Presentation type:
AS – Atmospheric Sciences

EGU24-11717 | Orals | MAL11-AS | Vilhelm Bjerknes Medal Lecture

Discovering global-scale processes in the marine atmosphere 

Lucy Carpenter, Anna Callaghan, Rosie Chance, Mat Evans, James Lee, Katie Read, Matthew Rowlinson, Marvin Shaw, Tomas Sherwen, Simone Andersen, Liselotte Tinel, and John Plane

Measurements in the remote unpolluted atmosphere have tremendous power to reveal processes that are happening on a global scale.   In the marine atmosphere where nitrogen oxide (NOx) levels are very low,  the photochemical loss rate of tropospheric ozone dominates over production, allowing loss processes to be sensitively explored.   We showed that bromine and iodine emitted from open-ocean marine sources initiate important global-scale catalytic ozone-destroying cycles and found that the deposition of ozone and subsequent reactions at the sea surface are a substantial pathway for production of volatile iodine.   Production of ozone in the remote atmosphere is predominantly regulated by the abundance of NOx, which also exerts substantial control over the hydroxyl radical (OH), the most important oxidant in the atmosphere.  It is now emerging that NOx regeneration pathways, namely the photolysis of particulate nitrate, could provide the dominant source of NOx to the marine atmosphere.  This has significant implications for our understanding of the chemistry of the remote troposphere.  This presentation discusses advances made in understanding these important, predominantly natural, cycles and their impacts on the atmosphere.

How to cite: Carpenter, L., Callaghan, A., Chance, R., Evans, M., Lee, J., Read, K., Rowlinson, M., Shaw, M., Sherwen, T., Andersen, S., Tinel, L., and Plane, J.: Discovering global-scale processes in the marine atmosphere, EGU General Assembly 2024, Vienna, Austria, 14–19 Apr 2024, EGU24-11717, https://doi.org/10.5194/egusphere-egu24-11717, 2024.

EGU24-21254 | ECS | Orals | MAL11-AS | Arne Richter Award for Outstanding ECS Lecture

Weathering the STORM: Challenges and opportunities in tropical cyclone risk research  

Nadia Bloemendaal

Tropical cyclones (TCs), also referred to as hurricanes or typhoons, are amongst the deadliest and costliest natural hazards, affecting people, economies, and the environment in coastal areas around the globe when they make landfall. TCs are projected to become more intense in a warming climate, enhancing the risks associated with their wind speeds, precipitation and storm surges. It is therefore crucial to minimize future loss of life and by performing accurate TC risk assessments for coastal areas. Calculating TC risk at a global scale, however, has proven to be difficult, given the limited temporal and spatial information on landfalling TCs around much of the global coastline, and how this is going to change under climate change.

To overcome these limitations, we developed a novel approach to calculate TC risk under present and future climate conditions using the Synthetic Tropical cyclOne geneRation Model (STORM). STORM is a fully statistical model that can take any input dataset and statistically resamples this to an equivalent of 10,000 years of TC activity under the same climate condition. The resulting publicly available STORM dataset contains of enough TC activity in any coastal region of interest to adequately calculate TC probabilities and risk from. Furthermore, the STORM algorithm has been expanded with a future-climate module, enabling globally consistent local-scale assessments of (changes in) TC risk. This presentation will discuss the challenges and opportunities in using such synthetic datasets, particularly in the light of improving our understanding of TC risk. 

How to cite: Bloemendaal, N.: Weathering the STORM: Challenges and opportunities in tropical cyclone risk research , EGU General Assembly 2024, Vienna, Austria, 14–19 Apr 2024, EGU24-21254, https://doi.org/10.5194/egusphere-egu24-21254, 2024.

AS1 – Meteorology

EGU24-857 | ECS | Posters on site | AS1.1

Improving extreme rainfall forecasting for a flood prone region: A hybrid modelling approach 

Athira Krishnankutty Nair and Sarmistha Singh

Numerical weather prediction models are utilized to forecast extreme rainfall events at fine resolutions; however, these models possess inherent errors due to the parameterization and discretization of differential equations, which diminishes simulation accuracy. Recent advancements in machine learning methods indicate their potential capability to significantly enhance forecast results. In this study, multiple extreme rainfall events for the Pamba river basin during the Indian Summer Monsoon Period spanning 2-4 days were forecasted using the WRF model. Pamba, one of the flood-prone basins in southern states of India (Kerala), experiences severe flood events annually. While numerous studies have been conducted to simulate the Kerala flood of 2018, those demonstrating the application of high-resolution rainfall data for the Pamba river basin remain unexplored. Therefore, in this study, we simulated multiple storm events during the period from 2015 to 2018 using the WRF model at a high resolution (1 km * 1 km) and a temporal resolution of a one-hour interval. The WRF-simulated rainfall dataset was further post-processed using various machine learning algorithms, including Random Forest, Support Vector Machine, and extreme gradient boost (XGBoost), to reduce bias in the hourly forecast of extreme rainfall events. Several cross-validation training and testing procedures were carried out using various algorithms, and the forecasted and predicted results were compared with ERA5 hourly data of 10*10 km resolution. Results indicated that XGBoost, with hyperparameter tunings, substantially reduced the Root Mean Square Error (RMSE); it was able to reduce the RMSE by up to 50% across the river basin. This hybrid model will provide a more accurate forecast of hourly extreme rainfall during the Indian Summer Monsoon Period for Pamba river basin, with high resolution essential for flood forecasting and warning.

How to cite: Krishnankutty Nair, A. and Singh, S.: Improving extreme rainfall forecasting for a flood prone region: A hybrid modelling approach, EGU General Assembly 2024, Vienna, Austria, 14–19 Apr 2024, EGU24-857, https://doi.org/10.5194/egusphere-egu24-857, 2024.

EGU24-1043 | ECS | Posters on site | AS1.1

Development of a mathematical model for the determination of the atmospheric boundary layer height using artificial intelligence 

Sebastián Estrada and Olga Lucia Quintero Montoya

The Atmospheric Boundary Layer Height (ABLH) is a fundamental parameter for many meteorological applications and climate change assessment and evaluation. A large number of methods for ABLH determination have been proposed; however, there is no sufficiently reliable and feasible method for this purpose. The rise of intelligence-based mathematical models for feature determination in data space has allowed their application to solve problems similar to ABLH determination. This article describes the development of a mathematical model based on artificial intelligence for ABLH determination, in which an introductory analysis of the data space from the point of view of machine learning, unsupervised, and supervised methods is presented. The methods explored are the mountain method, subtractive clustering, and the classic K-means and its soft counterpart, Fuzzy C-means. Furthermore, an analysis was conducted to determine which similarity function—whether Euclidean, Manhattan, Mahalanobis, or Cosine—best fits for ABLH estimation in each unsupervised method. For classification in a supervised fashion, the best suitable models, among others, are support vector machines and decision trees. Different internal metrics (Silhouette Index, Calinski-Harabasz score) and external metrics (root mean square error and adjusted Rand score), with a reference made by means of visual inspection by an expert, were used to evaluate the methods. The unsupervised mountain method with the Manhattan similarity function proved to be the most feasible, as it is a non-stochastic method, its computation time is reduced, and it does not require an ABLH reference. The data used was extracted from several sources: 83 days of quasi-continuous LIDAR data with 23,000 data points located at Brest, France, measured with a MiniMPL from the Meteo France LIDAR network, were used. An ABLH reference from a radiosonde adjacent to the site of the LIDAR system was used. The references range from October to December 2018. The root mean square error achieved for the whole dataset was 600 m for the mountain method. The presented method is shown to be effective for various atmospheric situations, regardless of their complexity.

How to cite: Estrada, S. and Quintero Montoya, O. L.: Development of a mathematical model for the determination of the atmospheric boundary layer height using artificial intelligence, EGU General Assembly 2024, Vienna, Austria, 14–19 Apr 2024, EGU24-1043, https://doi.org/10.5194/egusphere-egu24-1043, 2024.

EGU24-2375 | Orals | AS1.1

Horizontally Explicit Vertically Implicit (HEVI) Time-Integrators for a Non-Hydrostatic Whole Atmosphere Models 

James F. Kelly, Francis X. Giraldo, P. Alex Reinecke, Felipe Alves, Cory A. Barton, and Stephen D. Eckermann

The U.S. Navy is building a coupled thermosphere-ionosphere prediction system.  As part of this project, we are developing a new dynamical core (DyCore) extending from the ground to the exobase (~500 km).  The DyCore must be able to handle large variations in both temperature and composition, which motivates a new Horizontally Explicit Vertically Implicit (HEVI) time integrator.  Unlike traditional linear Implicit-EXplicit (IMEX) methods commonly used in numerical weather prediction (NWP), HEVI does not require a fixed reference state.  Our DyCore combines HEVI with a Specific Internal Energy Equation (SIEE) and a Spectral Element Method (SEM) spatial discretization to form a robust, whole-atmosphere model for the neutral atmosphere.  We present results for two test cases using the proposed DyCore: an idealized heating/cooling test extending into the middle thermosphere and a perturbation experiment yielding nonhydrostatic baroclinic instability. The idealized heating/cooling test, which is compared to corresponding results from the hydrostatic Navy Global Environmental Model (NAVGEM), demonstrates that HEVI is more robust than traditional linear IMEX methods.  The baroclinic instability test shows that HEVI, when combined with a banded lower-upper (LU) direct solve, is efficient and allows a large timestep.  These numerical results suggest that our HEVI-enabled DyCore is a good candidate for the proposed thermosphere-ionosphere prediction system.

This work was funded by the Office of Naval Research Marine Meteorology and Space Weather program.

How to cite: Kelly, J. F., Giraldo, F. X., Reinecke, P. A., Alves, F., Barton, C. A., and Eckermann, S. D.: Horizontally Explicit Vertically Implicit (HEVI) Time-Integrators for a Non-Hydrostatic Whole Atmosphere Models, EGU General Assembly 2024, Vienna, Austria, 14–19 Apr 2024, EGU24-2375, https://doi.org/10.5194/egusphere-egu24-2375, 2024.

EGU24-2897 | Orals | AS1.1

Postprocessing East African rainfall forecasts using a generative machine learning model 

Bobby Antonio, Andrew McRae, Dave MacLeod, Fenwick Cooper, John Marsham, Laurence Aitchison, Tim Palmer, and Peter Watson

Existing weather models are known to have poor skill at forecasting rainfall over East Africa, where there are regular threats of drought and floods. Improved precipitation forecasts could reduce the effects of these extreme weather events and provide significant socioeconomic benefits to the region. We present a novel machine learning based method to improve precipitation forecasts in East Africa, using postprocessing based on a conditional generative adversarial network (cGAN). This addresses the challenge of realistically representing tropical rainfall in this region, where convection dominates and is poorly simulated in conventional global forecast models. We postprocess hourly forecasts made by the European Centre for Medium-Range Weather Forecasts Integrated Forecast System at 6-18h lead times, at 0.1o resolution. We combine the cGAN predictions with a novel neighbourhood version of quantile mapping, to integrate the strengths of both machine learning and conventional postprocessing. Our results indicate that the cGAN substantially improves the diurnal cycle of rainfall, and improves rainfall predictions up to the 99.9th percentile of rainfall. This improvement persists when evaluating against the 2018 March-May season, which had extremely high rainfall, indicating that the approach has some ability to generalise to more extreme conditions. We explore the potential for the cGAN to produce probabilistic forecasts and find that the spread of this ensemble broadly reflects the predictability of the observations, but is also characterised by a mixture of under- and over-dispersion. Overall our results demonstrate how the strengths of machine learning and conventional postprocessing methods can be combined, and illuminate what benefits machine learning approaches can bring to this region.

How to cite: Antonio, B., McRae, A., MacLeod, D., Cooper, F., Marsham, J., Aitchison, L., Palmer, T., and Watson, P.: Postprocessing East African rainfall forecasts using a generative machine learning model, EGU General Assembly 2024, Vienna, Austria, 14–19 Apr 2024, EGU24-2897, https://doi.org/10.5194/egusphere-egu24-2897, 2024.

The UFS-R2O Project, which began in July 2020 as a five-year plan with deliverables for the first three years funded, has made significant progress in developing the medium-range and sub-seasonal to seasonal (MRW/S2S) predictions, a regional, high-resolution hourly-updating and convection-allowing ensemble system for prediction of short range severe weather (CAM/SRW), and a Hurricane Application developing a very high-resolution Hurricane Analysis and Forecast System (HAFS) with storm following moving nests.  The Project is organized with Application Teams and Development Teams interacting with each other to reflect the cross-cutting nature of the UFS components and infrastructure. It  fostered successful collaborations between the National Centers for Environmental Prediction (NCEP) Environmental Modeling Center, several NOAA research labs, the National Center for Atmospheric Research (NCAR), the Naval Research Lab (NRL), and multiple universities and cooperative institutes.  Most sIgnificant outcomes of the project thus far are the implementation of the HAFSv1 ahead of the schedule, and the development of a six-way global coupled (atmosphere/ ocean/ land/ sea-ice/ wave/ aerosol) modeling system, both within the UFS framework, major accomplishments from the community modeling perspective.  

The UFS-R2O Project has entered into its second phase (2023-2024), albeit with reduced funding, to continue the momentum built during the first phase.  While the first three years of the project were focused on engineering and infrastructure, Phase II is primarily targeting systematic testing and evaluation of the prototype UFS configurations for selecting the candidates for potential transition to operations in the next few years.  In addition, Phase II of the project includes a new Seasonal Forecast System (SFS) Application Tean established to develop SFS v1 that will replace the legacy Climate Forecast System (CFSv2) currently in operations since 2011.

This presentation describes the outcomes of the UFS R2O Project for the first three years, and highlights the progress and plans for the Phase II.

How to cite: Tallapragada, V., Whitaker, J., and Kinter, J.: NOAA's Unified Forecast System Research to Operations (UFS R2O) Project Phase II - Accomplishments, Progress and Future Plans, EGU General Assembly 2024, Vienna, Austria, 14–19 Apr 2024, EGU24-2930, https://doi.org/10.5194/egusphere-egu24-2930, 2024.

EGU24-3462 | ECS | Posters on site | AS1.1

Assimilation of HY-2D scatterometer wind field data in CMA-GFS 

Chuanwen Wei, Wei Han, Yan Liu, Hao Hu, Huijuan Lu, Hongyi Xiao, and Dan Wang

Satellite sea surface wind fields can compensate for the shortcomings of conventional observation data, thereby improving the forecasting skills of global medium-range numerical weather models. China successfully launched the HY2D satellite carrying a Ku band microwave scatterometer (HSCAT) on May 19, 2021. It can provide a large amount of high-quality sea surface wind field data for numerical forecasting models. In order to test the potential application of HY2D sea surface wind field data in the Global Assimilation Forecasting System of the China Meteorological Administration (CMA-GFS). A three-step study was conducted, with the first step being the timeliness evaluation of HY2D wind, followed by the quality evaluation of HY2D wind using ERA5 and buoy data, and finally assessment of impacts of the HY2D wind assimilation on the analyses and forecasts. Two sets of assimilation experiments were conducted: the control experiment without HY2D wind (CTRL) and sensitivity experiment with HY2D wind based on a new quality control scheme (HY2D-FlagQC). The experimental period is from March 1, 2023 to April 1, 2023. The results show that the timeliness of HY2D wind field obtained through National Satellite Ocean Application Service (NSOAS) has been improved by about 20% compared to Koninklijk Nederlands Meteorologisch Instituut (KNMI). But the timeliness fluctuation is relatively large in terms of time and space. The root mean square error of HY2D wind field is less than 2m/s. After assimilating the HY2D wind, the analysis errors of the wind fields in the lower-middle troposphere of the tropics and the southern hemisphere (SH) are significantly reduced. Furthermore, assimilating the HY2D wind data can improve the forecast skill of wind, geopotential height, and temperature in the troposphere of the tropics and SH. 

How to cite: Wei, C., Han, W., Liu, Y., Hu, H., Lu, H., Xiao, H., and Wang, D.: Assimilation of HY-2D scatterometer wind field data in CMA-GFS, EGU General Assembly 2024, Vienna, Austria, 14–19 Apr 2024, EGU24-3462, https://doi.org/10.5194/egusphere-egu24-3462, 2024.

EGU24-3686 | Orals | AS1.1

Improving Visibility Forecasting during Haze-fog Processes in Shanghai and Eastern China: the Significance of Aerosol and Hydrometeor 

Ying Xie, Xiaofeng Wang, Yanqing Gao, Baode Chen, Ronald van der A, Jieying Ding, Wen Gu, Min Zhou, and Hongli Wang

Aerosols and droplets are the main factors of visibility reduction by scattering and absorbing light. For visibility predictions in operational NWP models, hydrometeors are often considered to be the dominant factor in the total extinction, whereas aerosol effects are usually simplified or omitted in models developed for relatively clean regions. In China, also many NWP studies related to visibility forecasting during haze-fog processes have been conducted, primarily focusing on severely polluted periods before 2018. These studies often employed visibility parameterizations that considered either aerosol extinction alone or hydrometeor extinction alone. Therefore, the significance of incorporating both aerosol and hydrometeor extinction into visibility forecasting during haze-fog processes remains uncertain, particularly under recent rapid changes in aerosol concentration, composition, and hygroscopicity in China.

In this study, we first use the 3-D meteorology fields from the Shanghai Meteorological Service WRF-ADAS Real-Time Modeling System (WARMS) to drive the Community Multiscale Air Quality (CMAQ) model. In this version, CMAQ is used in an off-line mode and visibility is diagnosed by combining extinctions due to hydrometeors and aerosols. Satellited derived NOx emissions using the Daily Emissions Constrained by Satellite Observations (DECSO) algorithm have been incorporated to give more up-to-date emissions. We analyze the results of a one-month forecasting period during the winter of 2021-2022 to assess the model's performance and understand the impact of hydrometeor and aerosol extinction on operational visibility forecasting. We find that for the city of Shanghai, aerosol extinction has a minor impact on the model’s performance when forecasting visibility below 1 km but becomes crucial for predictions spanning 1-10 km. Comparison against observations shows that the model well captures the general contributions from various chemical constituents with nitrate as the most important factor in aerosol extinction (~60%). Furthermore, our assessment of the North China Plain (NCP) highlights that in highly polluted areas aerosols could be significant for visibility below 1 km. Finally, we conduct case studies with the fully coupled WRF-Chem model and compare results with the offline WARMS-CMAQ system. Aerosol effects on fog and visibility forecasting due to feedbacks between aerosols, radiation, and cloud physics will be discussed.

How to cite: Xie, Y., Wang, X., Gao, Y., Chen, B., van der A, R., Ding, J., Gu, W., Zhou, M., and Wang, H.: Improving Visibility Forecasting during Haze-fog Processes in Shanghai and Eastern China: the Significance of Aerosol and Hydrometeor, EGU General Assembly 2024, Vienna, Austria, 14–19 Apr 2024, EGU24-3686, https://doi.org/10.5194/egusphere-egu24-3686, 2024.

This study explores the potential impact of global navigation satellite system radio occultation (RO) data assimilation on the tropical cyclone (TC) intensity forecast over the western North Pacific. The forecast experiments are performed through a regional model for six TCs occurring in 2020. RO data are mainly obtained from the Constellation Observing System for Meteorology, Ionosphere, and Climate Mission II. The forecasts with and without assimilation of RO data are compared, and their difference is regarded as the impact of RO data on TC forecasts. Overall, the forecasts tend to underestimate the TC intensity relative to the best track data. Compared to the forecasts assimilating without RO data, forecasts assimilating with RO data improve the initial conditions and reduce the underestimation of TC intensity forecast by 13 kt and 16 hPa in subsequent forecasts. This intensity improvement is more significant for TCs developing in drier environments than those in moister environments. The main period of intensity increase is 48-24 h prior to TCs developing to the maximum intensity. The assimilation of RO data increases the moisture around the TC centers, especially at mid-levels (700-300 hPa). It also increases the low-level vorticity but reduces the mid-level vorticity around the TC centers. These characteristics favor TCs with stronger surface wind speed and lower sea surface pressure. In summary, this study highlights the positive contribution of RO data to TC intensity forecast and explores the potential mechanisms.

How to cite: Teng, H.-F.: Impact of radio occultation data assimilation on tropical cyclone intensity forecast over the western North Pacific, EGU General Assembly 2024, Vienna, Austria, 14–19 Apr 2024, EGU24-4760, https://doi.org/10.5194/egusphere-egu24-4760, 2024.

Data assimilation is a widely used method for estimating the state and associated uncertainties in numerical models. While ensemble-based approaches are common, their computational expense arises from necessary ensemble integrations. This study improves the Weather Research and Forecasting–Advanced Research WRF (WRF-ARW) model by integrating it with the Parallel Data Assimilation Framework (PDAF) in a fully online mode. Through minimal modifications to the WRF-ARW code, an efficient data assimilation system is developed, leveraging parallelization and in-memory data transfers to minimize file I/O and model restarts during assimilation. The clear separation of concerns between method development and model application, facilitated by PDAF's model-agnostic structure, is an advantage. Evaluating the assimilation system through a twin experiment simulating a tropical cyclone reveals improved accuracy in temperature, U and V fields. The assimilation process incurs minimal overhead in run time compared to the model without data assimilation, demonstrating excellent parallel performance. Consequently, the online WRF-PDAF system proves to be an efficient framework for high-resolution mesoscale forecasting and reanalysis.

How to cite: Shao, C.: Augmenting WRF with PDAF for an Online Localized Ensemble Data Assimilation, EGU General Assembly 2024, Vienna, Austria, 14–19 Apr 2024, EGU24-4851, https://doi.org/10.5194/egusphere-egu24-4851, 2024.

EGU24-5395 | ECS | Orals | AS1.1

Uncertainty quantification for data-driven weather models 

Nina Horat, Christopher Bülte, Julian Quinting, and Sebastian Lerch

Data-driven machine learning methods for weather forecasting have experienced a steep progress over the last years, with recent studies demonstrating substantial improvements over physics-based numerical weather prediction models. Beyond improved forecasts, the major advantages of purely data-driven models are their substantially lower computational costs and faster generation of forecasts, once a model has been trained. However, in contrast to ensemble forecasts from physical weather models, most efforts in data-driven weather forecasting have been limited to deterministic, point-valued predictions only, making it impossible to quantify forecast uncertainties which is crucial for optimal decision making in applications.

Our overarching aim is to evaluate and compare methods for creating probabilistic forecasts from data-driven weather models. The uncertainty quantification (UQ) approaches we compare are either based on generating ensemble forecasts from data-driven weather models via perturbations to the initial conditions, or based on statistical post-hoc UQ methods. The perturbation-based methods either leverage initial conditions from the ECMWF IFS ensemble, add random Gaussian noise to the deterministic initial conditions, or add random field perturbations based on past observations (Magnusson et al., 2009). The post-hoc approaches operate on deterministic forecasts and quantify forecast uncertainty using established post-processing methods, namely distributional regression networks (Rasp and Lerch, 2018) and isotonic distributional regression (Walz et al., 2022; Henzi et al., 2021).

Using forecasts from Pangu-Weather (Bi et al., 2023), we evaluate these UQ methods over Europe for selected user-relevant weather variables, such as wind speed at 10 m, temperature at 2 m, and geopotential height at 500 hPa. We focus on daily initialised Pangu-Weather forecasts for 2022 with a forecast horizon of up to 7 days and compare their performance against ECMWF IFS ensemble forecasts. Our results suggest that Pangu-Weather predictions combined with UQ approaches yield improvements over the ECMWF ensemble forecasts for lead times of up to 5 days in terms of the Continuous Ranked Probability Score. However, it strongly depends on the variable of interest which of the UQ methods performs best, none of the different UQ methods performs best over all variables and lead times. Post-hoc UQ methods tend to perform better for shorter lead times, while initial condition perturbations are superior for longer lead times, with in particular the random field method showing promising results.


References:

  • Bi, K., Xie, L., Zhang, H., Chen, X., Gu, X. and Tian, Q. (2023). Accurate medium-range global weather forecasting with 3D neural networks. Nature, 619, 533–538.
  • Henzi, A., Ziegel, J. F. and Gneiting, T. (2021). Isotonic distributional regression. Journal of the Royal Statistical Society Series B: Statistical Methodology, 83, 963–993.
  • Magnusson, L., Nycander, J. and Källén, E. (2009). Flow-dependent versus flow-independent initial perturbations for ensemble prediction. Tellus A: Dynamic Meteorology and Oceanography, 61, 194.
  • Rasp, S. and Lerch, S. (2018). Neural networks for postprocessing ensemble weather forecasts. Monthly Weather Review, 146, 3885–3900.
  • Walz, E.-M., Henzi, A., Ziegel, J. and Gneiting, T. (2022). Easy Uncertainty Quantification (EasyUQ): Generating Predictive Distributions from Single-valued Model Output. Preprint, available at https://arxiv.org/abs/2212.08376.

How to cite: Horat, N., Bülte, C., Quinting, J., and Lerch, S.: Uncertainty quantification for data-driven weather models, EGU General Assembly 2024, Vienna, Austria, 14–19 Apr 2024, EGU24-5395, https://doi.org/10.5194/egusphere-egu24-5395, 2024.

EGU24-5656 | Orals | AS1.1

Impact of GNSS tropospheric gradient assimilation and sensitivity analysis 

Rohith Thundathil, Florian Zus, Galina Dick, and Jens Wickert

The Global Navigation Satellite System (GNSS) ground-based network in Europe is a comparatively dense network that provides valuable humidity information through Zenith Total Delays (ZTDs) and tropospheric gradients. ZTDs include information on column water vapor, while tropospheric gradients provide information on moisture distribution. Recently, we developed the tropospheric gradient operator (Zus et al., 2023) and implemented it in the Weather Research and Forecasting (WRF) model (Thundathil et al., 2023, under review).

We have conducted ZTD and tropospheric gradient assimilation experiments over a couple of periods, which lasted for two months. We will present our latest test period, the Benchmark Campaign organized within the European COST Action, in May and June 2013. Data from more than 250 GNSS stations in central Europe covering Germany, the Czech Republic, and part of Poland and Austria were assimilated during this period. The data assimilation (DA) system used a rapid update cycle of 3-dimensional variational DA with 6-hourly cycles for two months.

Our research methodology involved configuring a 0.1 x 0.1-degree mesh in the WRF model with 50 vertical levels up to 50 hPa for Europe. Model forcing was done with the European Centre for Medium-Range Weather Forecasts (ECMWF) operational analysis. We conducted three runs, which included the assimilation of conventional datasets from ECMWF (or control run), ZTD added on top of the control run, and ZTD and gradients on top of the control run. We observed a significant reduction of the root mean square errors; we observed a 42 % and 16 % reduction for ZTDs and gradients in the ZTD assimilation run, which further reduced to 43 % and 21 % for ZTDs and gradients in the ZTD and gradient assimilation. Validation with the atmospheric reanalysis ERA5 and radiosondes revealed improvements in the lower troposphere.

We conducted an additional sensitivity experiment using a sparsely distributed GNSS network. This process involved reducing the station density from roughly 0.5 degrees to 1 degree by replacing the original network with one consisting of 100 stations. We found that the improvement in the humidity field with the assimilation of ZTD and gradients from the sparse station network (1-degree resolution) is roughly the same as in the humidity field with the assimilation of ZTD only from the dense station network (0.5-degree resolution). Therefore, the assimilation of gradients in addition to ZTDs is particularly interesting in regions with a few GNSS stations. It may also be considered a cost-effective way to increase the density of networks.

After preliminary testing of the GNSS ZTD plus gradient assimilation with WRF, we are ready to move to convective-scale assimilation using an ensemble-based approach over different regions and seasons. We will be presenting initial results from our high-resolution simulations.

References

Zus, F., Thundathil R., Dick G., and Wickert J. "Fast Observation Operator for Global Navigation Satellite System Tropospheric Gradients." Remote Sensing 15, no. 21 (2023): 5114.

Thundathil, R. M., Zus, F., Dick, G., and Wickert, J. "Assimilation of GNSS Tropospheric Gradients into the Weather Research and Forecasting Model Version 4.4.1", Geoscientific Model Development Discussion [preprint], in review, 2023.

How to cite: Thundathil, R., Zus, F., Dick, G., and Wickert, J.: Impact of GNSS tropospheric gradient assimilation and sensitivity analysis, EGU General Assembly 2024, Vienna, Austria, 14–19 Apr 2024, EGU24-5656, https://doi.org/10.5194/egusphere-egu24-5656, 2024.

Ensemble forecasts play a pivotal role in weather prediction, providing valuable insights into the inherent uncertainty of atmospheric processes. Strategies in ensemble construction involve generating multiple simulations by perturbing initial conditions, model parameters, or both. This diverse set of forecasts allows meteorologists to capture a range of possible future scenarios, acknowledging the inherent complexity of the atmosphere. Model resolution is a critical factor, influencing the representation of small-scale features and improving the overall accuracy of ensemble predictions. Additionally, forecast range-related issues address the challenge of extending predictions beyond a few days, where uncertainties tend to grow. Combining advanced statistical techniques with cutting-edge modeling technologies helps refine ensemble forecasts, enhancing our ability to anticipate and mitigate the impacts of weather-related events on society and the environment.

The investigation based operational global ensemble forecast system from NCEP, CMC, ECMWF and CMA to focus on the analyses of ensemble design that combined to the data assimilation for initial condition perturbation and various stochastic physical perturbations. The impact of model resolutions (both horizontal and vertical) will be addressed to the different atmospheric characteristics, such as forecast uncertainty, reliability and resolution. The forecast capability and predictability to the extreme events will be discussed from single model ensemble and multi-model ensemble. Finally, the 1st-moment and 2nd-moment ensemble forecast calibration will be demonstrated from traditional statistical method and machine learning based ensemble reforecasts

How to cite: Zhu, Y.: An assessment of prediction and predictability through the state-of-the-art global ensemble forecast systems, EGU General Assembly 2024, Vienna, Austria, 14–19 Apr 2024, EGU24-6802, https://doi.org/10.5194/egusphere-egu24-6802, 2024.

EGU24-6813 | ECS | Posters on site | AS1.1

Numerical Investigation of High Impact Foehn storm in February 1925 using WRF and PALM models. 

Renuka Prakash Shastri, Stefan Brönnimann, and Peter Stucki

One of the most hazardous windstorms was observed in Switzerland on February 15, 1925. The storm is categorized as a 'High-impact Foehn Storm' that affected all Foehn regions of Switzerland. All communities, stables, and houses were wholly or partially damaged in the canton of Glarus. In previous work, the Weather Research and Forecasting Model (WRF) was used for downscaling the storm from the Twentieth Century Reanalysis (20CRv2) down to a grid width of 3 km. While many storm features were realistically simulated, wind speeds in the Glarus Valley, where most damage occurred, remained well below the expected values. Here, we go one step further by using a Large-Eddy Simulation model (LES) to analyze whether high gust peaks would occur at the bottom of the valley. For this, the PArallelized Large-eddy simulation Model (PALMv6.0) is coupled to WRFv4.1.2. In the first stage, WRFv4.1.2 was downscaled to a resolution of 1x1 km2 by using the "Twentieth Century Reanalysis" (20CRv3) as a boundary condition. Three nested domains with resolutions 25km, 5 km, and 1 km were set up for the simulation experiment. The second stage involves downscaling PALMv6.0 to a resolution of 20 m by using the output of WRFv4.1.2 as a boundary condition. The simulation shows strong winds between Netstal and Näfels on Earth's surface. Peak gusts of 40 m/s and more hit the valley floor south of Näfels. Strong turbulence fields reaching the ground at high velocities are observed in the central valley in the south-north direction. The simulation shows good agreement with the damage described, and the simulated peak gusts easily reach the measured maxima of extreme storms. Being able to realistically simulate the local characteristics of a Foehn storm that occurred a century back opens a new window to quantitative analyses of past extremes and their impacts.

How to cite: Shastri, R. P., Brönnimann, S., and Stucki, P.: Numerical Investigation of High Impact Foehn storm in February 1925 using WRF and PALM models., EGU General Assembly 2024, Vienna, Austria, 14–19 Apr 2024, EGU24-6813, https://doi.org/10.5194/egusphere-egu24-6813, 2024.

The Cross-track Infrared Sounder (CrIS) observations (O) contributed greatly to numerical weather prediction. Further contribution depends on the success of all-sky data assimilation, which requires a method to produce realistic cloud/rain band structures from background fields (i. e., 6-h forecasts), and to remove large biases of all-sky simulation of brightness temperature in the presence of clouds. In this study, CrIS all-sky simulations of brightness temperatures at an arbitrarily selected window channel within Typhoon Hinnamnor (2022) are investigated. The 3-km Weather Research and Forecasting model with three microphysics schemes were used to produce 6-h background forecasts (B). The O−B statistic deviate greatly from Gaussian distribution with large biases in either water clouds, or thin ice clouds, or thick ice clouds within Typhoon Hinnamnor. By developing a linear regression function of three all-sky simulations of brightness temperature from 6-h forecasts with three microphysics schemes, the O−B statistics approximate a Gaussian normal distribution in water clouds, thin ice clouds and thick ice clouds. Taking the regression function that is established by a training dataset to combine 6-h background forecasts at later times, the cloud/rain band structures compared much more favorably with CrIS observations than those from an individual microphysics, and the O−B biases are significantly reduced. The work in this study to quantify and remove biases in background fields of brightness temperature and generating realistic typhoon cloud/rain band structures in background fields will allow a better description of center position, intensity and size to improve typhoon forecasts.

How to cite: Niu, Z.: Improving All-sky Simulations of Typhoon Cloud/Rain Band Structures of NOAA-20 CrIS Window Channel Observations, EGU General Assembly 2024, Vienna, Austria, 14–19 Apr 2024, EGU24-6917, https://doi.org/10.5194/egusphere-egu24-6917, 2024.

EGU24-6940 | Orals | AS1.1

Impacts of Direct Assimilation of the FY-4A/GIIRS Long-Wave Temperature Sounding Channel Data on Forecasting Typhoon In-Fa (2021) 

Lei Zhang, Zeyi Niu, Fuzhong Weng, Peiming Dong, Wei Huang, and Jia Zhu

The Advanced Weather Research Forecast model (WRF-ARW) is used to investigate the potential impacts of assimilating the FengYun-4A (FY-4A) Geostationary Interferometric Infrared Sounder (GIIRS) long-wave temperature sounding channel data on prediction of Typhoon In-Fa (2021). In addition, a series of data assimilation experiments are conducted to demonstrate the added value of the FY-4A/GIIRS data assimilation for typhoon forecasts. It is shown that the higher spectral resolution and broader coverage of GIIRS radiance data can positively impact the model analysis and forecasts with larger temperature and moisture increments at the initial time of simulations, thus producing the better simulation for typhoon warm core aloft, vortex wind structure and spiral rainfall band. Moreover, the assimilation of the GIIRS data can also lead to better storm steering flows and consequently better typhoon track forecasts. Overall, the assimilation of FY-4A/GIIRS temperature sounding channel data shows some added values to improve the track and storm structure forecasts of Typhoon In-Fa.

How to cite: Zhang, L., Niu, Z., Weng, F., Dong, P., Huang, W., and Zhu, J.: Impacts of Direct Assimilation of the FY-4A/GIIRS Long-Wave Temperature Sounding Channel Data on Forecasting Typhoon In-Fa (2021), EGU General Assembly 2024, Vienna, Austria, 14–19 Apr 2024, EGU24-6940, https://doi.org/10.5194/egusphere-egu24-6940, 2024.

MPAS-JEDI, a relatively-new data assimilation (DA) system for the Model for Prediction Across Scales – Atmosphere (MPAS-A) based upon the Joint Effort for Data assimilation Integration (JEDI), allows to assimilate cloud-/precipitation-affected satellite microwave and infrared radiance data to analysis microphysical parameters, e.g., mixing ratios of hydrometeors. Global cycling DA experiments were conducted in the context of MPAS-JEDI’s hybrid-3DEnVar configured at 30km resolution with 80-member ensemble input at 60km that is produced using MPAS-JEDI's ensemble of 3DEnVar. The benchmark experiment assimilates conventional observations plus clear-sky radiances from AMSU-A and MHS. All-sky experiments add the assimilation of all-sky microwave (MW) radiances from AMSU-A’s and/or ATMS’s window channels over water as well as infrared (IR) channels of two geostationary sensors GOES-ABI and Himawari-AHI. In addition to the impact assessment on dynamic and thermodynamic variables, we investigated more the impact on cloud forecasts in terms of fitting to ABI/AHI radiance data at different wavelengths. The community radiative transfer model (CRTM) is used as the observation operator in both all-sky radiance DA and evaluation. The substantial positive impact on cloud forecasts was obtained with all-sky microwave DA (individually or collectively from AMSU-A and ATMS) in terms of a better forecast fitting to observed ABI/AHI channel 13's radiances up to 7 days, especially over tropical regions, where the day-1 forecast root-mean-square error is reduced up to 10%. Cloud forecast impact from assimilating all-sky ABI/AHI 3 water vapor channels' radiances is more limited although a clear benefit is seen for middle/upper troposphere moisture field, which is consistent with ABI/AHI water vapor channels' sensitivity height. Future research direction for all-sky MW and IR radiance DA with MPAS-JEDI will also be discussed.

How to cite: Liu, Z., Ban, J., and Banos, I.: Improving cloud forecasts with assimilation of cloud-/precipitation-affected microwave and infrared radiances using MPAS-JEDI, EGU General Assembly 2024, Vienna, Austria, 14–19 Apr 2024, EGU24-7021, https://doi.org/10.5194/egusphere-egu24-7021, 2024.

We developed a rice paddy model based on the Noah LSM considering the standing water layer during the irrigation period. In the model, we adopted a consistent subcanopy process from thin to thick canopy conditions and considered small scalar roughness length of water surface in rice paddy field. We evaluated the model’s performance against observations from three rice paddy sites with different leaf area index (LAI) and water depths during the growing season. Two simulations were performed in an offline mode: the fixed irrigation simulation of Noah LSM with saturation moisture in the top two soil layers during the irrigation period (IRRI) and the developed model simulation (RICE). The evaluation results showed that RICE outperformed IRRI in the simulating ground, sensible (H) and latent heat (LH) fluxes and topsoil temperature (Tsoil) on hourly and diurnal time scales. Two sensitivity tests of RICE were performed in relation to the subcanopy resistance and standing water layer: RICE without consideration of small roughness length of water surface during the irritation period (BARE) and RICE with a constant standing water depth (FIX). The sensitivity tests showed that BARE calculated very low subcanopy resistance values when the sum of LAI and stem area index was less than 2 m2 m-2, which resulted in cold biases in the daily mean Tg and Tsoil and also led to overestimation of daily mean LH. There was no significant difference in RICE and FIX with hourly and seasonal time scale statistics, suggesting that H, LH,  Tg and Tsoil of the developed model are not sensitive to changes in water depth. The structure of the developed model was also discussed.

How to cite: Lim, H.-J. and Lee, Y.-H.: Development of Rice Paddy Model Based on Noah LSM: Consistent Parameterization of Subcanopy Resistance from the Ponded Water to Dense Rice Canopy , EGU General Assembly 2024, Vienna, Austria, 14–19 Apr 2024, EGU24-7968, https://doi.org/10.5194/egusphere-egu24-7968, 2024.

EGU24-8324 | Posters on site | AS1.1

Eta features, additional to the vertical coordinate, deserving attention 

Fedor Mesinger, Katarina Veljovic, Sin Chan Chou, Jorge L. Gomes, André A. Lyra, and Dusan Jovic

An experiment reported in Mesinger and Veljovic (JMSJ 2020) and at the preceding EGU General Assembly, showed an advantage of the Eta over its driver ECMWF ensemble members in placing 250 hPa jet stream winds east of the Rockies.  Verifications subsequent to 2020 confirmed this advantage.  A byproduct of that experiment was that of the Eta ensemble switched to use sigma, Eta/sigma, also achieving 250 hPa wind speed scores better than their driver members, although to a lesser extent.  It follows that the Eta must include feature or features additional to the eta coordinate responsible for this advantage over the ECMWF.

An experiment we have done strongly suggests that the van Leer type finite-volume vertical advection of the Eta, implemented in 2007, may be a significant contributor to this advantage.  In that experiment, having replaced a centered finite-difference Lorenz-Arakawa scheme, this finite-volume scheme enabled a successful simulation of an intense downslope windstorm in the lee of the Andes.

Another likely and perhaps unique feature of the Eta contributing to that advantage is its sophisticated representation of topography, designed to arrive at the most realistic grid-cell values with no smoothing (Mesinger and Veljovic, MAAP 2017).

While apparently a widespread opinion is that it is a disadvantage of terrain intersecting coordinates that “vertical resolution in the boundary layer becomes reduced at mountain tops as model grids are typically vertically stretched at higher altitudes (Thuburn, 10.1007/978-3-642-11640-7 2011),” a comprehensive 2006 NCEP parallel test gave the opposite result.  With seemingly equal PBL schemes, the Eta showed a higher surface layer accuracy over high topography than the NMM, using a hybrid terrain-following system (Mesinger, BLM 2023).

Hundreds of thousands of the Eta forecasts and experiments performed demonstrate that the relaxation lateral boundary condition, almost universally used in regional climate models (RCMs), in addition to conflicting with the properties of the basic equations used, is unnecessary.  Similarly, so-called large scale or spectral nudging, frequently applied in RCMs, based on an ill-founded belief, should only be detrimental if possible numerical issues of the limited area model used are addressed.  Note that this is confirmed by the Eta vs ECMWF results we refer to above.

Even so, to have large scales of a nested model ensemble members most times more accurate than those of their driver members, surely requires not only the absence of detrimental techniques, but also the use of a lateral boundary condition (LBC) scheme that is not inducing major errors.  The scheme of the Eta is at the outflow points of the boundary prescribing one less condition than at the inflow points (e.g., Mesinger and Veljovic, MAAP 2013), and has for that reason been referred to by McDonald (MWR 2003) as one of “fairly well-posed” schemes.

How to cite: Mesinger, F., Veljovic, K., Chou, S. C., Gomes, J. L., Lyra, A. A., and Jovic, D.: Eta features, additional to the vertical coordinate, deserving attention, EGU General Assembly 2024, Vienna, Austria, 14–19 Apr 2024, EGU24-8324, https://doi.org/10.5194/egusphere-egu24-8324, 2024.

Convective-scale ensembles are routinely used in operational centres around the world to produce probabilistic precipitation forecasts, but a lack of spread between members is providing forecasts that are frequently overconfident. This deficiency can be corrected by increasing spread, increasing forecast accuracy or both. A recent development in the Met Office forecasting system is the inclusion of Large-Scale Blending (LSB) in the convective-scale data assimilation scheme. This method aims to reduce the synoptic-scale forecast error in the analysis by reducing the influence of the convective-scale data assimilation at scales that are too large to be constrained by the limited domain. These scales are instead initialised using output from the global data assimilation scheme, which we expect to reduce the forecast error and, thus, improve the spread-skill relationship. In this study, we have quantified the impact of LSB on the spread-skill relationship of hourly precipitation accumulations by comparing forecast ensembles with and without LSB over a 17-day summer trial period. This trial found modest but significant improvements to the spread-skill relationship as calculated using metrics based on the Fractions Skill Score. Skill is improved for a lower precipitation centile by an average of 0.56% at the largest scales, but a corresponding degradation of spread limits the overall correction. The spread-skill disparity is reduced the most in the higher centiles due to a more muted spread response, with significant reductions of up to 0.40% obtained at larger scales. Case study analysis using a novel extension of the Localised Fractions Skill Score demonstrates how spread-skill improvements transfer to smaller-scale features, not just the scales that have been blended. There are promising signs that further spread-skill improvements can be made by implementing LSB more fully within the ensemble.

How to cite: Gainford, A.: Improvements in the spread-skill relationship of precipitation in a convective-scale ensemble through blending, EGU General Assembly 2024, Vienna, Austria, 14–19 Apr 2024, EGU24-9034, https://doi.org/10.5194/egusphere-egu24-9034, 2024.

EGU24-9797 | Posters on site | AS1.1

Arctic temperature persistence in winter and spring and seasonal forecasting 

Haraldur Ólafsson and Negar Ekrami

Persistence is a natural first approximation or a baseline to seasonal temperature forecasting.  In the present study, winter and spring persistence in mean montly temperatures in the circumpolar Arctic is explored in long time-series of monthly mean data for the winter and spring seasons.

Locally, very high temporal correlations, as well as significant negative correlations are detected

Physically, the persistence may be traced to snow cover and sea-ice extent.  The variability in these factors may contribute directly to seasonal variability in the radiation budget as well as in surface fluxes, but there are also indirect, but detectable impacts upon regional circulation patterns.

How to cite: Ólafsson, H. and Ekrami, N.: Arctic temperature persistence in winter and spring and seasonal forecasting, EGU General Assembly 2024, Vienna, Austria, 14–19 Apr 2024, EGU24-9797, https://doi.org/10.5194/egusphere-egu24-9797, 2024.

In modern forecasting it is now a common technique to use an ensemble of forecasts generated by Numerical Weather Prediction (NWP) models. This necessitates a statistical approach be taken when using these weather predictions to inform decision-making and leveraging probabilities in the production of forecasts. It is often required to take the spread of predictions made by NWPs in the ensemble and reduce these to a single value, a pseudo-deterministic forecast, analogous to a forecast made be a traditional deterministic NWP, in order to allow end users to make binary decisions often defined at a definite threshold. These values may be representative of a single physical parameter modelled (e.g. road surface temperature) or may combine multiple parameters in a physically consistent manner (e.g. the road surface temperature coupled to the depth of water on the road for calculating road state), and are used by stakeholders in a number of sectors often to inform safety critical decision making. Therefore, it is important to ensure that the methodology used to reduce the ensemble of predictions to a pseudo-deterministic forecast is as accurate as possible and can retain information related to the ensemble spread , whilst ensuring consistency in parameters through the spatial and temporal domain.

The Surface Transport Forecast (STF) system produces forecasts for different transport surfaces in response to NWP outputs. The STF system is architected such that it runs simultaneously for each member of the NWP forecast ensemble, producing a corresponding ensemble of STF predictions. This enables the computation of a pseudo-deterministic forecast, which retains the maximum amount of information provided by the NWP ensemble.

To reduce the STF ensemble to a pseudo-deterministic forecast a Kernel Density Estimation (KDE) is utilised to build Probability Density Functions (PDFs), which can be readily interrogated using standard statistical techniques. It is found that pseudo-deterministic forecasts, which are consistent across a combination of physical modelled parameters, can be determined using covariant techniques, ensuring the ensemble is reduced as late as possible in the forecast production keeping the maximum benefit provided by the forecast spread. We will present the numerical and computational implementation of the described method in our STF system. Further, we will analyse the pseudo-deterministic forecasts produced and verify the validity of results at specific locations using multiple years of road observations.

How to cite: Wiggs, J., Eyles, J., and Lake, A.: Creating a Pseudo-Deterministic Forecast for Surface Transport from an NWP Ensemble with Consistency Across Multiple Variables using KDE, EGU General Assembly 2024, Vienna, Austria, 14–19 Apr 2024, EGU24-11209, https://doi.org/10.5194/egusphere-egu24-11209, 2024.

EGU24-11708 | ECS | Orals | AS1.1

Medium-Range Excessive Rainfall Prediction with Machine Learning 

Aaron Hill and Russ Schumacher

The prediction of excessive rainfall using numerical weather prediction (NWP) models is unequivocally difficult owing to the myriad of complexities that must be resolved (e.g., parent storm dynamics, microphysics) in order to forecast the placement and intensity of rainfall correctly. However, machine learning (ML) has provided a new avenue by which we can generate predictions of excessive rainfall with sufficient lead time to inform decision makers and planners to the threat of inclement weather. ML techniques are able to decode known long-standing relationships between environmental predictors and convective hazards from long historical records, and they have demonstrated tremendous value in predicting weather hazards at longer lead times (e.g., Hill et al. 2023). Further, continued effort by the meteorological community to explain ML models and their forecasts is building trust between developers and end users. As a result, their use in meteorological hazard forecasting is expanding, particularly into the medium range (e.g., 4-8 days) when forecasters are reliant on relatively coarse NWP models to create forecasts.


In this work, we are using Random Forests (RFs) to generate daily probabilistic forecasts of excessive rainfall at 1-8 day lead times. The RFs are trained using output from the Global Ensemble Forecast System and historical observations of excessive rainfall. Environmental parameters like precipitable water and CAPE, as well as modeled precipitation, are spatiotemporally arranged so the RFs can learn spatial and diurnal patterns that associate with excessive rainfall. The RF models are evaluated against a spatio-temporally varying climatology and show skill out to 7 days, and routinely outperform human-based forecasts past a 1-day lead time. In this presentation, we will highlight performance characteristics of the RFs into the medium-range (e.g., out to 8 days) and discuss the implications of excessive rainfall definitions in RF model training. Additionally, we will present an ensemble prediction framework that provides estimates of uncertainty and ranges of forecast solutions that operational forecasters desire at extended lead times.

How to cite: Hill, A. and Schumacher, R.: Medium-Range Excessive Rainfall Prediction with Machine Learning, EGU General Assembly 2024, Vienna, Austria, 14–19 Apr 2024, EGU24-11708, https://doi.org/10.5194/egusphere-egu24-11708, 2024.

EGU24-11953 | Posters on site | AS1.1

A Unified Representation of Subgrid Convection in NOAA’s Unified Forecast System 

Jian-Wen Bao, Sara Michelson, Haiqin Li, and Sungsu Park

It remains challenging to represent subgrid convection in weather and climate models at horizontal grid resolution across the gray zone, in which convective clouds are only partially resolved by the model dynamics and it is required for the representation of subgrid convection to have a generalized transitional behavior as the model’s horizontal resolution varies.  A practical approach for such a representation is to scale the eddy transport of physical properties from a conventional convection parameterization scheme by a quadradic function of the fractional area covered by convective updrafts in the grid cell (Arakawa and Wu, 2013).  Despite this approach’s popularity, its generalization is limited theoretically by the fact that the coarse-graining statistical analysis that gave rise to the approach involved only an idealized scenario of deep convection in quasi-equilibrium.  Additionally, when applying this approach, there is a theoretical ambiguity associated with the validity of conventional convection parameterizations for a fractional area covered by convective updrafts in the grid cell that is not close to zero.

An alternative approach for subgrid convection representation across the gray zone is to apply a unified plume scheme that treats subgrid convection as nonlocal asymmetric eddies due to unresolved convection relative to the grid-mean vertical flow (Park, 2014).  This unified plume scheme represents unresolved convection relative to the grid-mean vertical motion without relying on quasi-equilibrium assumptions in conventional convection parameterizations.  Its generalized transitional behavior across the gray zone is naturally controlled by the size of the plumes representing unresolved convection that varies with the model’s horizontal resolution.  It simulates all unresolved convective transport of atmospheric properties within a single steady framework, allowing multiple convective plumes.  It also includes the prognosis of unresolved cold pool and convection organization within the planetary boundary layer.  The unified plume scheme circumvents the theoretical limitation and ambiguity of the above approach based on conventional convection parameterization.  It also rectifies the lack of plume memory across the time step in conventional convection parameterizations.

This presentation will focus on an ongoing effort to experiment with the alternative unified approach for representing subgrid convection across the gray zone in NOAA’s Unified Forecast System.  Results from 1-D and 3-D case studies will be shown to highlight the advantage of the unified plume scheme.

References:

Arakawa, A., and C.-M. Wu, 2013: A unified representation of deep moist convection in numerical modeling of the atmosphere. Part I. J. Atmos. Sci., 70, 1977–1992.

Park, S., 2014: A unified convection scheme (UNICON). Part I: Formulation. J. Atmos. Sci., 71, 3902–3930.

How to cite: Bao, J.-W., Michelson, S., Li, H., and Park, S.: A Unified Representation of Subgrid Convection in NOAA’s Unified Forecast System, EGU General Assembly 2024, Vienna, Austria, 14–19 Apr 2024, EGU24-11953, https://doi.org/10.5194/egusphere-egu24-11953, 2024.

EGU24-12029 | Orals | AS1.1

NOAA’s Environmental Modeling Center Update: Transitioning to Unified Forecast System Applications for Operations 

Ivanka Stajner, Brian Gross, Vijay Tallapragada, Jason Levit, Raffaele Montuoro, Avichal Mehra, Daryl Kleist, and Fanglin Yang

National Oceanic and Atmospheric Administration’s (NOAA’s) Environmental Modeling Center (EMC) is a lead developer of operational Numerical Weather Prediction (NWP) systems at the National Weather Service (NWS), which are used for the protection of life and property and the enhancement of the economy. EMC transitions to operations and maintains more than 20 numerical prediction systems that are used by NWS, NOAA, other United States (U.S.) federal agencies, and various other stakeholders. These systems are developed through a close collaboration with academic, federal and commercial sector partners. EMC maintains, enhances and transitions-to-operations numerical forecast systems for weather, ocean, climate, land surface and hydrology, hurricanes, and air quality for the U.S. and global domains.


NOAA’s operational predictions are transitioning to the Unified Forecast System (UFS) framework in order to simplify the operational prediction suite of modeling systems. The UFS is being designed as a community-based, comprehensive atmosphere-ocean-sea-ice-wave-aerosol-land coupled Earth modeling system with coupled data assimilation and ensemble capabilities, organized around applications spanning from local to global domains and predictive time scales ranging from sub-hourly analyses to seasonal predictions.  Disparate legacy operational applications that have been developed and maintained by EMC in support of various stakeholder requirements are being transitioned to the UFS framework. The transition started several years ago and is planned to continue over the next few years. Fewer resulting applications will consolidate NCEP’s Production Suite that shares a set of common scientific components and technical infrastructure.  This streamlined suite is expected to accelerate the transition of research into operations and simplify maintenance of operational systems.


This talk describes major development and operational implementation projects at EMC over the last couple of years including for example a new UFS-based hurricane application, recent advances in the use of satellite data and a new verification system. We will present EMC plans for the next few years, within the overall NOAA strategy, and how planned efforts link with other modeling efforts within NOAA, in the broader U.S. and international community.

How to cite: Stajner, I., Gross, B., Tallapragada, V., Levit, J., Montuoro, R., Mehra, A., Kleist, D., and Yang, F.: NOAA’s Environmental Modeling Center Update: Transitioning to Unified Forecast System Applications for Operations, EGU General Assembly 2024, Vienna, Austria, 14–19 Apr 2024, EGU24-12029, https://doi.org/10.5194/egusphere-egu24-12029, 2024.

EGU24-12345 | Orals | AS1.1

Impact of a new land surface package in Canadian  numerical weather prediction system on the medium range weather forecast in the lower and upper atmosphere 

Nasim Alavi, Stephane Belair, Marco Carrera, Maria Abrahamowicz, Bernard Bilodeau, Dragan Simjanovski, Dorothee Charpentier, Bakr Badawy, and Sylvie Leroyer

A new land surface package developed at Environment and Climate Change Canada (ECCC) has been evaluated in the context of the medium-range global deterministic numerical weather prediction (NWP) system. The evaluation is performed by comparison of NWP forecasts against near-surface and

atmospheric analyses. The new land surface package includes i) new databases to specify soils and vegetation characteristics, ii) improved initialization of land surface variables by the assimilation of space-based remote sensing observations, and iii) a more sophisticated land surface scheme.

Evaluation for the screen-level air temperature and humidity indicates that the new land surface package resulted in smaller STDEs and larger temporal correlation between forecasts and analyses comparing to the current operational configuration. The improvement is greater for humidity than for air temperature.

Upper-air evaluation indicates that the impact of the new land surface package on the Planetary boundary layer (PBL) is substantial but more mixed, with large spatial variability in terms of its effect.

This study also investigated the physical and statistical links between near-surface and upper-air forecast errors at the medium range.

How to cite: Alavi, N., Belair, S., Carrera, M., Abrahamowicz, M., Bilodeau, B., Simjanovski, D., Charpentier, D., Badawy, B., and Leroyer, S.: Impact of a new land surface package in Canadian  numerical weather prediction system on the medium range weather forecast in the lower and upper atmosphere, EGU General Assembly 2024, Vienna, Austria, 14–19 Apr 2024, EGU24-12345, https://doi.org/10.5194/egusphere-egu24-12345, 2024.

EGU24-12794 | Posters on site | AS1.1

Sensitivity Experiments of a Mountain-Induced Gravity Wave Drag Parameterizations for Global Weather Forecasting 

Songyou Hong, Jian-Wen Bao, Sara Michelson, Evelyn Grell, Mike Toy, Joe Olson, and Fanglin Yang

The lower tropospheric enhanced gravity wave drag (GWD) parameterization has been operational in Global Forecast System (GFS) since late 1990s. The scheme is based on Kim and Arakawa and further revised with the addition of flow blocking (Kim and Doyle). For UFSR2O project, there have been collaborative efforts to improve the GWD parameterization by revising the mountain induced GWD. Revisions include the updates in GWD and flow blocking (Choi and Hong), and turbulent orography form drag of Beljaars et al. Sensitivity experiments are performed to investigate the importance of partitioning GWD and flow blocking in the skill of medium-range forecasts. Alternative approach for TOFD (Richter et al.) is tested. Importance of the representation of sub-grid orography statistics is also examined. 

How to cite: Hong, S., Bao, J.-W., Michelson, S., Grell, E., Toy, M., Olson, J., and Yang, F.: Sensitivity Experiments of a Mountain-Induced Gravity Wave Drag Parameterizations for Global Weather Forecasting, EGU General Assembly 2024, Vienna, Austria, 14–19 Apr 2024, EGU24-12794, https://doi.org/10.5194/egusphere-egu24-12794, 2024.

EGU24-13187 | Orals | AS1.1

Improved Weather Predictions Through Data Assimilation for GFDL SHiELD 

Mingjing Tong, Lucas Harris, Linjiong Zhou, Kun Gao, Alex Kaltenbaugh, and Baoqiang Xiang

The Geophysical Fluid Dynamics Laboratory (GFDL)’s System for High‐resolution prediction on Earth‐to‐Local Domains (SHiELD) model typically uses the National Centers for Environmental Prediction (NCEP) Global Forecast System (GFS) analyses to initialize its medium-range global forecasts. Both initial condition (IC) and forecast model have an impact on model prediction skills. The quality of the IC is partially determined by the model short-range forecast used as first guess in data assimilation. 

A data assimilation (DA) system has been developed for the global SHiELD to demonstrate the prediction skills of the model initialized from its own analysis. The DA system largely leverages the advanced DA techniques used in GFS and assimilates all the observations assimilated in GFS. Compared to the SHiELD forecasts initialized from GFS analysis, SHiELD forecast skill is significantly improved by using its own analysis. Tremendous improvement was found in the Southern Hemisphere with positive impact lasting up to 10 days. The DA system is also useful in identifying and understanding model errors. The most noticeable model error detected by the DA system originates from the TKE-EDMF boundary layer scheme. The model error leads to insufficient ensemble spread, which could not be fully addressed by the multiplicative inflation and stochastic physics schemes used in the system. Including two versions of the TKE EDMF scheme in the ensemble can alleviate the systematic model error, which further improves forecast skills. The use of the interchannel correlated observation errors for Infrared Atmospheric Sounding Interferometer (IASI) and Cross-track Infrared Sounder (CrIS) was also investigated, which improves the forecast skill up to day 5 and further reduces the impact of the model error in the marine stratocumulus region. Further understanding of the model error associated with the TKE-EDMF scheme will be presented. 

How to cite: Tong, M., Harris, L., Zhou, L., Gao, K., Kaltenbaugh, A., and Xiang, B.: Improved Weather Predictions Through Data Assimilation for GFDL SHiELD, EGU General Assembly 2024, Vienna, Austria, 14–19 Apr 2024, EGU24-13187, https://doi.org/10.5194/egusphere-egu24-13187, 2024.

EGU24-13504 | Posters on site | AS1.1

Second Year Progress of PREVENIR: Japan-Argentina Cooperation Project for Heavy Rain and Urban Flood Disaster Prevention 

Takemasa Miyoshi, Yanina G. Skabar, Shigenori Otsuka, Arata Amemiya, Juan Ruiz, Tomoo Ushio, Hirofumi Tomita, Tomoki Ushiyama, and Masaya Konishi

This presentation provides recent research highlights of the project PREVENIR, including radar quantitative precipitation estimates (QPE), ensemble nowcasting, data assimilation, numerical weather prediction (NWP), and hydrological model prediction. PREVENIR is an international cooperation project between Argentina and Japan since 2022 for five years under the Science and Technology Research Partnership for Sustainable Development (SATREPS) program jointly funded by the Japan International Cooperation Agency (JICA) and the Japan Science and Technology Agency (JST). The main goal is to develop an impact-based early warning system for heavy rains and urban floods in Argentina. PREVENIR takes advantage of leading research on Big Data Assimilation (BDA) with the Japan’s flagship supercomputer “Fugaku” and its predecessor “K” and develops a total package for disaster prevention, namely, monitoring, QPE, nowcasting, BDA and NWP, hydrological model prediction, warning communications, public education, and capacity building. The total package for disaster prevention will be the first of its kind in Argentina and will provide useful tools and recommendations for the implementation of similar systems in other parts of the world.

How to cite: Miyoshi, T., Skabar, Y. G., Otsuka, S., Amemiya, A., Ruiz, J., Ushio, T., Tomita, H., Ushiyama, T., and Konishi, M.: Second Year Progress of PREVENIR: Japan-Argentina Cooperation Project for Heavy Rain and Urban Flood Disaster Prevention, EGU General Assembly 2024, Vienna, Austria, 14–19 Apr 2024, EGU24-13504, https://doi.org/10.5194/egusphere-egu24-13504, 2024.

EGU24-13557 | ECS | Orals | AS1.1

What determines the predictability of a Mediterranean cyclone?   

Benjamin Doiteau, Florian Pantillon, Matthieu Plu, Laurent Descamps, and Thomas Rieutord

Cyclones provides the majority of water supplies in the Mediterranean and are essential elements of the climate of the region. The most intense of them lead to natural disasters because of their violent winds and extreme rainfall. Identifying systematic errors in the predictability of Mediterranean cyclones is therefore essential to better anticipate and prevent their impact. The aim of this work is to understand what processes determine their predictability. 

We investigate the predictability of Mediterranean cyclones in a systematic framework using an ensemble prediction system. First, a reference dataset of 2853 cyclones is obtained by tracking lows in the ERA5 reanalysis, using an algorithm developed for the North Atlantic and adapted for the Mediterranean region. Then we investigate their predictability using IFS ensemble reforecasts in a homogeneous configuration over 22 years (2000-2021). The predictability in the reforecasts is quantified using probabilistic scores on cyclones trajectories and on intensity (mean sea level pressure) and then crossed with explanatory variables such as geographic area, cyclone velocity, season and intensity.

The evolution of location error with lead time shows a two phases growth, until and beyond 72 h, which will be discussed. When crossing the location and intensity errors with the explanatory variables, we can identify the conditions leading to a poorer (respectively better) predictability. In particular the velocity of cyclones appears to play an important role in the predictability of the location, the slower the cyclone the better the predictability, while the season is shown to play a greater role on the predictability of the intensity. These characteristics are also dependant on the sub-region considered and on the intensity of the low itself, the deeper the cyclone, the poorer the predictability in both the location and the intensity.

How to cite: Doiteau, B., Pantillon, F., Plu, M., Descamps, L., and Rieutord, T.: What determines the predictability of a Mediterranean cyclone?  , EGU General Assembly 2024, Vienna, Austria, 14–19 Apr 2024, EGU24-13557, https://doi.org/10.5194/egusphere-egu24-13557, 2024.

EGU24-13655 | Posters on site | AS1.1

An overview of Japan’s Moonshot Goal 8 R&D program for controlling and modifying the weather by 2050 

Tetsuo Nakazawa, Takemasa Miyoshi, Takashi Sakajo, and Kohei Takatama

Forecast and control are the two sides of a coin. Recent improvements in numerical weather prediction have led to the point where we can start discussing the control of complex, chaotic weather systems. The Japan’s Moonshot Goal 8 research and development (R&D) program or simply MS8 was launched in 2022 to control extreme weather events such as typhoons and torrential rains and to reduce damage from extreme winds and rains, so that we can realize a society safe from such disasters by 2050. As the important first step toward the next 3-decade R&D, MS8 prioritizes numerical simulation experiments to investigate the feasibility of weather control under the constraints of energy and technology within human’s capability in a foreseeable future. Thus far, MS8 achieved promising results to reduce a peak rainfall of heavy downpours, and more results are expected by ongoing efforts. MS8 also accelerates developing basic science and technologies for realizing weather control, such as advanced weather models, computational models of flood damage, and mathematical approaches to intervention optimization techniques for large dimensional systems. In addition, addressing ethical, legal, and social issues (ELSI) is essential and a priority in MS8. This presentation will provide an overview of MS8 with highlighting scientific results.


How to cite: Nakazawa, T., Miyoshi, T., Sakajo, T., and Takatama, K.: An overview of Japan’s Moonshot Goal 8 R&D program for controlling and modifying the weather by 2050, EGU General Assembly 2024, Vienna, Austria, 14–19 Apr 2024, EGU24-13655, https://doi.org/10.5194/egusphere-egu24-13655, 2024.

EGU24-13807 | ECS | Posters on site | AS1.1

Implementation of the Generalized Double-Moment Normalization Method in the Cloud Microphysics Scheme 

JoongHyun Jo, Sun-Young Park, Kyo-Sun Sunny Lim, Wonbea Bang, and Gyuwon Lee

Cloud microphysics parameterizations are generally divided into two categories: bin models that explicitly calculate the evolution of the drop size distribution (DSD) and bulk models that represent the DSD with a specific function. The Weather Research and Forecasting (WRF) Double-Moment 6-class (WDM6) scheme is one of the bulk microphysics options in the WRF model and is widely utilized for both research and operational purposes. In WDM6 scheme, the gamma form with a single static shape parameter is applied for the DSD of rain. This study adopts a generalized double-moment normalization method for the rain DSD in WDM6 scheme. Previous study mentions that the advantage of the generalized double-moment normalization method lies in its ability to singnificantly reduce the observed DSD scatter. Therefore, it can concisely represent the DSD with appropriate shape parameters, c and μ. The modified WDM6 is evaluated through simulations of an idealized 2D squall line and a summer precipitation case over the Korean peninsula. Based on similar experimental results from the original WDM6 and the modified WDM6 schemes, we can confirm that the generalized double-moment normalization method in the WDM6 scheme is properly implemented. We further collected the observed shape parameters suitable for the generalized double-moment DSD of rain over a two-year summer period (2018, 2019). The modified WDM6, with the observed shape parameters, simulates a more comparable spatial distribution of acummulated precipitation that occurred on 6 August 2013 with the observation, compared to the original WDM6. More detailed simulation results will be presented at the conference.


* This work was supported by the National Research Foundation of Korea(NRF) grant funded by the Korea government(MSIT). (grant no.RS-2023-00208394).

How to cite: Jo, J., Park, S.-Y., Lim, K.-S. S., Bang, W., and Lee, G.: Implementation of the Generalized Double-Moment Normalization Method in the Cloud Microphysics Scheme, EGU General Assembly 2024, Vienna, Austria, 14–19 Apr 2024, EGU24-13807, https://doi.org/10.5194/egusphere-egu24-13807, 2024.

EGU24-13978 | Posters on site | AS1.1

A Positive-Definite Moist EDMF Parameterization Scheme for Turbulent Mixing in the PBL 

Evelyn Grell and Jian-Wen Bao

Planetary boundary layer (PBL) parameterizations using the eddy diffusivity - mass flux (EDMF) technique for turbulent mixing in the convective PBL have been popularly used in weather and climate models.  When including moist adjustment processes, some numerical implementations of the EDMF parameterization may result in unphysical solutions of cloud condensate, for example, negative cloud water quantities.  To solve this problem, a procedure to obtain a positive definite solution is proposed to solve the moist EDMF equations.  In this presentation, we will demonstrate the formulation of the solution procedure and show examples of its impact on the PBL mixing simulation using a single-column model.

How to cite: Grell, E. and Bao, J.-W.: A Positive-Definite Moist EDMF Parameterization Scheme for Turbulent Mixing in the PBL, EGU General Assembly 2024, Vienna, Austria, 14–19 Apr 2024, EGU24-13978, https://doi.org/10.5194/egusphere-egu24-13978, 2024.

Korea Institute of Atmospheric Prediction Systems (KIAPS) has developed a global forecasting system, Korean Integrated Model (KIM) and the model now operates with 12-km horizontal resolution. With plans to develop the numerical model in horizontally and vertically higher resolution, smoothed hybrid sigma-pressure (SMH) coordinate has applied to KIM to cover the influence of the terrain structure. The SMH is proposed to alleviate artificial circulations that horizontal pressure gradients and advection can be appeared along complex surfaces by reducing small-scale components more rapidly with height (Choi and Klemp, 2021). 
In this research, we focus on the prediction with higher-resolution topography in the SMH coordinate and it is revealed that more realistic data can be utilized than the previous topography adapted in hybrid sigma coordinate. The SMH coordinate could well reflect the steepness and roughness of complex region such as terrains near mountains without stability issue. To investigate the sensitivity to the detailed topographic data, case studies such as heatwave, cold surge and rainfall are dealt with especially in the Korean peninsula consisted of complex terrain. By considering more complex topography, the SMH coordinate performs better in capturing precipitation peak and temperature bias. In addition, it will be discussed that vertical propagation to the upper atmosphere is appropriately controlled due to the SMH coordinate. This study can contribute to the future work on adjusting diffusion coefficient by optimizing the SMH coordinate in much higher resolution.

How to cite: Kong, H.-J., Park, J.-R., and Nam, H.: Response of the SMoothed Hybrid sigma-pressure (SMH) coordinate to higher-resolution topographic data in Korean Integrated Model (KIM), EGU General Assembly 2024, Vienna, Austria, 14–19 Apr 2024, EGU24-14761, https://doi.org/10.5194/egusphere-egu24-14761, 2024.

EGU24-15364 | Posters on site | AS1.1

Development of extended medium-range reforecasting system based on the Korean Integrated Model (KIM) 

Shin-Woo Kim, Taehyoun Shim, Ja-Young Hong, and Hye-Jin Park

The Korean Integrated Model (KIM) is a global numerical weather prediction (NWP) system developed by the first phase project of the Korea Institute of Atmospheric Prediction Systems (KIAPS) and has been used as the operational NWP system at the Korea Meteorological Administration (KMA) since April 2020. The second phase project of KIAPS aims at developing a next-generation NWP system to seamlessly predict from very short-range to extended medium-range. To improve the extended medium-range forecast, one of the main goals of KIAPS is to develop the ensemble prediction system with coupling to land, ocean, and sea ice. The production of extended medium-range reforecast data is necessary to understand the climatological characteristics and model biases of KIM. KIAPS developed an initial version of reforecasting system based on the KIM atmopheric model. The system has a spatial resolution of 50 km (NE090NP3) and consists of 91 vertical layers. We produce reforecast of the cold season cases for 20 years (from 2001 to 2020) and perform the diagnosis and verification of reforecast data. A suite of sensitivity experiments are also performed to investigate the impact of initial perturbations on the ensemble prediction system.

How to cite: Kim, S.-W., Shim, T., Hong, J.-Y., and Park, H.-J.: Development of extended medium-range reforecasting system based on the Korean Integrated Model (KIM), EGU General Assembly 2024, Vienna, Austria, 14–19 Apr 2024, EGU24-15364, https://doi.org/10.5194/egusphere-egu24-15364, 2024.

EGU24-15467 | ECS | Posters on site | AS1.1

Impact of Nesting Techniques Over Short-Term WRF Forecast Accuracy 

A. Cem Çatal, Aysu Arık, M. Tuğrul Yılmaz, and İsmail Yücel

Weather Research and Forecasting (WRF) plays a crucial role in studying atmospheric dynamics and investigating the mesoscale weather prediction phenomena. However, WRF model offers lots of different configurations for physics, dynamics, and domain options that need to be investigated. From these configurations, domain options offer nesting techniques which may affect the fundamental structure and the performance of the simulations. Nesting options may impact the representation of fine-scale processes by increasing the resolution for the desired domain, compared to single-domain simulations. Existing studies on comparison of different nesting configurations in mesoscale domains are limited. This study presents a comparative analysis of three different nesting configurations in the WRF model over Türkiye. Accuracy of WRF-based short-term (24 to 48 hourly) temperature, wind, and precipitation forecasts over a 30-day period in November 2021 is investigated utilizing ground-station based observations. Three different model configurations are investigated: single domain, one-way feedback nested, and two-way feedback nested runs for the same time period and region. Root mean square error (RMSE), error standard deviation, and correlation coefficient were calculated for all three configurations. This study contributes to the optimization of nesting configurations in WRF mesoscale weather predictions, aiding decision-making processes reliant on accurate short-term forecasts in Türkiye.

How to cite: Çatal, A. C., Arık, A., Yılmaz, M. T., and Yücel, İ.: Impact of Nesting Techniques Over Short-Term WRF Forecast Accuracy, EGU General Assembly 2024, Vienna, Austria, 14–19 Apr 2024, EGU24-15467, https://doi.org/10.5194/egusphere-egu24-15467, 2024.

EGU24-15614 | Orals | AS1.1

Running global Machine Learning weather models - challenges, observations and conclusions 

Karolina Stanisławska and Olafur Rognvaldsson

Machine Learning (ML) became pervasive in every domain of the research, providing opportunities of modeling phenomena that were difficult to capture using known equations. From small models running on student computers, to giant LLMs trained on the whole Internet, ML models come in all shapes and sizes. To the meteorological community, one branch of this research stands out as revolutionary - ML-based global weather models.

ML-based global weather models lie on the opposite end of the spectrum compared to numerical weather prediction (NWP) models. Instead of representing the physics in a form of equations and solving these equations on the model grid, ML models are purely data-driven - even if they managed to represent physics internally, the inference of that physics would remain a black box.

Yet, these models underwent significant advancement in the past year - and three of them stand out - GraphCast (Google), ClimaX (Microsoft) and MetNet (Google). The former two, open-sourced for research purposes, are being tested currently at Belgingur. Having many years of experience with running and deploying NWP weather models, we notice how working with these models differs from working with the new class of ML-based (or data-driven) models.

This talk discusses essential differences between working with NWP and ML-based weather models. What we can, and what we cannot control? What does the process of working with such an ML model look like? What is the main advantage of an ML model run in production? What are the main obstacles in deploying an ML model and running it operationally?

With the current pace of the growth of Machine Learning models, we will be encountering them in our everyday work sooner or later. Knowing the challenges and opportunities of them will help us understand how to use them to our advantage.

How to cite: Stanisławska, K. and Rognvaldsson, O.: Running global Machine Learning weather models - challenges, observations and conclusions, EGU General Assembly 2024, Vienna, Austria, 14–19 Apr 2024, EGU24-15614, https://doi.org/10.5194/egusphere-egu24-15614, 2024.

EGU24-16714 | Orals | AS1.1

The Weather On Demand weather forecast framework - Recent developments and outlook 

Olafur Rognvaldsson and Karolina Stanislawska

Belgingur Ltd. has created a novel weather forecasting framework, called Weather On Demand – WOD, that is deployable in the cloud and on in-house hardware and which can be customised for any location world-wide at a very short notice.

The WOD framework is a distributed system for:

  • Running the WRF weather model for data-assimilation and forecasts by either triggering scheduled or on-demand jobs.
  • Gathering upstream weather forecasts and observations from a wide variety of sources.
  • Processing data for long to medium-term storage.
  • Making results available through APIs.
  • Making data files available to custom post-processors.

Much effort is put into starting processing as soon as the required data becomes available and in parallel when possible.

Recent additions to the WOD system include the potential of:

  • Optional use of the hybrid data assimilation techniques of the WRF Data Assimilation system [1, 2].
  • Set up a multi-domain dispersion forecast of volcanic ash and gases.
  • Use of the Verif [3] verification package to compare forecasts, both upstream and WOD, to observations.
  • Using different sources of initial data to that of the boundary forcing data.

On-going developments focuses on the use of in-situ UAV profiles and radar data as input to the WOD data assimilation system.

We have further started experimenting with using global models, both conventional NWP models as well as novel ML models (cf. abstract no. EGU24-15614).

References:

[1] Xuguang Wang, Dale M. Barker, Chris Snyder, and Thomas M. Hamill, 2008: A hybrid ETKF–3DVAR data assimilation scheme for the WRF model. Part I: Observing system simulation experiment. Mon. Wea. Rev., 136, 5116–5131.

[2] Xuguang Wang, Dale M. Barker, Chris Snyder, and Thomas M. Hamill, 2008: A Hybrid ETKF–3DVAR Data Assimilation Scheme for the WRF Model. Part II: Real Observation Experiments. Mon. Wea. Rev., 136, 5132–5147.

[3] Nipen, T. N., R. B. Stull, C. Lussana, and I. A. Seierstad, 2023. Verif: A Weather-Prediction Verification Tool for Effective Product Development. Bulletin of the American Meteorological Society 104, 9; 10.1175/BAMS-D-22-0253.1.

How to cite: Rognvaldsson, O. and Stanislawska, K.: The Weather On Demand weather forecast framework - Recent developments and outlook, EGU General Assembly 2024, Vienna, Austria, 14–19 Apr 2024, EGU24-16714, https://doi.org/10.5194/egusphere-egu24-16714, 2024.

EGU24-17438 | ECS | Orals | AS1.1

A feature-based framework to investigate atmospheric predictability. 

Sören Schmidt, Michael Riemer, and Tobias Selz

Atmospheric predictability is intrinsically limited by the upscale growth of initial small-scale, small-amplitude errors. For practical predictability, model error and initial-condition uncertainty also contribute significantly. The accurate representation and interactions of these factors within numerical weather prediction systems determine the extent to which forecast uncertainty is correctly modeled. An improved understanding of upscale error-growth mechanisms and their flow dependence in numerical weather prediction models has several implications: it enables more focused model verification and development, aids in recognizing limitations in emerging forecasts systems like machine-learning-based approaches, and may indicate when the intrinsic limit of predictability has been reached.

Studying the flow dependence of error growth requires a local perspective, which is not provided by the traditional spectral perspective on upscale error growth. We here take a complementary approach and apply a feature-based perspective. We have developed an automated algorithm to identify error features in gridded data and track their spatial and temporal evolution. Errors are considered in terms of potential vorticity (PV) and near the tropopause, where they maximize. A previously derived PV-error tendency equation is evaluated to quantify the different contributions to error-growth experiments with the global prediction Model ICON from the German Weather Service. Errors in these experiments grow from differences in the seeding of a stochastic convection scheme. In a suite of experiments, this source of uncertainty competes with initial-condition uncertainty of varying magnitude. Evaluation of the process-specific error-growth rates allow the detailed quantification of the upscale-growth mechanisms. For this purpose, we integrate the growth rates over the respective area associated with an error feature. Examination of the combined growth rates of all features in an upscale-error-growth experiment reproduces a previously found three-stage multi-scale upscale-growth paradigm. Illustration the importance of flow dependence, the growth rates from a single feature can substantially differ from the overall average. Further highlighting this importance, intrinsic limits of predictivity can be identified for some features even in the presence of substantial initial-condition uncertainty. The presentation will conclude with a comparison of error evolution in conventional numerical weather prediction systems to a data-driven, machine-learned model.

How to cite: Schmidt, S., Riemer, M., and Selz, T.: A feature-based framework to investigate atmospheric predictability., EGU General Assembly 2024, Vienna, Austria, 14–19 Apr 2024, EGU24-17438, https://doi.org/10.5194/egusphere-egu24-17438, 2024.

EGU24-18054 | Posters on site | AS1.1

Enhanced coupled land-atmosphere data assimilation for reanalysis 

Peter Weston, Patricia de Rosnay, Christoph Herbert, and Ewan Pinnington

The CERISE (CopERnIcus climate change Service Evolution) project aims to develop land and coupled land-atmosphere data assimilation systems for the next generation of coupled reanalysis. This encompasses technical enhancements to the system architecture as well as scientific changes to improve the quality of the reanalyses.

Recent work has focussed on developing ensemble perturbation methods for the land-surface. The existing ensemble spread in model variables at and near the land-surface is known to be insufficient which can cause problems when assimilating interface observations in a coupled system. This is because the existing ensemble perturbations are mainly applied to upper air atmospheric variables. One way to increase the spread at the surface is to directly perturb land-surface parameters such as vegetation cover and leaf area index. Results from this approach are encouraging in offline and coupled experiments.

Another part of the project is to enhance the assimilation of passive microwave radiances over land. Currently the use of surface-sensitive passive microwave channels are largely limited to the ocean due to challenges in forward modelling of complex and heterogenous land surfaces. In CERISE, machine learning approaches are being explored to develop an observation operator to enable the use of these observations over land and snow surfaces.

Finally, developing quasi-strongly coupled land-atmosphere assimilation is a key objective of the project. Developments so far have focussed on technical changes to build a framework to allow stronger coupling than the current weakly coupled assimilation strategy. A summary of recent progress in the CERISE project will be presented.

How to cite: Weston, P., de Rosnay, P., Herbert, C., and Pinnington, E.: Enhanced coupled land-atmosphere data assimilation for reanalysis, EGU General Assembly 2024, Vienna, Austria, 14–19 Apr 2024, EGU24-18054, https://doi.org/10.5194/egusphere-egu24-18054, 2024.

EGU24-18151 | ECS | Posters on site | AS1.1

Evaluating multi-task learning strategies for tropical cyclones itnensity forecasting from satellite images 

Clément Dauvilliers, Anastase Charantonis, and Claire Monteleoni

Skillfully forecasting the evolution of tropical cyclones (TC) is crucial for
the human populations in areas at risk, and an essential indicator of a storm’s
potential impact is the Maximum Sustained Wind Speed, often referred to as
the cyclone’s intensity. Predicting the future intensity of ongoing storms is
traditionally done using statistical-dynamical methods such as (D)SHIPS and
LGEM, or as a byproduct of fully dynamical models such as the HWRF model.
Previous works have shown that deep learning models based on convolutional
neural networks can achieve comparable performances using infrared and/or
passive microwave satellite imagery as input. Recently, multi-task models have
highlighted that jointly learning the future intensity and other indicators such
as the TC size with shared network weights can improve the performance in the
context of intensity estimation. This ongoing work aims to evaluate which tasks
and architectures can lead to the best improvement for intensity forecasting.

How to cite: Dauvilliers, C., Charantonis, A., and Monteleoni, C.: Evaluating multi-task learning strategies for tropical cyclones itnensity forecasting from satellite images, EGU General Assembly 2024, Vienna, Austria, 14–19 Apr 2024, EGU24-18151, https://doi.org/10.5194/egusphere-egu24-18151, 2024.

EGU24-18966 | Posters on site | AS1.1

Effects of initialization of sea ice properties on medium-range forecasts in the Korean Integrated Model 

Hyun-Joo Choi, Seok Hwan Kim, Baek-Min Kim, Myung-Seo Koo, Eek-Hyun Cho, and Young Cheol Kwon

The Korean Integrated Model (KIM) has been in operation at Korea Meteorological Administration (KMA) since April 2020 and its forecasting performance has been improved by updating model physical processes and data assimilation system. The model performance is comparable to that of the Unified Model run in parallel with the KIM at KMA during Boreal summer, but is relatively poor during the winter. One of the major biases in 5-day temperature forecasts for Norther Hemisphere winter is the low atmospheric cold bias over the Arctic region, and thus this study modifies the initialization of sea ice properties (sea ice thickness and temperature) to reduce the bias. First, the initial sea ice thickness data prescribed by climatology data produced using reanalysis data from the past 10 years (2000~2009) is replaced using the latest (2019~2021) reanalysis data. Second, the initial temperatures of the 1st and 2nd sea ice layers are set to the sea water freezing temperature instead of the currently applied first guess (background) sea ice temperatures. The effects of initialization modification on the medium-range forecasts of KIM are analyzed by performing two sets of experiments: cold start and warm cycle experiments without and with a data assimilation system in January 2022. The latest sea ice thickness initial data shows that sea ice thickness has decreased by about a factor of two. And its adoption by KIM increases surface and lower atmospheric temperatures in the Arctic sea ice region, alleviating cold biases in the region for both analysis and forecasts. In addition to sea ice thickness, sea ice temperature initialization modifications enhance Arctic warming and lead to greater improvement of cold bias. The warming effect in the lower Arctic is consistent in both cold start and warm cycle experiments. However, secondary effects induced by the Arctic warming occur significantly only in the warm cycle experiment and significantly affect forecasts fields not only in the polar region but also in the Southern Hemisphere and mid-latitude regions. Skill scores for medium-range forecasts in January 2022 are mostly improved (degraded) for the 12 UTC (00 UTC) initial conditions in the warm cycle experiment.

How to cite: Choi, H.-J., Kim, S. H., Kim, B.-M., Koo, M.-S., Cho, E.-H., and Kwon, Y. C.: Effects of initialization of sea ice properties on medium-range forecasts in the Korean Integrated Model, EGU General Assembly 2024, Vienna, Austria, 14–19 Apr 2024, EGU24-18966, https://doi.org/10.5194/egusphere-egu24-18966, 2024.

EGU24-18982 | ECS | Posters on site | AS1.1

Benefits of initializing equatorial waves on extratropical forecasts 

Chen Wang, Nedjeljka Žagar, and Sergiy Vasylkevych
Large initial uncertainties in the tropics are believed to compromise medium- and extended-range extratropical forecasts. A more reliable analysis of tropical Rossby and non-Rossby waves requires more tropical observations and improved data assimilation schemes. Wind observations are known to be more valuable than mass observations in the tropics, but it is not well-understood how different types of observations affect the accuracy of equatorial wave analysis and influence extratropical predictability. 
We investigate these questions by assimilating only wind or mass observations within the tropics using a perfect-model framework and a global model based on shallow-water equations and 3D-Var data assimilation. The mass-wind relationships of equatorial waves are built into the background-error covariance matrix with Rossby and non-Rossby waves as control variables in 3D-Var and prognostic variables in the forecast model.  Results demonstrate that wind observations are more efficient at reducing both tropical and extratropical forecast errors than mass observations. Adding mass-wind coupling further improves extratropical forecasts and it is especially beneficial for mass observations.Forecast benefits are quantified along latitude circles in terms of scales. A more accurate analysis of the equatorial Rossby waves is found to be the key for the propagation of observation impact from the tropics to midlatitudes. 
 

How to cite: Wang, C., Žagar, N., and Vasylkevych, S.: Benefits of initializing equatorial waves on extratropical forecasts, EGU General Assembly 2024, Vienna, Austria, 14–19 Apr 2024, EGU24-18982, https://doi.org/10.5194/egusphere-egu24-18982, 2024.

EGU24-19593 | Posters on site | AS1.1

Dynamical downscaling and data assimilation for a cold-air outbreak in the European Alps during the Year Without Summer 1816 

Peter Stucki, Lucas Pfister, Stefan Brönnimann, Yuri Brugnara, Chantal Hari, and Renate Varga

The “Year Without Summer” of 1816 was characterized by extraordinarily cold and wet periods in Central Europe, and it was associated with severe crop failures, famine, and socio-economic disruptions. From a modern perspective and beyond its tragic consequences, the summer of 1816 represents a rare occasion to analyze the adverse weather (and its impacts) after a major volcanic eruption. However, given the distant past, obtaining the high-resolution data needed for such studies is a challenge. In our approach, we use dynamical downscaling, in combination with 3D-variational data assimilation of early instrumental observations, for assessing a cold-air outbreak in early June 1816. 
Our downscaling simulations reproduce and explain meteorological processes well at regional to local scales, such as a foehn wind situation over the Alps with much lower temperatures on its northern side. Simulated weather variables, such as cloud cover or rainy days, are simulated in good agreement with (eye) observations and (independent) measurements, with small differences between the simulations with and without data assimilation. However, validations with partly independent station data show that simulations with assimilated pressure and temperature measurements are closer to the observations. In turn, data assimilation requires careful selection, preprocessing and bias-adjustment of the underlying observations. Our findings underline the great value of digitizing efforts of early instrumental data and provide novel opportunities to learn from extreme weather and climate events as far back as 200 years or more.

How to cite: Stucki, P., Pfister, L., Brönnimann, S., Brugnara, Y., Hari, C., and Varga, R.: Dynamical downscaling and data assimilation for a cold-air outbreak in the European Alps during the Year Without Summer 1816, EGU General Assembly 2024, Vienna, Austria, 14–19 Apr 2024, EGU24-19593, https://doi.org/10.5194/egusphere-egu24-19593, 2024.

EGU24-20366 | ECS | Orals | AS1.1

Irrigation parameterization in the Operational Numerical Weather Prediction model ICON-nwp 

Jane Roque, Arianna Valmassoi, and Jan Keller

Irrigation is one agricultural practice that contributes to maintain an optimal soil water content for crop development. Currently, farmers find this practice as an essential method for adapting to climate change. The Earth science community identified some irrigation effects beyond soil moisture and plant growth impact, as multiple studies found an influence on atmospheric variables such as 2 m temperature, relative humidity and even precipitation. Moreover, the effect of irrigation on the Earth’s system has been studied on various temporal and geographical scales and with different climate and land surface models. However, there are few studies that simulated the effect of irrigation on higher resolutions on a regional scale. Therefore, the aim of this study is to include the representation of irrigation processes in the operational ICON-nwp in Limited Area Mode on the EURO-CORDEX domain. The implementation of the current irrigation parameterization in ICON-nwp coupled with TERRA is an adaptation of the CHANNEL scheme developed by Valmassoi et al. (2020). We found suitable to include this scheme in the land surface and atmosphere interface of the icon-nwp-2.6.6-nwp0 version. The present study consists of four sensitivity experiments with different irrigation water amounts, namely 2.6 mmd-1, 6.7 mmd-1 and two fixed soil water contents, field capacity and saturation. All experiments have the same irrigation frequency (1 day), length (24 hours), and simulation period (May to August). The model settings for the experiments are 3 km resolution, 75 vertical levels and ICON boundary and initial conditions. The results from the difference between experiments and the control run demonstrate that ICON captures the irrigation effect on land surface atmospheric variables. As expected, soil moisture content increased on different magnitudes in all experiments. Moreover, 2 m temperature values dropped on average -0.74 K in irrigated areas. Likewise, energy fluxes were sensible to the different irrigation amounts.

How to cite: Roque, J., Valmassoi, A., and Keller, J.: Irrigation parameterization in the Operational Numerical Weather Prediction model ICON-nwp, EGU General Assembly 2024, Vienna, Austria, 14–19 Apr 2024, EGU24-20366, https://doi.org/10.5194/egusphere-egu24-20366, 2024.

EGU24-20553 | Orals | AS1.1

Crossing the Valley of Death : Transitioning Weather Research to Operations in NOAA 

Chandra Kondragunta, Aaron Pratt, Kevin Garrett, Nicole Kurkowski, Wendy Sellers, and Valbona Kunkel

In 2016, the U. S. Congress created the Joint Technology Transfer Initiative (JTTI) program in the Office of Oceanic and Atmospheric Research (OAR), the research wing of the National Oceanic Atmospheric Administration (NOAA).  Within OAR, the Weather Program Office (WPO) is responsible for managing the JTTI program.  The main mission of this program is to continuously develop and transition the mature weather technologies from the research community to the National Weather Service (NWS) operations.  

JTTI selects promising Research to Operations (R2O) transition projects through two types of competitions: one for the external community (non-NOAA) that includes private, academic sectors and non-profit organizations through Notices of Funding Opportunities; and the other for the NOAA scientific community.  Additionally, the JTTI program collaborates with the NWS Office of Science and Technology Integration (OSTI) and provides funding for the Unified Forecasting System - R2O project and testbed activities.  JTTI-funded R2O projects cover three main frameworks within the NWS forecasting operations: the observational, modeling, and products and services frameworks.  The topics covered include data assimilation; convective scale weather modeling; stochastic physics; ensemble model building; hydrologic modeling; post-processing of model output on time scales ranging from hourly to subseasonal; high impact weather forecasting tools; artificial intelligence/machine learning; and social behavioral and economic science. To date, the JTTI program has funded 155 R2O projects and transitioned 20 projects to the NWS operations.  In this paper, we present the JTTI implementation process in NOAA and share some of the successful R2O stories.

How to cite: Kondragunta, C., Pratt, A., Garrett, K., Kurkowski, N., Sellers, W., and Kunkel, V.: Crossing the Valley of Death : Transitioning Weather Research to Operations in NOAA, EGU General Assembly 2024, Vienna, Austria, 14–19 Apr 2024, EGU24-20553, https://doi.org/10.5194/egusphere-egu24-20553, 2024.

EGU24-3548 | Posters on site | AS1.2

Improving the Completion of Weather Radar Missing Data with Deep Learning 

Aofan Gong, Haonan Chen, and Guangheng Ni

Weather radars commonly suffer from the data-missing problem that limits their data quality and applications. Traditional methods for the completion of weather radar missing data, which are based on radar physics and statistics, have shown defects in various aspects. Several deep learning (DL) models have been designed and applied to weather radar completion tasks but have been limited by low accuracy. This study proposes a dilated and self-attentional UNet (DSA-UNet) model to improve the completion of weather radar missing data. The model is trained and evaluated on a radar dataset built with random sector masking from the Yizhuang radar observations during the warm seasons from 2017 to 2019, which is further analyzed with two cases from the dataset. The performance of the DSA-UNet model is compared to two traditional statistical methods and a DL model. The evaluation methods consist of three quantitative metrics and three diagrams. The results show that the DL models can produce less biased and more accurate radar reflectivity values for data-missing areas than traditional statistical methods. Compared to the other DL model, the DSA-UNet model can not only produce a completion closer to the observation, especially for extreme values, but also improve the detection and reconstruction of local-scale radar echo patterns. Our study provides an effective solution for improving the completion of weather radar missing data, which is indispensable in radar quantitative applications.

How to cite: Gong, A., Chen, H., and Ni, G.: Improving the Completion of Weather Radar Missing Data with Deep Learning, EGU General Assembly 2024, Vienna, Austria, 14–19 Apr 2024, EGU24-3548, https://doi.org/10.5194/egusphere-egu24-3548, 2024.

EGU24-5373 | ECS | Orals | AS1.2 | Highlight

Convective environments in AI-models - What have AI-models learned about atmospheric profiles? 

Monika Feldmann, Louis Poulain-Auzeau, Milton Gomez, Tom Beucler, and Olivia Martius
The recently released suite of AI-based medium-range forecast models can produce multi-day forecasts within seconds, with a skill on par with the IFS model of ECMWF. Traditional model evaluation predominantly targets global scores on single levels. Specific prediction tasks, such as severe convective environments, require much more precision on a local scale and with the correct vertical gradients in between levels. With a focus on the North American and European convective season of 2020, we assess the performance of Panguweather, Graphcast and Fourcastnet for convective available potential energy (CAPE) and storm relative helicity (SRH) at lead times of up to 7 days.
Looking at the example of a US tornado outbreak on April 12 and 13, 2020, all models predict elevated CAPE and SRH values multiple days in advance. The spatial structures in the AI-models are smoothed in comparison to IFS and the reanalysis ERA5. The models show differing biases in the prediction of CAPE values, with Graphcast capturing the value distribution the most accurately and Fourcastnet showing a consistent underestimation.
By advancing the assessment of large AI-models towards process-based evaluations we lay the foundation for hazard-driven applications of AI-weather-forecasts.

How to cite: Feldmann, M., Poulain-Auzeau, L., Gomez, M., Beucler, T., and Martius, O.: Convective environments in AI-models - What have AI-models learned about atmospheric profiles?, EGU General Assembly 2024, Vienna, Austria, 14–19 Apr 2024, EGU24-5373, https://doi.org/10.5194/egusphere-egu24-5373, 2024.

EGU24-5571 | ECS | Orals | AS1.2

SHADECast: Enhancing solar energy integration through probabilistic regional forecasts 

Alberto Carpentieri, Doris Folini, Jussi Leinonen, and Angela Meyer

Surface solar irradiance (SSI) is a pivotal component in addressing climate change. As an abundant and non-fossil energy source, it is harnessed through photovoltaic (PV) energy production. As the contribution of PV to total energy production grows, the stability of the power grid faces challenges due to the volatile nature of solar energy, predominantly influenced by stochastic cloud dynamics. To address this challenge, there is a need for accurate, uncertainty-aware, near real-time, and regional-scale SSI forecasts with forecast horizons ranging from minutes to a few hours.

Existing state-of-the-art SSI nowcasting methods only partially meet these requirements. In our study, we introduce SHADECast [1], a deep generative diffusion model designed for probabilistic nowcasting of cloudiness fields. SHADECast is uniquely structured, incorporating deterministic aspects of cloud evolution to guide the probabilistic ensemble forecast, relying only on previous satellite images. Our model showcases significant advancements in forecast quality, reliability, and accuracy across various weather scenarios.

Through comprehensive evaluations, SHADECast demonstrates superior performance, surpassing the state of the art by 15% in the continuous ranked probability score (CRPS) over diverse regions up to 512 km × 512 km, extending the state-of-the-art forecast horizon by 30 minutes. The conditioning of ensemble generation on deterministic forecasts further enhances reliability and performance by more than 7% on CRPS.

SHADECast forecasts equip grid operators and energy traders with essential insights for informed decision-making, thereby guaranteeing grid stability and facilitating the smooth integration of regionally distributed PV energy sources. Our research contributes to the advancement of sustainable energy practices and underscores the significance of accurate probabilistic nowcasting for effective solar power grid management.


References

[1] Carpentieri A. et al., 2023, Extending intraday solar forecast horizons with deep generative models. Preprint at ArXiv. https://arxiv.org/abs/2312.11966 

How to cite: Carpentieri, A., Folini, D., Leinonen, J., and Meyer, A.: SHADECast: Enhancing solar energy integration through probabilistic regional forecasts, EGU General Assembly 2024, Vienna, Austria, 14–19 Apr 2024, EGU24-5571, https://doi.org/10.5194/egusphere-egu24-5571, 2024.

EGU24-5849 | ECS | Posters on site | AS1.2

Towards seamless rainfall and flood forecasting in the Netherlands: improvements to and validation of blending in pysteps 

Ruben Imhoff, Michiel Van Ginderachter, Klaas-Jan van Heeringen, Mees Radema, Simon De Kock, Ricardo Reinoso-Rondinel, and Lesley De Cruz

Flood early warning in fast responding catchments challenges our forecasting systems. It requires frequently updated, accurate and high-resolution rainfall forecasts to provide timely warning of rainfall amounts that will reach a catchment in the coming hours. The Netherlands is a typical example, with polder systems below sea level, a high level of urbanization and catchments with short response times. The need for better short-term rainfall forecasts is clearly present, but this is generally not feasible with numerical weather prediction (NWP) models alone. Hence, an alternative rainfall forecasting method is desirable for the first few hours into the future.

Rainfall nowcasting can provide this alternative but quickly loses skill after the first few hours. A promising way forward is a seamless forecasting system, which tries to optimally combine rainfall products from nowcasting and NWP. In this study, we applied the STEPS blending method to combine rainfall forecasts from ensemble radar nowcasts with those from the Harmonie-AROME configuration of the ACCORD NWP model in the Netherlands. This blending method is part of the open-source nowcasting initiative pysteps. To make blending possible in an operational setup, including the needs of involved water authorities, we made several adjustments to the blending implementation in pysteps, for instance:

  • We reduced the computational time by using a faster preprocessing and advection scheme.
  • We improved the noise initialization (needed for generating ensemble members) to allow for stable forecasts, also when one or both product(s) contain(s) no rain.
  • We enabled a dynamic disaggregation of the 1-hour resolution NWP forecasts to match the temporal resolution of the radar nowcast.

We operationalized the updated blending framework in the flood forecasting platforms of the involved water authorities. Given a forecast duration of 12 hours for the blended forecast and a 10-minute time step, average computation times are 3.4 minutes for a deterministic run and 12.3 minutes for an ensemble forecast with 10 members on a 4-core machine. Preprocessing takes approximately 10 minutes and only needs to occur when a new NWP forecast is issued. We tested the implementation for an entire, rainy summer month (July 15 to August 15, 2023) and analyzed the results over the entire domain. The results demonstrate that the blending method effectively combines radar nowcasts with NWP forecasts. Depending on the statistical score considered (such as RMSE and critical success index), the blending method performs either better or on par with the best-performing individual product (radar nowcast or NWP). A consistent finding is that the blending closely tracks the nowcast quality during the initial 1 to 2 hours of the forecast (in this study, the nowcast had lower errors than NWP during the first 2 – 2.5 hours), after which it gradually transitions into the NWP forecast. At longer lead times, the seamless product retains local precipitation structures and extremes better than the NWP product. It does this by leveraging information from the radar nowcast and the stochastic perturbations. Based on these results, a seamless forecasting approach can be regarded as an improvement for the involved water authorities.

How to cite: Imhoff, R., Van Ginderachter, M., van Heeringen, K.-J., Radema, M., De Kock, S., Reinoso-Rondinel, R., and De Cruz, L.: Towards seamless rainfall and flood forecasting in the Netherlands: improvements to and validation of blending in pysteps, EGU General Assembly 2024, Vienna, Austria, 14–19 Apr 2024, EGU24-5849, https://doi.org/10.5194/egusphere-egu24-5849, 2024.

EGU24-5909 | ECS | Posters on site | AS1.2

Impact of Spatial Density of Automatic Weather Station Data on Assimilation Effectiveness in WRF-3DVar Model 

Zeyu Qiao, Bu Li, Aofan Gong, and Guangheng Ni

Implementing the 3-Dimensional Variational (3DVar) data assimilation technique using high-density automatic weather station (AWS) observations substantially improves the precipitation simulation and forecast capabilities in the Weather Research and Forecasting (WRF) model. Given the impact of spatial distribution and quantity of observation data on assimilation effectiveness, there is a growing need to assimilate the most efficient amount of observation data to improve the precipitation forecast accuracy, especially in the context of the proliferation of data from diverse sources. This study investigates the impacts of spatial density of assimilated data on enhancing model predictions, focusing on a squall line event in Beijing on 2 August 2017 which has approximately 2400 AWSs in the simulation domain. Seven experiment groups assimilating varying proportions of AWS data (3.125, 6.25, 12.5, 25, 50, 75, and 100 percent of total AWSs) were conducted, comprising 10 experiments per group. The results were then compared with the experiment without data assimilation (CTRL) and the observations. Results show that while the WRF model roughly captured the evolution of this event, it overestimated the precipitation amount with significant deviations in precipitation locations. A general positive correlation was observed between the spatial density of assimilated data and the enhancement in model performance. However, there is a notable threshold beyond which additional data ceases to enhance forecast accuracy. The model performs best when the ratio of the number of assimilated AWSs to the model simulated area reaches 1/40 km-2. Moreover, significant variations in improvement effects across experiments within the same group indicate the substantial impact of spatial distribution of assimilated AWSs on forecast outcomes. This study provides a reference for devising more efficient and cost-effective data assimilation strategies in numerical weather prediction.

How to cite: Qiao, Z., Li, B., Gong, A., and Ni, G.: Impact of Spatial Density of Automatic Weather Station Data on Assimilation Effectiveness in WRF-3DVar Model, EGU General Assembly 2024, Vienna, Austria, 14–19 Apr 2024, EGU24-5909, https://doi.org/10.5194/egusphere-egu24-5909, 2024.

EGU24-6155 | ECS | Orals | AS1.2

Enhanced Foundation Model through Efficient Finetuning for Extended-Range Weather Prediction 

Shan Zhao, Zhitong Xiong, and Xiao Xiang Zhu

Weather forecasting is a vital topic in meteorological analysis, agriculture planning, disaster management, etc. The accuracy of forecasts varies with the prediction horizon, spanning from nowcasting to long-range forecasts. The extended range forecast, which predicts weather conditions beyond two weeks to months ahead, is particularly challenging. This difficulty arises from the inherent variability in weather systems, where minor disturbances in the initial condition can lead to significantly divergent future trajectories.

Numerical Weather Prediction (NWP) has been the predominant approach in this field. Recently, deep learning (DL) techniques have emerged as a promising alternative, achieving performance comparable to NWP [1, 2]. However, their lack of embedded physical knowledge often limits their acceptance within the research community. To enhance the trustworthiness of DL-based weather forecasts, we explore a transformer-based framework which considers complex geospatial-temporal (4D) processes and interactions. Specifically, we select the Pangu model [3] with a 24-hour lead time as the initial framework. To extend the prediction horizon to two weeks ahead, we employ a low-rank adaptation for model finetuning, which saves computation resources by reducing the number of parameters to only 1.1% of the original model. Besides, we incorporate multiple oceanic and atmospheric indices to capture a broad spectrum of global teleconnections, aiding in the selection of important features.

Our contributions are threefold: first, we provide an operational framework for foundation models, improving their applicability in versatile tasks by enabling training rather than limiting them to inference stages. Second, we demonstrate how to leverage these models with limited resources effectively and contribute to the development of green AI. Last, our method improves performance in extended-range weather forecasting, offering enhanced prediction skills, physical consistency, and finer spatial granularity. Our methodology achieved reduced RMSE on T2M, Z500, and T850 for 0.13, 139.2, and 0.52, respectively, compared to IFS. In the future, we plan to explore other settings, such as predicting precipitation and extreme temperatures.

REFERENCES
[1] Nguyen, Tung, et al. "ClimaX: A foundation model for weather and climate." arXiv preprint arXiv:2301.10343 (2023).
[2] Lam, Remi, et al. "Learning skillful medium-range global weather forecasting." Science (2023): eadi2336.
[3] Bi, Kaifeng, et al. "Accurate medium-range global weather forecasting with 3D neural networks." Nature 619.7970 (2023): 533-538.

How to cite: Zhao, S., Xiong, Z., and Zhu, X. X.: Enhanced Foundation Model through Efficient Finetuning for Extended-Range Weather Prediction, EGU General Assembly 2024, Vienna, Austria, 14–19 Apr 2024, EGU24-6155, https://doi.org/10.5194/egusphere-egu24-6155, 2024.

EGU24-6545 | Posters on site | AS1.2

Improving precipitation nowcasting using deep generative models: a case-study and experiences in R2O  

Kirien Whan, Charlotte Cambier van Nooten, Maurice Schmeits, Jasper Wijnands, Koert Schreurs, and Yuliya Shapovalova

Precipitation nowcasting is essential for weather-dependent decision-making. The combination of radar data and deep learning methods has opened new avenues for research. Deep learning approaches have demonstrated equal or better performance than optical flow methods for low-intensity precipitation, but nowcasting high-intensity events remains a challenge. We use radar data from the Royal Netherlands Meteorological Institute (KNMI) and explore various extensions of deep learning architectures (i.e. loss function, additional inputs) to improve nowcasting of heavy precipitation intensities. Our model outperforms other state-of-the-art models and benchmarks and is skilful at nowcasting precipitation for high rainfall intensities, up to 60-min lead time. 

Transferring research to operations is difficult for many meteorological institutes, particularly for new applications that use AI/ML methods. We discuss some of these challenges that KNMI is facing in this domain. 

How to cite: Whan, K., Cambier van Nooten, C., Schmeits, M., Wijnands, J., Schreurs, K., and Shapovalova, Y.: Improving precipitation nowcasting using deep generative models: a case-study and experiences in R2O , EGU General Assembly 2024, Vienna, Austria, 14–19 Apr 2024, EGU24-6545, https://doi.org/10.5194/egusphere-egu24-6545, 2024.

EGU24-6856 | Posters on site | AS1.2

Very Short-Range Precipitation Forecast in Korea Meteorological Administration 

ho yong lee, Jongseong Kim, Joohyung Son, and Seong-Jin Kim

Korea Meteorological Administration (KMA) has been providing the public with an hourly precipitation forecast updated every 10 minutes for the next 6 hours since 2015. This forecasts, named as the Very Short-Range Forecast (VSRF), differs from other longer forecasts ? such as short-range and medium-range forecasts issued by forecasters. The VSRF is automatically generated by a system based on two different models: MAPLE (McGill Algorithm for Precipitation nowcasting by Lagrangian Extrapolation) and KLAPS (Korea Local Analysis and Prediction System). 

MAPLE, based on Variational Echo Tracking (VET) from radar observations, has an intrinsic disadvantage: its performance decreases rapidly. On the other hand, numerical weather prediction systems like KLAPS are not initially as effective as MAPLE due to model balancing factors such as spin-up, but they maintain initial skill for a slightly longer period. Therefore, to provide the best predictions to the public, it is necessary to merge the two models properly. KMA conducted tests to determine the optimal way to utilize both models and established weights for each model based on their performance and precipitation tendencies. According to a 4-year evaluation, MAPLE outperforms for up to 2 hours, while KLAPS performs better after 4 hours. Consequently, the two models were merged with a hyperbolic tangent weight applied between 2 and 4 hours, and we named it as the best guidance. 

The best guidance was verified against precipitation observed by 720 raingauges over South Korea during the summer seasons from 2020 to 2023. It demonstrated better skill compared to both MAPLE and KLAPS. The average threat scores, with a rain intensity threshold of 0.5 mm/h throughout the forecast period, were 0.40 for the best guidance, 0.38 for MAPLE, and 0.35 for KLAPS.

The best guidance depends on both MAPLE and KLAPS. Therefore, KMA is actively working to improve the performance of each model. Additionally, a very short-range model based on AI is currently under development and running in semi-operations.

How to cite: lee, H. Y., Kim, J., Son, J., and Kim, S.-J.: Very Short-Range Precipitation Forecast in Korea Meteorological Administration, EGU General Assembly 2024, Vienna, Austria, 14–19 Apr 2024, EGU24-6856, https://doi.org/10.5194/egusphere-egu24-6856, 2024.

EGU24-6873 | Posters on site | AS1.2

Does more frequent Very Short-Range Forecast provide more useful information? 

Joohyung Son, Jongseong Kim, and Seongjin Kim

The Very Short-Range Forecast (VSRF) for precipitation from the Korea Meteorological Administration (KMA) is released every 10 minutes, providing forecasts for the next 6 hours at 10-minute intervals. However, when the forecast is provided to the public, it is updated at 10-minute interval, but only provides up to 6 hours at every hour. Consequently, from the public's perspective, forecasts for specific times may change every 10 minutes. While this allows users to access the latest updates, it also poses a challenge in terms of reduced reliability due to constantly changing predictions.

This study aims to assess the prediction performance and variability between forecasts released at 10-minute intervals and those at 1-hour intervals. We evaluated with the Very Short-Range Forecast numerical model KLAPS in VSRF and seek to determine which approach offers more valuable information from the public's standpoint. The assessment focuses on two distinct types of precipitation. The first involves convective showers, which sporadically appear over short durations, driven by atmospheric instability during the Korean Peninsula's summer. The second relates to systematic precipitation associated with a frontal boundary accompanying a medium-scale low-pressure system. For convective showers, the 1-hour interval exhibits better performance and continuity, particularly as the forecast time extends. In the case of systematic precipitation, the 1-hour interval remains superior, though the skill is not as prominent as with convective showers. This highlights that an abundance of information doesn't always equate to high-quality information.

How to cite: Son, J., Kim, J., and Kim, S.: Does more frequent Very Short-Range Forecast provide more useful information?, EGU General Assembly 2024, Vienna, Austria, 14–19 Apr 2024, EGU24-6873, https://doi.org/10.5194/egusphere-egu24-6873, 2024.

EGU24-7086 | Posters on site | AS1.2

Development of stadium-specific numerical forecast guidance for weather forecast for the 2024 Gangwon Winter Youth Olympic Games 

Yeon-Hee Kim, Eunju Cho, Sungbin Jang, Junsu Kim, Hyejeong Bok, and Seungbum Kim

The 2024 Gangwon Winter Youth Olympic Games (GANGWON 2024) will be held in the province of Gangwon in the Republic of Korea from January 19 to February 1, 2024, which already hosted the Olympic Winter Games PyeongChang 2018. In order to successfully host these first Winter YOG to be held in Asia, which will be held for the first time in Asia, it is necessary to provide customized weather information for decision-making in game operation and support in establishing game strategies for athletes and their teams. Accordingly, the Korea Meteorological Administration develops point-specific numerical forecast guidance for major stadiums and provides it to the field to support successful hosting of YOG and improvement of performance. Numerical forecast guidance is the final data delivered to consumers or forecasters as post-processed numerical model data that has been corrected by applying altitude correction and statistical methods to produce highly accurate forecasts. For a total of 13 forecast elements (temperature, minimum/maximum temperature, humidity, wind direction/speed, precipitation, new snow cover, sky conditions, precipitation probability, precipitation type), we developed user-customized numerical forecast guidance specialized for competition points  (Gangneung Olympic Park, Pyeongchang Alpensia Venue, Biathlon Center, Olympic Sliding Center departure/arrival, Wellyhilli departure/arrival, High1 departure/arrival). Through the process of Perfect Prognostic Method (PPM), Model Output Statistics (MOS), optimization, and optimal merging, the systematic errors inherent in the numerical model are removed, and the optimal data (BEST) with improved forecasting performance is provided as customized numerical forecast guidance specific to stadium locations.  In the prediction performance evaluation for the period of December 2023, the accuracy (improvement rate) compared to the average of available models was temperature 1.49℃ (18%), humidity 12% (25%), wind speed 1.87m/s (33%), and visibility 12.8km (17%).

How to cite: Kim, Y.-H., Cho, E., Jang, S., Kim, J., Bok, H., and Kim, S.: Development of stadium-specific numerical forecast guidance for weather forecast for the 2024 Gangwon Winter Youth Olympic Games, EGU General Assembly 2024, Vienna, Austria, 14–19 Apr 2024, EGU24-7086, https://doi.org/10.5194/egusphere-egu24-7086, 2024.

EGU24-7091 | Posters on site | AS1.2

The Development of precipitation model modifed with ECMWF IFS and XGBoost and its performance verification 

Eunju Cho, Yeon-Hee Kim, Seungbum Kim, and Young Cheol Kwon

This study was conducted to develop a modified precipitation model for its amount and existence by combining machine learning method, Extreme Gradient Boosting(XGBoost), with ECMWF IFS(Integrated forecasting system) and, finally, estimate the related performance.

According to the analysis of regional precipitation characteristic, prior to its development, the ratio of precipitation existence was various on a basis of a forecast’s district and its season. These different patterns on each district makes it necessary to develop the regional and seasonal model respectively.

And, the first attempt at the machine learning showed the importance of each feature as input-variables, as a result of which cloud physics-related features, for example large-area precipitation, total precipitation, visibility and what not, proved so significant. However, the insufficient amount of these feature’s data seemed to result in overfitting. And therefore, the feasible features, except for cloud physics-related things, of IFS data were used. In addition, auxiliary features and their gradient for every lead-time were calculated and added: relative vorticity, divergence, equivalent potential temperature, main 6 patterns for Korean summer and so on. The number of features amounted to around 144 with which for the 9-year training set, 2013~2021, based learning to be conducted regionally, followed by using validation-set of 2022.

As a result of validation for precipitation existence and its amount up to 135 hours ahead on the 10 regions at 00UTC in summer of 2022, Critical Success Index(CSI) was more improved by 10.3% than before. Accuracy(ACC) for each lead-time rose by 6% and its fluctuation also decreased. And the correction by this machine learning alleviated the overfitting trend of precipitation forecast amount produced by the original model, and improved correlation and linearity between observation and forecast. In particular, while the machine learning prevailed over the original model up to 100 hours ahead, from then on, both of them showed similar performance or that of the former was downward slightly. If the above-mentioned cloud physics features are used to further sharpen machine learning technique, its performance should be enhanced more and more.

How to cite: Cho, E., Kim, Y.-H., Kim, S., and Kwon, Y. C.: The Development of precipitation model modifed with ECMWF IFS and XGBoost and its performance verification, EGU General Assembly 2024, Vienna, Austria, 14–19 Apr 2024, EGU24-7091, https://doi.org/10.5194/egusphere-egu24-7091, 2024.

EGU24-7291 | ECS | Posters on site | AS1.2

Improvements in fog predictions via a modified reconstruction of moisture distribution using the Weather Research and Forecasting(WRF) model 

Eunji Kim, Soon-Young Park, Jung-Woo You, and Soon-Hwan Lee

Since fog is an important weather phenomenon affecting the traffic safety, accurate fog forecasting should be attained to minimize meteorological disasters. Most fog forecasts determine only the presence or absence of fog based on less visibility than 1 km, which is known as the visibility diagnostic method. During this process, fog could be predicted by the visibility calculated in the numerical weather prediction (NWP) model using the cloud liquid water content (LWC) near the surface. In this study, we investigated to increase the accuracy of fog forecast by optimizing the reconstruction of moisture distribution method, which can simulate the intensity of fog as well as the presence or absence of fog. The performances of the fog simulations were examined by modifying the relative humidity threshold at a height of 2 m and the stability parameters which affect turbulence and also one of the important criteria for fog occurrence. When we applied the optimize parameters to fog prediction in the winter seasons, the probability of detection (POD) has been increased significantly from 0.21 to 0.54. These improvements were attributed to the corrected relative humidity threshold and the stability parameters. Although the false alarm rate (FAR) remained almost unchanged, the critical success index (CSI) has been improved slightly lesser than those of the POD. When we analyzed the life cycle of fog, it takes time for the NWP model to simulate water droplets in the fog-developing stage. Therefore, the accuracy of the fog simulation is intimately related to the reconstruction of moisture distribution. The NWP model, however, showed a better performance in the process of fog dissipation than the reconstruction of moisture distribution method that was sensitive to temperature and turbulence. In conclusion, the reconstruction of moisture distribution led to a considerable improvement of the fog prediction in the generation and development stage since we used the optimized humidity threshold. It is also expected that accurate fog prediction could be achieved in the future by considering the aerosol effects, which is another importance factor for the fog generation.

How to cite: Kim, E., Park, S.-Y., You, J.-W., and Lee, S.-H.: Improvements in fog predictions via a modified reconstruction of moisture distribution using the Weather Research and Forecasting(WRF) model, EGU General Assembly 2024, Vienna, Austria, 14–19 Apr 2024, EGU24-7291, https://doi.org/10.5194/egusphere-egu24-7291, 2024.

EGU24-7536 | Orals | AS1.2

Nowcasting with Transformer-based Models using Multi-Source Data  

Çağlar Küçük, Apostolos Giannakos, Stefan Schneider, and Alexander Jann

Rapid advancements in data-driven weather prediction have shown notable success, particularly in nowcasting, where forecast lead times span just a few hours. Transformer-based models, in particular, have proven effective in learning spatiotemporal connections of varying scales by leveraging the attention mechanism with efficient space-time patching of data. This offers potential improvements over traditional nowcasting techniques, enabling early detection of convective activity and reducing computational costs. 

In this presentation, we demonstrate the effectiveness of a modified Earthformer model, a space-time Transformer framework, in addressing two specific nowcasting challenges. First, we introduce a nowcasting model that predicts ground-based 2D radar mosaics up to 2-hour lead time with 5-minute temporal resolution, using geostationary satellite data from the preceding two hours. Trained on a benchmark dataset sampled across the United States, our model exhibits robust performance against various impactful weather events with distinctive features. Through permutation tests, we interpret the model to understand the effects of input channels and input data length. We found that the infrared channel centered at 10.3 µm contains skillful information for all weather conditions, while, interestingly, satellite-based lightning data is the most skilled at predicting severe weather events in short lead times. Both findings align with existing literature, enhancing confidence in our model and guiding better usage of satellite data for nowcasting. Moreover, we found the model is sensitive to input data length in predicting severe weather events, suggesting early detection of convective activity by the model in rapidly growing fields. 

Second, we present the initial attempts to develop a multi-source precipitation nowcasting model for Austria, tailored to predict impactful events with convective activities. This model integrates satellite- and ground-based observations with analysis and numerical weather prediction data to predict precipitation up to 2-hour lead time with 5-minute temporal resolution.  

We conclude by discussing the broad spectrum of applications for such models, ranging from enhancing operational nowcasting systems to providing synthetic data to data-scarce regions, and the challenges therein.

How to cite: Küçük, Ç., Giannakos, A., Schneider, S., and Jann, A.: Nowcasting with Transformer-based Models using Multi-Source Data , EGU General Assembly 2024, Vienna, Austria, 14–19 Apr 2024, EGU24-7536, https://doi.org/10.5194/egusphere-egu24-7536, 2024.

EGU24-7753 | ECS | Orals | AS1.2

On the usefulness of considering the run-to-run variability for an ensemble prediction system 

Hugo Marchal, François Bouttier, and Olivier Nuissier

The run-to-run variability of numerical weather prediction systems is at the heart of forecasters' concerns, especially in the decision-making process when high-stakes events are considered. Indeed, forecasts that are brutally changing from one run to another may be difficult to handle and can lose credibility. This is all the more true nowadays, as many meteorological centres have adopted the strategy of increasing runs frequency, some reaching hourly frequencies. However, this aspect has received little attention in the literature, and the link with predictability has barely been explored.

In this study, run-to-run variability is investigated through 24h-accumulated precipitations forecasted by AROME-EPS, Météo-France's high resolution ensemble, which is refreshed 4 times a day. Focusing on the probability of some (warning) thresholds being exceeded, results suggest that how forecasts evolve over successive runs can be used to improve their skill, especially reliability. Various possible aspects of run sequence have been studied, from trends to rapid increases or decreases in event probability at short lags, also called "sneaks" or "phantoms", as well as the persistence of a non-zero probability through successive runs. The added value provided by blending successive runs, known as lagging, is also discussed.

How to cite: Marchal, H., Bouttier, F., and Nuissier, O.: On the usefulness of considering the run-to-run variability for an ensemble prediction system, EGU General Assembly 2024, Vienna, Austria, 14–19 Apr 2024, EGU24-7753, https://doi.org/10.5194/egusphere-egu24-7753, 2024.

EGU24-8449 | ECS | Orals | AS1.2

Radiation fog nowcasting with XGBoost using station and satellite data 

Michaela Schütz, Jörg Bendix, and Boris Thies

The research project “FOrecasting radiation foG by combining station and satellite data using Machine Learning (FOG-ML)” represents a comprehensive effort to advance radiation fog prediction using machine learning (ML) techniques, with focus on the XGBoost algorithm. The nowcasting period is up to four hours into the future.

The initial phase of the project involved developing a robust classification-based model that could accurately forecast the occurrence of radiation fog, a challenging meteorological phenomenon. Radiation fog is particularly difficult to predict because it depends on a complex interplay of factors such as ground cooling, humidity, and minimal cloud cover. It often forms rapidly and in local areas. This required careful analysis of the chronological order of the data and consideration of autocorrelation to increase the effectiveness of model training.

Building upon this foundation, the next two phases concentrated on improving the model’s forecasting performance for visibility classes (step 2) and for absolute visibility values (step 3). The main focus was then on a nowcasting period of up to two hours. This nowcasting period is critical in fog prediction as it directly impacts transportation planning and safety. The use of ground-level observations in step 2 and integration of satellite data in step 3 provided a rich dataset that allowed for more nuanced model training and validation.

In the latest phase of research, satellite data has been incorporated to further refine the prediction model, especially regarding the fog formation and dissipation. Satellite imagery provides additional variables of atmospheric data that are not readily available from ground-based observations. This integration aims to address one of the inherent limitations in fog forecasting methods, particularly in areas where ground-based observations are sparse.

Throughout the different stages, the project emphasized the need for thorough data processing and validation. This included the implementation of cross-validation techniques to assess the generalizability of the models and the use of various metrics to gauge their predictive power. This has also included the incorporation of trend information, which has proven to be crucial for forecasting with XGBoost. Our research has also shown that not only the overall performance, but also the performance of the transitions (fog formation and resolution) should be analyzed to get a complete picture of the model performance. This finding was consistent throughout the entire study, regardless of classification-based forecast or regression-based forecast.

We have been able to significantly improve the performance of our nowcasting model with each step. We will be presenting the key findings and latest results from this research at EGU24.

All results from step 1 can be found in “Current Training and Validation Weaknesses in Classification-Based Radiation Fog Nowcast Using Machine Learning Algorithms” from Vorndran et al. 2022. All results from step 2 can be found in “Improving classification-based nowcasting of radiation fog with machine learning based on filtered and preprocessed temporal data” from Schütz et al. 2023.

How to cite: Schütz, M., Bendix, J., and Thies, B.: Radiation fog nowcasting with XGBoost using station and satellite data, EGU General Assembly 2024, Vienna, Austria, 14–19 Apr 2024, EGU24-8449, https://doi.org/10.5194/egusphere-egu24-8449, 2024.

EGU24-9528 | ECS | Orals | AS1.2

Ensemble forecast post-processing based on neural networks and normalizing flows 

Peter Mlakar, Janko Merše, and Jana Faganeli Pucer

Ensemble weather forecast post-processing can generate more reliable probabilistic weather forecasts compared to the raw ensemble. Often, the post-processing method models the future weather probability distribution in terms of a pre-specified distribution family, which can limit their expressive power. To combat these issues, we propose a novel, neural network-based approach, which produces forecasts for multiple lead times jointly, using a single model to post-process forecasts at each station of interest. We use normalizing flows as parametric models to relax the distributional assumption, offering additional modeling flexibility.We evaluate our method for the task of temperature post-processing on the EUPPBench benchmark dataset. We show that our approach exhibits state-of-the-art performance on the benchmark, improving upon other well-performing entries. Additionally, we analyze the performance of different parametric distribution models in conjunction with our parameter regression neural network, to better understand the contribution of normalizing flows in the post-processing context. Finally, we provide a possible explanation as to why our method performs well, exploring per-lead time input importance.

How to cite: Mlakar, P., Merše, J., and Faganeli Pucer, J.: Ensemble forecast post-processing based on neural networks and normalizing flows, EGU General Assembly 2024, Vienna, Austria, 14–19 Apr 2024, EGU24-9528, https://doi.org/10.5194/egusphere-egu24-9528, 2024.

EGU24-9659 | Posters on site | AS1.2

Application Research of Multi-source New Detection Data in Snow Depth Prediction for Beijing Winter Olympics 

Jia Du, Bo Yu, Yi Dai, Sang Li, Luyang Xu, Jiaolan Fu, Lin Li, and Hao Jing

According to the demand of the Winter Olympic Organizing Committee for snow depth prediction, the application of multi-source new data in snow depth was studied based on densely artificial snow-depth measurement, microscopic snowflake shape observation and PARSIVEL data. The specific conclusions are as follows: (1) Most of the Snow-Liquid-Ratio(SLR) in Beijing competition zone was between 0.69 and 1.43 (unit: cm/mm, the same below), while that in Yanqing zone was between 0.53 and 1.17. But 7.5% of the SLRs in Yanqing zone exceeded 3.5, which all occurred in the same period of the key service time of 2022 Beijing Winter Olympics, making it more difficult to predict new snow depth. (2) The higher the SLR, the lower the daily minimum surface temperature and lowest air temperature.  Plate or column ice crystals, rimed snowflakes, and dendritic snowflakes were observed, whose corresponding SLRs increased. The average falling speed of particles falling below 2m/s can be used as an indicator of phase transfer. (3) The vertical distributions of temperature and humidity with SLR <1 or >2 were summarized. It was found that when the cloud area coincided with the dendritic growth zone with height close to Yanqing zone, the SLR would be more than 2, higher than that of Beijing zone. (4) A weather concept model generating large SLR was extracted. Snow in Beijing is often accompanied by easterly winds in boundary layer, which is easy to form a wet and ascending layer in the lower troposphere due to the blocking of western mountain. In the late winter season, helped by the temperature’s profile, it tends to produce unrimed dendritic snowflakes, leading to a great SLR.

How to cite: Du, J., Yu, B., Dai, Y., Li, S., Xu, L., Fu, J., Li, L., and Jing, H.: Application Research of Multi-source New Detection Data in Snow Depth Prediction for Beijing Winter Olympics, EGU General Assembly 2024, Vienna, Austria, 14–19 Apr 2024, EGU24-9659, https://doi.org/10.5194/egusphere-egu24-9659, 2024.

EGU24-9935 | ECS | Posters on site | AS1.2

Machine and Deep Learning algorithms to improve weather forecasts over a complex orography Mediterranean region 

Luca Furnari, Umair Yousuf, Alessio De Rango, Donato D'Ambrosio, Giuseppe Mendicino, and Alfonso Senatore

The rapid development of artificial intelligence algorithms has generated considerable interest in the scientific community. The number of scientific articles relating to applying these algorithms for weather forecasting has increased dramatically in the last few years. In addition, the recent operational launch of products such as GraphCast has put this area of research even more in the spotlight. This work uses different Machine Learning and Deep Learning algorithms, namely ANN (Artificial Neural Network), RF (Random Forest) and GNN (Graph Neural Network), with the aim to improve the short-term (1-day lead time) forecasts provided by a physically-based forecasting system. Specifically, the CeSMMA laboratory, since January 2020, has been producing daily forecasts accessible via the https://cesmma.unical.it/cwfv2/ webpage related to a large portion of southern Italy. The NWP (Numerical Weather Prediction) system is based on the WRF (Weather Research and Forecasting) model, with boundary and initial conditions provided by the GFS (Global Forecasting System) model. The AI algorithms post-process the NWP output, applying correction factors achieved by a two-year training considering the observations of the dense regional monitoring network composed of ca. 150 rain gauges.

The results show that the AI is able to improve daily rainfall forecasts compared to ground-based observations. Specifically, the ANN reduces the average MSE (Mean Square Error) by approximately 29% and the RF by 21% with respect to the WRF forecast for the whole study area (about 15’000 km2). Moreover, the GNN applied to a smaller area (considering only 22 rain gauges) further reduces the MSE by 35% during the heaviest rainfall months.

In addition to improving the performance of the forecast, the AI-based post-processing provides reasonable precipitation spatial patterns, reproducing the main physical phenomena such as the orographic enhancement since it is not a surrogate model and benefits from the original physically-based forecasts.


Acknowledgements. This work was funded by the Next Generation EU - Italian NRRP, Mission 4, Component 2, Investment 1.5, call for the creation and strengthening of ‘Innovation Ecosystems’, building ‘Territorial R&D Leaders’ (Directorial Decree n. 2021/3277) - project Tech4You - Technologies for climate change adaptation and quality of life improvement, n. ECS0000009. This work reflects only the authors’ views and opinions, neither the Ministry for University and Research nor the European Commission can be considered responsible for them.

How to cite: Furnari, L., Yousuf, U., De Rango, A., D'Ambrosio, D., Mendicino, G., and Senatore, A.: Machine and Deep Learning algorithms to improve weather forecasts over a complex orography Mediterranean region, EGU General Assembly 2024, Vienna, Austria, 14–19 Apr 2024, EGU24-9935, https://doi.org/10.5194/egusphere-egu24-9935, 2024.

On May 17, 2019, a rare severe convective weather occurred in Beijing, accompanied by local heavy rainstorm, hail, thunderstorm and gale. This severe convective weather occurred significantly earlier than normal years, bringing great challenge to the forecast. Using multiple observation data and radar four-dimensional variational assimilation products to analyze the triggering and development evolution of this severe convection. Under the conditions of no obvious weather scale system and local high potential unstable energy, the eastward advancement of the sea breeze front was the main factor triggering strong convection. As the northwest wind in the air increasing, the environmental conditions became stronger vertical wind shear, which was beneficial for the storm to maintain for a longer period of time. The supercell was the main cause of the convective weather. During the development of storms, they split into two parts and moved counterclockwise. The southern echo gradually weakened as it moved northward, while the northern echo moved southward, strengthening and developing into a super cell accompanied by a mesocyclone. The significant fluctuations in the height of the 0 ℃ layer within a small range resulted in different melting rates of hail during its descent, leading to the formation of spiky hail.

How to cite: Yu, B.: Analysis of a rare severe convective weather event in spring in Beijing of China, EGU General Assembly 2024, Vienna, Austria, 14–19 Apr 2024, EGU24-10809, https://doi.org/10.5194/egusphere-egu24-10809, 2024.

EGU24-12420 | ECS | Orals | AS1.2

Can convection permitting forecasts solve the tropical African precipitation forecasting problem? 

Felix Rein, Andreas H. Fink, Tilmann Gneiting, Philippe Peyrille, James Warner, and Peter Knippertz

Forecasting precipitation over Africa, the largest landmass in the tropics, has been a long standing problem. The unique conditions of the West African monsoon result in large and long lasting mesoscale convective systems. Global numerical weather prediction (NWP) models have gridsizes in the 10s of kilometers, particular when run in ensemble mode, leaving convection to be parameterized. This often results in precipitation being forecast on too large scales, in the wrong places, and with too weak intensity, ultimately leading to little to no skill in tropical Africa.


It has been argued that convection permitting (CP) NWP forecasts would cure some of the problems described above but those have only recently become feasible in an operational setting, although ensembles are still deemed to be too expensive. Here, we systematically compare regional deterministic CP and global ensemble forecasts in the region over multiple rainy seasons for the first time. We analyze CP forecasts from AROME and Met Office Tropical African Model, and seven global ensemble forecasts from the TIGGE archive, both individually and as a multi-model ensemble. In order to create an uncertainty estimate, we create neighborhood ensembles from CP forecasts at surrounding grid points, which allows for a fair comparison to the ensembles and a probabilistic climatology. Considering both precipitation occurrence and amount, we use the Brier score (BS) and the continuous ranked probability score (CRPS), along with their decompositions in discrimination, miscalibration and uncertainty, for evaluation.


Using neighborhood methods, deterministic forecasts are turned into probabilistic forecasts, allowing a fair comparison with ensembles. All numerical forecasts benefit from Neighborhoods, improving their BS and CRPS in terms of both miscalibration and discrimination. We find all individual forecasts to have skill over most of tropical Africa, with some ensemble models lacking skill in some regions and the multi model showing the most overall skill. The CP forecasts TAM and AROME outperform non-CP forecasts mainly in the region of the little dry Season and the Soud. However, large areas of low skill in terms of CRPS remain and even with high resolution, numerical models still struggle to predict precipitation in tropical Africa. 

How to cite: Rein, F., Fink, A. H., Gneiting, T., Peyrille, P., Warner, J., and Knippertz, P.: Can convection permitting forecasts solve the tropical African precipitation forecasting problem?, EGU General Assembly 2024, Vienna, Austria, 14–19 Apr 2024, EGU24-12420, https://doi.org/10.5194/egusphere-egu24-12420, 2024.

EGU24-12855 | Posters on site | AS1.2

Project IMA: Lessons Learned from Building the Belgian Operational Seamless Ensemble Prediction System 

Lesley De Cruz, Michiel Van Ginderachter, Maarten Reyniers, Alex Deckmyn, Idir Dehmous, Simon De Kock, Wout Dewettinck, Ruben Imhoff, Esteban Montandon, and Ricardo Reinoso-Rondinel


In recent years, several national meteorological services (NMSs) have invested considerable resources in the development of a seamless prediction system: rapidly updating forecasts that integrate the latest observations, covering timescales from minutes to days or longer ahead (e.g. DWD's SINFONY; FMI's ULJAS, MetOffice's IMPROVER and Geosphere Austria's SAPHIR) [1]. This move was motivated mainly by rising expectations from end users such as hydrological services, local authorities, the renewable energy sector and the general public. The development of seamless prediction systems was made possible thanks to the increasing availability of high-resolution observations, continuing advances in numerical weather prediction (NWP) models, nowcasting algorithms, and improved strategies to combine multiple information sources optimally. Moreover, the rise of AI/ML techniques in forecasting and nowcasting can further reduce the computational cost to generate frequently updating seamless operational forecast products.


We present the journey of building the Belgian seamless prediction system at the Royal Meteorological Institute of Belgium, with the working title "Project IMA". IMA uses both the deterministic INCA-BE and the probabilistic pysteps-BE systems to combine nowcasts with the ALARO and AROME configurations of the ACCORD NWP model. In the lessons learned along the way, we focus on what is often omitted, moving from research to operations, and integrating what we learn from operations back into research. We discuss the benefits of integrating new developments within the free and open-source software (FOSS) pysteps [2]. Our experience shows that using and contributing to FOSS not only leads to more transparency and reproducible, open science; it also enhances international collaboration and can benefit other users, including developing countries, bringing us a step closer to the ambitious goal of Early Warnings for All by 2027 [3].


References


[1] Bojinski, Stephan, et al. "Towards nowcasting in Europe in 2030." Meteorological Applications 30.4 (2023): e2124.

[2] Imhoff, Ruben O., et al. "Scale‐dependent blending of ensemble rainfall nowcasts and numerical weather prediction in the open‐source pysteps library." Quarterly Journal of the Royal Meteorological Society 149.753 (2023): 1335-1364.

[3] WMO, "Early warnings for all: Executive action plan 2023-2027", 8 Nov 2022,  https://www.preventionweb.net/quick/75125.

How to cite: De Cruz, L., Van Ginderachter, M., Reyniers, M., Deckmyn, A., Dehmous, I., De Kock, S., Dewettinck, W., Imhoff, R., Montandon, E., and Reinoso-Rondinel, R.: Project IMA: Lessons Learned from Building the Belgian Operational Seamless Ensemble Prediction System, EGU General Assembly 2024, Vienna, Austria, 14–19 Apr 2024, EGU24-12855, https://doi.org/10.5194/egusphere-egu24-12855, 2024.

Moderate to heavy rain produced by slantwise ascent of moist air above the cold high is prevalent in cold season in East China. The slantwise ascent is usually characterized by a southwest moist flow aroused by the so-called southern branch trough of 500hPa level to the south of the Qinghai-Tibet Plateau, while the cold high is usually formed by cold air damming, which is familiar to weather forecasters due to topographic feature of East China. The routine short-range forecast skill for this kind of precipitation of weather forecasters is usually limited by model performance. Through large sample model verification, our study indicates that, for the rainfall produced by southwesterly moist flow ascending above the cold high, the ECMWF model always underestimates the rainfall amount on the northeastern part of the rainfall belt, which could be taken as a systematic bias of the state-of-the-art global model. Our case studies indicate that the underestimation of rainfall amount is related to the weaker slant ascent of moist southwest flow forecast by ECMWF model than observation or reanalysis. The southwest flow above the northeastern flow induced by the cold high forms strong wind shear and warm-moist advection, which favors the occurrence of conditional symmetric instability producing strong slantwise ascent not well reflected by global model.

How to cite: Hu, N. and Fu, J.: Investigating Model Forecast Bias for Rainfall Produced by Slantwise Ascent above Cold High, EGU General Assembly 2024, Vienna, Austria, 14–19 Apr 2024, EGU24-13809, https://doi.org/10.5194/egusphere-egu24-13809, 2024.

EGU24-13853 | Orals | AS1.2 | Highlight

A Research Agenda for the Evaluation of AI-Based Weather Forecasting Models 

Imme Ebert-Uphoff, Jebb Q. Stewart, and Jacob T. Radford and the CIRA-NOAA team

Over the past few years purely AI-driven global weather forecasting models have emerged that show increasingly impressive skill, raising the question whether AI models might soon compete with NWP models for selected forecasting tasks. At this point these AI-based models are still in the proof-of-concept stage and not ready to be used for operational forecasting, but entirely new AI-models emerge every 2-3 months, with rapidly increasing abilities. Furthermore, many of these models are orders of magnitude faster than NWP models and can run on modest computational resources enabling repeatable on-demand forecasts competitive with NWP. The low computational cost enables the creation of very large ensembles, which better represent the tails of the forecast distribution, which, if an ensemble is well calibrated, allows for better forecasting of rare and extreme events.

However, these AI-based weather forecasting models have not yet been rigorously tested by the meteorological community, and their utility to operational forecasters is unknown. In this presentation we propose several studies to address the above issues, grouped into two central foci:

(1) Nature of AI models: AI-based models have very different characteristics from NWP models. Thus, in addition to applying evaluation procedures developed for NWP models, we need to develop procedures that test for AI-specific weaknesses. For example, NWP models and their physics backbone guarantee certain properties - such as dynamic coupling between fields - that AI-based models are not required to uphold. Developing suitable tests is based on a fundamental understanding of the AI-based models.

(2) Forecaster Perspective: Evaluation of weather forecasting models should be performed with respect to particular applications of weather forecasts, and it is critical to have research meteorologists and operational forecasters involved in the evaluation process. Our initial evaluation of AI-based models in CIRA weather briefings revealed that these models have characteristics that make interpretation of their forecasts fundamentally different from the physics-based NWP model predictions meteorologists are familiar with. For example, the increasing “blurriness” of AI-based predictions with longer lead times is not a reflection of weaker atmospheric circulations, but rather a reflection of uncertainty. Evaluations aimed at specific meteorological phenomena and atmospheric processes will allow the community to make informed decisions in the future regarding in what environments and for which applications AI-based weather forecasting models may be safe and beneficial to use.

In summary, AI-based weather forecasts have different characteristics from familiar dynamically-based forecasts, and it is thus important to have a robust research plan to evaluate many different characteristics of the models in order to provide guidelines to operational forecasters and feedback to model developers. In this abstract we propose a number of characteristics to evaluate, present results we already obtained, and suggest a research plan for future work.

How to cite: Ebert-Uphoff, I., Stewart, J. Q., and Radford, J. T. and the CIRA-NOAA team: A Research Agenda for the Evaluation of AI-Based Weather Forecasting Models, EGU General Assembly 2024, Vienna, Austria, 14–19 Apr 2024, EGU24-13853, https://doi.org/10.5194/egusphere-egu24-13853, 2024.

Large-eddy simulations of an idealized tropical cyclone (TC) were conducted as benchmarks to provide statistical information about subgrid convective clouds at a convection-permitting resolution over a TC convection system in different stages. The focus was on the vertical and spatial distributions of the subgrid cloud and associated mass flux that need to be parameterized in convection-permitting models. Results showed that the characteristics of the subgrid clouds varied significantly in various parts of the TC convection system. Statistical analysis revealed that the subgrid clouds were mainly located in the lower troposphere and exhibited shallow vertical extents of less than 4 km. The subgrid clouds were also classified into various cloud regimes according to the maximum mass flux height. Local subgrid clouds differed in mass-flux profile shape and magnitude at various regimes in the TC convection system.

How to cite: Zhang, X. and Bao, J.-W.: Statistics of the Subgrid Cloud of an Idealized Tropical Cyclone at Convection-Permitting Resolution, EGU General Assembly 2024, Vienna, Austria, 14–19 Apr 2024, EGU24-14232, https://doi.org/10.5194/egusphere-egu24-14232, 2024.

EGU24-14541 | Posters on site | AS1.2

Status and Plan of Standard Verification System for the NWP model in Korea Meteorological Administration 

Sora Park, Hyeja Park, Haejin Lee, Saem Song, Jong-Chul Ha, and Young Cheol Kwon

The Korea Meteorological Administration (KMA) has established and operated a standard verification system of the operational NWP models to evaluate the predictive performance of NWP model and compare them with other NWP models operated by domestic and foreign organization. This secures the objectivity of the verification results by applying the verification standards (WMO-No.485) presented by World Meteorological Organization (WMO), and being able to compare the performance with the numerical forecasting models of other institutions under the same conditions. The NWP models to be verified is a global, a regional, very short-range, and an ensemble prediction system and verification against analyses and observations are performed twice a day (00 UTC, 12 UTC). In addition to standard verification, precipitation, typhoon and various verification indexes (CBS index, KMA index, jumpiness index) are verified and used to evaluate the utilization of NWP models. The Korea Integrated Model (KIM), which is developed for Korea’s own NWP model, has been in operation since April 2020. Since the start of operation, the RMSE of 500hPa geopotential height (in Northern Hemisphere) has decreased every year, showing that forecast performance is improving. In addition, it can be seen that the 72-hour prediction accuracy for 12-hour accumulated precipitation (1.0 mm or more) in the Korean Peninsula area (75 ASOS stations) is also improving. As such, this study intends to discuss the predictive performance of the numerical forecast model based on the standard verification system and plans to improve the verification system in the future. 

How to cite: Park, S., Park, H., Lee, H., Song, S., Ha, J.-C., and Kwon, Y. C.: Status and Plan of Standard Verification System for the NWP model in Korea Meteorological Administration, EGU General Assembly 2024, Vienna, Austria, 14–19 Apr 2024, EGU24-14541, https://doi.org/10.5194/egusphere-egu24-14541, 2024.

EGU24-15431 | ECS | Orals | AS1.2 | Highlight

Nowcasting of extreme precipitation events: performance assessment of Generative Deep Learning methods 

Gabriele Franch, Elena Tomasi, Rishabh Umesh Wanjari, and Marco Cristoforetti

Radar-based precipitation nowcasting is one of the most prominent applications of deep learning (DL) in weather forecasting. The accurate forecast of extreme precipitation events remains a significant challenge for deep learning models, primarily due to their complex dynamics and the scarcity of data on such events. In this work we present the application of the latest state-of-the-art generative architectures for radar-based nowcasting, focusing on extreme event forecasting performance. We analyze a declination for the nowcasting task of all the three main current architectural approaches for generative modeling, namely: Generative Adversarial Networks (DGMRs), Latent Diffusion (LDCast), and our novel proposed Transformer architecture (GPTCast). These models are trained on a comprehensive 1-km scale, 5-minute timestep radar precipitation dataset that integrates multiple radar data sources from the US, Germany, the UK, and France. To ensure a robust evaluation and to test the generalization ability of the models, we concentrate on a collection of out-of-domain extreme precipitation events over the Italian peninsula extracted from the last 5 years. This focus allows us to assess the improvements these techniques offer compared to extrapolation methods, evaluating continuous (MSE, MAE) and categorical scores (CSI, POD, FAR), ensemble reliability, uncertainty quantification, and warning lead time. Finally, we analyze the computational requirements of these new techniques and highlight the caveats that must be considered when operational usage of these methods is envisaged. 

How to cite: Franch, G., Tomasi, E., Wanjari, R. U., and Cristoforetti, M.: Nowcasting of extreme precipitation events: performance assessment of Generative Deep Learning methods, EGU General Assembly 2024, Vienna, Austria, 14–19 Apr 2024, EGU24-15431, https://doi.org/10.5194/egusphere-egu24-15431, 2024.

EGU24-16617 | Posters on site | AS1.2

Forecasting extreme events with the crossing-point forecast  

Zied Ben Bouallegue

The crossing-point forecast (CPF) is a new type of ensemble-based forecast developed at the European Centre for Medium-Range Weather Forecasts. The crossing point refers to the intersection between the cumulative probability distribution of a forecast and the cumulative probability distribution of a model climatology. Originally, the CPF has emerged as a consistent forecast with the diagonal score, a weighted version of the continuous ranked probability score targeting high-impact events. Ranging between 0 and 1, the CPF can serve as an index for high-impact weather and thus directly be compared with the well-established extreme forecast index. The CPF is also interpretable in terms of a return period and conveys a sense of a “probabilistic worst-case scenario”.  Using a recent example of an extreme event affecting Europe, we illustrate and discuss the performance and specificities of this new type of forecast for extreme weather forecasting.

Ben Bouallegue, Z (2023).  Seamless prediction of high-impact weather events: a comparison of actionable forecasts. arXiv:2312.01673

How to cite: Ben Bouallegue, Z.: Forecasting extreme events with the crossing-point forecast , EGU General Assembly 2024, Vienna, Austria, 14–19 Apr 2024, EGU24-16617, https://doi.org/10.5194/egusphere-egu24-16617, 2024.

EGU24-17158 | Orals | AS1.2 | Highlight

AIFS – ECMWF’s Data-Driven Probabilistic Forecasting  

Zied Ben Bouallegue, Mihai Alexe, Matthew Chantry, Mariana Clare, Jesper Dramsch, Simon Lang, Christian Lessig, Linus Magnusson, Ana Prieto Nemesio, Florian Pinault, Baudouin Raoult, and Steffen Tietsche

In just two years, the idea of an operational data-driven system for medium-range weather forecasting has been transformed from dream to very real possibility. This has occurred through a series of publications from innovators, which have rapidly improved deterministic forecast skill. Our own evaluation confirms that these forecasts have comparable deterministic skill to NWP models across a range of variables. However, on medium-range timescales probabilistic forecasting, typically achieved through ensembles, is key for providing actionable insights to users. ECMWF is building on top of these recent works to develop a probabilistic forecasting system, AIFS. We will showcase results from our progress towards this system and outline our roadmap to operationalisation.

How to cite: Ben Bouallegue, Z., Alexe, M., Chantry, M., Clare, M., Dramsch, J., Lang, S., Lessig, C., Magnusson, L., Prieto Nemesio, A., Pinault, F., Raoult, B., and Tietsche, S.: AIFS – ECMWF’s Data-Driven Probabilistic Forecasting , EGU General Assembly 2024, Vienna, Austria, 14–19 Apr 2024, EGU24-17158, https://doi.org/10.5194/egusphere-egu24-17158, 2024.

The increasing integration of renewable energy resources to the national grids necessitates
accurate prediction of power generation from those sources in terms of secure operation of
electricity grid system and energy trading. Electricity generation of renewable energy power
plants such as wind and solar are inherently affected by weather conditions. The wind condition
particularly is affected by surface characteristics such as orography and vegetation, therefore it is
the one of the near surface atmospheric variables having the strongest local variability. The high-
resolution Numerical Weather Prediction (NWP) models are utilized to take the local conditions
into account. WRF model is the one of the most common NWP models having been widely
investigated by various researchers. On the other hand, The Model for Prediction Across Scales
(MPAS) is a relatively new NWP model utilizing non-uniform mesh structures, developed by the
National Center for Environmental Predictions (NCEP). However, there are limited studies in the
literature which compare the prediction performance of WRF and MPAS model in terms of
surface wind speed. This study evaluates the prediction accuracy of near surface wind of two
downscaled NWP models namely, WRF-ARW and MPAS. Both models are configured with
almost identical physics suites and initialized with 3 hourly 00-UTC initialization of Global
Forecast System (GFS) data. The model outputs are obtained at 10 minutes interval for 48 hours
horizon. Hourly averaged model results are compared with observations from 104 on-site
meteorological stations located in Turkiye having different complexity in terms of correlation
coefficient and RMSE.

How to cite: Yalcin, R. D., Yilmaz, M. T., and Yucel, İ.: Evaluation of the Impact of Uniform and Non-Uniform Resolution Implementations in Numerical Weather Prediction Models over the Accuracy of Short-Term Wind Prediction, EGU General Assembly 2024, Vienna, Austria, 14–19 Apr 2024, EGU24-17339, https://doi.org/10.5194/egusphere-egu24-17339, 2024.

EGU24-18548 | ECS | Posters on site | AS1.2

Enhancing Regional NWP Model with GNSS Zenith Total Delay Assimilation: A WRF and WRFDA 3D-Var Approach in the Greater Region of Luxembourg 

Haseeb Ur Rehman, Felix Norman Teferle, Addissu Hunegnaw, Guy Schumann, Florian Zus, and Rohith Muraleedharan Thundathil

Compared to alluvial floods, flash or pluvial floods are difficult to predict because they result from intense and brief periods of extreme precipitation. Luxembourg has a history of being impacted by floods, with notable occurrences in January 2011, May 2016, December 2017, January 2018, February 2019, and February 2020. However, July 2021 stands out as the most severe flood year on record in the region. In this study we are aiming to develop, a high-resolution numerical weather prediction (NWP) model for effective local heavy rainfall prediction in a nowcasting scenario and provide real time for flood simulation. The modeling relies on the Weather Research and Forecasting (WRF) model, which incorporates local Global Navigation Satellite System (GNSS) data assimilation and local precipitation observations to simulate small-scale, high-intensity convective precipitation.

As part of this, we will also test run the LISFlood flood model in an operational inundation forecast mode, meaning that the flood model will be run with the WRF precipitation forecasts as inputs.

The WRF model was configured for the Greater Region, utilizing a horizontal grid resolution of 12 km and incorporating high-resolution static datasets. Meteorological data i.e. July 13 -14 2021, from the Global Forecast System (GFS) were employed in the model setup as initial boundary condition. Zenith Total Delay (ZTD) data collected from various GNSS stations (112) across Germany and Luxembourg were assimilated into the model. Additionally, observational datasets including Surface Synoptic Observations (SYNOP), Upper Air Data, Radiosonde measurements (TEMP), and Tropospheric Airborne Meteorological Data Reporting (TAMDAR) were assimilated. Following this integration, an sensitivity analysis of various meteorological parameters such as precipitation, surface temperature (T2), and relative humidity was performed.


Keywords: NWP, WRF, Flash flood, LISFlood, Weather forecast, High-Resolution, GNSS, ZTD

How to cite: Rehman, H. U., Teferle, F. N., Hunegnaw, A., Schumann, G., Zus, F., and Muraleedharan Thundathil, R.: Enhancing Regional NWP Model with GNSS Zenith Total Delay Assimilation: A WRF and WRFDA 3D-Var Approach in the Greater Region of Luxembourg, EGU General Assembly 2024, Vienna, Austria, 14–19 Apr 2024, EGU24-18548, https://doi.org/10.5194/egusphere-egu24-18548, 2024.

EGU24-18938 | Posters on site | AS1.2

Forecasting tropical high-impact rainfall events using a hybrid statistical dynamical technique based on equatorial waves 

Samantha Ferrett, Gabriel Wolf, John Methven, Tom Frame, Christopher Holloway, Oscar Martinez-Alvarado, and Steve Woolnough

Recent work within the WCSSP FORSEA project and its successor FORWARDS has demonstrated that a hybrid statistical-dynamical forecasting technique combining model ensemble forecasts of equatorial waves with climatological rainfall statistics conditioned on wave phase and amplitude can provide additional skill in predicting high impact weather. The underlying rationale for the technique is twofold. Firstly that high impact rainfall events in the tropics are commonly associated with presence of equatorial waves; and secondly that while global models can adequately predict the evolution of dynamical structure of equatorial waves on time-scales of several days they do not predict the relationship between waves and rainfall well. In tests using the Met Office Global and Regional Forecasting System (MOGREPS) the hybrid forecast is found to outperform model rainfall forecasts from both the global and regional convection permitting versions of MOGREPS, however a weighted blend of the MOGREPS forecasts and the hybrid forecast was found to have the highest skill and further improvements in the method may be obtained by taking into consideration the effects of wave-superposition and interaction. To ascertain whether forecasts can be further improved by better predictions of wave amplitude and phase we compare to hypothetical best-case hybrid forecast computed using wave amplitudes and phases taken from reanalysis. This best-case scenario indicates that errors in forecasting all wave types diminish the hybrid forecast's skill, with the most significant reduction observed for Kelvin waves, suggesting that a significant improvement in the prediction of the propagation of equatorial waves would have a significant impact on rainfall prediction in the tropics. 

How to cite: Ferrett, S., Wolf, G., Methven, J., Frame, T., Holloway, C., Martinez-Alvarado, O., and Woolnough, S.: Forecasting tropical high-impact rainfall events using a hybrid statistical dynamical technique based on equatorial waves, EGU General Assembly 2024, Vienna, Austria, 14–19 Apr 2024, EGU24-18938, https://doi.org/10.5194/egusphere-egu24-18938, 2024.

EGU24-19257 | ECS | Orals | AS1.2

Dynamic Locally Binned Density Loss 

Jan Prosi, Sebastian Otte, and Martin V. Butz

In the field of precipitation nowcasting recent deep learning models now outperform traditional approaches such as optical flow [1,2]. Despite their principled effectiveness, these models and their respective training setups suffer from particular shortcomings.  For instance, they often rely on pixel-wise losses, which lead to blurred predictions by which the model expresses its uncertainty [2]. Additionally, these losses can negatively impact training dynamics by overly penalizing small spatial or temporal discrepancies between predictions and actual observations, i.e., the double penalty problem [3]. Generative methods such as discriminative losses or diffusion models do not suffer from the blurring effect as much [1, 4]. However, training these methods is complicated because training success is highly sensitive to the network architecture as well as to the learning setup and its parameterization [5].

Previous research has shown that spatial verification methods such as the fractions skill score offer an easy-to-implement alternative to solve the problem of pixel-wise losses [6, 7]. However, the fact that each pixel within the neighborhood of a spatial kernel is weighted equally poses a limiting factor to their performance and potential. Inspired by theories of cognitive modeling and in relation to the fractions skill score loss, we introduce a dynamic locally binned density (DLBD) loss: Forecasting target is not the actual precipitation in a grid cell but a target distribution, which encodes the density of binned precipitation values in a locally weighted area of grid cells. The loss is then determined via the cross-entropy of the predicted and the target distribution. We show that our novel prediction loss avoids the double penalty problem.  It thus diminishes the negative impact of small spatial offsets. Moreover, it enables the learning model to gradually shift focus towards progressively more accurate predictions.

We achieve best performance by simultaneously training on multiple concurrent forecasting targets that cover different local extents. We schedule the weighting of the loss terms such that the focus shifts from larger to smaller neighborhoods over the course of training. This way, the DL model first learns density dynamics and basic precipitation shifts. Later, it focuses on minimizing small spatial deviations, tuning into the local dynamics towards the end of training.  Our DLBD loss is easy-to-implement and shows great performance improvements.  We thus believe that DLBD losses can also be used by other forecasting architectures where the current forecasting loss precludes smooth loss landscapes.


1: Leinonen et al. 2023: Latent diffusion models for generative precipitation nowcasting with accurate uncertainty quantification
2: Espeholt et al. 2022: Deep learning for twelve hour precipitation forecasts
3: Grilleland et al. 2009: Intercomparison of spatial forecast verification methods.
4: Ravuri et al. 2021: Skilful precipitation nowcasting using deep generative models of radar
5: Mescheder et al. 2018: Which training methods for GANs do actually converge?
6: Roberts et al. 2008: Scale-selective verification of rainfall accumulations from high resolution forecasts of convective events.
7: Lagerquist et al. 2022: Can we integrate spatial verification methods into neural-network loss functions for atmospheric science?

How to cite: Prosi, J., Otte, S., and Butz, M. V.: Dynamic Locally Binned Density Loss, EGU General Assembly 2024, Vienna, Austria, 14–19 Apr 2024, EGU24-19257, https://doi.org/10.5194/egusphere-egu24-19257, 2024.

EGU24-19321 | ECS | Orals | AS1.2

Viability of satellite derived irradiance data for ML-based nowcasts 

Pascal Gfäller, Irene Schicker, and Petrina Papazek

Photovoltaic (PV) power production is increasingly becoming a central pillar in the shift to renewable power sources. The use of solar irradiance has great potential, as it is practically limitless and globally provides magnitudes more energy to the Earth than currently or foreseeable required. Solar irradiance as a power source does, however come with certain downsides. Besides the effects of seasonality and day-night-cycles on its usable potential, it´s broad use suffers mostly from uncertainty through its volatility. The actual extent of solar irradiance at the surface of the Earth is strongly influenced by a variety of atmospheric phenomena, most prominently clouds and atmospheric turbidity. The forecasting of near-future solar irradiance can thereby be beneficial in the estimation of PV power production in itself and with the goal of maintaining a stable equilibrium in electrical grids.

To achieve nowcasts on a larger grid scope, forecasting of solar irradiance from satellite data can substitute forecasting of power output for individual sites. Satellite data, in contrast to ground-based data sources or NWP model estimates, is less reliant on the proper workings of a wide range of externalities. General-purpose spatiotemporal neural networks can be adapted to this task and provide predictions within a very short timeframe, with no requirement of HPC-infrastructure. A sparse model relying on a single satellite-based data source has less points of failure that could affect its forecasting performance and can be very efficient, but this sparsity could also reduce the achievable predictive accuracy. Benefits of smaller and simpler forecasting pipelines therefore may need to be balanced with requirements in terms of accuracy.

To gather more meaningful and reliable results, a variety of spatiotemporal neural networks is implemented and tested to provide a more meaningful foundation. The models were selected and evaluated with respect to their different architectural patterns and designs, to get a notion of architectures beneficial to this task and achieve a more generalizable argument concerning the use satellite data as the sole basis of solar irradiance nowcasting.

In an attempt of improving the viability of satellite-based nowcasting a commonly occurring flaw in near-real-time satellite data sources, missing or skipped frames, solutions to mitigate issues in operational nowcasting are considered. In place of ad-hoc preprocessing such as interpolation of missing data frames, an attempt to condition the models to missing frames is made.

How to cite: Gfäller, P., Schicker, I., and Papazek, P.: Viability of satellite derived irradiance data for ML-based nowcasts, EGU General Assembly 2024, Vienna, Austria, 14–19 Apr 2024, EGU24-19321, https://doi.org/10.5194/egusphere-egu24-19321, 2024.

EGU24-19377 | ECS | Posters on site | AS1.2

Advancing Spatiotemporal Rainfall Nowcasting through Deep Learning Techniques 

Ahmed Abdelhalim, Miguel Rico-Ramirez, Weiru Liu, and Dawei Han

For weather forecasters and hydrologists, predicting rainfall in the short term – minutes to a few hours – is crucial for a range of applications. While traditional nowcasting methods excel in operational settings, they face limitations in predicting convective storm formation and high-intensity events. Enter deep learning, a powerful tool transforming numerous fields. Convolutional neural networks, in particular, have shown promise in improving nowcasting accuracy. These networks can learn complex patterns and relationships within data, like the intricate tapestry of rainfall variations observed in historical radar sequences. However, capturing long-term dependencies in this data remains a challenge, resulting in fuzzy nowcasts and underestimating high-intensity events. This study proposes a novel deep learning model that goes beyond simple extrapolation, effectively capturing both the spatial correlations and temporal dependencies within rainfall data. Our hybrid convolutional neural network architecture tackles this challenge through three key components: Decoder & Encoder: These modules focus on unraveling the intricate spatial patterns of rainfall and a temporal Module to learn the subtle long-term evolutions and interactions between rain cells over time. By capturing these temporal dependencies, the model can produce more accurate forecasts. To evaluate the model performance, it is compared against both deep learning and optical flow baselines. This presentation will introduce the model and provide a summary of its performance in spatiotemporal rainfall nowcasting.

Keywords: deep learning; spatiotemporal encoding, rainfall nowcasting; radar; optical flow

How to cite: Abdelhalim, A., Rico-Ramirez, M., Liu, W., and Han, D.: Advancing Spatiotemporal Rainfall Nowcasting through Deep Learning Techniques, EGU General Assembly 2024, Vienna, Austria, 14–19 Apr 2024, EGU24-19377, https://doi.org/10.5194/egusphere-egu24-19377, 2024.

EGU24-19699 | ECS | Posters on site | AS1.2

Evaluation of seamless forecasts for severe weather warnings  

Verena Bessenbacher, Jonas Bhend, Lea Beusch, Daniele Nerini, Colombe Siegenthaler, Christoph Spirig, and Lionel Moret

At MeteoSwiss, NWP and ML-based models are run operationally on a daily basis to provide weather forecasts and weather warnings for the general public. These forecasts come from various models that differ in lead times, initialization frequency, spatial resolution, and extents. We aim at combining those sources into a probabilistic, gridded weather forecast that is seamless in space and time. Creating a seamless forecast needs careful post-processing so as not to introduce cut-offs or unphysical behavior at the seams between the model runs. This includes using multiple forecast sources and forecast initializations (called lagged ensembles) and combining these using comprehensive blending methods. 

The first minimal viable product of a seamless forecast is currently being produced at MeteoSwiss, and will soon be available to the forecasters in real time. 

We evaluate the merit of these forecasts in terms of warning thresholds for rain and wind gusts. To do so, we compare reforecasts and observations from ground stations as well as rain radar observations from a set of past severe weather events over Switzerland. We benchmark the seamless forecast with individual forecast sources and post-processed products to evaluate the added value of seamlessly combining different forecast sources into one blended product. We furthermore plan to compare different methods for blending between sources soon.

How to cite: Bessenbacher, V., Bhend, J., Beusch, L., Nerini, D., Siegenthaler, C., Spirig, C., and Moret, L.: Evaluation of seamless forecasts for severe weather warnings , EGU General Assembly 2024, Vienna, Austria, 14–19 Apr 2024, EGU24-19699, https://doi.org/10.5194/egusphere-egu24-19699, 2024.

Integrating the hybrid and multiscale analyses and the parallel computation is necessary for current data assimilation schemes. A local data assimilation method, Local DA, is designed to fulfill these needs. This algorithm follows the grid-independent framework of the local ensemble transform Kalman filter (LETKF) and is more flexible in hybrid analysis than the LETKF. Local DA employs an explicitly computed background error correlation matrix of model variables mapped to observed grid points/columns. This matrix allows Local DA to calculate static covariance with a preset correlation function. It also allows using the conjugate gradient (CG) method to solve the cost function and allows performing localization in model space, observation space, or both spaces (double-space localization). The Local DA performance is evaluated with a simulated multiscale observation network that includes sounding, wind profiler, precipitable water vapor, and radar observations. In the presence of a small-size time-lagged ensemble, Local DA can produce a small analysis error by combining multiscale hybrid covariance and double-space localization. The multiscale covariance is computed using error samples decomposed into several scales and independently assigning the localization radius for each scale. Multiscale covariance is conducive to error reduction, especially at a small scale. The results further indicate that applying the CG method for each local analysis does not result in a discontinuity issue. The wall clock time of Local DA implemented in parallel is halved as the number of cores doubles, indicating a reasonable parallel computational efficiency of Local DA.

How to cite: Wang, S. and Qiao, X.: A Local Data Assimilation Method (Local DA v1.0) and its Application in a Simulated Typhoon Case, EGU General Assembly 2024, Vienna, Austria, 14–19 Apr 2024, EGU24-21770, https://doi.org/10.5194/egusphere-egu24-21770, 2024.

EGU24-21772 | Orals | AS1.2

Calibration of Convective-scale Hourly Precipitation Based on the Frequency-Matching Method 

Xiaoshi Qiao, Shizhang Wang, and Mingjian Zeng

Calibration of convective-scale hourly precipitation based on the frequency-matching method was carried on using CMPASS observation and CMA-MESO 3km forecast data. The character of hourly precipitation bias was studied.The effect of frequency-matching method (FMM) on the bias correction of CMA-MESO 3km hourly precipitation forecasts was analyzed. In the bias characteristic analysis, the differences in precipitation intensity in different regions of the country and the differences in precipitation in different months were considered. The whole country was divided into 7 sub-regions for monthly analysis. In the bias correction based on the frequency-matching method, the daily variations of precipitation bias and the impact of increasing and decreasing precipitation values on the corrected precipitation scores were analyzed. The results show that CMA-MESO 3km forecasts have a wet bias in light rainfall in the cold season, while a dry bias dominates in moderate to heavy rainfall. In the warm season, except for the Tibet region, the hourly precipitation forecast bias of CMA-MESO 3km shows significant daily variations, with more precipitation in the afternoon and less at night and in the morning, especially for heavy rainfall. Therefore, whether to consider the daily variations of precipitation bias in the use of FMM correction mainly reflects in the summer, especially at night and in the morning. Considering the daily variations of precipitation bias is beneficial to improving the forecast skills (TS scores) for nighttime and morning in the summer. Further analysis shows that the positive contribution of FMM correction to forecast scores mainly comes from the increase in frequency adjustment, especially for heavy rainfall. However, for light rainfall with wet bias, FMM often results in negative contribution. Therefore, FMM has a significant improvement effect on heavy rainfall in winter and nighttime rainfall in summer. The reason for this result is that the hit rate of CMA-MESO hourly precipitation forecast is low, and the false alarm rate is generally high, especially for heavy rainfall. In this case, the increased precipitation significantly increases the hit rate, while the false alarm rate increases to a lesser extent, thereby improving the precipitation scores.

How to cite: Qiao, X., Wang, S., and Zeng, M.: Calibration of Convective-scale Hourly Precipitation Based on the Frequency-Matching Method, EGU General Assembly 2024, Vienna, Austria, 14–19 Apr 2024, EGU24-21772, https://doi.org/10.5194/egusphere-egu24-21772, 2024.

EGU24-375 | ECS | Posters on site | AS1.3

Subseasonal forecast of the MJO over Tropical America 

Luis Lazcano and Christian Dominguez

The Intraseasonal Oscillation (ISO) is commonly divided into two oscillations: the Madden-Julian Oscillation (MJO), which commonly occurs from November to April in winter, and the Boreal Summer Intraseasonal Oscillation (BSISO), which occurs from May to October. Recent studies have classified these two modes into different types using cluster analysis. Here, we analyze the oceanic and atmospheric variables from the reanalysis ERA5 to determine the influence of MJO and BSISO over the Tropical Americas during the period 1980-2018. We also evaluate how the models of the S2S represent the diverse types of MJO and BSISO by using the Pearson correlation, the root mean square error, and the Brier skill score.

The analysis shows that the four MJO types (slow, fast, stationary, and jumping) exhibit no convective signal over the Tropical Americas and the three BSISO types (canonical, north dipole, and east-expansion) have a strong signal on OLR, winds at 850 and 200 mb over the Tropical Americas. Considering the MJO types, the jumping and slow MJO reveal a small warm pool area, areas where the sea surface temperatures (SSTs) are higher than 28.5°C, over the Mexican Pacific, while the stationary and fast MJOs do not reach such high temperatures. Slow (fast) MJO has strong negative (positive) anomalies in SSTs over the central and Eastern Pacific Ocean. Considering the BSISO types, the canonical BSISO has the strongest westerly burst signal before the initiation of the BSISO events over the Maritime Continent, followed by easterly winds later. In contrast, the east-expansion BSISO shows weaker winds and negative OLR anomalies over Mexico. The northward dipole produces a small warm pool area over the Eastern Pacific Ocean when compared to the canonic and east expansion BSISO.

We conclude that the MJO and BSISO types have different physical mechanisms for modulating the intraseasonal changes in the atmospheric and oceanic variables over the Tropical Americas. We also find that the ECMWF model has the best correlation skill when compared to other models from the S2S project.

How to cite: Lazcano, L. and Dominguez, C.: Subseasonal forecast of the MJO over Tropical America, EGU General Assembly 2024, Vienna, Austria, 14–19 Apr 2024, EGU24-375, https://doi.org/10.5194/egusphere-egu24-375, 2024.

EGU24-572 | ECS | Posters on site | AS1.3

Intraseasonal Oscillation of Land Surface Moisture and  its role in the maintenance of land CTCZ during the active  phases of the Indian Summer Monsoon 

Pratibha Gautam, Rajib Chattopadhyay, Gill Martin, Susmitha Joseph, and Atul kumar Sahai

This study focuses on the soil moisture characteristics and its role in supporting the continental tropical convergence zone (CTCZ) during the active phase of the monsoon. Like rainfall, land surface parameters (soil moisture and evaporation) also show intraseasonal oscillation. Furthermore, the sub-seasonal and seasonal features of soil moisture are different from each other. During the summer monsoon season, the maximum soil moisture is found over western coastal regions, central parts of India, and the northeastern Indian subcontinent. However, during active phases of the monsoon (i.e., on sub-seasonal timescales), the maximum positive soil moisture anomaly was found in northern India. Land surface characteristics (soil moisture) also play a pre-conditioning role during active phases of the monsoon over the monsoon core zone of India. When it is further divided into two boxes, the north monsoon core zone and the south monsoon core zone, it is found that the preconditioning depends on that region's soil type and climate classification. Also, we calculate the moist static energy (MSE) budget during the monsoon phases to show how soil moisture feedback affects the boundary layer MSE and rainfall. A similar analysis is applied to the model run, but it cannot show the realistic preconditioning role of soil moisture and its feedback on the rainfall as in observations. We conclude that to get proper feedback between soil moisture and precipitation during the active phase of the monsoon in the model, the pre-conditioning of soil moisture should be realistic.

How to cite: Gautam, P., Chattopadhyay, R., Martin, G., Joseph, S., and Sahai, A. K.: Intraseasonal Oscillation of Land Surface Moisture and  its role in the maintenance of land CTCZ during the active  phases of the Indian Summer Monsoon, EGU General Assembly 2024, Vienna, Austria, 14–19 Apr 2024, EGU24-572, https://doi.org/10.5194/egusphere-egu24-572, 2024.

Drought, an extreme meteorological phenomenon, has significant impacts on a country's social, economic, and environmental stability. Early prediction of drought is crucial to provide warning and preparedness measures. Sub-seasonal prediction, which encompasses a few weeks to a few months ahead, is a critical timescale with limited memory of initial conditions, and not significantly controlled by boundary conditions. Presently, dynamical models have drawn much attention in the sub-seasonal precipitation forecast, however, the accuracy in drought prediction remains low. Currently, various dynamical models such as North American Multi-Model Ensemble (NMME) provide sub-seasonal prediction of hydro-meteorological variables for the entire globe. The efficacy of NMME model output for sub-seasonal drought prediction has not been explored in India. Also, a comprehensive study regarding the inclusion of climate indices as potential predictors for S2S drought prediction is lacking in the literature. We have investigated the potentiality of NMME precipitation output for sub-seasonal drought prediction over India and found out that the NMME model output doesn’t show a reasonable S2S forecast for 3-months standardized precipitation index (SPI3). Further, the study utilized data-driven models such as auto-regression, support vector regression (SVR), XGboost, and recurrent neural network (RNN) with climatic indices and previous month lagged value as predictors to improve the prediction skill. The results show that statistical models are superior to dynamic models. Although the previous monthly data is adequate for lead 1 drought prediction for most of the grids over India, the inclusion of climatic oscillation information was found to be the potential predictor and necessary for higher lead predictions. For example, the western disturbance index helped predict droughts at 2-months lead for the Northwest region of India. Moreover, the wavelet-based post-processing technique has shown the potential to enhance drought predictions significantly. The outcomes of this study will provide an outlook for the sub-seasonal to seasonal drought prediction over India and aid in the improvement of decision-making.

How to cite: Singh, S. and Valiya Veetil, S.: Sub-seasonal to seasonal (S2S) prediction of droughts over India using different data-driven models, EGU General Assembly 2024, Vienna, Austria, 14–19 Apr 2024, EGU24-975, https://doi.org/10.5194/egusphere-egu24-975, 2024.

Recent studies suggest that La Niña events can be classified into two categories: mega La Niña and equatorial La Niña. The understanding of the variations in boreal summer intraseasonal oscillation (BSISO) behaviors between such two conditions remains uncertain. Results in this work show during equatorial La Niña summers, in conjunction with the more adequate intraseasonal column-integrated moisture anomalies, the weaker intraseasonal outgoing longwave radiation anomalies are observed over the western North Pacific (WNP) at 3 pentads lag of the peak phase for the Maritime Continent (MC) BSISO events than during mega conditions. Such changes are closely linked with the different propagation features, specifically northwestward and northeastward propagations under mega and equatorial conditions respectively. The distinct propagations under these two conditions could be partly explained by the background column-integrated moisture anomalies. Under equatorial conditions, the less sufficient background moisture anomalies over the tropical western Pacific (WP), in comparison to mega conditions, suppress the activities of the BSISO and its northwestward propagation here. Meanwhile, the enhanced moisture anomalies over the northwestern MC and its surrounding area (NWMC) facilitate the northeastward propagation. Under mega conditions, the background moisture anomalies over the tropical WP are not significant. The southward moisture anomaly gradient over the NWMC hinders the meridional northward propagation and makes some BSISO activities move to the tropical WP region, performing the zonal westward propagation as a whole. The moisture budget and multi-scale interaction diagnoses also emphasize the significant role of the propagation change in the moisture tendency difference averaged over the WNP. Moreover, the extratropical circulation anomalies associated with the MC BSISO events are also discussed. These findings provide new insights into BSISO activity and offer potential improvements for subseasonal forecast.

How to cite: Cao, C. and Wu, Z.: Distinct changes in boreal summer intraseasonal oscillation over the western North Pacific under mega and equatorial La Niña conditions, EGU General Assembly 2024, Vienna, Austria, 14–19 Apr 2024, EGU24-1244, https://doi.org/10.5194/egusphere-egu24-1244, 2024.

Subseasonal prediction of extremes has emerged as a top forecast priority but remains a great challenge. In this work, we explored two physical modes controlling the subseasonal variation and prediction of land cold extremes over Eurasia: the so-called North Atlantic Oscillation (NAO) and the Eurasian Meridional Dipole mode (EMD). The ECMWF model has shown its skill in predicting the Eurasian land cold extremes 2-4 weeks in advance mainly because of the skillful prediction of NAO and EMD. Further, we separated these observed events into the good prediction and poor prediction groups for those two modes to reveal the potential factors influencing the subseasonal prediction of land cold extremes. It is found that the good prediction group has a stronger initial amplitude and longer persistence, while the poor prediction group has a relatively weaker initial amplitude but rapid intensification. For EMD, the predictability is mainly due to the skillful prediction of the Ural blocking which is further traced back to the stratospheric variations.  

How to cite: Xiang, B.: The window of opportunity for subseasonal land cold extreme prediction over Eurasia  , EGU General Assembly 2024, Vienna, Austria, 14–19 Apr 2024, EGU24-1376, https://doi.org/10.5194/egusphere-egu24-1376, 2024.

EGU24-1548 | Posters on site | AS1.3

Prediction Skill and Practical Predictability Depending on the Initial Atmospheric States in S2S Forecasts 

Masaru Inatsu, Mio Matsueda, Naoto Nakano, and Sho Kawazoe

The hypothesis that predictability depends on the atmospheric state in the planetary-scale low-frequency variability in boreal winter was examined.We first computed six typical weather patterns from 500-hPa geopotential height anomalies in the Northern Hemisphere using self-organizing map (SOM) and k-clustering analysis. Next, using 11 models from the subseasonal-to-seasonal (S2S) operational and reforecast archive, we computed each model’s climatology as a function of lead time to evaluate model bias. Although the forecast bias depends on the model, it is consistently the largest when the forecast begins from the atmospheric state with a blocking-like pattern in the eastern North Pacific. Moreover, the ensemble-forecast spread based on S2S multimodel forecast data was compared with empirically estimated Fokker– Planck equation (FPE) parameters based on reanalysis data. The multimodel mean ensemble-forecast spread was correlated with the diffusion tensor norm; they are large for the cases when the atmospheric state started from a cluster with a blocking-like pattern. As the multimodel mean is expected to substantially reduce model biases and may approximate the predictability inherent in nature, we can summarize that the atmospheric state corresponding to the cluster was less predictable than others.

How to cite: Inatsu, M., Matsueda, M., Nakano, N., and Kawazoe, S.: Prediction Skill and Practical Predictability Depending on the Initial Atmospheric States in S2S Forecasts, EGU General Assembly 2024, Vienna, Austria, 14–19 Apr 2024, EGU24-1548, https://doi.org/10.5194/egusphere-egu24-1548, 2024.

EGU24-1591 | ECS | Orals | AS1.3

Process-based analysis of the MJO phase speed error in the coupled NWP model of the UK Met Office: a two-way feedback between the MJO and the diurnal warm layers 

Eliza Karlowska, Adrian Matthews, Benjamin Webber, Tim Graham, and Prince Xavier

The diurnal cycle of SST (dSST) is influenced by the development of diurnal warm layers in the upper ocean. Observations show that the dSST rectifies intraseasonal SSTs, potentially leading to changes in intraseasonal weather patterns such as the Madden-Julian Oscillation (MJO). Here we analyze 15-day forecast composites of the coupled ocean-atmosphere and the atmosphere-only configurations of the Numerical Weather Prediction (NWP) models of the UK Met Office to show that a strong dSST in the coupled model leads to a faster MJO propagation compared with the atmosphere-only version of the model. A set of experiments using the coupled model was designed to reduce the strength of the dSST by imposing instant vertical mixing in the top 5 and 10 m of the ocean model. On a 15 lead-day time scale, weakening the dSST slows the MJO phase speed in the coupled model. On a 7 lead-day time scale, all coupled model runs display an underlying 5% increase in the MJO phase speed compared to the atmosphere-only model due to the presence of thermodynamic coupling unrelated to the dSST. The MJO phase speed increase due to the dSST is linearly related to the mean tropical dSST at lead day 1 in the coupled model. An additional 4% of the MJO phase speed increase between the control coupled model and the atmosphere-only model on a 7 lead-day timescale can be attributed to the presence of the dSST in the coupled model. Over 15 lead days, the coupled model produces a two-way feedback between the MJO and the dSST. The MJO conditions set the strength of the dSST in the coupled model. Consistent with observations, the dSST in the coupled model rectifies intraseasonal anomalies of SSTs such that stronger dSST leads to positive intraseasonal SST anomalies. The MJO convection response to these SST anomalies peaks 7 days later, and subsequently feeds back onto SST anomalies. The phase relationship between MJO convection, dSST and intraseasonal SST anomalies is consistent with the relationship between dSST and MJO propagation speed. Overall, our experiments demonstrate the importance of high vertical resolution of the upper ocean in predicting the eastward propagation of the MJO in an NWP setting, potentially creating repercussions for seasonal predictions and climate projections should this feedback be unrepresented in the models.

How to cite: Karlowska, E., Matthews, A., Webber, B., Graham, T., and Xavier, P.: Process-based analysis of the MJO phase speed error in the coupled NWP model of the UK Met Office: a two-way feedback between the MJO and the diurnal warm layers, EGU General Assembly 2024, Vienna, Austria, 14–19 Apr 2024, EGU24-1591, https://doi.org/10.5194/egusphere-egu24-1591, 2024.

EGU24-1706 | ECS | Orals | AS1.3

Real-time subseasonal prediction of cold waves over India 

Raju Mandal, Susmitha Joseph, Atul Kumar Sahai, Avijit Dey, Phani Murali Krishna, Dushmanta Pattanaik, Manpreet Kaur, and Nirupam Karmakar

Cold wave (CW) events over India are usually observed during the boreal winter months, November to February. This study proposes an objective criterion using the actual, departure from normal and the percentile values of the daily gridded minimum temperature (Tmin) data for the monitoring of the CW events over the Indian region and also checks its usefulness in a multi-model ensemble extended range prediction system. The large-scale features associated with these CW events are also discussed.

The CW-prone region has been identified by utilizing this proposed criterion and considering the number of average CW days/year for the entire study period and recent decades. By calculating the standardized area-averaged (over the CW-prone region) Tmin anomalies time series, the CW events are identified from 1951 to 2022. Analyzing the temporal variability of these events, it is seen that there is no compromise in the occurrences of the CW events, even under the general warming scenarios. It is found that the long CW events (>7 days) are favoured by the La-Nina condition, and short CW events (≤7 days) are favoured by the neutral condition in the Pacific. Also, the blocking high to the northwest of Indian longitude with the very slow movement of the westerly trough to the east is found to be associated with the long CW events. In contrast, in the case of short events, the blocking high is not so significant. The multi-model ensemble prediction system is found to be reasonably skilful in predicting the CW events over the CW-prone region up to 2-3 weeks in advance with decreasing confidence in longer leads. Based on the forecast verifications, it is noticed that this forecasting system has a remarkable strength to provide an overall indication about the forthcoming CW events with sufficient lead time despite its uncertainties in space and time. 

How to cite: Mandal, R., Joseph, S., Sahai, A. K., Dey, A., Krishna, P. M., Pattanaik, D., Kaur, M., and Karmakar, N.: Real-time subseasonal prediction of cold waves over India, EGU General Assembly 2024, Vienna, Austria, 14–19 Apr 2024, EGU24-1706, https://doi.org/10.5194/egusphere-egu24-1706, 2024.

EGU24-2747 | Orals | AS1.3

Development of a Multi-physics Multi-ensemble Subseasonal Prediction System and its Real-time Performance during Contrasting Indian monsoons 

Susmitha Joseph, Avijit Dey, Raju Mandal, Mahesh Kalshetti, Ravuri Phani, Shubham Waje, and Atul Sahai

Subseasonal predictions with a time scale of 2-4 weeks, which fills the gap between the weather and seasonal forecasts, are limited by the uncertainties arising from the initial conditions as well as the model physics. Therefore, to develop an efficient subseasonal prediction system, both these uncertainties need to be addressed. With this background, a multi-physics multi-ensemble approach has been adopted to develop a competent second-generation subseasonal prediction system at the Indian Institute of Tropical Meteorology (IITM), Pune, India. The first-generation prediction system developed at IITM is run operationally at the India Meteorological Department and has useful skills for up to two weeks.

A combination of physics perturbations and initial condition perturbations with a total of 18 ensemble members is present in the system. This system has been experimentally run since May 2022. The hindcast runs during 2003-2018 are also made on-the-fly. The initial results indicate a considerable improvement in the forecast skill compared to its predecessor and have reasonable deterministic prediction skill for up to three weeks. The system could provide skilful prediction of the subseasonal variations during the two contrasting monsoon seasons 2022 (above normal) and 2023 (below normal) 2-3 weeks in advance.

How to cite: Joseph, S., Dey, A., Mandal, R., Kalshetti, M., Phani, R., Waje, S., and Sahai, A.: Development of a Multi-physics Multi-ensemble Subseasonal Prediction System and its Real-time Performance during Contrasting Indian monsoons, EGU General Assembly 2024, Vienna, Austria, 14–19 Apr 2024, EGU24-2747, https://doi.org/10.5194/egusphere-egu24-2747, 2024.

This study investigates the influence of the boreal summer intraseasonal oscillation (BSISO) on 10-30-day summer rainfall anomalies in Southwestern China (SWC) under the effects of Qinghai-Tibetan Plateau monsoon (QTPM) based on ERA5 reanalysis data and CN05.1 precipitation in 1981-2018. The results show that the 10-30-day rainfall anomalies in SWC have significant and joint feedback to variation of the second component of BSISO (BSISO2) and QTPM at lagging strong (weak) BSISO events by 0-12 days. Their lagged causal linkage and corresponding physical processes have been revealed by causal effect networks and composite analyses, which are most significant at 4-day and 12-day lag. Simultaneously, BSISO2 can induce wetter 10-30-day rainfall over southern SWC by motivating water vapor transport from the Bay of Bengal towards Yunnan province. More importantly, BSISO2 can modulate a northwest-propagating wave train from the western north Pacific towards SWC at the upper troposphere by vertical wave energy transport, which blocks the wave train propagating from the Lake Balkhash to east China–Japan most significantly at a 4-day lag and leads to drier eastern SWC. The process can be influenced by QTPM significantly which leads to the response of 10-30-day rainfall over SWC with lags of 0-12 days. Specifically, same-phase QTPM can trigger more active wave train propagation from high-latitude while opposite-phase QTPM enhances the low-latitude wave energy transport. The interference then facilitates baroclinic structure over eastern SWC at lagging 12 days with positive precipitation anomalies for same-phase events and negative precipitation for opposite-phase events.

How to cite: Yang, L., Chen, H., and Wang, S.: The joint effects of the boreal summer intraseasonal oscillation and Qinghai-Tibetan Plateau monsoon on the precipitation over Southwestern China , EGU General Assembly 2024, Vienna, Austria, 14–19 Apr 2024, EGU24-2784, https://doi.org/10.5194/egusphere-egu24-2784, 2024.

EGU24-2862 | ECS | Posters on site | AS1.3

Robust Relationship between Mean State Moisture and Interannual MJO Activity in Observations and CMIP6 Models 

Daehyun Kang, Daehyun Kim, and Seon-Yu Kang

The Madden-Julian Oscillation (MJO) is the dominant intraseasonal variability of eastward propagating atmospheric disturbances in the tropics. From its vast impacts on the sub-seasonal extreme events and predictability, the mean states controlling the MJO activity have been investigated. For example, the robust relationship between the Quasi-Biennial Oscillation (QBO) and the MJO has been suggested in the past several years. In the easterly QBO winters, the MJO exhibits stronger activity than the westerly QBO winters. 
Our study suggests another crucial factor that affects the MJO: a meridional humidity gradient of the atmospheric column in the vicinity of the Maritime Continent. With the change in the shape of the column humidity distribution, MJO variance shows a robust interannual modulation regardless of the QBO. The northward (southward) extension of the moisture increases (decreases) the mean state meridional humidity gradient, which leads to MJO development (decay) over the MC with increasing (decreasing) horizontal moisture advection. This robust relationship between mean state humidity and MJO activity is investigated in the CMIP6 models as two aspects: i) interannual variation of MJO and ii) future change in MJO. Both simulated MJO activities are largely affected by the mean state MHG, supporting the robust role of mean state moisture on the MJO shown in the observations. The results of this study provide a further understanding of seasonal MJO activity and sub-seasonal predictability.MJO activity and sub-seasonal predictability.

How to cite: Kang, D., Kim, D., and Kang, S.-Y.: Robust Relationship between Mean State Moisture and Interannual MJO Activity in Observations and CMIP6 Models, EGU General Assembly 2024, Vienna, Austria, 14–19 Apr 2024, EGU24-2862, https://doi.org/10.5194/egusphere-egu24-2862, 2024.

EGU24-2890 | ECS | Orals | AS1.3

Influence of Arctic sea ice concentration on extreme Ural blocking predictability in subseasonal timescales 

Guokun Dai, Mu Mu, Xueying Ma, and Yangjiayi Gao

Utilizing the Community Atmospheric Model version 4, the influence of Arctic sea ice concentration (SIC) on the predictability of the Ural Blocking (UB) in subseasonal timescale is investigated. Taking the zonal flows as the reference states, the optimal Arctic SIC perturbations that trigger zonal flows into UB events on subseasonal timescale are obtained with the conditional nonlinear optimal perturbation (CNOP) approach. The numerical results show that the Arctic SIC decline in the Greenland, Barents and Okhotsk Seas can trigger zonal flows into UB events on a timescale of four pentads (20 days). Further diagnosis shows that the SIC decline in these regions locally warms the low troposphere via diabatic processes in the first pentad. Then, dynamic processes, such as temperature advection, modulate the temperature in the middle troposphere and weaken the meridional temperature gradient between the Arctic and mid-latitudes upstream of the Ural sector. The weakened meridional temperature gradient further decelerates the background zonal flow near the Ural sector and triggers UB formation in four pentads. After that, the optimal Arctic SIC perturbations that have great influences on subseasonal UB predictions are also obtained with CNOP approach. It is found that SIC increase in the Greenland Sea, Barents Sea, and Okhotsk Sea would weaken the UB intensity while SIC decline in these regions would strengthen it. Further diagnoses show that the physical mechanisms are similar to those triggering UB formation. Moreover, utilizing the observing system simulation experiments, it is shown that targeted observations in the Barents Sea, Greenland Sea, and Okhotsk Sea can remarkably improve the prediction skills of UB in the fourth pentad. Numerical results show that targeted observations have a positive effect on 75% of 160 experiment members, reduce 35% forecast errors of the fourth pentad mean blocking index, and perform even better when the original forecast errors are greater. Further diagnosis shows that the improvement is related to the well-described westerly winds in the Ural region and its adjacent regions, corresponding to the more skillful predictions of blocking circulations. The above results supply a theoretical base for the design of Arctic SIC observations and more skillful subseasonal predictions for mid-latitude extreme weather.

How to cite: Dai, G., Mu, M., Ma, X., and Gao, Y.: Influence of Arctic sea ice concentration on extreme Ural blocking predictability in subseasonal timescales, EGU General Assembly 2024, Vienna, Austria, 14–19 Apr 2024, EGU24-2890, https://doi.org/10.5194/egusphere-egu24-2890, 2024.

EGU24-3148 | Posters on site | AS1.3

Subseasonal Warming of Surface Soil Enhances Precipitation Over the Eastern Tibetan Plateau in Early Summer 

Xin Qi, Jing Yang, Yongkang Xue, Qing Bao, Guoxiong Wu, and Duoying Ji

The precipitation over the eastern Tibetan Plateau (ETP, here defined as 29°–38°N, 91°–103°E) usually exhibits significant subseasonal variation during boreal summer. As the hot spot of land-air interaction, the influences of ETP surface soil temperature (Tsoil) on the local precipitation through subseasonal land-air interaction are still unclear but urgently needed for improving subseasonal prediction. Based on station and reanalysis datasets of 1979–2018, this study identifies the evident quasi-biweekly (QBW) (9–30 days) periodic signal of ETP surface Tsoilvariation during the early summer (May–June), which results from the anomalies of southeastward propagating mid-latitude QBW waves in the mid-to-upper troposphere. The observational results further show that the maximum positive anomaly of precipitation over the ETP lags the warmest surface Tsoil by one phase at the QBW timescale, indicating that the warming surface Tsoil could enhance the subseasonal precipitation. The numerical experiments using the WRF model further demonstrate the effect of warming surface Tsoil  on enhancing the local cyclonic and precipitation anomaly through increasing upward sensible heat flux, the ascending motion, and water vapor convergence at the QBW timescale. In contrast, the effect of soil moisture over the ETP is much weaker than Tsoil  at the subseasonal timescale. This study confirms the importance of surface Tsoil over the ETP in regulating the precipitation intensity, which suggests better simulating the land thermal feedback is crucial for improving the subseasonal prediction.

How to cite: Qi, X., Yang, J., Xue, Y., Bao, Q., Wu, G., and Ji, D.: Subseasonal Warming of Surface Soil Enhances Precipitation Over the Eastern Tibetan Plateau in Early Summer, EGU General Assembly 2024, Vienna, Austria, 14–19 Apr 2024, EGU24-3148, https://doi.org/10.5194/egusphere-egu24-3148, 2024.

Global warming is accelerating drought onset, causing more frequent flash drought events. These events occur at the subseasonal timescale in which rapid decreases in root-zone soil moisture (RZSM) increase risks of crop failure, wildfire, and heat stress globally. However, forecasting soil moisture and flash droughts at lead times beyond 2 weeks remains a significant challenge. Recently, machine learning methods with historical reanalysis data have shown improved forecast accuracy compared to state-of-the-art numerical weather prediction methods, but they can only produce skillful forecast within 10 days. Here we show that a convergence forecast model combining a deep learning approach with subseasonal retrospective forecasts (reforecast) from numerical models produces skillful subseasonal soil moisture and flash drought forecasts at lead times beyond 2 weeks. We train a deep learning architecture on combinations of reanalysis and reforecast from 2000 to 2015 and validate results during the testing period from 2018 to 2019. The subseasonal forecast skill of soil moisture of the convergence forecast model is much higher than those of current state-of-the-art numerical forecast models, deep learning bias corrected numerical forecast models, or the reanalysis-based deep learning models, which showed no skill after 2 weeks lead time. The convergence model also showed significantly improved performance for predicting flash droughts compared to the original or deep learning bias corrected numerical forecast models or reanalysis-based deep learning models.  A permutation analysis indicates that reanalysis precursors and soil moisture reforecast at lead times within 2 weeks both contribute significantly to the forecast skill at longer lead times. The convergence forecast model provides accurate and efficient subseasonal soil moisture and flash drought forecasting and is promising for accurately forecasting key variables and extreme events at the subseasonal timescale.

How to cite: Lesinger, K. and Tian, D.: Converging Deep Learning and Numerical Prediction for Skillful Subseasonal Soil Moisture and Flash Drought Forecasting, EGU General Assembly 2024, Vienna, Austria, 14–19 Apr 2024, EGU24-3194, https://doi.org/10.5194/egusphere-egu24-3194, 2024.

EGU24-3242 | ECS | Orals | AS1.3 | Highlight

Predicting Forest Damage in Europe: A Subseasonal-to-Seasonal Forecasting Approach for Hydro-meteorological Drivers 

Pauline Rivoire, Sonia Dupuis, Antoine Guisan, and Pascal Vittoz

Extreme meteorological events such as frost, heat, and drought can induce significant damage to vegetation and ecosystems. In particular, heat and drought events are projected to become more frequent in a changing climate. On the subseasonal-to-seasonal (S2S) forecasting timescale, skillful forecasts of hydro-meteorological hazards combined with targeted actions can prevent various vegetation damage and large-scale impacts (e.g. agriculture and food security, wildfire risk management, forest management,  biodiversity and flora protection,etc.).

We here focus on forest damage in Europe, defined as negative anomalies of the normalized difference vegetation index (NDVI). Compound drought and heat wave events are known to trigger low NDVI events in summer. A dry summer combined with warm and moist conditions during the previous winter can also have a negative impact. However, to our knowledge, there exists no comprehensive study of hydro-meteorological drivers triggering forest damage in Europe. Hence, the goal of our study is a) finding the optimal variables to predict summer forest damage in Europe, and b) assessing the S2S forecast skill of these variables. We develop an automated procedure to systematically identify hydro-meteorological conditions leading to forest damage, up to 18 months prior to occurrence. We train a model using AVHRR remote sensing observation of NDVI for the impact data, and ERA5 and ERA5-Land reanalysis datasets for the explicative variables. These variables include temperature, precipitation, dew point temperature, surface latent heat flux, soil moisture, and soil temperature. To bridge the research gap between the S2S forecasts of hydrometeorological variables and vegetation damage, we assess the forecast skill of variables from the S2S hindcast database of ECMWF identified as responsible for low NDVI events. The idea is to determine to what extent S2S models can predict conditions triggering forest damage, by identifying the sources of predictability or potential need for improvement.

How to cite: Rivoire, P., Dupuis, S., Guisan, A., and Vittoz, P.: Predicting Forest Damage in Europe: A Subseasonal-to-Seasonal Forecasting Approach for Hydro-meteorological Drivers, EGU General Assembly 2024, Vienna, Austria, 14–19 Apr 2024, EGU24-3242, https://doi.org/10.5194/egusphere-egu24-3242, 2024.

EGU24-3737 | ECS | Posters on site | AS1.3 | Highlight

Arctic sea ice loss and La Niña as precursors of extreme East Asian cold winters 

Yeon-Soo Jang, Hyung-Gyu Lim, Sang-Yoon Jun, and Jong-Seong Kug

Despite current global warming due to increasing greenhouse gases, severe cold winters have devastated the East Asia in recent decades. Efforts are being made to predict cold events using dynamic models and physically-based statistical models. In this study, we explore the potential predictability of the East Asian winter surface temperature by establishing a multiple linear regression model based on three precursors of time-evolved preconditions: 1) autumn Arctic sea-ice loss, 2) northern Eurasian sea level pressure pattern, and 3) the El Niño-Southern Oscillation (ENSO). Reduced autumn Arctic sea-ice was favorable for extreme cold events in the East Asia. Furthermore, the autumn Arctic sea-ice loss was accompanied by cyclonic circulations over northern Eurasia in November, which could have led to cold anomalies over the East Asia in the late winter. The preconditioning deep convection in La Niña events is a well-known indicator of exerted atmospheric wave propagation, resulting in cold winters over the East Asia. We suggested here that by combining Arctic sea-ice, atmospheric circulations, and ENSO, the predictability of East Asian winter surface temperature variability could be improved.

How to cite: Jang, Y.-S., Lim, H.-G., Jun, S.-Y., and Kug, J.-S.: Arctic sea ice loss and La Niña as precursors of extreme East Asian cold winters, EGU General Assembly 2024, Vienna, Austria, 14–19 Apr 2024, EGU24-3737, https://doi.org/10.5194/egusphere-egu24-3737, 2024.

EGU24-3796 | ECS | Posters on site | AS1.3 | Highlight

Targeted Observations on Arctic Sea Ice Concentration for Improving Extended-range Prediction of Ural Blocking 

Yangjiayi Gao, Mu Mu, and Guokun Dai

The predictability of certain extreme weather events can exceed the traditional two weeks by considering the boundary conditions. Targeted observations in sensitive areas on Arctic sea ice concentration (SIC) can improve the extended-range (4 pentads) forecast skills of long-lasting and strong Ural blocking (UB). The sensitive areas are determined based on the SIC optimally growing boundary errors, obtained by the conditional nonlinear optimal perturbation method. The sensitive areas are mainly located in the Barents Sea, Greenland Sea, and Okhotsk Sea. The results of observing system simulation experiments for 8 UB cases indicate that the targeted observations can remarkably improve the prediction skills of UB in the 4th pentad. Targeted observations have a positive effect on 75% of 160 experiment members, reduce 35% forecast errors of the 4th pentad mean blocking index, and perform even better when the original forecast errors are greater. Further diagnosis shows that targeted observations contribute to more accurate SIC boundary conditions in the Barents Sea, Greenland Sea, and Okhotsk Sea and reduce temperature errors in the lower and middle troposphere. It further results in well-described westerly winds in the Ural region and its adjacent regions, corresponding to the more skillful predictions of blocking circulations. The above results supply a theoretical base for the design of Arctic SIC observations and more skillful extended-range predictions for mid-latitude extreme weather.

How to cite: Gao, Y., Mu, M., and Dai, G.: Targeted Observations on Arctic Sea Ice Concentration for Improving Extended-range Prediction of Ural Blocking, EGU General Assembly 2024, Vienna, Austria, 14–19 Apr 2024, EGU24-3796, https://doi.org/10.5194/egusphere-egu24-3796, 2024.

EGU24-3798 | ECS | Posters on site | AS1.3

The role of stratospheric processes in the trans-seasonal connection between spring and summer northern annular modes 

Xiran Xu, Lei Wang, Tao Wang, and Gang Chen

The summer northern annular mode (NAM) variability plays a crucial role in the summer climate variability and extremes of the Northern Hemisphere. In this study, we report a significant negative correlation between the March NAM and summer NAM during 1979–2022 and reveal the role of the spring stratosphere in this seasonal linkage. Particularly, it is found that the negative phase of March NAM features a strong meridional shear in the extended-North-Atlantic jet, which tends to generate planetary scale Rossby waves that propagate upward and poleward into the stratosphere. This increased stratospheric planetary wave activity in March transitions to weakened wave activity in May, leading to positive zonal wind anomalies in the polar stratosphere in May, extending downward to the troposphere in June and promoting the formation and persistence of positive summer NAM. The results provide both statistical and dynamical evidence for the role of the spring stratosphere in connecting the spring and summer circulation. 

How to cite: Xu, X., Wang, L., Wang, T., and Chen, G.: The role of stratospheric processes in the trans-seasonal connection between spring and summer northern annular modes, EGU General Assembly 2024, Vienna, Austria, 14–19 Apr 2024, EGU24-3798, https://doi.org/10.5194/egusphere-egu24-3798, 2024.

The main objective of this study is to assess typhoon precipitation forecast skill on the subseasonal timescale. The 20-year reforecasts from the ECMWF 46-day ensemble (ENS) are utilized to compare with gridded surface observations in Taiwan. The analysis focuses on the dates when typhoons affect Taiwan (117-129°E and 19-28°N). 15 ENS grids around Taiwan area are used with the grid size of 0.8 x 0.8 degree. Historical rainfall observations are provided by the Central Weather Administration (CWA), which the observations from the surface stations are interpolated into a resolution of 1km x 1km grid box. A comparison between the ENS forecast data and gridded CWA rainfall observations is performed by searching the optimal percentile rank (PR) of gridded CWA rainfall that has the smallest mean difference against the ENS data. The result reveals that the ENS can somewhat capture the rainfall contrast between the mountainous area and plain area, despite its relatively lower horizontal resolution. However, the difference between ENS rainfall forecasts and surface observations significantly increases for the forecasts beyond 72 hours, due to the model's coarser resolution and typhoon track forecast errors.

The ENS typhoon track forecast errors in weeks 1-4 are analyzed by comparing the ensemble vortex tracks with the JTWC best tracks. The track forecast error is decomposed into the along-track (AT) and cross-track (CT) components. The analysis result shows negative mean AT errors, indicating slower translation speed biases in the model. The mean AT errors could reach up to 400 km for the 168 h forecasts after TC formations.

Given the significant typhoon track forecast errors, using the raw ENS rainfall forecasts for the operational TC forecasting/outlook become challenging. In response, we have developed a statistical Quantitative Precipitation Forecast (QPF) model to predict typhoon rainfall, considering the track biases in the ENS forecasts. The forecast tools developed in this study will be integrated into CWA’s subseasonal typhoon forecast system to support water resources management and disaster risk reduction.

How to cite: Hsu, H.-Y. and Tsai, H.-C.: Subseasonal Typhoon Precipitation Forecast in Taiwan Area Using the ECMWF Reforecasts: Forecast Verification and Application, EGU General Assembly 2024, Vienna, Austria, 14–19 Apr 2024, EGU24-4208, https://doi.org/10.5194/egusphere-egu24-4208, 2024.

Land surface processes are strongly associated with heat waves (HWs). However, how the uncertainties in land surface processes owing to inaccurate physical parameters influence subseasonal HW predictions has rarely been explored. To examine the impact of parameter errors of land surface processes on the uncertainty of subseasonal HW predictions, five strong and long-lasting HW events over the middle and lower reaches of the Yangtze River (MLYR) are investigated. Based on the Weather Research and Forecasting (WRF) model, the conditional nonlinear optimal perturbation related to parameters (CNOP-P) approach is employed to address the aforementioned issues.

Numerical results demonstrate that the CNOP-P type errors of physical parameters cause large prediction errors for five HW event onsets. Two types of CNOP-Ps are obtained for HW events, called the type-1 CNOP-P and the type-2 CNOP-P. The type-1 (type-2) CNOP-P causes an approximately 3 °C (2 °C) warm (cold) bias during the HW period. Surface sensible and latent heat flux errors, especially flux exchange between vegetation canopy and canopy air, provide considerable uncertainty in subseasonal HW predictions. The type-1 (type-2) CNOP-P exhibits an underestimation (overestimation) of transpiration. Furthermore, it should be noted that the type-1 CNOP-P results in a substantial difference in soil moisture, a phenomenon that is demonstrated to be challenging to observe in the type-2 CNOP-P. The results indicate that understanding vegetation-atmosphere dynamics is crucial for improving subseasonal HW predictions. Jointly lowering soil-atmosphere and vegetation-atmosphere uncertainty can notably improve subseasonal HW prediction skills.

How to cite: Zhang, Q., Mu, M., Sun, G., and Dai, G.: Impact of Uncertainties in Land Surface Processes on Subseasonal Predictability of Heat Waves Onset Over the Yangtze River Valley, EGU General Assembly 2024, Vienna, Austria, 14–19 Apr 2024, EGU24-4245, https://doi.org/10.5194/egusphere-egu24-4245, 2024.

EGU24-4272 | Posters on site | AS1.3

Verifications of Week-1 to Week-4 Tropical Cyclone Forecasts in the Western North Pacific from the ECMWF 46-Day Ensemble 

Hsiao-Chung Tsai, Han-Yu Hsu, Tzu-Ting Lo, and Meng-Shih Chen

This study uses the ECMWF 46-day ensemble to evaluate the subseasonal forecasts of tropical cyclones (TCs) in the western North Pacific, including TC formations, tracks, intensity, and precipitation forecasts. TC formations and the subsequent tracks are objectively detected in both real-time forecasts and also the 20-year ECMWF reforecasts. Additionally, a spatial-temporal track clustering technique is utilized to group similar vortex tracks in the 101-member real-time forecasts for operational application. The forecast verification focuses on evaluating the influence of large-scale environmental factors on TC forecast skills during weeks 1-4, such as the Western North Pacific Summer Monsoon (WNPSM), Madden Julian Oscillation (MJO), and Boreal Summer Intraseasonal Oscillation (BSISO). The Precision-Recall (PR) curve is used to represent the imbalanced TC data instead of the Receiver Operating Characteristic (ROC) curve. Better TC forecast skills are observed if model initialized on MJO Phases 6 and 7 for the week-1 forecasts, and on MJO Phases 4 and 5 for the weeks 2 and 3 forecasts. Also, TC forecast skills are better if the cumulative percentage of the WNPSM index (Wang et al. 2001) is larger than 60%. This study also investigats the TC precipitation forecast skill around Taiwan area.

The evaluation results obtained from this study has been integrated into the TC Tracker 2.0 system developed by Central Weather Administration (CWA). The system can generate a "Subseasonal TC Threat Potential Forecast" product to assist in disaster mitigation and water resources management for the Water Resources Agency. More details about the subseasonal TC forecast verifications and applications will be presented in the meeting

How to cite: Tsai, H.-C., Hsu, H.-Y., Lo, T.-T., and Chen, M.-S.: Verifications of Week-1 to Week-4 Tropical Cyclone Forecasts in the Western North Pacific from the ECMWF 46-Day Ensemble, EGU General Assembly 2024, Vienna, Austria, 14–19 Apr 2024, EGU24-4272, https://doi.org/10.5194/egusphere-egu24-4272, 2024.

EGU24-4665 | Orals | AS1.3 | Highlight

Evaluating Real-time Subseasonal to Seasonal Tropical Cyclone Prediction 

Xiaochun Wang and Frederic Vitart

The real-time WWRP/WCRP Subseasonal to Seasonal (S2S) Prediction Project Phase 2 database was used to evaluate the prediction skill of tropical cyclone from eleven forecasting systems for the North Western Pacific. The variable introduced to evaluate S2S tropical cyclone prediction is daily tropical cyclone probability, which is the occurrence probability of tropical cyclone within 500 km in one day. Using such a definition, the occurrence of tropical cyclone is a dichotomous event. The skill of S2S tropical cyclone prediction can be evaluated using debiased Brier Skill Score, which is the traditional Brier Skill Score with impact of forecast ensemble size removed. Sensitivity tests were conducted to analyze the influence of difference in temporal window and radius in the definition of daily tropical cyclone probability. It is demonstrated that though the daily tropical cyclone probability would vary with a changed radius and temporal window, the debiased Briere Skill Score does not change much since it is related with the ratio of mean error of model forecast and the mean error of a reference climatological forecast. The robustness of the prediction skill indicates the suitability of using the daily tropical cyclone probability and debiased Brier Skill Score to measure tropical cyclone prediction skill at S2S timescale. Compared with the prediction skill of the S2S Prediction Project Phase 1, the real-time S2S tropical cyclone prediction is improved for some forecast systems. Some early results by combining multi-model tropical cyclone forecasts to improve tropical cyclone prediction will also be presented.

How to cite: Wang, X. and Vitart, F.: Evaluating Real-time Subseasonal to Seasonal Tropical Cyclone Prediction, EGU General Assembly 2024, Vienna, Austria, 14–19 Apr 2024, EGU24-4665, https://doi.org/10.5194/egusphere-egu24-4665, 2024.

EGU24-4955 | ECS | Posters on site | AS1.3

Subseasonal Predictability of Early and Late Summer Rainfall Over East Asia 

Xiaojing Li

Considering the significant differences in the rainfall characteristics over East Asia between the early [May–June (MJ)] and late [July–August (JA)] summer, this study investigates the subseasonal predictability of the rainfall over East Asia in early and late summer, respectively. Distinctions are obvious for both the spatial distribution of the prediction skill and the most predictable patterns, that is, the leading pattern of the average predictable time (APT1) between the MJ and JA rainfall. Further analysis found that the distinct APT1s of MJ and JA rainfall are attributable to their different predictability sources. The predictability of the MJ rainfall APT1 is mainly from the boreal intraseasonal oscillation signal, whereas that of the JA rainfall APT1 is provided by the Pacific–Japan teleconnection pattern. This study sheds light on the temporal variation of predictability sources of summer precipitation over East Asia, offering a possibility to improve the summer precipitation prediction skill over East Asia through separate predictions for early and late summer, respectively.

How to cite: Li, X.: Subseasonal Predictability of Early and Late Summer Rainfall Over East Asia, EGU General Assembly 2024, Vienna, Austria, 14–19 Apr 2024, EGU24-4955, https://doi.org/10.5194/egusphere-egu24-4955, 2024.

Summer monsoon precipitation over the Bay of Bengal (BoB) has pronounced intraseasonal variability (ISV), which has a close relationship to the local intraseasonal sea surface temperature (SST). Before heavy precipitation, intraseasonal SST in the BoB often has a warm anomaly and propagates northward, which drives the atmosphere and tends to trigger the convection. Besides the local air-sea interaction, the ISV of SST in the Arabian Sea (AS) also has an effect on the precipitation over the BoB. Results show that a prominent heavy precipitation usually occurs when the warm intraseasonal SST anomaly appears early in the AS and moves northward prior to that emerges in the BoB. The warm SST anomaly in the AS affects the sea level pressure and then trigger a southwestly wind anomaly in the center of AS. This wind anomaly promotes the wind convergence moving northward from the southern tip of Indian peninsula to the north India and northern BoB, which directly influence the vertical moisture advection and finally the precipitation. Understanding this process will be helpful to improve the predictive skill of the ISVs during the Indian Summer Monsoon.

How to cite: Xi, J.: Influence of Intraseasonal Variability of Sea Surface Temperature in the Arabian Sea on the Summer Monsoon Precipitation Over the Bay of Bengal, EGU General Assembly 2024, Vienna, Austria, 14–19 Apr 2024, EGU24-5422, https://doi.org/10.5194/egusphere-egu24-5422, 2024.

EGU24-6229 | Orals | AS1.3

Decadal variability of the extratopical response to the MJO: AMV and PDO modulation in the UKESM climate model 

Adrian Matthews, Daniel Skinner, and David Stevens

The extratropical response to the Madden-Julian Oscillation (MJO) is modulated by two prominent modes of low-frequency sea surface temperature (SST) variability: the Atlantic Multidecadal Variability (AMV) and the Pacific Decadal Oscillation (PDO). Utilizing the UK Earth System Model (UKESM) 1100 year pre-industrial control simulation from CMIP6, this study offers a unique opportunity to explore decadal variability with an extensive dataset, surpassing the limitations of previous studies which focussed on reanalysis products.

The results underscore a statistically significant influence of both AMV and PDO on the extratropical response across all MJO phases. Non-linear interactions between the MJO teleconnection and SST forcing are observed prominently in the modification of the response to MJO phase 6 (enhanced convection over the western Pacific), with AMV+ and PDO+ background states amplifying distinct teleconnection patterns, notably the negative North Atlantic Oscillation (NAO-) and the deepened Aleutian Low responses, respectively. These changes are greater in magnitude than would be expected from the linear superposition of the individual atmospheric responses to the SST mode and the MJO. The amplification of the MJO phase 6 teleconnection to the North Atlantic aligns with prior research based on ERA5 reanalysis data.

While modulation of the response to MJO phase 3 (enhanced convection over the eastern Indian Ocean) is evident, it is less pronounced compared to phase 6, and the mechanisms via which it acts are less clear. Intriguingly, alterations in the teleconnection, such as a weaker Aleutian Low during PDO+, contradict the anticipated modulation. Since MJO phase 3 and PDO+ tend to weaken and strengthen the Aleutian Low, respectively, it would be reasonable to expect that these effects would cancel. Instead, the weakening of the Low after MJO phase 3 is increased during PDO+.

A possible mechanism for the modulation of the teleconnections is a linear superposition of Rossby wave modes excited by the MJO, contingent upon the SST state. In the case of MJO phase 6, this corresponds to an amplification of the existing modes, and hence of the expected response. For MJO phase 3, however, there is an indication that other Rossby wave modes may also be excited in certain SST states, leading to interference which is out of phase with the primary response.

Acknowledging the limitations of observational and reanalysis datasets, this study underscores the pivotal role of climate models in the effective study of decadal and multi-decadal variability. Importantly, the study has significant implications for extratropical forecasting over the coming decades. The modulation of the MJO teleconnection by AMV and PDO suggests modifications in predictability, crucial for refining forecasting techniques. Furthermore, these results provide a contextual foundation for studies examining MJO teleconnections in future climates, enabling a more accurate dissection of responses influenced by internal and anthropogenically forced variability.

How to cite: Matthews, A., Skinner, D., and Stevens, D.: Decadal variability of the extratopical response to the MJO: AMV and PDO modulation in the UKESM climate model, EGU General Assembly 2024, Vienna, Austria, 14–19 Apr 2024, EGU24-6229, https://doi.org/10.5194/egusphere-egu24-6229, 2024.

EGU24-6452 | Posters on site | AS1.3

Local and remote sources of error inMJO forecasts in the Navy ESPC  

Stephanie Rushley, Matthew Janiga, and Carolyn Reynolds

The Navy Earth System Prediction Capability (ESPC) is the Navy’s coupled ocean-atmosphere-sea ice model.  The current version of the Navy ESPC has 16 ensemble members and been operational since August 2020. The Navy ESPC has known biases in Madden-Julian Oscillation (MJO), which has a too strong amplitude and too fast propagation speed. During boreal winter, the MJO in the Navy ESPC is too strong due to biases in the vertical motion, which supports larger vertical moisture advection.  The MJO is too strong in this season due to excessive evaporation in the western Pacific supporting moistening to the east of the MJO convective center.  In this study, we examine the boreal winter MJO in the operational Navy ESPC ensemble.  We use process oriented diagnostics to explore the local and remote sources of biases that drive good and poor MJO forecasts. 

MJO forecasts are split into those that are well predicted and those that are poorly predicted.  Individual MJO events are tracked following Chikira (2014), using Hovmöllers of MJO filtered OLR averaged between 10N and 10S.  The MJO forecast performance is determined by comparing the forecasted MJO to the observed MJO based on the magnitude of the maximum amplitude of the MJO, the phase speed, duration of the event, and the location of the MJO convection.  Using the moisture mode framework, we examine the maintenance and propagation of moisture anomalies to identify how the local and remote sources of error affect MJO skill.  We use a moisture budget analysis to diagnose and understand the difference between the forecasts that performed well and those that performed poorly.  Additionally, we examine the effects that these forecast errors in the MJO have on extratropical cyclones, surface winds, and clouds in the Navy ESPC and how biases in the extratropics affect the skill of MJO-teleconnections.

How to cite: Rushley, S., Janiga, M., and Reynolds, C.: Local and remote sources of error inMJO forecasts in the Navy ESPC , EGU General Assembly 2024, Vienna, Austria, 14–19 Apr 2024, EGU24-6452, https://doi.org/10.5194/egusphere-egu24-6452, 2024.

EGU24-6688 | Orals | AS1.3

Sources of S2S and MJO predictability 

Chidong Zhang

One main justification for subseasonal-to-seasonal (S2S) prediction is its identified sources of predictability. These sources include slowly varying phenomena, such as the MJO, stratospheric conditions, upper-ocean heat content, soil moisture, and sea ice. In practice, however, these presumed sources of S2S predictability have become the main targets of S2S prediction. For example, predicting the MJO, especially its propagation over the Indo-Pacific Maritime Continent, has been challenging. This raises a fundamental question: What are the predictability sources of the MJO? For global coupled prediction models, the primary sources of predictability are initial conditions and the governing laws. It is unclear, however, what elements in the initial conditions are more important to MJO prediction than others. It can be argued that the current practice of initializing forecasts using a single state of the system may not be optimal. Embedded initial conditions may provide an additional source of predictability that has yet to be fully explored.

How to cite: Zhang, C.: Sources of S2S and MJO predictability, EGU General Assembly 2024, Vienna, Austria, 14–19 Apr 2024, EGU24-6688, https://doi.org/10.5194/egusphere-egu24-6688, 2024.

EGU24-7386 | Posters on site | AS1.3 | Highlight

Weather and Climate conditions over the Arctic and mid-latitude regions affecting air quality 

Jeong-Min Park, Dasom Lee, Kwanchul Kim, Seong-min Kim, Gahye Lee, and Kwon Ho Lee

Recently, it has been noticed that weather and climate changes over the Arctic and mid-latitude regions may have influenced the particulate matter concentrations and haze over East Asia. Among the various weather and climate conditions and climate indices could be an important factor in affecting variation of particulate matter (PM) concentrations. In this study, we examined the long-term changes in the sea ice cover, soil moisture, near-surface temperature and its link with the lower atmospheric circulation over Arctic and mid-latitude from 1950 to 2022, using modern reanalysis datasets. Long-term analyses show negative trends in sea ice cover over the Arctic and positive trends in near-surface temperature and SST, implying atmospheric stagnant and variation of PM concentration. Additionally, climate indices, related to teleconnection between the Arctic region and mid-latitude, co-related with understanding air quality. Based on climate indices, we have developed the air quality prediction model for reflecting variations in weather and climate conditions. Therefore, the findings in this study can likely be used for actual prediction systems based on long-term weather measurement datasets over the Arctic region.

Acknowledgment: This research was supported by a National Research Foundation of Korea Grant from the Korean Government (MSIT ; the Ministry of Science and ICT) (NRF- 2023M1A5A1090715).

How to cite: Park, J.-M., Lee, D., Kim, K., Kim, S., Lee, G., and Lee, K. H.: Weather and Climate conditions over the Arctic and mid-latitude regions affecting air quality, EGU General Assembly 2024, Vienna, Austria, 14–19 Apr 2024, EGU24-7386, https://doi.org/10.5194/egusphere-egu24-7386, 2024.

EGU24-7705 | ECS | Orals | AS1.3 | Highlight

Soil enthalpy: an unheeded source of subseasonal predictability? 

Constantin Ardilouze and Aaron Boone

Accurate soil moisture initial conditions in dynamical subseasonal forecast systems are known to improve the temperature forecast skill regionally, through more realistic water and energy fluxes at the land-atmosphere interface. Recently, results from the GEWEX-GASS LS4P (Impact of initialized land temperature and snowpack on sub-seasonal to seasonal prediction) multi-model coordinated experiment have provided evidence of the primal contribution of the initial surface and subsurface soil temperature over the Tibetan Plateau for capturing a hemispheric scale atmopsheric teleconnection leading to improved subseasonal forecasts. Yet, both the soil temperature and water content are key components of the soil enthalpy and we hypothesize that properly initializing one of them without modifying the other in a consistent manner can alter the soil thermal equilibrium, thereby potentially reducing the benefit of land initial conditions on subsequent atmospheric forecasts. This study builds on the protocol of the above-mentioned multi-model experiment, by testing different land initialization strategies in an Earth system model. Results of this pilot study suggest that a better mass and energy balance in land initial conditions of the Tibetan Plateau triggers a wave train which propagates through the northern hemisphere mid-latitudes, resulting in an improved large scale circulation and temperature anomalies over multiple regions of the globe. While this study is based on a single case, it strongly advocates for enhanced attention towards preserving the soil energy equilibrium at initialization to make the most of land as a driver of atmospheric extended-range predictability.

How to cite: Ardilouze, C. and Boone, A.: Soil enthalpy: an unheeded source of subseasonal predictability?, EGU General Assembly 2024, Vienna, Austria, 14–19 Apr 2024, EGU24-7705, https://doi.org/10.5194/egusphere-egu24-7705, 2024.

EGU24-8357 | Orals | AS1.3

Quantifying sources of subseasonal prediction skill in CESM2 

Jadwiga Richter, Anne Glanville, Teagan King, Sanjiv Kumar, Stephen Yeager, Yanan Duan, Megan Fowler, Abby Jaye, Jim Edwards, Julie Caron, Paul Dirmeyer, Gokhan Danabasoglu, and Keith Oleson

Subseasonal prediction fills the gap between weather forecasts and seasonal outlooks. There is evidence that predictability on subseasonal timescales comes from a combination of atmosphere, land, and ocean initial conditions. Predictability from the land is often attributed to slowly varying changes in soil moisture and snowpack, while predictability from the ocean is attributed to sources such as the El Niño Southern Oscillation. Here we use a unique set of subseasonal reforecast experiments with CESM2 to quantify the respective roles of atmosphere, land, and ocean initial conditions on subseasonal prediction skill over land. These reveal that the majority of prediction skill for global surface temperature in weeks 3-4 comes from the atmosphere, while ocean initial conditions become important after week 4, especially in the Tropics. In the CESM2 subseasonal prediction system, the land initial state does not contribute to surface temperature prediction skill in weeks 3-6 and climatological land conditions lead to higher skill, disagreeing with our current understanding. However, land-atmosphere coupling is important in week 1. Subseasonal precipitation prediction skill also comes primarily from the atmospheric initial condition, except for the Tropics, where after week 4 the ocean state is more important.

How to cite: Richter, J., Glanville, A., King, T., Kumar, S., Yeager, S., Duan, Y., Fowler, M., Jaye, A., Edwards, J., Caron, J., Dirmeyer, P., Danabasoglu, G., and Oleson, K.: Quantifying sources of subseasonal prediction skill in CESM2, EGU General Assembly 2024, Vienna, Austria, 14–19 Apr 2024, EGU24-8357, https://doi.org/10.5194/egusphere-egu24-8357, 2024.

EGU24-8918 | ECS | Posters on site | AS1.3 | Highlight

Can Machine Learning Models be a Suitable Tool for Predicting Central European Cold Winter Weather on Subseasonal Timescales? 

Selina M. Kiefer, Sebastian Lerch, Patrick Ludwig, and Joaquim G. Pinto

For many practical applications, e.g. agricultural planning, skillful weather predictions on the subseasonal timescale (2-4 weeks in advance) are key for making sensible decisions. Since traditional numerical weather prediction (NWP) models are often not capable of delivering such forecasts, we use an alternative forecasting approach combining both, physical knowledge and statistical models. Selected meteorological variables from ERA-5 reanalysis data are used as predictors for wintertime Central European mean 2-meter temperature and the occurrence of cold wave days at lead times of 14, 21 and 28 days. The forecasts are created by Quantile Regression Forests in case of continuous temperature values and Random Forest Classifiers in case of binary occurrence of cold wave days. Both model types are evaluated for the winters 2000/2001 to 2019/2020 using the Continuous Ranked Probability Skill Score for the continuous forecasts and the Brier Skill Score for the binary forecasts. As a benchmark model, a climatological ensemble obtained from E-OBS observational data is considered. We find that the used machine learning models are able to produce skillful weather forecasts on all tested lead times. As expected, the skill depends on the exact winter to be forecasted and generally decreases for longer lead times but is still achieved for individual winters and in the 20-winter mean at 28 days lead time. Since machine learning models are often subject to a lack of interpretability and thus considered to be less trustworthy, we apply Shapley Additive Explanations to gain insight into the most relevant predictors of the models’ predictions. The results suggest that both Random-Forest based models are capable of learning physically known relationships in the data. This is, besides the capability of producing skillful forecasts on the subseasonal timescale, a selling point of the combination of physical knowledge and statistical models. Finally, we compare the skill of our statistical models to subseasonal state-of-the-art NWP forecasts.

How to cite: Kiefer, S. M., Lerch, S., Ludwig, P., and Pinto, J. G.: Can Machine Learning Models be a Suitable Tool for Predicting Central European Cold Winter Weather on Subseasonal Timescales?, EGU General Assembly 2024, Vienna, Austria, 14–19 Apr 2024, EGU24-8918, https://doi.org/10.5194/egusphere-egu24-8918, 2024.

EGU24-9510 | ECS | Orals | AS1.3

Stratospheric impact on subseasonal forecast uncertainty in the Northern extratropics  

Jonas Spaeth, Philip Rupp, Hella Garny, and Thomas Birner

Extreme events of the stratospheric polar vortex can modulate subsequent surface weather at subseaonal to seasonal (S2S) timescales. Moreover, they are considered to form windows of opportunity for tropospheric forecasting. This study aims to improve understanding of how the canonical surface response of polar vortex events translates into modulated surface predictability. 

First, we confirm that in the ECMWF extended-range prediction model, the mean signal of weak (strong) polar vortex events projects onto a negative (positive) phase of the North Atlantic Oscillation. The associated equatorward (poleward) shift of the eddy-driven jet then enhances or suppresses synoptic variability in specific regions. By constructing a leadtime, seasonal and model version-dependent climatology of forecast ensemble spread, we link these regions to anomalous forecast uncertainty. For example, sudden stratospheric warmings (SSWs) are followed by a southerly jet shift, which translates into suppressed Rossby wave breaking over Northern Europe, resulting in anomalously high forecast confidence in that region.

In general, both signatures in the mean and spread can contribute to predictability. However, when forecasts are compared to reanalyses, they manifest differently in different skill scores, such as the Root-Mean-Squared Error or the Continuously Ranked Probability Skill Score. We therefore discuss how separate consideration of anomalies in the ensemble mean and ensemble spread may aid to interpret predictability following polar vortex events.

Finally, we apply the diagnostics also to tropical teleconnections. We find indications that windows of forecast opportunity might be dominated by stratospheric polar vortex variability over the Atlantic and by ENSO variability over the Pacific.

How to cite: Spaeth, J., Rupp, P., Garny, H., and Birner, T.: Stratospheric impact on subseasonal forecast uncertainty in the Northern extratropics , EGU General Assembly 2024, Vienna, Austria, 14–19 Apr 2024, EGU24-9510, https://doi.org/10.5194/egusphere-egu24-9510, 2024.

EGU24-9738 | ECS | Orals | AS1.3

The dynamics of persistent hotspells in European summers 

Duncan Pappert, Alexandre Tuel, Dim Coumou, Mathieu Vrac, and Olivia Martius

Persistent summer weather can result in extreme events with enormous socio-economic impacts; recent summers in Europe have notably demonstrated this. The dynamics that cause persistent surface weather, as well as potential changes under anthropogenic climate change, are the subject of active scientific debate. Summertime atmospheric dynamics have nevertheless received less attention and we are far from obtaining a comprehensive understanding of the mechanisms involved in the formation of persistent weather conditions in summer. This study investigates the drivers responsible for making some surface extreme events more prone to being long-lasting than others.

Gaining a comprehensive understanding of such processes poses challenges due to the complex interactions of variables and fluxes operating at various timescales – from individual weather events (daily to weekly), to the general circulation of the atmosphere and its modulation by specific changes in sea surface temperature or soil moisture interactions (monthly, seasonal to interannual). Furthermore, studies are recently observing that persistent (quasi-stationary or recurrent) circulation patterns do not necessarily always translate to extreme events and persistence at the surface. This discussion extends to open questions about, such as the potential role of soil moisture preconditioning in extending the lifetime of these events.

Starting from an impact-based definition of persistent hot conditions for different European regions, we characterise their persistence by looking at the associated circulation patterns and surface conditions. Through a comparison of long-lived (persistent) and short-duration events, we discern dynamical differences and regional variations that shed light on the common ingredients and potential mechanisms influencing the persistence of extreme heat events in summer. We use the ERA5 reanalysis dataset to take advantage of its high spatiotemporal resolution and relatively long temporal coverage from the 1950s up to today.

A deeper investigation into the dynamical processes controlling persistent surface conditions over Europe in summer is essential for improved predictability at the sub-seasonal to seasonal (S2S) timescale, and it holds significant relevance for risk preparedness. Results from the study aim to advance the discussion on summer dynamics, weather persistence and climate impacts.

How to cite: Pappert, D., Tuel, A., Coumou, D., Vrac, M., and Martius, O.: The dynamics of persistent hotspells in European summers, EGU General Assembly 2024, Vienna, Austria, 14–19 Apr 2024, EGU24-9738, https://doi.org/10.5194/egusphere-egu24-9738, 2024.

EGU24-11457 | ECS | Posters on site | AS1.3 | Highlight

Deep Learning improved seasonal forecasts for the Blue Nile Basin 

Rebecca Wiegels, Luca Glawion, Julius Polz, Christian Chwala, Jan Niklas Weber, Tanja C. Schober, Christof Lorenz, and Harald Kunstmann

Seasonal predictions are essential in mitigating damage to people and nature as a result of climate change and extreme events by improving timely decision-making particularly for water and irrigation management. The newly constructed Grand Ethiopian Renaissance Dam, located in the Blue Nile (BN) Basin in Ethiopia at the border to Sudan, increases the urgency of optimized transboundary water management and improved seasonal predictions. However, the global seasonal forecasting systems have known limitations such as biases and drifts. Specifically at regional level, such as in the highlands of Ethiopia, the seasonal predictions need accurate post-processing. Recent developments have shown the large potential of Deep Learning (DL) applications to improve weather and climate predictions. The goal of this study is to improve the global seasonal forecasting system SEAS5 of ECMWF specifically for the BN Basin using DL approaches such as conventional Convolutional Neural Networks (CNN) or more advanced Adaptive Fourier Neural Operators (AFNO). We present first results for improving and downscaling SEAS5 global seasonal precipitation forecasts in the BN Basin with a particular emphasis on ensemble generation and calibration. The neural networks are trained with ERA5-Land-reanalysis data as a ground-truth, which has a higher resolution than SEAS5 (~9km compared to ~36km). This additional downscaling step allows us to consider the high variations in precipitation intensities in the Ethiopian highlands. The results show that the applied DL models have high potential in improving forecasting scores such as the continuous ranked probability skill score. They therefore allow for improved timely decision-making for water management in the transboundary BN Basin.

How to cite: Wiegels, R., Glawion, L., Polz, J., Chwala, C., Weber, J. N., Schober, T. C., Lorenz, C., and Kunstmann, H.: Deep Learning improved seasonal forecasts for the Blue Nile Basin, EGU General Assembly 2024, Vienna, Austria, 14–19 Apr 2024, EGU24-11457, https://doi.org/10.5194/egusphere-egu24-11457, 2024.

EGU24-11637 | ECS | Orals | AS1.3

Seasonal classification of North American weather regimes and their effect on extreme weather 

Swatah Snigdha Borkotoky, Kathleen Schiro, and Kevin Grise

Large-scale (synoptic to planetary), quasi-stationary circulation patterns in the atmosphere modulate the local weather dynamics from seasonal to sub-seasonal scale. These circulation patterns are known as Weather Regimes (WRs) and are a prominent feature in the midlatitudes. Most studies so far have focused on specific regions (such as the west coast of the United States or the European sector), and during a specific time of the year (namely the boreal winter season). Little work has been done on understanding the spatiotemporal characteristics (frequency, duration, and orientation) of seasonal North American WRs and how they affect local weather, especially in terms of extremes. This study aims to fill this knowledge gap with an investigation of North American WRs independently for all four seasons. Using a k-means clustering algorithm on daily geopotential height anomalies (de-seasonalized at monthly scale) at the 500-hPa pressure level, we identify five WRs in each of the four seasons across three independent reanalysis datasets: 1) MERRA2; 2) ERA5; and 3) NCEP-NCAR Reanalysis 1, for the period 1980-2022. Initial analysis shows that the spatial patterns of these WRs are robust but have non-trivial differences in the frequency and duration of occurrences across different reanalysis datasets. Additionally, we explore the occurrence of local extreme weather (precipitation and temperature) across the contiguous United States (CONUS) during the presence of these seasonal WRs. This study aims to improve the understanding of the seasonal to sub-seasonal variations of North American WRs and their influence on local extreme weather.

How to cite: Borkotoky, S. S., Schiro, K., and Grise, K.: Seasonal classification of North American weather regimes and their effect on extreme weather, EGU General Assembly 2024, Vienna, Austria, 14–19 Apr 2024, EGU24-11637, https://doi.org/10.5194/egusphere-egu24-11637, 2024.

EGU24-11702 | Orals | AS1.3

Attributing the role of sudden stratospheric warming events in surface weather extremes and their impacts: insights from SNAPSI Working Group 2 

William Seviour, Amy Butler, Chaim Garfinkel, and Peter Hitchcock and the SNAPSI Working Group 2

Sudden stratospheric warming events (SSWs)–in which the westerly polar vortex rapidly breaks down during winter–are  some of the most dramatic examples of dynamical variability in Earth’s atmosphere. It is now well established that SSWs are, on average, followed by large scale anomalies in near-surface circulation patterns, including an equatorward shift of the eddy driven jet that can persist for several months. These anomalies have, in turn, been related to an increase in the likelihood of a variety of high impact weather extremes. However, not all SSWs are followed by impactful weather events; equally, most winter weather extremes are not preceded by SSWs.

Here we will discuss the extent to which the occurrence of individual extreme weather events and their impacts can be attributed to polar stratospheric variability, drawing upon new results from the Stratospheric Nudging And Predictable Surface Impacts (SNAPSI) project (Working Group 2). This project involves a set of controlled subseasonal hindcast experiments, targeted at three SSW case study events, in which the stratospheric state can be either freely-evolving or nudged towards a climatological or observational state. These simulations reveal that the stratospheric evolution can more than double the regional risk of extreme temperature, rainfall, and snow events. We will go on to explore the attribution of the subsequent impacts of these weather extremes, including on the energy sector, health, and wildfires.  

How to cite: Seviour, W., Butler, A., Garfinkel, C., and Hitchcock, P. and the SNAPSI Working Group 2: Attributing the role of sudden stratospheric warming events in surface weather extremes and their impacts: insights from SNAPSI Working Group 2, EGU General Assembly 2024, Vienna, Austria, 14–19 Apr 2024, EGU24-11702, https://doi.org/10.5194/egusphere-egu24-11702, 2024.

EGU24-13143 | ECS | Posters on site | AS1.3

Land-Atmosphere Coupling Simulation and Its Role in Subseasonal-to-Seasonal Prediction 

Yuna Lim, Andrea Molod, Randal Koster, and Joseph Santanello

Land-atmosphere (L-A) coupling can significantly contribute to subseasonal-to-seasonal (S2S) prediction. During periods of strong L-A coupling, land-atmosphere feedbacks are expected to enhance the memory of the system and therefore also the predictability and prediction skill. This study aims to evaluate S2S prediction of ambient surface air temperature under conditions of strong versus weak L-A coupling in forecasts produced with NASA’s state-of-the-art GEOS S2S forecast system. Utilizing three L-A coupling metrics that together capture the connection between the soil and the free atmosphere, enhanced prediction skill for surface air temperature is observed for 3-4 week boreal summer forecasts across the eastern Great Plains when strong L-A coupling is detected at this lead by all three indices. The forecasts with strong L-A coupling in these “hot spot” regions exhibit warm and dry anomalies, signals that are well simulated in the model. Overall, this study provides insight into how better capturing relevant L-A coupling processes might improve prediction on subseasonal-to-seasonal timescales.

How to cite: Lim, Y., Molod, A., Koster, R., and Santanello, J.: Land-Atmosphere Coupling Simulation and Its Role in Subseasonal-to-Seasonal Prediction, EGU General Assembly 2024, Vienna, Austria, 14–19 Apr 2024, EGU24-13143, https://doi.org/10.5194/egusphere-egu24-13143, 2024.

EGU24-14585 | Posters on site | AS1.3 | Highlight

Improved long-range forecasts in South Korea through integrated forecast information 

OKYeon Kim, Seul-Hee Im, and Gaeun Kim

We explored the objective methods to improve long-range forecasting through enhanced forecast skills and integrated forecast information. The objective process we used in this study includes the selection of monitoring factors for more reliable monthly seasonal forecasts. Therefore, we chose the three most significant monitoring factors, i.e., ENSO, snow cover over Eurasia Continent and Arctic sea ice. We first examined the effect and response of the monitoring factors on the boreal winter temperature in South Korea. To improve the information related to the ENSO in seasonal forecasting, the impact of the tropical precipitation which act as an oceanic ENSO forcing was investigated. As one of the important monitoring factors for boreal winter temperature prediction, we analyzed the availability of the index describing austral Eurasian snow cover. We also analyzed the usage of Arctic conditions for predicting monthly temperature for boreal winter. We then investigated how well the effect and response of the factors are simulated in the operational seasonal models. Finally, the link between observation-based monitoring factors and model-based prediction is proposed for objective forecasting.

How to cite: Kim, O., Im, S.-H., and Kim, G.: Improved long-range forecasts in South Korea through integrated forecast information, EGU General Assembly 2024, Vienna, Austria, 14–19 Apr 2024, EGU24-14585, https://doi.org/10.5194/egusphere-egu24-14585, 2024.

EGU24-14626 | ECS | Orals | AS1.3

The impact of storm event likelihood on the forecast uncertainty over Europe at S2S time scales 

Philip Rupp, Hilla Afargan-Gerstman, Jonas Spaeth, and Thomas Birner

Weather forecasts at subseasonal-to-seasonal (S2S) timescales have little or no deterministic forecast skill in the troposphere. Individual ensemble members are uncorrelated and span a range of scenarios that are possible for the given set of boundary conditions. The uncertainty of such probabilistic forecasts is then determined by this range of scenarios – often quantified in terms of ensemble spread. For certain boundary conditions, the ensemble spread can be highly anomalous, with conditions associated with reduced spread sometimes referred to as „windows of opportunity“. Various dynamical processes can affect the ensemble spread within a given region, including extreme weather events present in individual members. For geopotential height forecasts over Europe, such extremes are mainly comprised of synoptic storms travelling on the North Atlantic storm track.

We use ECMWF re-forecasts from the S2S database to investigate the connection between storm characteristics and increases in ensemble spread in more detail. We find that the presence of storms in individual ensemble members at s2s time scales forms a major contribution to the geopotential height forecast uncertainty over Europe. In our study, we quantify the magnitude of this contribution and analyse the underlying dynamics, using both Eulerian and Lagrangian frameworks. We further show that certain atmospheric conditions, like various blocked weather regimes, are associated with reduced geopotential height ensemble spread over Europe due to changes in the North Atlantic storm track and associated anomalies in storm density. This connection sheds light on the occurrence of some “windows of opportunity” in the troposphere on S2S time scales.

How to cite: Rupp, P., Afargan-Gerstman, H., Spaeth, J., and Birner, T.: The impact of storm event likelihood on the forecast uncertainty over Europe at S2S time scales, EGU General Assembly 2024, Vienna, Austria, 14–19 Apr 2024, EGU24-14626, https://doi.org/10.5194/egusphere-egu24-14626, 2024.

EGU24-14701 | Posters virtual | AS1.3

Northern Hemisphere extratropical cyclone biases in ECMWF sub-seasonal forecasts 

Michael Sprenger, Dominik Büeler, and Heini Wernli

Extratropical cyclones influence midlatitude surface weather directly via precipitation and wind and indirectly via upscale feedbacks on the large-scale flow. Biases in cyclone frequency and characteristics in medium-range to sub-seasonal numerical weather prediction might therefore hinder exploiting the potential predictability on these timescales. We thus, for the first time, identify and track extratropical cyclones in 21 years (2000 – 2020) of sub-seasonal ensemble reforecasts from the European Centre for Medium-Range Weather Forecasts (ECMWF) in the Northern Hemisphere in all seasons. Overall, the reforecasts reproduce the climatology of cyclone frequency and life-cycle characteristics qualitatively well up to six weeks ahead. However, there are significant regional biases in cyclone frequency, which can result from a complex combination of biases in cyclone genesis (locally and upstream), size, location, lifetime, and propagation speed. Their magnitude is largest in summer, with the strongest deficit of cyclones of up to 15% in the North Atlantic, relatively large in spring, and smallest in winter and autumn. Moreover, the reforecast cyclones are too deep in both ocean basins during most seasons, although intensification rates are captured well. An overestimation of cyclone lifetime and differences between the native spatial resolutions of the reforecasts and the verification dataset might explain this intensity bias in some cases, but there are likely further so far unidentified processes involved. While the patterns of cyclone frequency and life cycle biases often appear in lead time weeks 1 and 2, their magnitudes typically grow further at sub-seasonal lead times and, in some cases, saturate in weeks 5 and 6 only. Most of the dynamical sources of these biases thus likely appear in the early medium range, but biases on longer timescales probably contribute to their further increase with lead time. Our study provides a useful basis to identify, better understand, and ultimately reduce biases in the large-scale flow and in surface weather in sub-seasonal weather forecasts. Given the considerable biases during summer, when sub-seasonal predictions of precipitation and surface temperature will become increasingly important, this season deserves particular attention for future research.

How to cite: Sprenger, M., Büeler, D., and Wernli, H.: Northern Hemisphere extratropical cyclone biases in ECMWF sub-seasonal forecasts, EGU General Assembly 2024, Vienna, Austria, 14–19 Apr 2024, EGU24-14701, https://doi.org/10.5194/egusphere-egu24-14701, 2024.

EGU24-15134 | Posters on site | AS1.3

How far in advance can we skillfully predict meteorological drought indices? 

Adel Imamovic, Dominik Büeler, Maria Pyrina, Vincent Humphrey, Christoph Spirig, Lionel Moret, and Daniela Domeisen

Given the limited skill of precipitation forecasts, the question arises to what extent ensemble forecasting systems can be used for early warning systems that require longer lead times, such as drought early warning. In this study, we use ECMWF’s IFS extended range forecasts, statistically downscaled to a 2 km grid encompassing Switzerland, to quantify the spatially and seasonally stratified predictability of several precipitation statistics. Consistent with existing analyses we find the predictability of extratropical instantaneous precipitation to be limited to week 1. However, when considering accumulated precipitation and the standardized precipitation index (SPI) forecasts, which is commonly used for drought management, the forecasts are skillful well into week 3. This extension in predictability horizon is attributed to the characteristic of accumulated precipitation, which is less sensitive to differences in timing of precipitating systems. The enhanced predictability of SPI enhances the utility of extended range forecasts for monthly drought forecasts. We discuss the practical applicability of these findings in the context of the new Swiss drought early warning and monitoring platform, planned for operations in 2025. Leveraging the enhanced predictability of SPI, this platform stands to benefit from our research outcomes, providing stakeholders with tools for proactive drought management and response strategies. 

How to cite: Imamovic, A., Büeler, D., Pyrina, M., Humphrey, V., Spirig, C., Moret, L., and Domeisen, D.: How far in advance can we skillfully predict meteorological drought indices?, EGU General Assembly 2024, Vienna, Austria, 14–19 Apr 2024, EGU24-15134, https://doi.org/10.5194/egusphere-egu24-15134, 2024.

EGU24-15210 | ECS | Posters on site | AS1.3

Domain adaptation for deep learning ENSO forecasts 

Miriam Rodriguez

In recent years, deep learning (DL) models have been shown to be able to make competitive forecasts of El Niño Southern Oscillation (ENSO). In most cases, due to the short observational record, the outputs of global circulation models (GCM) are used to train DL models. However, GCMs themselves show biases when modeling ENSO dynamics, such as the lack of phase-locking behavior, shifted precipitation trends, or missing El Niño - La Niña asymmetry. The biases of the GCMs are likely inherited by the DL models during pre-training, raising the question of how we can obtain unbiased DL ENSO models while pre-training on GCM output. In this study, we contend that a possible solution to correct these biases is to use well-established domain adaptation methods, which allow DL models to account for shifts in data distribution between training and validation data sets. In particular, we use a ConvLSTM network trained on CESM2 simulations where we first use a supervised objective to fine-tune our model to reanalysis data. Secondly, we employ test-time training to adapt our model for the domain shift between CESM2 and reanalysis data. This study serves as a first step toward comparing domain adaptation techniques for data-driven seasonal-to-annual DL models in a limited data regime.

How to cite: Rodriguez, M.: Domain adaptation for deep learning ENSO forecasts, EGU General Assembly 2024, Vienna, Austria, 14–19 Apr 2024, EGU24-15210, https://doi.org/10.5194/egusphere-egu24-15210, 2024.

EGU24-16022 | ECS | Posters on site | AS1.3

Global bias-corrected seasonal forecasts: Towards efficient and near real-time solutions 

Jan Niklas Weber, Christof Lorenz, Tanja Schober, Rebecca Wiegels, and Harald Kunstmann

Droughts, prolonged heat-waves, heavy precipitation events and large-scale flooding - the last years have demonstrated that global climate change is already hitting hard in many places of the Earth. This, inevitably, leads to increased water stress that requires a more sustainable and timely water management across scales. In particular, for optimized use of water resources for irrigation or hydropower generation, it is essential to know their expected availability in the coming months all over the world. This sub-seasonal to seasonal temporal domain, from weeks to months ahead, is addressed by seasonal forecasting systems such as SEAS5, developed by the European Centre for Medium-Range Weather Forecasts (ECMWF). These systems have the potential to provide essential data for enhancing water management practices. Without a bias correction though, the data exhibit a notable deficiency in skill. We have shown for several regions of the world that the “Bias Correction and Spatial Disaggregation” method (BCSD) can improve the forecasting skill substantially. Our next step is now to expand our efforts from the regional to the global scale, i.e., to provide the BCSD-forecasts for the entire globe. Here, the challenge lies in significantly reducing the computational demand for the bias correction: Presently, the BCSD requires several days to execute on a global scale. However, if such forecasts should be used as decision support, a timely provision is crucial.

We therefore present a method to achieve this task: The utilization of fixed Cumulative Distribution Functions (CDFs) rather than their recalculation for each pixel has the potential to enhance the computational efficiency of the bias correction. This approach not only significantly reduces the required data volume but also improves accessibility. To further achieve transferability of the system, we also demonstrate the performance of this system in a containerized environment. Our goal is to achieve a globally corrected SEAS5 forecasts within a time frame of ideally less than one day. With the provision of these bias-corrected data in near-real time, better estimations become available for direct utilization by water managers or as input for subsequent modeling processes.

How to cite: Weber, J. N., Lorenz, C., Schober, T., Wiegels, R., and Kunstmann, H.: Global bias-corrected seasonal forecasts: Towards efficient and near real-time solutions, EGU General Assembly 2024, Vienna, Austria, 14–19 Apr 2024, EGU24-16022, https://doi.org/10.5194/egusphere-egu24-16022, 2024.

The seasonal cycle (SC) anomalies of winter surface air temperature (SAT) over China mainly include three modes: consistent changes throughout the winter, inverse changes in the early and late winter, and opposite changes in the southern and northern China, respectively.  The positive EOF1 phase (i.e., uniformly warming throughout winter) can be attributed to global warming, especially in the North Atlantic and tropical Pacific. The EOF2 is mainly related to the dipole sea surface temperature (SST) pattern in the North Atlantic. In the early winter, the Rossby wave originating from North Atlantic strengthens Ural blocking high (UBH) and Siberian high (SH) in the early winter, resulting in cold SAT anomalies in most of China. While the large-scale zonal circulation with weakened SH has transformed SAT over China into a warm state in the later winter. The EOF3 can be attributed to the tripole SST in the North Atlantic and El Niño-like SST pattern in the tropical Pacific. In December, the Rossby wave train originating from the mid-latitudes of the North Atlantic Ocean enhances cold air activity in the Northern Hemisphere, causing cold SAT anomalies in Northeast China, while the dominating southerly winds in southern China cause warm SAT anomalies. In the late winter, the large-scale circulation resembles negative AO phase, resulting in the northerly winds and cold SAT anomalies in the northern China. Meanwhile, the anomalous anticyclonic circulation in the Northwest Pacific causes warm SAT anomalies in southern China. Therefore, the combined effects of tropical and extratropical SST should be considered when predicting interannual variability of winter SAT anomalies over China.

How to cite: Yu, M.: Diversity of seasonal cycle anomalies of surface air temperature in winter over China , EGU General Assembly 2024, Vienna, Austria, 14–19 Apr 2024, EGU24-16753, https://doi.org/10.5194/egusphere-egu24-16753, 2024.

EGU24-17318 | ECS | Posters on site | AS1.3

A barycenter-based approach for the multi-model ensembling of subseasonal forecasts 

Camille Le Coz, Alexis Tantet, Rémi Flamary, and Riwal Plougonven

Combining ensemble forecasts from different models into a multi-model ensemble (MME) have been shown to improve forecast skill at different time-scales, including the sub-seasonal to seasonal (S2S) one. Here, we investigate a new method to build such MME based on barycenter.

Recognizing ensemble forecasts as discrete probability distributions, we work directly in the probability distribution space. This allows us to use existing tools in this space, and in particular the concept of barycenter. The barycenter of a collection of distributions (or the ensemble forecasts here) is the distribution that best represents them, based on a given metric. The barycenter can thus be seen as the combination of these distributions, and so used to build a MME. We compare two barycenters based on different metrics: the L2 and the Wasserstein distances. The Wasserstein distance corresponds to the cost of the optimal transport between two distributions and has interesting properties in the distribution space. We compare it to the L2-barycenter which is in fact shown to be equivalent to the well-known “pooling” MME method (i.e. the concatenation of the different ensembles members). Another interesting point of the barycenters is that they allow you to give different weights to the models and so to easily build a weighted-MME. The weights have an important impact on the skill of the MMEs. We are thus optimizing the weights by learning them from the data using cross-validation on the forecasts.

The two barycenter-based MMEs are applied to the combination of the models from the S2S project’s database. Their performances are evaluated for the prediction of weekly 2m-temperature during European winter with respect to different metrics. As a proof of concept, we first start with the combination of two models, namely the European Centre Medium-Range Weather Forecasts (ECMWF) and the National Center for Environmental Prediction (NCEP) models. We show that the two MMEs are generally able to perform as well or better than both the single-models, but that the best combination method depends on the chosen metric. We then extend the barycenter approach to the combination of more models, of which we will discuss preliminary results.

How to cite: Le Coz, C., Tantet, A., Flamary, R., and Plougonven, R.: A barycenter-based approach for the multi-model ensembling of subseasonal forecasts, EGU General Assembly 2024, Vienna, Austria, 14–19 Apr 2024, EGU24-17318, https://doi.org/10.5194/egusphere-egu24-17318, 2024.

EGU24-17920 | Orals | AS1.3 | Highlight

Verification of seasonal forecast for facilitating agricultural applications 

Yuhei Takaya, Toshichika Iizumi, Yuji Masutomi, and Toshiyuki Nakaegawa

Seasonal forecasting has the potential to support agricultural activities by offering crop-yield forecasts and facilitating measures to mitigate weather-related damages. This study aims to enhance the application of subseasonal to seasonal (S2S) forecasts in agriculture by evaluating them through tailored verification methods that consider crop calendars and areas.

The verification employs the so-called 1-norm continuous ranked probability score (CRPS), which utilizes the absolute norm instead of a square to quantify forecast errors. While the 1-norm CRPS is not a proper score and does not suit for ensemble forecast verification, it offers an advantage in terms of user-friendliness. Specifically, the score is proportional to the expectation of the absolute error, and thus, it is easier to relate the outcomes of crop models under the assumption of linearity compared to other scores like the ordinal CRPS.

Crop regions and seasons for major commodity crops such as wheat, rice, and maize were identified using global datasets of crop yields and crop calendars. Using the crop calendar information, we can assess the within-season forecast performance in relation to crop growth stages globally. Reforecast data from seasonal forecasts archived by the EU-funded Copernicus Climate Change Service (C3S) were evaluated, allowing for a multi-model comparison of forecast skill. The presentation illustrates a set of example verification products targeted to the common commodity crops. A comprehensive overview of forecast skill for the target crops is anticipated to facilitate a dialogue between meteorological and agricultural experts, thereby enhancing the usability of the seasonal forecast.

How to cite: Takaya, Y., Iizumi, T., Masutomi, Y., and Nakaegawa, T.: Verification of seasonal forecast for facilitating agricultural applications, EGU General Assembly 2024, Vienna, Austria, 14–19 Apr 2024, EGU24-17920, https://doi.org/10.5194/egusphere-egu24-17920, 2024.

EGU24-18260 | Posters on site | AS1.3

Improving daily-to-seasonal sea ice forecasts of the AWI coupled prediction system with sea-ice and ocean data assimilation and atmospheric large-scale wind nudging. 

Svetlana Loza, Marylou Athanase, Longjiang Mu, Jan Streffing, Antonio Sánchez-Benítez, Miguel Andrés-Martínez, Lars Nerger, Tido Semmler, Dmitry Sidorenko, and Helge Goessling

Predictive skills of coupled sea-ice/ocean and atmosphere models are limited by the chaotic nature of the atmosphere. Assimilation of observational information on ocean hydrography and sea ice allows to obtain a coupled-system state that provides a basis for subseasonal-to-seasonal ocean and sea-ice forecast (Mu et al., 2022). However, if the atmosphere is not additionally constrained, the quasi-random atmospheric states within an ensemble forecast lead to a fast divergence of the ocean and sea-ice states, degrading the system’s performance with respect to the sea ice forecasts. As reported previously, imposing an additional constraint by nudging large-scale winds to the ERA5 reanalysis data (Sánchez-Benítez et al., 2021; Athanase et al., 2022) improves predictive skills of the AWI Coupled Prediction System (AWI-CPS, Mu et al. 2022) with regard to sea ice drift (Losa et al., 2023). Here we provide results based on a much more extensive set of ensemble-based data assimilation experiments spanning the time period from 2002 to 2023 and a series of long forecast experiments over 2010 – 2023, initialized in four different seasons. We compare the performance of forecasts initialized from two sets of data assimilation experiments, with and without atmospheric wind nudging. The additional relaxation of the large-scale atmospheric circulation to the ERA5 reanalysis data for the initialization leads to reasonable atmospheric forecast skill on weather timescales: Despite the simple technique, the coarse resolution compared to NWP systems, and the limited optimization efforts, 10-day forecasts of the 500 hPa geopotential height are about as skillful as the best performing NWP forecasts were about 10 –15 years ago. Among other aspects, this leads to significantly improved subseasonal-to-seasonal sea-ice concentration and thickness forecasts.


Athanase, M., Schwager, M., Streffing, J., Andrés-Martínez, M., Loza, S., and Goessling, H.: Impact of the atmospheric circulation on the Arctic snow cover and ice thickness variability , EGU General Assembly 2022, Vienna, Austria, 23–27 May 2022, EGU22-5836, https://doi.org/10.5194/egusphere-egu22-5836, 2022.

Losa, S. N., Mu, L., Athanase, M., Streffing, J., Andrés-Martínez, M., Nerger, L., Semmler, T., Sidorenko, D., and Goessling, H. F.: Combining sea-ice and ocean data assimilation with nudging atmospheric circulation in the AWI Coupled Prediction System, EGU General Assembly 2023, Vienna, Austria, 24–28 Apr 2023, EGU23-14227, https://doi.org/10.5194/egusphere-egu23-14227, 2023.

Mu, L. , Nerger, L. , Streffing, J. , Tang, Q. , Niraula, B. , Zampieri, L., Loza, S. N. and Goessling, H. F. (2022): Sea‐Ice Forecasts With an Upgraded AWI Coupled Prediction System , Journal of Advances in Modeling Earth Systems, 14 (12) . doi: 10.1029/2022ms003176

Sánchez-Benítez, A. , Goessling, H. , Pithan, F. , Semmler, T. and Jung, T. (2022): The July 2019 European Heat Wave in a Warmer Climate: Storyline Scenarios with a Coupled Model Using Spectral Nudging , Journal of Climate, 35 (8), pp. 2373-2390 . doi: 10.1175/JCLI-D-21-0573.1

How to cite: Loza, S., Athanase, M., Mu, L., Streffing, J., Sánchez-Benítez, A., Andrés-Martínez, M., Nerger, L., Semmler, T., Sidorenko, D., and Goessling, H.: Improving daily-to-seasonal sea ice forecasts of the AWI coupled prediction system with sea-ice and ocean data assimilation and atmospheric large-scale wind nudging., EGU General Assembly 2024, Vienna, Austria, 14–19 Apr 2024, EGU24-18260, https://doi.org/10.5194/egusphere-egu24-18260, 2024.

EGU24-19908 | ECS | Posters on site | AS1.3 | Highlight

Improving sub-seasonal forecasting of East Asian monsoon precipitation with deep learning 

Zhou Jiahui and Fei Liu

Accurate subseasonal forecast of East Asian summer monsoon precipitation (EASM) is pivotal, impacting the livelihoods of billions. However, the proficiency of state-of-the-art subseasonal-to-seasonal (S2S) models in forecasting precipitation remains constrained. We developed a convolutional neural network regression model, harnessing the more reliably predicted atmospheric variables from dynamic models to enhance their forecast skills for precipitation. The outcomes of the CNN model are promising: a 12% increase in accuracy and a 10% reduction in RMSE for precipitation forecast at the lead time of one week. The predictive skill of dynamic models for atmospheric variables shows a significant correlation with the performance of the CNN model. Ablation experiments on various predictors reveal that xx is the most influential factor affecting the CNN model's performance.

How to cite: Jiahui, Z. and Liu, F.: Improving sub-seasonal forecasting of East Asian monsoon precipitation with deep learning, EGU General Assembly 2024, Vienna, Austria, 14–19 Apr 2024, EGU24-19908, https://doi.org/10.5194/egusphere-egu24-19908, 2024.

EGU24-20725 | ECS | Posters on site | AS1.3

A Parametric Model of Elliptic Orbits for Annual Evolutions of Northern Hemisphere Stratospheric Polar Vortex and Their Interannual Variability 

Michael Secor, Yueyue Yu, Jie Sun, Ming Cai, and Xinyue Luo

The year-to-year varying annual evolutions of the stratospheric polar vortex (SPV) have an important downward impact on the weather and climate from winter to summer and thus potential implications for seasonal forecasts. This study constructs a parametric elliptic orbit model for capturing the annual evolutions of mass-weighted zonal momentum at 60° N (MU) and total air mass above the isentropic surface of 400 K (M) over the latitude band of 60–90° N from 1 July 1979 to 30 June 2022. The elliptic orbit model naturally connects two time series of a nonlinear oscillator. As a result, the observed coupling relationship between MU and M associated with SPV as well as its interannual variations can be well reconstructed by a limited number of parameters of the elliptic orbit model. The findings of this study may pave a new way for short-time climate forecasts of the annual evolutions of SPV, including its temporal evolutions over winter seasons as well as the spring and fall seasons, and timings of the sudden stratospheric warming events by constructing its elliptic orbit in advance.

How to cite: Secor, M., Yu, Y., Sun, J., Cai, M., and Luo, X.: A Parametric Model of Elliptic Orbits for Annual Evolutions of Northern Hemisphere Stratospheric Polar Vortex and Their Interannual Variability, EGU General Assembly 2024, Vienna, Austria, 14–19 Apr 2024, EGU24-20725, https://doi.org/10.5194/egusphere-egu24-20725, 2024.

EGU24-20993 | ECS | Orals | AS1.3

Machine Learning Models Use Large Scale Signals to Forecast the MJO 

Lin Yao, Da Yang, James Duncan, Ashesh Kumar Chattopadhyay, Pedram Hassanzadeh, Wahid Bhimji, and Bin Yu

The Madden-Julian Oscillation (MJO) is a large-scale tropical phenomenon where fluctuations of clouds, rainfall, winds, and pressure propagate eastward around the globe every 30 to 90 days on average. The MJO has significant impacts on weather and climate both locally and globally. Despite its importance, forecasting the MJO remains challenging due to the limitations of traditional numerical and statistical methods. To address this, machine learning has emerged as a promising avenue for MJO forecasting (Martin et al. 2022, Silini et al. 2021, Delaunay and Christensen 2022). Apart from accurate forecasts emphasized in previous research, our study aims to get more physical insights: we build a predictive and interpretable convolution neural network (CNN) and unravel what tropical waves at which spatial scales are essential for MJO forecasting.

Our CNN model takes tropical reanalysis maps as input and predicts the MJO index, achieving forecast skills comparable to NCEP Climate Forecast System (CFSv2). This level of skill is state-of-art in interpretable neural networks. To understand what information is crucial to our MJO forecast, we decompose the output of each convolution layer into tropical waves at different zonal scales. We find that the CNN focuses on large-scale patterns whose zonal scale is above 2500 km. In fact, even when fed exclusively with large-scale features as input, the CNN achieves MJO forecasts akin to the skill of the original model. Furthermore, the CNN chooses to reconstruct large-scale features from input containing solely small-scale features instead of relying directly on small scales for forecasting. This reconstruction further emphasizes the critical role of large-scale patterns in MJO predictions.

In future research, we plan to perform a systematic analysis to evaluate the contribution of different tropical waves to MJO forecasting. We will also simplify the model architecture to facilitate better understanding. Additionally, we plan to incorporate more previous time steps as input memories to enhance forecast accuracy. This work represents a promising advance towards economic yet precise MJO forecasting.

How to cite: Yao, L., Yang, D., Duncan, J., Kumar Chattopadhyay, A., Hassanzadeh, P., Bhimji, W., and Yu, B.: Machine Learning Models Use Large Scale Signals to Forecast the MJO, EGU General Assembly 2024, Vienna, Austria, 14–19 Apr 2024, EGU24-20993, https://doi.org/10.5194/egusphere-egu24-20993, 2024.

The latest assessment report (AR6) of the Intergovernmental Panel on Climate Change includes a new element to climate research, i.e. the Interactive Atlas (IA), which is very useful for users from different sectors. As the new CMIP6 global climate model simulations use the brand-new SSP-scenarios paired with the RCP-scenarios, the latest climate change projections should be evaluated in order to update the regional and national adaptation strategies. Keeping this in mind we focused on Europe, with a special emphasis on Hungary in our study.

Our aim was to analyse the potential future changes of different temperature indices for Europe, in order to recognize spatial patterns and trends that may shape our climate in the second half of the 21st century. For this purpose, multi-model mean simulation data provided by the IPCC AR6 WG1 IA were downloaded on a monthly base. We chose two climate indices beside the mean temperature values, which represent temperature extremes, namely, the number of days with maximum temperature above 35 °C and the number of frost days (i.e. when daily minimum temperature is below 0 °C). We focused on the end of the 21st century (2081–2100) with also briefly considering the medium-term changes of the 2041–2060 period (both compared to the last two decades of the historical simulation period, i.e. 1995–2014 as the reference period). For both future periods we used all scenarios provided in the IA, namely, SSP1-2.6, SSP2-4.5, SSP3-7.0 and SSP5-8.5.

Several zonal and meridional segments over the continent were defined, where we analysed the projected changes of the indices. The zonal segments provide an insight on two different effects that may induce spatial differences between future regional changes. (i) Continentality can be recognized as an increasing effect from the western parts of the segment towards the east. (ii) Topography also appears as the influence of mountains, plains, and basins emerge. The meridional segments provide information about the north-to-south differences as well, as the effects of sea cover. The changes in the indices are plotted on diagrams representing the different months, where the differences in the scenarios are also shown. These diagrams are compared to their respective landscape profiles, furthermore, statistical parameters were calculated. In addition, a monotony index was defined as the cumulative direction of differences between the neighbouring grid cells and analysed within the study.

Our results show that in the changes of mean temperature, both the zonal location and sea cover will play a key role in forming spatial differences within Europe. However, for the extreme temperature indices, topography and continentality are likely to become more dominant than sea cover, while the zonal location remains an important factor. 

Acknowledgements: This work was supported by the Hungarian National Research, Development and Innovation Fund [grant numbers PD138023, K-129162], and the National Multidisciplinary Laboratory for Climate Change [grant number RRF-2.3.1-21-2022-00014]. 

How to cite: Divinszki, F., Kis, A., and Pongrácz, R.: Analysing the projected monthly changes of temperature-related climate indices over Europe using zonal and meridional segments based on CMIP6 data, EGU General Assembly 2024, Vienna, Austria, 14–19 Apr 2024, EGU24-389, https://doi.org/10.5194/egusphere-egu24-389, 2024.

EGU24-868 | ECS | Posters on site | CL4.3

Relationship of the predictability of North Pacific Mode and ENSO with predictability of PDO 

Jivesh Dixit and Krishna M. AchutaRao

PDO and ENSO are most prominent variability modes in the Pacific Ocean at decadal and interannual timescales respectively. Mutual independence between ENSO and PDO is questionable (Chen & Wallace, 2016). Linear combination of the first two orthogonal modes of SST variability in our Study Region (SR; 70oN - 20oS, 110oE - 90oW) i.e. mode 1 (interannual mode, we call it, IAM; ENSO like variability) and mode 2 (North Pacific Mode (NPM; Deser & Blackmon (1995)); a decadal mode) produces a PDO like variability (Chen & Wallace, 2016). It suggests that PDO is not independently hosted in the Pacific Ocean and can be represented by two linearly independent variability modes.

To produce credible and skillful climate information at multi-year to decadal timescales, Decadal Climate Prediction Project (DCPP), led by the Working Group on Subseasonal to Interdecadal Prediction (WGSIP), focuses on both the scientific and practical elements of forecasting climate by employing predictability research and retrospective analyses within the Coupled Model Intercomparison Project Phase 6 (CMIP6). Component A under DCPP experiments concentrates on hindcast experiments to examine the prediction skill of participating models with respect to actual observations.

As linear combination of  IAM and NPM in SR produces PDO pattern and timescales efficiently, we compared the  ability of DCPP-A hindcasts to predict  IAM, NPM, and  PDO. In this analysis we use output from 9 models (a total of 128 ensemble members), initialised every year from 1960 to 2010. To produce the prediction skill estimates.

At lead year 1 from initialisation, the prediction of NPM,  IAM and PDO is quite skillful as the models are initialised with observations. In subsequent years, skill of either IAM or NPM or both drop significantly and that leads to drop in skill of predicted PDO index. Both the deterministic estimates and probabilistic estimates of prediction skill for DCPP hindcast experiments suggest that the ability of hindcast experiments to predict NPM governs the prediction skill to predict PDO index.

Keywords: PDO, ENSO, NPM, CMIP6, DCPP, hindcast

References

Chen, X., & Wallace, J. M. (2016). Orthogonal PDO and ENSO indices. Journal of Climate, 29(10), 3883–3892. https://doi.org/10.1175/jcli-d-15-0684.1

Deser, C., & Blackmon, M. L. (1995). On the Relationship between Tropical and North Pacific Sea Surface Temperature Variations. Journal of Climate, 8(6), 1677–1680. https://doi.org/10.1175/1520-0442(1995)008<1677:OTRBTA>2.0.CO;2

How to cite: Dixit, J. and AchutaRao, K. M.: Relationship of the predictability of North Pacific Mode and ENSO with predictability of PDO, EGU General Assembly 2024, Vienna, Austria, 14–19 Apr 2024, EGU24-868, https://doi.org/10.5194/egusphere-egu24-868, 2024.

EGU24-1757 | Posters on site | CL4.3

Is the NAO signal-to-noise paradox exacerbated by severe winter windstorms? 

Lisa Degenhardt, Gregor C. Leckebusch, Adam A. Scaife, Doug Smith, and Steve Hardiman

The signal-to-noise paradox is known to be a limitation in multiple seasonal and decadal forecast models where the model ensemble mean predicts observations better than individual ensemble members. This ‘paradox’ occurs for different parameters, like the NAO, temperature, wind speed or storm counts in multiple seasonal and decadal forecasts. However, investigations have not yet found the origin of the paradox. First hypotheses are that weak ocean – atmosphere coupling or a misrepresentation of eddy feedback in these models is responsible.

Our previous study found a stronger signal-to-noise error in windstorm frequency than for the NAO despite highly significant forecast skill. In combination with the underestimation of eddy feedback in multiple models, this led to the question: Might the signal-to-noise paradox over the North-Atlantic be driven by severe winter windstorms?

To assess this hypothesis, the signal-to-noise paradox is investigated in multiple seasonal forecast suites from the UK Met Office, ECMWF, DWD and CMCC. The NAO is used to investigate the changes in the paradox depending on the storminess of the season. The results show a significant increase of the NAO-signal-to-noise error in stormy seasons in GloSea5. Other individual models like the seasonal model of the DWD or CMCC do not show such a strong difference. A multi-model approach, on the other hand, shows the same tendency as GloSea5. Nevertheless, these model differences mean that more hindcasts are needed to conclusively demonstrate that the signal-to-noise error arises from Atlantic windstorms.

How to cite: Degenhardt, L., Leckebusch, G. C., Scaife, A. A., Smith, D., and Hardiman, S.: Is the NAO signal-to-noise paradox exacerbated by severe winter windstorms?, EGU General Assembly 2024, Vienna, Austria, 14–19 Apr 2024, EGU24-1757, https://doi.org/10.5194/egusphere-egu24-1757, 2024.

EGU24-1940 | ECS | Orals | CL4.3

Study of the Decadal Predictability of Mediterranean Sea Surface Temperature Based on Observations 

Xiaoqin Yan, Youmin Tang, and Dejian Yang

Sea surface temperature (SST) changes in the Mediterranean Sea have profound impacts on both the Mediterranean regions and remote areas. Previous studies show that the Mediterranean SST has significant decadal variability that is comparable with the Atlantic multidecadal variability (AMV). However, few studies have discussed the characteristics and sources of the decadal predictability of Mediterranean SST based on observations. Here for the first time we use observational datasets to reveal that the decadal predictability of Mediterranean SST is contributed by both external forcings and internal variability for both annual and seasonal means, except that the decadal predictability of the winter mean SST in the eastern Mediterranean is mostly contributed by only internal variability. Besides, the persistence of the Mediterranean SST is quite significant even in contrast with that in the subpolar North Atlantic, which is widely regarded to have the most predictable surface temperature on the decadal time scale. After the impacts of external forcings are removed, the average prediction time of internally generated Mediterranean SST variations is more than 10 years and closely associated with the multidecadal variability of the Mediterranean SST that is closely related to the accumulated North Atlantic Oscillation forcing.

How to cite: Yan, X., Tang, Y., and Yang, D.: Study of the Decadal Predictability of Mediterranean Sea Surface Temperature Based on Observations, EGU General Assembly 2024, Vienna, Austria, 14–19 Apr 2024, EGU24-1940, https://doi.org/10.5194/egusphere-egu24-1940, 2024.

EGU24-3190 | ECS | Orals | CL4.3

Seasonal forecasting of the European North-West shelf seas: limits of winter and summer sea surface temperature predictability 

Jamie Atkins, Jonathan Tinker, Jennifer Graham, Adam Scaife, and Paul Halloran

The European North-West shelf seas (NWS) support economic interests and provide environmental services to several adjacent populous countries. Skilful seasonal forecasts of the NWS would be useful to support decision making. Here, we quantify the skill of an operational large-ensemble ocean-atmosphere coupled dynamical forecasting system (GloSea), as well as a benchmark persistence forecasting system, for predictions of NWS sea surface temperature (SST) at 2-4 months lead time in winter and summer. We also identify sources of- and limits to NWS SST predictability with a view to what additional skill may be available in the future. We find that GloSea NWS SST skill is generally high in winter and low in summer. Persistence of anomalies in the initial conditions contributes substantially to predictability. GloSea outperforms simple persistence forecasts, by adding atmospheric variability information, but only to a modest extent. Where persistence is low – for example in seasonally stratified regions – both GloSea and persistence forecasts show lower skill. GloSea skill can be degradeded by model deficiencies in the relatively coarse global ocean component, which lacks a tidal regime and likely fails to properly fine-scale NWS physics. However, using “near perfect atmosphere” tests, we show potential for improving predictability of currently low performing regions if atmospheric circulation forecasts can be improved, underlining the importance of development of atmosphere-ocean coupled models for NWS seasonal forecasting applications.

How to cite: Atkins, J., Tinker, J., Graham, J., Scaife, A., and Halloran, P.: Seasonal forecasting of the European North-West shelf seas: limits of winter and summer sea surface temperature predictability, EGU General Assembly 2024, Vienna, Austria, 14–19 Apr 2024, EGU24-3190, https://doi.org/10.5194/egusphere-egu24-3190, 2024.

EGU24-4538 | ECS | Orals | CL4.3

Statistical downscaling of extremes in seasonal predictions - a case study on spring frosts for the viticultural sector 

Sebastiano Roncoroni, Panos Athanasiadis, and Silvio Gualdi

Spring frost events occurring after budburst of grapevines can damage new shoots, disrupt plant growth and cause large economic losses to the viticultural sector. Frost protection practices encompass a variety of vineyard management actions across timescales, from seasonal to decadal and beyond. The cost-effectiveness of such measures depends on the availability of accurate predictions of the relevant climate hazards at the appropriate timescales.

In this work, we present a statistical downscaling method which predicts variations in the frequency of occurrence of spring frost events in the important winemaking region of Catalunya at the seasonal timescale. The downscaling method exploits the seasonal predictability associated with the predictable components of the atmospheric variability over the Euro-Atlantic region, and produces local predictions of frost occurrence at a spatial scale relevant to vineyard management.

The downscaling method is designed to address the specific needs highlighted by a representative stakeholder in the local viticultural sector, and is expected to deliver an actionable prototype climate service. The statistical procedure is developed in perfect prognosis mode: the method is trained with large-scale reanalysis data against a high-resolution gridded observational reference, and validated against multi-model seasonal hindcast predictions.

Our work spotlights the potential benefits of transferring climate predictability across spatial scales for the design and provision of usable climate information, particularly regarding extremes.

How to cite: Roncoroni, S., Athanasiadis, P., and Gualdi, S.: Statistical downscaling of extremes in seasonal predictions - a case study on spring frosts for the viticultural sector, EGU General Assembly 2024, Vienna, Austria, 14–19 Apr 2024, EGU24-4538, https://doi.org/10.5194/egusphere-egu24-4538, 2024.

EGU24-4873 | ECS | Orals | CL4.3

Why does the Signal-to-Noise Paradox Exist in Seasonal Climate Predictability? 

Yashas Shivamurthy, Subodh Kumar Saha, Samir Pokhrel, Mahen Konwar, and Hemant Kumar Chaudhari

Skillful prediction of seasonal monsoons has been a challenging problem since the 1800s. However, significant progress has been made in Indian summer monsoon rainfall prediction in recent times, with skill scores reaching 0.6 and beyond, surpassing the estimated predictability limits. This phenomenon leads to what is known as the “Signal-to-noise Paradox.” To investigate this paradox, we utilized 52 ensemble member hindcast runs spanning 30 years.

Through the application of ANOVA and Mutual Information methods, we estimate the predictability limit globally. Notably, for the boreal summer rainfall season, the Indian subcontinent exhibited the paradox, among several other regions, while the Equatorial Pacific region, despite demonstrating high prediction skill, does not have the Signal-to-Noise paradox. We employed a novel approach to understand how sub-seasonal variability and their projection in association with predictors are linked to the paradoxical behavior of seasonal prediction skill.

We propose a new method to estimate predictability limits that is free from paradoxical phenomena and shows much higher seasonal predictability. This novel method provides valuable insights into the complex dynamics of monsoon prediction, thereby creating opportunities for expanded research and potential improvements in seasonal forecasting skill in the coming years.

How to cite: Shivamurthy, Y., Saha, S. K., Pokhrel, S., Konwar, M., and Chaudhari, H. K.: Why does the Signal-to-Noise Paradox Exist in Seasonal Climate Predictability?, EGU General Assembly 2024, Vienna, Austria, 14–19 Apr 2024, EGU24-4873, https://doi.org/10.5194/egusphere-egu24-4873, 2024.

EGU24-7134 | ECS | Orals | CL4.3

Towards the Predictability of Compound Dry and Hot Extremes through Complexity Science 

Ankit Agarwal and Ravikumar Guntu

Compound Dry and Hot Extremes (CDHE) have an adverse impact on socioeconomic factors during the Indian summer monsoon, and a future exacerbation is anticipated. The occurrence of CDHE is influenced by teleconnections, which play a crucial role in determining its likelihood on a seasonal scale. Despite the importance, there is a lack of studies unravelling the teleconnections of CDHE in India. Previous investigations specifically focused on teleconnections between precipitation, temperature, and climate indices. Hence, there is a need to unravel the teleconnections of CDHE. This study presents a framework combining event coincidence analysis (ECA) with complexity science. ECA evaluates the synchronization between CDHE and climate indices. Subsequently, complexity science is utilized to construct a driver-CDHE network to identify the critical drivers of CDHE. A logistic regression model is employed to evaluate the proposed drivers' effectiveness. The occurrence of CDHE exhibits distinct patterns from July to September when considering intra-seasonal variability. Our findings contribute to the identification of drivers associated with CDHE. The primary driver for Eastern, Western India and Central India is the indices in the Pacific Ocean and Atlantic Ocean, respectively, followed by the indices in the Indian Ocean. These identified drivers outperform the traditional Niño 3.4-based predictions. Overall, our results demonstrate the effectiveness of integrating ECA and complexity science to enhance the prediction of CDHE occurrences.

How to cite: Agarwal, A. and Guntu, R.: Towards the Predictability of Compound Dry and Hot Extremes through Complexity Science, EGU General Assembly 2024, Vienna, Austria, 14–19 Apr 2024, EGU24-7134, https://doi.org/10.5194/egusphere-egu24-7134, 2024.

EGU24-8028 | ECS | Orals | CL4.3

Constraining near to mid-term climate projections by combining observations with decadal predictions 

Rémy Bonnet, Julien Boé, and Emilia Sanchez

The implementation of adaptation policies requires seamless and relevant information on the evolution of the climate over the next decades. Decadal climate predictions are subject to drift because of intrinsic model errors and their skill may be limited after a few years or even months depending on the region. Non-initialized ensembles of climate projections have large uncertainties over the next decades, encompassing the full range of uncertainty attributed to internal climate variability. Providing the best climate information over the next decades is therefore challenging. Recent studies have started to address this challenge by constraining uninitialized projections of sea surface temperature using decadal predictions or using a storyline approach to constrain uninitialized projections of the Atlantic Meridional Overturning Circulation using observations. Here, using a hierarchical clustering method, we select a sub-ensemble of non-initialized climate simulations based on their similarity to observations. Then, we try to further refine this sub-ensemble of trajectories by selecting a subset based on its consistency with decadal predictions. This study presents a comparison of these different methods for constraining surface temperatures in the North-Atlantic / Europe region over the next decades, focusing on CMIP6 non-initialized simulations.

How to cite: Bonnet, R., Boé, J., and Sanchez, E.: Constraining near to mid-term climate projections by combining observations with decadal predictions, EGU General Assembly 2024, Vienna, Austria, 14–19 Apr 2024, EGU24-8028, https://doi.org/10.5194/egusphere-egu24-8028, 2024.

EGU24-9049 | Posters on site | CL4.3

Constraining internal variability in CMIP6 simulations to provide skillful near-term climate predictions 

Rashed Mahmood, Markus G. Donat, Pablo Ortega, and Francisco Doblas-Reyes

Adaptation to climate change requires accurate and reliable climate information on decadal and multi-decadal timescales. Such near-term climate information is obtained from future projection simulations, which are strongly affected by uncertainties related to, among other things, internal climate variability. Here we present an approach to constrain variability in future projection simulations of the coupled model intercomparison project phase 6 (CMIP6). The constraining approach involves phasing in the simulated with the observed climate state by evaluating the area-weighted spatial pattern correlations of sea surface temperature (SST) anomalies in individual members and observations. The constrained ensemble, based on the top ranked members in terms of pattern correlations with observed SST anomalies, shows significant added value over the unconstrained ensemble in predicting surface temperature 10 and also 20 years  after the synchronization with observations, thus extending the forecast range of the standard initialised predictions. We also find that while the prediction skill of the constrained ensemble for the first ten years is similar to the initialized decadal predictions, the added value against the unconstrained ensemble extends over more regions than the decadal predictions. In addition, the constraining approach can also be used to attribute predictability of regional and global climate variations to regional SST variability.

How to cite: Mahmood, R., G. Donat, M., Ortega, P., and Doblas-Reyes, F.: Constraining internal variability in CMIP6 simulations to provide skillful near-term climate predictions, EGU General Assembly 2024, Vienna, Austria, 14–19 Apr 2024, EGU24-9049, https://doi.org/10.5194/egusphere-egu24-9049, 2024.

There is an ongoing discussion about the contributions from forced and natural sources to the Atlantic Multi-decadal Variability (AMV).  As the AMV influences the general climate in large regions, this question has important consequences for climate predictions on decadal timescales and for a robust estimation of the influence of climate forcings.

Here, we investigate the Atlantic Multi-decadal Variability (AMV) in observations and in a large CMIP6 historical climate model ensemble. We compare three different definitions of the AMV aimed at extracting the variability intrinsic to the Atlantic region. These definitions are based on removing from the Atlantic temperature the non-linear trend, the part congruent to the global average, or the part congruent to the multi-model ensemble mean of the global average. The considered AMV definitions agree on the well-known low-frequency oscillatory variability in observations, but show larger differences for the models. In general, large differences between ensemble members are found.

We estimate the forced response in the AMV as the mean of the large multi-model ensemble.  The forced response resembles the observed low-frequency oscillatory variability for the detrended AMV definition, but this definition is also the most inefficient in removing the forced global mean signal. The forced response is very weak for the other definitions and only few of their individual ensemble members show oscillatory variability and, if they do, not with the observed phase.

The observed spatial temperature pattern related to the AMV is well captured for all three AMV definitions, but with some differences in the spatial extent. The observed instantaneous connection between NAO and AMV is well represented in the models for all AMV definitions. Only non-significant evidence of NAO leading the AMV on decadal timescales is found.

How to cite: Christiansen, B., Yang, S., and Drews, A.: The Atlantic Multi-decadal Variability in observations and in a large historical multi-model ensemble: Forced and internal variability, EGU General Assembly 2024, Vienna, Austria, 14–19 Apr 2024, EGU24-9100, https://doi.org/10.5194/egusphere-egu24-9100, 2024.

EGU24-9274 | ECS | Orals | CL4.3 | Highlight

The Role of the North Atlantic for Heat Wave Characteristics in Europe 

Sabine Bischof, Robin Pilch Kedzierski, Martje Hänsch, Sebastian Wahl, and Katja Matthes

The recent severe European summer heat waves of 2015 and 2018 co-occurred with cold subpolar North Atlantic (NA) sea surface temperatures (SSTs). However, a significant connection between this oceanic state and European heat waves was not yet established.

We investigate the effect of cold subpolar NA SSTs on European summer heat waves using two 100-year long AMIP-like model experiments: one that employs the observed global 2018 SST pattern as a boundary forcing and a counter experiment for which we removed the negative NA SST anomaly from the 2018 SST field, while preserving daily and small-scale SST variabilities. Comparing these experiments, we find that cold subpolar NA SSTs significantly increase heat wave duration and magnitude downstream over the European continent. Surface temperature and circulation anomalies are connected by the upper-tropospheric summer wave pattern of meridional winds over the North Atlantic European sector, which is enhanced with cold NA SSTs. Our results highlight the relevance of the subpolar NA region for European summer conditions, a region that is marked by large biases in current coupled climate model simulations.

How to cite: Bischof, S., Pilch Kedzierski, R., Hänsch, M., Wahl, S., and Matthes, K.: The Role of the North Atlantic for Heat Wave Characteristics in Europe, EGU General Assembly 2024, Vienna, Austria, 14–19 Apr 2024, EGU24-9274, https://doi.org/10.5194/egusphere-egu24-9274, 2024.

EGU24-9690 | ECS | Orals | CL4.3

Hybrid statistical-dynamical seasonal prediction of summer extreme temperatures over Europe 

Luca Famooss Paolini, Paolo Ruggieri, Salvatore Pascale, Erika Brattich, and Silvana Di Sabatino

Several studies show that the occurrence of summer extreme temperatures over Europe is increased since the middle of the twentieth century and is expected to further increase in the future due to global warming (Seneviratne et al., 2021). Thus, predicting heat extremes several months ahead is crucial given their impacts on socio-economic and environmental systems.

In this context, state-of-the-art dynamical seasonal prediction systems (SPSs) show low skills in predicting European heat extremes on seasonal timescale, especially in central and northern Europe (Prodhomme et al., 2022). However, recent studies have shown that our skills in predicting extratropical climate can be largely improved by subsampling the dynamical SPS ensemble with statistical post-processing techniques (Dobrynin et al., 2022).

This study assesses if the seasonal prediction skill of summer extreme temperatures in Europe in the state-of-the-art dynamical SPSs can be improved through subsampling. Specifically, we use a multi-model ensemble (MME) of SPSs contributing to the Copernicus Climate Change Service (C3S), analysing di hindcast period 1993—2016. The MME is subsampled by retaining a subset of members that predict the phase of the North Atlantic Oscillation (NAO) and the Eastern Atlantic (EA), typically linked to summer extreme temperatures in Europe. The subsampling relies on spring predictors of the weather regimes and thus allows us to retain only those ensemble members with a reasonable representation of summer heat extreme teleconnections.

Results show that by retaining only those ensemble members that accurately represent the NAO phase, it not only enhances the seasonal prediction skills for the summer European climate but also leads to improved predictions of summer extreme temperatures, especially in central and northern Europe. Differently, selecting only those ensemble members that accurately represent the EA phase does not improve either the predictions of summer European climate or the predictions of summer extreme temperatures. This can be explained by the fact that the C3S SPSs exhibits deficiencies in accurately representing the summer low-frequency atmospheric variability.

Bibliography

Dobrynin, M., and Coauthors, 2018: Improved Teleconnection-Based Dynamical Seasonal Predictions of Boreal Winter. Geophysical Research Letters, 45 (8), 3605—3614, https://doi.org/10.1002/2018GL07720

Prodhomme, C., S. Materia, C. Ardilouze, R. H. White, L. Batté, V. Guemas, G. Fragkoulidis, and J. Garcìa-Serrano, 2022: Seasonal prediction of European summer heatwaves. Climate Dynamics, 58 (7), 2149—2166, https://doi.org/10.1007/s00382-021-05828-3

Seneviratne, S., and Coauthors, 2021: Weather and Climate Extreme Events in a Changing Climate, chap. 11, 1513—1766. Cambridge University Press, https://doi.org/10.1017/9781009157896.013

How to cite: Famooss Paolini, L., Ruggieri, P., Pascale, S., Brattich, E., and Di Sabatino, S.: Hybrid statistical-dynamical seasonal prediction of summer extreme temperatures over Europe, EGU General Assembly 2024, Vienna, Austria, 14–19 Apr 2024, EGU24-9690, https://doi.org/10.5194/egusphere-egu24-9690, 2024.

EGU24-9905 | ECS | Orals | CL4.3

Optimization-based driver detection and prediction of seasonal heat extremes 

Ronan McAdam, César Peláez Rodríguez, Felicitas Hansen, Jorge Pérez Aracil, Antonello Squintu, Leone Cavicchia, Eduardo Zorita, Sancho Saldez-Sanz, and Enrico Scoccimarro

As a consequence of limited reliability of dynamical forecast systems, particularly over Europe, efforts in recent years have turned to exploiting the power of Machine Learning methods to extract information on drivers of extreme temperature from observations and reanalysis. Meanwhile, the diverse impacts of extreme heat have driven development of new indicators which take into account nightime temperatures and humidity. In the H2020 CLimate INTelligence (CLINT) project, a feature selection framework is being developed to find the combination of drivers which provides optimal seasonal forecast skill of European summer heatwave indicators. Here, we present the methodology, its application to a range of heatwave indicators and forecast skill compared to existing dynamical systems. First, a range of (reduced-dimensionality) drivers are defined, including k-means clusters of variables known to impact European summer (e.g. precipitation, sea ice content), and more complex indices like the NAO and weather regimes. Then, these drivers are used to train machine learning based prediction models, of varying complexity, to predict seasonal indicators of heatwave occurrence and intensity. A crucial and novel step in our framework is the use of the Coral Reef Optimisation algorithm, used to select the variables and their corresponding lag times and time periods which provide optimal forecast skill. To maximise training data, both ERA5 reanalysis and a 2000-year paleo-simulation are used; the representation of heatwaves and atmospheric conditions are validated with respect to ERA5. We present comparisons of forecast skill to the dynamical Copernicus Climate Change Service seasonal forecasts systems. The differences in timing, predictability and drivers of daytime and nighttime heatwaves across Europe are highlighted. Lastly, we discuss how the framework can easily be adapted to other extremes and timescales.


How to cite: McAdam, R., Peláez Rodríguez, C., Hansen, F., Pérez Aracil, J., Squintu, A., Cavicchia, L., Zorita, E., Saldez-Sanz, S., and Scoccimarro, E.: Optimization-based driver detection and prediction of seasonal heat extremes, EGU General Assembly 2024, Vienna, Austria, 14–19 Apr 2024, EGU24-9905, https://doi.org/10.5194/egusphere-egu24-9905, 2024.

EGU24-10539 | ECS | Orals | CL4.3

Exploring multiyear-to-decadal North Atlantic sea level predictability using machine learning and analog methods 

Qinxue Gu, Liwei Jia, Liping Zhang, Thomas Delworth, Xiaosong Yang, Fanrong Zeng, and Shouwei Li

Long-term sea level rise and multiyear-to-decadal sea level variations pose substantial risks of flooding and erosion in coastal communities. The North Atlantic Ocean and the U.S. East Coast are hotspots for sea level changes under current and future climates. Here, we employ a machine learning technique, a self-organizing map (SOM)-based framework, to systematically characterize the North Atlantic sea level variability, assess sea level predictability, and generate sea level predictions on multiyear-to-decadal timescales. Specifically, we classify 5000-year North Atlantic sea level anomalies from the Seamless System for Prediction and EArth System Research (SPEAR) model control simulations into generalized patterns using SOM. Preferred transitions among these patterns are further identified, revealing long-term predictability on multiyear-to-decadal timescales related to shifts in Atlantic meridional overturning circulation (AMOC) phases. By combining the SOM framework with “analog” techniques based on the simulations and observational/reanalysis data, we demonstrate prediction skill of large-scale sea level patterns comparable to that from initialized hindcasts. Moreover, additional source of short-term predictability is identified after the exclusion of low-frequency AMOC signals, which arises from the wind-driven North Atlantic tripole mode triggered by the North Atlantic Oscillation. This study highlights the potential of machine learning methods to assess sources of predictability and to enable efficient, long-term climate prediction.

How to cite: Gu, Q., Jia, L., Zhang, L., Delworth, T., Yang, X., Zeng, F., and Li, S.: Exploring multiyear-to-decadal North Atlantic sea level predictability using machine learning and analog methods, EGU General Assembly 2024, Vienna, Austria, 14–19 Apr 2024, EGU24-10539, https://doi.org/10.5194/egusphere-egu24-10539, 2024.

The inter-annual to multi-decadal variability of recurrent, synoptic-scale atmospheric circulation patterns in the Northern Hemisphere extratropics, as represented by the Jenkinson-Collison classification scheme, is explored in reanalysis data spanning the entire 20th century, and in global climate model (GCM) data from the historical, AMIP and DCPP experiments conducted within the framework of CMIP6. The aim of these efforts is to assess the effect of coupled vs. uncoupled and initialised vs. non-initialized GCM simulations in reproducing the observed low-frequency variability of the aforementioned circulation patterns.

Results reveal that the observed annual counts of typical recurrent weather patterns, such as cyclonic or anticyclonic conditions and also situations of pronounced advection, exhibit significant oscillations on multiple time-scales ranging between several years and several decades. The period of these oscillations, however, is subject to large regional variations. This is in line with earlier studies suggesting that the extratropical atmospheric circulation’s low frequency variability is essentially unforced, except in the Pacific-North American sector where the forced variability is enhanced due to ENSO teleconnections. Neither the periods obtained from historical nor those obtained from AMIP experiments align with observations. Likewise, not even the periods obtained from different runs of the same GCM and experiment correspond to each other. Thus, in an non-initialized model setup, ocean-atmosphere coupling or the lack thereof essentially leads to the same results. Whether initialization and/or augmenting the ensemble size can improve these findings, will also be discussed.

Acknowledgement: This work is part of project Impetus4Change, which has received funding from the European Union’s Horizon Europe research and innovation programme under grant agreement No 101081555.

How to cite: Brands, S., Cimadevilla, E., and Fernández, J.: Low-frequency variability of synoptic-scale atmospheric circulation patterns in the Northern Hemisphere extratropics and associated hindcast skill of decadal forecasting systems, EGU General Assembly 2024, Vienna, Austria, 14–19 Apr 2024, EGU24-10551, https://doi.org/10.5194/egusphere-egu24-10551, 2024.

EGU24-10574 | Orals | CL4.3 | Highlight

Will 2024 be the first year above 1.5 C? 

Nick Dunstone, Doug Smith, Adam Scaife, Leon Hermanson, Andrew Colman, and Chris Folland

Global mean surface temperature is the key metric by which our warming climate is monitored and for which international climate policy is set. At the end of each year the Met Office makes a global mean temperature forecast for the coming year. Following on from the new record 2023, we predict a high probability of another record year in 2024 and a 35% chance of exceeding 1.5 C above pre-industrial. Whilst a one-year temporary exceedance of 1.5 C would not constitute a breech of the Paris Agreement target, our forecast highlights how close we are now to breeching this target. We show that our 2024 forecast can be largely explained by the combination of the continuing warming trend of +0.2 C/decade and the lagged warming affect of a strong tropical Pacific El Nino event. We further highlight 2023 was significantly warmer than forecast and that much of this warming signal came from the southern hemisphere and requires further understanding.

How to cite: Dunstone, N., Smith, D., Scaife, A., Hermanson, L., Colman, A., and Folland, C.: Will 2024 be the first year above 1.5 C?, EGU General Assembly 2024, Vienna, Austria, 14–19 Apr 2024, EGU24-10574, https://doi.org/10.5194/egusphere-egu24-10574, 2024.

EGU24-11485 | ECS | Orals | CL4.3

Summer drought predictability in the Mediterranean region in seasonal forecasts 

Giada Cerato, Katinka Bellomo, and Jost von Hardenberg

The Mediterranean region has been identified as an important climate change hotspot, over the 21st century both air temperature and its extremes are projected to rise at a rate surpassing that of the global average and a significant decrease of average summer precipitation is projected, particularly for the western Mediterranean. On average, Mediterranean droughts have become more frequent and intense in recent years and are expected to become more widespread in many regions. These prolonged dry spells pose a substantial threat to agriculture and impact several socio-economic sectors. In this context, long-range weather forecasting has emerged as a promising tool for seasonal drought risk assessment. However, the interpretation of the forecasting products is not always straightforward due to their inherent probabilistic nature. Therefore, a rigorous evaluation process is needed to determine the extent to which these forecasts provide a fruitful advantage over much simpler forecasting systems, such as those based on climatology. 

In this study, we use the latest version of ECMWF’s seasonal prediction system (SEAS5) to understand its skill in predicting summer droughts. The Standardized Precipitation Evapotranspiration Index (SPEI) aggregated over different lead times is employed to mark below-normal dryness conditions in August. We use a comprehensive set of evaluation metrics to gain insight into the accuracy, systematic biases, association, discrimination and sharpness of the forecast system. Our findings reveal that up to 3 months lead time, seasonal forecasts show stronger association and discrimination skills than the climatological forecast, especially in the Southern Mediterranean, although the prediction quality in terms of accuracy and sharpness is limited. On the other hand, extending the forecast range up to 6 months lead time dramatically reduces its predictability skill, with the system mostly underperforming elementary climatological predictions. 

This approach is then extended to examine the full ensemble of seasonal forecasting systems provided by the Copernicus Climate Change Service (C3S) to test their skill in predicting droughts. Our findings can help an informed use of seasonal forecasts of droughts and the development of related climate services.

How to cite: Cerato, G., Bellomo, K., and von Hardenberg, J.: Summer drought predictability in the Mediterranean region in seasonal forecasts, EGU General Assembly 2024, Vienna, Austria, 14–19 Apr 2024, EGU24-11485, https://doi.org/10.5194/egusphere-egu24-11485, 2024.

EGU24-11930 | ECS | Posters on site | CL4.3

A global empirical system for probabilistic seasonal climate prediction based on generative AI and CMIP6 models  

Lluís Palma, Alejandro Peraza, Amanda Duarte, David Civantos, Stefano Materia, Arijit Nandi, Jesús Peña-Izquierdo, Mihnea Tufis, Gonzalo Vilella, Laia Romero, Albert Soret, and Markus Donat

Reliable probabilistic information at the seasonal time scale is essential across various societal sectors, such as agriculture, energy, or water management. Current applications of seasonal predictions rely on General Circulation Models (GCMs) that represent dynamical processes in the atmosphere, land surface, and ocean while capturing their linear and nonlinear interactions. However, GCMs come with an inherent high computational cost. In an operational setup, they are typically run once a month and at a lower temporal and spatial resolution than the ones needed for regional applications. Moreover, GCMs suffer from significant drifts and biases and can miss relevant teleconnections, resulting in low skill for particular regions or seasons. 

In this context, the use of generative AI methods that can model complex nonlinear relationships can be a viable alternative for producing probabilistic predictions with low computational demand. Such models have already demonstrated their effectiveness in different domains, i.e. computer vision, natural language processing, and weather prediction. However, although requiring less computational power, these techniques still rely on big datasets in order to be efficiently trained. Under this scenario, and with sufficiently high-quality global observational datasets spanning at most 70 years, the research trend has evolved into training these models using climate model output. 

In this work, we build upon the work presented by Pan et al., 2022, which introduced a conditional Variational Autoencoder (cVAE) to predict global temperature and precipitation fields for the October to March season starting from July initial conditions. We adopt several pre-processing changes to account for different biases and trends across the CMIP6 models. Additionally, we explore different architecture modifications to improve the model's performance and stability. We study the benefits of our model in predicting three-month anomalies on top of the climate change trend. Finally, we compare our results with a state-of-the-art GCM (SEAS5) and a simple empirical system based on the linear regression of classical seasonal indices based on Eden et al., 2015.


Pan, Baoxiang, Gemma J. Anderson, André Goncalves, Donald D. Lucas, Céline J.W. Bonfils, and Jiwoo Lee. 'Improving Seasonal Forecast Using Probabilistic Deep Learning'. Journal of Advances in Modeling Earth Systems 14, no. 3 (1 March 2022). https://doi.org/10.1029/2021MS002766.


Eden, J. M., G. J. van Oldenborgh, E. Hawkins, and E. B. Suckling. 'A Global Empirical System for Probabilistic Seasonal Climate Prediction'. Geoscientific Model Development 8, no. 12 (11 December 2015): 3947–73. https://doi.org/10.5194/gmd-8-3947-2015.

How to cite: Palma, L., Peraza, A., Duarte, A., Civantos, D., Materia, S., Nandi, A., Peña-Izquierdo, J., Tufis, M., Vilella, G., Romero, L., Soret, A., and Donat, M.: A global empirical system for probabilistic seasonal climate prediction based on generative AI and CMIP6 models , EGU General Assembly 2024, Vienna, Austria, 14–19 Apr 2024, EGU24-11930, https://doi.org/10.5194/egusphere-egu24-11930, 2024.

EGU24-12969 | ECS | Orals | CL4.3

How unusual is the recent decade-long pause in Arctic summer sea ice retreat? 

Patricia DeRepentigny, François Massonnet, Roberto Bilbao, and Stefano Materia

The Earth has warmed significantly over the past 40 years, and the fastest rate of warming has occurred in and around the Arctic. The warming of northern high latitudes at a rate of almost four times the global average (Rantanen et al., 2022), known as Arctic amplification, is associated with sea ice loss, glacier retreat, permafrost degradation, and expansion of the melting season. Since the mid-2000s, summer sea ice has exhibited a rapid decline, reaching record minima in September sea ice area in 2007 and 2012. However, after the early 2010s, the downward trend of minimum sea ice area appears to decelerate (Swart et al., 2015; Baxter et al., 2019). This apparent slowdown and the preceding acceleration in the rate of sea ice loss are puzzling in light of the steadily increasing rate of greenhouse gas emissions of about 4.5 ppm yr−1 over the past decade (Friedlingstein et al., 2023) that provides a constant climate forcing. Recent studies suggest that low-frequency internal climate variability may have been as important as anthropogenic influences on observed Arctic sea ice decline over the past four decades (Dörr et al., 2023; Karami et al., 2023). Here, we investigate how unusual this decade-long pause in Arctic summer sea ice decline is within the context of internal climate variability. To do so, we first assess how rare this is deceleration of Arctic sea ice loss is by comparing it to trends in CMIP6 historical simulations. We also use simulations from the Decadal Climate Prediction Project (DCPP) contribution to CMIP6 to determine if initializing decadal prediction systems from estimates of the observed climate state substantially improves their performance in predicting the slowdown in Arctic sea ice loss over the past decade. As the DCPP does not specify the data or the methods to be used to initialize forecasts or how to generate ensembles of initial conditions, we also assess how different formulations affect the skill of the forecasts by analyzing differences between models. This work provides an opportunity to attribute this pause in Arctic sea ice retreat to interannual internal variability or radiative external forcings, something that observation analysis alone cannot achieve.

How to cite: DeRepentigny, P., Massonnet, F., Bilbao, R., and Materia, S.: How unusual is the recent decade-long pause in Arctic summer sea ice retreat?, EGU General Assembly 2024, Vienna, Austria, 14–19 Apr 2024, EGU24-12969, https://doi.org/10.5194/egusphere-egu24-12969, 2024.

EGU24-14341 | Posters on site | CL4.3

Compound Heat and Dry Events Influenced by the Pacific–Japan Pattern over Taiwan in Summer 

Szu-Ying Lin, Wan-Ling Tseng, Yi-Chi Wang, and MinHui Lo

Compound dry and hot events, characterized by elevated temperatures and reduced precipitation, pose interconnected challenges to human social economics, necessitating comprehensive strategies for mitigation and adaptation. This study focuses on the Pacific-Japan (PJ) pattern, a significant climate variability influencing summer climates in East Asia. While previous research has explored its impact on Japan and Korea, our investigation delves into its effects on Taiwan, a mountainous subtropical island with a population of approximately 24 million. Utilizing long-term temperature and rainfall data, along with reanalysis dynamic downscaling datasets, we examine the interannual impacts of the PJ pattern on summer temperature and compound heat and dry events. Our findings reveal a significant temperature increase during the positive phase of the PJ pattern, characterized by anticyclonic anomalous circulation over Taiwan. Additionally, both the Standardized Precipitation Index and soil water exhibit a decline during this phase, reflecting meteorological and hydrological drought conditions. A robust negative correlation (-0.7) between drought indices and temperature emphasizes the compound effect of heat and dry events during the PJ positive phase. This study enhances the understanding of the PJ pattern as a climate driver, describing its role in hot and dry summers over Taiwan. The insights gained, when integrated into seasonal prediction and early warning systems, can aid vulnerable sectors in preparing for potential heat and dry stress hazards.

How to cite: Lin, S.-Y., Tseng, W.-L., Wang, Y.-C., and Lo, M.: Compound Heat and Dry Events Influenced by the Pacific–Japan Pattern over Taiwan in Summer, EGU General Assembly 2024, Vienna, Austria, 14–19 Apr 2024, EGU24-14341, https://doi.org/10.5194/egusphere-egu24-14341, 2024.

EGU24-14379 | Posters on site | CL4.3

Linkage between Temperature and Heatwaves in Summer Taiwan to the Pacific Meridional Mode 

Chieh-Ting Tsai, Wan-Ling Tseng, and Yi-Chi Wang

Over the past century, Taiwan has gradually recognized the hazards posed by extreme heat events (EHT), prompting the development of mid-term adaptation strategies to address challenges in the coming decades. However, our understanding of decadal-scale temperature variations remains insufficient, requiring further research into influencing factors. Our study reveals the crucial role of the Pacific Meridional Mode (PMM) in modulating decadal-scale variations in summer temperatures in Taiwan. During the positive phase of PMM, warm sea surface temperature anomalies trigger an eastward-moving wave train extending into East Asia. This leads to the development of high-pressure circulations near Southeast Asia and Taiwan, enhancing the temperature increase. This mechanism has been reproduced in experiments using the Taiwan Earth System Model. Moreover, our study utilizes the calendar day 90th percentile of maximum temperature (CTX) as the threshold for extreme high-temperature events (EHT), while also employing the heatwaves magnitude scale (HWMS) as the criterion for defining heatwaves. During the positive phase of PMM, the frequency and duration of EHT increase, with variations observed across different regions. The overall intensity of heatwave events also strengthens, primarily due to extended durations. Notably, in a single city, this results in exposure of up to 800,000 person-days to EHT, presenting a tenfold increase compared to the annual effect observed in the long-term warming trend. These findings on the decadal-scale relationship between summer temperatures in Taiwan and PMM contribute to a deeper understanding of EHT and heatwaves events impacts, providing more nuanced insights for future regional strategies in mitigating heatwave disasters.

How to cite: Tsai, C.-T., Tseng, W.-L., and Wang, Y.-C.: Linkage between Temperature and Heatwaves in Summer Taiwan to the Pacific Meridional Mode, EGU General Assembly 2024, Vienna, Austria, 14–19 Apr 2024, EGU24-14379, https://doi.org/10.5194/egusphere-egu24-14379, 2024.

EGU24-14688 | ECS | Orals | CL4.3

Exploring ML-based decadal predictions of the German Bight storm surge climate 

Daniel Krieger, Sebastian Brune, Johanna Baehr, and Ralf Weisse

Storm surges and elevated water levels regularly challenge coastal protection and inland water management along the low-lying coastline of the German Bight. Skillful seasonal-to-decadal (S2D) predictions of the local storm surge climate would be beneficial to stakeholders and decision makers in the region. While storm activity has recently been shown to be skillfully predictable on a decadal timescale with a global earth system model, surge modelling usually requires very fine spatial and temporal resolutions that are not yet present in current earth system models. We therefore propose an alternative approach to generating S2D predictions of the storm surge climate by training a neural network on observed water levels and large-scale atmospheric patterns, and apply the neural network to the available model output of a S2D prediction system. We show that the neural-network-based translation from large-scale atmospheric fields to local water levels at the coast works sufficiently well, and that several windows of predictability for the German Bight surge climate emerge on the S2D scale.

How to cite: Krieger, D., Brune, S., Baehr, J., and Weisse, R.: Exploring ML-based decadal predictions of the German Bight storm surge climate, EGU General Assembly 2024, Vienna, Austria, 14–19 Apr 2024, EGU24-14688, https://doi.org/10.5194/egusphere-egu24-14688, 2024.

Atlantic meridional overturning circulation (AMOC) is one of the mechanisms for climate predictability and one of the properties that decadal climate predictions are attempting to predict. The starting point for AMOC decadal predictions is sensitive to the underlying data assimilation and/or initialization procedure. This means that different choices during the data assimilation procedure (e.g., assimilation method, assimilation window, data sources, resolution, nudging terms and strength, full field vs anomaly initialization/assimilation, etc) can result in a different mean and even variability of reconstructed ocean circulation. How coherent the AMOC initial states should be among the CMIP-like decadal prediction experiments? How good in general should the initial AMOC be for decadal predictions? And do initialization issues of the ocean circulation influence the prediction skill of other variables that are of interest for application studies? These are the questions that we were attempting to address in our study, where we analyzed twelve decadal prediction systems from the World Meteorological Organization Lead Centre for Annual-to-Decadal Climate Prediction project. We identify that the AMOC initialization influences the quality of predictions of the subpolar gyre (SPG). When predictions show a large initial error in their AMOC, they usually have low skill for predicting the internal variability of the SPG five years after the initialization.

How to cite: Polkova, I. and the Co-Authors: Initialization shock in the ocean circulation reduces skill in decadal predictions of the North Atlantic subpolar gyre, EGU General Assembly 2024, Vienna, Austria, 14–19 Apr 2024, EGU24-15358, https://doi.org/10.5194/egusphere-egu24-15358, 2024.

EGU24-15476 | Posters on site | CL4.3

Statistics of sudden stratospheric warmings using a large model ensemble 

Sarah Ineson, Nick Dunstone, Adam Scaife, Martin Andrews, Julia Lockwood, and Bo Pang

Using a large ensemble of initialised retrospective forecasts (hindcasts) from a seasonal prediction system, we explore various statistics relating to sudden stratospheric warmings (SSWs). Observations show that SSWs occur at a similar frequency during both El Niño and La Niña northern hemisphere winters. This is contrary to expectation, as the stronger stratospheric polar vortex associated with La Niña years might be expected to result in fewer of these extreme breakdowns. We show that this similar frequency may have occurred by chance due to the limited sample of years in the observational record. We also show that in these hindcasts, winters with two SSWs, a rare event in the observational record, on average have an increased surface impact. Multiple SSW events occur at a lower rate than expected if events were independent but somewhat surprisingly, our analysis also indicates a risk, albeit small, of winters with three or more SSWs, as yet an unseen event.

How to cite: Ineson, S., Dunstone, N., Scaife, A., Andrews, M., Lockwood, J., and Pang, B.: Statistics of sudden stratospheric warmings using a large model ensemble, EGU General Assembly 2024, Vienna, Austria, 14–19 Apr 2024, EGU24-15476, https://doi.org/10.5194/egusphere-egu24-15476, 2024.

EGU24-15709 | ECS | Orals | CL4.3

Predicting Atlantic and Benguela Niño events with deep learning  

Marie-Lou Bachelery, Julien Brajard, Massimiliano Patacchiola, and Noel Keenlyside

Extreme Atlantic and Benguela Niño events continue to significantly impact the tropical Atlantic region, with far-reaching consequences for African climate and ecosystems. Despite attempts to forecast these events using traditional seasonal forecasting systems, success remains low, reinforcing the growing idea that these events are unpredictable. To overcome the limitations of dynamical prediction systems, we introduce a deep learning-based statistical prediction model for Atlantic and Benguela Niño events. Our convolutional neural network (CNN) model, trained on 90 years of reanalysis data incorporating surface and 100m-averaged temperature variables, demonstrates the capability to forecast the Atlantic and Benguela Niño indices with lead times of up to 3-4 months. Notably, the CNN model excels in forecasting peak-season events with remarkable accuracy extending up to 5 months ahead. Gradient sensitivity analysis reveals the ability of the CNN model to exploit known physical precursors, particularly the connection to equatorial dynamics and the South Atlantic Anticyclone, for accurate predictions of Benguela Niño events. This study challenges the perception of the Tropical Atlantic as inherently unpredictable, underscoring the potential of deep learning to enhance our understanding and forecasting of critical climate events. 

How to cite: Bachelery, M.-L., Brajard, J., Patacchiola, M., and Keenlyside, N.: Predicting Atlantic and Benguela Niño events with deep learning , EGU General Assembly 2024, Vienna, Austria, 14–19 Apr 2024, EGU24-15709, https://doi.org/10.5194/egusphere-egu24-15709, 2024.

EGU24-15974 | ECS | Posters virtual | CL4.3

Recalibrating DWD’s operational climate predictions: towards a user-oriented seamless climate service 

Alexander Pasternack, Birgit Mannig, Andreas Paxian, Amelie Hoff, Klaus Pankatz, Philip Lorenz, and Barbara Früh

The German Meteorological Service's (Deutscher Wetterdienst DWD) climate predictions website  (www.dwd.de/climatepredictions) offers a centralized platform for accessing post-processed climate predictions, including subseasonal forecasts from ECMWF's IFS and seasonal and decadal predictions from the German climate prediction system. The website design was developed in collaboration with various sectors to ensure uniformity across all time frames, and users can view maps, tables, and time series of ensemble mean and probabilistic predictions in combination with their skill. The available data covers weekly, 3-month, 1-year, and 5-year temperature means, precipitation sums and soil moisture for the world, Europe, Germany, and particular German regions. To achieve high spatial resolution, the DWD used the statistical downscaling method EPISODES. Moreover, within the BMBF project KIMoDIs (AI-based monitoring, data management and information system for coupled forecasting and early warning of low groundwater levels and salinisation) the DWD provides climate prediction data of further hydrological variables (e.g. relative humidity) with corresponding prediction skill on a regional scale.

However, all predictions on these time scales can suffer from inherent systematic errors, which can impact their usefulness. To address these issues, the recalibration method DeFoReSt was applied to decadal predictions, using a combination of 3rd order polynomials in lead and start time, along with a boosting model selection approach. This approach addresses lead-time dependent systematic errors, such as drift, as well as inaccuracies in representing long-term changes and variability.

This study highlights the improved accuracy of the recalibration approach on decadal predictions due to an increased polynomial order compared to the original approach, and its different impact on global and regional scales. It also explores the feasibility of transferring this approach to predictions with shorter time horizons of the provided variables.

How to cite: Pasternack, A., Mannig, B., Paxian, A., Hoff, A., Pankatz, K., Lorenz, P., and Früh, B.: Recalibrating DWD’s operational climate predictions: towards a user-oriented seamless climate service, EGU General Assembly 2024, Vienna, Austria, 14–19 Apr 2024, EGU24-15974, https://doi.org/10.5194/egusphere-egu24-15974, 2024.

EGU24-16366 | ECS | Orals | CL4.3

Decadal predictions outperform projections in forecasting winter precipitation over the Mediterranean region 

Dario Nicolì, Silvio Gualdi, and Panos Athanasiadis

The Mediterranean region is highly sensitive to climate change, having experienced an intense warming and drying trend in recent decades, primarily due to the increased concentrations of anthropogenic greenhouse gases. In the context of decision-making processes, there is a growing interest in understanding the near-term climate evolution of this region.

In this study, we explore the climatic fluctuations of the Mediterranean region in the near-term range (up to 10 years ahead) using two different products: projections and decadal predictions. The former are century-scale climate change simulations initialized from arbitrary model states to which were applied anthropogenic and natural forcings. A major limitation of climate projections is their limited information regarding the current state of the Earth’s climate system. Decadal climate predictions, obtained by constraining the initial conditions of an ensemble of model simulations through a best estimate of the observed climate state, provide a better understanding of the next-decade climate and thus represent an invaluable tool in assisting climate adaptation.

Using retrospective forecasts from eight decadal prediction systems contributing to the CMIP6 Decadal Climate Prediction Project (CMIP6 DCPP) and the corresponding ensemble of non-initialized projections, we compare the capabilities of the state-of-the-art climate models in predicting future climate changes of the Mediterranean region for some key quantities so as to assess the added value of initialization. 

Beyond the contribution of external forcings, the role of internal variability is also investigated since part of the detected predictability arises from internal climate variability patterns affecting the Mediterranean. The observed North Atlantic Oscillation, the dominant climate variability pattern in the Euro-Atlantic domain, as well as its  impact on wintertime precipitation over Europe are well reproduced by decadal predictions, especially over the Mediterranean, outperforming projections. We also apply a sub-sampling method to enhance the respective signal-to-noise ratio and consequently improve precipitation skill over the Mediterranean.

How to cite: Nicolì, D., Gualdi, S., and Athanasiadis, P.: Decadal predictions outperform projections in forecasting winter precipitation over the Mediterranean region, EGU General Assembly 2024, Vienna, Austria, 14–19 Apr 2024, EGU24-16366, https://doi.org/10.5194/egusphere-egu24-16366, 2024.

EGU24-16985 | Posters on site | CL4.3

Investigating signals in summer seasonal forecasts over the North Atlantic/European region 

Julia Lockwood, Nick Dunstone, Kristina Fröhlich, Ramón Fuentes Franco, Anna Maidens, Adam Scaife, Doug Smith, and Hazel Thornton

The current generation of seasonal forecast models struggle to skilfully predict dynamical circulation over the North Atlantic and European region in boreal summer.  Using two different state-of-the-art seasonal prediction systems, we show that tropical rainfall anomalies drive a circulation signal in the North Atlantic/Europe via the propagation of Rossby waves.  The wave, however, is shifted eastwards compared to observations, so the signal does not contribute positively to model skill.  Reasons for the eastward shift of the Rossby wave are investigated, as well as other drivers of the signal in this region.  Despite the errors in the waves, the fact that seasonal forecast models do predict dynamical signals over the North Atlantic/Europe signifies seasonal predictability over this region beyond the climate change trend, and understaning the cause of the errors could lead to skilful predictions.

How to cite: Lockwood, J., Dunstone, N., Fröhlich, K., Fuentes Franco, R., Maidens, A., Scaife, A., Smith, D., and Thornton, H.: Investigating signals in summer seasonal forecasts over the North Atlantic/European region, EGU General Assembly 2024, Vienna, Austria, 14–19 Apr 2024, EGU24-16985, https://doi.org/10.5194/egusphere-egu24-16985, 2024.

EGU24-17418 | Posters on site | CL4.3

Strengthening seasonal forecasting in the Middle East & North Africa (MENA) through the WISER Programme. 

Stefan Lines, Nicholas Savage, Rebecca Parfitt, Andrew Colman, Alex Chamberlain-Clay, Luke Norris, Heidi Howard, and Helen Ticehurst

In this presentation, we introduce the WISER MENA projects SeaFOAM (Seasonal Forecasting Across MENA) and SeaSCAPE (Seasonal Co-Production and Application in MENA). These projects explore both the improvement to the regional-level seasonal forecast in the MENA region, as well as how to tailor the information in ways useful to a range of climate information stakeholders. SeaFOAM works alongside Maroc Meteo, Morocco's National Meteorological and Hydrological Service (NMHS) and the Long Range Forecasting node of the Northern Africa WMO Regional Climate Centre (RCC), to develop a framework for objective seasonal forecasting. This approach will blend techniques such as bias correction via local linear regression and canonical correlation analysis (CCA), with skill-assessed sub-selected models, to improve forecasting accuracy. Multiple drivers of rainfall variability, including the North Atlantic Oscillation (NAO) and Mediterranean Oscillation (MO), are investigated for their calibration potential. SeaSCAPE works with the WMO and various partners across MENA to understand the use of seasonal information in multiple sectors, exploring existing gaps and needs. Through stakeholder engagement workshops, training and bespoke support for the Arab Climate Outlook Forum (ArabCOF), SeaSCAPE operates collaboratively to tailor regional and national-level climate information to improve accessibility and usability of climate information on seasonal timescales.

How to cite: Lines, S., Savage, N., Parfitt, R., Colman, A., Chamberlain-Clay, A., Norris, L., Howard, H., and Ticehurst, H.: Strengthening seasonal forecasting in the Middle East & North Africa (MENA) through the WISER Programme., EGU General Assembly 2024, Vienna, Austria, 14–19 Apr 2024, EGU24-17418, https://doi.org/10.5194/egusphere-egu24-17418, 2024.

EGU24-17585 | Orals | CL4.3

Skill of wind resource forecasts on the decadal time scale 

Kai Lochbihler, Ana Lopez, and Gil Lizcano

Accurate forecasts of the natural resources of renewable energy production have become not only a valuable but a crucial tool for managing the associated risks of specific events, such as wind droughts. Wind energy, alongside with solar power, now provide a substantial part to the renewable energy share of the global energy production and growth in this sector will most likely further increase. The naturally given fluctuations of wind resources, however, pose a challenge for maintaining a stable energy supply, which, at the end of the chain, can have an impact on the energy market prices.
Operational short-term forecasting products for the wind energy sector (multiple days) are already commonly available and seasonal to sub seasonal forecasting solutions (multiple months) can provide valuable skill and are gaining in popularity. On the other side of the spectrum, typically on a time scale of multiple decades, we find risk assessment based on climate change projections. In between the long and short term time scales, however, there is a gap that still needs to be filled to achieve seamless prediction of risks that are relevant for the energy sector: decadal predictions.

Here, we present the results of an evaluation study of a multi-model decadal prediction ensemble (DCPP) for a selection of wind development regions in Europe. The evaluation is based on multiple decades long hindcasts and carried out with a focus on the skill of predicting specific event types of wind resource availability in a probabilistic context, alongside with basic deterministic skill measures. We further investigate specific event constellations and their large-scale drivers that, in combination, can provide windows of opportunity with enhanced predictive skill. We conclude with a discussion on how this hybrid approach can be used to potentially increase not only forecast skill but also the trust of the end user.

How to cite: Lochbihler, K., Lopez, A., and Lizcano, G.: Skill of wind resource forecasts on the decadal time scale, EGU General Assembly 2024, Vienna, Austria, 14–19 Apr 2024, EGU24-17585, https://doi.org/10.5194/egusphere-egu24-17585, 2024.

EGU24-19229 | ECS | Orals | CL4.3

Comparing the seasonal predictability of Tropical Pacific variability in EC-Earth3 at two different horizontal resolutions 

Aude Carreric, Pablo Ortega, Vladimir Lapin, and Francisco Doblas-Reyes

Seasonal prediction is a field of research attracting growing interest beyond the scientific community due to its strong potential to guide decision-making in many sectors (e.g. agriculture and food security, health, energy production, water management, disaster risk reduction) in the face of the pressing dangers of climate change.

Among the various techniques being considered to improve the predictive skill of seasonal prediction systems, increasing the horizontal resolution of GCMs is a promising avenue. There are several indications that higher resolution versions of the current generation of climate models might improve key air-sea teleconnections, decreasing common biases of global models and improving the skill to predict certain regions at seasonal scales, e.g. in tropical sea surface temperature.

In this study, we analyze the differences in the predictive skill of two different seasonal prediction systems, based on the same climate model EC-Earth3 and initialized in the same way but using two different horizontal resolutions. The standard (SR) and high resolution (HR) configurations are based on an atmospheric component, IFS, of ~100 km and ~40 km of resolution respectively and on an ocean component, NEMO3.6, of ~100 km and ~25 km respectively. We focus in particular on the Tropical Pacific region where statistically significant improvements are found in HR with respect to SR for predicting ENSO and its associated climate teleconnections. We explore some processes that can explain these differences, such as the simulation of the tropical ocean mean state and atmospheric teleconnections between the Atlantic and Pacific tropical oceans. 

A weaker mean-state bias in the HR configuration, with less westward extension of ENSO-related SST anomalies, leads to better skill in ENSO regions, which can also be linked to better localization of the atmospheric teleconnection with the equatorial Atlantic Ocean. It remains to be assessed if similar improvements are consistently identified for HR versions in other forecast systems, which would prompt their routine use in seasonal climate prediction.

How to cite: Carreric, A., Ortega, P., Lapin, V., and Doblas-Reyes, F.: Comparing the seasonal predictability of Tropical Pacific variability in EC-Earth3 at two different horizontal resolutions, EGU General Assembly 2024, Vienna, Austria, 14–19 Apr 2024, EGU24-19229, https://doi.org/10.5194/egusphere-egu24-19229, 2024.

EGU24-19251 | Orals | CL4.3 | Highlight

The opportunities and challenges of near-term climate prediction 

Hazel Thornton

Accurate forecasts of the climate of the coming season and years are highly desired by many sectors of society. The skill of near-term climate prediction in winter in the North Atlantic and European region has improved over the last decade associated with larger ensembles, improving models and boosting of the prediction signal using intelligent post processing. International collaboration has improved the availability of forecasts and promoted the uptake of forecasts by different sectors. However, significant challenges remain, including summer prediction, understanding the risk of extremes within a season, multi-seasonal extremes and how best to post process the forecasts to aid decision making. This talk will summarise recent near-term climate prediction research activities at the UK Met Office and will detail our experience of providing such forecasts to the energy and water sectors.  

How to cite: Thornton, H.: The opportunities and challenges of near-term climate prediction, EGU General Assembly 2024, Vienna, Austria, 14–19 Apr 2024, EGU24-19251, https://doi.org/10.5194/egusphere-egu24-19251, 2024.

This study focuses on applying machine learning techniques to bias-correct the seasonal temperature forecasts provided by the Copernicus Climate Change Service (C3S) models. Specifically, we employ bias correction on forecasts from five major models: UK Meteorological Office (UKMO), Euro-Mediterranean Center on Climate Change (CMCC), Deutscher Wetterdienst (DWD), Environment and Climate Change Canada (ECCC), and Meteo-France. Our primary objective is to assess the performance of our bias correction model in comparison to the original forecast datasets. We utilise temperature-based indices recommended by the Expert Team on Climate Change Detection and Indices (ETCCDI) to evaluate the effectiveness of the bias-corrected seasonal forecasts. These indices served as valuable metrics to gauge the predictive capability of the models, especially in forecasting natural cascading hazards such as wildfires, droughts, and floods. The study involved an in-depth analysis of the bias-corrected forecasts, and the derived indices were crucial in understanding the models' ability to predict temperature-related extreme events. The results of this research contribute valuable information for decision-making and planning across various sectors, including disaster risk management and environmental protection. Through a comprehensive evaluation of machine learning-based bias correction techniques, we enhance the accuracy and applicability of seasonal temperature forecasts, thereby improving preparedness and resilience to climate-related challenges. 

How to cite: Mbuvha, R. and Nikraftar, Z.: Machine Learning Approaches to Improve Accuracy in Extreme Seasonal Temperature Forecasts: A Multi-Model Assessment , EGU General Assembly 2024, Vienna, Austria, 14–19 Apr 2024, EGU24-19297, https://doi.org/10.5194/egusphere-egu24-19297, 2024.

EGU24-19359 | ECS | Posters on site | CL4.3

Seasonal forecast of the late boreal winter temperature based on solar forcing and QBO 

Mikhail Vokhmianin, Antti Salminen, Kalevi Mursula, and Timo Asikainen

The ground temperature variability in the Northern Hemisphere winter is greatly influenced by the state of the polar vortex. When the vortex collapses during sudden stratospheric warmings (SSWs), rapid changes in stratospheric circulations propagate downward to the troposphere in the subsequent weeks. The ground effect following SSWs is typically manifested as the negative phase of the North Atlantic Oscillation. Our findings reveal a higher frequency of cold temperature anomalies in the Northern part of Eurasia during winters with SSWs, and conversely, warm anomalies in winters with a strong and stable vortex. This behavior is particularly evident when temperature anomalies are categorized into three equal subgroups, or terciles. Recently, we developed a statistical model that successfully predicts SSW occurrences with an 86% accuracy rate. The model utilizes the stratospheric Quasi-Biennial Oscillation (QBO) phase and two parameters associated with solar activity: the geomagnetic aa-index as a proxy for energetic particle precipitations and solar irradiance. In this study, we explore the model's potential to provide a seasonal forecast for ground temperatures. We assess the probabilities of regional temperature anomalies falling into the lowest or highest terciles based on the predicted weak or strong vortex state. Additionally, we demonstrate that the QBO phase further enhances the forecast quality. As the model provides SSW predictions as early as preceding August, our results carry significant societal relevance as well, e.g., for the energy sector, which is highly dependent on prevailing weather conditions.

How to cite: Vokhmianin, M., Salminen, A., Mursula, K., and Asikainen, T.: Seasonal forecast of the late boreal winter temperature based on solar forcing and QBO, EGU General Assembly 2024, Vienna, Austria, 14–19 Apr 2024, EGU24-19359, https://doi.org/10.5194/egusphere-egu24-19359, 2024.

EGU24-33 | ECS | Posters on site | AS1.5

Improved Diurnal Cycle in GFDL Earth System Models with Non-Equilibrium Convection 

Bosong Zhang, Leo Donner, Ming Zhao, and Zhihong Tan

Most global climate models with convective parameterization have trouble in simulating the observed diurnal cycle of convection. Maximum precipitation usually happens too early during local summertime, especially over land. Observational analyses indicate that deep convection over land cannot keep pace with rapid variations in convective available potential energy (CAPE), which is largely controlled by boundary layer forcing. In this study, a new convective closure in which shallow and deep convection interact strongly, out of equilibrium, is implemented in atmosphere-only and ocean-atmosphere coupled models developed at the NOAA Geophysical Fluid Dynamics Laboratory (GFDL). The diurnal cycles of convection in both simulations are significantly improved without altering their mean states. These improvements in the diurnal cycle of these climate models are consistent with those obtained by Peter Bechtold and colleagues in the ECMWF Integrated Forecasting System. The new closure shifts maximum precipitation over land later by about three hours. Compared to satellite observations, the diurnal phase biases are reduced by half. Shallow convection to some extent equilibrates rapid changes in the boundary layer at sub-diurnal time scales. Future model improvement will focus on the remaining biases, which may be further reduced by including stochastic entrainment and cold pools.

How to cite: Zhang, B., Donner, L., Zhao, M., and Tan, Z.: Improved Diurnal Cycle in GFDL Earth System Models with Non-Equilibrium Convection, EGU General Assembly 2024, Vienna, Austria, 14–19 Apr 2024, EGU24-33, https://doi.org/10.5194/egusphere-egu24-33, 2024.

EGU24-1875 | Orals | AS1.5

Is the fate of Mesoscale Convective Systems written from the start? 

Caroline Muller, Sophie Abramian, Camille Risi, Remy Roca, and Thomas Fiolleau

Mesoscale Convective Systems (MCSs) that become large or have long lifespans contribute disproportionately to extreme rainfall. Gaining a better understanding of the factors that determine whether a system will become large could improve our understanding of extreme weather phenomena. The recent emergence of high-resolution global simulations from the DYAMOND project, coupled with a storm tracking algorithm called TOOCAN, provides a groundbreaking opportunity to study the factors controlling the maximum area of MCSs. In this study we use machine learning algorithms to predict the maximum area of convective systems based on their early development stages and initial environmental conditions. The results reveal that the initial evolution of the system anticipates its maximum area. Factors such as the presence of ice in the system's environment, proximity to surrounding systems, intensity of vertical velocity at 500 hPa, and the migration distance, have been identified as significant factors in improving the accuracy of the prediction. Using a linear model, we investigate the relative role of the environment and of the system itself, in the growth of the system. 

How to cite: Muller, C., Abramian, S., Risi, C., Roca, R., and Fiolleau, T.: Is the fate of Mesoscale Convective Systems written from the start?, EGU General Assembly 2024, Vienna, Austria, 14–19 Apr 2024, EGU24-1875, https://doi.org/10.5194/egusphere-egu24-1875, 2024.

Future changes in tropical convection will be closely tied to changes in the underlying sea surface temperature (SST) pattern. To understand the convective response to warming in a coupled atmosphere-ocean system, we perform a series of idealized, 20-year radiative-convective equilibrium experiments with a 2D cloud-resolving model coupled to a 25-m slab ocean. The domain length is that of the tropical Pacific basin, and different climates are achieved by varying the parameterized ocean heat transport (q-flux). The simulations are characterized by two distinct regimes of  convection-SST coupling: an oscillatory regime that occurs when the mean SST is near that of the present-day tropical Pacific (27-30 °C), and a non-oscillatory regime at warmer temperatures (>36 °C).

The oscillatory regime is defined by internal, 3°C oscillations in mean SST driven by variations in low cloudiness. During the warming phase of the cycle, SSTs are homogeneous, deep convection occurs in two regions, and low clouds are sparse. During the cooling phase, there are well-defined warm and cold pools, deep convection aggregates into a single region, and expansive low cloud decks act to decrease the mean SST.  

In the warmer, non-oscillating regime, distinct warm and cold pools still form, but convection is no longer limited to the warmest SSTs. Rather, convection develops over cooler SSTs and is then advected to the warm pool by the mean flow. The expansion of deep convection to cooler SSTs impedes low cloud formation over the cold pool and inhibits the low cloud-driven oscillations in mean SST. Changes in sub-cloud buoyancy explain the expansion of the convectively unstable region.

Both regimes (oscillatory and non-oscillatory) can be achieved for the same q-flux depending on initial conditions. Intermediate SSTs (30-36 °C) are unstable on long timescales and eventually revert to one regime or the other. While certain aspects of this behavior are likely sensitive to simulation design, our broader set of experiments suggests potential shifts in convection-SST coupling as the climate warms.

How to cite: Sokol, A., Munteanu, V., and Hartmann, D.: Internal variability, multiple equilibria, and convection-SST coupling in a cloud-resolving model with an interactive ocean, EGU General Assembly 2024, Vienna, Austria, 14–19 Apr 2024, EGU24-3218, https://doi.org/10.5194/egusphere-egu24-3218, 2024.

EGU24-3972 | ECS | Posters on site | AS1.5

Modelling the formation of an extreme Australian pyro-convection event and its sensitivities 

Jason Müller, Fabian Senf, and Ina Tegen

During the Australian fire season 2019/2020, an unprecedented amount of smoke aerosol was not only released, but also transported upwards and injected into the tropopause region by so-called pyro-cumulonimbus clouds (pyroCb). The resulting lower stratospheric aerosol loads in early 2020 were comparable to those of the largest volcanic eruptions of the twentieth century. PyroCbs have been identified as the main pathway for biomass burning aerosol into the stratosphere. To study the phenomenon of PyroCbs, simulations of the so-called Australian New Year Super Outbreak are performed with the numerical weather model ICON. Simulations were run in a nested, limited area mode setup, with the smallest domain reaching down to a horizontal grid spacing of 500 m. Within the domain, an idealised fire perturbation was applied for which an additional constant surface sensible heat and water vapour flux was introduced to represent the thermodynamical impacts of the fire. Simulations with this setup were successful in producing fire-induced deep convection with subsequent smoke injection into the lower stratosphere. Preliminary sensitivity experiments show a high sensitivity of the PyroCb properties to initial and boundary conditions. We can show, that especially water vapour emissions, which would originate from evaporating surface water as well as from combustion of organic materials, have a decisive, enhancing impact on the pyro-convection. Moreover, besides the fire intensity, the plume characteristics and smoke injection heights are also closely linked to the background meteorology, in particular. In the long term, the goal is to incorporate the effects of extreme biomass burning emission into large scale climate simulations by taking into account PyroCb activity. However, this will require a very deep understanding of wildfire triggered convection and PyroCb dynamics.  

How to cite: Müller, J., Senf, F., and Tegen, I.: Modelling the formation of an extreme Australian pyro-convection event and its sensitivities, EGU General Assembly 2024, Vienna, Austria, 14–19 Apr 2024, EGU24-3972, https://doi.org/10.5194/egusphere-egu24-3972, 2024.

EGU24-4139 | ECS | Posters on site | AS1.5

The Unreasonable Efficiency of Total Rain Evaporation Removal in Triggering Convective Self-Aggregation 

Yi-Ling Hwong and Caroline Muller

The elimination of rain evaporation in the planetary boundary layer (PBL) has been found to lead to convective self-aggregation (CSA) even without radiative feedback (frequently referred to as “moisture memory aggregation”), but the precise mechanisms underlying this phenomenon remain unclear. We conducted cloud-resolving simulations with two domain sizes (L = 128 and 256 km; Δx = 1 and 4 km) with homogenised radiation and progressively reduced rain evaporation in the PBL by multiplying it with a factor 𝛼 = [1.0, 0.8, 0.6, 0.4, 0.2, 0]. Surprisingly, self aggregation only occurred when rain evaporation was almost completely removed (𝛼 ≈ 0). Similar to conventional radiatively-driven aggregation (RDA), a shallow circulation that leads to an upgradient moist static energy transport is present, but in this case it is the additional convective heating resulting from the reduction of evaporative cooling in the moist patch that triggers this circulation, thereafter a dry subsidence intrusion into the PBL in the dry patch takes over and intensifies aggregation. Hence, this type of aggregation should be more appropriately referred to as “convectively-driven aggregation” (CDA). Contrary to RDA, in CDA temperature and moisture anomalies oppose each other in their buoyancy effects, hence explaining the need for near-zero 𝛼 values: only when rain evaporation is almost completely removed can the additional heating trigger aggregation. Lastly, we found radiative cooling and not cold pools to be the leading cause of the domain size dependence of CDA. Runs with similar amounts of cold pools aggregate in the large but not small domain due to stronger radiative cooling rates and concomitant broadening of the range of precipitable water in the larger domain. 

How to cite: Hwong, Y.-L. and Muller, C.: The Unreasonable Efficiency of Total Rain Evaporation Removal in Triggering Convective Self-Aggregation, EGU General Assembly 2024, Vienna, Austria, 14–19 Apr 2024, EGU24-4139, https://doi.org/10.5194/egusphere-egu24-4139, 2024.

EGU24-5759 | ECS | Posters on site | AS1.5

Climatology, characteristics and forcing mechanisms of warm-season cold-frontal convection in Europe 

George Pacey, Stephan Pfahl, Lisa Schielicke, and Kathrin Wapler

Convection frequently initiates in proximity to cold fronts during the European warm-season and can also be associated with hazards such as flooding, rain, and hail. Despite this, the frequency and underlying processes that drive such events are not well-understood. To understand the typical nature, frequency and forcing mechanisms of convection depending on the region relative to the front, automatic front detection methods, a convective cell detection and tracking dataset (KONRAD), and lightning data are combined between 2007–2016.

The climatology shows that convective cells are most frequent in Germany marginally ahead of the surface front. Furthermore, the 700 hPa frontal line marks the minimum frequency of convection and a shift in regime between cells with a strong diurnal cycle on the cold-side of the 700 hPa front and a weakened diurnal cycle on the warm-side of the 700 hPa front. The results are consistent for lightning data on a sub-European domain. Given cell detection ahead of the surface front, cells are up to 3 times more likely to be associated with a mesocyclone compared to non-cold-frontal cells in Germany. Cells with 55 dBZ cores are over 1.5 times more likely.

To unravel the complex relationships between different predictor variables and the probability of convection a logistic regression model is developed. Feature importance techniques are utilised to understand which variables carry the most importance depending on the region relative to the front. We find solar heating carries more importance towards the model’s predictive power behind the 700 hPa front than ahead of the 700 hPa front. The opposite is true for the elevation term, which acts as a proxy for the influence of orography on convective initiation. By giving the model information on the number of surrounding grid points associated with convection, a proxy for cell interactions, the most skill is added near the surface front.

These results are an important step towards a deeper understanding of the underlying processes that drive cold-frontal convection and improved forecasting.

How to cite: Pacey, G., Pfahl, S., Schielicke, L., and Wapler, K.: Climatology, characteristics and forcing mechanisms of warm-season cold-frontal convection in Europe, EGU General Assembly 2024, Vienna, Austria, 14–19 Apr 2024, EGU24-5759, https://doi.org/10.5194/egusphere-egu24-5759, 2024.

Seeley and Wordsworth (2021) showed that in small-domain cloud-resolving simulations the temporal pattern of precipitation transforms in extremely hot climates (≥ 320 K) from quasi-steady to organized episodic deluges, with outbursts of heavy rain alternating with several dry days. They proposed a mechanism for this transition involving increased water vapor greenhouse effect and solar radiation absorption leading to net lower-tropospheric radiative heating. This heating inhibits lower-tropospheric convection and decouples the boundary layer from the upper troposphere during the dry phase, allowing lower-tropospheric moist static energy to build until it discharges, resulting in a deluge. We perform cloud-resolving simulations in polar night and show that the same transition occurs, implying that some revision of their mechanism is necessary. We perform further tests to show that episodic deluges can occur even if the lower-tropospheric radiative heating rate is negative, as long as the magnitude of the upper-tropospheric radiative cooling is about twice as large. We find that in the episodic deluge regime the period can be predicted from the time for radiation and reevaporation to cool the lower atmosphere.

How to cite: Song, X., Abbot, D., and Yang, J.: Critical role of vertical radiative cooling contrast in triggering episodic deluges in small-domain hothouse climates, EGU General Assembly 2024, Vienna, Austria, 14–19 Apr 2024, EGU24-5781, https://doi.org/10.5194/egusphere-egu24-5781, 2024.

EGU24-5959 | ECS | Posters on site | AS1.5

Numerical diffusion and turbulent mixing in convective self-aggregation 

Lorenzo Silvestri, Miriam Saraceni, and Paolina Bongioannini Cerlini

Spontaneous aggregation of deep convection is a common feature of idealized numerical simulations of the tropical atmosphere in Radiative-Convective Equilibrium (RCE). However, at coarse grid resolution where deep convection is not fully resolved, the occurrence of this phenomenon is highly sensitive to subgrid-scale processes. This study investigates the role of mixing and entrainment, provided by either the turbulence model or the implicit numerical dissipation, in this phenomenon. The results of two different models, WRF and SAM, have been analysed and compared using different configurations by varying the turbulence models, initial conditions, and horizontal spatial resolution. At a coarse grid resolution of 3 km, the occurrence of Convective Self-Aggregation (CSA) is prevented in models with low numerical diffusivity due to the removal of turbulent mixing, while it is preserved in models with high numerical diffusivity. When refining the horizontal grid resolution to 1 km, which reduces the implicit numerical dissipation, CSA can only be achieved by increasing explicit turbulent mixing. Even with a small amount of shallow clouds, CSA was found to occur in this case. Therefore, this study suggests that the sensitivity of CSA to horizontal grid resolution is not primarily due to the corresponding decrease in shallow clouds. It has been found that the amplitude of initial humidity perturbations introduced by convection in the free troposphere is regulated by turbulent mixing and dissipation at small scales. The size and strength of humidity perturbations in the free troposphere that can destabilize the RCE state increase with greater dissipation at small scales.

How to cite: Silvestri, L., Saraceni, M., and Bongioannini Cerlini, P.: Numerical diffusion and turbulent mixing in convective self-aggregation, EGU General Assembly 2024, Vienna, Austria, 14–19 Apr 2024, EGU24-5959, https://doi.org/10.5194/egusphere-egu24-5959, 2024.

EGU24-8367 | ECS | Posters on site | AS1.5

Improving and Assessing Organized Convection Parameterization in the Unified Model 

Zhixiao Zhang, Hannah Christensen, Mark Muetzelfeldt, Tim Woollings, Bob Plant, Alison Stirling, Michael Whitall, Mitchell Moncrieff, and Chih-Chieh Chen

Improving weather and climate prediction cannot avoid accurately representing organized convection, as its convective and stratiform components distinctly reshape large-scale circulations via redistributing momentum and heat. For latent heating, the stratiform heating in organized convection shifts to higher altitudes compared to convective regions, presenting a significant challenge for representation in models across scales. The Multiscale Coherent Structural Parameterization (MCSP), introduced by Moncrieff et al. (2017), offers a promising solution by generating the top-heavy profile from convective heating in slantwise layer overturning scenarios. As part of the MCS: PRIME project, the PRIME-MCSP implementation by Zhang et al. (submitted, 2024) couples MCSP with the CoMorph-A convection scheme in the UK Met Office Unified Model with the following improvements: 1) CoMorph permits unstable air to rise from any height, diverging from the conventional CAPE trigger for deep convection, thereby enhancing continuity and facilitating storm tracking. 2) We activate MCSP selectively for deep mixed-phase clouds, recognizing the limited ability of shallow clouds to produce a stratiform component. 3) We configure the global model runs to include both a fixed convective-stratiform heating fraction and a fraction proportional to cloud top temperature.

MCS tracks in ensembles of weather runs show that PRIME-MCSP suppresses cloud deepening and reduces precipitation areas by dampening low-level updrafts. 20-year climate simulations show that PRIME-MCSP improves the precipitation seasonal cycle over the Indian Ocean, while increasing the warm-season wet bias over the Western Pacific. Additionally, PRIME-MCSP intensifies the Madden Julian Oscillation (MJO). The model run using a variable convective-stratiform fraction more accurately represents the MJO frequency and aligns better with reanalysis. Future plans focus on the stochastic representation of stratiform effects, steered by insights from data assimilation increments.

How to cite: Zhang, Z., Christensen, H., Muetzelfeldt, M., Woollings, T., Plant, B., Stirling, A., Whitall, M., Moncrieff, M., and Chen, C.-C.: Improving and Assessing Organized Convection Parameterization in the Unified Model, EGU General Assembly 2024, Vienna, Austria, 14–19 Apr 2024, EGU24-8367, https://doi.org/10.5194/egusphere-egu24-8367, 2024.

EGU24-8856 | ECS | Orals | AS1.5

Storm intensification driven by soil moisture gradients in global hotspot regions 

Emma Barton, Cornelia Klein, Christopher Taylor, John Marsham, Douglas Parker, Ben Maybee, Zhe Feng, and L. Ruby Leung

Organised thunderstorm clusters known as Mesoscale Convective Systems (MCSs) can bring high impact hazards such as flash floods, lighting and destructive winds. It is crucial for the forecasting and mitigation of these hazards to understand the processes that influence the characteristics of storms and thereby contribute to extreme events. Soil moisture is known to influence the initiation of MCSs in several regions of the world, but the influence of soil moisture on the later stages of MCS lifecycles is less well understood. Work in West Africa has revealed that dry soil moisture structures on scales > 200 km can increase the scale and longevity of propagating, mature afternoon MCSs, but this has not been investigated for other regions. In the current work we simultaneously analyse seven global MCS hotspot regions where storms may be sensitive to soil moisture, the US Great Plains, China, India, West Africa, Australia, South Africa and South America, to gain a more global perspective of the impact of soil moisture conditions on mature MCS characteristics. Using a combination of global datasets, storm tracks, satellite data, reanalysis data and CMIP6 simulations, we reveal that large-scale soil moisture gradients (100s of km) can intensify storms by driving favourable shear conditions through the strengthening of low-level atmospheric temperature gradients. By separating storms by soil moisture conditions, we show an increase in precipitation feature area and rainfall production on days with favourable gradients compared to days with unfavourable gradients. This is a newly identified mechanism through which soil moisture can influence storm hazards globally, which has implications for the forecasting and future projection of extreme events under climate change.

How to cite: Barton, E., Klein, C., Taylor, C., Marsham, J., Parker, D., Maybee, B., Feng, Z., and Leung, L. R.: Storm intensification driven by soil moisture gradients in global hotspot regions, EGU General Assembly 2024, Vienna, Austria, 14–19 Apr 2024, EGU24-8856, https://doi.org/10.5194/egusphere-egu24-8856, 2024.

EGU24-9561 | Posters on site | AS1.5

Representing land-ocean heterogeneity via convective adjustment timescale 

Andrea Polesello, Bidyut Bikash Goswami, and Caroline Muller

Representing land-ocean heterogeneity via convective
adjustment timescale
Bidyut Goswami1 , Andrea Polesello1 , Caroline Muller1 .
1Department of Earth Science, Institute of Science and Technology Austria, Klosterneuburg, Austria
January 2024


Abstract

The time needed by deep convection to bring the atmosphere back to equilibrium
is called convective adjustment timescale or simply adjustment timescale, typically
denoted by τ . In the Community Atmospheric Model version 6 (CAM6), convection
is parameterized through the Zhang-McFarlan scheme [1], where CAPE undergoes
an exponential consumption, of which τ is the time constant. τ is a tunable pa-
rameter in CAM6 and it has a default value of 1 hour, worldwide, on both ocean
and land. Albeit, there is no justified reason why one adjustment timescale value
should work over land and ocean both. Continental and oceanic convection is dif-
ferent in terms of the vigor of updraft and hence can have different durations.[2, 3]
So it is logical to investigate the prescription of two different convective adjustment
timescales for land (τL ) and ocean (τL ). To understand the impact of representing
land-ocean heterogeneity via τ , we investigated CAM climate simulations for two
different convective adjustment timescales for land and ocean in contrast to having
one value globally.
Following a comparative analysis of 5-year-long climate simulations, we find
τO =4hr and τL =1hr to yield the best results. In particular, we obtain a better
description of the Madden-Julian Oscillation (MJO). Although these τ values were
chosen empirically and require further tuning, the conclusion of our finding remains
the same, which is, to use two different τ values for land and ocean.
References
[1] G. Zhang and N. A. McFarlane, “Sensitivity of climate simulations to the parameterization of
cumulus convection in the canadian climate centre general circulation model,” Atmosphere-
Ocean, vol. 33, no. 3, pp. 407–446, 1995.
[2] C. Lucas, E. J. Zipser, and M. A. Lemone, “Vertical Velocity in Oceanic Convection off
Tropical Australia,” Journal of the Atmospheric Sciences, vol. 51, pp. 3183–3193, 11 1994.
[3] R. Roca, T. Fiolleau, and D. Bouniol, “A Simple Model of the Life Cycle of Mesoscale
Convective Systems Cloud Shield in the Tropics,” Journal of Climate, vol. 30, pp. 4283–
4298, 6 2017.

How to cite: Polesello, A., Goswami, B. B., and Muller, C.: Representing land-ocean heterogeneity via convective adjustment timescale, EGU General Assembly 2024, Vienna, Austria, 14–19 Apr 2024, EGU24-9561, https://doi.org/10.5194/egusphere-egu24-9561, 2024.

EGU24-10474 | ECS | Posters on site | AS1.5

Predator-prey characteristics of the rapid shallow-to-deep transition of atmospheric convection 

Cristian-Valer Vraciu, Julien Savre, and Maxime Colin

Within a diurnal cycle, the transition from shallow to deep convection takes several hours, despite having large environmental instability at the onset of shallow convection. During this period, the cloud environment remains rather steady, while the convection exhibits a rapid development. Properly predicting the timing of this rapid shallow-to-deep transition within a diurnal cycle is still a major shortcoming of weather and climate models that employ the so-called mass-flux parameterization of atmospheric convection, as they typically predict the onset of deep convection too early, not allowing for a gradual convective deepening. In this work, it is argued that the problem of correctly representing the diurnal cycle of deep convection comes from the fundamental assumptions of the mass-flux formulation, in which it is considered that the clouds, represented by steady-state plumes, only interact with a spatially homogeneous environment. However, in the rapid shallow-to-deep transition, the convection still requires several hours to deepen, even if the environment remains steady, so some interactions must be missing. Here, a conceptual model for cloud development is introduced, in which a cloud is formed due to the sum of water transport from the boundary layer by multiple updrafts during its life-time, allowing for cloud-cloud interactions. This process captures local preconditioning, in which the clouds themself provide favorable conditions for the development of subsequent updrafts. It is also argued that the cold pools act as a reinforcement of this process, organizing the updrafts, and thus, allowing for a greater degree of local preconditioning. Based on this new conceptual model, it is argued that the shallow-to-deep transition can be seen as a predator-prey problem, in which the cloud population at the cloud base acts as prey, while the surface precipitation rate acts as predators. This simple predator-prey model is then tested against an idealized large-eddy simulation, showing that indeed, the rapid shallow-to-deep transition of atmospheric convection exhibits predator-prey characteristics. Moreover, it is shown how easily the simple predator-prey model can be implemented in current mass-flux schemes, leading to improved representation of deep convection within a diurnal cycle. Overall, this suggests that better representing the spatial organisation of clouds can lead to improvements in the timing of cloud and precipitation properties, thanks to a better convective memory.

How to cite: Vraciu, C.-V., Savre, J., and Colin, M.: Predator-prey characteristics of the rapid shallow-to-deep transition of atmospheric convection, EGU General Assembly 2024, Vienna, Austria, 14–19 Apr 2024, EGU24-10474, https://doi.org/10.5194/egusphere-egu24-10474, 2024.

EGU24-10894 | Posters on site | AS1.5

Organization of convection over Amazonia and its impact on transport 

Thibaut Dauhut, Héléna Gonthier, Bastien Viala, and Guido Haytzmann

Deep convection over Amazonia can manifest in various forms, from scattered convective cells to mesoscale organizations like squall lines and cloud clusters. This diversity significantly influences vertical convective transport, impacting not only large-scale circulation but also the poorly understood cycle of gases and aerosols emitted by the forest. Monitoring convective systems over Amazonia during the CAFE-Brazil field campaign (Dec 2022-Jan 2023) involved the HALO aircraft and the ATTO-Campina ground site, employing meteorological, aerosol, and chemical measurements.

On January 18, a 500-km wide mesoscale system dissipated, giving rise to new convective cells initially disorganized and later organized into a large squall line. This event was measured by ATTO-Campina and HALO during the local afternoon. To understand the processes driving organizational changes and their impact on transport, 24-hour simulations with the Meso-NH model were conducted over an 800-km wide domain, ranging from horizontal resolutions of 1600 m down to 200 m, ultimately resulting in large-eddy simulations.

The simulations revealed a strong resolution sensitivity in mesoscale convective organization, with a distinct emergence of squall lines at the finest resolutions only. Surprisingly, at fine resolution, organized convection exhibited larger transport due to increased updraft size, rather than intensity. Cloud cluster organization exhibited a delayed onset compared to convective cell organization, aligning with expectations. Ongoing investigations are currently focusing on gravity waves and cold pools to better understand their impact on convective organization.

How to cite: Dauhut, T., Gonthier, H., Viala, B., and Haytzmann, G.: Organization of convection over Amazonia and its impact on transport, EGU General Assembly 2024, Vienna, Austria, 14–19 Apr 2024, EGU24-10894, https://doi.org/10.5194/egusphere-egu24-10894, 2024.

Satellite infrared (IR) cloud imagery has proven valuable in the identification of Pyrocumulonimbus (pyroCb) clouds. The substantial brightness temperature difference observed between warm shortwave IR wavelengths (~4 μm) and window IR wavelengths (~11 μm) has served as a reliable marker for detecting daytime pyroCb. However, this indicator becomes ineffective during nocturnal hours when the enhanced brightness temperature at 4 μm is solely a daytime phenomenon, arising from PyroCb microphysics that increase solar reflectivity of clouds. We have developed a machine learning model designed to detect pyroCb events during nighttime using IR channels from the Advanced Baseline Imager (ABI) aboard GOES-16. The model leverages the distinctive characteristics of daytime IR channels as its training data. We applied the trained model to five intense pyroCb events in western North America during August 2017. Furthermore, we have employed an established cloud-tracking tool known as Tracking and Object-Based Analysis of Clouds (tobac) to analyze the evolution of the clouds plumes and infer their lifetimes. Our research aims to extend this case study on a global scale, with the objective of creating a comprehensive database for the lifetimes of pyroCb events. Such a database will enhance our understanding of pyroCb dynamics, which is helpful for investigating the radiative implications and the potential impact on stratospheric chemistry.

How to cite: Liu, F. and da Silva, A.: Detecting diurnal cycle and lifetime of pyrocumulonimbus using GOES-16 infrared data with a machine learning model , EGU General Assembly 2024, Vienna, Austria, 14–19 Apr 2024, EGU24-12581, https://doi.org/10.5194/egusphere-egu24-12581, 2024.

EGU24-13870 | ECS | Posters on site | AS1.5

Investigating Deep Convective Cores Combining CloudSat Observations and Model Simulations  

Zhuocan Xu, Pavlos Kollias, Alessandro Battaglia, Bernat Puigdomènech Treserras, and Peter Marinescu

The launch of the joint ESA JAXA Earth Cloud Aerosol and Radiation Explorer (EarthCARE) mission (May, 2024) marks the beginning of a new era of spaceborne radar measurements that target atmospheric convection. In addition to the EarthCARE mission that features the first Cloud Profiling Radar (CPR) with Doppler capability, NASA’s Investigation of Convective Updrafts (INCUS) and Atmosphere Observing System (AOS) missions aim to provide unique observations of convective dynamics. Prior to this upcoming decade of the study of atmospheric convection from space, the CloudSat CPR collected remarkable data of convective cores over a period of 15 years. Despite its high frequency that results in significant attenuation and multiple scattering effects, the 94-GHz CloudSat CPR offers a relatively small footprint (compared to the TRMM/GPM radar footprint of 5 km) and collocated radar-radiometer (passive) brightness temperatures (Tb). Here, we propose a refined deep convective core (DCC) identification scheme by first selecting the CPR profiles with continuous echoes between below 2 and above 10 km. The 10-dBZ echo top height is also required to exceed 10 km and located within 2 km from cloud top. Additionally, profiles with stratiform precipitation flags in the CloudSat products are not included in the analysis.

We investigated the CloudSat observations from 2006 to 2019 globally and also with a focus over 4 convective basins where model simulations are performed by the NASA’s INCUS science team. The four deep convection basins are Amazon, Congo, Philippines, and Western Pacific, which represent a decent spectrum of atmospheric environments. It is found that the DCCs over the Congo basin are featured with larger size and likely more intensified updrafts, while the Western Pacific is characterized with finer-scale cores. The analysis shows that the DCCs with size below 5 km predominate, implying the narrow cores can be under detected by the large-footprint radars such as GPM. The distinct depressions of 94-GHz Tb due to the presence of high-density ice particles lend complementary information on DCC classifications. In addition, multiple scattering can be a confounding factor in interpretating the CPR measurements within deep convective clouds. Our preliminary calculations suggest the impact of multiple scattering becomes significant at ~2.5 km from radar cloud top on average and is subject to the DCC updraft intensity. Moreover, profiles of 94-GHz radar reflectivity and Tb are forward calculated from the high-resolution model simulation outputs to understand the constraints that such observations can afford on key measures such as convective mass fluxes.

How to cite: Xu, Z., Kollias, P., Battaglia, A., Treserras, B. P., and Marinescu, P.: Investigating Deep Convective Cores Combining CloudSat Observations and Model Simulations , EGU General Assembly 2024, Vienna, Austria, 14–19 Apr 2024, EGU24-13870, https://doi.org/10.5194/egusphere-egu24-13870, 2024.

EGU24-14373 | Orals | AS1.5

Why can nighttime convection occur despite strong convective inhibition? 

Yi-Hung Kuo, Zhihong Tan, Ming Zhao, and J. David Neelin

Over continental plains, precipitation tends to peak in the late afternoon or during nighttime. The accurate simulation of the land precipitation diurnal cycle in GCMs has been a long-standing challenge. Nighttime surface cooling tends to yield a stable layer with large convective inhibition (CIN). However, CIN arises from traditional parcel considerations—measuring the inhibition for an infinitesimal parcel. Here, we argue that the CIN layer is less effective in inhibiting convection than previously thought for convective entities of typical horizontal cloud size.

A time-dependent process model for anelastic convective entities (ACE) is formulated to consistently include dynamic entrainment/detrainment as well as a representation of nonhydrostatic perturbation pressure. Spatially nonlocal effects mediated by the pressure field imply that horizontal feature size becomes a factor in the vertical conditional instability problem. ACE simulations using nighttime GoAmazon soundings with strong surface inversion demonstrate that the vertically nonlocal pressure response and its interaction with the surface boundary condition make the CIN layer ineffective for convective features of substantial horizontal size. Within the convective column, buoyancy of different signs offset each other via the nonlocal interaction over vertical scales comparable to the typical horizontal scale. Furthermore, the interaction with the surface tends to downweight the effectiveness of negative buoyancy contributions at low levels. This implies that a much smaller vertical velocity perturbation (or more generally, nonlocal buoyancy forcing from neighboring disturbances) can tunnel through the CIN layer. The same effect yields smaller magnitude for the mass flux above the CIN layer compared with steady plume models. 

A related implication of including spatially nonlocal interactions is that the vertical acceleration due to deep-convective buoyancy tends to extend above the level of neutral buoyancy (LNB). This results in cloud top much higher than the LNB, exhibiting the convective cold-top feature previously noted in observations. Results here point to revision for convective parameterizations. 

How to cite: Kuo, Y.-H., Tan, Z., Zhao, M., and Neelin, J. D.: Why can nighttime convection occur despite strong convective inhibition?, EGU General Assembly 2024, Vienna, Austria, 14–19 Apr 2024, EGU24-14373, https://doi.org/10.5194/egusphere-egu24-14373, 2024.

EGU24-14599 | Posters on site | AS1.5

Using Deep Learning for Convection Parameterization 

Guang Zhang, Yilun Han, and Yong Wang

Data-driven approaches using machine learning to parameterizing model physical processes in Earth System Models have been actively explored in recent years. Deep-learning-based convection parameterization is one such example. While significant progress has been made in emulating convection using neural networks (NN), serious roadblocks remain, including generalization of the NN-based scheme trained on model data from current climate to future climate and integration instability when it is implemented into the model for long-term integrations. This study uses a deep residual convolutional network to emulate convection simulated by a superparameterized global climate model (GCM). The NN uses the current environmental state variables and advection tendencies, as well as the history of convection to predict the GCM grid-scale temperature and moisture tendencies, cloud liquid and ice water contents from moist physics processes. Independent offline tests show that the NN-based scheme has extremely high prediction accuracy for all output variables considered. In addition, the scheme trained on data in the current climate generalizes well to a warmer climate with +4K sea surface temperature in an offline test, with high prediction accuracy as well. Further tests on different aspects of the NN architecture are performed to understand what factors are responsible for its generalization ability to a warmer climate. We are also able to perform multi-year integrations, without encountering any integration instability, when the scheme is implemented into the NCAR CAM5. The details will be presented at the meeting.

How to cite: Zhang, G., Han, Y., and Wang, Y.: Using Deep Learning for Convection Parameterization, EGU General Assembly 2024, Vienna, Austria, 14–19 Apr 2024, EGU24-14599, https://doi.org/10.5194/egusphere-egu24-14599, 2024.

EGU24-14717 | Orals | AS1.5

Intensification of daily tropical precipitation extremes from more organized convection 

Jiawei Bao, Bjorn Stevens, Lukas Kluft, and Caroline Muller

Tropical precipitation extremes and their changes with surface warming are investigated using global storm resolving simulations and high-resolution observations. The simulations demonstrate that the spatial organization of convection at mesoscale, a process that cannot be physically represented by conventional global climate models, is important for the variations of tropical daily precipitation extremes (total accumulations over a day). In both the simulations and observations, daily precipitation extremes increase in a more organized state, in association with larger, but less frequent, storms. Repeating the simulations for a warmer climate results in a robust increase in monthly-mean daily precipitation extremes. Higher precipitation percentiles have a greater sensitivity to convective organization, which is predicted to increase with warming. Without changes in organization, the strongest daily precipitation extremes over the tropical oceans increase at a rate close to Clausius-Clapeyron (CC) scaling. Thus, in a future warmer state with increased organization, the strongest daily precipitation extremes over oceans increase at a faster rate than CC scaling. Moreover, as the precipitation distribution becomes more uneven with increased organization, the tropics may not only face heavier precipitation extremes, but experience more extensive drying.

How to cite: Bao, J., Stevens, B., Kluft, L., and Muller, C.: Intensification of daily tropical precipitation extremes from more organized convection, EGU General Assembly 2024, Vienna, Austria, 14–19 Apr 2024, EGU24-14717, https://doi.org/10.5194/egusphere-egu24-14717, 2024.

EGU24-16757 | Orals | AS1.5

Increase of a precipitation “brake” to stronger storms in kilometer-scale global warming simulations 

Maximilien Bolot, Olivier Pauluis, Lucas Harris, Kai Cheng, Timothy Merlis, Spencer Clark, Alex Kaltenbaugh, Linjiong Zhou, and Stephan Fueglistaler

As the atmosphere gets warmer, it is expected to hold more water vapor, thereby fueling stronger storms. At the same time, the condensation of this vapor increases the combined load of liquid water and ice aloft, forcing convection to do more work to lift water to the level where it precipitates. This takes away from the generation of kinetic energy, thereby creating a “brake” on atmospheric motions. The evolution of this precipitation “brake” with warming determines the magnitude of future storm intensification, with important societal implications. The new generation of kilometer-scale climate models is capable of projecting this evolution. In this presentation, we show how the NOAA/GFDL X-SHiELD experimental global storm-resolving model can be used to estimate the total mechanical work done by convection and the work done to lift water which is then subsequently dissipated by friction during precipitation. The statistics are computed in year-long simulations of the present climate and of a 4K warmer climate.

We find that the ratio of kinetic energy generation vs work spent to lift water is respectively 30% vs 70% of the total mechanical work done by convection on global average, with a relative stability across regions and in the present vs future climate.

Moving beyond regional averages, when we organize the space by decreasing values of dissipation, we find that the ratio of work spent to lift water to total mechanical work strongly increases in the most convective percentiles, that is, most of the work done by convection is used to lift water in the extremes, showing that water loading strongly opposes kinetic energy generation. We also find that the total work done by convection, the work spent to lift water and the precipitation-induced dissipation all increase similarly with warming in the most convective percentiles. This suggests that, as the Earth warms, the updrafts tend to “kill” themselves in situ from increased water loading instead of generating a response at larger scale.

How to cite: Bolot, M., Pauluis, O., Harris, L., Cheng, K., Merlis, T., Clark, S., Kaltenbaugh, A., Zhou, L., and Fueglistaler, S.: Increase of a precipitation “brake” to stronger storms in kilometer-scale global warming simulations, EGU General Assembly 2024, Vienna, Austria, 14–19 Apr 2024, EGU24-16757, https://doi.org/10.5194/egusphere-egu24-16757, 2024.

EGU24-16951 | ECS | Posters on site | AS1.5

Mapping km-scale global extreme rainfall onto mesoscale convective systems lifecycle, frequency and dynamics  

Benjamin Fildier, Maxime Carenso, Rémy Roca, and Thomas Fiolleau

Mesoscale convective systems are the building block of tropical precipitation, as more than 40% of global precipitation and more than 80% of extreme rainrates are produced by these organized systems. However, when investigating the sensitivity of global rain extremes, the behavior and morphology of organized storm systems are typically ignored and corresponding dynamics are instead interpreted using the textbook framework of a convecting parcel. Indeed, despite rich observational and case studies describing the internal dynamics and structures of MCSs, no conceptual framework exist to this day to bridge the gap between global hydrologic sensitivity and MCS behavior.

This work introduces new approaches to link extreme precipitation rates in the tropics to the occurrence, internal dynamics and lifecycle of individual MCSs. Individual storms are idenditifed based on by the Lagrangian tracking algorithm TOOCAN which tracks storm anvils over their lifecycle, and which has been applied to satellite observations and to global storm resolving models in the DYAMOND experiment. We first use this rich dataset to develop a numerical interface that maps the occurrence of extreme precipitation rate onto the MCS cloud shield. We then introduce a novel conceptual framework to decompose the sensitivity of precipitation extremes to the change in storm occurrence and change in internal dynamics within this cloud shield. 

Results are threefold. We demonstrate a robust phasing in the timing of global extreme rainrates within the storm lifecycle, robustly occurring at 25-30% of the storm's lifetime for the models and regions analyzed. The analytical decomposition confirms that in a given climate state, variability in the heaviest rainrates across regions mostly occur through changes in MCS frequency, rather than changes in their efficiency at producing rain. We finally argue that the sensitivity of extremes to climate state may occur through both a change in occurrence and a change in internal MCS dynamics.

How to cite: Fildier, B., Carenso, M., Roca, R., and Fiolleau, T.: Mapping km-scale global extreme rainfall onto mesoscale convective systems lifecycle, frequency and dynamics , EGU General Assembly 2024, Vienna, Austria, 14–19 Apr 2024, EGU24-16951, https://doi.org/10.5194/egusphere-egu24-16951, 2024.

EGU24-17683 | ECS | Orals | AS1.5

Characteristics of precipitating convection and moisture-convection relationships in global km-scale simulations 

Tobias Becker, Daisuke Takasuka, and Jiawei Bao

In this study, we compare convection characteristics in three models that are at the forefront of global km-scale modelling, the ICON model developed by the Max Planck Institute for Meteorology (MPI-M) and German Weather Service (DWD), the IFS developed by the European Centre for Medium-Range Weather Forecasts (ECMWF), and the NICAM model developed by the University of Tokyo, the Japan Agency for Marine-Earth Science and Technology (JAMSTEC) and the National Institute for Environmental Studies (NIES). For IFS and ICON, we analyse 1-year coupled simulations at 4.4 and 5 km resolution, respectively, which stem from Cycle 3 of the H2020 Next Generation Earth Modelling Systems (nextGEMS) project. For NICAM, we analyse a 1-year AMIP-type simulation at 3.5 km resolution. Convection schemes have been switched off in ICON and NICAM, while in the IFS the deep convection scheme’s cloud base mass flux is strongly reduced. 

Modelling convection at km-scale resolutions is both exciting and challenging because some important processes are already resolved at these scales (e.g., deep convection) but other important processes remain under-resolved (e.g., mixing of grid-scale updrafts with their environment). Thus, we analyse in this study what common issues exist in ICON, IFS and NICAM with respect to the convection characteristics in the tropics, in what respects all models do well and where there are substantial inter-model differences.

Specifically, we analyse local convection characteristics and show that compared to satellite observations, the models tend to overestimate precipitation intensity (NICAM and ICON), while they underestimate precipitation cell size and precipitation duration. We study mesoscale organisation by using different organisation metrics and show that the models tend to underestimate organisation, even though they all consistently show that when organisation is enhanced, heavy precipitation is enhanced as well. We also investigate moisture-convection relationships and show that the models generally do not moisten enough during a convective event compared to ERA5 reanalysis data. Consistently, the sensitivity of lower-tropospheric moisture variations to the life cycle of deep convection over ocean looks too weak in ICON and IFS.

Finally, we look at land-ocean differences of the convection characteristics and show that while all models capture the diurnal cycle of precipitation over ocean well, there are some substantial differences over land, even though biases are not consistent between the models. Over coastal regions of the Maritime Continent, ICON has too strong mean precipitation and a too strong diurnal cycle, whereas IFS overall underestimates both, connected to a too weak propagation of convection onto the ocean during nighttime, potentially connected to too weak cold pools. Meanwhile, NICAM has more realistic convection characteristics in these coastal regions.

How to cite: Becker, T., Takasuka, D., and Bao, J.: Characteristics of precipitating convection and moisture-convection relationships in global km-scale simulations, EGU General Assembly 2024, Vienna, Austria, 14–19 Apr 2024, EGU24-17683, https://doi.org/10.5194/egusphere-egu24-17683, 2024.

EGU24-20249 | ECS | Orals | AS1.5

Convective precipitation extremes may not increase beyond the Clausius-Clapeyron expectation 

Nicolas Da Silva and Jan Haerter

Flash floods arising from short-duration precipitation extremes are costly for the population, and their frequency and intensity could increase with global warming (Fowler et al., 2021). Understanding the mechanisms leading to extreme precipitation is thus essential. A common hypothesis for precipitation extremes is that they scale with temperature according to the thermodynamic Clausius-Clapeyron (CC) law. However, increases in short-duration precipitation extremes beyond the CC expectation (or super-CC) were reported in multiple regions. The super-CC scaling is currently understood as the combination of two effects: (1) an invigoration of convective precipitation through convective cloud feedbacks; (2) a statistical effect resulting from a shift in rain type, from light stratiform to heavier convective-type precipitation, with increasing temperatures.

This work revisits these hypotheses by identifying convective precipitation at an unprecedented high resolution (5 km spatially and 10 min temporally). For this, we employ the EUropean Cooperation for LIghtning Detection (EUCLID) lightning dataset to define convective precipitation and combine it with weather station data from the German weather service (Deutscher Wetterdienst, DWD). We show that while (total) extreme precipitation increases with a super-CC rate, the scaling of both convective and stratiform-type precipitation extremes is in accordance with the CC law. We thus conclude that the super-CC rate is explained by the statistical shift in rain type alone and refute any mechanistic origin. 

Mesoscale Convective Systems (MCSs), which dominate extreme precipitation events in Europe (Da Silva & Haerter, 2023), are known to contain both a convective and stratiform region (Houze, 1997). By tracking MCSs over Germany, we show that MCS extreme precipitation also features a super-CC rate, which we relate to a dramatic increase in their convective fraction for dew point temperatures exceeding 14 degrees Celsius. 

References:

Da Silva, N. A., & Haerter, J. O. (2023). The precipitation characteristics of mesoscale convective systems over Europe. Journal of Geophysical Research: Atmospheres, 128, e2023JD039045. https://doi.org/10.1029/2023JD039045

Fowler, H.J., Lenderink, G., Prein, A.F. et al. Anthropogenic intensification of short-duration rainfall extremes. Nat Rev Earth Environ 2, 107–122 (2021). https://doi.org/10.1038/s43017-020-00128-6

Houze, R. A. Stratiform precipitation in regions of convection: A meteorological paradox? Bulletin of the American Meteorological Society 78, 2179 – 2196 (1997). https://doi.org/10.1175/1520-0477(1997)078<2179:SPIROC>2.0.CO;2

How to cite: Da Silva, N. and Haerter, J.: Convective precipitation extremes may not increase beyond the Clausius-Clapeyron expectation, EGU General Assembly 2024, Vienna, Austria, 14–19 Apr 2024, EGU24-20249, https://doi.org/10.5194/egusphere-egu24-20249, 2024.

EGU24-20512 | ECS | Posters on site | AS1.5

Formation of thermal vortex rings 

Paweł Jędrejko and Jun-Ichi Yano

Geophysical convection is usually characterized by Reynolds number in the range typical for turbulent flow. Despite that, it displays features of organization.  
Thermal vortex rings are considered candidates for the basic elements of that order (Yano 2023, ch. 16).
In this work, the process of their formation from a spherical buoyancy anomaly is studied numerically. The buoyancy distribution is assumed to be uniform with a discontinuity at the interface.
The rising anomaly experiences a collapse at the bottom, and initially spherical shape is transformed into a torus. Neglecting diffusive processes, the system is uniquely defined by the vortex sheet coincident with the interface. For that reason, its evolution is considered on the grounds of vorticity dynamics with Lagrangian approach.
The vortex sheet is intensified by buoyancy and further subjected to Kelvin-Helmholtz instability. This starts in high wavenumbers increasing the effective thickness by purely advective mechanism. A similar instability is then launched in lower wavenumbers, and the phenomenon repeats hierarchically. As a result, the energy is transferred from small to large scales. The same mechanism also drives the interfacial mixing by applying stretching and folding repetitively. This makes it a good starting point for further studies on the entrainment rate and order emerging out of chaos. 

How to cite: Jędrejko, P. and Yano, J.-I.: Formation of thermal vortex rings, EGU General Assembly 2024, Vienna, Austria, 14–19 Apr 2024, EGU24-20512, https://doi.org/10.5194/egusphere-egu24-20512, 2024.

EGU24-328 | ECS | Orals | AS1.6

Object-Based Analyses of Mesoscale Convective Systems and Embedded Storms over the Indian Monsoon Zone Using Datasets from Satellite, Radar and Model Simulations                

Manisha Tupsoundare, Sachin Deshpande, Zhe Feng, Subrata kumar Das, Medha Deshpande, and Harshad Hanmante

Mesoscale convective systems (MCSs), the largest type of deep convective storms are formed when convection aggregates and grows upscale, forming a distinct mesoscale circulation through the interaction of multiple storms. Thus, storms play an important role in MCS organization. Due to their large size, longer duration, and larger precipitation, MCSs cause high-impact extreme weather events like lightning, damaging hail, gusty winds, and flooding. During the Indian summer monsoon (June-September), synoptic-scale weather systems move across the monsoon zone (MZ), causing MCSs to form frequently. MCSs often produce widespread and heavy rain throughout the MZ. Hence, studies on structure and evolution of MCSs highlighting the organization of convection are needed for an improved understanding of MCS.

In this study, we used an object-based cloud-tracking method (Feng et al., 2018) to identify and track MCSs and embedded storms in remote sensing observations and numerical simulations. The work is divided into three parts. In the first part, we tracked MCSs over the monsoon zone using geostationary satellite infrared brightness temperature (IRTb) and GPM IMERG precipitation from June-September, 2014 to 2019 and examined various aspects of observed MCSs (n=2092) such as spatial coverage, diurnal cycle, rainfall amount, and land-ocean contrast. The majority of MCSs are positioned in the monsoon trough's southeast-northwest stretch and account for more than 60% of total precipitation. For MCSs with short and long lifespans, there was a clear land-ocean divide and varied lifecycle trends. Oceanic MCSs last longer, are deeper, and provide more rainfall over a larger area than land-based MCSs.

In the second part of the study, we explored embedded storm structures for those MCSs that exist within the radar domain (n=65) by applying a storm classification algorithm to the S-band Doppler radar observations during June-September 2015. We observed that an MCS contains many precipitation features, especially during early stages of development when multiple convective clusters begin to amalgamate. Furthermore, we investigated the co-evolution of numerous storm parameters (e.g., areas of convective/stratiform precipitation, convective core length, and top heights) as a function of MCS lifetime. Distinct vertical structures are observed for the convective, stratiform, and anvil components of MCSs.

In the third part of this work, we examine the ability of a convection-permitting Weather Research Forecast (WRF) model in simulating MCSs and their characteristics (initiation, size, intensity, lifetime, propagation) during June-September 2015. A similar cloud-tracking algorithm is applied to WRF-simulated data (reflectivity, IRTb, and precipitation) to identify and track MCS in the simulation. Although the model underestimated the number of observed MCSs, the composite evolution and frequency distribution of convective area, precipitation amount, MCS propagation speed produces reasonable agreement with observations but underestimate stratiform areas. Consistent with observations, the simulated MCS properties showed a gradual increase from convective initiation to around the first half of the MCS lifetime. We observed that an MCS contains multiple precipitation features, particularly during the initial development stage when multiple convective clusters begin to aggregate. More details on observed MCSs and embedded storm structures, as well as their representation in simulation, will be presented.

How to cite: Tupsoundare, M., Deshpande, S., Feng, Z., Das, S. K., Deshpande, M., and Hanmante, H.: Object-Based Analyses of Mesoscale Convective Systems and Embedded Storms over the Indian Monsoon Zone Using Datasets from Satellite, Radar and Model Simulations               , EGU General Assembly 2024, Vienna, Austria, 14–19 Apr 2024, EGU24-328, https://doi.org/10.5194/egusphere-egu24-328, 2024.

EGU24-1300 | Posters on site | AS1.6

Ensemble Sensitivity-Based Subsetting for Convection: Progress Toward Operational Use 

Brian Ancell and Austin Coleman

Ensemble sensitivity is a statistical tool applied within an ensemble that reveals the atmospheric flow features (e.g. position of a jet streak, or magnitude of a low-level moisture plume) at early forecast times that are related to a chosen forecast response later in the forecast window.  The response function is chosen to diagnose high-impact forecast features such as maximum updraft helicty over a specified area, or number of grid points of simulated reflectivity exceeding 40 dBZ in a chosen region.  Since ensemble sensitivity highlights the features early in a forecast important to the prediction of high-impact features later in the forecast, a subset of members with the smallest errors in sensitive regions can be chosen that might improve probabilistic forecasts of the response relative to the full ensemble. Similar to ensemble data assimilation, this process incorporates observational information to beneficially update forecast distributions.  The subsetting procedure can be done quickly once an ensemble has been run, and sensitivity-based subsets can typically be generated well before the next extended forecast can be run within a cycling storm-scale data assimilation and forecasting system. In turn, the subsetting procedure, if shown to improve forecasts, could be a unique and useful operational forecasting tool.


Ensemble sensitivity-based subsetting has been tested within the Texas Tech University operational ensemble system in both an idealized framework and in more operational settings in real time during several years of the National Oceanic and Atmospheric Administration (NOAA) Hazardous Weather Testbed (HWT).  Response functions that diagnose severe convective hazards, such as updraft helicity, hail size, and simulated reflectivity have been tested to gain an understanding of both the general capability of the technique and the perception of forecasters regarding its value in a real-time forecasting environment.  Here we discuss this effort and its associated results, the technique’s current status, and future plans toward ultimate operational implementation.

How to cite: Ancell, B. and Coleman, A.: Ensemble Sensitivity-Based Subsetting for Convection: Progress Toward Operational Use, EGU General Assembly 2024, Vienna, Austria, 14–19 Apr 2024, EGU24-1300, https://doi.org/10.5194/egusphere-egu24-1300, 2024.

EGU24-1675 | Orals | AS1.6 | Highlight

ML for weather prediction at Météo-France : current status and future plans 

Laure Raynaud, Clément Brochet, and Gabriel Moldovan

Applications of Machine Learning (ML) in the different stages of weather forecasting have considerably developed recently. Such progress is likely to change the landscape and offer new perspectives to speed up and improve forecast performances, at different spatio-temporal scales. In this context, Météo-France engaged more actively in this new area of research, with the objective to further explore the capabilities and opportunities of ML for operational forecasting. Major ongoing projects include ML to significantly enhance the size of convective-scale ensemble forecasts, high-resolution statistical downscaling and the development of data-driven kilometre-scale forecasting systems. Early results will be presented and our short-term roadmap will be discussed.

How to cite: Raynaud, L., Brochet, C., and Moldovan, G.: ML for weather prediction at Météo-France : current status and future plans, EGU General Assembly 2024, Vienna, Austria, 14–19 Apr 2024, EGU24-1675, https://doi.org/10.5194/egusphere-egu24-1675, 2024.

EGU24-1936 | ECS | Orals | AS1.6

Mesoscale Convective Systems across Australia 

Ewan Short and Todd Lane

A major aspiration of operational and research meteorology is to relate the average behaviour of convective-scale flows to the more predictable, larger-scale flows in which they occur. This goal is difficult, partly because convective flows often self-organize at mesoscales, with the dynamics of such mesoscale convective systems (MCSs) distinct from those at convective and synoptic scales. In this study we use a tracking algorithm to detect MCSs in Australian operational radar data, revealing regional, seasonal and sub-seasonal, i.e. synoptic, differences in organizational characteristics. Restricting to MCS observations with nominally two-dimensional mean system-relative flows, spatio-temporal organizational differences are generally well explained by theoretical ideas regarding the breakdown of two-dimensional overturning flows. Theoretically, breakdown is characterised by a single non-dimensional convective Richardson number R, which provides the ratio of thermodynamic potential energy to inflow kinetic energy. Specifically, 76% of MCS relative trailing-stratiform, up-shear tilted observations, nominally associated with primarily non-overturning system-relative flows, occur when R>5, whereas 72% of relative leading-stratiform, down-shear tilted observations, nominally indicating primarily overturning system-relative flows, occur when R<5. Spatiotemporal variations in observed organizational characteristics are broadly consistent with spatiotemporal variations in median R. These results likely have implications for convective parametrisation, and operational convective permitting model testing and development.

How to cite: Short, E. and Lane, T.: Mesoscale Convective Systems across Australia, EGU General Assembly 2024, Vienna, Austria, 14–19 Apr 2024, EGU24-1936, https://doi.org/10.5194/egusphere-egu24-1936, 2024.

The Advanced Geostationary Radiation Imager (AGRI) onboard the FY-4A geostationary satellite provides high spatiotemporal resolution visible reflectance data since March 12th, 2018. Data assimilation experiments under the framework of observing system simulation experiment have shown great potential of these data to improve the forecasting skills of numerical weather prediction (NWP) models. To effectively assimilate the AGRI data, it is important to address the quality the observations. In this study, the FY-4A/AGRI channel 2 (0.55 μm - 0.75 μm) reflectance was evaluated by the equivalents derived from the short-term model forecasts of the China Meteorological Administration Mesoscale Model (CMA-MESO) using the Radiative Transfer for TOVS (RTTOV, v 12.3). It is shown that the observation minus background (O – B) statistics could be used to reveal the abrupt changes related to the measurement calibration processes. In addition, O - B statistics are negatively biased. Potential causes include measurement errors, the unresolved processes, forward-operator errors, etc. The relative mean biases of O-B computed for cloud-free and cloudy pixels were used to correct the systematic differences for cloudy and clear pixels separately. Results indicate that the bias correction method could effectively reduce the biases and standard deviations of O-B. In addition, an ensemble forecast has advantages over a deterministic forecast in correcting the biases in FY-4A/AGRI visible reflectance data. The finding suggests an effective method to monitor the performance of FY-4A/AGRI visible measurements and to correct the biases in the observations. 

How to cite: Zhou, Y., Liu, Y., Zeng, Y., and Han, W.: Evaluation of FY-4A/AGRI visible reflectance using the equivalents derived from the forecasts of CMA-MESO using RTTOV, EGU General Assembly 2024, Vienna, Austria, 14–19 Apr 2024, EGU24-2793, https://doi.org/10.5194/egusphere-egu24-2793, 2024.

The historic 22-26 May 2015 flood event in Texas and Oklahoma was caused by anomalous clustered mesoscale convective systems (MCSs) that produced record-breaking rainfall and $3 billion of damage in the region. A month-long regional convection-permitting simulation is conducted to reconstruct multiple clustered MCSs that lead to this flood event. We further use the pseudo global warming approach to examine how a similar event may unfold in a warmer climate and the driving physical factors for the changes. Tracking of MCSs in observations and simulations shows that the historical simulation reproduces the salient characteristics of the observed MCSs. In a warmer climate under a high-emission (SSP5-8.5) scenario, the Southern Great Plains is projected to experience a near surface warming of 4-6 K, accompanied by enhanced moisture transport by the strengthened Great Plains low-level jet. A warmer and moister lower troposphere leads to 36-59% larger convective available potential energy, supporting wider and more intense convective updrafts and rainfall production. Consistently, MCSs have wider convective areas and stronger rainfall intensities, producing 50% larger rain volumes during the mature stage. Extreme (99.5%) MCS rainfall frequency and amount will increase by threefold (Fig. 1). However, MCS stratiform rain area decreases as a result of elevated stratiform cloud bases that lead to stronger sublimation and evaporation of precipitation in response to warming, resulting in reduced weak-to-moderate surface precipitation. Results suggest that global warming greatly increases precipitation intensity of clustered MCS events under strong synoptic influence, with much higher potential to produce serious floods without additional climate adaptation.

Figure 1. (a) Frequency distribution of MCS grid-point hourly rain rates, and (b) normalized cumulative distribution of rainfall amount by hourly rain rates. The region of the data included is show in the inset.

How to cite: Feng, Z., Chen, X., and Leung, R.: How Might the May 2015 Flood in the U.S. Southern Great Plains Induced by Clustered MCSs Unfold in the Future?, EGU General Assembly 2024, Vienna, Austria, 14–19 Apr 2024, EGU24-3210, https://doi.org/10.5194/egusphere-egu24-3210, 2024.

This study examines the urban impacts associated with a developed city belt on generating an afternoon heavy rainfall event over a coastal developing city that is 70–100 km downwind from the city belt over the Yangtze River Delta region. Observational analyses show pronounced urban heat island (UHI) effects along the upstream city belt prior to convection initiation (CI). A series of cloud-permitting model simulations with the finest grid spacing of 1 km are performed to examine the impacts of urbanization on CI and the subsequent heavy rainfall event. Results reveal the generation of warm anomalies and low-level convergence in the planetary boundary layer along the upstream city belt, thereby inducing upward motion for CI. The southwesterly flows of the monsoonal warm-moist air, enhanced by the UHI effects along the city belt, allow the development of convective cells along the belt. Some of the cells merge during their downstream propagation, promoting to the ultimate generation of the distinct heavy rainfall centers in favor of local convective clusters over the coastal city where atmospheric columns are more moist and potentially unstable under the influences of sea breezes. Sensitivity simulations show small contribution of the downstream city but more influences from the upstream city belt on the heavy rainfall event. The above findings help elucidate how the UHI effects could assist the CI in a weak-gradient environment, and explain why urbanization can contribute to increased downwind mean and extreme precipitation under the influences of favorable regional forcing conditions. These findings have been published in Monthly Weather Review.

How to cite: Jiang, X., Zhang, D.-L., and Luo, Y.: Influences of urbanization on an afternoon heavy rainfall event over the Yangtze River Delta region in East China, EGU General Assembly 2024, Vienna, Austria, 14–19 Apr 2024, EGU24-3714, https://doi.org/10.5194/egusphere-egu24-3714, 2024.

The impact of urbanization and the sensitivity of urban canopy parameters (UCPs) on a typical summer rainfall event in Hangzhou, China, is investigated using three groups of ensemble experiments. In this case, urbanization leads to higher temperatures, lower mixing ratios, lower wind speeds before precipitation, and more precipitation in and around the urban area. Both the thermal and dynamical effects of urbanization contribute to an increase in temperature and precipitation, with thermal effects contributing 71.2% and 63.8% to the temperature and precipitation increase, respectively, while the thermal and dynamical impacts cause the opposite changes to the mixing ratio and wind speed. Compared to the other three meteorological elements, the model has the largest uncertainty in the simulation of precipitation, which includes the sensitivity of the different parameterization schemes to the simulation of precipitation in urban areas, and the uncertainty brought by the urban effect on precipitation is not confined within the city but extends to the surrounding areas as well. Temperature and mixing ratio are more sensitive to thermal-related UCPs, while the wind speed is mainly affected by the structural parameters. These variations, however, are sometimes contradictory to precipitation changes, which further adds to the complexity of precipitation simulation.

How to cite: Wu, M., Dong, M., Chen, F., and Yang, X.: Impacts of Urbanization and Its Parameters on Thermal and Dynamic Fields in Hangzhou: A Sensitivity Study Using the Weather Research and Forecasting Urban Model, EGU General Assembly 2024, Vienna, Austria, 14–19 Apr 2024, EGU24-3735, https://doi.org/10.5194/egusphere-egu24-3735, 2024.

EGU24-4082 | ECS | Orals | AS1.6

Assessing the influence of observations on the analysis in ensemble-based data assimilation systems 

Guannan Hu, Sarah Dance, Alison Fowler, David Simonin, and Joanne Waller

Convection-permitting numerical weather prediction (NWP) is crucial for forecasting high-impact weather events such as heavy precipitation, storms, floods, wind gusts and fog. The assimilation of observations plays a significant role in improving the forecasting skill of these weather events. To make better use of existing observations and guide the design of future observation networks, accurately assessing the influence of assimilated observations is essential. The degrees of freedom for signal (DFS) has long been used to assess the influence of observations on the analysis. While various methods exist for calculating the DFS in variational data assimilation (DA) systems, calculating the DFS in ensemble-based DA systems (e.g., the ensemble transform Kalman filter) is a largely unexplored area. Since ensemble-based DA systems are becoming increasingly dominant for convection-permitting NWP, practical implementation of the DFS in such DA systems is needed. Unlike in variational DA systems, the background error covariance matrix is not static in ensemble-based DA methods. Consequently, the DFS calculated at each assimilation step measures the observation influence for a certain background error covariance matrix. This means that the DFS estimates are flow dependent. In addition, domain localisation of observations is often used in ensemble-based DA systems (e.g., local ensemble transform Kalman filter). This implies that the DFS should be calculated locally. In this work, we propose novel approaches for calculating the DFS in ensemble-based DA systems and investigate existing approaches applicable to such systems. We establish their consistency under idealised conditions and discuss their differences in practical applications. To validate our theoretical findings, we conduct simple numerical experiments using JEDI (Joint Effort for Data assimilation Integration) developed by JCSDA (Joint Center for Satellite Data Assimilation).  Our results provide useful information for assessing the influence of observations in ensemble-based DA systems. This work is financially supported by the Met Office and is fully in line with the Met Office’s strategy and its ongoing development of the next generation data assimilation and observation processing system.

How to cite: Hu, G., Dance, S., Fowler, A., Simonin, D., and Waller, J.: Assessing the influence of observations on the analysis in ensemble-based data assimilation systems, EGU General Assembly 2024, Vienna, Austria, 14–19 Apr 2024, EGU24-4082, https://doi.org/10.5194/egusphere-egu24-4082, 2024.

Frequent air pollution episodes pose severe health and environmental challenges in Tehran, Iran. Despite recent efforts, pollutant levels often exceed WHO-based national standards. This study addresses the pressing need for accurate air quality prediction by leveraging advanced satellite data and machine learning techniques. Our methodology integrates Sentinel-5P satellite data with optical depth remote sensing information. We systematically evaluated five machine learning algorithms to identify the most effective approach for AQI prediction. This study aims to advance air quality prediction in Tehran by integrating Sentinel-5P satellite data with machine learning algorithms. We examined the efficacy of various algorithms, including Decision Tree, K-Nearest Neighbors, Random Forest, Support Vector Machine, and Logistic Regression, in correlating air pollutant levels with the Air Quality Index (AQI). The selection criteria focused on algorithmic efficiency and accuracy in handling diverse environmental datasets. The Random Forest algorithm, utilizing Sentinel-5P and optical depth data, achieved a remarkable accuracy of 74% in predicting AQI. Further enhancement was observed by incorporating climatic data, COVID-19 status, and environmental parameters; the model achieved a significant predictive accuracy of up to 75.6%. These findings underscore the critical impact of nitrogen dioxide, ozone, and aerosol optical depth on Tehran's AQI, with notable variations observed post-COVID-19 restrictions. The increase in AQI following the lifting of COVID-19 restrictions suggests a significant correlation between human activity and air quality. These insights can inform targeted environmental policies in Tehran. We demonstrate the potential of integrating satellite data with machine learning to predict AQI accurately. Our approach offers a scalable model for urban air quality management with implications for environmental policy and public health initiatives.

How to cite: Kafi, A. M., Hosseinipoor, M., Zare Shahne, M., and Jamaat, A.: Integrating Sentinel-5P Satellite Data and Machine Learning Algorithms for Air Quality Index Prediction in Tehran: A Comprehensive Study on Factors Influencing Air Quality, EGU General Assembly 2024, Vienna, Austria, 14–19 Apr 2024, EGU24-4506, https://doi.org/10.5194/egusphere-egu24-4506, 2024.

EGU24-5305 | ECS | Posters on site | AS1.6

Testing Hybrid-3DEnVar in the convective scale NWP model AROME-Austria 

Kaushambi Jyoti, Martin Weissmann, Philipp Griewank, and Florian Meier
We test a Hybrid 3-Dimensional Ensemble Variational (Hybrid-3DEnVar) Data Assimilation (DA) method in the limited-area NWP model AROME over Austria at 2.5km horizontal resolution, with a flow-dependent error covariance matrix sampled from a 50-member ensemble.
Rapidly evolving highly non-linear convective-scale processes and the unique orography of the Austrian Alps intensify the complexities of estimating model error correlations. While the climatological error covariance matrix can not well represent the non-linear error growth of convective-scale weather, these errors can be incorporated into the assimilation using the ensemble-based error covariance matrix. We explore 11 weighted combinations of climatological and sampled covariance matrices, ranging from a purely climatological (weight of 0) to a purely ensemble-based (weight of 1) B-matrix, with incremental weight adjustments to the ensemble by 10 percent increments. The pure climatological configuration (3-dimensional variational data assimilation, 3DVar) is the operational DA scheme of GeoSphere Austria and serves as a comparative benchmark for our experiments. Multiple distinct summertime convective weather scenarios with a special focus on local convection were tested, while cold and warm fronts also influenced some of these cases. Aircraft wind and temperature observations are split into assimilated and non-assimilated parts so that the latter serves as validation for the analysis.
The resulting analysis from the Hybrid-3DEnVar configuration outperforms the operational 3DVAR of GeoSphere Austria, indicating a substantial leap forward in forecast accuracy of convective scale weather within Austria’s complex terrain. However, the optimal weight to the ensemble-based covariances for the optimal analysis strongly depends on the weather phenomenon investigated.
Keywords: AROME-Austria, Hybrid-3DEnVar, a 50-member ensemble, convective scale, and non-linear error growth.


How to cite: Jyoti, K., Weissmann, M., Griewank, P., and Meier, F.: Testing Hybrid-3DEnVar in the convective scale NWP model AROME-Austria, EGU General Assembly 2024, Vienna, Austria, 14–19 Apr 2024, EGU24-5305, https://doi.org/10.5194/egusphere-egu24-5305, 2024.

EGU24-5399 | ECS | Posters on site | AS1.6

Characteristics of Warm‐Season Mesoscale Convective Systems Over the Yangtze–Huaihe River Basin (YHR): Comparison Between Radar and Satellite 

Yutong Lu, Jianping Tang, Xin Xu, Ying Tang, and Juan Fang

Mesoscale convective systems (MCSs) are crucial in modifying the water cycle and frequently induce high-impact weather events over eastern China. Radar and Climate Prediction Center (CPC)-4 km satellite-derived infrared cloud top temperature (Tb) data were used to thoroughly analyze the long-term climatology of MCSs over eastern China, particularly in the Yangtze–Huaihe River Basin (YHR) in the warm season from 2013 to 2018. For the first time, we contrasted the effects of data set selection and threshold setting on research outcomes. The large-scale environments of MCSs initiation were also investigated using the latest global reanalysis data ERA5. It is found that striction of thresholds, including duration, reflectivity/Tb, area, and linearity, would lead to a greater proportion of early-morning MCSs. Satellite-identified MCSs differed from radar-derived ones, exhibiting afternoon diurnal peaks, faster movement speeds, longer travel distances, and expansive impact areas. The center of MCS and related precipitation shifted northward from Pre-Meiyu to Post-Meiyu seasons, contributing to up to 20% of total rainfall, with most MCSs moving along eastward trajectories. MCSs typically had the most substantial impact in the Meiyu season because of the most prolonged duration, largest convective core area, and strongest precipitation intensity. Warm-season MCSs initiated ahead of midlevel troughs and were related to strong anomalous low-level convergence and midlevel upward. The circulation anomalies were the strongest in the Pre-Meiyu season among the three subseasons, with most moisture sourced from the southwest.

How to cite: Lu, Y., Tang, J., Xu, X., Tang, Y., and Fang, J.: Characteristics of Warm‐Season Mesoscale Convective Systems Over the Yangtze–Huaihe River Basin (YHR): Comparison Between Radar and Satellite, EGU General Assembly 2024, Vienna, Austria, 14–19 Apr 2024, EGU24-5399, https://doi.org/10.5194/egusphere-egu24-5399, 2024.

Using the FengYun (FY) satellite products and hourly rain gauge data, the east-moveing regional rainfall events (RREs) with long duration and large areas originated in the northeastern Tibetan Plateau (TP) were identified. Our findings reveal that 70% of heavy and long-duration(≥6h) RREs originating in the northeastern TP have the potential to move a thousand kilometers eastward during the warm-season. We noted distinct differences in the speed and spatial location of rainfall for the two types of eastward-moving RREs under investigation.. For the long-distance eastward-moving RREs, three local enhancements of precipitation centers, corresponding to the center moving out of 105°E, 110°E and 115°E are evident. In contrast, for the short-distance eastward-moving RREs, the precipitation centers mainly reach the second topographical terrace without further eastward moving. The evolution of mid-level trough and upper troposphere warm anomalies are closely related to the eastward-moving RREs. With the eastward movements of middle troposphere trough, coupled with the synergistic effects of the convergence and a change in wind orientation at the lower level, and the divergence at the upper-level, collectively contribute to the long-distance eastward moving RREs. The short-distance eastward moving RREs, influenced by the ridge of western Pacific subtropical high over North China and the low-level anomalous anticyclone, remains west of 110°E. This study offers an in-depth understanding of how upstream precipitation events influences the downstream rainfall.

How to cite: Chen, H. and He, M.: The characteristics of eastward-moving regional rainfall events originating in the northeastern of Tibetan plateau, EGU General Assembly 2024, Vienna, Austria, 14–19 Apr 2024, EGU24-5848, https://doi.org/10.5194/egusphere-egu24-5848, 2024.

EGU24-5880 | Orals | AS1.6

Multiday mesoscale soil moisture persistence and atmospheric predictability – an illustration from the Sahel 

Christopher Taylor, Cornelia Klein, and Bethan Harris

The hydro-climate of the Sahel is dominated by organised Mesoscale Convective Systems (MCSs), which typically bring intense rain every few days during the West African Monsoon season. MCSs leave a swath of wet soil often hundreds of kilometres across, which in turn create strong spatial patterns of surface fluxes of heat and water back into the atmosphere. Previous studies have shown that soil moisture patterns exert a strong control on the initiation and propagation of MCSs, significantly enhancing the predictability of convection on scales of 10 – 100s km. Here, we use satellite observations to examine how this strong, locally negative, soil moisture-precipitation feedback evolves and impacts rainfall patterns over a series of storms.

We track the response of the surface and atmosphere to over 5,000 MCS events from the period 2004-2020, using a combination of satellite-derived products (Land Surface Temperature; LST, soil moisture, Vegetation Optical Depth, rainfall, cloud-top temperature). Initial anomalies in LST and soil moisture weaken rapidly in the 3-4 days after the MCS, particularly in climatologically wetter regions. However, a statistically significant memory of the original MCS event still remains in surface anomalies out to 20 days. In terms of rainfall, we see a strong suppression of convection in the first 48 hours after the MCS in areas which initially received heavy rain. There is also some evidence of enhanced MCS activity around the edges of the original swath in the first 4 days. The persistence over several days of mesoscale rainfall patterns anti-correlated with the original MCS point to an important role for surface-atmosphere feedbacks. Synoptic forcing cannot explain the finer scale rainfall response, whilst post-MCS cold pool effects are too short-lived. On longer time scales (5-20 days) in climatologically drier areas, we also find a weak but statistically significant enhancement of rainfall around the original initiation zone.

These results have important implications for rainfall forecasting on scales of tens to several hundred kilometres. Pre-existing soil moisture heterogeneity provides strong predictability of where future convection will occur under favourable synoptic conditions. This provides skill out to 2-4 days, but strongly depends on regional rainfall frequencies. Because new MCSs create new soil moisture patterns, the combination of storms every few days and a strong negative land feedback at the mesoscale actively degrades longer term predictability within the rainy season, effectively limiting intra-seasonal to seasonal forecast skill for severe weather.

How to cite: Taylor, C., Klein, C., and Harris, B.: Multiday mesoscale soil moisture persistence and atmospheric predictability – an illustration from the Sahel, EGU General Assembly 2024, Vienna, Austria, 14–19 Apr 2024, EGU24-5880, https://doi.org/10.5194/egusphere-egu24-5880, 2024.

EGU24-6302 | Orals | AS1.6

Relationships between growing cloudy updrafts, deep convection initiation, and orographic flow 

James Marquis, Adam Varble, Zhe Feng, Enoch Jo, and William Gustafson

Shallow cumulus cloud fields often organize and deepen within regions of mesoscale ascent associated with orographic flows. However, there is significant uncertainty in the relative roles of mesoscale and cloud-scale factors ultimately controlling the location of orographic deep convection initiation (DCI). These factors include spatial heterogeneity of the magnitude of mesoscale vertical mass flux associated with orographic convergence, near-cloud convective ingredients (e.g. CAPE, CIN, LFC, and shear), and entrainment effects. More fundamentally, it is not well understood how these factors influence the initial width and strength of low-level cloudy updrafts, which are increasingly cited as important governors of their ultimate depth potential. Thus, it is important to better understand these relationships for increased predictability of DCI.


Numerous DCI events observed along the Sierras de Córdoba range during the Cloud, Aerosol, and Complex Terrain Interactions (CACTI) project were modeled by the U.S. Department of Energy’s LES ARM Symbiotic Simulation and Observation (LASSO) team. In this study, we examine the connection between low-level cloudy updrafts, DCI, and the ascent associated with the mesoscale orographic circulation using LES with 100-m and 500-m grid spacing across multiple days. We hypothesize that the width and strength of low-level cloudy updrafts and the probability of DCI events along the ridge are proportional to the width, strength, and depth of the local orographic convergence. To test this, we examine correlations between the width and depth of developing cloudy updrafts and the: i) 3D structure of the evolving orographic ascent, and ii) convective meteorological ingredients (e.g., convective available potential energy, convective inhibition, level of free convection, moisture, etc.).


Preliminary results indicate that DCI events do not always occur in regions of the strongest or widest orographic ascent along the mountain range. Further, the strength and width of low-level cloudy updrafts that precede DCI are only weakly correlated with most orographic ascent metrics. Overall, the apparent relative roles of mesoscale ascent and convective sounding parameters governing DCI varied significantly across case days. Near-cloud relative humidity located near and just above the level of free convection steadily increased with time during each afternoon, likely owing to orographic vertical moisture flux and/or cloud detrainment. Thus, in addition to highly varied roles of the background conditions, the fate of individual growing cloudy updrafts may further depend on complex cloud-scale factors, such as entrainment and microphysical processes.

How to cite: Marquis, J., Varble, A., Feng, Z., Jo, E., and Gustafson, W.: Relationships between growing cloudy updrafts, deep convection initiation, and orographic flow, EGU General Assembly 2024, Vienna, Austria, 14–19 Apr 2024, EGU24-6302, https://doi.org/10.5194/egusphere-egu24-6302, 2024.

  Recently, the increase in convective storms that develop rapidly within a short period of time and on a very small area causes severe damage to property and human life. Thus, it is important to understand the characteristics of convective activities and to provide the information about severity of the developing storms.  In order to address these issues, object-based analysis of convective systems is essential to provide severity information on convective precipitation systems including their life-cycle from initiation to dissipation. 
  In this study, we analyzed the developing stage of convective storms by using the statistics of storms detected by the Fuzzy Logic Algorithm for Storm Tracking (FAST). The Column Maximum (CMAX) was used to provide the information on detection and severity of storms. A convective storm was defined as a CMAX values above 35dBZ and small convective cells with an area less than 20km2 were filtered out. The identified storm was tracked on a fuzzy basis using storm speed and its morphological characteristics. Within the detected storm area, we analyzed the characteristics of the storm by averaging variables such as reflectivity (ZH), echo top height corresponding to ZH, rainfall rate at 1.5km altitude, VIL (Vertical Integrated Liquid) contents, etc.
  This study aims to provide quantitative information on severity of individual storms by using these radar variables and storm characteristics. We calculated and modified the threshold values of each predictor for determining the severity of the convective storms. Furthermore, we plan to analyze the intensity and frequency of severe precipitation storms in associated with the occurrence or absence of lightning event during their life cycle.

Key words : Weather Radar, convective storms, Radar parameter, storm severity

※ This research was supported by the "Development of radar based severe weather monitoring technology (KMA2021-03121)" of "Development of integrated application technology for Korea weather radar" project funded by the Weather 

How to cite: Kang, E., Kwon, S., and Lee, S.: Analysis of convective storm characteristics to classify the storm severity information using weather radar variables, EGU General Assembly 2024, Vienna, Austria, 14–19 Apr 2024, EGU24-6900, https://doi.org/10.5194/egusphere-egu24-6900, 2024.

EGU24-8069 | ECS | Posters on site | AS1.6

Towards the assimilation of dual-polarization radar data 

Tatsiana Bardachova, Maryam Ramezani Ziarani, and Tijana Janjic

The forecast accuracy of numerical weather prediction models is strongly determined by the precision of the initial conditions, especially for storm and convective-scale weather prediction. Since radars allow to capture the internal structure and important microphysical and dynamical processes in convective systems, they are crucial instrument for improvement of weather forecasts on these scales. Dual-polarization radar, in contrast to a prevalent single-polarization radar, also provides information on the types and sizes of hydrometeor particles. As a result, polarimetric radar data (PRD) proves to be a valuable data source for data assimilation. However, direct assimilation of PRD is not used in current operational non-hydrostatic convection-permitting numerical models. This is associated with several difficulties, such as model error estimation, which require further study.

The current focus of our study is to directly assimilate PRD in an idealized setup. For that purpose, observation system simulation experiments (OSSEs) were performed that simulate the development of a long-lived supercell using the ICON model with two-moment microphysics scheme. In OSSE, the Kilometer-scale Ensemble Data Assimilation (KENDA) system, which comprises the Local Ensemble Transform Kalman Filter (LETKF) was used. The new polarimetric radar forward operator EMVORADO-POL developed at Deutscher Wetterdienst (DWD) was incorporated in the setup. The first steps towards the direct assimilation of differential reflectivity, in addition to non-polarimetric variables, have been implemented and will be presented. Proper thresholds and model equivalents of polarimetric data were examined. Results were compared to reference experiments assimilating non-polarimetric variables such as reflectivity and radial velocity.

How to cite: Bardachova, T., Ramezani Ziarani, M., and Janjic, T.: Towards the assimilation of dual-polarization radar data, EGU General Assembly 2024, Vienna, Austria, 14–19 Apr 2024, EGU24-8069, https://doi.org/10.5194/egusphere-egu24-8069, 2024.

EGU24-8739 | ECS | Posters on site | AS1.6

Trends in Warm Season Mesoscale Convective Systems OverAsia in 2001–2020 

Yuanjing Guo, Qiang Fu, L. Ruby Leung, Ying Na, and Riyu Lu

Mesoscale convective systems (MCSs) frequently occur over Asia during the warm season, often producing intense precipitation with associated socioeconomic impacts. Here we reveal significant trends in MCS occurrence frequency and related precipitation in Asia during the warm season (March–September) in 2001–2020, using a tracking method that combines cloud and precipitation criteria with high-resolution satellite data from the Global Precipitation Measurement mission. To examine whether there are differences between MCSs of different scales, both meso-α scales (MαCSs) and meso-β scales (MβCSs), with horizontal scales of 200–2,000 km and 20–200 km, are tracked. The distribution pattern of frequency and related precipitation of both MαCSs and MβCSs are quite similar and manifest positive trends over East Asia (EA) and Northeast Asia, and negative trend over Southeast Asia (SEA). The MCS precipitation trend contributes significantly to total precipitation trend, with MαCSs contributing the most. Our analysis indicates the trend in lower-tropospheric water vapor flux convergence has a similar spatial pattern to the MCS frequency and related precipitation trend. Based on an atmospheric moisture flux decomposition analysis, the water vapor flux convergence trend can largely be explained by the change in horizontal wind convergence, while the specific humidity trend driven largely by temperature change plays a minor role. The trend in wind convergence in EA and SEA is possibly related to the evident trend in the lower-tropospheric anticyclone over the western North Pacific and SEA, which might be due to the relatively stronger warming in the Indian Ocean during the past two decades.

How to cite: Guo, Y., Fu, Q., Leung, L. R., Na, Y., and Lu, R.: Trends in Warm Season Mesoscale Convective Systems OverAsia in 2001–2020, EGU General Assembly 2024, Vienna, Austria, 14–19 Apr 2024, EGU24-8739, https://doi.org/10.5194/egusphere-egu24-8739, 2024.

EGU24-8810 | ECS | Posters on site | AS1.6

Investigating the life-cycle of convective clouds from 4D observational data 

Sarah Brüning and Holger Tost

Convective clouds play a crucial role for understanding the Earth’s climate. Current advancements of remote sensing instruments allow us to obtain valuable information on the spatio-temporal dynamics of convective clouds on multiple scales. Nevertheless, a continuous coverage of high-resolved 4D observational data to investigate the 3D properties of rapidly developing convective clouds is generally not available.

In this study, we leverage 4D radar reflectivities (in dBZ) derived from the extrapolation of passive and active remote sensing sensors with machine learning to close this gap. Using data with a spatial resolution of 3 km and a temporal resolution of 15 minutes, we receive a continuous perspective on the evolution of the cloud vertical column along the different stages of the cloud life-cycle. For this purpose, we apply an object-based algorithm to detect the centroid of convective cores and their anvil at each time step. Based on these centroids, we extract the 3D cloud field and track the horizontal and vertical movement through space and time. Afterwards, we filter all tracks using the vertical extension and maximum reflectivity of the associated cloud field to exclude erroneous features.

Here, we present an evaluation of the algorithm and its ability to investigate the 4D spatio-temporal properties of convective clouds. We set out to compare convective systems of different sizes over both oceans and continents to analyze the impact of varying environmental conditions on the cloud vertical motions along the cloud life-cycle.

How to cite: Brüning, S. and Tost, H.: Investigating the life-cycle of convective clouds from 4D observational data, EGU General Assembly 2024, Vienna, Austria, 14–19 Apr 2024, EGU24-8810, https://doi.org/10.5194/egusphere-egu24-8810, 2024.

EGU24-8868 | ECS | Posters on site | AS1.6

Situation-Dependent Localization for All-Sky Satellite Observations 

Tobias Necker, Takumi Honda, Philipp Griewank, Takemasa Miyoshi, and Martin Weissmann

This study aims to improve the localization and assimilation of satellite observations in the visible and infrared spectral ranges to enhance predictions of clouds and convective processes. Understanding correlation structures between satellite observations and atmospheric state variables is crucial for successful data assimilation. We focus on examining vertical ensemble-based correlations from Himawari-8 channels (VIS0.64 or IR7.35) and tackle the challenge of vertical observation-space localization. Traditional distance-based localization methods are often suboptimal due to the multi-layered origin of observed radiation. We present empirical optimal localization (EOL) functions derived from a 1000-member ensemble convective-scale simulation to address this issue. Our research highlights the need for channel-specific and variable-specific localization strategies, emphasized by our analysis of two summer case studies that exhibit substantial situational variability in correlation structures, especially in the visible spectral range. Further, we explore various predictors for formulating dynamic, situation-specific vertical localization strategies, offering insights into their effectiveness and potential for advancing convective-scale satellite data assimilation.

How to cite: Necker, T., Honda, T., Griewank, P., Miyoshi, T., and Weissmann, M.: Situation-Dependent Localization for All-Sky Satellite Observations, EGU General Assembly 2024, Vienna, Austria, 14–19 Apr 2024, EGU24-8868, https://doi.org/10.5194/egusphere-egu24-8868, 2024.

EGU24-9241 | ECS | Orals | AS1.6

Designing a Global Weather Station Network 

Stavros Keppas, Haris Balis, Ioannis Dravilas, and John Pagonis

Designing a weather station network is a demanding, multi-objective optimisation problem and usually constrained to local geographies. In this study, the authors deviate from typical approaches that focus the design of weather station networks on a small or country-wide area and present a method that is applicable on a global scale.

Prior art suggests that weather networks should exhibit high density, often at 1-3km or finer resolution, especially when deployed over complex topographies and urban landscapes. High station density is usually required to support research on urban micrometeorology, agricultural applications and to capture intricate meteorological mesoscale phenomena such as convective precipitation and sea breeze. High density is also required due to the persistence of temperature inversions at near-surface layers is significantly influenced by topography, leading to prolonged periods of temperature inversion.

In this novel approach, the authors suggest the design of a global weather network distributed over millions of hexagons covering the entire world. The number of weather stations per hexagon is determined by the topology (e.g. maximum elevation difference, aspects, water formations, etc.) and the land use (urban coverage, green areas, etc.) of the covered area.

The method is materialized via an open-source software tool (available on GitHub) which utilizes freely available elevation data (Copernicus DEM) and land use data (OpenStreetMap) and is capable of preparing the global weather station network in reasonable computation time (~24 hours on a 16-core CPU).

Finally, the authors present their findings, discuss the effect of various hexagon sizes and suggest that the design of a global weather station network is viable and computationally feasible.

How to cite: Keppas, S., Balis, H., Dravilas, I., and Pagonis, J.: Designing a Global Weather Station Network, EGU General Assembly 2024, Vienna, Austria, 14–19 Apr 2024, EGU24-9241, https://doi.org/10.5194/egusphere-egu24-9241, 2024.

EGU24-9266 | ECS | Orals | AS1.6

Impact of aerosol and microphysical uncertainty on the evolution of a severe hailstorm 

Patrick Kuntze, Annette Miltenberger, Corinna Hoose, Michael Kunz, and Lena Frey

Forecasting high impact weather events is a major challenge for numerical weather prediction. Initial condition uncertainty plays an important role but so do uncertainties arising from the representation of subgrid-scale processes, e.g. cloud microphysics. Here, we investigate the impact of cloud microphysical parameter uncertainties on the forecast of a selected severe convective storm over South-Eastern Germany in 2019, which is generally referred to as the Munich hailstorm (Wilhelm et al., 2020).
The storm is simulated using the ICON model (2-moment cloud microphysics, 1 km grid-spacing) with perturbed microphysical parameters related to graupel and hail formation. Combinations of parameter perturbations are chosen according to a Latin hyper cube design and one-at-a-time parameter perturbations for the smallest and largest parameter values. Important impacts on surface (hail) precipitation are found for parameters pertaining to (i) CCN and INP activation, (ii) diffusional growth of ice, and (iii) the mass-diameter and mass-fall velocity relations for graupel. The behavior of graupel particles are thereby controlled by their density.
The one-at-a-time parameter perturbation simulations are used to track microphysical process rates. By closing the hydrometeor mass budgets we explore changes in precipitation formation pathways (based on the approach by Barrett and Hoose, 2023) arising from perturbations of the most impactful parameters. Preliminary results show a strong influence of graupel density on the hail particle size distribution as well as total precipitation, but less so on surface hail amount.
The analysis allows us to draw conclusions about the most impactful cloud microphysical parameters for hail forecast uncertainty as well as the underlying mechanisms.

How to cite: Kuntze, P., Miltenberger, A., Hoose, C., Kunz, M., and Frey, L.: Impact of aerosol and microphysical uncertainty on the evolution of a severe hailstorm, EGU General Assembly 2024, Vienna, Austria, 14–19 Apr 2024, EGU24-9266, https://doi.org/10.5194/egusphere-egu24-9266, 2024.

EGU24-11456 | ECS | Orals | AS1.6

Thunderstorm and Hail Frequencies in South America and Australia Based on Overshooting Tops 

Jannick Fischer, Michael Kunz, and Kristopher Bedka

Convective storms over South America and Australia are among the most intense worldwide (e.g., Zipser 2006). However, they are less researched compared to US and Europe. This study analyses the thunderstorm climatology over South America and Australia based on over 20 years of overshooting cloud top (OT) satellite detections (Khlopenkov et al. 2021). These OTs serve as robust, horizontally homogeneous indicators of strong updrafts and hence intense thunderstorms. Furthermore, we focus on the frequency of severe storms and hail by using ERA5 Reanalysis data to exclude OTs in unfavorable environments (e.g., Punge et al. 2023).
The resulting climatologies of intense thunderstorms and hail are largely consistent with existing literature, showing strong thunderstorm activity in tropical regions but more severe (e.g., hail-producing) storms in south-central South America and southeast Australia. Some notable details will also be discussed, such as the discrepancy with observational hotspots near the coast in South America and a surprisingly strong signal over northwest Australia. Furthermore, regarding a climate change signal, preliminary analysis indicates no significant trend for South America. However, the multi-year variations are strongly linked to the El Ninjo-Southern Oscillation (ENSO).

How to cite: Fischer, J., Kunz, M., and Bedka, K.: Thunderstorm and Hail Frequencies in South America and Australia Based on Overshooting Tops, EGU General Assembly 2024, Vienna, Austria, 14–19 Apr 2024, EGU24-11456, https://doi.org/10.5194/egusphere-egu24-11456, 2024.

EGU24-12158 | Orals | AS1.6

Severe Storms Research at ESSL 

Pieter Groenemeijer, Francesco Battaglioli, Tomáš Púčik, Alois Holzer, and Mateusz Taszarek

Convective storms are an important weather hazard in Europe as shown by the high number of severe wind gusts, large hail, tornadoes, and flash floods recorded each year in the European Severe Weather Database. A recent innovation to the ESWD was the introduction of the new tornado International Fujita scale for rating tornado and wind intensity from damage. In 2023, no fewer than 62182 new reports were entered, and reinsurer Munich Re estimated severe thunderstorms to account for the majority of weather-related losses in Europe in 2023 with a total damage of € 10 billion.

At the core of ESSL’s mission is conducting and facilitating research on severe weather at a European level. Over the years, the organisation has grown with support from its members which include most of Europe’s weather services and commercial sector partners. In addition to research ESSL is active in the area of forecaster training and the evaluation of novel forecasting and nowcasting applications at the ESSL Testbed.

The recorded multi-year trends of severe weather apparent in the ESWD are often dominated by non-meteorological factors, but for large hail indications are strong that its frequency is changing, illustrated by the new hailstone size record of 19 cm diameter in northern Italy in July 2023. ESSL’s recent models of large hail climatology across Europe and the world support these trends. A key challenge for the research community is to develop methods to estimate trends from ever higher-resolution reanalyses and climate models. This is not straightforward as even the highest resolution models do not resolve tornadoes or microbursts, let alone hailstones, and already show biases at coarse scales.

The mentioned work modelling severe weather has given new insights into which environmental characteristics are important to severe weather occurrence. For hail, we additionally studied the conditions under which individual hailstorms in 2021, 2022, and 2023 that were particularly severe. We show the importance of the vertical distribution of buoyancy and wind in a storm-centred reference framework, defined using radar-observed storm motion.

High vertical wind shear above the boundary layer and high CAPE above the -10 °C isotherm for hail, and a combination of vertical vorticity and strong streamwise vorticity for tornadoes. ESSL is collaborating with ECMWF to develop forecast tools based on these concepts. That said, many questions remain, for example regarding the pre-convective environment and mountain ranges, and with the developing storms. For instance, an important concentration of severe weather is evident surrounding the Alps. To address related questions, ESSL has taken the initiative for a multi-year multi-national field campaign in central Europe called TIM (Thunderstorm Intensification from Mountains to plains), in which it will collaborate with a large number of research institutes.

How to cite: Groenemeijer, P., Battaglioli, F., Púčik, T., Holzer, A., and Taszarek, M.: Severe Storms Research at ESSL, EGU General Assembly 2024, Vienna, Austria, 14–19 Apr 2024, EGU24-12158, https://doi.org/10.5194/egusphere-egu24-12158, 2024.

EGU24-12221 | ECS | Posters on site | AS1.6

Preparing AROME assimilation experiments for cloud-affected satellite observations 

Sandy Chkeir, Martin Weissmann, Philipp Griewank, Florian Meier, and Adhithiyan Neduncheran

Despite the abundance of satellite observations, their assimilation in all-sky scenarios remains difficult, which hinders the use of high-resolution information in forecast models. In this work, we focus on the direct assimilation of satellite radiances (visible 0.6 μm, infrared IR 6.2 and 7.3 μm of the Seviri instrument) under all-sky conditions into the convection-permitting Numerical Weather Prediction (NWP) model AROME, which is in operation at Geosphere Austria, the Austrian weather service. Our research aims to exploit the potential of assimilating visible and IR channels under all-sky conditions making use of convection-permitting weather models that can explicitly resolve deep convection. In particular, we are looking at the use of the Radiative Transfer for TOVS (RTTOV), as an observational operator, to generate synthetic images for each channel. We endeavor to optimize the operator settings for running simulations within the convective-scale AROME model. Our first experiment focuses on testing IR synthetic images generated under all-sky conditions during a summer period (August) over Austria. 

How to cite: Chkeir, S., Weissmann, M., Griewank, P., Meier, F., and Neduncheran, A.: Preparing AROME assimilation experiments for cloud-affected satellite observations, EGU General Assembly 2024, Vienna, Austria, 14–19 Apr 2024, EGU24-12221, https://doi.org/10.5194/egusphere-egu24-12221, 2024.

EGU24-12544 | Orals | AS1.6

Testing ensemble-based estimates of potential observation impact 

Philipp Griewank, Tobias Necker, and Martin Weissmann

While ensemble methods to estimate the impact of assimilated observations on forecast error have been widely used (known as EFSO), similar methods to estimate the benefit of potential observations not assimilated have received less attention. For this presentation we use a toymodel to illustrate these methods and highlight their strengths and weaknesses. We show that these methods work well over a wide range of lead times and for different types of observations, but only when the localization used in ensemble data assimilation to mitigate sampling errors is accounted for. While previous studies struggled to achieve quantitative results because they treated the localization inconsistently, we found three methods to overcome this limitation. 

How to cite: Griewank, P., Necker, T., and Weissmann, M.: Testing ensemble-based estimates of potential observation impact, EGU General Assembly 2024, Vienna, Austria, 14–19 Apr 2024, EGU24-12544, https://doi.org/10.5194/egusphere-egu24-12544, 2024.

EGU24-13519 | ECS | Posters on site | AS1.6

Impacts of an upper tropospheric cold low on the extreme precipitation in Henan Province, China in July 2021 

Liangliang Li, Wenshou Tian, Jian Li, Jinlong Huang, Rui Wang, and Jiali Luo

From 19 to 21 July 2021, Henan province of China experienced an extreme precipitation event that caused massive flooding and great loss of lives. This event is thus far the second heaviest precipitation event observed by rain gauges in this region. Based on the ERA5 reanalysis data, the ECMWF operational global ensemble forecasts and numerical simulations using the ARW-WRF model, impacts of an upper tropospheric cold low (UTCL) on the extreme precipitation are examined. It is found that due to the influence of the persistent intrusion of stratospheric high potential vorticity (PV) air, a long-lived UTCL was detached from the upper level flow a week prior to the extreme precipitation event. The UTCL then moved westward, reaching the Yellow Sea and the East China Sea and maintaining there until the precipitation event ended. During this event, a broad northeast-southwest oriented area of ascending motion associated with the UTCL could be observed in front of the UTCL and strong ascending motions developed in the upper troposphere above Henan province. Analysis of the ECMWF operational global ensemble forecasts reveals that the amount of precipitation over Henan is positively correlated with the UTCL intensity. The UTCL impact on the extreme precipitation and the underlying mechanisms are further investigated based on results of numerical experiments. The control experiment reasonably reproduces the UTCL location as well as the distribution and evolution of the extreme precipitation. When the UTCL intensity is reduced in the initial condition using the piecewise PV inversion for sensitivity experiment, the upper tropospheric divergence reduces correspondingly and the dynamical ascending motion weakens in the second precipitation stage. As a result, the amount and intensity of precipitation both decrease. When the UTCL is completely removed from the initial condition, the sensitivity experiment indicates that the upper tropospheric divergence and dynamical ascending motion further weaken, resulting in a large decrease in precipitation intensity during the whole precipitation period. These findings highlight that the occurrence of the long-lived UTCL is a crucial factor that affects the intensity of the extreme precipitation event.

How to cite: Li, L., Tian, W., Li, J., Huang, J., Wang, R., and Luo, J.: Impacts of an upper tropospheric cold low on the extreme precipitation in Henan Province, China in July 2021, EGU General Assembly 2024, Vienna, Austria, 14–19 Apr 2024, EGU24-13519, https://doi.org/10.5194/egusphere-egu24-13519, 2024.

EGU24-13906 | ECS | Orals | AS1.6

Multi-scale interaction and predictability of moist convection and tropical cyclones  

Masashi Minamide and Derek Posselt

Predicting tropical cyclone intensity changes, especially the onset of rapid intensification, has been a more challenging topic than tropical cyclone tracking because of its chaotic nature in multi-scale physical process with significant contributions from convective-scale phenomena. Before intensification onset, tropical cyclones experience precession process, in which tilted vortices rotate counterclockwise around the center of circulation, and develop an axisymmetric structure. The forecast uncertainty in precession process limits the predictability of early-stage development and intensification of TCs.

In this study, we have explored the contribution of moist convective activity to the predictability and variability of TC intensification onset through the precession process. Our recent investigation in Minamide and Posselt (2022) proposed a Lagrangian-based approach to identify the potential signals of individual convective occurrence. Using the technique, we conducted sensitivity experiments to control specific convective activities within the inner-core of early-stage TCs with convection-permitting Weather Research and Forecasting model (WRF-ARW). The results indicate that the spatiotemporal variability of convective activity even governs whether early-stage vortex completes precession and initiates RI, indicating the importance of accurately constraining convective activity in the severe weather event predictions. Given the strong nonlinearity of the onset process of RI, the advancement of our understanding of the uncertainty sources will provide an insight about the observation network that may effectively constrain the TC forecasting.

How to cite: Minamide, M. and Posselt, D.: Multi-scale interaction and predictability of moist convection and tropical cyclones , EGU General Assembly 2024, Vienna, Austria, 14–19 Apr 2024, EGU24-13906, https://doi.org/10.5194/egusphere-egu24-13906, 2024.

Atmospheric Rivers (ARs) transport vast amounts of water vapor from the tropics to mid-latitudes, resulting in sustained, heavy precipitation that explains about 50 % of mid-latitude annual mean rainfall. AR events over the Western US have shown particularly high societal impact, where orographic and soil conditions make communities vulnerable to floods and mudslides. Climate modelling approaches for capturing extreme precipitation and water runoff on land are both strongly constrained by the horizontal resolution that is currently deployed, typically on the order of 100 km. Such grid spacing neither allows for explicitly resolving key processes associated with extreme precipitation like atmospheric convection, nor complex terrain that controls water runoff. However, recent advances in computational capabilities and model development at the Geophysical Fluid Dynamics Laboratory (GFDL) at a finer horizontal resolution of 50 and 25 km have shown promising perspectives for simulating important characteristics of ARs and their associated mean and extreme precipitation. In addition, advances in GFDL land model hydrology now allow for investigating climate model capabilities in predicting precipitation induced flood hazard precursors like excessive runoff and streamflow in a physically coupled, orography-aware atmosphere-land framework.

Here, we make use of the high resolution GFDL coupled atmosphere-land model by running hindcast experiments for a handful of high impact AR events over the Western US. We evaluate the model’s predictive skill in AR associated precipitation by running ensemble forecasts on weather time scales, which we evaluate against observations and reanalysis. We attribute the found biases in terms of dynamical and thermodynamic drivers, revealing current model constraints. Accounting for the biases found in precipitation, we turn to the land hydrology and evaluate catchment associated hydrological characteristics, which we compare to satellite derived and in-situ observations.

How to cite: Prange, M., Zhao, M., and Shevliakova, E.: Evaluating historic atmospheric river associated extreme rainfall and its flooding potentials based on a high-resolution climate model, EGU General Assembly 2024, Vienna, Austria, 14–19 Apr 2024, EGU24-13964, https://doi.org/10.5194/egusphere-egu24-13964, 2024.

EGU24-15473 | ECS | Posters on site | AS1.6

The assimilation of surface observations in mountainous terrain in the WRFDA system 

Giorgio Doglioni, Stefano Serafin, Martin Weissmann, Gianluca Ferrari, and Dino Zardi

Assimilating surface observations in convective scale data assimilation (DA) systems is not straightforward, since these observations may be affected by small-scale effects not represented in the model, and the model itself might not be able to accurately represent the features of the atmosphere close to the surface. These issues are particularly evident in mountainous terrain. In variational DA systems, such as the Weather Research and Forecasting, Data Assimilation (WRFDA) suite, the available background error (BE) models produce BE variances and covariances that vary smoothly over long distances. Therefore, for instance, assimilating a valley-floor surface observation typically leads to large analysis increments even at nearby mountain tops, which are physically unwarranted and cause high levels of gravity-wave noise. 

Such problems can be partially mitigated in WRFDA by modeling the BE using the Alpha Control Variable Transform (Alpha CVT). 

Like other BE models in WRFDA, this technique derives BE statistics from an ensemble of differences between forecasts with different initial and identical valid times (NMC method), and it makes use of a control variable transform (CVT). Differently from other BE models in WRFDA, it computes analysis increments as a linear combination of the NMC ensemble members.

In this work we consider simulations with a grid spacing of 3.5 km over a domain encompassing the European Alps. We first use pseudo-observation tests to show how different BE specifications in WRFDA affect the assimilation of surface observations of temperature, specific humidity, pressure and horizontal winds components in complex terrain.

We then present real-case assimilation experiments with a limited set of surface observations. Considering the consistency between the variances of innovations and the assigned observation and background errors, we demonstrate the positive impact of the Alpha CVT.

How to cite: Doglioni, G., Serafin, S., Weissmann, M., Ferrari, G., and Zardi, D.: The assimilation of surface observations in mountainous terrain in the WRFDA system, EGU General Assembly 2024, Vienna, Austria, 14–19 Apr 2024, EGU24-15473, https://doi.org/10.5194/egusphere-egu24-15473, 2024.

EGU24-15891 | ECS | Posters on site | AS1.6

Optimizing Kilometer-Scale Climate Modeling: Refining Cloud Microphysics Using Machine Learning and Satellite Correlation 

Hannah Marie Eichholz, Jan Kretzschmar, Josefine Umlauft, and Johannes Quaas

The modeling of the Earth Climate System has undergone outstanding advances to the point of resolving atmospheric and oceanic processes on kilometer-scale, thanks to the development of high-performance computing systems. In the preparation phase of the global kilometre-resolution coupled ICON climate model, there's a critical need to fine-tune cloud microphysical parameters. Our approach involves investigating the optimal calibration of these parameters using machine learning techniques.

Our initial focus involves calibrating the autoconversion scaling parameter by correlating it with satellite-derived top-of-atmosphere and bottom-of-atmosphere radiation fluxes. This calibration process entails conducting limited area simulations specifically within the North Atlantic and South Pacific region using ICON. Through these simulations, various adjustments to cloud microphysical parameters are made, aiming to assess their potential impacts on radiation flux output.

How to cite: Eichholz, H. M., Kretzschmar, J., Umlauft, J., and Quaas, J.: Optimizing Kilometer-Scale Climate Modeling: Refining Cloud Microphysics Using Machine Learning and Satellite Correlation, EGU General Assembly 2024, Vienna, Austria, 14–19 Apr 2024, EGU24-15891, https://doi.org/10.5194/egusphere-egu24-15891, 2024.

EGU24-17689 | ECS | Posters on site | AS1.6

Impact of microphysical perturbations on convective precipitation predictability 

Beata Czajka, Christian Barthlott, and Corinna Hoose

The predictability of deep moist convection is subject to large uncertainties, mainly due to inaccurate initial and boundary data, incomplete description of physical processes, or uncertainties in microphysical parameterizations. In this study we present results from a large 108-member ensemble focussing solely on the perturbation of microphysical uncertainties. We perturb the cloud condensation nuclei concentrations, the ice nucleating particle concentrations, the graupel sedimentation velocity as well as the width of the cloud droplet size distribution, all of which are not well constrained by observations. The model simulations are conducted with a convection-permitting configuration of the ICON model using a double-moment microphysics scheme. Results from four convective episodes during the Swabian MOSES field campaigns conducted in the summers of 2021 and 2023 show a large spread in convective precipitation in Germany. Based on convection-related parameters and microphysical process rates, the sensitivities of convection initiation, cloud and precipitation formation to the microphysical uncertainties are discussed. An important finding is e.g. the large sensitivity of hail formation on all analysed days. These results demonstrate the benefits of using an aerosol-aware double-moment microphysics scheme and that the use of microphysical uncertainties for ensemble modelling strategies can produce a sufficiently large ensemble spread for convective-scale predictability.

How to cite: Czajka, B., Barthlott, C., and Hoose, C.: Impact of microphysical perturbations on convective precipitation predictability, EGU General Assembly 2024, Vienna, Austria, 14–19 Apr 2024, EGU24-17689, https://doi.org/10.5194/egusphere-egu24-17689, 2024.

EGU24-17871 | ECS | Posters on site | AS1.6

Accurate Representation of Dual-Polarized Radar Parameters with Data Assimilation 

Ji-Won Lee, Ki-Hong Min, and GyuWon Lee

To enhance the accuracy of heavy rainfall prediction, the assimilation of radar data (DA) is crucial. Single-polarized radar variables, such as reflectivity and Doppler velocity, offer insights into raindrop quantity and speed. Dual-polarization (dual-pol) radar variables, including differential reflectivity (ZDR), specific differential phase (KDP), and co-polar correlation coefficient (ρhv), provide additional details about hydrometeor phase, size, and liquid water content. Assimilating dual-pol radar variables into a Numerical Weather Prediction (NWP) model can enhance the accuracy of predicting both large-scale and rapidly developing mesoscale precipitation events. Therefore, the development and application of an accurate radar observation operator for DA, considering the microphysical information of an NWP model with dual-pol radar data, is necessary.

In this study, we developed a dual-pol radar operator based on microphysical variables such as the mixing ratio and total number concentration of hydrometeors. The enhanced method can accurately replicate the characteristics of dual-pol radar variables in the melting layer, improve the underestimation of hydrometeors mixing ratio for liquid and ice particles. Enhancing the estimation of hydrometeor increments further refines the prediction of mesoscale precipitation effects. This study aims to demonstrate improvements in microphysical processes and enhanced accuracy in rainfall predictions through dual-pol radar DA.

※ This work was supported by the National Research Foundation (NRF) grant funded by the Korea government (MSIT)(No. 2021R1A4A1032646, 2022R1A6A3A13073165) and the Korea Meteorological Administration Research and Development Program under Grant RS-2023-00237740.

How to cite: Lee, J.-W., Min, K.-H., and Lee, G.: Accurate Representation of Dual-Polarized Radar Parameters with Data Assimilation, EGU General Assembly 2024, Vienna, Austria, 14–19 Apr 2024, EGU24-17871, https://doi.org/10.5194/egusphere-egu24-17871, 2024.

EGU24-18115 | ECS | Posters on site | AS1.6

Influence of data assimilation on tropical waves 

Yvonne Ruckstuhl, Tijana Janjic, Hyunju Jung, Peter Knippertz, and Robert Redl

Precipitation forecasts in the tropics are poor due to large model and initial condition errors, leaving ample room for improvement. In particular, it has been hypothesized that the coupling of tropical waves and convection offers a source of predictability, suggesting that capturing these waves accurately in the model and in initial conditions could lead to improved precipitation forecasts. In this work, we investigate whether standard data assimilation (DA) algorithms like the Ensemble Kalman Filter (EnKF) are fundamentally capable of recovering tropical waves and thereby provide initial conditions that lead to skillful precipitation forecasts. To capture the essence of tropical dynamics without contamination of land-sea contrasts, sea-surface temperature gradients and influences from the extra-tropics, we use a tropical aqua channel configuration at 13km grid-spacing with the ICON numerical weather prediction model. Further, to isolate the role of the initial conditions provided by DA, we assume a perfect model. In our setup, Kelvin waves dominate over other wave types and primarily modulate precipitation.  In addition, there is evidence of a Madden-Julian-Oscillation (MJO)-like feature that appears coupled to large-scale convective activity. We show that when sufficient wind observations are assimilated, the DA can reduce the errors in the representation of the Kelvin waves sufficiently to provide accurate precipitation forecasts up to several weeks. Surprisingly, even the MJO-like rainfall event, which starts after a forecast lead time of 10 days, is captured by the forecast ensemble. Further, we find that accurate initial conditions for humidity are important to slow down error growth for all model variables. Like emphasized by several other studies, we conclude that wind observations are by far the most important input to achieve skillful tropical forecasts. A secondary challenge is to improve initial conditions of humidity by developing DA algorithms to account for non-Gaussian error statistics. Investigating the role of model error in DA and the resulting forecasts is left for future work. 

How to cite: Ruckstuhl, Y., Janjic, T., Jung, H., Knippertz, P., and Redl, R.: Influence of data assimilation on tropical waves, EGU General Assembly 2024, Vienna, Austria, 14–19 Apr 2024, EGU24-18115, https://doi.org/10.5194/egusphere-egu24-18115, 2024.

EGU24-19982 | ECS | Orals | AS1.6

Assessing the Influence of the Shillong Plateau Topography on Thunderstorm Activities in North-east India 

Rajesh Kumar Sahu, Hylke E Beck, and Bhishma Tyagi

Northeast India (NEI) experiences frequent thunderstorms during the pre-monsoon season, which can be catastrophic, resulting in loss of life and damage to infrastructure and property. The Shillong Plateau (SP) has been identified as a key factor in triggering these thunderstorms over NEI. Our study focuses on monitoring changes in thermodynamic indicators over NEI to assess the impact of the SP on the initiation and propagation of thunderstorms. The results demonstrate a significant increase in thermodynamic index values across NEI when the SP topography is elevated, indicating an increase in thunderstorm activity. Conversely, when the SP topography is reduced, there is a decrease in these indicators, corresponding with lower thunderstorm intensity. Notably, a lower SP topography is associated with increased precipitation, whereas a higher SP topography is linked to decreased precipitation. These findings underscore the crucial role of SP topography in influencing pre-monsoon thunderstorms over NEI, which has implications for understanding and predicting regional weather patterns.

Keywords: Thunderstorms; Thermodynamic Indices; Topography; Shillong Plateau; WRF

How to cite: Sahu, R. K., Beck, H. E., and Tyagi, B.: Assessing the Influence of the Shillong Plateau Topography on Thunderstorm Activities in North-east India, EGU General Assembly 2024, Vienna, Austria, 14–19 Apr 2024, EGU24-19982, https://doi.org/10.5194/egusphere-egu24-19982, 2024.

EGU24-20211 | ECS | Posters on site | AS1.6

Does higher temperature accentuate convective cell clustering within European MCSs? 

Nicolas A. Da Silva and Jan O. Haerter

Mesoscale Convective Systems (MCSs) are clusters of thunderstorms composed of narrow and heavy convective-type precipitation adjacent with wider and lighter stratiform-type precipitation. MCSs are the largest contributor of extreme precipitation events over Europe (Da Silva & Haerter, 2023). 

While convective and stratiform-type precipitation contributions within MCSs are each expected to increase according to the Clausius-Clapeyron law (~7%°C-1), their statistical superimposition is shown to increase at a faster rate due to increased MCS convective fraction with temperature (Da Silva & Haerter, submitted). 


For better prediction of floods induced by MCSs, it is also important to characterize the relationship between temperature and the spatio-temporal clustering of convective cells within MCSs. For that purpose, we use the high resolution EUropean Cooperation for LIghtning Detection (EUCLID) lightning dataset and combine it with MCS tracking data (derived from the RADOLAN radar precipitation dataset; Bartels et al., 2004) over Germany. Identifying convective cells through lightning records, we measure the degree of convection clustering using an organization index which we adapt to the MCS geometry. In this process, we use a Monte Carlo method to estimate the reference random distribution of nearest neighbor distances of convective centroids. 


We associate our organization index with surface dew-point temperatures from neighboring weather stations from the German Weather Service (Deutscher Wetterdienst, DWD). We select the temperature upstream of the MCS tracks, as a proxy of the moisture source involved in the formation of MCS precipitation. Idealized simulations suggest that both the mean and the spatial variability of surface temperature could be relevant for convective aggregation (Pendergrass, 2020; Shamekh et al., 2020). Our study considers both and also investigates the potential role of other triggers for convective aggregation such as convective cold pools (Haerter, 2019) or the diurnal cycle (Haerter et al., 2020).


References:


Bartels, H. et al. Projekt RADOLAN Routineverfahren zur Online-Aneichung der Radarniederschlagsdaten mit Hilfe von automatischen Bodenniederschlagsstationen (Ombrometer) (2004).

https://www.dwd.de/DE/leistungen/radolan/radolan_info/abschlussbericht_pdf.pdf?__blob=publicationFile&v=2


Da Silva, N. A., & Haerter, J. O. (2023). The precipitation characteristics of mesoscale convective systems over Europe. Journal of Geophysical Research: Atmospheres, 128, e2023JD039045. https://doi.org/10.1029/2023JD039045


Da Silva, N. A, & Haerter J. O.. Non super-Clausius-Clapeyron scaling of convective precipitation extremes, 08 January 2024, PREPRINT (Version 1) available at Research Square

https://doi.org/10.21203/rs.3.rs-3777860/v1


Haerter, J. O. (2019). Convective self-aggregation as a cold pool-driven critical phenomenon. Geophysical Research Letters, 46, 4017–4028. https://doi.org/10.1029/2018GL081817


Haerter, J.O., Meyer, B. & Nissen, S.B. Diurnal self-aggregation (2020). npj Clim Atmos Sci 3, 30. https://doi.org/10.1038/s41612-020-00132-z


Pendergrass, A. G. (2020). Changing degree of convective organization as a mechanism for dynamic changes in extreme precipitation. Current climate change reports, 6, 47-54.


Shamekh, S., C. Muller, J. Duvel, and F. D’Andrea (2020), How Do Ocean Warm Anomalies Favor the Aggregation of Deep Convective Clouds?. J. Atmos. Sci., 77, 3733–3745, https://doi.org/10.1175/JAS-D-18-0369.1.

How to cite: Da Silva, N. A. and Haerter, J. O.: Does higher temperature accentuate convective cell clustering within European MCSs?, EGU General Assembly 2024, Vienna, Austria, 14–19 Apr 2024, EGU24-20211, https://doi.org/10.5194/egusphere-egu24-20211, 2024.

EGU24-20250 | Posters on site | AS1.6

Probabilistic nowcasting of severe storms in Africa: workflow and online tools for monitoring 

Cornelia Klein, Seonaid Anderson, Steven Cole, Christopher Taylor, Steven Wells, Gemma Nash, and Abdoulahat Diop

Mesoscale convective systems (MCSs) dominate rainfall and its extremes in most parts of West Africa, frequently producing flash floods that result in major damage and loss of life. As West African storms are already intensifying, these effects are expected to become more frequent and severe under climate-change and rapid urban expansion. To help mitigate these impacts, the NFLICS (Nowcasting FLood Impacts of Convective storms in the Sahel) project has co-developed a prototype nowcasting system with West African meteorological services based on conditioned climatologies of organised convection as seen from the Meteosat Second Generation (MSG) satellites since 2004.  Data on historical convective activity, conditioned on the present location and timing of observed convection, are used to produce probabilistic forecasts of convective activity out to six hours ahead. Verification against the convective activity analysis and the 24-hour raingauge accumulations over Dakar suggests that these probabilistic nowcasts provide useful information on the occurrence of convective activity. The highest skill (compared to nowcasts based solely on climatology) is obtained when the probability of convection is estimated over spatial scales between 100 and 200km, depending on the forecast lead-time considered. Furthermore, recent advances have included incorporation of land surface temperature anomalies to modify nowcast probabilities – this recognises that MCS evolution favour drier land. We present the workflow of this nowcasting system and discuss our current understanding of the land surface effects that play a role for storm development and prediction. The developed nowcasting system is crucially computationally inexpensive to run operationally and achieves skill in the absence of rainfall radar, as is the case over most of Africa. Operational trials over the 2020 and 2021 rainy seasons, and during intensive nowcasting testbeds with researchers and forecasters, has shown the utility of these new nowcast products to support Impact-based Forecasting, and are currently being extended for use during a testbed with meteorological services in southern Africa in 2024.

Latest West Africa nowcasts alongside pan-African cloud and surface state imagery are publicy accessible on https://eip.ceh.ac.uk/hydrology/sub-saharan-africa/nowcasting

How to cite: Klein, C., Anderson, S., Cole, S., Taylor, C., Wells, S., Nash, G., and Diop, A.: Probabilistic nowcasting of severe storms in Africa: workflow and online tools for monitoring, EGU General Assembly 2024, Vienna, Austria, 14–19 Apr 2024, EGU24-20250, https://doi.org/10.5194/egusphere-egu24-20250, 2024.

EGU24-981 | ECS | Posters on site | AS1.7

Low clouds over the subtropical Indian Ocean in the Mascarene High environment and sub-seasonal circulation associations with the Indian summer monsoon 

Gokul Tamilselvam, Ramesh Vellore, Ayantika Dey Choudhury, Divya Viswanath, Krishnan Raghavan, and Reji Mariya Joy Kooran

This study investigates anomalous low cloud fractions (LCFs) in the Mascarene High(MH) environment of subtropical Indian Ocean (SIO) during June-September, and their sub-seasonal (10-90 day) circulation changes in the SIO and associated variations of the Indian summer monsoon (ISM) using observations and ERA5 circulation products based on 1999-2014 period. Periods of anomalous excess and deficits in LCFs in the SIO clearly reveal different sub-seasonal circulation attributes across the equator with precursor signals to the strength of ISM. Anomalous circulation composites from the excess LCF periods shows mean sea level pressure (MSLP) enhancements of about 2 hPa in the MH region in correspondence with increasing areal extent and intensifications in LCFs, and a net increase in low-level southerly momentum between MH and monsoon trough (MT) environments. The MSLP reinforcements in the MH are clearly demonstrated to emerge from the strength of cloud-top radiative cooling and associated winds and mass adjustments. The 10-20 [30 -50] day modes of the circulation in the SIO further elucidates zonally propagating [quasi-stationary] manifestations on MH reinforcements. There is an increase in meridional transport of moisture fluxes, by about 7 times relative to deficit LCF periods, channelled through a
conduit region (15-30°S, 60-90°E) juxtaposing the cross-equatorial circulation (CEC) from both western and eastern sides of the Indian Ocean. This occurs in tandem with a zone of moisture flux convergence in the ISM region advancing poleward towards the climatological MT region - implying that excess LCF periods portend the likelihood of stronger ISM. Deficit LCF periods, on the contrary, show a mirrored scenario of the above with a net northerly low-level wind anomalies between MH and MT, pressure deficits in the MH region, and also portend the likelihood of weaker ISM. Low clouds
in the SIO are not only instrumental for MH stability, but also essential for circulation and moisture support across the equator and the signals for the strength of ISM on sub-seasonal scale.

How to cite: Tamilselvam, G., Vellore, R., Choudhury, A. D., Viswanath, D., Raghavan, K., and Kooran, R. M. J.: Low clouds over the subtropical Indian Ocean in the Mascarene High environment and sub-seasonal circulation associations with the Indian summer monsoon, EGU General Assembly 2024, Vienna, Austria, 14–19 Apr 2024, EGU24-981, https://doi.org/10.5194/egusphere-egu24-981, 2024.

EGU24-1219 | Orals | AS1.7

Mesoscale Convective Systems in DYAMOND Models: A Feature Tracking Intercomparison. 

Zhe Feng, Ruby Leung, Andreas Prein, Thomas Fiolleau, William Jones, Zachary Moon, Ben Maybee, Fengfei Song, Jinyan Song, Kelly Núñez Ocasio, Cornelia Klein, Adam Varble, Remy Roca, and Puxi Li

The DYAMOND project (Stevens et al. 2019) provides an intercomparison framework for state-of-the-art global convection-permitting models with km-scale horizontal grid spacing that can directly simulate convective storms. We recently assessed the fidelity of the convective storms simulated by DYAMOND models using a novel feature tracking technique (Feng et al. 2023) and found a surprisingly large inter-model spread in the simulated frequency of ordinary deep convection and mesoscale convective systems (MCSs), as well as their associated precipitation. Recent works also showed that different feature tracking algorithms have significant impacts on estimating MCS characteristics including frequency, size, lifetime and precipitation (Prein et al. 2023). To further investigate how feature tracking methods affect the evaluation of global MCS simulations and our understanding of convective organization in observations and DYAMOND simulations, we are organizing a new international initiative called MCSMIP (MCS tracking Method Intercomparison Project). Preliminary results from several different feature trackers show that DYAMOND models generally underestimate observed MCS precipitation amount and their contribution to total precipitation in the tropics (Fig. 1), and the simulated MCS precipitation is too intense. However, some models have notable differences in MCS frequency and characteristics among the trackers. Potential paths towards more process-oriented model diagnostics to better understand the differences in simulated MCS and precipitation characteristics will be discussed.

Figure 1. (a) Observed MCS contribution to total precipitation during DYAMOND Phase II, (b) model relative mean difference (%) from observations in the tropics. Each group of bars in (b) is from a feature tracker: PyFLEXTRKR, MOAAP, TOOCAN, tobac, TAMS, and simpleTrack, and each bar denotes a DYAMOND model.

References

Feng, Z. et al. (2023). Mesoscale Convective Systems in DYAMOND Global Convection-Permitting Simulations. Geophys. Res. Lett., doi: 10.1029/2022GL102603.

Prein, A. et al. (2023). Km-Scale Simulations of Mesoscale Convective Systems (MCSs) Over South America – A Feature Tracker Intercomparison. DOI: 10.22541/essoar.169841723.36785590/v1.

How to cite: Feng, Z., Leung, R., Prein, A., Fiolleau, T., Jones, W., Moon, Z., Maybee, B., Song, F., Song, J., Núñez Ocasio, K., Klein, C., Varble, A., Roca, R., and Li, P.: Mesoscale Convective Systems in DYAMOND Models: A Feature Tracking Intercomparison., EGU General Assembly 2024, Vienna, Austria, 14–19 Apr 2024, EGU24-1219, https://doi.org/10.5194/egusphere-egu24-1219, 2024.

EGU24-1281 | ECS | Orals | AS1.7

Cold Pools in the Trades: External Drivers and Self-Organization Impact 

Pouriya Alinaghi, Martin Janssens, Fredrik Jansson, A. Pier Siebesma, and Franziska Glassmeier

Recent observations of the trades highlight the covariability between cold pool (CP) properties and cloud cover, suggesting a potential impact of CPs on the cloud radiative effect (CRE). To explore this, we use an ensemble of 103 large-domain, high-resolution, large-eddy simulations (Cloud Botany). We investigate the extent to which the variability in CPs is driven by external conditions or convective self-organization. Our findings show that CPs are notably controlled by large-scale conditions, specifically (horizontal) wind speed and subsidence. The temporal evolution of CPs is tightly related to the diurnality in radiation. To understand the extent to which CPs vary with self-organization, we switch off the diurnality in radiation. Despite the absence of the diurnal cycle, CP time series still exhibit fluctuations. These fluctuations result from the recharge-discharge of thermodynamic and dynamic properties of the sub-cloud layer owing to CP-cloud interactions. Our results demonstrate that circulations induced by CPs reinforce the parent clouds, resulting in deepening and scale growth, followed by mesoscale arcs enclosing clear-sky areas. Finally, we show that CPs influence CRE, but only when they exist during the day. Our findings emphasize the importance of the relationship between the timescales of self-organization and the diurnal cycle of external conditions, greatly influencing the CRE dependency on self-organizing CPs.

How to cite: Alinaghi, P., Janssens, M., Jansson, F., Siebesma, A. P., and Glassmeier, F.: Cold Pools in the Trades: External Drivers and Self-Organization Impact, EGU General Assembly 2024, Vienna, Austria, 14–19 Apr 2024, EGU24-1281, https://doi.org/10.5194/egusphere-egu24-1281, 2024.

EGU24-1848 | Posters on site | AS1.7

Do observations support ideas behind common mass flux closures? 

Raphaela Vogel and Juan Pedro Mellado

Determining the mass flux at cloud base is the principle closure needed in convective parameterizations. Here we evaluate if observations from the EUREC4A field campaign support ideas behind common shallow-convective mass flux closures. All parameters of the closures are diagnosed at the mesoscale (200km, 3h) from dropsonde data and turbulence measurements. The closure models are compared to a reference mass flux estimated as a residual of the sub-cloud layer mass budget from the same circular dropsonde arrays. We find that a closure using the subcloud convective velocity scale (w*) captures the magnitude but underestimates the variability of the reference mass flux. A closure using a  turbulence kinetic energy (TKE) based velocity scale instead explains 78% of mass flux variability. These results suggest that (1) the full TKE needs to be considered rather than just the convective contribution represented by w*, and (2) the TKE may contain information about the area fraction of thermals, which makes a separate cloud area fraction scale unnecessary to explain mass flux variability during EUREC4A.

How to cite: Vogel, R. and Mellado, J. P.: Do observations support ideas behind common mass flux closures?, EGU General Assembly 2024, Vienna, Austria, 14–19 Apr 2024, EGU24-1848, https://doi.org/10.5194/egusphere-egu24-1848, 2024.

EGU24-2105 | Orals | AS1.7

A passive tracer perspective on the origin and evolution of tropical cirrus clouds  

Blaž Gasparini, Peter N. Blossey, Aiko Voigt, Rachel Atlas, and Martina Krämer

The processes controlling tropical cirrus clouds are poorly understood, contributing to significant uncertainty in estimating how clouds respond to global warming. Much of this uncertainty stems from a lack of knowledge about the cirrus life cycle. Not knowing how cirrus clouds evolve also makes it hard to determine the fraction of clouds that comes from deep convective outflow compared to those formed by in situ ice nucleation at temperatures colder than -40°C. These two types of clouds are controlled by different processes that may operate differently in a warmer climate, making it even more important to assess their origin.

We implement passive tracers in the cloud-resolving model SAM used in a tropical channel setup to track the 3D evolution of cloudy parcels from two different perspectives:

  • A detrainment perspective, useful for tracking the evolution of anvil clouds.
  • An ice nucleation perspective, useful for following the evolution of in situ cirrus.

Using the detrainment tracer, we can accurately determine how long it's been since an air parcel left a deep convective plume. Our analysis shows that freshly detrained air parcels consist mainly of many large ice crystals with radii of 30-80 μm. These quickly fall out of the atmosphere, resulting in aged anvils containing fewer and smaller ice crystals.

The ice nucleation tracer tracks the time after the onset of ice nucleation. This proves valuable for studying the evolution pathways of in situ cirrus ice crystals. Initially, small, freshly nucleated in situ cirrus mostly contain 20-200 ice crystals/liter, occasionally spiking due to relatively rare homogeneous nucleation events. However, the number of ice crystals decreases rapidly, likely because of sublimation, leading to concentrations of < 10/liter in aged clouds.

Tracers also help us understand the climatology of cirrus formation. On average, we find that in situ cirrus account for 20% (at T>-50°C) to 70% (at T<-70°C) of all tropical cirrus.

While tracers cannot follow individual cloud parcels and different realizations of the tropical atmosphere in global models and other idealized frameworks may affect their behavior and interpretation somewhat, our research shows that they can provide valuable insights into cloud evolution and microphysics. They also have the potential to improve our mechanistic understanding of how tropical cirrus respond to global warming.

How to cite: Gasparini, B., Blossey, P. N., Voigt, A., Atlas, R., and Krämer, M.: A passive tracer perspective on the origin and evolution of tropical cirrus clouds , EGU General Assembly 2024, Vienna, Austria, 14–19 Apr 2024, EGU24-2105, https://doi.org/10.5194/egusphere-egu24-2105, 2024.

EGU24-2919 | Orals | AS1.7

The role of cloud-cloud interactions and entrainment-mixing in the lifecycle of shallow cumulus clouds 

Jingyi Chen, Samson Hagos, Zhe Feng, Heng Xiao, Jerome Fast, Chunsong Lu, and Adam Varble

Limited understanding of the key factors that govern the lifecycle of cumulus clouds, including the interactions among clouds and with surrounding environments, contributes to climate prediction uncertainty. To investigate these processes, we tracked the lifecycle of thousands of individual shallow cumulus clouds within a large-eddy simulation during the Holistic Interactions of Shallow Clouds, Aerosols, and Land-Ecosystems (HISCALE) field campaign in the U.S. Southern Great Plains.

Our examination of these clouds followed two paths. First, we compared two distinct groups of clouds—those with growing cloud neighbors and those with decaying cloud neighbors. Clouds with growing neighbors were found to form over areas with larger surface heterogeneity than clouds with decaying neighbors. Clouds with growing neighbors also had less instability, less moisture and warmer air below cloud base than decaying neighbor clouds. This suggests that evaporation below the cloud base likely occurs before the formation of these clouds with decaying neighbor clouds due to the colder and moister air below cloud base. Larger instability leads to higher vertical velocity and convergence within the cloud, which causes stronger downdrafts and water vapor removal in the surrounding area. The latter appears to be the reason for the decaying neighboring clouds.

Second, we introduced two new metrics to assess the relationships between cloud shape and these processes: one reflecting the irregularity of cloud edges and another emphasizing the cloud horizontal aspect ratio. During the lifecycle of simulated cumulus clouds, cloud edge irregularity increased with minimal changes in aspect ratio. Irregularity-driven growth of the cloud perimeter was a strong indicator of cloud splitting, more so than growth driven by aspect ratio changes. Additionally, clouds with more irregular edges exhibited smaller gradients of properties at their boundaries, suggesting more intense mixing with the surrounding cloud-free environment.

These results advance insights into the interactions between cumulus clouds and their nearby environment entrainment that influence the evolution of cloud populations. Such knowledge can support the development of more accurate shallow cumulus parameterizations in the new generation of climate models.

How to cite: Chen, J., Hagos, S., Feng, Z., Xiao, H., Fast, J., Lu, C., and Varble, A.: The role of cloud-cloud interactions and entrainment-mixing in the lifecycle of shallow cumulus clouds, EGU General Assembly 2024, Vienna, Austria, 14–19 Apr 2024, EGU24-2919, https://doi.org/10.5194/egusphere-egu24-2919, 2024.

EGU24-3192 | Posters on site | AS1.7

Do optically denser trade-wind cumuli live longer? 

Torsten Seelig, Felix Müller, and Matthias Tesche

We present a detailed investigation of the lifetime of Caribbean trade-wind cumulus clouds and the temporal evolution of their physical properties based on geostationary observations with the Advanced Baseline Imager (Schmit et al., 2017) aboard the GOES-16 satellite during the “ElUcidating the RolE of Cloud-Circulation Coupling in ClimAte” (EUREC⁴A; Stevens et al., 2021) field experiment in winter 2020. A first application of our upgraded cloud-tracking methodology (Seelig et al., 2021) to measurements with a spatio-temporal resolution of 2 × 2 km² and 1 min, respectively, enables the investigation of processes that control the lifetime of shallow marine cumulus clouds. Our analysis reveals that shallow marine cumulus clouds live longer when they span over a surface area that exceeds an order of tens of square kilometers. While these clouds show similar median cloud droplet size and number concentration compared to shorter-lived clouds, they contain more liquid water and, thus, show a cloud optical depth that is increased by about one third. Besides the effect of cloud optical depth, we find that the scale of the atmospheric motions with which the clouds interact is also critical to their lifetime.

References:

Schmit, T. J., Griffith, P., Gunshor, M. M., Daniels, J. M., Goodman, S. J., and Lebair, W. J.: A Closer Look at the ABI on the GOES-R Series, B. Am. Meteorol. Soc., 98, 681-698, https://doi.org/10.1175/BAMS-D-15-00230.1, 2017.

Stevens, et al.: EUREC4A, Earth Syst. Sci. Data, 13, 4067-4119, https://doi.org/10.5194/essd-13-4067-2021, 2021.

Seelig, T., Deneke, H., Quaas, J., and Tesche, M.: Life cycle of shallow marine cumulus clouds from geostationary satellite observations, J. Geophys. Res.: Atmos., 126(22), e2021JD035577, https://doi.org/10.1029/2021JD035577, 2021.

How to cite: Seelig, T., Müller, F., and Tesche, M.: Do optically denser trade-wind cumuli live longer?, EGU General Assembly 2024, Vienna, Austria, 14–19 Apr 2024, EGU24-3192, https://doi.org/10.5194/egusphere-egu24-3192, 2024.

EGU24-5369 | Posters on site | AS1.7

Reducing biases in low cloud cover over the tropical Atlantic in the Norwegian Earth System Model 

Richard Davy, Tarkeshwar Singh, Lingling Suo, and Francois Counillon

Biases in the representation of low cloud cover in climate models has been identified as one of the leading causes of uncertainty in equilibrium climate sensitivity. It is therfore crucial to reduce current climate model biases in low cloud cover in order to reduce uncertainty in projected climate change. We have conducted perturbed parameter simulations to assess the sensitivity of the simulated low cloud cover in the Norwegian Earth System Model to parameters within the CLUBB scheme. The CLUBB scheme unifies the atmospheric boundary layer turbulence scheme with the clouds schemes and so has the potential advantage of reducing inconsistencies between these components of the atmosphere. However, there are many parameters within the CLUBB scheme that are not well constrained and have unknown effects on simulated climate. We demonstrate that of the 12 parameters in the CLUBB scheme selected for perturbed-parameter experiments, there are just 2 which control the low cloud cover in the model. We used a combination of multi-linear regression models and offline data assimilation with parameter estimation to identify the optimum values for these two parameters to eliminate the bias in low cloud cover, and confirmed this through a second iteration of perturbed-parameter experiments.

How to cite: Davy, R., Singh, T., Suo, L., and Counillon, F.: Reducing biases in low cloud cover over the tropical Atlantic in the Norwegian Earth System Model, EGU General Assembly 2024, Vienna, Austria, 14–19 Apr 2024, EGU24-5369, https://doi.org/10.5194/egusphere-egu24-5369, 2024.

EGU24-6203 | Orals | AS1.7

Coupled Mesoscale to Microscale Simulations of Mixed-Phase Convective Clouds Observed during the Cold-Air Outbreaks in the Marine Boundary Layer Experiment (COMBLE) 

Branko Kosovic, Timothy Juliano, Lulin xue, Bart Geerts, Christian Lackner, and Nathaniel Abrokwah Oteng

Equatorward excursions of cold polar air masses during cold air outbreaks (CAOs) result in the development of mesoscale convective circulations that significantly affect surface fluxes. Air masses undergo intense transformations as they transition from the ice to the warmer ocean.  Initially strong surface heat fluxes and strong shear result in the formation of helical convective rolls and associated cloud streets that can extend for hundreds of kilometers. Further downwind helical convective rolls evolve into convective cells forming open cell clouds.

We study an intense CAO observed on 13 March 2020 during Cold-Air Outbreaks in the Marine Boundary Layer Experiment (COMBLE) [1]. COMBLE deployed the Department of Energy Atmospheric Radiation Measurement (ARM) Mobile Facility 1 (AMF1) at Andenes, Norway to observe a range of CAO conditions. We simulate the evolution of a CAO using coupled mesoscale to microscale simulations with the Weather Research and Forecasting (WRF) model. The coupled simulation using WRF includes a mesoscale domain with 1050 m horizontal grid cell coupled online with a cloud-resolving LES domain with horizontal grid cell size of 150 m that stretches through the full ~1000 km extent of a CAO, from the ice edge to Andenes. Within the cloud-resolving domain are nested two LES domains with 30 m grid cells. One of these domains is focused on the region of convective rolls while the other one is focused on convective cells. This configuration enables us to study the transformation of airmass at high resolution, providing unprecedented insight into the mixed phase cloud (MPC) transition from rolls to cells. We study the interaction between large-scale forcing, surface fluxes, radiative transfer, and cloud processes in the formation and evolution of mesoscale organization and MPCs. As part of this effort, we utilize the Cloud Resolving Model Radar Simulator (CR-SIM) to compare WRF more directly to the measurements. Our CR-SIM analysis suggests that convective cell structures and properties are well modeled at the AMF1 site when using turbulence-resolving resolutions.

How to cite: Kosovic, B., Juliano, T., xue, L., Geerts, B., Lackner, C., and Abrokwah Oteng, N.: Coupled Mesoscale to Microscale Simulations of Mixed-Phase Convective Clouds Observed during the Cold-Air Outbreaks in the Marine Boundary Layer Experiment (COMBLE), EGU General Assembly 2024, Vienna, Austria, 14–19 Apr 2024, EGU24-6203, https://doi.org/10.5194/egusphere-egu24-6203, 2024.

EGU24-6252 | ECS | Orals | AS1.7

Quantifying cloud microphysical uncertainties in an extratropical cyclone’s ascending airstream using Lagrangian diagnostics 

Annika Oertel, Annette K. Miltenberger, Christian M. Grams, and Corinna Hoose

The characteristic large-scale and strongly precipitating cloud band in extratropical cyclones is associated with the so-called warm conveyor belt (WCB), which is a coherent cyclone-relative airstream that ascends cross-isentropically from the boundary layer into the upper troposphere. Cloud microphysical processes along this ascending airstream determine the total diabatic heating, cloud structure, and associated surface precipitation characteristics.

We disentangle uncertainty related to the representation of cloud microphysical processes in the two-moment microphysics scheme of the ICOsahedral Nonhydrostatic (ICON) modeling framework in a convection-permitting simulation setup for an extratropical cyclone case study in the North Atlantic. To quantify uncertainty, we employ a perturbed parameter ensemble (PPE) approach, whereby five selected uncertain parameters in the cloud microphysics scheme and environmental conditions relevant for cloud formation are perturbed simultaneously and systematically. Specifically, cloud microphysical uncertainty is quantified along Lagrangian WCB trajectories which are calculated online during the ICON simulations from the resolved 3D wind fields at every model time step for each of the 70 PPE members. The Lagrangian perspective not only facilitates the characterisation of the airstream’s ascent behaviour but also provides detailed insight in cloud and precipitation formation along the ascent. The application of the Lagrangian diagnostics to all PPE members enables the quantification of dominant contributions of uncertainty from the perturbed parameters for WCB ascent characteristics, such as ascent timescales and tracks, as well as for precipitation formation along the ascent.

For example, we show that the precipitation efficiency along the ascending airstream is most strongly influenced by cloud condensation nuclei (CCN) concentrations modifying the cloud droplet to rain drop conversion. Moreover, a trajectory-based airstream-relative composite analysis shows that increased CCN concentrations result in a downstream shift of the surface precipitation relative to the eastward propagating airstream as the precipitation efficiency is reduced. In addition, the Lagrangian diagnostics can illustrate the feedback between diabatic heating from cloud microphysical processes in the mixed-phase and local vertical velocity. In this contribution we present our analysis framework and show how the perturbed parameters influence various Lagrangian diagnostics for WCB ascent and associated cloud and precipitation formation.

How to cite: Oertel, A., Miltenberger, A. K., Grams, C. M., and Hoose, C.: Quantifying cloud microphysical uncertainties in an extratropical cyclone’s ascending airstream using Lagrangian diagnostics, EGU General Assembly 2024, Vienna, Austria, 14–19 Apr 2024, EGU24-6252, https://doi.org/10.5194/egusphere-egu24-6252, 2024.

EGU24-7261 | ECS | Posters on site | AS1.7

Wave-Convection Interactions Amplify Convective Parameterization Biases in the South Pacific Convergence Zone 

Yuanrui Chen, Wenchao Chu, Jonathon Wright, and Yanluan Lin

Climate models have long struggled to realistically simulate the South Pacific Convergence Zone (SPCZ) and its variability. For example, the default Zhang-McFarlane (ZM) convection in the Community Atmosphere Model version 5 (CAM5) produces too much light precipitation and too little heavy precipitation in the SPCZ, with this bias even more pronounced in the SPCZ region than in the broader tropics. In this presentation, we show that implementing a recently developed convection scheme in the CAM5 yields significant improvements in the simulated SPCZ during austral summer and describe the main reasons behind these improvements. In addition to intensifying both mean rainfall and its variability in the SPCZ, the new scheme produces a larger heavy rainfall fraction that is more consistent with observations and a state-of-the-art reanalysis. This shift toward heavier, more variable rainfall amounts is linked to increases in both the magnitude and altitude of diabatic heating associated with convective precipitation, thereby intensifying lower tropospheric convergence along the SPCZ axis and increasing the extent to which convection influences the upper-level circulation. Increased diabatic production of potential vorticity in the upper troposphere increases the distortion effect exerted by convection on transient Rossby waves passing through the SPCZ region. The much weaker distortion effects in simulations using the ZM scheme mean that waves are more likely to propagate continuously through the region rather than dissipate locally, thereby reducing updrafts and weakening convection within the SPCZ. Our results outline a dynamical framework for evaluating model representations of tropical-extratropical interactions within the SPCZ region and clarify why convective parameterizations that produce a more realistic top-heavy profile of deep convective heating are beneficial to representing the SPCZ and its variability.

How to cite: Chen, Y., Chu, W., Wright, J., and Lin, Y.: Wave-Convection Interactions Amplify Convective Parameterization Biases in the South Pacific Convergence Zone, EGU General Assembly 2024, Vienna, Austria, 14–19 Apr 2024, EGU24-7261, https://doi.org/10.5194/egusphere-egu24-7261, 2024.

EGU24-8708 | ECS | Orals | AS1.7

The role of parametrized shallow convection in tropical cloud systems 

Alessandro Savazzi, Louise Nuijens, Wim de Rooy, and Pier Siebesma

In current storm-resolving models, the parameterization of shallow cumulus convection is based on the mass-flux framework, originally tailored for coarse mesh sizes O(10-50km). Recent finer grids present a unique opportunity to study the coupling between clouds, convection, and the large-scale circulations. This finer resolution also prompts a critical inquiry into the role of shallow convection parameterization (SCP). Within the context of EUREC4A-MIP, we use HARMONIE-AROME with a grid spacing of 2.5 km to test the mesoscale cloud sensitivity to SCP. While cloud patterns are discernible at this resolution, individual shallow cumuli may not be fully resolved. Our investigation reveals that mesoscale properties of tropical shallow cumulus fields and associated circulations exhibit a pronounced dependence on sub-grid parametrization, with differences in cloud cover up to 20%. We simulate the period from January 1st to February 28th 2020, and compare three configurations of HARMONIE-AROME: 1) the control with active SCP, 2) UVmix-off without momentum mixing by shallow convection, 3) SCP-off without any mixing by shallow convection. Instead of an incremental effect, our results show that UVmix-off and SCP-off can produce opposite responses in the cloud field. UVmix-off produces large anvils, less precipitation, and a cooler lower-troposphere. In contrast, SCP-off produces many smaller clouds which precipitate more in a warmer lower-troposphere due to a more unstable environment, and the buildup of CAPE and turbulent kinetic energy. Importantly, our results underscore that the removal of SCP (and to a lesser extent, the removal of UV mixing) strengthens mesoscale circulations and augments their coverage through increased wind variance, predominantly at scales larger than 25 km. Stronger resolved vertical motion in SCP-off produces stronger circulations, whereas the altered wind mixing in UVmix-off primarily affects the coverage of circulations. The ability to look at parameterized tendencies provides further insight into where the convection is strengthening or weakening the winds. This nuanced exploration contributes valuable insights into the intricate dynamics of mesoscale cloud systems under varying shallow convective parameterizations.

How to cite: Savazzi, A., Nuijens, L., de Rooy, W., and Siebesma, P.: The role of parametrized shallow convection in tropical cloud systems, EGU General Assembly 2024, Vienna, Austria, 14–19 Apr 2024, EGU24-8708, https://doi.org/10.5194/egusphere-egu24-8708, 2024.

EGU24-8740 | Orals | AS1.7

The Max Planck Cloud Kite 

Eberhard Bodenschatz, Mohsen Bagheri, Hossein Khodamoradi, Artur Kupitzek, Freja Nordsiek, Constantin Schettler, and Birte Thiede

Most of the Earth's atmosphere is covered with clouds, which significantly affect incoming and outgoing radiation and thus the Earth's energy balance. Clouds are a source of considerable uncertainty in weather and climate models. Their size ranges from submillimeters, where cloud microphysics is important, to hundreds of kilometers, where they affect weather and climate. The complex coupling of cloud and turbulent flow dynamics at these scales makes clouds difficult to understand. In addition, several long-standing important puzzles, such as the existence and/or presence of cloud holes (regions without droplets) and the sharpness of cloud boundaries, remain unsolved. Given the high Reynolds numbers in atmospheric clouds (Re~10^6-10^9), laboratory-generated flows (with few exceptions) and direct numerical simulations are not yet capable of achieving cloud-like flow dynamics. Therefore, field studies and, in particular, airborne measurements performed far from the Earth's topographic influences can approach the correct range of parameter space relevant to naturally occurring clouds.
We have developed the Max Planck CloudKite, which consists of a balloon-kite aerostat and a suite of scientific instruments for simultaneous measurements of aerosols and turbulence features in the atmospheric boundary layer and in clouds. Cloudkite is an independent platform capable of characterizing the atmospheric boundary layer and low-lying clouds within the boundary layer (<2 km) at almost any location on Earth. It has been successfully deployed in remote regions of the Atlantic aboard research vessels and also in northern Finland within the Arctic Circle. The cloud-resolving probe is equipped with Particle Image/Tracking Velocimetry (PIV/PTV), Inline Holographic Particle Imaging, Fast Cloud Droplet Probe (FCDP), multi-hole pitot tubes, and humidity, temperature and pressure sensors. In addition, 10 WinDart units, including aerosol spectrometers and 3D ultrasonic sensors, are installed on the tether to fully characterize the atmospheric boundary layer and clouds simultaneously. Overall, the results will greatly improve our understanding of cloud evolution and spatial structure, as well as cloud-aerosol interactions, which is urgently needed to address climate change challenges.

How to cite: Bodenschatz, E., Bagheri, M., Khodamoradi, H., Kupitzek, A., Nordsiek, F., Schettler, C., and Thiede, B.: The Max Planck Cloud Kite, EGU General Assembly 2024, Vienna, Austria, 14–19 Apr 2024, EGU24-8740, https://doi.org/10.5194/egusphere-egu24-8740, 2024.

EGU24-8742 | Posters on site | AS1.7

Resolving shallow cumulus clouds: insights from high-resolution airborne measurements  

Gholamhossein Bagheri, Birte Thiede, Oliver Schlenczek, Freja Nordsiek, and Eberhard Bodenschatz

During the EUREC4A field campaign over the Atlantic Ocean near Barbados, we flew the Max Planck CloudKite aboard the German research vessel Maria S. Merian. In addition to three-dimensional wind speed, temperature, and humidity data, the scientific payload aboard CloudKite captured about one million holograms and half a million particle-image-velocimetry images, primarily in shallow cumulus clouds. The collected data allow us to capture the droplet size distribution and turbulence features with unprecedented resolution, thanks to the fast acquisition rate of the instruments combined with the low true air speed of the tethered CloudKite aerostat. We found that the clouds exhibit extreme variations in droplet size distribution both near the edge and in the core. The cloud droplets also exhibit clusters and empty regions, especially near the cloud edge.

How to cite: Bagheri, G., Thiede, B., Schlenczek, O., Nordsiek, F., and Bodenschatz, E.: Resolving shallow cumulus clouds: insights from high-resolution airborne measurements , EGU General Assembly 2024, Vienna, Austria, 14–19 Apr 2024, EGU24-8742, https://doi.org/10.5194/egusphere-egu24-8742, 2024.

EGU24-9104 | ECS | Orals | AS1.7

The puzzle of shallow convection-circulation coupling 

Martin Janssens

Since shallow clouds over the tropical oceans are organised into mesoscale structures, explaining the role of these clouds in climate requires understanding what governs mesoscale patterns in shallow cumulus convection. Many puzzle pieces have emerged in recent years. These include both external forcings on the boundary layer, such as the import of extratropical eddies and water vapour with the large-scale flow, weak sea-surface temperature anomalies and remotely triggered gravity waves, as well as internal feedbacks between convection and its mesoscale environment, such as cold pool dynamics and self-reinforcing low-level moisture convergence. What all these mechanisms share, is their interaction with the low-level mesoscale vertical motion field, which itself is often organised into shallow circulations that couple tightly to the convection. Here, we will therefore propose to begin assembling the puzzle pieces by analysing the origins of shallow circulations, in a conceptual framework of weak mesoscale virtual temperature gradients. The analysis is enabled by the simultaneous presence of observations of clouds, thermodynamics and mesoscale vertical motion taken during the EUREC4A field campaign, and simulations from EUREC4A-MIP; it will therefore serve as an example of what other puzzle pieces might fall in place by combining observations with other intercomparison projects in the model hierarchy, such as Lagrangian LES MIP, CP-MIP and NextGEMS.

How to cite: Janssens, M.: The puzzle of shallow convection-circulation coupling, EGU General Assembly 2024, Vienna, Austria, 14–19 Apr 2024, EGU24-9104, https://doi.org/10.5194/egusphere-egu24-9104, 2024.

EGU24-9151 | Posters on site | AS1.7

Lagrangian analysis of ice supersaturated air masses in connection with low level fronts of extratropical cyclones 

Philipp Reutter, Stefan Niebler, Annette Miltenberger, and Peter Spichtinger

Ice supersaturation is often found in the upper troposphere. The so-called ice supersaturated regions (ISSRs), i.e. air masses in the status of supersaturation with respect to ice, are formation regions of in-situ cirrus clouds. While an ISSR alone has a rather small effect on the radiation budget, this changes significantly when cirrus clouds develop within the ISSR. Hence, the transition from an ISSR to a cirrus cloud has important implications. In order to understand how ISSR and the embedded in-situ cirrus clouds form and develop, the transport pathways of water vapour have to be understood.

Therefore, to better understand the life cycle of extratropical ice-supersaturated regions (ISSRs), we utilize backward and forward trajectories initiated within ISSRs and analyze them. Furthermore, we connect these trajectories with information about the location of low-level frontal systems to investigate connections between ISSRs and extratropical cyclones. Particularly interesting is the relative position to the so-called warm conveyor belt (WCB) trajectories.


How to cite: Reutter, P., Niebler, S., Miltenberger, A., and Spichtinger, P.: Lagrangian analysis of ice supersaturated air masses in connection with low level fronts of extratropical cyclones, EGU General Assembly 2024, Vienna, Austria, 14–19 Apr 2024, EGU24-9151, https://doi.org/10.5194/egusphere-egu24-9151, 2024.

EGU24-9182 | Orals | AS1.7

Links between subtropical high-pressure systems and stratocumulus clouds variation 

Hairu Ding, Bjorn Stevens, and Hauke Schmidt

Stratocumulus clouds contribute significantly to the global energy budget as they are the Earth’s predominant cloud type and contribute strongly to Earth’s albedo. They are known to predominate in the subtropics, especially on the eastern edge of the subtropical highs. Previous studies have confirmed the importance of these highs for stratocumulus clouds, but how much it varies can influence the cloudiness hasn’t been quantified, yet. Our study investigates this relation for both the annual cycle and deseasonalized time series for the five major subtropical high-pressure regions. It has been shown that the estimated cloud top entrainment index (ECTEI) is a useful predictor for the stratocumulus cloud fraction for both time scales. We show, however, that the variation of the highs provides additional information on the fraction change on an annual cycle. The Northern Hemisphere is more sensitive to the highs change compared to the Southern Hemisphere. Variations in the structure, area, and location of subtropical highs are not considered the dominant influencing factors (correlations about 0.3~0.4). Nevertheless, we found a qualitative preference that stratocumulus clouds prefer a flatter, large, and westward subtropical high.

How to cite: Ding, H., Stevens, B., and Schmidt, H.: Links between subtropical high-pressure systems and stratocumulus clouds variation, EGU General Assembly 2024, Vienna, Austria, 14–19 Apr 2024, EGU24-9182, https://doi.org/10.5194/egusphere-egu24-9182, 2024.

EGU24-9705 | ECS | Orals | AS1.7

Linking tropical large-scale circulation and deep convection to subtropical marine low-clouds in the Pacific Ocean 

Danny McCulloch, Hugo Lambert, Mark Webb, and Geoffrey Vallis

Global Climate Models (GCMs) are essential for predicting the impact of climate change in the coming decades. However, the primary source of uncertainty in these predictions is our limited understanding of cloud feedback and its representation in models. Improving our knowledge of how changes in local heating rates affect low clouds via tropical overturning circulation is crucial to refining climate projections. In this study, we use an AMIP climate assessment configuration (with CMIP6 forcing) of the Met Office Unified Model to test the remote effects on subtropical clouds caused by localised changes in tropical atmospheric circulation.  

We conduct this causal analysis by applying a heating/cooling perturbation in the free troposphere in a typical convecting and in a typical subsiding region in the equatorial Pacific Ocean. This method allows us to perturb large-scale circulation and track the subsequent effects on subtropical clouds. We find that when we apply a heating or cooling in the tropical free troposphere, the subsidence in the subtropics strengthens but we do not find a change in the low-cloud content. However, when we apply a cooling perturbation in the Southeast Pacific subsidence region, which increases subsidence, we get more local low-clouds. This is the opposite of what is suggested by previous studies which use a correlative approach on a global scale. 

We show how changing the intensity of the large-scale circulation in the equatorial Pacific influences subtropical low clouds, while tracking the effects of our perturbations in the transition regions between the tropics and subtropics. Our findings demonstrate a new way to conduct causal studies to better understand and isolate the influence of the free troposphere on large-scale circulation and subtropical clouds in a full GCM setup. Additionally, our findings emphasise how regional influences might differ from global results, highlighting the importance of recognising and quantifying regional contributions which dictate global trends.


How to cite: McCulloch, D., Lambert, H., Webb, M., and Vallis, G.: Linking tropical large-scale circulation and deep convection to subtropical marine low-clouds in the Pacific Ocean, EGU General Assembly 2024, Vienna, Austria, 14–19 Apr 2024, EGU24-9705, https://doi.org/10.5194/egusphere-egu24-9705, 2024.

EGU24-9900 | ECS | Posters on site | AS1.7

Seeing doldrums from space 

Geet George and Julia Windmiller

Doldrums — the bane of sailors in ages past — are mesoscale regions of calm winds, usually seen dividing two zonal bands of convective clouds near the thermal equator. These features, together often manifest as the inter-tropical convergence zone (ITCZ), particularly over the Atlantic. The terms "ITCZ" and "doldrums" are often incorrectly used inter-changeably. With satellite observations, we show that they are in fact not the same meteorological feature. Although the doldrums seemed to have departed from current discussions, recent cross-equatorial ship-borne observations in the Atlantic have brought back attention to them and their role in shaping the distribution of convection. We use satellite measurements spanning more than 15 years to report statistics of doldrums over the Atlantic and the East Pacific. Along with their spatial extents, we document their zonal and meridional positioning as well as the seasonal and inter-annual variability therein. We also record the vertical extents of these calm horizontal winds, albeit with a shorter period of sampling. Co-located measurements of column moisture, surface rain rate and cloud liquid water provide an idea of the environmental conditions that are associated with the presence of doldrums. Particularly, we see an anomalously dry atmospheric column over the doldrums compared to that over the adjacent convergence bands, which is similar to those observed from the ship-based observations. We also find long periods (ca. 1 month) of westward propagation of doldrums, but there can be large differences in their spatio-temporal persistence among different years. Our characterization enables frameworks attempting to explain the physical mechanism of doldrums as well as their role in the mesoscale organization of the ITCZ.

How to cite: George, G. and Windmiller, J.: Seeing doldrums from space, EGU General Assembly 2024, Vienna, Austria, 14–19 Apr 2024, EGU24-9900, https://doi.org/10.5194/egusphere-egu24-9900, 2024.

EGU24-9928 | ECS | Orals | AS1.7

Tracking Clouds: Comparing Geostationary Satellite Observations and Model Data in the EUREC4A domain 

Felix Müller, Torsten Seelig, and Matthias Tesche

Cloud modelling is a very important tool for climate research. However, it is not an easy task to validate model data and assess a model’s performance. Since cloud model data can not be expected to be an exact match of corresponding satellite data, there is no immediate method of comparison available.

We use a cloud tracking algorithm [1] to find the lifetime and cloud size distributions of the cloud datasets. This enables us to provide a unique quality assessment of the model data. Lifetime information is interesting because it encompasses multiple dynamic scales from micro to planetary regimes, while cloud size and cloud cover are important factors for the radiative properties of the clouds in a region and characterise the clouds’ general behavior.

Here we compare satellite data from the EUREC4A campaign [2] (observed by the Advanced Baseline Image onboard the GOES-16 satellite) and model output from ICON-LEM tailored for the EUREC4A campaign [3], where two resolutions are available. All datasets are located east of Barbados in the Caribbean Sea. We build on previous cloud tracking analyses for the GOES satellite dataset [1].

For the comparison between the three datasets, we first show the temporal development of cloud cover and number of clouds as an overview for the datasets. Secondly, we show the distributions of clouds lifetimes and sizes for all trajectories. The linear regression exponent for the logarithmic cloud size distribution can be expected to be around -2 on the global scale [4], which all three datasets come close to. However for this region, we would expect small clouds to have a bigger influence compared to the global view. This effect can be observed in the model data which have slightly more negative exponents for both resolutions. Thirdly, we show the average development of cloud size over the lifetime of the tracked clouds as a further metric for evaluating how well the model can represent the cloud-development processes.

References

[1] Seelig et al. (2023) “Do optically denser trade-wind cumuli live longer?”, in Geophysical Research Letters, doi: 10.1029/2023GL103339

[2] EUREC4A campaign: www.eurec4a.eu

[3] Schulz, Hauke & Stevens, Bjorn (2023) “Evaluating Large-Domain, Hecto-Meter, Large-Eddy Simulations of Trade-Wind Clouds Using EUREC4A Data” in Journal of Advances in Modeling Earth Systems, doi: 10.1029/2023MS003648

[4] Wood, Robert & Field, Paul (2011) “The Distribution of Cloud Horizontal Sizes”, in J. Climate, doi: 10.1175/2011JCLI4056.1

How to cite: Müller, F., Seelig, T., and Tesche, M.: Tracking Clouds: Comparing Geostationary Satellite Observations and Model Data in the EUREC4A domain, EGU General Assembly 2024, Vienna, Austria, 14–19 Apr 2024, EGU24-9928, https://doi.org/10.5194/egusphere-egu24-9928, 2024.

Warm conveyor belts (WCB) are regions of large-scale coherent airflow within extratropical cyclones that rapidly ascend from the boundary layer to the upper troposphere. During their ascent, WCB air parcels experience various microphysical processes that produce mixed-phase clouds and large amounts of precipitation. They also transport water vapour and cloud condensate to the upper troposphere/lower stratosphere (UTLS), which is important for Earth’s radiative budget. Recent studies have found that deep and embedded convection play an important role in WCBs. This points to the necessity of high-resolution simulations, that are well validated with observational data to provide a “benchmark” for coarser-resolution global (climate) models. We conduct a Lagrangian investigation of the physical processes governing WCB moisture transport and cloud composition with a particular focus on (i) the microphysical processes controlling moisture loss from the WCB, and (ii) the cloud microphysical properties of the cirrus clouds in the WCB outflow.

To this end we conducted a case-study from the HALO-WISE campaign and ran a high-resolution doubly nested ICON simulation with a maximum (convection permitting) resolution of ~3km. Online trajectories are calculated that capture convective ascent and allow for a Lagrangian analysis of WCB moisture transport and WCB cloud structure.

The Lagrangian metrics show large differences in the behaviour of moisture transport to the UTLS for trajectories with different ascent timescales. Fast ascending trajectories ascend further south and to much lower pressures and temperatures than their slower counterparts. They also produce much more precipitation and have markedly different hydrometeor contents throughout the ascent. In the ice phase, slow ascending trajectories mainly produce ice and snow through depositional growth, whereas fast trajectories also produce graupel and hail by collision-coalescence. Warm rain processes dominate the moisture loss for all ascent timescales, but for fast ascending trajectories the conversion of moisture to precipitation by microphysical processes in the ice phase increases. These findings are important because widely used coarse-resolution simulations with convection parameterization run the risk of missing the physical processes we see for the fastest ascending trajectories.

How to cite: Schwenk, C. and Miltenberger, A.: A Lagrangian investigation of the (micro)physical processes controlling warm conveyor belt moisture transport and cloud properties, EGU General Assembly 2024, Vienna, Austria, 14–19 Apr 2024, EGU24-10425, https://doi.org/10.5194/egusphere-egu24-10425, 2024.

EGU24-12792 | Orals | AS1.7

Role of Sub-Cloud Rain Evaporation on Boundary Layer Decoupling over Barbados Island 

Mampi Sarkar, Youtong Zheng, and Raphaela Vogel

This study investigates the influence of sub-cloud rain evaporation on the decoupling of sub-tropical marine cumulus-topped raining boundary layers. Using 24-hour wind lidar and Ka-band radar observations on February 9, 2020 from the Barbados Cloud Observatory (BCO), along with in-situ rain microphysical observations from the ATR aircraft during the EUREC4A field campaign, we extract rain microphysical parameters - raindrop number concentration (N0) and geometric mean diameter (Dg). These parameters, alongside surface relative humidity measurements, serve as inputs to initialize a single-column rain evaporation model, allowing us to derive vertical profiles of rain evaporation fluxes and evaporation cooling rates. Our analysis identifies 'top-heavy' profiles characterized by maximum evaporative cooling near the cloud base, featuring smaller Dg and larger N0. Conversely, 'bottom-heavy' profiles exhibit larger Dg and smaller N0, with maximum evaporative cooling closer to the surface. Notably, our findings reveal that top-heavy profiles, especially when cloud bases are higher, tend to be more decoupled than bottom-heavy profiles. The higher decoupling of the top-heavy profiles is attributed to the stable configuration of the evaporatively-cooled moisture layer just below the warmer cloud layer, hindering moisture transport to the cloud. In contrast, for a bottom-heavy profile where the evaporatively-cooled moisture layer is accumulated closer to the surface over a warmer sea surface, surface-driven mixing promotes moisture transport to cloud bases, resulting in less decoupling. The decoupling index, independently estimated from the difference between ceilometer-based cloud base height and empirically determined lifting condensation level, enhances the robustness of our results. While emphasizing the significant influence of sub-cloud rain evaporation on the decoupling of cumulus-topped raining boundary layers, our study has not explored other factors like surface and radiative fluxes, which could also contribute to the boundary layer decoupling.

How to cite: Sarkar, M., Zheng, Y., and Vogel, R.: Role of Sub-Cloud Rain Evaporation on Boundary Layer Decoupling over Barbados Island, EGU General Assembly 2024, Vienna, Austria, 14–19 Apr 2024, EGU24-12792, https://doi.org/10.5194/egusphere-egu24-12792, 2024.

EGU24-12952 | ECS | Orals | AS1.7

Representation of marine low‐level clouds in global-coupled kilometer-scale simulations 

Ian D'Amato Dragaud, Jakub Nowak, Piotr Dziekan, Junhong Lee, Juan Pedro Mellado, and Bjorn Stevens

Marine boundary layer clouds stand out because of their importance for Earth's planetary albedo and their central role in determining Earth's sensitivity to forcing. The new global-coupled simulations at kilometer-scale resolution in both the atmosphere and the ocean in the framework of the H2020 nextGEMS project offer new opportunities to study cloud processes and their environmental factors, as well as provide unprecedented realism and new opportunities for comparison to observations. We examine the representation of (sub)tropical stratocumulus and trade-wind cumulus clouds by the IFS and ICON models configured with kilometer-scale resolution and global domains. The simultaneous consideration of ICON and IFS allows us to compare two strategies. The former simplifies parameterizations to understand process interactions better, sacrificing degrees of freedom to tune the model. The latter considers more sophisticated parameterizations, which allow for better tuning. The results of this study show the value of both. The performance of the four-year simulations is assessed in terms of the top-of-atmosphere (TOA) albedo and the vertical structure of the atmospheric boundary layer in eight regions where low-clouds are climatologically found. The stratocumulus regions are located in the eastern subtropical ocean basins, and the trade-wind cumulus regions are located west and equatorward from the stratocumulus ones. As an observational reference for the TOA albedo, we used satellite data from the CERES-EBAF TOA dataset.
Both models captured the mean horizontal distribution and seasonal cycle of TOA albedo and the typical vertical structure of the low atmosphere over the stratocumulus regions. Despite its relatively simplistic approach to sub-grid parameterizations, particularly turbulence mixing treated with the Smagorinsky scheme, ICON performed comparably well to IFS, which employs more sophisticated solutions, including eddy-diffusivity mass flux and convection schemes. Regarding trade-wind cumulus, both models overestimate the mean TOA albedo. To validate the simulated vertical structure of the atmospheric boundary layer in the northwestern Atlantic trade-wind regime, we used the radiosondes launched at the Barbados Cloud Observatory (BCO) during the EUREC4A field campaign. The ICON and IFS models represent the main characteristics of the vertical structure of wind speed, temperature, and moisture observed at the BCO. We also find some discrepancies between the model representation and the observations. The simulations represented a colder (1 K) vertical profile than the observations. The ICON represented a drier cloud layer between 1–2 km and a moister layer above it, which is attributed to too much vertical mixing across the top of the cloud layer and suggests some revision of the stability correction function. The IFS model represented this region better than ICON, which was expected because IFS uses a shallow convection scheme, which allows better control of this region. However, IFS represented slightly drier the lowest 500 m.

How to cite: D'Amato Dragaud, I., Nowak, J., Dziekan, P., Lee, J., Mellado, J. P., and Stevens, B.: Representation of marine low‐level clouds in global-coupled kilometer-scale simulations, EGU General Assembly 2024, Vienna, Austria, 14–19 Apr 2024, EGU24-12952, https://doi.org/10.5194/egusphere-egu24-12952, 2024.

The anvils of deep convective clouds (DCCs) have an important impact on global radiation balance. While the anvil cloud area feedback to warming temperatures is expected to have a cooling effect, it has the largest uncertainty of any cloud-climate feedback. Differences in anvil structure contribute to this uncertainty due to changes in the proportions of thicker, cooling anvil and thinner, warming anvil cirrus. A lack of long-term observational datasets of both convective and anvil properties of DCCs has limited our understanding of the connections between these processes.

Using a novel cloud tracking algorithm we detect and track the developing cores, thick and thin anvils of DCCs seen in 5 years of GOES-16 imagery, allowing investigations of their properties throughout the DCC lifecycle. Using this dataset, we compare how the amount of thin anvil cirrus changes with the intensity and organisation of observed DCCs. Previous studies of anvil structure have found that the proportion of thin cirrus increases with convective intensity across a range of regimes. We find that the thin anvil proportion increases with convective intensity both in area and lifetime. To the contrary, for more organised DCCs – those with more cores – we find, however, that the thin anvil area and lifetime both decrease as a proportion of the total anvil. While more intense DCCs have shorter growing phases and longer dissipating phases, the opposite is true for more organised DCCs. These differences in lifecycle have an important impact on thin anvil proportion. The contrast in structure and lifecycle between DCCs with increasing intensity and increasing organisation occurs despite both convective processes having positive impacts on the total anvil area, lifetime and temperature. As both the intensity and organisation of DCCs are expected to increase with warming, we may expect differences in anvil cloud area feedback between different regimes depending on the occurrence of isolated or organised DCCs.

How to cite: Jones, W. and Stier, P.: Contrasting effects of intensity and organisation on the structure and lifecycle of deep convective clouds, EGU General Assembly 2024, Vienna, Austria, 14–19 Apr 2024, EGU24-13548, https://doi.org/10.5194/egusphere-egu24-13548, 2024.

EGU24-15608 | Posters on site | AS1.7

A detailed statistics of cloud and precipitation processes in the trades from the RV M.S. Merian 

Claudia Acquistapace, Sabrina Schnitt, Sibylle Krause, Nils Risse, Davide Ori, Dwaipayan Chatterjee, Torsten Seelig, Diego Lange, Florian Späth, and Isabel Mccoy

Shallow cumulus clouds always played an essential role in the uncertainties in climate predictions. The EUREC4A campaign was conceived to tackle the problem of how such clouds will respond to climate change. Recent studies showed that although the research outcomes of the EUREC4A campaign constrained their response to climate sensitivity, open questions remain on the importance of mesoscale processes and the role of precipitation in the cloud organization, both aspects not well represented in climate models. 

The research vessel (RV) Maria S. Merian, during the campaign, continuously provided high-resolution observations of clouds, precipitation, and atmospheric boundary layer properties in a vast area of the Atlantic Ocean east and south of Barbados island. Here, we exploit such observations to statistically characterize clouds and precipitation properties and the surrounding environment in which they develop. 

In agreement with the literature, we define shallow clouds with cloud tops within 600 m of lifting condensation level (LCL) and congestus clouds with cloud tops between 600 and 4000m. We characterize their cloud properties, rain rates, and raindrop size distributions. We investigate virga generated from shallow and congestus clouds and describe how humidity and temperature change with the different cloudy conditions. We also display the relation between the W-band radar reflectivity and the radar skewness, revealing insights into the precipitation onset for shallow and congestus clouds and characterizing their cloud lifetime. Finally, we connect the local boundary layer and cloud properties to configurations occurring at the mesoscale, providing additional characterizations of flower, fish, sugar, and gravel in terms of ship-based observations.

How to cite: Acquistapace, C., Schnitt, S., Krause, S., Risse, N., Ori, D., Chatterjee, D., Seelig, T., Lange, D., Späth, F., and Mccoy, I.: A detailed statistics of cloud and precipitation processes in the trades from the RV M.S. Merian, EGU General Assembly 2024, Vienna, Austria, 14–19 Apr 2024, EGU24-15608, https://doi.org/10.5194/egusphere-egu24-15608, 2024.

EGU24-16010 | ECS | Posters on site | AS1.7

Lassoing Fish — Linking tropical Fish cloud structures to extratropical fronts 

Theresa Mieslinger, Julia Windmiller, and Bjorn Stevens

People on Barbados are used to “rope-like” cloud structures passing over the island and their association with more disturbed weather conditions. In more recent literature, such cloud structures are frequently named Fish owing to their fishbone-like appearance on satellite images. Schulz et al., 2021, identified Fish cloud structures in satellite imagery via machine learning and showed that they have a pathway coming from the extratropics and often show a frontal character based on their surface convergence field, both indicative of them being associated with extratropical fronts. Extratropical fronts are known to impact convection in the tropics. A wealth of past studies based on theory, observations and modelling showed the distinct water-vapor structure, precipitation characteristics, as well as radiative-dynamical mechanisms of extratropical intrusions and highlight their importance for tropical moist convection.

In our study, we investigate the link between well-studied extratropical fronts and Fish-like cloud appearances. We apply a neural network to identify Fish cloud structures across the global tropics and investigate them with respect to the characteristics of well-studied extratropical fronts. We aim to answer the questions whether all Fish patterns are the visual imprint of extratropical fronts and how their thermodynamical and dynamical properties change as they propagate to lower latitudes.

How to cite: Mieslinger, T., Windmiller, J., and Stevens, B.: Lassoing Fish — Linking tropical Fish cloud structures to extratropical fronts, EGU General Assembly 2024, Vienna, Austria, 14–19 Apr 2024, EGU24-16010, https://doi.org/10.5194/egusphere-egu24-16010, 2024.

EGU24-17171 | ECS | Orals | AS1.7

Pattern Recognition of Convection in the Atlantic Intertropical Convergence Zone 

Lennéa Hayo, Julia Windmiller, Hauke Schulz, Claudia Acquistapace, and Susanne Crewell

The Intertropical Convergence Zone (ITCZ) in the Atlantic is typically described as a narrow band of precipitation and deep convection. However, this description often stems from long-term averaging of precipitation or outgoing longwave radiation in the ITCZ. On shorter time scales, the ITCZ is much more dynamic and various classifications of different patterns can be attempted. One possibility is based on satellite images collected during the GATE campaign in 1974 where four patterns - Line, Double Line, Broad and Cluster - were previously identified. In our analysis, we build on the pioneering results from GATE, supplement the category No Clouds, and validate the patterns based on 43 years of harmonized, equal-angle grid geostationary satellite images. In a first attempt, manual classification of these patterns in the visible spectrum proved feasible for 1000 km wide cutouts and for manually defining the extent of the pattern on the entire Atlantic ITCZ. Manual classification for July 2021 has already shown that all classes neither occur with the same frequency nor the same spatial ditribution over all regions of the Atlantic. For further analysis on the appearance of these patterns on longer time scales the satellite images have been classified by a machine learning algorithm, and their frequency dependence on season and region have been analyzed. These results now enable us to ask why these different patterns occur.

How to cite: Hayo, L., Windmiller, J., Schulz, H., Acquistapace, C., and Crewell, S.: Pattern Recognition of Convection in the Atlantic Intertropical Convergence Zone, EGU General Assembly 2024, Vienna, Austria, 14–19 Apr 2024, EGU24-17171, https://doi.org/10.5194/egusphere-egu24-17171, 2024.

EGU24-17571 | ECS | Posters on site | AS1.7

Interactions between tropical low marine clouds and wind profiles using ALADIN/Aeolus 

Zacharie Titus, Hélène Chepfer, and Marine Bonazzola

Low clouds such as cumulus and stratocumulus cover a great part of the tropical belt all year long. Variables affecting the formation and dissipation of these clouds like the Sea Surface Temperature or humidity have been studied for a long time now. However, wind profiles could previously only be obtained by radiosondes (localized) or airborne measurements (regional). From 2018 to 2023, ESA ALADIN/Aeolus Doppler Wind LIDAR has orbited the Earth, collecting wind profiles at a global scale, between the surface and 20 km of altitude. This instrument has opened new perspectives regarding wind-cloud interactions with co-located low cloud profiles and wind profiles.


In a Large Eddy Simulation Helfer et al.[1]  have shown that wind shear can have an impact on the development of trade wind cumulus clouds in the first kilometers of the atmosphere. Mieslinger et al.[2]  have shown combining ERA5 wind and ASTER imagery, that stronger surface wind are correlated with a more important cloud cover. In our study, we will see how ALADIN/Aeolus can help us to better understand interactions between low clouds and wind with co-located observed wind profiles and cloud profiles. We will focus on the subtropical marine boundary layer, around strong subsidence regions, like the descending branch of the Hadley cell. In these regions, low clouds are present in number and ALADIN is rarely attenuated due to the rare occurrence of mid and high altitude clouds[3].


[1] Helfer et al. - How Wind Shear Affects Trade-wind Cumulus Convection (2020)

[2] Mielsinger et al. - How Wind Shear Affects Trade-wind Cumulus Convection (2020)

[3] Chepfer et al. - The GCM oriented CALIPSO Cloud Product (CALIPSO-GOCCP) (2010)


How to cite: Titus, Z., Chepfer, H., and Bonazzola, M.: Interactions between tropical low marine clouds and wind profiles using ALADIN/Aeolus, EGU General Assembly 2024, Vienna, Austria, 14–19 Apr 2024, EGU24-17571, https://doi.org/10.5194/egusphere-egu24-17571, 2024.

EGU24-21182 | Posters on site | AS1.7

The Cold Pool Model Intercomparison Project (CP-MIP) 

Jan Kazil, Raphaela Vogel, Peter Blossey, Steven Boeing, Leif Denby, Salima Ghazayel, Thijs Heus, Roel Neggers, Girish Raghunathan, and Pier Siebesma

Atmospheric cold pools form when cool downdrafts from cumulus clouds spread out laterally at the surface. The cool surface air suppresses convection and erases clouds around the downdraft. Over the oceans, the resulting cloud-free areas are often larger than 100 km, and turbulence and clouds recover only after many hours. The properties, mechanisms, lifecycle, and radiative effect of cold pools are currently not well understood. This is in part because the key processes of cold pools proceed on scales below the resolution of large scale models, and in part because of model biases in cold pool simulations by high resolution models.

The Cold Pool Model Intercomparison Project (CP-MIP) seeks to investigate and improve the fidelity of model representation of convective cold pools. The goals of CP-MIP are the identification, characterization, and quantification of model biases through comparison with observed cold pool statistics, the convergence of models towards a robust basis for the study of cold pools, and the improved representation of cold pools in high resolution and large scale simulations.

We introduce CP-MIP, describe the approaches and objectives, and set out the elements of CP-MIP. The first stage of CP-MIP focuses on shallow convective cold pools over the tropical oceans, which are primarily associated with trade cumulus clouds. Observations from the EUREC4A and ATOMIC field campaigns, and modeling efforts from the CP-MIP partner projects contribute to CP-MIP. We present an analysis of first results.

How to cite: Kazil, J., Vogel, R., Blossey, P., Boeing, S., Denby, L., Ghazayel, S., Heus, T., Neggers, R., Raghunathan, G., and Siebesma, P.: The Cold Pool Model Intercomparison Project (CP-MIP), EGU General Assembly 2024, Vienna, Austria, 14–19 Apr 2024, EGU24-21182, https://doi.org/10.5194/egusphere-egu24-21182, 2024.

EGU24-651 | ECS | Posters on site | HS7.1

Multi-scale comparison of rainfall measurement in Paris area between two optical disdrometers of different working principles 

Marcio Matheus Santos de Souza, Auguste Gires, and Jerry Jose

A disdrometer is an instrument designed to assess both the size and velocity of descending hydrometeors. The applications of rainfall measurements retrieved with the help of disdrometers are diverse, spanning areas such as traffic control, scientific research, airport observation systems, and hydrology. Modern disdrometers leverage microwave or laser technologies that have increased the accuracy of the measurements with each iteration. Still, the quality of measurements fluctuates depending on factors such as raindrop size, wind velocity, and rain rate. A comprehension of these variations is needed to better understand the level of reliability of each device depending on the specific rain conditions.

In this study, we compare the performance of two optical disdrometers : 3D Stereo disdrometer (manufactured by Thies Clima) and Parsivel2 (manufactured by OTT). Both devices provide size resolved measurement of rainfall along with velocity of falling drops. Parsivel is set to record data every 30 seconds over a sampling area of 54 cm² and arranges the information in 32 x 32 classes of drop size and velocity. Unlike the Parsivel, 3D Stereo does not discretize measurements, and directly provides the diameter and velocity of each falling drop in a sampling area of 100 cm² with a measuring resolution of 0.08 mm and 0.2 m/s respectively, and a temporal resolution of 1 millisecond. This finer resolution data enables us to study rainfall variability at very small scales which are not usually available.

Here, we used continuously and simultaneously measured data since 21/08/2023, from TARANIS observatory of ENPC (https://hmco.enpc.fr/portfolio-archive/taranis-observatory/). The initial comparison of the data was done using a time series of rain-rate for rainfall events in between a dry period of at least 15 minutes and total depth >0.7 mm. This revealed an unexpected disparity in the water volume collected between the devices. Parsivel collected more than 3D Stereo on every instance, and the disparity got bigger as the rain rate increased. With the purpose of studying the source of this disparity, the sampling area of the 3D Stereo was divided into 8 sections and compared with each other. This showed that the estimate of rainfall parameters such mean diameter, mean velocity of the drops (which were expected to be uniform over long periods regardless of the section where drops are measured) were not the same for the sections studied, and exhibited clear trends. To understand this discrepancy in a scale invariant way, and to evaluate the performance of devices across scales and not only at a single scale, the widely used framework for studying variability of geophysical fields – Universal Multifractals (UM) was employed for assessing the scaling behavior of fields. Rainfall from both devices showed previously reported average scaling behavior from 30 s to 30 min. The difference between rain events and also the behavior at finer scales, which can be accessed from 3D stereo disdrometer were also studied using the UM framework and will be discussed.

Authors acknowledge the Ra2DW project (supported by the French National Research Agency - ANR-23-CE01-0019), for partial financial support.

Keywords: rainfall; disdrometer; multifractals;

How to cite: Santos de Souza, M. M., Gires, A., and Jose, J.: Multi-scale comparison of rainfall measurement in Paris area between two optical disdrometers of different working principles, EGU General Assembly 2024, Vienna, Austria, 14–19 Apr 2024, EGU24-651, https://doi.org/10.5194/egusphere-egu24-651, 2024.

EGU24-2655 | Posters on site | HS7.1

Designing the TUDS rainfall observatory in northern Ghana 

Nick van de Giesen, Frank Annor, Sylvester Ayambila, Richard Dogbey, Vincent Hoogelander, Gordana Kranjac-Berisavljevic, Kingsley Kwabena, Rob Mackenzie, Marc Schleiss, and Remko Uijlenhoet

Convective rainfall in West Africa is poorly monitored and understood. There are large gaps between remote sensing rainfall products and what is observed on the ground. There are several reasons for these gaps. First, satellites and rain gauges measure at very different scales so one would expect that remote sensing products contain more events at lower intensities than small gauges. Second, a lot happens between the clouds observed by satellites and the ground. Rainfall may evaporate and move with the wind, causing further disconnects between space and ground observations. There are also indications that clouds in West Africa contain many small drops due to the presence of many aerosols, thereby possibly “misleading” satellite products. Finally, it is likely that there are further factors that are not yet accounted for.

In order to tackle this disconnect between ground and space observations, we plan to build the TUD - UDS, or TUDS, rainfall observatory near Tamale and Nyankpala in northern Ghana. The following are initial ideas that we would like to discuss at the EGU. It will be a multi-scale observatory, starting at a grid of nine gauges on a 500m grid (1km x 1km total). This small grid should capture the inherent spatial variability of convective rainfall events with convective cells of 2km or less. The largest grid would also contain nine gauges and have an extent of 10km x 10km, or larger. This outer grid would capture the movement of convective cells, including those contained within so-called line squalls. An intermediate grid may complete this picture. The structure will look, more or less, like the one in the picture below.

Different instruments will be at our disposal, from simple totalling rain gauges to disdrometers. There will be five Thies disdrometers, one Ott Parsivel, and several TAHMO stations and/or tipping bucket rain gauges. Also experimental intervalometers will be placed in the grid to better understand rainfall structure over time and space. Several instruments will be co-located to examine strengths and weaknesses of the different methods.

We explicitly invite comments and contributions.  


TEMBO Africa: The work leading to these results has received funding from the European Horizon Europe Programme (2021-2027) under grant agreement n° 101086209. The opinions expressed in the document are of the authors only and no way reflect the European Commission’s opinions. The European Union is not liable for any use that may be made of the information.

How to cite: van de Giesen, N., Annor, F., Ayambila, S., Dogbey, R., Hoogelander, V., Kranjac-Berisavljevic, G., Kwabena, K., Mackenzie, R., Schleiss, M., and Uijlenhoet, R.: Designing the TUDS rainfall observatory in northern Ghana, EGU General Assembly 2024, Vienna, Austria, 14–19 Apr 2024, EGU24-2655, https://doi.org/10.5194/egusphere-egu24-2655, 2024.

Precipitation droplets are influenced by environmental fields and transform in time and space, following cloud microphysical processes. Accordingly, a raindrop size distribution (DSD) changes shape in a various form. However, DSDs cannot be calculated directly in radar or bulk models and are expressed using an approximate function. Exponential and gamma distribution are well-known as approximation functions, but there are DSDs of shapes that cannot be represented by these functions. One of them is a bimodal DSD with two peaks. Previous modeling studies have indicated that the bimodal DSD is formed when the collision-breakup process reaches equilibrium. On the other hand, recent observation-based studies have discussed the influence of convective activity within the precipitation system on forming the bimodal DSD. However, observations have not been able to quantitatively study the microphysical changes of individual particles and have yet to reveal the formation mechanisms within the precipitation system. In this study, we investigated quantitatively the process of the formation of the bimodal DSD by two-dimensional simulation of multicellular convection with the bin method. The simulation results showed that the bimodal DSD was formed during the updraft and downdraft in the mature stage of the multicell. Additionally, the bimodal DSD was formed at lower altitudes where there was inflow into the precipitation system. Particles that constituted the maximum of the bimodal DSD were found to have been advected by the inflow. Particles that constituted the local maximum dropped against the updraft. In contrast to these, particles that constituted the local minimum were less affected by the inflow and had difficulty dropping against the updraft. These results suggested that the bimodal DSD was formed by horizontal and vertical size sorting because of inflow and updrafts in the mature multicellular convection. In the future, it is necessary to simulate the reproduction of observed cases and compare them with observations.

How to cite: Okazaki, M., Yamaguchi, K., Yanase, T., and Nakakita, E.: Spatiotemporal structure of raindrop size distribution due to flow field in a convective precipitation system simulated by bin cloud microphysics model., EGU General Assembly 2024, Vienna, Austria, 14–19 Apr 2024, EGU24-6387, https://doi.org/10.5194/egusphere-egu24-6387, 2024.

EGU24-6767 | Posters on site | HS7.1

Microphysical properties of the stratiform precipitation in Kyiv city based on OTT Parsivel2 and pluviograph data  

Svitlana Krakovska, Liudmyla Palamarchuk, and Anastasiia Chyhareva

Precipitation detailed characteristics, namely spectrum of particles by their sizes, phase and precipitation intensity with high-resolution timestep, still need to be investigated due to the complexity of their direct instrumental measurements but necessity for improving forecast for different applications including hydrological and emergency service. Our study is focused on the stratiform precipitation associated with cloud system (Ns-As) of warm front during prolonged and intense precipitation event on the 25th October 2023 in Kyiv, Ukraine. This warm front cloud system was connected with an occluded low over Poland which developed on the East periphery of a huge depression (970 hPa) over the Northern Atlantic.

We analyzed the OTT Parsivel² - Laser Weather Sensor measurement data with 10sec time steps. Parsivel² was installed nearby regular meteorological station, which is a part of the WMO network, and its measurements were used for verification. Precipitation intensity and raindrop distributions had wavy character, where we can distinguish a few waves of precipitation enhancement. The average intensity of the minimum wave was 0.02mm/min that corresponds to 30 raindrops with size varying from 0.5 to 1.5mm and maximum falling speed 4m/s for the largest raindrops. The average intensity of maximum precipitation enhancement wave was 0.15mm/min with around 100 raindrops per 10sec with sizes mainly from 0.5 to 2.5mm (with some raindrop sizes up to 3.5mm) and average falling speed 5-6m/s. Total amount of 26-hour precipitation event was 24.2mm according to OTT Parsivel² measurements and 26mm according to SYNOP data from Kyiv WMO station (ID 33345). We should note that in modern climate condition in Kyiv such prolonged frontal precipitation even in autumn is rather rare event in respect to previous decades.  

Gained results were compared with previous studies based on 20-year measurement by pluviograph at the same Kyiv WMO station. For stratiform precipitation, average maximum precipitation intensity within precipitation enhancement waves was around 0.11mm/min. Duration of main precipitation enhancement waves was around 21 minutes. Characteristics of precipitation enhancements waves are key for assessment of surface runoff value. The significant fraction of water on the ground that forms surface runoff goes mainly from such precipitation enhancement waves, when around 60 up to 90% of the maximum surface runoff can be formed.

In conclusion, OTT Parsivel² Laser Weather Sensor was used in Ukraine for the first time and demonstrated good performance versus the city station accumulation measurements and historical pluviograph data at the station. At the moment this instrument is under way to the Ukrainian Antarctic station Akademik Vernadsky where further exploitation will allow to test and obtain measurement data for different phase of precipitation, mostly mixed and solid and compare with data from Micro Rain Radar Pro. Obtained and future results will extend our understanding of precipitation formation, their microphysics and dynamics, interconnections between precipitation intensity and size/fall speed of raindrops and solid particles. Future studies could help to evaluate the transformation of cloud and precipitation formation processes under the climate change for better parameterization in numerical models, to study the microphysical structure and composition of precipitation.

How to cite: Krakovska, S., Palamarchuk, L., and Chyhareva, A.: Microphysical properties of the stratiform precipitation in Kyiv city based on OTT Parsivel2 and pluviograph data , EGU General Assembly 2024, Vienna, Austria, 14–19 Apr 2024, EGU24-6767, https://doi.org/10.5194/egusphere-egu24-6767, 2024.

EGU24-7802 | Posters on site | HS7.1

Cloud based tool to enhance urban resilience with the Fresnel Platform using the Multi-Hydro Model 

Guillaume Drouen, Daniel Schertzer, Auguste Gires, and Ioulia Tchiguirinskaia

The aim of the Fresnel platform of École des Ponts ParisTech is to foster research and innovation in multiscale urban resilience. Studying the hydrological response of such complex urban areas accounting also for small scale spatio-temporal precipitation variability requires adapted tools. For these reasons, RadX provides a user-friendly graphical interface to run simulations using a fully distributed and physically based model: Multi-Hydro. RadX is designed as a Software as a Service (SaaS) platform, allowing users to work with data across a wide range of space-time scales and the appropriate tools for analyzing and simulating this data.

The hydrological model, developed at École des Ponts ParisTech, integrates four open-source software applications previously used and validated independently by the scientific community as well as practitionners. Its modular structure includes a surface flow module, sewer flow module, a ground flow module and a precipitation module. It is able to simulate the quantity of runoff and rainwater infiltrated into unsaturated soil layers from any space-time varying rainfall event at any location of the studied peri-urban watersheds, as well as depth and flow in all the pipes and nodes of the sewer network.

Users can launch hydrological simulations using the Multi-Hydro model directly from their web browser, while they are run on dedicated servers. They can adjust two key input parameters: the land use of the studied catchment and the rainfall data. Dedicated tools have been developed to enable users to modify the land use of the catchment with the same ease as using a raster graphic editor. Users can either choose real rainfall events captured by the X-band weather radar located at École des Ponts ParisTech or utilize user-defined synthetic rainfall as input. Data from other radar can also easily be integrated. 

For the simulation output, the interface provides users with different tools to study in detail the impact of the chosen input parameters. For instance, by simply selecting two sewer junctions on an interactive map, users can generate a sewer path between these two points and display an interactive representation of the water level heights in sewer conduits and junctions along the user-defined sewer network path.

Additional components can be integrated into RadX to meet specific requirements using visual tools and forecasting systems, including those from third parties. Developments are still in progress, with a constant loop of requests and feedback from the scientific and professional world.

How to cite: Drouen, G., Schertzer, D., Gires, A., and Tchiguirinskaia, I.: Cloud based tool to enhance urban resilience with the Fresnel Platform using the Multi-Hydro Model, EGU General Assembly 2024, Vienna, Austria, 14–19 Apr 2024, EGU24-7802, https://doi.org/10.5194/egusphere-egu24-7802, 2024.

EGU24-8714 | ECS | Orals | HS7.1

Improvements in rain gauge design and measurements to minimise under-catch errors 

Mark Dutton and Domenico Balsamo

Precipitation measurements provide historic and near real-time data for Met Services and ground truth references for modelling and forecasting.  Current methods suffer from well-known under-catch problems1.  These are caused by wind effect2 on the gauge, out-splash, evaporation, and internal tipping bucket (‘counting’) errors.  Thereby causing water-balance errors for Hydrology scientists.  Good gauge design and correct siting can minimise these errors but not eliminate them.

Over 10 years of research, into the best aerodynamic shape for a precipitation gauge, was carried out to minimize out-splash and maximize catch3.  Comparison field work1 and Computational Fluid Dynamic4 (CFD) research was undertaken between standard straight-sided, ‘chimney’ shaped, aerodynamic shaped and pit-installed (out of the wind) gauges.  This research demonstrated that it may be possible to quantify under-catch using gauge rim-based wind data, drop-size and drop-type information.  Field comparison between the “new instrument” and pit gauge will be needed.  Once quantified at source, it can then be used to accurately correct live data.

This new instrument uses ultrasonic wind sensors and Doppler-Shift measuring techniques to obtain wind versus rainfall catch data.  Also using optical and/or impact sensing techniques we can measure the individual drop size and count the drops involved in a rain event.  By adding weighing technology to the tipping bucket design and improving calibration methods, we can improve resolution and detect evaporation losses.  Also power efficient and controlled heating to allow the inclusion of solid precipitation measurements.  Then finally use machine learning (ML) techniques to correct the errors.

Therefore, the aim of this project is to design a simple to use intelligent instrument to minimise and possibly eliminate under-catch measurement errors balancing out the water budget.  Allow installation of the instruments at ground and raised levels without increase in errors caused predominately by the wind.  Create near real-time and historic field precipitation data, both corrected and non-corrected to be use by Met Services and Hydrology modelling scientists.

References

1. Sevruk, B. Methods of correction for systematic error in point precipitation measurement for operational use, World Meteorological Organization - Operational Hydrology, Report No. 21, 1982.

2. Pollock, M. D., et al. Quantifying and mitigating wind induced undercatch in rainfall measurements, Water Resources Research, 54, 2018.

3. Strangeways, Ian. Improving precipitation measurement. International Journal of Climatology. 24. 1443 - 1460. 10.1002/joc.1075, 2004.

4. Colli, M., et al.  A Computational Fluid-Dynamics Assessment of the Improved Performance of Aerodynamic Rain Gauges. Water Resources Research. 54. 10.1002/2017WR020549, 2018.

How to cite: Dutton, M. and Balsamo, D.: Improvements in rain gauge design and measurements to minimise under-catch errors, EGU General Assembly 2024, Vienna, Austria, 14–19 Apr 2024, EGU24-8714, https://doi.org/10.5194/egusphere-egu24-8714, 2024.

EGU24-8789 | ECS | Orals | HS7.1

Merging personal weather stations with real-time radar rainfall estimates at the catchment scale 

Nathalie Rombeek, Markus Hrachowitz, Davide Wüthrich, and Remko Uijlenhoet

Real-time flood forecasting and warning during extreme rainfall events remains challenging since accurate and real-time available data are critical. Nowcasting based on radar rainfall can be utilized for this, as it has a high spatial and temporal resolution (i.e. typically 1 km and 5 min). However, the quantitative precipitation estimates (QPE) from the radar, upon which radar rainfall nowcasting is based, often contains substantial uncertainty and bias. While the QPE are usually corrected with official rain-gauge networks, these networks are sparse, and not always available in (near) real-time.

Instead, personal weather stations (PWS) can be used, as they have a much higher density and are available in real time. While PWS are prone to several sources of error, quality control algorithms can be used to improve their accuracy. Previous research already showed that merging quality controlled PWS with radar rainfall estimates reduces the underestimation for 1-hour accumulated rainfall at the pan-European scale. However, this has not yet been investigated at the catchment scale. This research aims to investigate the potential of merging PWS data with radar rainfall estimates for different catchments in the Netherlands, by considering multiple rainfall events starting from 2018. The goal is to quantify the performance in relation to rainfall type, quality control algorithms and catchment properties, validated against the climatological gauge-adjusted radar dataset from the KNMI. The insights obtained from this research have the potential to be utilized for real-time radar rainfall nowcasting and consequently flood forecasting.

How to cite: Rombeek, N., Hrachowitz, M., Wüthrich, D., and Uijlenhoet, R.: Merging personal weather stations with real-time radar rainfall estimates at the catchment scale, EGU General Assembly 2024, Vienna, Austria, 14–19 Apr 2024, EGU24-8789, https://doi.org/10.5194/egusphere-egu24-8789, 2024.

EGU24-10819 | Orals | HS7.1

Spatial and temporal structure of normal and extreme rainfall 

András Bárdossy

The space time behaviour of precipitation is very complex. The knowledge of the dependence structures in space and time is very important for the assessment of flood risks. In this contribution the dependence structures of normal and extreme events are compared. Both rain gauges with high temporal resolution and radar images are investigated. Spatial and temporal copulas are used for this investigation. Due to the large number of zero observations, especially for short temporal aggregations an indicator approach is used to detect structural differences. The results show, that the temporal dependence structure of rainfall gradually changes with increasing intensity. Similar behaviour can be detected for the spatial structure with the addition of advection related differences in both ranges and angles of anisotropy. The findings indicate that metagaussian approaches which only consider spatial and temporal correlations are not appropriate for the description and the simulation of rainfall extremes. Finally a new structural simulation method using non-Gaussian dependence is presented.

How to cite: Bárdossy, A.: Spatial and temporal structure of normal and extreme rainfall, EGU General Assembly 2024, Vienna, Austria, 14–19 Apr 2024, EGU24-10819, https://doi.org/10.5194/egusphere-egu24-10819, 2024.

EGU24-12007 | Orals | HS7.1

Revisiting nonterminal hydrometeors: Refining instrument uncertainty 

Michael Larsen, Andrei Vakhtin, and Anthony Gomez

The fall velocities of rain and drizzle drops are often assumed to be a deterministic function of their size. These diameter-fall speed relationships are intrinsically assumed in the retrievals provided by some commercial rain measurement instruments (e.g. the Joss-Waldvogel Disdrometer (Distromet), Micro Rain Radar (METEK), and 1-Dimensional Video Disdrometer (Joanneum Research)).

Some disdrometers are capable of independently measuring droplet size and fall-speed and provide evidence that not all drops adhere to the assumed size/fall-speed relationship. The ubiquity and magnitude of these deviations are still an area of some debate; clear identification of drizzle and rain drops falling at speeds different than their expected terminal fall velocities is muddied by conservative estimates of disdrometer resolution and performance. For a long time the bulk of observed non-terminal drop fall speeds were assumed to be instrumental artifacts and, even now, most investigators conclude drops falling at non-terminal speeds do not have a large impact on rain measurement science.

To date, uncertainties in disdrometer-derived drop sizes and fall speeds have usually been derived from the manufacturer estimates. Here, we improve on these estimates by using a field calibration source (the new ``Large Drop Generator'' from Mesa Photonics) that permits user-selectable generation of droplets with known sizes and fall speeds. From these data, empirical estimates of disdrometer sizing and fall velocity bias and uncertainty can be determined. This, then, allows for a more reliable estimate of the fraction of non-terminal drops in natural rain and a more reliable assessment of the impact of non-terminal drizzle and rain drops in data derived from instruments that assume a specific drop size/fall-speed relationship.

How to cite: Larsen, M., Vakhtin, A., and Gomez, A.: Revisiting nonterminal hydrometeors: Refining instrument uncertainty, EGU General Assembly 2024, Vienna, Austria, 14–19 Apr 2024, EGU24-12007, https://doi.org/10.5194/egusphere-egu24-12007, 2024.

EGU24-12054 | Posters on site | HS7.1

Testing a new Radar QPE methodology for winter events with a low melting layer 

Raquel Evaristo, Ju-yu Chen, Alexander Ryzhkov, and Silke Trömel

The RY precipitation product of the German Weather Service (DWD) is severely affected by the presence of the low melting layer and frequently shows circular features of enhanced precipitation around the radar sites during the winter time. 
The radars tend to be installed at relatively high terrain and to scan at elevations at a minimum of 0.5° in order to avoid beam blockage and ground clutter. In doing so two problems arise:

1) the difference between the ground and the radar beams becomes a problem especially at large distances from the radar, and consequently precipitation processes in the lowest layers are not observed.
2) the radar beam often reaches the melting layer and may even cross it where it is sampling the snow above.As a result problems arise when deriving surface QPE from the radar: regions of enhanced QPE in ring shapes around the radar sites, and underestimation of the precipitation beyond the melting layer.

A new methodology (PVPR - Polarimetric Vertical Profile of Reflectivity) developed by Ryzhkov et al. 2022 is tested here for which the radar reflectivity (ZH) is reconstructed to correct for the effect of the melting layer and snow beyond. In this methodology the melting layer is detected independently for each azimuth based on the values of ZH and ρHV (cross-correlation coefficient between horizontal and vertically polarized radar waves). In particular the range bin at which the melting layer was reached is recorded (mlb_r). The strength of the melting layer (ML_S) is defined based on how much the value of ρHV  dropped within the melting layer. The values of ML_r and ML_S at a specific elevation are considered sufficient to characterize the melting layer, and are then compared with lookuptables which were generated by simulations of the melting layer effect on the radar beam. A correction factor is then applied based on the lookuptables to the ZH profile within and beyond the melting layer. Visually the result shows a smoother field of reflectivity without the obvious bright band and decreased values associated with snow at farther ranges.

In this study the PVPR methodology was used to correct ZH which in turn was used to calculate rain rates and rain accumulations in a few winter events in Germany.  The results show a strong improvement in the quality of the QPE when compared to rain gauges. The quality of the resulting QPE depends on the event and on the location of the radar. More specifically, the quality decreases when the melting layer is very low, at heights comparable to the radar height, and when the difference between the beam and the surface increases. These problems will be analyzed and potential solutions will be tested in order to improve the quality of the rainfall product.

Ryzhkov, Alexander, Pengfei Zhang, Petar Bukovčić, Jian Zhang, and Stephen Cocks. 2022. "Polarimetric Radar Quantitative Precipitation Estimation" Remote Sensing 14, no. 7: 1695. https://doi.org/10.3390/rs14071695 

How to cite: Evaristo, R., Chen, J., Ryzhkov, A., and Trömel, S.: Testing a new Radar QPE methodology for winter events with a low melting layer, EGU General Assembly 2024, Vienna, Austria, 14–19 Apr 2024, EGU24-12054, https://doi.org/10.5194/egusphere-egu24-12054, 2024.

EGU24-12374 | ECS | Posters on site | HS7.1

Implications of the rainfall spatial variability for the real-time modeling of runoff triggering stony debris flows 

Mauro Boreggio, Matteo Barbini, Martino Bernard, Matteo Berti, Massimiliano Schiavo, Alessandro Simoni, Sandivel Vesco Lopez, and Carlo Gregoretti

In a mountainous environment, high-intensity and short-duration precipitation can generate sudden and abundant runoff at the base of rocky cliffs. This runoff, upon impacting the debris deposits present there, can trigger debris-flow phenomena. In the province of Belluno, in the Boite River valley, a network of rain gauges has been set up to monitor precipitation in the Rovina di Cancia site, where 12 debris-flow events have occurred in the last 10 years. The rain gauges are strategically placed both upstream and downstream of the debris-flow initiation area. In most cases, the precipitation showed significant spatial variability in both planimetric and altimetric aspects. This variability is crucial when simulating the runoff that triggers stony debris flows. The simulation of the peak runoff that triggered the 12 occurred events using a single rain gauge presented a high scatter compared to the simulation performed with the spatially recorded rainfall, except when the chosen rain gauge was close to the rocky cliffs. Furthermore, modelling using radar estimates as rainfall input also displayed significant variability based on the rain gauge used to correct the radar data. Essentially, accurate real-time simulation of runoff triggering debris flows requires the presence of rain gauges upstream of the initiation area, particularly in close proximity to the rocky cliffs.

How to cite: Boreggio, M., Barbini, M., Bernard, M., Berti, M., Schiavo, M., Simoni, A., Vesco Lopez, S., and Gregoretti, C.: Implications of the rainfall spatial variability for the real-time modeling of runoff triggering stony debris flows, EGU General Assembly 2024, Vienna, Austria, 14–19 Apr 2024, EGU24-12374, https://doi.org/10.5194/egusphere-egu24-12374, 2024.

EGU24-13111 | ECS | Orals | HS7.1

Identification of wet and dry periods in commercial microwave link observations via information theory framework 

Anna Špačková, Martin Fencl, and Vojtěch Bareš

Commercial microwave links (CML) have already demonstrated their promising potential in rainfall observation and sensing. The CMLs enable indirect monitoring of path-averaged rainfall intensity as the transmitted signal is attenuated along the link path mainly by raindrops. However, the signal is also attenuated during dry weather periods and is affected by both atmospheric and hardware conditions. Faulty separation of wet and dry periods can easily lead to incorrect rainfall estimates and remains challenging to estimate due to irregular fluctuations of the attenuated signal.

This study aims to use information theory approach to estimate wet and dry periods in the CML signal attenuation observation, which is achieved by evaluating individual predictors and combinations of predictors. The method enables any data to be used as predictors without the need for parameters to describe relations between different variables, as the discrete probability distributions are applied. The model that provides the strongest information content to the wet and dry classification is binarized using an optimized threshold and validated. Thiesen et al. (2019) recently applied this approach to identify rainfall-runoff events in discharge timeseries.

Data of non-winter periods between 2014 and 2016 are used with a temporal resolution of 1 minute. For one CML in the Prague network, wet and dry periods were defined manually as reference (target). Predictors included raw CML data (signal attenuation), as well as derived timeseries such as signal attenuation shifted in time, relative magnitude of attenuation, gradient of the signal attenuation and signal deviation. In addition, external predictors such as temperature deviation, rain gauge precipitation observations or synoptic types are used as additional predictors.

By selecting different predictors, it is possible to compare effectiveness in estimating the reference wet and dry periods. Variation in the strength of the relations between the target and the predictors allows ranking the suitability of available predictors and their combinations for the task. Subsequently, having the best performing predictor, it is combined with others and their collective performance was iteratively evaluated to find the most accurate combination of three predictors described in a multidimensional discrete distribution model. The resulting predictor combination was then converted into binary form and validated. A method comparison is performed with separation of constant and moving average baseline attenuation for wet periods identification as well as wet/dry classification using a threshold for rolling standard deviation of the signal.

Having sufficient data amount for data-driven models enables utilizing the relationships within the dataset without being limited by parametric or operational assumptions, which are often embedded part of wet/dry in classification methods.

References
Thiesen, S., Darscheid, P., and Ehret, U.: Identifying rainfall-runoff events in discharge time series: a data-driven method based on information theory, Hydrol. Earth Syst. Sci., 23, 1015–1034, https://doi.org/10.5194/hess-23-1015-2019, 2019.

This work was supported by the Grant Agency of the Czech Technical University in Prague, grant no. SGS23/048/OHK1/1T/11.

How to cite: Špačková, A., Fencl, M., and Bareš, V.: Identification of wet and dry periods in commercial microwave link observations via information theory framework, EGU General Assembly 2024, Vienna, Austria, 14–19 Apr 2024, EGU24-13111, https://doi.org/10.5194/egusphere-egu24-13111, 2024.

EGU24-14062 | Posters on site | HS7.1

Upward transport in a canopy assisted by raindrop impacts on plant leaves 

Tristan Gilet and Loïc Tadrist

The interception of raindrops by plant leaves induces a redistribution of water, nutrients, and micro-organisms, from the surface of these leaves to their surroundings. It consequently shapes the plant ecosystem. For example, in wheat fields (as in most major crops), splashing raindrops are the main mechanism of spore dispersal for fungal diseases at the epidemic stage, with severe consequences on crop yield. Surprisingly, the observed dispersal is not only downward (wash off / dripping) or outward (splash), but also upward, which may considerably speed up the fungus propagation. Other nutrients and microorganisms might also benefit from such upward transport external to the plant.

In this work, we unravel an efficient and universal mechanism of upward transport: after a raindrop splashed on a plant leaf, the residual water on the leaf can be shot upward as the leaf springs back. We illustrate this phenomenon with several plant leaves. Then we present results obtained from systematic experiments with artificial leaves, thanks to which both the mechanics of rain-induced leaf motion and the fluid dynamics of leaf-induced droplet ejections are elucidated. We identify the range of mechanical properties of the leaf that makes upward shooting fully effective. Finally, we show that the efficiency of this upward transport increases more than proportionally with rain intensity. Its occurrence and role in shaping ecosystems will be largely amplified in the case of an increased frequency of extreme rain events.

How to cite: Gilet, T. and Tadrist, L.: Upward transport in a canopy assisted by raindrop impacts on plant leaves, EGU General Assembly 2024, Vienna, Austria, 14–19 Apr 2024, EGU24-14062, https://doi.org/10.5194/egusphere-egu24-14062, 2024.

EGU24-16024 | ECS | Orals | HS7.1

Quantifying precipitation intermittency for Bergen, Norway, from measurements and models across a wide range of time scales 

Ingrid O. Bækkelund, Mari B. Steinslid, and Harald Sodemann

Intermittency of rainfall is an important property, for example in the context of urban flooding. There is currently a lack of information about the ability of numerical weather prediction models to represent precipitation intermittency for different weather situations, in particular at high resolution in space and time. Here we present a new way to quantify rainfall intermittency based on a near-continuous, high-resolution precipitation dataset from Bergen, Norway, one of the rainiest cities in Europe. 

We quantify precipitation intermittency from a precipitation dataset acquired at the Geophysical Institute, Bergen, spanning the period 2019-2022 at a 1 min time resolution. Precipitation rates were obtained from a Total Precipitation Sensor TPS-3100 (Yankee Environmental Systems Inc., USA) and a Parsivel2 disdrometer (OTT Hydromet GmbH, Germany). In addition, we use precipitation output at 1 min resolution from the regional high-resolution weather forecasts model HARMONIE-AROME for selected events. Precipitation intermittency is then identified for a range of minimum inter-event times (MIT) from 1 min to 24 h, and precipitation event durations from 1 min to 33 days. Next, the precipitation events for different intermittencies are related to average meteorological characteristics during the events with respect to air temperature, pressure, wind speed, rain rate and amount, and corresponding weather regimes.  

We compile the intermittency information into a 2-dimensional heat map that can be considered as a characteristic fingerprint for precipitation in Bergen. Particular frequency maxima and minima appear to be related to different precipitation processes and weather regimes. A scale gap between 30 min and 2 h event duration for MIT larger than 12 h indicates that separate factors control precipitation processes at these time scales. Weather regimes show a clear influence on the precipitation characteristics, with a markedly higher probability for long-duration rain events in the zonal flow regime for longer event durations at high MITs compared to the Scandinavian trough regime. A comparison between precipitation intermittency simulated by HARMONIE-AROME shows reasonable agreement with observed event characteristics for events lasting more than 1h, while events with durations of 30 min and less are poorly represented. 

How to cite: Bækkelund, I. O., Steinslid, M. B., and Sodemann, H.: Quantifying precipitation intermittency for Bergen, Norway, from measurements and models across a wide range of time scales, EGU General Assembly 2024, Vienna, Austria, 14–19 Apr 2024, EGU24-16024, https://doi.org/10.5194/egusphere-egu24-16024, 2024.

EGU24-17471 | Orals | HS7.1

Wind-induced bias of catching-type precipitation gauges and their overall collection efficiency 

Luca G. Lanza, Arianna Cauteruccio, and Enrico Chinchella

In windy conditions, the measurement of liquid and solid atmospheric precipitation is still a challenge even using the most advanced automatic instrumentation (Cauteruccio et al., 2021). The measurement accuracy is affected by various environmental sources of bias, including siting issues and exposure. These add to the instrumental bias, which can be minimized in case of accurate instrument calibration. Wind is however recognised as the most impactful source of environmental bias, outperforming by 3 to 50 times the total impact of all other environmental factors.

Computational Fluid Dynamics simulation with embedded liquid (raindrops) and solid (snowflakes) particle tracking is here used to quantify the wind-induced bias of catching-type precipitation gauges. Starting from the numerically calculated catch ratios, six common commercial gauges having different outer geometry are compared in terms of their expected performance under various precipitation intensity and wind speed conditions. Preliminary wind tunnel experiments allowed full validation of the simulated aerodynamic behaviour and its effect on water drop trajectories.

The overall collection efficiency is shown to depend on the precipitation intensity and its functional dependence is quantitatively derived as a measure of the instrument performance under a wind climatology characterised by a uniform probability density function. A less pronounced diversion of hydrometeor trajectories is shown – at any given size – by instruments with aerodynamic design than in case of more traditional geometry.

Chimney-shaped instruments rank low in case of liquid precipitation measurements, while a high performance is shown by inverted conical and Nipher shielded instruments and the investigated quasi-cylindrical gauges have intermediate behaviour, which depends on their specific aerodynamic features. All instruments rank low at light to moderate precipitation intensity for the measurement of solid precipitation, except the Nipher shielded gauge.

This work provides the basic information needed to apply adjustments to the measured data and supports manufacturers in upgrading instruments with an existing design by introducing on-board adjustments of the measured precipitation. These would only require contemporary measurement of the wind velocity (often included in typical meteorological stations). The full work and the numerically derived adjustments for the six investigated commercial gauges are published in Cauteruccio et al. (2024).

References

Cauteruccio, A., Colli, M., Stagnaro, M., Lanza, L.G. & Vuerich, E. (2021). In situ precipitation measurements. In T. Foken (Ed.), Handbook of Atmospheric Measurements (359-400). Switzerland, Springer Nature. ISBN 978-3-030-52170-7, https://doi.org/10.1007/978-3-030-52171-4_12.

Cauteruccio, A., Chinchella, E. and L.G. Lanza (2024). The overall collection efficiency of catching-type precipitation gauges in windy conditions. Water Resour. Res., in press. https://doi.org/10.1029/2023WR035098.

How to cite: Lanza, L. G., Cauteruccio, A., and Chinchella, E.: Wind-induced bias of catching-type precipitation gauges and their overall collection efficiency, EGU General Assembly 2024, Vienna, Austria, 14–19 Apr 2024, EGU24-17471, https://doi.org/10.5194/egusphere-egu24-17471, 2024.

EGU24-18921 | Orals | HS7.1

Unveiling the Geodetic Distribution of Temporal Characteristics in Rainstorm Events across Republic of Korea 

Hoyoung Cha, Jongjin Baik, Hyeon-Joon Kim, Jinwook Lee, Jongyun Byun, and Changhyun Jun

Abstract

This study analyzed geodetic distribution about temporal characteristics in rainstorm (> 1 hour) observed at approximately 600 rainfall stations across Republic of Korea. Utilizing minute-scale precipitation data observed by rainfall stations from 2000 to 2022, independent rainstorm events separated from rainfall data per unit time (i.e., 10, 20, 30, and 60 minutes) and Inter-Event Time Definition (IETD) (i.e., 2, 3, 4, and 6 hours). The significant variations in rainfall characteristics are defined as the number of independent rainstorm events, rainfall duration (hour), amount (mm), and intensity (mm/hour) for quantifying the temporal characteristics across rainfall stations. We quantified temporal characteristics among rainfall characteristics observed by rainfall stations based on latitude and longitude. The number of independent rainstorm events varies significantly depending on unit time and IETD, and the occurrence of events was frequently observed in areas characterized by island features. The rainfall amount for independent rainstorm events obscured significant characteristics, excluding Halla Mountain on Jeju Island. The geodetic distribution for the duration and intensity per rainstorm event varied depending on the characteristics of the region (i.e., island, mountain, etc.). Based on these results, it was confirmed that certain temporal characteristics vary according to regional features. In future research, we intend to utilize this information to cluster rainfall stations based on temporal characteristics.

Keywords: Independent Rainstorm Events, Temporal Characteristics, Geodetic Distribution, Regional Features, Republic of Korea

Acknowledgment

This research was supported by Korea Environment Industry & Technology Institute (KEITI) funded by Korea Ministry of Environment (RS-2022-KE002032 and 2022003640001) and was also supported by the National Research Foundation of Korea (NRF) grant funded by the Korea government (MSIT) (No. NRF-2022R1A4A3032838 and No. RS-2023-00250239).

How to cite: Cha, H., Baik, J., Kim, H.-J., Lee, J., Byun, J., and Jun, C.: Unveiling the Geodetic Distribution of Temporal Characteristics in Rainstorm Events across Republic of Korea, EGU General Assembly 2024, Vienna, Austria, 14–19 Apr 2024, EGU24-18921, https://doi.org/10.5194/egusphere-egu24-18921, 2024.

EGU24-20231 | Posters on site | HS7.1

A new method for disaggregating path-averaged rain rates from commercial microwave links 

Martin Fencl and Marc Schleiss

Commercial microwave links (CMLs) serve as point-to-point radio connections in cellular backhaul and offer a promising way to measure rainfall opportunistically. Raindrops along the CML path attenuate electromagnetic waves, allowing the conversion of this attenuation into path-averaged rain rates. Wide coverage of CML networks, high density in urban areas, and cost-effective operation present clear advantages over traditional rain gauges and radar networks. However, the integrated nature of CML data poses a challenge. When transforming this data into spatially representative rainfall estimates, such as 2D maps, path-integrated rain rates need to be converted into point data and interpolated to a regular two-dimensional Cartesian grid. The most direct method involves reducing each CML observation to a single-point measurement at the path's center, followed by interpolation using techniques like kriging or inverse distance weighted (IDW) interpolation. Yet, past studies indicate that for longer CMLs (several kilometers) and intense localized rain showers, this approach can introduce significant biases and unrealistic rainfall distributions due to the substantial spatial and temporal variability of rainfall.

In this contribution, we introduce a new disaggregation method employing random cascades. The method redistributes rainfall amounts along CML paths across progressively smaller scales using a discrete, conservative multiplicative random cascade. Inspired by the EVA (Equal-volume area) cascade developed by Schleiss (2020) for disaggregating spatially intermittent rainfall fields, our approach involves splitting each CML segment into two new segments with different path-lengths but identical path-integrated rainfall. We call this new method CLEAR (CML segments with equal amounts of rain). CLEAR is tested for CML network of 77 CMLs located in Prague, CZ. First, the disaggregation is evaluated using simulated CML observations and, second, CML rain rates derived from real attenuation data.

Our findings demonstrate that CLEAR surpasses reconstruction algorithms that reduce CML observations into a single point. It accurately replicates the highly diverse rainfall distributions observed along CMLs, including their intermittency. Moreover, the stochastic nature of the cascade enables the quantification of uncertainty associated with the spatial redistribution of rainfall rates along CMLs.

References

Schleiss, Marc. “A New Discrete Multiplicative Random Cascade Model for Downscaling Intermittent Rainfall Fields.” Hydrology and Earth System Sciences 24, no. 7 (July 23, 2020): 3699–3723. https://doi.org/10.5194/hess-24-3699-2020.

How to cite: Fencl, M. and Schleiss, M.: A new method for disaggregating path-averaged rain rates from commercial microwave links, EGU General Assembly 2024, Vienna, Austria, 14–19 Apr 2024, EGU24-20231, https://doi.org/10.5194/egusphere-egu24-20231, 2024.

EGU24-20898 | Posters on site | HS7.1

Comparative analysis of rainfall characteristics for two distinct research plots 

Jürgen Komma, Borbala Szeles, Katarina Zabret, Mojca Šraj, and Juraj Parajka

In natural environments, rainfall causes soil erosion, which has a significant impact on the agricultural production and the ecological conditions of the streams. Due to different types of vegetation, their unique characteristics and seasonality, there are still a lot of open scientific questions about how rainfall interception process influences the rainfall erosivity and soil erosion. With the aim of improving knowledge about rainfall interception by different vegetation and its impact on the rainfall erosivity, an interdisciplinary and international research team (Faculty of Civil and Geodetic Engineering at the University of Ljubljana, Slovenian Forestry Institute and Technical University of Vienna) work together in the research project entitled “Evaluation of the impact of rainfall interception on soil erosion”. In the scope of the project, drop size distribution measurements above and below selected plants will be conducted in combination with classical measurements of rainfall partitioning. The measurements are ongoing in the small urban park in Ljubljana, Slovenia and in the experimental catchment with mainly agricultural land use in Lower Austria (The Hydrological Open Air Laboratory HOAL in Petzenkirchen). To evaluate the differences in rainfall characteristics for the two research plots, a comparative analysis on rainfall event properties such as rainfall amount, duration and intensity, size and velocity distribution of raindrops is performed. The aim of the presentation is to introduce the project and presents the first comparison of the rainfall characteristics at research plots in Austria and Slovenia.

Acknowledgments: This contribution is part of the ongoing research project entitled “Evaluation of the impact of rainfall interception on soil erosion” supported by the Slovenian Research and Innovation Agency (project J2-4489) and the Austrian Science Fund (FWF) I 6254-N.

How to cite: Komma, J., Szeles, B., Zabret, K., Šraj, M., and Parajka, J.: Comparative analysis of rainfall characteristics for two distinct research plots, EGU General Assembly 2024, Vienna, Austria, 14–19 Apr 2024, EGU24-20898, https://doi.org/10.5194/egusphere-egu24-20898, 2024.

Understanding historical evolution and future projections of drought are crucial for Madagascar, which experiences drought almost every year. Not only it contributes to the economic development of the area but it also helps to mitigate direct and indirect impacts of drought on human’s lives and natural ecosystems. To begin with, it is crucial to use accurate datasets for assessing drought in order to get reliable findings. However, Madagascar lacks reliable station datasets. Here, we present the first evaluation of performance of available observed precipitation datasets over the country: gridded precipitation datasets from gauge-based, reanalysis and satellite estimates. Among the 15 analyzed datasets, CHIRPS (Climate Hazards Group Infrared Precipitation with Station data version 2) and ERA5 (European Centre for Medium-Range Weather Forecasts reanalysis fifth generation- Land dataset) the lowest biases compared to the rest. Thus, they are used as the reference for evaluating the performance of CMIP6 HighResMIP simulations. The assessment employs diverse methods, accompanied by the use of the Taylor skill score for ranking the overall performance of the models. The results show that EC-Earth3P-HR, ECMWF-IFS-HR, ECMWF-IFS-LR and HadGEM3-GC31-MM perform the best. The evaluated precipitation datasets are used in current ongoing research of recent drought evolution and its impact on vegetation over Madagascar. Preliminarily results show that the SPI (Standard Precipitation Index) exhibit decreasing trend for all chosen SPI scales (SPI3, SPI6 and SPI12). This indicates that the occurrence of drought over Madagascar has amplified within the study period of 1981 to 2022. Eventually, the evaluation of future projections of drought over the Island would be the next goal to be tackled in order to provide bases for planning appropriate measures in lessening the impact of drought, building effective adaptation strategies and structuring climate change policies.

How to cite: Randriatsara, H. H.-R. H. and Holtanova, E.: Precipitation over Madagascar: Assessment of observed datasets and CMIP6 HighResMIP models for further analysis of drought and its impact on vegetation , EGU General Assembly 2024, Vienna, Austria, 14–19 Apr 2024, EGU24-199, https://doi.org/10.5194/egusphere-egu24-199, 2024.

EGU24-527 | ECS | Orals | AS1.10

Diurnal Variability of Global Precipitation: Insights from Hourly Satellite and Reanalysis Datasets 

Rajani Kumar Pradhan, Yannis Markonis, and Francesco Marra

Accurate estimation of precipitation at the global scale is of utmost importance. Even though satellite and reanalysis products are capable of providing high spatial-temporal resolution estimations at the global level, their uncertainties vary with regional characteristics, scales, and so on. The uncertainties among the estimates, in general, are much higher at the sub-daily scale compared to daily, monthly and annual scales. Therefore, quantifying these sub-daily estimations is of specific importance. In this context, this study seeks to explore the diurnal cycle of precipitation using all the currently available space-borne and reanalysis-based precipitation products with at least hourly resolution (IMERG, GSMaP, CMORPH, PERSIANN, ERA5) at the quasi-global scale (60N - 60S). The diurnal variability of precipitation is estimated using three parameters, namely, the precipitation amount, frequency, and intensity, all remapped at a common resolution of 0.25 and 1 h. All the estimates well represent the spatio-temporal variation across the globe. Nevertheless, considerable uncertainties exist in the estimates regarding the peak precipitation hour, as well as the diurnal mean precipitation amount, frequency, and intensity. In terms of diurnal mean precipitation, PERSIANN shows the lowest estimates compared to the other datasets, with the largest difference observed over the ocean rather than over land. As for diurnal frequency, ERA5 exhibits the highest disparity among the estimates, with a frequency twice as high as that of the other estimates. Furthermore, as expected being based on model reanalysis, ERA5 shows an early diurnal peak and the highest variability compared to the other datasets. Moreover, among the satellite estimates, IMERG, GSMaP, and CMORPH exhibit a similar pattern with a late afternoon peak over land and an early morning peak over the ocean.

How to cite: Pradhan, R. K., Markonis, Y., and Marra, F.: Diurnal Variability of Global Precipitation: Insights from Hourly Satellite and Reanalysis Datasets, EGU General Assembly 2024, Vienna, Austria, 14–19 Apr 2024, EGU24-527, https://doi.org/10.5194/egusphere-egu24-527, 2024.

EGU24-736 | ECS | Posters virtual | AS1.10

Regional Variation in Precipitation characteristics observed by space-borne Precipitation Radar  

Amit Kumar, Atul Kumar Srivastava, and Manoj Kumar Srivastava

Dual-frequency precipitation radar (DPR) placed on the Global Precipitation Measurement (GPM) satellite provides a three-dimensional distribution of precipitation between 650N- 650S. The availability of precipitation parameters at the spatial resolution of 0.10*0.10 and temporal resolution of 30 minutes can be used to investigate the microphysical process responsible for the precipitation. We analyzed the GPM-DPR level 2 V07 observed data collected over the Southern region of India and the surrounding Oceanic region to understand the precipitation characteristics in the pre-monsoon and monsoon seasons. India Meteorological Department (IMD) gridded rainfall data at the resolution 0.250 is used to validate GPM-DPR data over the landmass region. There is significant variation in the temporal and spatial distribution of reflectivity (Z), rain rate (R), and DSD parameters such as mass-weighted mean diameter (Dm) and normalized intercept parameter (Nw). In the monsoon season, higher precipitation frequency provides considerable accumulated precipitation throughout India. However, the frequency of intense rainfall is higher in the pre-monsoon season than in the monsoon season, as most of rain events occur over the Ocean instead of land. The mean of R, Z, and Dm is small, and a large Nw value is observed in the monsoon season, as stratiform clouds (more than 68%) contribution in monsoon precipitation is more than convective clouds. The distribution of average Dm, Z, and R in pre-monsoon indicates the presence of bigger rain droplets, possibly due to the enhancement in the collision-coalescence process and slow-down of the break-up process. The share of convective clouds in overall precipitation on the land surface increased in the pre-monsoon season. The fluctuation in Dm not only occurs with topography, season, and R, but also with the concentration of heavy ice precipitation particles above the bright band and microphysical process. Simultaneously, in both pre-monsoon and monsoon seasons, a modest relationship was detected between the incidence of heavy precipitation and maximum echo top reflectivity.

How to cite: Kumar, A., Srivastava, A. K., and Srivastava, M. K.: Regional Variation in Precipitation characteristics observed by space-borne Precipitation Radar , EGU General Assembly 2024, Vienna, Austria, 14–19 Apr 2024, EGU24-736, https://doi.org/10.5194/egusphere-egu24-736, 2024.

EGU24-1520 | ECS | Orals | AS1.10

Sensitivity to the vertical structure of hydrometeors using Polarimetric RO 

Antía Paz Carracedo, Ramon Padullés Rulló, and Estel Cardellach Galí

The Global Navigation Satellite System (GNSS) Radio Occultation (RO) technique sounds the atmosphere providing high quality vertical profiles of the thermodynamics on a global scale. The Polarimetric RO (PRO) technique is an extension of traditional RO that retrieves precipitation information in addition to the standard thermodynamic products. The technique has been demonstrated aboard the Spanish Low Earth Orbiter (LEO) PAZ, as part of the Radio Occultation and Heavy Precipitation (ROHP) experiment led by the Institut de Ciències de l’Espai (ICE-CSIC/IEEC) in collaboration with NOAA, UCAR, and NASA/Jet Propulsion Laboratory. This mission enables the investigation of intense precipitation events and their associated meteorological conditions by retrieving atmospheric thermodynamic variables and offering insights into the vertical structure of precipitation.

The determination of the vertical structure is accomplished through the observable differential phase shift (ΔΦ), defined as the difference in the accumulated phase delay between the two linear polarizations (H-V) as function of the tangent point of the PRO rays. During intense precipitation events certain challenges arise in obtaining high-quality measurements of thermodynamic parameters due to signal attenuation. However, the PRO technique is less affected by attenuation, presenting an opportunity to obtain high-resolution thermodynamic profiles and information about the vertical structure of hydrometeors, simultaneously.

Validation of the PRO technique with two-dimensional data has been successfully conducted using the Global Precipitation Measurement (GPM) mission gridded products (like Integrated Multi-satellitE Retrievals for GPM, IMERG). In this analysis, vertical structure validation has been performed using data from the Next Generation Weather Radars (NEXRAD), a network of dual-polarized Doppler radars operating at the S-band, covering the entire United States territory. By exploiting the dual-polarization capabilities of NEXRAD, a comparison of the specific differential phase shift (KDP) structures with the PRO observable ΔΦ aids in examining similarities and differences in the detection of precipitation between the two instruments.

Furthermore, to explore the sensitivity of the PRO technique to various types of hydrometeors, the Weather Research and Forecasting-Advanced Research Weather Model (WRF-ARW) is employed for a comparative analysis, focusing on hydrometeor water contents. The variation of the model’s microphysics parametrizations allows for the study of the PRO technique’s sensitivity based on different assumptions about hydrometeors. Changes in these parametrizations impact total precipitation, vertical structure of hydrometeors, cloud properties, energy budget, spatial structure, among others. The validation and sensitivity study of the PRO technique will contribute to an enhanced understanding of the observables obtained and will offer insights into the phenomena characterizing intense precipitation situations.

How to cite: Paz Carracedo, A., Padullés Rulló, R., and Cardellach Galí, E.: Sensitivity to the vertical structure of hydrometeors using Polarimetric RO, EGU General Assembly 2024, Vienna, Austria, 14–19 Apr 2024, EGU24-1520, https://doi.org/10.5194/egusphere-egu24-1520, 2024.

EGU24-1983 | ECS | Orals | AS1.10

Hydrometeor classification using dual-polarized C-band Doppler weather radars: comparison to a dual-polarization Doppler profiler 

Linda Bogerd, Hidde Leijnse, Aart Overeeem, Remko Uijlenhoet, and Sibbo van der Veen

The innovation of dual-polarization Doppler weather radars has improved the accuracy of precipitation estimates over the past decades. Retrieving hydrometeor types from dual-polarization weather radar data, however, remains challenging. In this study, we used a hydrometeor classification scheme from wradlib to identify hydrometeor types aloft from two C-band weather radars in the Netherlands. Four recent case studies, from 2022 and 2023, were selected. A dual-polarization Doppler profiling radar, operating at Ka-band and W-band at an elevation angle of 45 degrees, was employed as a reference. First, the output of the wradlib scheme was used to determine the hydrometeor type. Based on this classification, we selected computed scattering properties from the open access ARTS Microwave Single Scattering Properties Database. Furthermore, mixing ratios of the hydrometeors were computed by combining measured C-band reflectivities using the hydrometeor type probabilities from wradlib. The hydrometeor type determines the scattering behavior of a single precipitation particle while the mixing ratio prescribes the particle size distribution (PSD), which is determined using parametrizations as employed in the Harmonie weather model. With the PSD and the hydrometeors’ terminal fall speeds, which are also taken from Harmonie, we produced spectra of various polarimetric variables that could be compared to those derived from the profiling radar. Besides incorrect classifications resulting from the wradlib algorithm, differences between constructed and observed spectra stem from various uncertainties associated with the retrievals from the profiler. Firstly, the hydrometeor canting angle distribution affects the backscattering to the radar. Secondly, the PSD parametrizations as employed in HARMONIE have been employed, while numerous alternatives exist that could yield different results. Finally, uncertainties are associated with the conversion of 45-degree measurements from the profiling radar to vertically-pointing spectra. Nonetheless, this study offers important insights into the performance of dual-polarization C-band weather radars regarding the classification of hydrometeor types.

How to cite: Bogerd, L., Leijnse, H., Overeeem, A., Uijlenhoet, R., and van der Veen, S.: Hydrometeor classification using dual-polarized C-band Doppler weather radars: comparison to a dual-polarization Doppler profiler, EGU General Assembly 2024, Vienna, Austria, 14–19 Apr 2024, EGU24-1983, https://doi.org/10.5194/egusphere-egu24-1983, 2024.

EGU24-2024 | Orals | AS1.10

Global Snowfall as Revealed by High Resolution Satellite Precipitation Products 

Lisa Milani, Jackson Tan, and George J. Huffman

The Integrated Multi-satellitE Retrievals for GPM (IMERG) product and the Global Precipitation Climatology Project (GPCP) product are two global precipitation datasets that also provide a diagnostic estimate of the probability of precipitation phase, thus enabling a quantification of snowfall rates. With recent improvements to the latest versions of the two algorithms, IMERG V07B and GPCP V3.2 represent a unique opportunity to study the global snowfall rates at an unprecedented resolution.

This presentation examines the distribution of snowfall in IMERG V07B and GPCP V3.2 both globally and regionally. By leveraging IMERG’s high resolution and GPCP’s consistent record, we investigate the climatology not just from a snowfall volume point of view but also from peak snowfall intensity and snow event duration perspectives that only high-resolution data can provide. To assess the reliability of the results, we compare the IMERG and GPCP snowfall against global observations from CloudSat. For example, the comparison revealed deficiencies in passive microwave retrievals of snowfall rates in IMERG over Greenland and Antarctica. Furthermore, we leverage IMERG’s half-hourly resolution to demonstrate its unprecedented potential in tracking snowfall events around the globe.

With the latest advances in the algorithms, IMERG V07 and GPCP V3.2 represent a unique opportunity to study snowfall globally using a combination of fine resolution, complete global coverage, and long record.

How to cite: Milani, L., Tan, J., and Huffman, G. J.: Global Snowfall as Revealed by High Resolution Satellite Precipitation Products, EGU General Assembly 2024, Vienna, Austria, 14–19 Apr 2024, EGU24-2024, https://doi.org/10.5194/egusphere-egu24-2024, 2024.

EGU24-2149 | Orals | AS1.10 | Highlight

Status and Developments in NASA GPM  

George Huffman

The joint U.S.-Japan Global Precipitation Measurement (GPM) mission is approaching a decade of operations, and continues to pursue research, dataset production, and outreach related to precipitation.  Key activities over the last year were the release of an improved “Version 07” of all GPM precipitation and latent heating products, boosting the orbit of the GPM Core Observatory (GPM CO) to 435 km, and improving quality control on precipitation retrievals from the GPM constellation of passive microwave satellites.

This presentation summarizes key improvements to the GPM products and provides some examples of the changes between Versions 06 and 07 in algorithm performance.  One important operational change that affected Version 07 is that the scanning strategy for the Ka-band radar channel changed in May 2018; all products that depend on Ka were revised to accommodate this change.  For example, in Version 07 the Goddard Profiling (GPROF) algorithm has implemented improvements in regions where orographic enhancement and suppression take place and where the surface is snowy/icy, and again covers radiometers reaching back to 1987.  The Combined Radar Radiometer Algorithm (CORRA) now incorporates modified drop-size distribution constraints that substantially reduce bias.  Revisions to the Convective-Stratiform Heating (CSH) algorithm employ new radiative transfer retrievals as well as accounting for terrain in the vertical coordinates.  Each algorithm was adjusted to ensure continuity for each product across the boundary in 2014 between the predecessor Tropical Rainfall Measuring Mission (TRMM) and the GPM CO.  The U.S. Science Team’s Integrated Multi-satellitE Retrievals for GPM (IMERG) was upgraded to account for distortions in the probability density function of regional precipitation rates due to weighted averaging in the Kalman filter used for “morphing” the passive microwave data.

Maintaining the GPM CO orbital altitude in the the current very active solar cycle has been forcing the use of more fuel than planned and consequently shortening the forecasted life of the mission from the early 2030's to the late 2020's.  It was considered vital to regain some of this lifetime to ensure overlap with the upcoming Atmosphere Observing System mission to provide cross-calibration of instruments.  To accomplish this, the orbital altitude was raised from 400 to 435 km on 7-8 November 2023.  Thereafter, the primary GPM CO algorithms had to be revised to account for the change in observing parameters.  By meeting time this action should be complete.

Recently, a screening algorithm based on auto-encoding was developed that uncovered 162 orbits (out of the many thousands of orbits across all years and all satellites) of passive microwave retrievals that had highly anomalous values.  Removing these defective retrievals has improved the integrity of both the GPROF and IMERG records.  However, the nature of the IMERG processing interacted sufficiently badly with the now-discovered anomalous orbits that it was necessary to completely reprocess the IMERG Final Run record, now labeled Version 07B.

The presentation also considers major issues that require continued attention, including the use of machine learning algorithms and the operational challenge of swarms of “small”, perhaps short–lived satellites.

How to cite: Huffman, G.: Status and Developments in NASA GPM , EGU General Assembly 2024, Vienna, Austria, 14–19 Apr 2024, EGU24-2149, https://doi.org/10.5194/egusphere-egu24-2149, 2024.

EGU24-2207 | ECS | Posters on site | AS1.10

Effects of Cloud Seeding on Air Quality and Particulate Matter Dynamics: United States, China, and United Arab Emirates case studies 

Marya Al Homoud, Stephan Macko, and Ashraf Farahat

Space-Borne and ground-based data are used to investigate the environmental effects of cloud seeding on air quality and Particulate Matter (PM2.5 and PM10) dynamics. Seven sites in United States (Texas, Wyoming, California, Idaho, Utah, Nevada, and Montana), two sites in China(Henan and Fujian Gutian), and one site in the United Arab Emirates (Abu Dhabi) are considered for this work. Long-terms statistical analysis of aerosol optical depth (AOD), Ångström exponent(AE), precipitation, and particulate matter is performed. Meanwhile, meteorological data including temperature, humidity, pressure, and wind speed/direction are analyzed. Air quality conditions before, during, and after cloud seeding missions are tested using ground monitoring stations. Data from the Moderate Resolution Imaging Spectroradiometer (MODIS) on board the Terra were also used to perform a statistical correlation between aerosol optical depth (AOD) and ground PM observation. An increase in PM concentration was observed during cloud seeding missions’ period, which indicates a possible effect of silver iodide crystals fired during the missions in increasing the concentration of PM in air. The study found that cloud seeding missions have a possible effect on increasing PM10 compared to PM2.5 concentration, which point to the possible effect of meteorological conditions on washing out silver iodide particles fired during the missions.


How to cite: Al Homoud, M., Macko, S., and Farahat, A.: Effects of Cloud Seeding on Air Quality and Particulate Matter Dynamics: United States, China, and United Arab Emirates case studies, EGU General Assembly 2024, Vienna, Austria, 14–19 Apr 2024, EGU24-2207, https://doi.org/10.5194/egusphere-egu24-2207, 2024.

EGU24-4232 | Posters on site | AS1.10

Early evaluation of effects on Dual-frequency Precipitation Radar observations by the orbit boost of the GPM Core Observatory  

Takuji Kubota, Takeshi Masaki, Gennosuke Kikuchi, Masato Ito, Tomohiko Higashiuwatoko, Kaya Kanemaru, Nobuhiro Takahashi, Kosuke Yamamoto, Kinji Furukawa, and Tomomi Nio

The NASA and the JAXA performed orbit boost maneuvers in November 2023 that raised an altitude of the Global Precipitation Measurement (GPM) Core Observatory from 400 km to 435 km to extend its lifetime. Effects of the orbit boost on the spaceborne precipitation radar have been investigated in the Tropical Rainfall Measuring Mission (TRMM) performed in August 2001. This study evaluates effects on DPR observations due to the GPM orbit boost.

Firstly, spacecraft altitudes of the GPM Core Observatory were analyzed during the period from 13rd October to 17th November 2023. The minimum altitudes were changed from about 400 km to about 435 km by the orbit boost. The averaged altitudes were changed from about 407 km to about 442 km by it. Thus, 407km and 442km were adopted as typical averaged satellite altitudes in pre-boost and the post-boost, respectively.

Spatial resolution at the nadir and swath width is changed at 5.04km×5.04km and 255.8 km at satellite altitude of 407 km to 5.48km×5.48km and 277.9 km at satellite altitude of 442 km, respectively.  Distances between adjacent footprints in the cross-track direction between the pre-boost and the post-boost using observation data and they confirmed that changes of the sampling were larger in the cross-track direction (about 5 km to 5.5 km at the nadir).

It was found that the DPR coverage tendency was changed by the GPM orbit boost. In pre-boost, DPR achieved 100% coverage in 8 days. On the other hand, with post-boost, the coverage was still 99.9834% after 24 days, slightly less than 100%. This coverage trend is expected to change with satellite maneuvers. The maneuver is expected to change the orbit elements, thereby covering all locations.

The sensitivity degradation of the DPR is expected owing to the increase of satellite altitude. Measured radar reflectivity factor (Zm) at storm top height (STH) over the ocean for is used as an indicator of the sensitivity. With analyzing Zm at STH over the ocean, the sensitivity degradation was found for about 0.8-0.9dB for KuPR, and about 0.7-0.9dB for KaPR.

How to cite: Kubota, T., Masaki, T., Kikuchi, G., Ito, M., Higashiuwatoko, T., Kanemaru, K., Takahashi, N., Yamamoto, K., Furukawa, K., and Nio, T.: Early evaluation of effects on Dual-frequency Precipitation Radar observations by the orbit boost of the GPM Core Observatory , EGU General Assembly 2024, Vienna, Austria, 14–19 Apr 2024, EGU24-4232, https://doi.org/10.5194/egusphere-egu24-4232, 2024.

A Multiscale Analysis of a Nocturnal Extreme Rainfall Event of 14 July 2017 in Northeast China


Gaili Wang1, Da-Lin Zhang2,1, and Jisong Sun1

1State Key Laboratory of Severe Weather, Chinese Academy of Meteorological Science, Beijing, China

46 South Street Zhongguancun, Beijing, China 100081

2 Department of Atmospheric and Oceanic Science, University of Maryland, College Park, College Park, Maryland

 Abstract

A multiscale observational analysis of a nocturnal extreme rainfall event that occurred at Changtu in Northeast China on 14 July 2017 is performed using global analysis, automated surface observations, Doppler radar, rawinsonde and disdrometer data. Results show that the large-scale environment was characterized by high convective available potential energy and precipitable water, moderate convective inhibition, and a southwesterly low-level jet (LLJ) capped by an inversion layer. The first and subsequent convective cells developed along a quasi-stationary surface convergence zone in a convection-void region of a previously dissipated meso-a-scale convective line. Continuous convective initiation through backbuilding at the western end and the subsequent merging of eastward-moving convective cells led to the formation of a near-zonally oriented meso-b-scale rainband, with reflectivity exceeding 45 dBZ (i.e., convective core intensity). This quasi-stationary rainband was maintained along the convergence zone by the LLJ of warm-moist air, aided by local topographical lifting and convectively generated outflows. A maximum hourly rainfall amount of 96 mm occurred during 0200-0300 BST as individual convective cores with a melting layer of >55 dBZ reflectivity moved across Changtu with little intermittency. The extreme-rain-producing stage was characterized with near-saturated vertical columns, and rapid number concentration increases of all raindrop sizes. It is concluded that the formation of the meso-b-scale rainband with continuous convective backbuilding, and the subsequent echo-training of convective cores with growing intensity and width as well as significant fallouts of frozen particles accounted for the generation of this extreme rainfall event. This extreme event was enhanced by local topography and the formation of a mesovortex of 20~30 km in diameter.

How to cite: Wang, G.: A Multiscale Analysis of a Nocturnal Extreme Rainfall Event of 14 July 2017 in Northeast China , EGU General Assembly 2024, Vienna, Austria, 14–19 Apr 2024, EGU24-4235, https://doi.org/10.5194/egusphere-egu24-4235, 2024.

EGU24-5053 | Posters on site | AS1.10

Evaluation of detecting algorithm for potential refreezing rain area using the road icing accidents report  

Soohyun Kwon, Jeong-Eun Lee, Seungwoo Lee, and Hee-Jeong Choi

Freezing rain is a meteorological phenomenon in which precipitation melts in the upper atmosphere, transforming into super-cooled droplets near the ground due to lower temperatures. In Northern Europe and North America, strong winter storms often accompany freezing rain, leading to road or facility damage. In Korea, several traffic accident have also occurred due to road icing caused by freezing rain, demanding the development of monitoring technologies for enhanced safety measures. In order to provide the information about the road hazard warning and ensuring safety, we analyzed the atmospheric condition and dual-polarimetric characteristics for road icing and developed the algorithm to detect the potential refreezing rain area by using dual polarization radar and 3-D wet-bulb temperature.
 We selected road icing accidents including precipitation and inversion layer events from 2019 to 2021, and analyzed the changes in surface temperatures and wet-bulb temperatures at surface and the hydrometeor classified using dual-polarization variables at upper layer. The hydrometeor at the accident sites were classified with rain or super-cooled droplet, and wet-bulb temperatures ranged between -2 to 1.5 degrees. This information was used to determine the potential refreezing rain area. The inversion layer was also analyzed by the calculation of 3-dimensional wet-bulb temperatures through multi-quadratic interpolation using various observations (AWS, sounding, Buoy, etc.) and the Korea Local Analysis and Prediction System (KLAPS). The dual-polarization variables were employed to classify the hydrometeor type and investigate the possibility of ice particle melting within the inversion layer. The area for potential refreezing rain was designated as dangerous/cautious zones based on ground temperature conditions when snow particles melted within the inversion layer.
The performance of the algorithm for potential refreezing rain areas was evaluated during cold seasons when incidents of refreezing rain, often referred to as black-ice events occurred. We analyzed the hourly and monthly frequencies of detecting dangerous/cautious zones during traffic accidents caused by refreezing rain.

※ This research was supported by the "Development of radar based severe weather monitoring technology (KMA2021-03121)" of "Development of integrated application technology for Korea weather radar" project funded by the Weather Radar Center, Korea Meteorological Administration.

How to cite: Kwon, S., Lee, J.-E., Lee, S., and Choi, H.-J.: Evaluation of detecting algorithm for potential refreezing rain area using the road icing accidents report , EGU General Assembly 2024, Vienna, Austria, 14–19 Apr 2024, EGU24-5053, https://doi.org/10.5194/egusphere-egu24-5053, 2024.

EGU24-5606 | ECS | Posters on site | AS1.10

Evaluation of precipitation product characteristics over Germany for hydrologic model forecasts 

Suad Hammoudeh, Klaus Goergen, Alexandre Belleflamme, and Stefan Kollet

As a primary component of the Earth’s hydrological cycle, precipitation plays a central role in many environmental processes and human activities. The availability of reliable precipitation data is essential for many sectors and applications, such as water resources management, flood and drought risk analysis, or hydrological modeling. In this study, we evaluate the characteristics of different precipitation datasets based on distinct methodologies and sources. This is in the context of high-resolution hindcasts and prototypical daily forecasts with the integrated hydrological model ParFlow over a central European model domain, where precipitation is a first order driver as part of the atmospheric forcing. Our objective is to determine, how closely precipitation from the ECMWF HRES numerical weather prediction matches in-situ observations, and how HRES compares to other precipitation products, some of which might be suitable for a bias adjustment of the hydrological model inputs. The European Climate Assessment & Dataset (ECA&D) in-situ daily precipitation observation dataset of 5072 stations in our ParFlow model domain serves as the reference. The time span of the comparison is from 2014 to 2022. Aside from ECMWF HRES, the evaluation includes at present data at different spatio-temporal resolutions: The ERA5 reanalysis as a background dataset, the HYRAS interpolated hydrometeorological raster data from the German Weather Service (DWD), the meteorological radar data product OPERA, a European composite dataset from EUMETNET, and the radar data product RADOLAN from DWD. Due to the spatial coverage of some datasets, the analysis is restricted to Germany constituting a subset of the hydrological model domain. The initial part of this evaluation uses only daily data, and precipitation products are compared at station locations. The spatial distribution and temporal variability is assessed with annual and seasonal sums, mean errors, and spatial correlation coefficients. Precipitation intensity is analyzed through the spatial distribution of the typical climate indices. The temporal characteristics of precipitation is determined through the precipitation fraction, i.e., the number of moderately wet days (75th percentile), very wet days (95th percentile), and consecutive wet days. Perkin's skill score is used for the comparison of the empirical distributions. While preliminary results indicate that HRES agrees well with the observational reference data, some form of bias adjustment may still be necessary.

How to cite: Hammoudeh, S., Goergen, K., Belleflamme, A., and Kollet, S.: Evaluation of precipitation product characteristics over Germany for hydrologic model forecasts, EGU General Assembly 2024, Vienna, Austria, 14–19 Apr 2024, EGU24-5606, https://doi.org/10.5194/egusphere-egu24-5606, 2024.

EGU24-6461 | ECS | Orals | AS1.10

ResRadNet: A 3D-Residual Neural Network Approach for Temporal Super-Resolution and Ground Adjustment of Weather Radar Rainfall Estimates 

Julius Polz, Luca Glawion, Hiob Gebisso, Lukas Altenstrasser, Maximilian Graf, Harald Kunstmann, Stefanie Vogl, and Christian Chwala

Weather radars are advanced tools for atmospheric observations that provide QPE with a high spatial representativeness and a high temporal resolution (e.g. 5-minutes). However, due to their indirect measurement aloft, strong systematic errors as well as temporal sampling errors compared to rain gauge measurements at even higher resolution (e.g. 1-minute) persist. As a solution, bias and advection correction techniques are used. Residual neural networks have proven to be efficient tools to approximate the behavior of dynamical systems. Here, we present ResRadNet, a 3D-residual neural network (3D-RNN), that is capable of correcting biases and increasing the temporal resolution of weather radar based quantitative precipitation estimates (QPE). ResRadNet is trained to correctly reproduce 1-minute rain gauge data from sequences of 5-minute radar images and information about the orography. The dataset used in this study consists of 8 years of country-wide rainfall observations in Germany. The weather radar composite used as model input is based on reflectivity derived rainfall information from 17 C-band radars. The rain gauge reference consists of 1066 rain gauges with a 1-minute resolution used to train and test ResRadNet. An additional 1138 rain gauges with a daily resolution are used for long-term evaluation of remaining biases. The results showed that ResRadNet can significantly increase the linear correlation and reduce the root mean squared error of the QPE field compared to rain gauge data at 1- and 5-minute, as well as daily resolutions. A qualitative analysis also showed that ResRadNet is a suitable optical flow estimator and that the provided rainfall fields are not subject to temporal or spatial inconsistencies even though spatio-temporal consistency was not enforced during training. Therefore, our study shows how using 3D-RNNs can provide accurate 1-minute, ground-adjusted, and advection-corrected QPE.

How to cite: Polz, J., Glawion, L., Gebisso, H., Altenstrasser, L., Graf, M., Kunstmann, H., Vogl, S., and Chwala, C.: ResRadNet: A 3D-Residual Neural Network Approach for Temporal Super-Resolution and Ground Adjustment of Weather Radar Rainfall Estimates, EGU General Assembly 2024, Vienna, Austria, 14–19 Apr 2024, EGU24-6461, https://doi.org/10.5194/egusphere-egu24-6461, 2024.

Mountainous Southern California experiences both wet and dry extremes in precipitation. During the wet extremes, shallow landslides and flash flooding are common consequences. These hazardous land surface impacts are typically triggered by short periods of extreme and local precipitation, oftentimes embedded within a larger storm. To characterize the hydrometeorological conditions that result in these impactful events, high-resolution precipitation information is required. In the topographically complex areas of Southern California, existing radars have insufficient coverage due to beam blockage and other issues, while sparse sub-daily rain gauge networks are not able to represent the high spatiotemporal precipitation variability. Coincidentally, this variability is often important in determining the locations where shallow landslides or flash floods are triggered. To this end, this work has developed a set of high-resolution quantitative precipitation estimates (QPEs) by blending information from rain gauges and bias corrected satellite precipitation estimates from U.S. operational precipitation products. The final product is a decadal (2014-2023) record of QPEs with high spatial (4km) and temporal (6-hourly) resolution, calibrated for the region and suitable for use in analyses of mountainous extreme precipitation events and associated hydrologic impacts. Validation of this final dataset is presented, including cross-validation to verify the bias correction efficacy. The final dataset is then used to examine the orographic precipitation variability and extremes. Both the climatological and event-scale orographic variability are examined for the Southern California mountainous regions. At the event-scale, emphasis is placed on understanding the variability for the most extreme precipitation events, which have the highest likelihood of resultant land surface impacts. A rigorous statistical analysis of the precipitation extremes is also presented, including an examination of the dominant patterns of extreme precipitation and several indices to characterize the nature of these extremes. Lastly, the influence of upstream atmospheric precursor conditions (namely, atmospheric instability and boundary layer moisture flux) on the distribution of the most significant extreme precipitation events is explored. As the spatial distribution of extreme precipitation events can impact the locations likely to experience hazardous land surface conditions during a particular storm, this has the potential to provide additional information for enhancement of predictability of these impactful events.

How to cite: De Biasio, E. and Georgakakos, K.: Analysis of extreme high-resolution precipitation based on gauge-corrected satellite observations in mountainous Southern California, EGU General Assembly 2024, Vienna, Austria, 14–19 Apr 2024, EGU24-6570, https://doi.org/10.5194/egusphere-egu24-6570, 2024.

EGU24-6758 | Orals | AS1.10

Precipitation variability in CMIP6 climate models across the North Atlantic–European region 

Eva Plavcova, Ondrej Lhotka, Romana Beranová, and Radan Huth

Long-term changes in climate variability are an important aspect of the climate change with various impacts on society and environment. In contrast to numerous studies which evaluated projected changes in mean values and extremes of precipitation amount, intensity and/or frequency, studies on changes in precipitation variability have been relatively scarce. To understand whether and how the precipitation variability will change in the future, projections of climate models are utilized. However, accurate simulation of this precipitation characteristic by current climate models is pivotal.

In our study we analyze outputs from 13 CMIP6 GCMs across the North Atlantic–European region focusing on winter and summer seasons separately. We classify days with a total precipitation amount exceeding 1 mm as wet days, while the remaining days are considered as dry days. Precipitation probability denote the mean probability of a wet day, and precipitation variability is represented by the tendency to cluster wet/dry days into sequences. To quantify this, we use the persistence parameter defined as the 1-lag autocorrelation of a discrete two-state Markov chain.

Firstly, we evaluate whether precipitation variability is simulated correctly over the historical period (1980–2010) by comparing model outputs against the ERA5 reanalysis. Subsequently, we analyse projected changes in the future period (2070–2100) using simulations forced by two Shared Socio-economic Pathways (SSP585 and SSP245). This allows for a comparison of possible future climate changes under different climate policies.

We identify biases common to all models, notably an overestimated precipitation probability across much of Europe in winter, while its underestimation in summer, and a general tendency of models toward higher autocorrelation of wet/dry days. Projected changes in precipitation characteristics are more pronounced for the more pessimistic SSP585 scenario. We find that the changes in precipitation variability are independent on the changes in precipitation probability. Our findings also indicate that the model biases and simulated changes in precipitation probability and variability can be linked to the biases and changes in synoptic-scale atmospheric circulation.   

How to cite: Plavcova, E., Lhotka, O., Beranová, R., and Huth, R.: Precipitation variability in CMIP6 climate models across the North Atlantic–European region, EGU General Assembly 2024, Vienna, Austria, 14–19 Apr 2024, EGU24-6758, https://doi.org/10.5194/egusphere-egu24-6758, 2024.

Cloud microphysics parameterization has several ice-crystal-related parameters that define the characteristic of ice crystal. Weather Research and Forecasting (WRF) Double-Moment 6-class (WDM6) parameterization scheme adopts the fall velocity-diameter and mass-diameter relationships from Heymsfield and Iaquinta (2000, HI00 hereafter) with the assumed single-bullet shape of ice crystals, and the mean mass-weighted terminal velocity-mixing ratio relationship from Heymsfield and Donner (1990, HD90 hereafter). There are a total five parameters that define ice-crystal characteristics, and these parameters vary according to different shapes of ice crystals, contributing to uncertainties of simulated precipitation. To assess these uncertainties, we generate 50 sampling sets using Latin hypercube sampling within the recommended range from previous studies. Numerical experiments are conducted for two major types of winter precipitation, namely Air-mass Transformation (AT) and Ease-coast Terrain effect (ET) types, over the Korean peninsula. The simulation results indicate that parameters defining the mass-diameter relationship are most sensitive for simulating precipitation in the AT type, while parameters defining the fall velocity-diameter relationship are most sensitive for the ET type. Sensitivity experiments are designed by adjusting the sensitive parameters for each type by ±20% to mitigate biases in surface precipitation observed in the control experiments. In the AT type, the sensitivity experiment simulates more solid-phase precipitable hydrometeors, such as snow and graupel, resulting in increased precipitation over the region with a negative bias. Conversely, in the ET type, the sensitivity experiment reduces the amount of snow and graupel, leading to a decrease in precipitation over the area with a positive bias. Our analysis underscores the high priority of tuning parameters related to ice-crystal characteristics to reduce uncertainty in precipitation simulations, depending on the type of winter precipitation.


Key words: Ice crystal, Uncertainty parameter, WDM6, Winter precipitation


Acknowledgement: This research was supported by Basic Science Research Program through the National Research Foundation of Korea (NRF) funded by the Ministry of Education (RS-2023-00272424) and Korea Meteorological Administration Research and Development Program under Grant (RS-2023-00240346)

How to cite: Kim, K.-B. and Lim, K.-S. S.: Impact of Parameters Related to Ice Crystal on the Simulation of Winter Precipitation over the Korean Peninsula, EGU General Assembly 2024, Vienna, Austria, 14–19 Apr 2024, EGU24-6793, https://doi.org/10.5194/egusphere-egu24-6793, 2024.

EGU24-6976 | ECS | Posters on site | AS1.10

The analysis and evaluation of rainfall events of different durations in the Tibetan Plateau 

Xiaoyan Ling, Yingying Chen, Kun Yang, Xin Li, and Xu Zhou

The Tibetan Plateau, known as the 'Asian Water Tower,' has drawn significant attention to its hydrological cycle and associated atmospheric dynamics. The Qiang-tang Plateau, located in the northern part of the Tibetan Plateau's  endorheic basin (hereinafter referred to as the plateau), experiences notable climate and water cycle variations. The spatial characteristics of its precipitation determine the spatial patterns of hydrological elements and ecological environments in the Qiang-tang Plateau. However, its harsh environment and challenging conditions for station establishment have resulted in a severe scarcity of precipitation observation data. Presently, mainstream reanalysis products consistently overestimate precipitation levels on the plateau and fail to accurately simulate daily precipitation variations. To address this, utilizing data from 206 tipping-bucket rain gauges deployed across the plateau from 2017 to 2020, the study investigates rainfall events of different durations: short-term (1-3 hours), medium-term (4-6 hours), and long-term (7 hours or more).

The research reveals that the precipitation intensity at plateau sites is generally low, with short-term rainfall events being predominant. However, the contribution of short-term rainfall events increases spatially from the southeast edge to the inland of the plateau. Notably, the Qiang-tang Plateau exhibits a significantly higher proportion of short-term precipitation compared to other regions on the plateau. Furthermore, based on a newly established mountainous precipitation transect, it was discovered that as one ascends from the Gangdisi Mountains to the Qiang-tang Plateau, the contribution of short-term rainfall to the total precipitation significantly increases with elevation. Additionally, an analysis of mainstream reanalysis products (ERA5, MERRA2) and high-resolution model simulation data (HAR2) for different duration rainfall events indicates that reanalysis products consistently underestimate the contribution of short-term precipitation while overestimating long-term precipitation. HAR2 outperforms ERA5 specifically in the Qiang-tang Plateau and the northeast part of the plateau, whereas MERRA2 fails to capture the spatial heterogeneity of different duration rainfall events. Although reanalysis products can capture the diurnal peak of short-term precipitation, they tend to prematurely estimate the diurnal peak of long-term precipitation.

How to cite: Ling, X., Chen, Y., Yang, K., Li, X., and Zhou, X.: The analysis and evaluation of rainfall events of different durations in the Tibetan Plateau, EGU General Assembly 2024, Vienna, Austria, 14–19 Apr 2024, EGU24-6976, https://doi.org/10.5194/egusphere-egu24-6976, 2024.

EGU24-7087 | Orals | AS1.10

A Summary and Comparison of the latest GPCP Daily and Monthly Products (Version 3.2) and the Plan Forward 

Ali Behrangi, George J. Huffman, and Robert F. Adler

This presentation is composed of four major parts: (1) a brief overview of the latest Global Precipitation Climatology Project (GPCP) Daily and Monthly products (V3.2) and satellite-gauge input data sets used in them, (2) comparison of the GPCP V3.2 products with the previous version of GPCP Daily (V1.3) and Monthly (V2.3) products and highlighting major changes, (3) assessment of the GPCP V3.2 products over the Oceans using Passive Aquatic Listeners (PALs) and over sea ice using snow depth data from combination of ICESat-2 and Cryosat-2 observations, and (4) a brief description of the plans towards the next generation of the GPCP products. GPCP is a popular combined satellite-gauge precipitation dataset in which the long-term CDR standards of consistency and homogeneity are emphasized, going back to 1983 for GPCP Monthly V3.2. Several major changes occurred in V3.2 including: (1) moving from Monthly 2.5°x2.5° and Daily 1.0°x 1.0° spatial resolution in V2.3 to 0.5°x0.5° for both Daily and Monthly products, (2) addition of more recent satellite data such as the Tropical Rainfall Measuring Mission (TRMM), CloudSat, Global Precipitation Measurement (GPM) mission, and the Gravity Recovery and Climate Experiment (GRACE) mass change observations, and (3) use of new precipitation retrieval and calibration methods. Compared to V2.3, GPCP V3.2 shows about  6.5% increase in global oceanic and about a 4.5% increase in global (land and ocean) precipitation rates with some major changes over the ocean between 40 oS and 60 oS. Similar to V2.3, a near-zero global precipitation trend was observed in V3.2.  However, regional trends, which are substantial, remain generally similar between V2.3 and V3.2. Evaluations over the oceans using PALs showed that GPCP v3.2 substantially outperforms GPCP V2.3 in representing rain occurrence and rain intensity at a daily scale, likely due to the use of IMERG in the daily product of GPCP V3.2. Comparison of the GPCP V3.2 product over sea ice, suggests that GPCP V3.2 generally captures the snowfall accumulation pattern over sea ice, compared to that obtained from the combination of ICESat-2 and Cryosat-2 observations, as well as that from ERA5. However, the products show considerable differences in the amount of snowfall accumulation, with ERA5 often showing the highest values. We will end the presentation by briefly discussing our plans for further improvement of GPCP including higher spatial and temporal resolution, lower latency, and the use of more advanced gauge analysis and precipitation retrieval methods.

How to cite: Behrangi, A., Huffman, G. J., and Adler, R. F.: A Summary and Comparison of the latest GPCP Daily and Monthly Products (Version 3.2) and the Plan Forward, EGU General Assembly 2024, Vienna, Austria, 14–19 Apr 2024, EGU24-7087, https://doi.org/10.5194/egusphere-egu24-7087, 2024.

EGU24-7197 | Posters on site | AS1.10

Deep learning for X-band radar quantitative precipitation estimation using polarimetric measurements 

Ruiyang Zhou, Aofan Gong, Bu Li, Youcun Qi, and Guangheng Ni

Accurate estimation of surface precipitation with high spatial and temporal resolution is crucial for disaster weather detection and decision-making regarding water resources management. Polarimetric weather radar is an important instrument for quantitative precipitation estimation (QPE). Conventional parametric approaches, such as the radar reflectivity (Z) and rain rate (R) relations, cannot fully represent the spatial and temporal variability of clouds and precipitation due to parameterization errors and dependence on raindrop size distribution (DSD). Furthermore, these relations estimate rainfall on a grid-by-grid basis, preventing the incorporation of spatial information into precipitation estimation.

In recent years, machine learning has made rapid advancements in non-linear fitting and feature extracting. Since 2020, multiple studies constructed MLP or CNN-based QPE models that used polarimetric radar observations to retrieve precipitation. These researches have consistently demonstrated that machine learning algorithms perform better than traditional parametric methods in different regions and climatic conditions(Chen & Chandrasekar, 2021; Li et al., 2023; Osborne et al., 2023; Tian et al., 2020; Zhang et al., 2021; Zhou et al., 2023).

The aforementioned studies have highlighted the immense potential of deep learning for radar QPE, but they are based on S-band radar data. Because X-band radar has a shorter wavelength, the electromagnetic scattering characteristics of hydrometeors differ from those of S-band radar, especially for specific differential phase (kdp), which is closely related to rainfall. Furthermore, X-band radars have different spatial resolutions from S-band radars, which indicates that directly applying a model trained with S-band radar data to X-band radar data may introduce biases. Therefore, we develop a CNN-based QPE model using polarimetric measurements from X-band radars and compare its performance against traditional parametric methods. The input data for the CNN model is a matrix with dimensions (6, 9, 9). The matrix is composed of two matrices of size (3, 9, 9), which is the polarimetric measurements from the two lowest scan elevation angles and 9*9 surrounding range gates. This allows the input data to capture the spatial and physical characteristics of the precipitation field. The results reveal that the CNN-based model not only enhances the accuracy of radar QPE with a diminished bias but also provides a more precise depiction of the spatial distribution of precipitation in comparison to conventional methods.

How to cite: Zhou, R., Gong, A., Li, B., Qi, Y., and Ni, G.: Deep learning for X-band radar quantitative precipitation estimation using polarimetric measurements, EGU General Assembly 2024, Vienna, Austria, 14–19 Apr 2024, EGU24-7197, https://doi.org/10.5194/egusphere-egu24-7197, 2024.

EGU24-7336 | Orals | AS1.10

The Precipitation Retrieval and Profiling Scheme for the Special Sensor Microwave Imager/Sounder 

Anja Niedorf, Christopher Kidd, Hannes Konrad, Karsten Fennig, and Marc Schröder

The Special Sensor Microwave Imager/Sounder (SSMIS) of the US Defense Meteorological Satellite Program (DMSP) has been the mainstay of observations used for precipitation retrievals over the last 20 years. The sensor, building upon the heritage of the DMSP Special Sensor Microwave/Imager (SSMI) series that operated between 1987 and 2020, provides precipitation-capable frequencies from 18-183 GHz at resolutions up to 15x13 km. The longevity of the SSMIS and the SSMI satellite series makes these sensors extremely important for the retrieval of precipitation at the climate-scale. The adaptation of the Precipitation Retrieval and Profiling Scheme (PRPS), originally developed for passive microwave sounders, to the SSMIS aims to provide model-free precipitation retrievals that can be incorporated into the Global Interpolated Rainfall Estimation (GIRAFE) product developed by EUMETSATs Satellite Application Facility on Climate Monitoring (CM SAF).

Fundamental to the PRPS is the avoidance of external dynamic data sets, such as model information, to ensure that the retrieval scheme is purely a satellite-based observational product. The scheme relies upon the generation of observational databases, based upon co-temporal and co-located observations made by the satellite sensor(s) and observations of precipitation made by either satellite-based precipitation radar or surface radars. For the PRPS-SSMIS, the databases have been generated using observations from SSMIS sensors on the F16, F17, F18 satellites matched against the precipitation estimates provided by the NASA/JAXA Dual frequency Precipitation Radar (DPR) on the NASA/JAXA Global Precipitation Measurement mission (GPM) core observatory. The orbits of the SSMIS and GPM provide about 20,000 crossing points per satellite between 2016 and 2022, and generate about 30M co-located (<2.5km) and co-temporal (<15mins) entries for the a priori database. The retrieval stage of the PRPS uses this database as a reference against which the satellite observations are made to provide an estimate of the surface precipitation. The PRPS-SSMIS as implemented here, provides instantaneous precipitation estimates across the globe at a spatial resolution of 15x15 km.

This presentation will show some initial results of the scheme which show that the PRPS-SSMIS retrievals are comparable with those generated by NASA’s operational precipitation retrieval scheme, GPROF. At the instantaneous scale the PRPS tends to generate less light precipitation and more heavy precipitation, this can be explained in part by the difference in the resolution of the PRPS-SSMIS (15x15 km) and GPROF-SSMIS (45x74 km). Crucially, the PRPS provide much more information on light precipitation compared with the existing CM SAF SSMIS retrieval scheme (not utilised in the current GIRAFE version because of these detection issues). At the monthly scale, the PRPS generates very similar results to GPROF with all the main precipitation features correctly portrayed.

How to cite: Niedorf, A., Kidd, C., Konrad, H., Fennig, K., and Schröder, M.: The Precipitation Retrieval and Profiling Scheme for the Special Sensor Microwave Imager/Sounder, EGU General Assembly 2024, Vienna, Austria, 14–19 Apr 2024, EGU24-7336, https://doi.org/10.5194/egusphere-egu24-7336, 2024.

EGU24-7551 | Orals | AS1.10

GIRAFE v1: A global precipitation climate data record from satellite data including uncertainty estimates 

Hannes Konrad, Anja Niedorf, Stephan Finkensieper, Rémy Roca, Marc Schröder, Sophie Cloché, Giulia Panegrossi, Paolo Sanò, Christopher Kidd, Rômulo Augusto Jucá Oliveira, Karsten Fennig, Thomas Sikorski, and Rainer Hollmann

We present a new precipitation climate data record (CDR) GIRAFE (Global Interpolated Rainfall Estimation), which has recently been released by EUMETSATs Satellite Application Facility on Climate Monitoring (CM SAF). For now, it covers a time period of 21 years (2002 – 2022) with global coverage and 1° x 1° spatial resolution. GIRAFE is a completely satellite-based dataset obtained by merging infrared (IR) data from geostationary satellites and passive microwave radiometers (PMW) onboard polar-orbiting satellites. Additional to daily sum and monthly mean precipitation rate, a sampling uncertainty on daily scale within the range of geostationary satellites (55°S-55°N) is provided. The implementation of a continuous extension of GIRAFE via a so-called Interim CDR service started and associated data will become available.

For retrieving instantaneous rain rates from PMW observations, three different retrievals for microwave imagers (HOAPS) and sounders (PNPR-CLIM and PRPS) were used. Quantile mapping is applied to the instantaneous rain rates of the 19 different PMW sensors to achieve stability in GIRAFE over time. The IR observations undergo a dedicated quality control procedure. The uncertainty estimation is based on decorrelation ranges from variograms in spatial and temporal dimensions. The merging of PMW and IR data as well as the technique for uncertainty estimation in GIRAFE is based on the Tropical Amount of Precipitation with an Estimate of ERrors (TAPEER) approach.

Here, we present details on the GIRAFE algorithm and uncertainty estimation as well as results of the CM SAF quality assessment activity comprised of comparisons against other established global, regional and local precipitation products.

How to cite: Konrad, H., Niedorf, A., Finkensieper, S., Roca, R., Schröder, M., Cloché, S., Panegrossi, G., Sanò, P., Kidd, C., Jucá Oliveira, R. A., Fennig, K., Sikorski, T., and Hollmann, R.: GIRAFE v1: A global precipitation climate data record from satellite data including uncertainty estimates, EGU General Assembly 2024, Vienna, Austria, 14–19 Apr 2024, EGU24-7551, https://doi.org/10.5194/egusphere-egu24-7551, 2024.

EGU24-7913 | ECS | Orals | AS1.10

Forecast Verification Analysis of the CombiPrecip Ensemble 

Athanasios Ntoumos, Ioannis Sideris, Marco Gabella, Urs Germann, and Alexis Berne

CombiPrecip is a real-time application developed by MeteoSwiss since 2012, which combines point raingauge measurements with radar-derived spatial estimations of precipitation over a vast 710x640km2 domain, extending beyond the Swiss borders. It relies on the geostatistics-based kriging with external drift as an interpolation technique. This method is probabilistic by nature, yielding both a mean value and an associated variance for every estimation. The purpose of our study is two-fold: (i) validate that the variance provided by the underlying geostatistical method of CombiPrecip does properly represent the uncertainty of the CombiPrecip product and (ii) devise a numerical method to build an ensemble of realistic-looking members based on this geostatistical variance. For this, we employ widely used probabilistic verification measures (reliability diagrams, rank histograms, ROC curves) for a large set of cross – validation results over the period 2016 – 2022. In addition, based on established methods developed within the nowcasting community, we produce ensembles of N realistic precipitation members that not only mimic the spatial autocorrelation of the mean-value CombiPrecip but also replicate its pixel-scale variance. Overall, our results indicate that observations fall reasonably well in the uncertainty range provided by the CombiPrecip ensemble.


How to cite: Ntoumos, A., Sideris, I., Gabella, M., Germann, U., and Berne, A.: Forecast Verification Analysis of the CombiPrecip Ensemble, EGU General Assembly 2024, Vienna, Austria, 14–19 Apr 2024, EGU24-7913, https://doi.org/10.5194/egusphere-egu24-7913, 2024.

EGU24-8019 | Posters on site | AS1.10

Regional variation of climatological cloudburst frequency estimated from historical observations of daily precipitation sums 

Torben Schmith, Peter Thejll, Flemming Vejen, and Bo Christiansen

Cloudburst are geographically localized extreme rainfall events where a large amount of rain falls within a few hours. The combination of small spatial scale, short duration and scarceness makes it difficult to reveal any systematic regional differences in occurrence. Here we estimate climatological cloudburst frequencies from the daily precipitation sums for a dense network of 161 historical Danish stations covering the period 1914-2010. We do this using supplementary sub-hourly precipitation observations from a modern network and relate the daily probability of cloudburst occurrence to the corresponding daily precipitation sum using binary regression. This allows a subsequent estimation of the cloudburst frequency from the daily sums from the historical observations. To validate the method, we use stations from the modern network that have been operating for 30 years or longer. For these stations, we demonstrate significant skill by comparing observed and estimated cloudburst frequencies with a jackknife procedure. We then apply the binary regression model using the 161 historical series as input and estimate climatological cloudburst frequencies throughout Denmark. We find large and systematic regional variations across Denmark. The methodology also allows determining temporal changes of cloudburst frequency and we find large differences across Denmark.

How to cite: Schmith, T., Thejll, P., Vejen, F., and Christiansen, B.: Regional variation of climatological cloudburst frequency estimated from historical observations of daily precipitation sums, EGU General Assembly 2024, Vienna, Austria, 14–19 Apr 2024, EGU24-8019, https://doi.org/10.5194/egusphere-egu24-8019, 2024.

EGU24-8111 | Posters on site | AS1.10

Study of the Urban Heat Island effect in Cyprus by using Earth Observation  

Charalambos Soderiades, Kyriacos Tryfonos, Silas Michaelides, Athos Agapiou, and Diofantos Hadjimitsis

Urbanization activities and their effects in Cyprus are more pronounced in the last 35 years, leading to a drastic change of the local climate of Cyprus’ main cities. Indeed, the contrast of energy absorption between developed urban areas and surrounding rural areas results in a variation of the local climate. The monitoring of the Urban Heat Island (UHI) is essential in the effort to produce heat maps of the urban area of Limassol, a town on the south coast of Cyprus. The area affected by UHI must be examined systematically in order to extract information that is vital in assisting decision- and policy-makers to adopt effective mitigation strategies and improve urban planning. This study presents the findings from the literature review of studying the UHI using earth observation, and reports on the results of the UHI effects for the whole Cyprus area, by using Landsat-5/8 TM & Sentinel-3 satellite images. NDVI calculations were conducted to derive the Fraction of Vegetation (FV) and calculate Emissivity over the last 20 years (2003-2023). Urban heat Island determination between several cities in Cyprus is presented in this study.  The results of this study are intended for use by the local authorities in support of the proposed revision of the local plans for the area by proposing a new ‘sustainability index‘ that uses UHI for urban planning purposes.

How to cite: Soderiades, C., Tryfonos, K., Michaelides, S., Agapiou, A., and Hadjimitsis, D.: Study of the Urban Heat Island effect in Cyprus by using Earth Observation , EGU General Assembly 2024, Vienna, Austria, 14–19 Apr 2024, EGU24-8111, https://doi.org/10.5194/egusphere-egu24-8111, 2024.

EGU24-8403 | Orals | AS1.10

High-resolution data products for precipitation monitoring from the WegenerNet 3D Open-Air Laboratory for Climate Change Research 

Andreas Kvas, Jürgen Fuchsberger, Gottfried Kirchengast, Robert Galovic, Daniel Scheidl, Christoph Bichler, and Ulrich Foelsche

The WegenerNet 3D Open-Air Laboratory for Climate Change Research, located in southeastern Austria in an area of about 22 km x 16 km around the city of Feldbach (46.93°N, 15.90°E), provides a unique setup for studying extreme hydrometeorological events such as heavy precipitation, hailstorms, and drought periods. Its 3D upper air instrumentation consists of a polarimetric X-band Doppler weather radar, a microwave radiometer for vertical profiling of temperature, humidity, and cloud liquid water, an infrared cloud structure radiometer, and a water-vapor-mapping GNSS station network. This enables comprehensive upper-air monitoring of precipitation events with high spatial- and temporal resolution in near real-time. These 3D sensors complement the high-density WegenerNet hydrometeorological ground station network, which covers the area by 156 stations measuring precipitation, temperature, humidity, and (at selected locations) wind and soil parameters. This highly synergistic measurement setup enables robust internal cross-evaluation, calibration and quality control for obtaining reliable observations and derived WegenerNet data products. The 3D instrumentation is operational since mid-2021, providing a consistent and growing data record of nearly three years so far.

We present the first release of upper air data cube products derived from the WegenerNet 3D Open-Air Laboratory, aimed at studying (heavy) precipitation events. This includes radar-derived precipitation and hydrometeor classification with 500 m spatial resolution and 2.5 min time resolution at multiple altitude levels, cloud coverage and base height maps with 10 min resolution, vertical profiles of temperature and humidity, atmospheric stability indices with 10 min resolution, and GNSS- and radiometer-derived tropospheric path delays as well as precipitable water vapor with 2.5 min to 10 min resolution. In addition to these Level 2 data products, quality-controlled Level 1 observational data, such as radar reflectivities and differential phase measurements, GNSS tropospheric delays and gradients, and infrared and microwave brightness temperatures are also made available to the scientific community. These data products, and accompanying metadata, are available in the form of user-friendly 3D data cubes accessible through the WegenerNet Data Portal.

How to cite: Kvas, A., Fuchsberger, J., Kirchengast, G., Galovic, R., Scheidl, D., Bichler, C., and Foelsche, U.: High-resolution data products for precipitation monitoring from the WegenerNet 3D Open-Air Laboratory for Climate Change Research, EGU General Assembly 2024, Vienna, Austria, 14–19 Apr 2024, EGU24-8403, https://doi.org/10.5194/egusphere-egu24-8403, 2024.

EGU24-9273 | Orals | AS1.10

Global hydro-climatological indicators and changes in the global hydrological cycle and rainfall patterns 

Andreas Dobler, Cristian Lussana, and Rasmus Benestad

There are only a few climate indicators that describe the state of the global hydrological cycle. In this presentation, we argue that important climate indicators based on global daily precipitation are lacking and propose three new indicators: 1) the daily global precipitation amount, 2) the daily global surface area receiving precipitation, and 3) the global mean daily precipitation intensity. Historically, assessing these indicators is limited by the extent of global observational networks. However, recent advancements in satellite observations and reanalysis data, particularly the ERA5 reanalysis, have enabled better estimations.

We present an analysis of the proposed indicators using ERA5 data and other data sources. We also discuss limitations and biases of the data sources, e.g. ERA5's tendency to overestimate precipitation. Further, a wavelet analysis of spatial characteristics of 24-hour precipitation is conducted, offering insights into the spatial extent and intensity of precipitation systems and their variations over time. To address the question whether long-term changes reflect real changes in Earth's global hydrological cycle due to warming, or may be artefacts from changes in the assimilated (satellite) data in ERA5, we examine an ensemble of CMIP6 simulations under scenarios of increasing greenhouse gas concentration.

Our analysis reveals that ERA5 shows a decrease in the global area of daily precipitation from 43% to 41% between 1950 and 2020. At the same time, the total daily global precipitation amount increased from 1440 Gt to 1510 Gt. The wavelet analysis of ERA5 data indicates that individual precipitation systems have become smaller in spatial extent but more intense over this period, suggesting an accelerated global hydrological cycle with reduced global rainfall area. The CMIP6 simulations show a robust decrease in the precipitation area towards the end of the 21st century in agreement with ERA5. However, compared to the reanalysis the changes are smaller and less rapid.  Nevertheless, our results suggest that in a warming climate the daily precipitation area may shrink, contributing to an increase in the mean daily precipitation intensity.

How to cite: Dobler, A., Lussana, C., and Benestad, R.: Global hydro-climatological indicators and changes in the global hydrological cycle and rainfall patterns, EGU General Assembly 2024, Vienna, Austria, 14–19 Apr 2024, EGU24-9273, https://doi.org/10.5194/egusphere-egu24-9273, 2024.

EGU24-10114 | ECS | Posters on site | AS1.10

Investigation of climatic changes for hailstorms over the Alps using spatiotemporal satellite imagery and self-supervised machine learning 

Paula Bigalke, Claudia Acquistapace, and Daniele Corradini

Severe hailstorms are becoming more frequent in Central Europe showing increasing interannual variability. The Pre-Alpine and Alpine region seems to be especially affected due to its complex terrain, that initiates convection and can intensify many hail favoring processes. This results in increasingly strong large hail events, which are often very local phenomena. Ground-based observations from weather radars are most reliable for detecting hail, however, prove to be challenging in the Alpine region due to interference at mountain ranges.

Passive Microwave satellite observations offer a useful alternative for detecting hail: a probability for hail can directly be derived from Passive Microwave channels with a high spatial coverage. However, this data is only available at certain times during satellite overpasses, thus, capturing only a few of these events. The highest temporal coverage is given by visible, near-infrared and infrared data from MSG. Though not directly sensitive to hail its high spatiotemporal resolution can identify early stages of severe storm developments.

Recently, self-supervised machine learning approaches have been used to classify spatial cloud patterns from satellite measurements from MSG over the Atlantic and Germany. The model learns to sort similar cloud organization patterns into the same classes.

In this work, we aim at adapting this model to also include the temporal component to then classify the evolution of typical cloud patterns leading to severe hailstorms over the Alpine region. The framework will later be used to characterize changes in spatiotemporal evolution of large hail bearing systems and associated environmental conditions across a multi-year dataset. First steps are presented here including the investigation of the optimal training dataset using the available data sources.

How to cite: Bigalke, P., Acquistapace, C., and Corradini, D.: Investigation of climatic changes for hailstorms over the Alps using spatiotemporal satellite imagery and self-supervised machine learning, EGU General Assembly 2024, Vienna, Austria, 14–19 Apr 2024, EGU24-10114, https://doi.org/10.5194/egusphere-egu24-10114, 2024.

EGU24-10338 | ECS | Posters on site | AS1.10

Using commercial microwave links and SEVIRI observations for rainfall estimation in Zambia 

Nico Blettner, Rebecca Wiegels, Harald Kunstmann, and Christian Chwala

In Zambia, like in many African countries, the dedicated rainfall observation network is sparse, whereas accurate information about rainfall is crucially needed. In such a data-poor country, opportunistic sensors like commercial microwave links (CMLs) can be very beneficial. However, the irregular spatial distribution and the fact that many CMLs are very long and operate at low frequencies are common characteristics for rural areas in Africa which make rainfall retrieval with CMLs challenging. In addition, the lack of reference data complicates the adoption and adjustment of existing CML processing methods. In particular, the detection of rain events in noisy CML data, which can have a significant effect on the resulting estimated rainfall amounts, requires special attention as the long low-frequency CMLs provide comparatively noisy data. One option to support CML data processing is the usage of satellite data.

We use level 1.5 data from Meteosat Second Generation (MSG) SEVIRI to generate a precipitation probability (PC) product, similar to the PC products from NWC SAF. Our PC product is generated by a convolutional neural network (CNN) which was trained with SEVIRI and high-resolution radar data in Germany and which was validated with station data in Burkina Faso. We use this PC product to improve the rain event detection during the data processing of almost 1000 CMLs with 15-minute min-max data over several months of the rainy season 2021/2022. In addition, we use two other rain event detection methods, the Python implementation of the nearby-link approach from RAINLINK and the simple rolling standard-deviation method. From the processed CML rainfall estimates, we produce interpolated rainfall maps which we then validate with rain gauge data.

Preliminary results show that the nearby-link and rolling standard-deviation method produce satisfactory results in urban regions where CML density is high and CML frequencies are larger than 10 GHz. The application of the SEVIRI-based PC product for improved CML data processing, in particular for the long low-frequency CMLs, is currently being investigated and we will present first results to analyze its potential and limitations.

How to cite: Blettner, N., Wiegels, R., Kunstmann, H., and Chwala, C.: Using commercial microwave links and SEVIRI observations for rainfall estimation in Zambia, EGU General Assembly 2024, Vienna, Austria, 14–19 Apr 2024, EGU24-10338, https://doi.org/10.5194/egusphere-egu24-10338, 2024.

EGU24-12329 | Posters on site | AS1.10

Precipitation retrievals from the SSMIS using the PRPS scheme: formulation, validation and intercomparison. 

Chris Kidd, Anja Niedorf, Hannes Konrad, Marc Schröder, and Karsten Fennig

The US Department of Defense (DoD) Meteorological Satellite Program (DMSP) has provided a long-term record of passive microwave observations from the Special Sensor Microwave/Imager (SSM/I) and the Special Sensor Microwave Imager/Sounder (SSMIS). These observations, available from 1987 to the present, provide the backbone of data used for global precipitation measurements. The SSM/I and SSMIS instruments have similar lower frequency channels (19.35-85.0 GHz vs 19.35-91.655 GHz), with the SSMIS having higher frequency channels at 150 GHz and three around 183.31 GHz.

The Precipitation Retrieval and Profiling Scheme (PRPS) is a retrieval scheme designed to be efficient and avoid the use of any external dynamic data sets, such as model information. This is particularly important for a truly independent data product that can be used for evaluating model performance. The PRPS was originally designed for use with cross track sounding instruments but has been adapted to other passive microwave sensors: here it has been adapted to utilise the SSMI and SSMIS Fundamental Climate Data Records generated by the EUMETSAT CM SAF. The PRPS-SSMIS relies upon an observational a priori database derived for each sensor paired with a database index file to provide a computationally efficient retrieval scheme.

This poster will present an outline of the PRPS-SSMIS scheme together with the validation and intercomparison of the resulting precipitation products. At present the databases for the retrieval scheme are based upon 7 years of observations (2016-2022) from SSMIS sensors on the F16, F17, F18 DMSP satellites, matched to co-incident and co-temporal measurements of precipitation from the Global Precipitation Measurement (GPM) mission’s Dual frequency Precipitation Radar (DPR). Comparisons are made at a number of scales: ‘climate’ scale comparisons are made against the GPCP v3.2 global precipitation product, through to instantaneous precipitation retrievals which are compared with surface radar over the US and Europe. In addition, comparisons are made with the Ferraro and GPROF precipitation products to assess consistency with other estimates. Overall, the PRPS-SSMIS retrievals tend to underestimate the precipitation, primarily due to the internal assumptions in the retrieval scheme as a result of the skewed distribution of precipitation occurrence and may easily be corrected. Correlations between the PRPS-SSMIS products and the GPCP are similar to those of the GPROF-SSMIS products, particularly when a comparable spatial resolution is used. Both the GPROF and PRPS scheme outperform the Ferraro precipitation product in terms of bias and correlation and are more consistent over time.

How to cite: Kidd, C., Niedorf, A., Konrad, H., Schröder, M., and Fennig, K.: Precipitation retrievals from the SSMIS using the PRPS scheme: formulation, validation and intercomparison., EGU General Assembly 2024, Vienna, Austria, 14–19 Apr 2024, EGU24-12329, https://doi.org/10.5194/egusphere-egu24-12329, 2024.

EGU24-12674 | Posters on site | AS1.10

Cloud radar spectral polarimetry for drop-size-distribution profiling: perspectives and challenges 

Alexander Myagkov, Tatiana Nomokonova, and Michael Frech

Rainfall is a critical component of the Earth's water cycle, influencing global economic stability, access to food and freshwater, and daily life. Rain is also frequently used as a calibration target for various remote-sensing instruments. As such, timely and accurate observations of rainfall are vital for meteorological applications. The microphysical properties of rain are commonly characterized by the drop-size distribution (DSD), which determines the water content, intensity of precipitation, and kinetic energy of the rain.

Conventional methods for measuring DSD include in situ instruments such as optical disdrometers and polarimetric weather radars. Disdrometers measure the size and velocity of raindrops within a narrow laser beam, providing data only at the surface level and having uncertainties due to the limited sampling area. Polarimetric weather radars, on the other hand, can observe rain profiles over larger areas, but typically only capture higher moments of the DSD, which then require specialized retrieval methods to derive DSD properties. Such retrievals are typically based on known size-shape-velocity relations for raindrops and a scattering model. Polarimetric variables are of an especial value because they allow to decouple the contribution of shape, size, and concentration of raindrops to the observations. In addition, the polarimetric variables can be accurately calibrated. The results of retrieval based on the moments are, however, prone to uncertainties related to measurement errors and limited information content of the DSD moments.

Polarimetric Doppler cloud radars, operating at millimeter wavelengths, offer an alternative to traditional methods of the DSD estimation. They can measure the same set of parameters as weather radars but spectrally resolved, i.e. the cloud radar can separately measure droplets coexisting in the same volume but moving with different velocities relative to the radar. Since velocity of droplets is a proxy of their size, spectrally resolved measurements contain much more information about the underlying DSD.

This study explores the potential of polarimetric cloud radars to retrieve DSD profiles. We highlight the advantages of this approach, including the ability of the non-parametric estimation of DSD profiles. We also examine existing challenges, such as the impact of resonance effects on observations due to the comparable wavelength of cloud radars and droplet sizes. These effects require accurate representation in scattering models and size-shape-velocity relationships. Current literature lacks explanations for some observations, indicating a need for further research and development of retrieval methods based on spectral polarimetric cloud radar data.

How to cite: Myagkov, A., Nomokonova, T., and Frech, M.: Cloud radar spectral polarimetry for drop-size-distribution profiling: perspectives and challenges, EGU General Assembly 2024, Vienna, Austria, 14–19 Apr 2024, EGU24-12674, https://doi.org/10.5194/egusphere-egu24-12674, 2024.

EGU24-12890 | ECS | Posters on site | AS1.10

The new real-time radar-gauge-CML adjustment system pyRADMAN at DWD 

Maximilian Graf, Christian Chwala, Malte Wenzel, Christian Vogel, Harald Kunstmann, and Tanja Winterrath

Adjusting weather radar data with ground-based precipitation observations is an established way to overcome radar-specific uncertainties. Most commonly, rain gauge data is used for this task. Commercial microwave links (CMLs) deployed by mobile network operators offer another source of rainfall information that can be used to adjust weather radar data. One of the main advantages of CMLs for this task is the real-time availability of their data with a latency of less than a minute. In addition, their large number, with high densities in particular in urban regions, and the path-averaging nature of their measurements have the potential to improve radar adjustment at short aggregation times.

We developed the Python framework pyRADMAN which is capable of merging weather radar with rain gauge and CML data with selectable temporal aggregations from minutes to hours. The path-averaging nature of the CML data is considered when merging with the gridded radar data. Computational efficiency has been taken into consideration in all implementations allowing a full countrywide radar adjustment for Germany, including the required processing of CML rainfall estimates, within 2 minutes with a pure Python implementation. pyRADMAN has now been continuously operating at DWD in real time since August 2023. Currently, real-time data streams from the gridded weather radar composite (based on 17 radar sites), ~1500 rain gauges, and ~5000 CMLs are handled by pyRADMAN, and products consisting of different combinations of sensors are produced for several aggregation times and latencies. 

We will show the general concept of pyRADMAN and present results from merging radar data with rain gauge and CML data. Our analysis will consist of selected events and monthly statistics. Results will be shown for aggregation times from 5 to 60 minutes and latencies of production from 5 to 20 minutes (increasing the number of available rain gauges for merging with increasing latency).

How to cite: Graf, M., Chwala, C., Wenzel, M., Vogel, C., Kunstmann, H., and Winterrath, T.: The new real-time radar-gauge-CML adjustment system pyRADMAN at DWD, EGU General Assembly 2024, Vienna, Austria, 14–19 Apr 2024, EGU24-12890, https://doi.org/10.5194/egusphere-egu24-12890, 2024.

EGU24-12908 | Orals | AS1.10

Meteorological and Remote Sensing Analysis of the Severe Storm “Daniel” over Greece 

Panagiotis T. Nastos, Elissavet Feloni, Alexandros Paraskevas, and Ioannis T. Matsangouras

Omega blocking, a meteorological phenomenon characterized by a persistent high-pressure system resembling the Greek letter omega (Ω) in the atmosphere, has recently been observed in the Mediterranean region. This atmospheric setup can have significant impacts on the weather patterns in the area, leading to prolonged periods of stable and dry conditions or, conversely, intense storms. One noteworthy instance of this phenomenon occurred with the arrival of Storm “Daniel" in Greece on September 4, 2023. This storm brought about a substantial disruption in the Mediterranean climate, particularly in the Thessaly region, Central Greece. The combination of omega blocking and Storm “Daniel” resulted in exceptionally high levels of precipitation and severe weather conditions, leading to significant flooding and damage in affected areas. The Thessaly region, Central Greece bore the brunt of the storm, experiencing significant flooding that damaged homes, roads, and agricultural areas. This inundation also led to the displacement of residents and posed challenges for local authorities in providing relief and assistance. Additionally, Storm “Daniel” had an economic impact, particularly on agriculture, as crops were damaged or destroyed by the excessive rainfall. Transportation networks were also affected, causing delays and disruptions in the affected areas. Overall, Storm Daniel underscored the need for effective disaster preparedness and response measures in Greece to minimize the impact of such severe weather events in the future and protect the well-being of its residents.

This research paper delves into a thorough examination of the severe Storm "Daniel," which impacted Greece on September 4, 2023, with a particular emphasis on its significant consequences on September 5, 2024. An all-encompassing approach is employed to analyze the storm, including a synoptic assessment, a thorough examination of weather conditions, and the utilization of remote sensing data. The synthesis of synoptic analysis yields insights into the broader atmospheric patterns and dynamics that contributed in the formation and progression of Storm "Daniel". Additionally, the incorporation of remote sensing data provides a distinctive perspective on the storm's characteristics, including its spatial extent, precipitation distribution, and the identification of vulnerable areas. By integrating these three analytical aspects, our aim is to provide a comprehensive overview of Storm “Daniel”, shedding light on its genesis, intensification, and the crucial meteorological factors that contributed to its exceptional precipitation.

Understanding the relationship between omega blocking and the occurrence of storms like “Daniel” in the Mediterranean is crucial for predicting and mitigating the potential impacts of such extreme weather events in the future. This research and analysis can aid in developing more accurate forecasting and early warning systems to protect communities in the region from the adverse effects of these atmospheric phenomena.

How to cite: Nastos, P. T., Feloni, E., Paraskevas, A., and Matsangouras, I. T.: Meteorological and Remote Sensing Analysis of the Severe Storm “Daniel” over Greece, EGU General Assembly 2024, Vienna, Austria, 14–19 Apr 2024, EGU24-12908, https://doi.org/10.5194/egusphere-egu24-12908, 2024.

EGU24-13597 | Orals | AS1.10

Improved Revisit Times of Microwave Observations of Precipitation: Recent Scientific Results from the Temporal Experiment for Storms and Tropical Systems (TEMPEST) Missions 

Steven C. Reising, Christian D. Kummerow, Venkatachalam Chandrasekar, Shannon T. Brown, Chandrasekar Radhakrishnan, Chia-Pang Kuo, and Richard Schulte

Small satellite constellations provide the potential to improve spatiotemporal resolution of microwave observations of precipitation from low-Earth orbit.  Shorter revisit times are essential to improve understanding of the development and evolution of extreme precipitation systems, in turn improving numerical weather prediction and accuracy of parameterization of extreme weather events in global climate models.  To this end, Temporal Experiment for Storms and Tropical Systems (TEMPEST) was proposed in 2013 as a constellation of 6U CubeSats in LEO to provide frequent observations of rapidly developing storms.  TEMPEST-D, the resulting NASA Earth Venture Technology Mission, demonstrated the first global observations from a multi-frequency microwave radiometer on a CubeSat for nearly three years from 2018 to 2021. TEMPEST-D exceeded expectations for scientific data quality, instrument calibration, radiometer stability, and mission duration. TEMPEST-D brightness temperatures were validated using double-difference intercomparison with scientific and operational microwave sensors, including GPM/GMI and four Microwave Humidity Sounders (MHS), operating at similar frequencies to TEMPEST-D channels at 87, 164, 174, 178 and 181 GHz. TEMPEST-D performance was shown to be comparable to or better than much larger operational sensors, in calibration accuracy, precision, stability and instrument noise, during its nearly 3-year mission.

A nearly identical TEMPEST flight spare was produced by JPL alongside TEMPEST-D for risk reduction.  The TEMPEST flight spare was made available to the U.S. Space Force to demonstrate low-cost space technologies for improving global weather forecasting. TEMPEST was then integrated with the Compact Ocean Wind Vector Radiometer (COWVR) produced by NASA/JPL for the U.S. Air Force. COWVR and TEMPEST were launched together as the Space Test Program – Houston 8 (STP-H8) on December 21, 2021, and deployed on the ISS Japanese Experiment for at least 3 years of operations. COWVR and TEMPEST have performed complementary observations of Earth’s oceans and atmosphere from the ISS nearly continuously since January 8, 2022. Atmospheric retrievals of water vapor profiles, clouds, and precipitation from COWVR/TEMPEST-H8 are performed collaboratively by JPL and Colorado State University.

Atmospheric inversion techniques have been developed to retrieve water vapor altitude profiles, as well as single-layer cloud liquid water and cloud ice water, from TEMPEST brightness temperatures, using ECMWF Reanalysis v5 (ERA5) data as an initial guess. These retrievals are enhanced through the inclusion of geostationary infrared data from GOES-16 ABI channels, increasing the number of levels and reducing the error of water vapor retrieval, particularly in the upper troposphere. 

The accuracy and precision of TEMPEST-D brightness temperatures have previously been validated using clear-sky oceanic observations.  Recent studies have extended the validation of both TEMPEST-D and TEMPEST-H8 to include observations of tropical cyclones, hurricanes, and typhoons using GPM-GMI passive microwave brightness temperatures and GPM-DPR active microwave vertical cumulative reflectivity.  These passive/active microwave intercomparisons employ techniques developed for quantitative evaluation of the cross correlation between TEMPEST-D and RainCube observations of tropical cyclones, hurricanes, and typhoons.  Such passive/active microwave observations also provide the basis for the development of surface rain rate estimates and retrieval of the vertical structure of precipitation from combined TEMPEST and DPR observations.

How to cite: Reising, S. C., Kummerow, C. D., Chandrasekar, V., Brown, S. T., Radhakrishnan, C., Kuo, C.-P., and Schulte, R.: Improved Revisit Times of Microwave Observations of Precipitation: Recent Scientific Results from the Temporal Experiment for Storms and Tropical Systems (TEMPEST) Missions, EGU General Assembly 2024, Vienna, Austria, 14–19 Apr 2024, EGU24-13597, https://doi.org/10.5194/egusphere-egu24-13597, 2024.

EGU24-13739 | Orals | AS1.10

THE HYDROMETEOR IDENTIFICATION FOR THE GPM DPR: Version 8 Updates 

Chandra V Chandrasekar, Minda Le, and Ari-Matti Harri

Since May 2018, the Dual-frequency Precipitation Radar (DPR) on board the GPM core observatory satellite has operated in full scan mode. Dual-frequency full swath data provides us a valuable chance to improve our knowledge of precipitation processes by providing greater dynamic range, more detailed information on microphysics, and better accuracies in rainfall and liquid water content retrievals [1]. The DPR Level-2 algorithms consist of several modules including the classification (CSF) module, where precipitation type is classified into three major types: stratiform, convective, and other.  Besides that, estimates of the melting layer top and bottom are provided in the classification module with product name as “binDFRmMLTop”, “binDFRmMLBottom” and the quality metric of “flagMLquality”. Three flags namely, identifiers of falling snow on the ground, graupel or hail along vertical profile termed, “flagSurfaceSnowfall”, “flagGraupelHail” and “flagHail” are recently developed in the DPR level-2 algorithm using a concept of precipitation type index (PTI). All these are currently developed products (version 7) in classification module of GPM DPR level-2 algorithm based on full-swath dual-frequency observations [2][3][4]. 


In near future, a new feature will be added to the version 8 of the GPM DPR level-2 algorithm to provide vertical profile of hydrometeors for full swath data.  A conceptual flow  for initial implementation will be presented. The judgements are made mainly on the DPR products omly to provide an independednt assessment. Mixed phase hydrometeors are judged with melting layer top and bottom together with the 0° isotherm. Flag of surface snowfall is used to identify snow only profile, while flags for detecting graupel and hail help identify range bins with those hydrometeor types. The whole judgement  a robust detection system to not only combine the products but enforce meteorologically meaningful. In the initial phase, five hydrometeor types will be introduced. They are dry snow/ice crystal (DS/ICE), wet snow (WS), graupel (GPL), hail (Hail) and rain (Rain). DS/ICE, GPL and Hail represent low-density, medium-density, high-density particles respectively.  

How to cite: Chandrasekar, C. V., Le, M., and Harri, A.-M.: THE HYDROMETEOR IDENTIFICATION FOR THE GPM DPR: Version 8 Updates, EGU General Assembly 2024, Vienna, Austria, 14–19 Apr 2024, EGU24-13739, https://doi.org/10.5194/egusphere-egu24-13739, 2024.

EGU24-14642 | ECS | Posters on site | AS1.10

Trend analysis of remotely sensed and forecasted precipitation in Iceland 1982-2050 

Iman Rousta, Marjan Dalvi, and Haraldur Olafsson

Precipitation is a major energy resource in Iceland. This study employs the Modern-Era Retrospective analysis for Research and Applications, Version 2 (MERRA-2) dataset to examine how precipitation patterns have evolved across Iceland from 1982 to 2021 and forecast them for the period 2022-2050.  The data confirms the known basic pattern of substantial precipitation in the south, while the northern interior plains are relatively arid.  The maximum precipitation is found in the South-East, but values are lower than suggested by glaciological and runoff data.  There is a non-significant overarching trend in annual precipitation across the country. However, a statistically significant declining trend (R>0.3, p-value=0.05) is observed in the interior regions of the East and Northeast regions. Conversely, a statistically significant increasing trend (R>0.3, p-value=0.05) is detected in coastal areas of these two regions. Future forecasting (2022-2050) suggests a very slight increase in Iceland's annual precipitation (approximately 0.6 mm/year). The findings of this study underline the importance of local scale monitoring of precipitation and comparison of methods of assessment of true ground precipitation.

How to cite: Rousta, I., Dalvi, M., and Olafsson, H.: Trend analysis of remotely sensed and forecasted precipitation in Iceland 1982-2050, EGU General Assembly 2024, Vienna, Austria, 14–19 Apr 2024, EGU24-14642, https://doi.org/10.5194/egusphere-egu24-14642, 2024.

EGU24-14760 | ECS | Posters on site | AS1.10

Remotely sensed assessment of Urmia Lake drying up; Climate change or anthropogenic effects?! 

Marjan Dalvi, Iman Rousta, and Haraldur Olafsson

Urmia Lake is the largest hypersaline lake in Western Asia and it is currently facing severe desiccation. Immediate action is necessary to prevent irreversible damage to the environment and economy. The lake covers the majority of the Urmia Lake watershed. This study aimed to analyze the changes in Land Surface Temperature (LST) during the day and night in the area using MODIS 1 km, 8 days, version 061 (MOD11A2) images. The study also looked at water level variations using TOPEX/POSEIDON and Jason 1, 2, and 3, and precipitation variations using CHIRPS images from the period of 2001-2023. The results indicate that the water level of Urmia Lake has significantly declined by about 10 meters in the last few decades. Approximately 95 percent of the lake has dried up. The continuous declining trend of the water level started in 2001 and has led to an increase in LST day, about 0.03 ℃/year, and a decrease in LST night, about 0.07 ℃/year. Precipitation variations did not show any significant trend during the study period. Due to the high salt content caused by the lake drying up, the area is becoming a center for salty dust that can negatively affect the surrounding habitats. The trend of precipitation variations suggests that climate is not the primary factor responsible for the lake's desiccation.

How to cite: Dalvi, M., Rousta, I., and Olafsson, H.: Remotely sensed assessment of Urmia Lake drying up; Climate change or anthropogenic effects?!, EGU General Assembly 2024, Vienna, Austria, 14–19 Apr 2024, EGU24-14760, https://doi.org/10.5194/egusphere-egu24-14760, 2024.

Cloudbursts over the NWH have become more common in recent years. The uncertainty caused by the sparse density of the station network over NWH encouraged us to employ the developed dataset, Indian Meteorological Ensemble Dataset (IMED), which explicitly accounts for topographical complexity and uncertainties in precipitation estimations. In the NWH, where monitoring stations are sparse, and cloudbursts are hard to discern, this study examines IMED's efficiency in identifying cloudburst events. We aim to use the mean, 70th percentile, 80th percentile, and 99th percentile values from 30 ensembles of IMED data every day with a resolution of 0.25 degrees.  We evaluated 18 events in the NWH between 2014 and 2016, which were documented in different paper publications. Furthermore, we compare the cloudburst identification ability of the CHIRPS dataset to that of the IMED datasets. A pixel-wise analysis shows that IMED performs better than the CHIRPS dataset in this event detection. With the mean value of IMED, it can capture five events, whereas four events are captured by the CHIRPS dataset. With the 70 percentile, 80 percentile, and 99th percentile, IMED can capture more events. This study concludes that IMED performs better than CHIRPS in identifying cloud burst events over the NWH region.

How to cite: Peringiyil, A., Saharia, M., and Op, S.: Assessment of the Indian Meteorological Ensemble Dataset (IMED) Performance in Identifying Cloudburst Events over the Northwest Himalayas (NWH) , EGU General Assembly 2024, Vienna, Austria, 14–19 Apr 2024, EGU24-15910, https://doi.org/10.5194/egusphere-egu24-15910, 2024.

EGU24-16304 | Orals | AS1.10

The WInd VElocity Radar Nephoscope (WIVERN): a candidate mission for the ESA Earth Explorer 11 

Alessandro Battaglia, Anthony Illingworth, Frederic Tridon, Pavlos Kollias, Maximilian Maahn, Cathy Hohenegger, and Filippo Emilio Scarsi

The WIVERN (WInd VElocity Radar Nephoscope, www.wivern.polito.it) concept (Illingworth et al., 2018), is one of the two remaining candidate missions of the ESA Earth Explorer program. The mission is now entering Phase A, which is expected to end in July 2025 with, at the ESA User Consultation Meeting, the final selection of the mission that will be launched in 2032.

WIVERN promises to complement the Aeolus Doppler wind lidar that measures predominantly clear air winds by globally observing, for the first time, the vertical profiles of winds in cloudy areas. The mission will also strengthen the cloud and precipitation observation capability of the Global Observing System by providing unprecedented revisit time of cloud and precipitation vertical profiles.

The mission hinges upon a single instrument, i.e., a dual-polarization Doppler W-band scanning cloud radar with a circular aperture non-deployable main reflector larger than 3 m. The WIVERN antenna conically scans a large swath (of about 800 km) around nadir at an off-nadir angle of about 38o at 12 revolutions per minute. This viewing geometry allows daily revisits poleward of 50°, 20-km horizontal resolution, and approximately 1-km vertical resolution (Battaglia et al., 2022). A key element to achieve Doppler accuracy and large Nyquist folding velocity is the use of closely spaced pulse pairs with polarization diversity (one pulse is H polarised, the other V polarised). In this paper we will discuss the status of the mission including the updated scientific objectives and outline some of the technical challenges of the measuring technique. We will also present examples of Level 2 products with particular focus on the cloud and precipitation products highlighting the benefit of the improved sampling and of the reduced clutter particularly over ocean surfaces compared to nadir-looking radars.

Illingworth, A. J., and Coauthors, 2018: WIVERN: A New Satellite Concept to Provide Global In-Cloud Winds, Precipitation, and Cloud Properties. Bull. Amer. Meteor. Soc., 99, 1669–1687, https://doi.org/10.1175/BAMS-D-16-0047.1. 

Battaglia, A., Martire, P., Caubet, E., Phalippou, L., Stesina, F., Kollias, P., and Illingworth, A.: Observation error analysis for the WInd VElocity Radar Nephoscope W-band Doppler conically scanning spaceborne radar via end-to-end simulations, Atmos. Meas. Tech., 15, 3011–3030, https://doi.org/10.5194/amt-15-3011-2022, 2022.


How to cite: Battaglia, A., Illingworth, A., Tridon, F., Kollias, P., Maahn, M., Hohenegger, C., and Scarsi, F. E.: The WInd VElocity Radar Nephoscope (WIVERN): a candidate mission for the ESA Earth Explorer 11, EGU General Assembly 2024, Vienna, Austria, 14–19 Apr 2024, EGU24-16304, https://doi.org/10.5194/egusphere-egu24-16304, 2024.

EGU24-16514 | Orals | AS1.10

Introducing the path-integrated attenuation as an additional filter in the quality index of spaceborne and ground-based radar calibration bias estimates 

Eleni Loulli, Johannes Bühl, Silas Michaelides, Athanasios Loukas, and Diofantos Hadjimitsis

This study analyses polarimetric weather radar data to explore their potential for comprehensive and reliable precipitation and thus, drought monitoring in Cyprus. For this purpose, we compare reflectivity measurements from the two ground-based X-band dual-polarization radars of the Department of Meteorology of the Republic of Cyprus with measurements obtained from the Dual-Frequency Precipitation Radar (DPR) onboard NASA’s Global Precipitation Measurement (GPM) mission. The comparison considers six years (2017–2023) of observations. It is implemented using the volume-matching method proposed by Schwaller and Morris (2011), as extended by Crisologo et al (2018) to take into account the beam blockage fraction as the basis of a quality index. To further enhance the consistency and precision of the calibration bias, we introduce path-integrated attenuation as an additional filter in the quality index. The path-integrated attenuation of the ground radars is estimated using a forward gate-by-gate attenuation correction method based on an iterative approach with scalable constraints. The level of path-integrated attenuation of the GPM Dual-Frequency Precipitation Radar is evaluated based on the GPM 2AKu variable piaFinal.

Acknowledgements

The authors acknowledge the ‘EXCELSIOR’: ERATOSTHENES: EΧcellence Research Centre for Earth Surveillance and Space-Based Monitoring of the Environment H2020 Widespread Teaming project (www.excelsior2020.eu). The ‘EXCELSIOR’ project has received funding from the European Union’s Horizon 2020 research and innovation programme under Grant Agreement No 857510, from the Government of the Republic of Cyprus through the Directorate General for the European Programmes, Coordination and Development and the Cyprus University of Technology.

The authors also acknowledge the Department of Meteorology of the Republic of Cyprus for providing the X-band radar data.

How to cite: Loulli, E., Bühl, J., Michaelides, S., Loukas, A., and Hadjimitsis, D.: Introducing the path-integrated attenuation as an additional filter in the quality index of spaceborne and ground-based radar calibration bias estimates, EGU General Assembly 2024, Vienna, Austria, 14–19 Apr 2024, EGU24-16514, https://doi.org/10.5194/egusphere-egu24-16514, 2024.

EGU24-17076 | Posters on site | AS1.10

The global CML data collection initiative GCDCI: The solution for scaling up CML rainfall estimation in developing countries? 

Christian Chwala, Remko Uijlenhoet, Aart Overeem, Tanja Winterrath, and Nick van de Giesen

Rainfall estimation from commercial microwave link (CML) attenuation data has matured and is being implemented by several European meteorological services. Individual studies have also confirmed its applicability in developing countries. But data collection and data access remain cumbersome, requiring to start from scratch in each country and in each cooperation with a new mobile network operator (MNO). More often than not the precious CML attenuation data that is produced for monitoring purposes is not stored on a long-term basis and thus is lost forever if no cooperation with researchers or meteorological services incentivizes archiving.

To avoid further loss of data and to allow to better scale up CML data acquisition and data collection across different countries, we propose to start the global CML data collection initiative (GCDCI). The GCDCI will provide containerized templates for the required IT systems for CML data collection, archiving and monitoring, as well as template documents for the required legal agreements. Each MNO will get a separate cloud-based compute and storage infrastructure which they can use to do long-term monitoring and analysis of their network, providing an incentive for them to transfer their data to the GCDCI platform. Potentially, access for third parties, based on trilateral agreements with GCDCI and individual MNOs, could be implemented, e.g. to allow the development of derived products by the private sector. A central compute infrastructure, only accessible by GCDCI staff, will access data from the individual instances of the MNOs and do a centralized CML data processing. Potentially the centralized processing can be combined with real-time satellite data to both enhance the CML data processing as well as the generation of rainfall products from satellite data.

With our poster we want to spark a discussion about this approach and start forming a consortium to put it into operation as a not-for-profit organization with inspirations from initiatives like TAHMO and GPCC.

How to cite: Chwala, C., Uijlenhoet, R., Overeem, A., Winterrath, T., and van de Giesen, N.: The global CML data collection initiative GCDCI: The solution for scaling up CML rainfall estimation in developing countries?, EGU General Assembly 2024, Vienna, Austria, 14–19 Apr 2024, EGU24-17076, https://doi.org/10.5194/egusphere-egu24-17076, 2024.

EGU24-19469 | ECS | Posters on site | AS1.10

Global Performance Assessment of 20+ Precipitation Products Using Radar Data and Gauge Observations 

Xuetong Wang, Hylke Beck, and Raied Alharbi

Accurate precipitation (P) estimates are crucial for a wide range of applications, including water resource management, disaster risk reduction, agricultural planning, and infrastructure development. Over the past few decades, numerous gridded P products have been developed, with varying temporal and spatial resolutions, derived from diverse data sources, and employing different methodologies and algorithms. However, these products frequently exhibit significant uncertainties, errors, and biases, underscoring the importance of selecting the most suitable product for each application. In this study, we conducted a comprehensive evaluation of the strengths and weaknesses of over 20 freely available global gridded P products. We used the European RADar CLIMatology (EURADCLIM) gauge-radar dataset, the US Stage-IV gauge-radar product, and observations from approximately 20,000 global stations as ground truth. Our assessment included several new products, such as PDIR-Now and GPM+SM2RAIN, as well as an experimental Random Forest (RF) model, a potential new version of the Multi-Source Weighted-Ensemble Precipitation (MSWEP) product. For the assessment, we employed a broad range of performance metrics sensitive to various aspects of P time series, including the versatile Kling-Gupta Efficiency (KGE) and its components (correlation, bias, and variability), as well as the Critical Success Index (CSI), wet day bias, peak bias, and trend error. Additionally, we assessed the relative performance in different physiographic regions, seasons, and P regimes, and among various product types (satellite, (re)analysis, gauge, and combinations thereof). The RF model showed the best overall performance, achieving a mean CSI of 0.42. In comparison, the current MSWEP version, CHIRP, ERA5, GSMaP and IMERG achieved mean CSI values of 0.40, 0.21, 0.36, 0.32, and 0.32, respectively. Our study highlights the stark differences in performance among various state-of-the-art P products and provides a baseline for the development of new machine learning-based P products.

How to cite: Wang, X., Beck, H., and Alharbi, R.: Global Performance Assessment of 20+ Precipitation Products Using Radar Data and Gauge Observations, EGU General Assembly 2024, Vienna, Austria, 14–19 Apr 2024, EGU24-19469, https://doi.org/10.5194/egusphere-egu24-19469, 2024.

EGU24-21231 | Orals | AS1.10 | Highlight

Tropical Cyclone and Convective Storm Observations with the NASA TROPICS Constellation Mission 

William Blackwell and the TROPICS Science Team

Four NASA TROPICS Earth Venture (EVI-3) CubeSat constellation satellites were successfully launched into orbit on May 8 and May 25, 2023 (two CubeSats in each of the two launches).  TROPICS is now providing nearly all-weather observations of precipitation horizontal structure, cloud ice, and 3-D temperature and humidity at high temporal resolution to conduct high-value science investigations of tropical cyclones. TROPICS is providing rapid-refresh microwave measurements (median refresh rate of approximately 60 minutes for the baseline mission) over the tropics that can be used to observe the thermodynamics of the troposphere and precipitation structure for storm systems at the mesoscale and synoptic scale over the entire storm lifecycle. Hundreds of high-resolution images of tropical cyclones have been captured thus far by the TROPICS mission, revealing detailed structure of the eyewall and surrounding rain bands.  The new 205-GHz channel in particular (together with a traditional channel near 92 GHz) is providing new information on the inner storm structure, and, coupled with the relatively frequent revisit and low downlink latency, is already informing tropical cyclone analysis at operational centers.

The TROPICS constellation mission comprises four 3U CubeSats (5.4 kg each) in two low-Earth orbital planes inclined at approximately 33 degrees with a 550-km altitude. Each CubeSat comprises a Blue Canyon Technologies bus and a high-performance radiometer payload to provide temperature profiles using seven channels near the 118.75 GHz oxygen absorption line, water vapor profiles using three channels near the 183 GHz water vapor absorption line, imagery in a single channel near 90 GHz for precipitation measurements (when combined with higher resolution water vapor channels), and a single channel at 205 GHz that is more sensitive to precipitation-sized ice particles. TROPICS spatial resolution and measurement sensitivity is comparable with current state-of-the-art observing platforms. Data is downlinked to the ground via the KSAT-Lite ground network with latencies better than one hour. NASA's Earth System Science Pathfinder (ESSP) Program Office approved the separate TROPICS Pathfinder mission, which launched into a sun-synchronous orbit on June 30, 2021, in advance of the TROPICS constellation mission as a technology demonstration and risk reduction effort. The TROPICS Pathfinder mission continues has yielded useful data for 30+ months of operation and has provided an opportunity to checkout and optimize all mission elements prior to the primary constellation mission.

How to cite: Blackwell, W. and the TROPICS Science Team: Tropical Cyclone and Convective Storm Observations with the NASA TROPICS Constellation Mission, EGU General Assembly 2024, Vienna, Austria, 14–19 Apr 2024, EGU24-21231, https://doi.org/10.5194/egusphere-egu24-21231, 2024.

EGU24-21379 | Posters on site | AS1.10

Investigating SST's Role in Seasonal Climate Variations: A WRF Model Analysis in the Tropical Zone, Thailand 

Surapong Lerdrittipong, Jian Zhong, Martin Widmann, Christopher Bradley, and Simon Dixon

The phenomenon of climate change, with its unique alterations in global temperatures and weather trends, presents a mounting obstacle for accurate weather prediction and climate simulation. This study uses the Weather Research and Forecasting (WRF) model to investigate the impact of variations of Sea Surface Temperature (SST) during the rainy season (17 May to 31 Oct 2016). The research aims to quantify the effect of changes in SST (0.5 to 2.0 degrees Celsius) in a climate-sensitive period. Utilising model configured for Thailand's specific geographic and climatic conditions, the study integrates SST data derived from satellite measurements and observations assess temperature, precipitation, and extreme weather events. Our results indicate the pronounced sensitivity of the WRF model to SST variations, with notable discrepancies in predicting rainfall patterns and temperature anomalies. These findings emphasise that SST is a critical factor in climate modelling and the need for accurate SST input in forecasting models, especially in the context of climate change. The study contributes to a better understanding of the WRF model's capabilities and limitations in simulating seasonal climate variations in tropical regions. It may also stress the importance of the governments to engage in effective water and irrigation management strategies, including improved drainage systems and adaptive agricultural practices, to mitigate climate change impacts like flooding and drought. Further research is recommended for other seasons and extended periods for a deeper understanding of the WRF model's performance against evolving climate dynamics.

How to cite: Lerdrittipong, S., Zhong, J., Widmann, M., Bradley, C., and Dixon, S.: Investigating SST's Role in Seasonal Climate Variations: A WRF Model Analysis in the Tropical Zone, Thailand, EGU General Assembly 2024, Vienna, Austria, 14–19 Apr 2024, EGU24-21379, https://doi.org/10.5194/egusphere-egu24-21379, 2024.

EGU24-21680 | Posters virtual | AS1.10

Identification and characterization of hailstorms over France using DPR-GPM sensor 

Laura Rivero Ordaz, Andrés Merino, Andrés Navarro, Francisco Javier Tapiador, José Luis Sánchez, and Eduardo García-Ortega

Severe weather events, particularly hailstorms with large hydrometeors, cause heavy losses worldwide. The south of France is one of the European regions most affected by these hydrometeors and is also one of the most studied because an extensive hailpad network of detection devices that has been in operation there for more than three decades. These direct observations are extremely useful because provide a very complete and reliable "ground truth". Space-based sensors are becoming increasingly important in monitoring hailstorms. Global Precipitation Measurement (GPM) is an international mission designed to advance precipitation measurements from multispectral sensors. The GPM core satellite carries a powerful and unprecedented Dual-Frequency Precipitation Radar (DPR) for studying 3D precipitation characteristics. Furthermore, it improves the accuracy of precipitation estimation and facilitates the analysis of the microphysical structure of clouds. The objective of the present work was to evaluate the DPR sensor capability in identifying hailstorms. Data from more than 1000 hailpads during eight field campaigns in southern France were used. We identified eight hailstorms over France where DPR data were coincident with ground-based observations from hailpad network during 2014–2021. In addition, variables provided by the DPR sensor indicative of hail presence were studied. The Ku band demonstrated greater capacity in identifying hailstorms. Storms with larger reflectivity values (≥50 dBZ, Ku band), both near the surface and throughout the vertical column, were those with a more clearly defined vertical structure and thus more powerful convective development. The intensity of these hailstorms was confirmed with the ground-based data. This work could contribute to enhancing the detection and prediction of hailstorms, thereby helping to mitigate the associated risks.

How to cite: Rivero Ordaz, L., Merino, A., Navarro, A., Tapiador, F. J., Sánchez, J. L., and García-Ortega, E.: Identification and characterization of hailstorms over France using DPR-GPM sensor, EGU General Assembly 2024, Vienna, Austria, 14–19 Apr 2024, EGU24-21680, https://doi.org/10.5194/egusphere-egu24-21680, 2024.

EGU24-1436 | ECS | Posters on site | AS1.11

Response of Snow Cloud Bands to Sea Surface Temperatures over Japan Sea 

Kaito Sato and Masaru Inatsu

The response of snow cloud bands to the increase in sea surface temperatures (SSTs) over the Japan Sea was investigated. We focused on a typical snowfall event in Japan by intense cloud bands around a convergence zone on December 25, 2021. After confirming that a regional atmospheric model fairly reproduced the event, we conducted three sensitivity experiments replacing the initial and boundary values with air temperatures and/or SSTs uniformly increasing by 4 K. The results revealed that the model experiment with higher SSTs or lower air temperatures supplied more evaporation to the planetary boundary layer, which encouraged the higher cloud to along the convergence zone. This dominated the transversal mode (T-mode) of cloud bands in the east of the zone, diagnosed by a newly developed technique that discriminates it from the longitudinal mode (L-mode) by means of the absolute value of horizontal advection of hydrometers. In contrast, the experiment with lower SSTs or higher air temperature exhibited wider areas dominated by the L-mode cloud bands over the Japan Sea.

How to cite: Sato, K. and Inatsu, M.: Response of Snow Cloud Bands to Sea Surface Temperatures over Japan Sea, EGU General Assembly 2024, Vienna, Austria, 14–19 Apr 2024, EGU24-1436, https://doi.org/10.5194/egusphere-egu24-1436, 2024.

EGU24-2859 | ECS | Orals | AS1.11

Importance of Age of Convective Clouds for Explosive Ice Crystal Number Growth via Secondary Ice Production 

Deepak Waman, Sachin Patade, Arti Jadav, Vaughan Phillips, and Corinna Hoose

In many aircraft studies of natural convective clouds (CCs), it has long been observed that at subzero levels warmer than –38oC, the number concentrations of ice particles exceed the number concentration of available active ice nuclei particles (INPs). This suggests that following initial primary ice formation via INP activity at these levels in CCs, there must be some natural mechanisms present to enhance the number concentration of ice crystals, known as secondary ice production (SIP) mechanisms. SIP may form 1) during riming of supercooled cloud droplets between –3 and –8oC (Hallett-Mossop [HM] process), and during 2) fragmentation of freezing raindrops, 3) ice-ice collision, and 4) sublimation of ice particles. However, the relative importance of these SIP processes may differ for differing cloudy conditions.

The present study discusses the importance of the age of the simulated CCs in their lifecycle to determine which SIP process is active. The degree of enhancement in the number concentrations of ice crystals due to SIP activity is defined using the term called ‘ice enhancement’ (IE) ratio. A line of CCs observed during the MC3E campaign in 2011 over Oklahoma, USA was simulated using the WRF-based Aerosol-Cloud (AC) model for a 3D mesoscale domain. AC initiates primary ice by predicting the INP activity of solid aerosol particles such as mineral dust, black carbon, and biological particles. Furthermore, AC forms secondary ice from the SIP processes mentioned above. The simulated microphysical characteristics of the MC3E clouds agree well with the coincident aircraft, ground-based, and satellite observations, with errors of ±30%.

It is predicted that for relatively young developing CCs, with their tops warmer than –15oC, the HM process and raindrop-freezing fragmentation dominate the overall ice enhancement, creating an IE ratio as high as 104. As the cloud goes through its lifecycle, becoming mature, fragmentation in ice-ice collision becomes prolific, forming IE ratios of about 103, both in updraft and downdraft regions. While it is weak (IE ratios < 10) in the updraft regions, fragmentation in sublimation is predicted to create IE ratios of up to about 102.

How to cite: Waman, D., Patade, S., Jadav, A., Phillips, V., and Hoose, C.: Importance of Age of Convective Clouds for Explosive Ice Crystal Number Growth via Secondary Ice Production, EGU General Assembly 2024, Vienna, Austria, 14–19 Apr 2024, EGU24-2859, https://doi.org/10.5194/egusphere-egu24-2859, 2024.

EGU24-4086 | Orals | AS1.11

Advancements in Cold Cloud Physics: Insights from a Decade of Airborne In-Situ Measurements with the PHIPS Instrument  

Emma Järvinen, Martin Schnaiter, Guanglang Xu, and Shawn Wagner

Airborne in-situ measurements provide a valuable opportunity to measure ice cloud properties in their natural atmospheric contexts, significantly contributing to our understanding of complex atmospheric processes. Traditional in-situ measurement techniques, relying on forward scattering, shadowgraphs or holography, have provided valuable insights into cloud particle size information and shape. However, finding answers to unresolved research questions often requires alternative and more advanced measurement technologies.

In this talk, we discuss one of those more advanced airborne instruments, a single-particle cloud imager and nephelometer (PHIPS), and review its first decade of airborne operations. PHIPS was intended to unravel the link between ice crystal microphysics and angular light scattering properties in cirrus clouds on a single particle basis. We demonstrate how the combination of angular scattering function measurements with simultaneous in-situ microscopy can be used to develop new parameterisations of ice cloud single-scattering properties for radiative transfer models. Furthermore, we explore the distinctions between these observational-based parameterisations and conventional parameterisations assuming idealised ice crystal shapes.

The single-particle light scattering function, detected with high enough angular resolution, emerges as a potent tool to distinguish between spherical and aspherical particles. Consequently, such measurements could be used to reliably discriminate hydrometeor phases in mixed-phase clouds. We illustrate how this method provides new insights into the ice formation via secondary ice processes in Southern Ocean boundary layer clouds. Additionally, we present first attempts to evaluate parameterisations for secondary ice processes in numerical models (CAM6 and CM1) based PHIPS observations. 

Our results underscore the necessity of airborne in-situ measurements and more advanced technologies in improving our understanding of fundamental ice cloud physics. This leads to more realistic parameterisations of microphysical processes as well a radiative properties of ice and mixed-phase clouds to be used in future climate and weather predictions. 

How to cite: Järvinen, E., Schnaiter, M., Xu, G., and Wagner, S.: Advancements in Cold Cloud Physics: Insights from a Decade of Airborne In-Situ Measurements with the PHIPS Instrument , EGU General Assembly 2024, Vienna, Austria, 14–19 Apr 2024, EGU24-4086, https://doi.org/10.5194/egusphere-egu24-4086, 2024.

EGU24-4359 | ECS | Orals | AS1.11

The competing effect of aerosols on stratiform mixed-phase clouds 

Diego Villanueva

Due to limited in-situ observations, spaceborne retrievals of cloud top phase are often used to study the behaviour of mixed-phase clouds and their sensitivity to aerosols. By stratifying 35 years of cloud observations by temperature and cloud thickness, we gained valuable insights into the interplay between aerosols and mixed-phase clouds.

First, there is evidence that the ice-to-liquid frequency (ILF) is dominated by two sources of cloud ice: For thin clouds, a cirrus-origin due to ice sedimentation from temperatures colder than -38 dgC, and for thick clouds, a glaciation-origin due to aerosol-driven droplet freezing. These different sources of ice may explain differences in the ILF from different retrieval methods. For example, active instruments, which are more sensitive to thin cirrus, may estimate a higher ILF compared to passive instruments, which are more sensitive to thick clouds.

Second, we find that in extratropical thick mixed-phase clouds, aerosols have two dominant effects on the ILF: For liquid clouds, aerosols increase cloudiness at warm temperatures, but they decrease cloudiness at cold temperatures. Our results suggest that precipitation inhibition (by increasing the number of droplets) and enhanced cloud glaciation (by increasing the rate of droplet freezing at cold temperatures) can explain this behaviour. As a result, we find that the indirect effect of aerosols through mixed-phase clouds is strongly temperature dependent.

Third, at cold temperatures, both dust aerosol and organic aerosols are temporally correlated with higher ILF on a monthly basis. Spatially, this correlation coincides with regions downwind of deserts and highly biologically productive regions in the ocean. We also find that the ILF increases logarithmically with increasing aerosol concentrations, at a rate consistent with the behaviour reported from laboratory studies. Thus, for the first time, we provide a link between laboratory studies of droplet freezing and space-based studies of cloud glaciation.

How to cite: Villanueva, D.: The competing effect of aerosols on stratiform mixed-phase clouds, EGU General Assembly 2024, Vienna, Austria, 14–19 Apr 2024, EGU24-4359, https://doi.org/10.5194/egusphere-egu24-4359, 2024.

Past investigations have shown that gravity waves can affect both when/where cirrus form in the Tropical Tropopause Layer (TTL) and the ice concentrations produced by homogeneous freezing nucleation.  Here, we use high-resolution two-dimensional simulations to investigate the impacts of wind shear and gravity waves on TTL cirrus evolution after the nucleation stage is complete.  We use a bin microphysics model to simulate the physical processes of ice crystal growth/sublimation, advection, and sedimentation.  Gravity wave temperature and wind perturbations are calculated using a Fourier series of wave frequencies with periods ranging from 1 day to near the Brunt Vaisala period, with amplitudes based on aircraft and superpressure balloon measurements.  The simulations are initialized based on high-altitude aircraft measurements of a case just after a homogeneous-freezing ice nucleation event has produced numerous small crystals in a supersaturated environment.  We show that wind shear alone rapidly alters the structure of the cloud, and strong shear can significantly reduce the cloud lifetime.  High-frequency gravity wave temperature oscillations accelerate the reduction of ice concentration as the cloud evolves.  Gravity waves can temporarily increase or decrease cloud optical depth (depending on the initial wave temperature tendencies), but the overall lifetime of the cloud is reduced by the waves.  We will further discuss the relative importance of different wave frequencies on the evolution of TTL cirrus.

How to cite: Jensen, E., Ueyama, R., and Pfister, L.: How do wind shear and gravity waves affect the evolution of optically thin cirrus in the tropical tropopause layer?, EGU General Assembly 2024, Vienna, Austria, 14–19 Apr 2024, EGU24-4453, https://doi.org/10.5194/egusphere-egu24-4453, 2024.

EGU24-5684 | Posters on site | AS1.11

Improved ice cloud phase function for passive remote sensing 

Romain Joseph, Emmanuel Fontaine, and Jérôme Vidot

As part of the NWCSAF (Nowcasting Satellite Application Facility), the CNRM participates in the retrieval of cloud properties from geostationary satellite observations. These retrievals include the Cloud Mask and Cloud Types classification, thermodynamics properties at the macroscopic scales (Cloud Top Temperature and Height) as well as microphysical cloud properties (effective radius, optical thickness, liquid and ice water path). The cloud optical properties (including scattering, absorptions and emissions) are derived from cloud microphysical model in order to perform radiative transfer simulations. In this study, I combine cloud microphysical properties retrieved from DARDAR and in-situ observations with ERA-5 reanalysis to perform radiative transfer simulations with RTTOV. Hence, these simulation are compared with Meteosat Second Generation observations. Our goal is to identify the cloud properties that can affect the difference between observations and simulations in order to propose a new parameterization of the ice cloud scattering phase function in the radiative transfer model RTTOV (Radiative Transfer for TOVS).

How to cite: Joseph, R., Fontaine, E., and Vidot, J.: Improved ice cloud phase function for passive remote sensing, EGU General Assembly 2024, Vienna, Austria, 14–19 Apr 2024, EGU24-5684, https://doi.org/10.5194/egusphere-egu24-5684, 2024.

EGU24-6010 | ECS | Posters on site | AS1.11

Ice crystal images classification using semi-supervised contrastive learning 

Yunpei Chu, Huiying Zhang, Xia Li, and Jan Henneberger

Ice crystals play a crucial role in precipitation formation and radiation budget, with their various shapes influencing these processes differently. The shape of ice crystals is related to the environmental conditions (i.e. temperature) under which the ice crystal forms and the microphysical processes that ice crystal experiences. Therefore, ice crystal shape classification is important for understanding conditions and microphysical processes in cloud. However, current methods are mainly supervised learning algorithms like convolutional neural networks (CNNs), heavily relying on extensive manual labelling, which requires substantial labor. Moreover, the limitations in human’s knowledge of ice crystals and the bias of human subjectivity in classification hinder the generalization ability of these networks. In response to these challenges, we propose a semi-supervised algorithm for ice crystal classification. We use data from the 2019 Ny-Ålesund NASCENT campaign, collected by a holographic imager mounted on the balloon-borne platform HoloBalloon, which includes 18,864 ice crystal images. In our algorithm we initially extract key features from ice crystal images using an unsupervised learning network, prioritizing generalization rather than dependence on labelled data, which ensures unbiased feature identification. Subsequently, a small subset of images is manually labelled into nineteen categories based on a multi-label classification scheme that consider both basic habits and microphysical processes. The classification accuracy of our hybrid algorithm on nineteen categories is similar to the performance supervised learning algorithm. This hybrid algorithm not only reduces the labor needed for manual labelling but also incorporates physics-based constraints, which prevents the network from making unfounded assumptions, thus offering a robust and efficient framework for ice crystal classification.

How to cite: Chu, Y., Zhang, H., Li, X., and Henneberger, J.: Ice crystal images classification using semi-supervised contrastive learning, EGU General Assembly 2024, Vienna, Austria, 14–19 Apr 2024, EGU24-6010, https://doi.org/10.5194/egusphere-egu24-6010, 2024.

The distribution of ice particles strongly affects the microphysical processes in mixed-phase clouds, but the inhomogeneity of ice distribution is not well understood. In this presentation the inhomogeneity and clustering of ice distribution in a stratiform cloud system is quantitatively analyzed using the pair correlation function (PCF) method, based on airborne in-situ measurements from northeast China. The results show that ice clusters on scales of a few kilometers dominate the inhomogeneity of the ice distribution. Due to the cumulative impact of ice clusters on different scales, the probability of finding relative high ice concentration within a lag of 80 m can be enhanced by 0.1 to 3.5 times. On average, the scale of ice cluster is ~100 m for a sampling distance of 1 km, and increases to 3.2 km for a sampling distance of 20 km. It is also found that the ice growth is not fast enough to cluster the ice water content (IWC), and the inhomogeneity of IWC is strongly influenced by ice generation in addition to ice growth in the observed clouds. The results provide potentially important information to improve the parameterizations of microphysics in numerical weather prediction and climate models.

How to cite: Yin, Y., Yang, J., Deng, Y., and Jing, X.: Quantifying the spatial inhomogeneity of ice concentration in mixed-phase stratiform clouds using airborne observations, EGU General Assembly 2024, Vienna, Austria, 14–19 Apr 2024, EGU24-6934, https://doi.org/10.5194/egusphere-egu24-6934, 2024.

EGU24-7185 | ECS | Posters on site | AS1.11

Impact of Prognostic Graupel Density on Simulated Precipitating Convections 

Sun-Young Park, Kyo-Sun Sunny Lim, Kwonil Kim, Gyuwon Lee, and Jason A. Milbrandt

Ice particles in cloud microphysics schemes are traditionally categorized as ice crystals, snow, graupel, and/or hail. Each category is defined by static parameters that determine density, diameter-mass relationship, and diameter-fall speed relationship. Several previous studies have reported considerable sensitivity in simulated precipitation systems based on these fixed parameters. This study introduces a prognostic approach for graupel density in the Weather Research and Forecasting (WRF) Double-Moment 6-class (WDM6) microphysics scheme, based on the work of Milbrandt and Morrison (2013). This allows graupel density to vary from 100 to 900 [kg/m3]. The modified WDM6 is tested for idealized squall line and winter snowfall cases over the Korean Peninsula. In the idealized squall line case, simulation results reveal variant graupel density in time and space, according to the evolution of squall line. For winter snowfall cases, simulations using the modified WDM6 show improved statistical skill scores, such as the root mean square error and bias, compared to the original WDM6, mitigating the positive precipitation bias simulated in the original WDM6. The modified WDM6 increases surface graupel amounts and decreases graupel suspended in the atmosphere due to faster sedimentation of graupel. Therefore, the major microphysical processes that generate graupel are influenced, subsequently reducing surface snow and precipitation over mountainous regions. Importantly, the modified WDM6 adeptly captures the relationship between graupel density and fall velocity, as verified by 2D video disdrometer measurements. *This work was supported by Basic Science Research Program through the National Research Foundation of Korea (NRF) funded by the Ministry of Education (grant no. RS-2023-00272751).

How to cite: Park, S.-Y., Lim, K.-S. S., Kim, K., Lee, G., and Milbrandt, J. A.: Impact of Prognostic Graupel Density on Simulated Precipitating Convections, EGU General Assembly 2024, Vienna, Austria, 14–19 Apr 2024, EGU24-7185, https://doi.org/10.5194/egusphere-egu24-7185, 2024.

EGU24-7194 | ECS | Posters on site | AS1.11

Double-moment approach for snow and graupel in the WDM6 scheme and its effects on simulated precipitation 

Juhee Kwon, Sun-Young Park, Kyo-Sun Sunny Lim, Kwonil Kim, and Gyuwon Lee

The Weather Research and Forecasting (WRF) Double-Moment 6-class (WDM6) microphysics scheme only predicts the number concentrations for CCN and liquid-phase hydrometeors such as cloud water and rain. Although the double-moment approach for the cloud ice is recently introduced in the WDM6 scheme by Park and Lim (2023), the single-moment approach, in which only mixing ratio is prognosed, is still employed for solid-phase precipitating hydrometeors such as snow and graupel. In this study, the double-moment approach is introduced to WDM6 for all hydrometeors by adding prognostic number concentration of snow and graupel. To evaluate the effects of prognostic snow and graupel number concentrations, simulated results between the new and original versions of WDM6 scheme are compared. The four summer-precipitating (cold-type and warm-type; Kim et al. 2019) and seven winter-precipitating convection cases (cold-low type and warm-low type; Ko et al. 2022) are selected to evaluate the new scheme. In comparison to the original WDM6 scheme, the new scheme exhibits increased snow mixing ratio, except for cold-type summer cases. Additionally, the new scheme reduces the graupel mixing ratio and rain number concentration for all cases. In the new scheme, the raindrop size becomes larger due to the reduced rain number concentration, which is more consistent results with the observation data from 2DVD. Furthermore, larger raindrop size in the new scheme makes the evaporation inefficient. Therefore, the new scheme produces more surface precipitation than the original one. Meanwhile, among total 11 cases, the new scheme improves the equitable treat score (ETS) for eight cases and probability of detection (POD) for seven cases.


*This work was supported by the National Research Foundation of Korea (NRF) grant funded by the Korea government. (MSIT) (RS-2023-00208394)

How to cite: Kwon, J., Park, S.-Y., Lim, K.-S. S., Kim, K., and Lee, G.: Double-moment approach for snow and graupel in the WDM6 scheme and its effects on simulated precipitation, EGU General Assembly 2024, Vienna, Austria, 14–19 Apr 2024, EGU24-7194, https://doi.org/10.5194/egusphere-egu24-7194, 2024.

EGU24-7424 | ECS | Orals | AS1.11

Characterizing the influence of riming on the spatial variability of ice water content in mixed-phase clouds using airborne data 

Nina Maherndl, Manuel Moser, Mario Mech, Nils Risse, Aaron Bansemer, and Maximilian Maahn

Observations show that ice water content (IWC) is not distributed homogeneously in mixed-phase clouds (MPC). Instead, high IWC tends to occur in clusters. However, it is not sufficiently understood, which ice crystal formation and growth processes play a dominant role in IWC clustering. Additionally, spatial scales of IWC clusters are not well known. This leads to uncertainties of atmospheric models in representing MPC.

Riming, which occurs when liquid water droplets freeze onto ice crystals, is an important ice crystal growth process. It plays a key role in precipitation formation in MPC by efficiently converting liquid cloud water into ice.

In this study, we analyze the influence of riming on IWC variability  and compare shallow Arctic MPC to mid-latitude winter storms. We use airborne data collected during the HALO-(AC)3 field campaign performed in spring 2022 west of Svalbard, and the IMPACTS field campaign, which took place over the eastern USA (winter 2020, 2022 and 2023). In both campaigns, two aircraft were flying in formation collecting closely spatially collocated and almost simultaneous in situ and remote sensing observations.

We quantify the amount of riming using the normalized rime mass M, which we retrieve from a closure of measured radar reflectivity Ze and measured in situ particle size distributions (PSD). As forward operators in the M retrieval, we use the Passive and Active Microwave radiative TRAnsfer tool (PAMTRA) and empirical relationships of M and particle properties. We calculate IWC from the retrieved M and the measured PSD. In addition, we calculate IWC assuming no riming (M = 0) and perform forward simulations of Ze for the (theoretical) unrimed case. 
Then, we quantify spatial variability of IWC and Ze with and without riming using autocorrelation, pair correlation, and power spectra. Further, we compare shallow Arctic MPC to mid-latitude winter storms and analyze the role of ice particle number concentration and size.

This will lead to a better understanding of the spatial scale and driver of IWC variability and thereby help to improve modeling of MPC.

How to cite: Maherndl, N., Moser, M., Mech, M., Risse, N., Bansemer, A., and Maahn, M.: Characterizing the influence of riming on the spatial variability of ice water content in mixed-phase clouds using airborne data, EGU General Assembly 2024, Vienna, Austria, 14–19 Apr 2024, EGU24-7424, https://doi.org/10.5194/egusphere-egu24-7424, 2024.

EGU24-7679 | ECS | Orals | AS1.11

Microphysical influence on cloud radiative effect during New Mexico deep convective cloud cases 

Declan Finney, Alan Blyth, Paul Field, Martin Daily, Benjamin Murray, and Steven Boeing

Cloud feedbacks associated with anvil cirrus are some of the most uncertain. The Deep Convective Microphysics EXperiment (DCMEX) aims to reduce this uncertainty by improving the representation of microphysical processes in climate models. In support of this aim, we present analysis of the cloud radiative properties from cloud-resolving simulations with the Met Office Unified Model (UM). We apply the Cloud AeroSol Interacting Microphysics (CASIM) module within the UM. 

Overall, the results suggest that an increase in cloud droplet number or ice nucleating particles can increase the reflectivity of anvil cloud. However, the magnitude of these effects shows a dependency on environmental conditions such as wind shear.

Our simulations are based upon a number of case studies from the DCMEX 2022 field campaign held over the Magdalena Mountains in central New Mexico. In the campaign, numerous cases of deep convective cloud formation were observed using the FAAM aircraft, radar,  ground-based aerosol instruments,  and automated cameras. A number of observation-informed, sensitivity simulations have been performed to explore the representation of cloud microphysics within the UM-CASIM model. 

With the model sensitivity simulations we explore the effect of a range of measured microphysical features. The features include: 1) Cloud droplet number concentration, 2) Temperature dependence of heterogeneous freezing, and 3) Secondary ice formation rate from the Hallett-Mossop process.

There is consistently higher outgoing radiation from high cloud, and across the whole domain, in experiments using higher cloud droplet concentration. This aggregate radiative effect manifests from changes in anvil cloud area and reflectivity. Experiments using the ice nucleating particle-temperature relationship derived from DCMEX observations are compared to a simulation using the widely-used Cooper curve. We find an increase in high cloud reflectivity in several cases, but the magnitude of the difference varies from 0-10%, depending on environmental conditions. Overall, the sensitivity experiments vary in all-domain mean outgoing radiation by greater than 10 Wm-2.

Our results offer an important contribution to the understanding of anvil cloud effects on climate through describing the potential effect of small-scale processes on radiation. These microphysical processes are not well represented in climate models. Our finding that their effect depends on environmental conditions encourages a focus on evaluation methods that take this into consideration.

How to cite: Finney, D., Blyth, A., Field, P., Daily, M., Murray, B., and Boeing, S.: Microphysical influence on cloud radiative effect during New Mexico deep convective cloud cases, EGU General Assembly 2024, Vienna, Austria, 14–19 Apr 2024, EGU24-7679, https://doi.org/10.5194/egusphere-egu24-7679, 2024.

EGU24-7972 | Posters on site | AS1.11

Determination of Cirrus Occurrence and Distribution Characteristics Over the Tibetan Plateau Based on the SWOP Campaign 

Zhen Yang, Dan Li, Jiali Luo, Wenshou Tian, Zhixuan Bai, Qian Li, Jinqiang Zhang, Haoyue Wang, Xiangdong Zheng, Holger Vömel, Frand G. Wienhold, Thomas Peter, Dale Hurst, and Jianchun Bian

Balloon sounding with the Compact Optical Backscatter Aerosol Detector (COBALD) and Frost Point hygrometers (FPs) provides in situ data for a better understanding of the vertical distribution of cirrus clouds. In this study, eight summer balloon-borne measurements in Kunming (2012, 2014, 2015, and 2017) and Lhasa (2013, 2016, 2018, and 2020) over the Tibetan Plateau were used to show the distribution characteristics of cirrus clouds. Differences of cirrus occurrence were compared by different indices: the backscatter ratio (BSR) at a 455 nm/940 nm wavelength (BSR455 > 1.2/BSR940 > 2), the color index (CI > 7), and the relative humidity with respect to ice (RHice > 70%). Analysis of the profiles indicated that BSR455 > 1.2 was the optimal criterion to identify the cirrus layer and depict the distribution of the CI and RHice within cirrus clouds. The results showed that the median CI (RHice) within the cirrus clouds at both sites was mostly in the 18–20 (90%–110%) range at pressures below 120 hPa. Furthermore, the balloon-borne measurements combined with Cloud-Aerosol Lidar and Infrared Pathfinder Satellite Observations (CALIPSO) measurements indicated a high frequency of cirrus occurrence near the tropopause in Kunming and Lhasa. The top height of cirrus occurrence at both sites was above the cold point tropopause and the lapse rate tropopause. Both Kunming and Lhasa had the highest frequency of thin cirrus clouds in the 0–0.4 km vertical cirrus thickness range.

How to cite: Yang, Z., Li, D., Luo, J., Tian, W., Bai, Z., Li, Q., Zhang, J., Wang, H., Zheng, X., Vömel, H., Wienhold, F. G., Peter, T., Hurst, D., and Bian, J.: Determination of Cirrus Occurrence and Distribution Characteristics Over the Tibetan Plateau Based on the SWOP Campaign, EGU General Assembly 2024, Vienna, Austria, 14–19 Apr 2024, EGU24-7972, https://doi.org/10.5194/egusphere-egu24-7972, 2024.

EGU24-8065 | ECS | Posters on site | AS1.11

Measuring dynamical properties of atmospheric convection using C2OMODO: a tandem of microwave radiometers 

Thomas Lefebvre, Helene Brogniez, Laura Hermozo, and Frédéric Chevalier

Convective clouds serve as a primary mechanism for the transfer of thermal energy, moisture, and momentum through the troposphere. The lack of understanding of the convective updraft properties and their relationship to environmental factors limit our ability to represent deep convection and its feedbacks in large-scale circulation models. Satellites are the only viable means of efficiently sampling tropical convective clouds, predominantly found in ocean-covered regions.

The C2OMODO Project, proposed by CNES as contribution to the AOS NASA program scheduled for 2029, aims to target the vertical development of deep convective cells. The proposed concept is a tandem of identical microwave radiometers aboard two different satellites in the same orbit, separated by a small-time delay, between 1 and 2 minutes. Each radiometer will measure at 89 GHz, 183 GHz (6 Channels) and 325 GHz (6 Channels), with footprints of 10, 5, and 3 km, respectively. These observations inform about the vertical distribution of ice, thanks to the scattering of radiation (in the line of ICI, STERNA, SAPHIR instruments). The derivative-time measurements of the C2OMODO tandem will provide information on the updraft dynamics of growing convective cells. Furthermore, C2OMODO will contribute to enhance the understanding of the life cycle of convective systems and improve the representation of deep convection in both weather prediction and climate models.

The aim of the presented study is to introduce the inversion method developed to estimate convective mass flux of ice from C2OMODO measurements, based on the variational approach (1D-VAR). Assimilation approaches, based on Bayesian theory, are commonly applied to the inversion of satellite observations. To simulate C2OMODO measurements, the radiative transfer model, RTTOV, serves as the forward operator while the mesoscale model MESO-NH is used as nature-like representation for atmospheric state. Only growing convective cells are selected in this work. The general 1D-VAR approach is adapted to integrate derivative-time measurements, thereby directly incorporating the dynamical properties in the restitution process. In this presentation, we describe the ongoing development of the variational approach. Additionally, the restitution of vertical ice mass flux and the performance of the 1D-VAR be discussed.

The ongoing development of this method has yielded promising preliminary results, instilling optimism about the wealth of information that will be accessible through C2OMODO.

How to cite: Lefebvre, T., Brogniez, H., Hermozo, L., and Chevalier, F.: Measuring dynamical properties of atmospheric convection using C2OMODO: a tandem of microwave radiometers, EGU General Assembly 2024, Vienna, Austria, 14–19 Apr 2024, EGU24-8065, https://doi.org/10.5194/egusphere-egu24-8065, 2024.

EGU24-8070 | ECS | Posters on site | AS1.11

The response of mixed-phase and ice clouds to volcanic eruptions- A model case study of the Raikoke eruption 2019 

Melina Sebisch, Corinna Hoose, Julia Bruckert, and Gholamali Hoshyaripour

Aerosol-cloud-interactions are one of the major causes of uncertainty in the radiative forcing as presented in the IPCC report WG1 (2021). The aerosols in the atmosphere can act as cloud condensation nuclei (CCNs) or ice nucleating particles (INPs) and affect cloud properties. A quantification of the impact of aerosols on these properties is difficult since clouds are also strongly affected by synoptic conditions.

Volcanic eruptions are an ideal testbed as they cause a local perturbance of aerosol concentrations in the atmosphere. The emitted aerosols such as SO2 reacting to sulfuric acid or ash can act as CCNs or INPs respectively. By comparing a simulation with and without the volcanic eruption the impact can be quantified directly. The simulation with an eruption can be validated by comparison to observations, e.g. satellite data.

In the presented work, the eruption of the Raikoke volcano in 2019 is simulated using the ICOsahedral Nonhydrostatic model (ICON) and the module for Aerosols and Reactive Trace gases (ART). The model is run in limited area mode on a R2B10 grid with about 2.5 km horizontal resolution for a time span of 3 days. The volcanic plume is simulated using a setup provided by J. Bruckert. During this time, the plume overlaps with cloud systems associated with a low-pressure system east of the volcano. The simulations with and without the eruption are compared to observational data to improve the implemented interaction mechanisms between cloud particles and volcanic aerosols with a focus on ice nucleation due to volcanic ash particles. Additionally, a new parameterization for volcanic ash formulated by Umo et al. (2021) based on laboratory experiments is implemented and compared to the commonly used ice nucleation parameterizations for mineral dust by e.g. Ullrich et al. (2017). First results of an offline calculation of the ice nucleation active site show a decrease in the ice nucleating efficiency for the parameterization for volcanic ash.

These first results on the interactions between the volcanic ash plume and mixed-phase and ice clouds will be presented.

How to cite: Sebisch, M., Hoose, C., Bruckert, J., and Hoshyaripour, G.: The response of mixed-phase and ice clouds to volcanic eruptions- A model case study of the Raikoke eruption 2019, EGU General Assembly 2024, Vienna, Austria, 14–19 Apr 2024, EGU24-8070, https://doi.org/10.5194/egusphere-egu24-8070, 2024.

EGU24-9194 | ECS | Posters on site | AS1.11

Patterns in dusty cirrus cloud formation mechanisms revealed by LES modeling study 

Kasper Juurikkala, Tomi Raatikainen, and Ari Laaksonen

Dusty cirrus clouds, a rare phenomenon occurring approximately a few times a year globally, are associated with desert dust plumes in the upper troposphere. The formation of these clouds involves a high-humidity layer above a mineral dust-rich layer. In the intermediate layer between these two layers, initially, a thin cirrus cloud forms heterogeneously on the mineral dust particles. The latent heat release caused by the ice nucleation and radiative cooling above the thin cirrus cloud layer cause instability and convection to occur. This convection uplifts mineral dust particles even higher until the humid layer is fully mixed with the mineral dust, resulting in the dusty cirrus covering the humid layer.
The objective of this study is to investigate the formation mechanisms of dusty cirrus clouds. Addressing the challenges highlighted by Seifert et al. (2023), current atmospheric models struggle to predict these events. This work aims to validate the hypothesis presented by Seifert and further advance the understanding of the formation mechanisms. The study involves a simulation study conducted using the UCLALES-SALSA large-eddy model (Tonttila et al., 2017). A case study is performed using the atmospheric conditions present during Saharan dust plumes over Europe in recent years.
The simulated dusty cirrus clouds show that the upward transport of the mineral dust is not as effective as in the regional model study by Seifert et al. (2023). This is because the mineral dust which gets uplifted initially sediments down back to the original mineral dust layer with the sedimenting ice crystals. Also, the predominant mechanism for the instabilization of the air in the initial stages of the cloud formation is the latent heat release caused by the ice nucleation and the growth of the ice crystals, rather than the radiative cooling suggested by Seifert et al. (2023).
In the future, simulations will be conducted using idealized cases to comprehensively understand the most relevant mechanisms involved in the formation of dusty cirrus clouds.

References

Seifert, A., Bachmann, V., Filipitsch, F., Förstner, J., Grams, C. M., Hoshyaripour, G. A., Quinting, J., Rohde, A., Vogel, H., Wagner, A., and Vogel, B. (2023) Aerosol–cloud–radiation interaction during Saharan dust episodes: the dusty cirrus puzzle, Atmos. Chem. Phys., 23, 6409–6430

Tonttila, J., Maalick, Z., Raatikainen, T., Kokkola, H., Kühn, T. and Romakkaniemi, S. (2017).
UCLALES-SALSA v1.0: a large-eddy model with interactive sectional microphysics for aerosol,
clouds and precipitation. Geosci. Model Dev., 10, 169-188

How to cite: Juurikkala, K., Raatikainen, T., and Laaksonen, A.: Patterns in dusty cirrus cloud formation mechanisms revealed by LES modeling study, EGU General Assembly 2024, Vienna, Austria, 14–19 Apr 2024, EGU24-9194, https://doi.org/10.5194/egusphere-egu24-9194, 2024.

EGU24-9345 | Posters virtual | AS1.11

Secondary Ice Processes during a Medicane Evolution 

Georgia Sotiropoulou, Foteini Floka, and Platon Patlakas

The Mediterranean basin is characterized by cyclonic activity that can often lead to adverse weather conditions. Lately, there is an increasing interest to specific types of cyclones, such as medicanes, due to their dynamic characteristics. However, these events can also lead to extreme precipitation, often resulting in flooding and causing severe damage, with potential human casualties. While there is continuous effort to understand the  dynamic evolution of these  systems, little is known about the underlying microphysical processes. Secondary Ice Production (SIP) processes are ice multiplication mechanisms that have been frequently linked to the onset of heavy precipitation and the generation of high concentrations of precipitation particles. In this study we investigate the impact of four SIP mechanisms (rime-splintering, collisional break-up, drop-shattering, sublimation break-up) on the evolution of medicane Qendresa using the Weather and Research Forecasting (WRF) model. Qendresa occurred in 2014 mainly in the vicinity of Italy and Malta, causing three fatalities and at least $250 million in damages in Italy.


How to cite: Sotiropoulou, G., Floka, F., and Patlakas, P.: Secondary Ice Processes during a Medicane Evolution, EGU General Assembly 2024, Vienna, Austria, 14–19 Apr 2024, EGU24-9345, https://doi.org/10.5194/egusphere-egu24-9345, 2024.

EGU24-10252 | ECS | Orals | AS1.11

Cloud thermodynamic phase from spectral and multi-angle polarimetric imaging with specMACS 

Anna Weber, Veronika Pörtge, Tobias Zinner, and Bernhard Mayer

We present a method to retrieve cloud thermodynamic phase from multi-angle polarimetric and spectral imaging. Spectral absorption differences between water and ice in the near infrared are commonly used to discriminate between liquid, mixed, and ice clouds. For example, the spectral slope between 1500 and 1700 nm increases with decreasing liquid cloud fraction. These methods are very sensitive to small amounts of ice in liquid clouds. On the other hand, the polarization signal of clouds shows different features depending on the cloud thermodynamic phase. The cloudbow is formed by single scattering on liquid cloud droplets. Observation of the cloudbow indicates the presence of liquid water while its absence indicates pure ice clouds. In addition the slope of the Q component of the Stokes vector for scattering angles in the range of 60 to 100 degree depends on the partitioning between liquid and ice phase. The polarimetric method is much more sensitive to small amounts of liquid water compared to the spectral method and represents cloud thermodynamic phase at cloud top. In addition, polarization is dominated by single scattering and thus does not suffer from 3D radiative effects.

Both methods are applied to data of the airborne hyperspectral and polarized imaging system specMACS measured during the HALO-(AC)3 campaign. specMACS provides wide-field and high spatial resolution data with a horizontal resolution down to a few 10m. By a combination of the spectral and multi-angle polarimetric observations we will retrieve cloud thermodynamic phase partitioning of single layer mixed-phase clouds and investigate spatial and temporal scales of phase transitions in low-level arctic mixed-phase clouds.

How to cite: Weber, A., Pörtge, V., Zinner, T., and Mayer, B.: Cloud thermodynamic phase from spectral and multi-angle polarimetric imaging with specMACS, EGU General Assembly 2024, Vienna, Austria, 14–19 Apr 2024, EGU24-10252, https://doi.org/10.5194/egusphere-egu24-10252, 2024.

EGU24-10554 | ECS | Posters on site | AS1.11

Fragmentation of atmospheric ice particles due to collision 

Sudha Yadav, Pierre Grzegorczyk, Lilly Metten, Florian Zanger, Subir Kumar Mitra, Alexander Theis, and Miklós Szakáll

Experiments were conducted in the cold room of the wind tunnel laboratory at Johannes Gutenberg University Mainz, encompassing collisions between bare graupel-graupel, bare graupel-ice sphere, bare graupel-graupel with dendrites and bare graupel-snowflake. This study addresses the underrepresented domain of secondary ice processes in clouds, focusing on fragmentation due to ice-ice collisions and their role in augmenting ice particle concentration. For this study, graupels were created using a setup that simulates the natural rotation and tumbling motion of freely falling graupels. The first set of experiments aimed to recreate previous collision experiments by producing more realistic nature-like graupels, while also improving the ice crystal fragment detection and counting process. 2mm and 4mm sized graupels were chosen based on previous observational studies.

This research contributes vital preliminary data, including fragment number and size distribution, as well as their dependency on collision kinetic energy. For this purpose, new coefficients fitted on our experiments following the theoretical framework have also been proposed, which can be used to parameterize the number of fragments resulting from ice-ice collisions. Our study attempts to bridge the gap between laboratory observations and numerical simulations, advancing the accuracy of atmospheric models.

How to cite: Yadav, S., Grzegorczyk, P., Metten, L., Zanger, F., Kumar Mitra, S., Theis, A., and Szakáll, M.: Fragmentation of atmospheric ice particles due to collision, EGU General Assembly 2024, Vienna, Austria, 14–19 Apr 2024, EGU24-10554, https://doi.org/10.5194/egusphere-egu24-10554, 2024.

EGU24-10561 | Orals | AS1.11

Impact of radiation, water vapour and ice clouds on the tropopause region 

Peter Spichtinger and Philipp Reutter

In the tropopause region, the thermal structure is strongly influenced by the interaction of radiation, ice clouds and water vapour. Features as the tropopause inversion layer as well as potentially unstable layers are suspected to be (partly) driven by radiative effects in connection with the frequently occurring large concentrations of water vapour (i.e. supersaturations with respect to ice) and ice clouds. Since there is a high variability of water vapour and ice clouds in terms of microphysical properties and vertical layers, it is still unclear under which conditions clouds and their precursor (i.e. water vapour) lead to a stronger or a weaker stratification, respectively.

In this study we investigate the interaction of radiation and clouds within an idealized framework of a combined cloud-radiation scheme within a vertical column. Using different environmental conditions in terms of water vapour concentrations, ice cloud properties, and thermal stratification we investigate the temporal evolution of the thermodynamic properties of the tropopause region. The results are statistically investigated for characterizing dominant impacts and feedbacks.

How to cite: Spichtinger, P. and Reutter, P.: Impact of radiation, water vapour and ice clouds on the tropopause region, EGU General Assembly 2024, Vienna, Austria, 14–19 Apr 2024, EGU24-10561, https://doi.org/10.5194/egusphere-egu24-10561, 2024.

EGU24-10694 | ECS | Orals | AS1.11

Airborne and ground measurements for vertical profiling of secondary ice production during ice pellet  

Mathieu Lachapelle, Kenny Bala, Cuong Nguyen, Natalia Bliankinshtein, Keyvan Ranjbar, Margaux Girouard, Julie M. Thériault, Justin Minder, David Kingsmill, Jeffrey French, Mengistu Wolde, and Leonid Nichman

Predicting the accurate type of precipitation during winter storms is crucial for the implementation of mitigation measures such as aircraft deicing in commercial aviation or the spreading of salt and abrasives on roads. For this reason, a better understanding of the microphysical processes leading to winter precipitation types is essential. During freezing rain events, secondary ice produced by the freezing of supercooled raindrops via the fragmentation of freezing drops (FFD) process can initiate a chain reaction, potentially transitioning freezing rain into ice pellets. However, including this process in numerical weather prediction models is challenging due to the uncertainty in the efficiency of this mechanism. To bridge this gap, this study aims to evaluate the efficiency of the FFD process during ice pellet precipitation using measurements collected onboard the NRC Convair-580 research aircraft during the WINTRE-MIX field campaign, in February 2022. Specifically, measurements from two missed-approaches conducted in the Saint Lawrence Valley, Quebec, Canada during an ice pellet storm are analyzed. These missed-approaches provide unique datasets collected above, within, and below the ice pellet freezing altitude using in-situ and remote sensing instruments. In the region characterized by completely frozen ice pellets, a bi-modal particle size distribution, indicative of secondary ice production, was measured. Observations from imaging and optical-array probes suggest that particles smaller than 200 µm in diameter were, likely, non-spherical ice crystals, whereas the particle size mode with the larger diameters was associated with ice pellets. The observations of fractured ice pellets and ice pellets with bulges and spicules on most large particles suggested the occurrence of the FFD process. Subsequently, the measured number concentration of small ice particles, which was of the order of 500 L-1, was compared with the number concentration of ice particles simulated through existing parametrizations of secondary ice production. This analysis  will be valuable for selecting the most accurate FFD process parametrization to use for freezing rain and ice pellets simulation. 

How to cite: Lachapelle, M., Bala, K., Nguyen, C., Bliankinshtein, N., Ranjbar, K., Girouard, M., M. Thériault, J., Minder, J., Kingsmill, D., French, J., Wolde, M., and Nichman, L.: Airborne and ground measurements for vertical profiling of secondary ice production during ice pellet , EGU General Assembly 2024, Vienna, Austria, 14–19 Apr 2024, EGU24-10694, https://doi.org/10.5194/egusphere-egu24-10694, 2024.

EGU24-11022 | Posters on site | AS1.11

Sensitivity of Microphysical Properties of Mixed-Phase Clouds on Model Resolution and Microphysics Scheme in ICON 

Corinna Hoose, Deepak Waman, Behrooz Keshtgar, Christian Barthlott, and Gabriella Wallentin

Microphysical processes in the mixed-phase clouds play an important role in modulating the earth’s weather and climate. However, uncertainties in both observational data and model parameterization of microphysical properties (e.g., number concentrations of ice particles) constrains our ability to accurately simulate mixed-phase clouds and their impact with weather and climate models. Model configuration, such as one- or two-moment microphysical schemes, horizontal and vertical resolution of the model can affect the representation of cloud and precipitation processes and cloud radiative effects. For simplicity, many numerical models use 1-moment microphysical scheme to represent clouds. However, this scheme may not represent microphysical and precipitation processes accurately as it only predicts the mass or number mixing ratios of hydrometeors. To address this issue, the present study uses the Icosahedral Non-hydrostatic (ICON) model to assess the sensitivity of model configuration by comparing the predicted microphysical properties with the observations. In ICON, the one-moment microphysical scheme represents mass fractions of five cloud as well as precipitation particles such as: cloud water and ice, snow, graupel, and rain. Furthermore, the two-moment microphysical scheme in predicts both mass and number mixing ratios of hail and the five prognostic variables mentioned above. For the above discussed purpose, a case of observed mixed-phase clouds will be simulated with ICON. The profiles of the simulated cloud microphysical properties will be compared with the coincident aircraft and ground-based observations. Furthermore, various simulations will be performed by varying the vertical as well as horizontal resolution to analyse the changes in model predicted microphysical properties.

How to cite: Hoose, C., Waman, D., Keshtgar, B., Barthlott, C., and Wallentin, G.: Sensitivity of Microphysical Properties of Mixed-Phase Clouds on Model Resolution and Microphysics Scheme in ICON, EGU General Assembly 2024, Vienna, Austria, 14–19 Apr 2024, EGU24-11022, https://doi.org/10.5194/egusphere-egu24-11022, 2024.

EGU24-11218 | Orals | AS1.11

Midlatitude cirrus cloud investigations from ground-based lidar and ERA-5 re-analysis 

Florian Mandija, Dunya Alraddawi, Philippe Keckhut, and Sergey Khaykin

Cirrus as high-altitude clouds are formed at the highest layers of the troposphere, usually at the altitude range 5,000 – 14,000m. Cirrus clouds are composed mainly by asymmetric ice crystals, which are formed during the freezing process of the water vapor at the regions of very low temperature. In global scale, over land, their frequency of occurrence ranges between 28 and 42%, depending on the geographic location and season.

Cirrus clouds are classified with respect to optical thickness into four major classes; thick cloud (τ > 3), opaque cirrostratus (0.3 < τ < 3), transparent or thin cirrus (0.03 < τ < 0.3), and subvisible cirrus (τ < 0.03). Another classification of cirrus comes from their origin; in-situ and liquid origins.

This cloud type plays a key role in the Earth’s radiation budget. In general, cirrus has a net warming effect (21 W/m2), due to the warming LR and cooling caused by SR reflection. However, difficulties to investigate optically very thin cirrus clouds with satellite observations, don’t allow to have the whole picture of the cirrus radiative forcing. Local investigations, engaging  ground-based lidar measurements enable the detection of cirrus clouds of optical depths down to 10-3 and hence a better quantification of the effect of the thin clouds.

In this study, we have investigated the cirrus cloud geometrical properties, during the period 2020 – 2023, based on the nocturnal measurements of the high-resolution Rayleigh/Mie lidar at the  Observatory of Haute Provence (OHP) in France (43.9°N, 5.7°E). The analysed parameters are the top/base/mid- cloud heights, mid-cloud altitude and geometrical thickness .

Coincident meteorological parameters Data, such as  mid-cloud temperature and relative humidity are provided by ERA-5 (climate reanalysis produced by ECMWF).

Clouds are then considered as cirrus based on the following  criterias: In-cloud temperature must be as lower than −25 C,  the Scattering Ratio SR, must be above its average plus three times its standard deviation in the 17–19 km altitude range.

Multivariate analysis combining the principal component analysis and cluster methods are used to classify cirrus cloud with respect of their geometrical properties. Overall results of these analysis indicate three major cirrus cloud classes; mid-troposphere thin cirrus, thick upper-troposphere cirrus and thin-tropopause cirrus. These cirrus classes have different geometrical thickness and mid-cloud altitude. These classes differ also in terms of meteorological parameters, such as relative humidity and In-cloud temperature.

This study is done in the framework of the project CONTRAILS funded by MEFR/BPI France under the contract number DOS0182436/00. 

How to cite: Mandija, F., Alraddawi, D., Keckhut, P., and Khaykin, S.: Midlatitude cirrus cloud investigations from ground-based lidar and ERA-5 re-analysis, EGU General Assembly 2024, Vienna, Austria, 14–19 Apr 2024, EGU24-11218, https://doi.org/10.5194/egusphere-egu24-11218, 2024.

EGU24-11933 | Orals | AS1.11

IceCloudNet: 3D reconstruction of cloud ice from Meteosat SEVIRI input 

Kai Jeggle, Mikolaj Czerkawski, Federico Serva, Bertrand Le Saux, David Neubauer, and Ulrike Lohmann

Remote sensing observations of cloud ice in cirrus and mixed-phase clouds have been playing a crucial role in advancing our understanding of cloud processes and validating climate models. On the one hand, many studies have used polar-orbiting active satellite instruments like CALIPSO’s lidar and CloudSat’s radar to analyze microphysical properties of ice clouds. These instruments are able to provide a vertical profile of cloud structures and thus allow a detailed view on cloud microphysical properties. But, due to their long revisiting times it is impossible to study the evolution of individual clouds. On the other hand, passive geostationary satellite instruments such as SEVIRI onboard the Meteosat satellites retrieve every 15 minutes a top-down view of Earth’s surface by measuring intensities of the reflected solar radiation and terrestrial infrared radiation but only in 2D.

IceCloudNet is a novel machine learning model that fuses the benefits of passive geostationary and polar-orbiting active satellite instruments to create a new vertically resolved (3D) data set of cloud ice in cirrus and mixed-phase clouds with high spatio-temporal coverage and resolution. To this end, we train IceCloudNet to predict the vertical structure of cloud ice from SEVIRI input data and co-located vertically resolved cloud ice retrievals from DARDAR as target data. Despite being only supervised with sparsely available DARDAR reference data, IceCloudNet shows good performance in predicting complex cloud structures including multi-layer clouds, when tested on independent validation data. The new data set created by IceCloudNet will enable the scientific community to conduct novel research on ice cloud formation and improve the understanding of microphysical processes by tracking and studying cloud properties through time and space.

How to cite: Jeggle, K., Czerkawski, M., Serva, F., Le Saux, B., Neubauer, D., and Lohmann, U.: IceCloudNet: 3D reconstruction of cloud ice from Meteosat SEVIRI input, EGU General Assembly 2024, Vienna, Austria, 14–19 Apr 2024, EGU24-11933, https://doi.org/10.5194/egusphere-egu24-11933, 2024.

EGU24-12059 | ECS | Orals | AS1.11

Exploring ice cloud formation mechanisms through satellite observations and integrated Lagrangian transport with microphysical models 

Athulya Saiprakash, Martina Krämer, Patrick Konjari, Christian Rolf, Jérôme Riedi, and Odran Sourdeval

Understanding the formation mechanisms of ice clouds has been hindered by the complexity of their composition and the diversity of their growth processes. Previously, observational constraints have been limited, leading to substantial gaps in our comprehension and representation of ice clouds. Satellite measurements face a significant challenge due to the lack of essential environmental context information, that is necessary to identify and understand the cloud's formation mechanism and evolution. Indeed, these representations only capture a snapshot of the state of a cloud and its microphysical properties at a given time. This study addresses this limitation by providing additional metrics on ice cloud history and origin along with operational satellite products.

Here, we present a novel framework that combines satellite observations with Lagrangian transport and ice microphysical models, to obtain information on the history and origin of air parcels that contributed to their formation. The air mass transport model CLaMS (Chemical LAgrangian Model of the Stratosphere) was employed to track the trajectory of air parcels along the DARDAR-Nice track. CLaMS-Ice model is jointly used to simulate cirrus clouds along trajectories derived by CLaMS. This approach provides information on the cloud regime as well as the ice formation (in-situ vs liquid origin) pathway. Our findings, derived from case studies involving multiple cloud types, present a realistic representation of these complex processes. We explore the sensitivity of our methodology to initial conditions and thresholds. Additionally, a statistical analysis examines how satellite cloud microphysics are sensitive to CLaMS-Ice metrics. This comprehensive approach advances our understanding of ice cloud processes and helps to refine satellite-based representations of these atmospheric phenomena.


How to cite: Saiprakash, A., Krämer, M., Konjari, P., Rolf, C., Riedi, J., and Sourdeval, O.: Exploring ice cloud formation mechanisms through satellite observations and integrated Lagrangian transport with microphysical models, EGU General Assembly 2024, Vienna, Austria, 14–19 Apr 2024, EGU24-12059, https://doi.org/10.5194/egusphere-egu24-12059, 2024.

EGU24-12253 | ECS | Posters on site | AS1.11

Scattering properties generated from real shaped ice crystals and snowflakes for ICON’s Radar Forward Operator EMVORADO 

Soumi Dutta, Davide Ori, Jana Mendrok, and Ulrich Blahak

Radar Forward Operators (RFO) act as an important link between the physical properties of cloud and precipitation and the observed radar quantities. A major source of uncertainty in radar forward operators is identified in the scattering properties of frozen and mixed-phase hydrometeors. Appropriate modeling of the internal structures of complex-shaped hydrometeors plays a pivotal role in the simulation of their polarimetric scattering properties. When RFOs are applied to weather model output, it is also desirable to ensure the consistency between the properties of hydrometeors assumed in the weather model and those implemented in the scattering simulations. Failing to do so, would impede a correct interpretation of model-observation comparison studies. The present study aims to model the microphysical and scattering properties of realistic ice crystals and snowflakes using the snow particle aggregation and DDA scattering models. The aggregation model includes realistic monomer generators for various ice crystal shapes. The simulated scattering properties are implemented into the EMVORADO RFO of the ICON model. Simulated properties are primarily kept consistent with the ICON microphysical assumptions. The shapes of snowflakes and ice crystals (dendrites and plates) are generated from the aggregation model, and used as input to the DDA scattering model to compute multi-frequency polarimetric radar scattering properties. The derived scattering properties are expected to explain better the observed polarimetric radar signatures of ice crystals and snow aggregates. Nonetheless, when simulating the snowflake shapes, one must make some decisions regarding its monomer composition. This study also explores the use of the innovative Lagrangian-particle cloud model McSnow in combination with the snowflake aggregation simulator. McSnow is able to simulate the snowflake evolution based on the physical and thermodynamic profiles of clouds and thus informs the aggregation model about the snowflake composition in terms of monomer shapes, size, and number. The synergy of these models is expected to elucidate the link between ice cloud processes and the polarimetric properties of cold clouds.

How to cite: Dutta, S., Ori, D., Mendrok, J., and Blahak, U.: Scattering properties generated from real shaped ice crystals and snowflakes for ICON’s Radar Forward Operator EMVORADO, EGU General Assembly 2024, Vienna, Austria, 14–19 Apr 2024, EGU24-12253, https://doi.org/10.5194/egusphere-egu24-12253, 2024.

EGU24-13078 | ECS | Posters on site | AS1.11

Temporal and Spatial Patterns of Ice Supersaturation: A 3D climatology over the North Atlantic Region 

Nils Brast, Yun Li, Susanne Rohs, Patrick Konjari, Christian Rolf, Martina Krämer, Andreas Petzold, Peter Spichtinger, and Philipp Reutter

As the most important greenhouse gas in the Earth's atmosphere, the presence of water vapor in the upper troposphere and lower stratosphere (UTLS) is essential for influencing global radiation patterns and surface climate conditions. Even minor changes in water vapor levels within the mostly dry lower stratosphere (LS) can impact the vertical water vapor gradient, making it a crucial factor in the decadal variability of surface temperature.
In condensed form, water holds significant importance for planetary radiation. Clouds play a dual role by reflecting incoming solar radiation into space and absorbing/emitting longwave radiation from the surface. Estimating the impact of cirrus clouds on the radiation budget is particularly challenging as it depends on a variety of factors, such as altitude, humidity and the microphysical properties of the cloud.
During the lifetime of a cirrus cloud, the radiative impact can even change from a warming to a cooling effect and vice versa. For the formation of cirrus clouds, ice supersaturated regions (ISSRs) play an important role. However, the required amount of supersaturation is dependent on the nucleation mechanism, with at least ∼ 45% supersaturation for homogeneous freezing and as low as ∼ 20% for heterogeneous freezing.
We present a statistical intercomparison of the In-service Aircraft for a Global Observing System (IAGOS) dataset with ERA5, the latest reanalysis product of the European Centre for Medium-Range Weather Forecasts (ECMWF). Furthermore, a machine learning based algorithm is developed to improve the accordance of relative humidity with respect to ice (RHi) of reanalysis data with in-situ measurements, enabling large scale analyses of water vapor in the UTLS region. 
With this tool, we build three-dimensional climatologies of RHi and ISSRs over the North Atlantic region and show their seasonal and regional variability. This will help foster a general understanding of the occurence of cirrus clouds and their impact on weather and climate.

How to cite: Brast, N., Li, Y., Rohs, S., Konjari, P., Rolf, C., Krämer, M., Petzold, A., Spichtinger, P., and Reutter, P.: Temporal and Spatial Patterns of Ice Supersaturation: A 3D climatology over the North Atlantic Region, EGU General Assembly 2024, Vienna, Austria, 14–19 Apr 2024, EGU24-13078, https://doi.org/10.5194/egusphere-egu24-13078, 2024.

Large cirrus outflows detrained from deep convection play a vital role in modulating the radiative balance of the Earth’s atmosphere. The total cloud radiative effect (CRE) in the tropics is close to zero due to a cancellation between a large shortwave (SW) cooling from optically thick clouds and a longwave (LW) warming from high-altitude thin cirrus that spread over much of the tropics. Any small percentage changes to the LW or SW components of these large detrained cirrus in a future climate could, therefore, have significant impacts on the overall CRE in the tropics.

A crucial question is how the lifetime of these detrained cirrus impacts the total cloud radiative effects in the tropics. Characterising the detrained cirrus outflows, how they evolve over time, and how they might change in a future climate is vital in order to understand their role in the climate system and to constrain past and future climate change.

Building on the ‘Time Since Convection’ product used in Horner & Gryspeerdt (2023), this work investigates how the initial conditions of deep convection influence the radiative evolution and lifetime of the detrained cirrus. If we extend the lifetime of detrained cirrus, how does this change their total radiative effect and the radiative balance in the tropics? To answer this question, data from the DARDAR, ISCCP, and CERES products are used to build a composite picture of the radiative and microphysical properties of the clouds, which are investigated under varying initial conditions.

It is found that the initial conditions of the convection, in particular whether the convection occurs over land or ocean, play an important role in determining the lifetime and total CRE of the detrained cirrus clouds, due to the strong diurnal contrasts in convection over ocean and land. Furthermore, it is found that artificially extending the lifetime of the detrained cirrus increases the total CRE of high clouds in the tropics in all cases.

How to cite: Horner, G. and Gryspeerdt, E.: How does the lifetime of cirrus detrained from deep convection impact the cloud radiative effect of the tropics?, EGU General Assembly 2024, Vienna, Austria, 14–19 Apr 2024, EGU24-13338, https://doi.org/10.5194/egusphere-egu24-13338, 2024.

EGU24-14948 | Orals | AS1.11

Modelling secondary ice production in Arctic mixed-phase clouds 

Tomi Raatikainen, Silvia Calderon, Emma Järvinen, and Sami Romakkaniemi

Ice number concentration is a critical parameter for Arctic mixed-phase clouds. Several observations have shown that such relatively warm clouds can have orders of magnitude higher ice concentrations than expected based on typical Ice-Nucleating Particle (INP) concentrations. The most common explanation is that Secondary Ice Production (SIP) such as rime splintering (Hallett-Mossop ice multiplication) process causes the increase in ice concentration. Here we use observations from two field campaigns. In both campaigns the observations indicated that one or more SIP processes were actively producing ice. Due to the high temperatures around 265 K, the focus is on Hallett-Mossop process. Observed meteorological conditions and aerosol size distributions were used to initialize high-resolution large-eddy model UCLALES-SALSA simulations. Primary ice formation was modelled based on fixed INP concentrations so that the observed ice concentration was at least ten times larger than the INP concentration. Hallet-Mossop ice multiplication factors due to rime-splintering did not reproduce observed rates of secondary ice production. An increment of about one order of magnitude was needed to find agreement between modeled and observed ice number concentrations. This highlights the urgent need of laboratory and model studies that unveil the variable dependencies controlling SIP mechanisms. Secondary ice production can be increased by adjusting the simulated cloud temperature towards the optimal value and by increasing cloud water content. Extending simulation time up to 10 hours or more will also help. Although high ice concentrations can be obtained simply by increasing the INP concentrations, details such as vertical ice distribution and spatial variability will be different than in the case where SIP is used. Although this difference has a small impact on cloud dynamics during these 10-hour simulations, long-term impacts are likely.

How to cite: Raatikainen, T., Calderon, S., Järvinen, E., and Romakkaniemi, S.: Modelling secondary ice production in Arctic mixed-phase clouds, EGU General Assembly 2024, Vienna, Austria, 14–19 Apr 2024, EGU24-14948, https://doi.org/10.5194/egusphere-egu24-14948, 2024.

Atmospheric aerosols can act as ice-nucleating particles (INPs) thereby influencing the formation and the microphysical properties of cirrus clouds. However, the knowledge on the atmospheric distribution of INPs is still limited and consequently the understanding of their climate impacts is highly uncertain. We perform model simulations with a global aerosol-climate model coupled to a two-moment cloud microphysical scheme and a parametrization for aerosol-induced ice formation in cirrus clouds and present a global climatology of INPs in the cirrus regime. In addition to the broadly considered mineral dust and soot INPs, this climatology also comprises crystalline ammonium sulfate and glassy organic particles. The simulated INP number concentrations range from about 1 to 100 L−1 and agree well with in-situ observations and other global model studies. Our model results show large ammonium sulfate INP concentrations, while the concentrations of glassy organic INPs are mostly low in the cirrus regime. By coupling the different INP-types to the microphysical cirrus cloud scheme, we analyze their ice nucleation potential under cirrus conditions, considering possible competition mechanisms between different INPs. The resulting radiative forcing of the total INP-cirrus effect, considering the difference between a simulation with all different INP-species and a simulation with purely homogeneous freezing, is simulated as −28 and −55 mW m−2, assuming a smaller and a larger ice-nucleating potential of INPs, respectively. While the simulated impact of glassy organic INPs is mostly small and not significant, ammonium sulfate INPs introduce a considerable radiative forcing, which is nearly as large as the combined effect of mineral dust and soot INPs. Assuming a larger ice-nucleating potential of INPs, the INP-cirrus effect due to anthropogenic INPs, considering the difference between present-day (2014) and pre-industrial (1750) conditions, is simulated as −29 mW m−2.

How to cite: Beer, C., Hendricks, J., and Righi, M.: The global distribution of ice-nucleating particles and their impacts on cirrus clouds and radiation derived from global model simulations, EGU General Assembly 2024, Vienna, Austria, 14–19 Apr 2024, EGU24-15251, https://doi.org/10.5194/egusphere-egu24-15251, 2024.

EGU24-15772 | Posters on site | AS1.11

Occurrence of multi-layer clouds and ice-crystal seeding in the Arctic observed by Radar and radiosondes 

Peggy Achtert, Torsten Seelig, Matthias Tesche, Gabriella Wallentin, and Corinna Hoose

While prior research on Arctic clouds has predominantly focused on single-layer clouds, the presence of multi-layer clouds in the Arctic holds significance. In such complex atmospheric systems, upper-level clouds can exert influence on the phase of lower clouds. A notable scenario occurs when ice crystals descend from higher altitudes into supercooled liquid water clouds, triggering the formation of mixed-phase clouds.

Our project is dedicated to investigating the occurrence of multi-layer clouds and their seeding, employing a combination of radiosonde and cloud radar observations. We will share findings from various locations, including research stations in Ny Alesund and the ARM North Slope of Alaska site, as well as insights from research cruises in the Arctic. Data from several research cruises were utilized in this study, namely MOSAiC (2019/20), Arctic Ocean 2018, and the ACSE 2014 campaign.

In addition, for the MOSAiC campaign, we employ back trajectories from various cloud levels and clear sky regions above the clouds to gain deeper insights into the occurrence and formation of multi-layer clouds. Our focus extends to different seasons, particularly emphasizing the Arctic melt and freeze-up periods.

How to cite: Achtert, P., Seelig, T., Tesche, M., Wallentin, G., and Hoose, C.: Occurrence of multi-layer clouds and ice-crystal seeding in the Arctic observed by Radar and radiosondes, EGU General Assembly 2024, Vienna, Austria, 14–19 Apr 2024, EGU24-15772, https://doi.org/10.5194/egusphere-egu24-15772, 2024.

EGU24-16916 | Orals | AS1.11

Perspectives on the Desert dust Contribution to Ice Nucleation in Mixed-phase Clouds and Associated Radiative Forcing 

Carlos Pérez García-Pando, Marios Chatziparaschos, Montserrat Costa-Surós, María Gonçalves Ageitos, Paraskevi Georgakaki, Athanasios Nenes, Maria Kanakidou, Twan van Noije, Philippe Le Sager, Zamin A. Kanji, Philip Brodrick, and Kathleen Grant

Wind-driven erosion of arid and semi-arid surfaces produces desert dust, the primary source of ice-nucleating particles (INP) in the atmosphere. These particles play a crucial role in the phase partitioning of mixed-phase clouds (MPCs) by influencing heterogeneous freezing processes. As global warming progresses, the shift from ice to liquid water in MPCs is anticipated to increase cloud reflectivity, potentially cooling the planet. However, the uncertainty surrounding this negative cloud-phase feedback is substantial, mainly due to uncertainties in the magnitude, spatiotemporal distribution, and trends of INP.

In dust-enriched environments, MPC glaciation is intricately linked to dust abundance and INP efficiency. Increased dust concentrations may enhance ice crystal formation, reducing overall cloud albedo and inducing a positive radiative effect, thereby diminishing the negative cloud-phase feedback. Currently, significant knowledge gaps impede the accurate representation of INP abundance, trends, and physical/chemical properties, hindering our understanding of its impact on ice formation in MPCs and climate.

This review assesses the current state-of-the-art in representing and quantifying the contribution of desert dust to ice nucleation in MPCs and its associated radiative forcing. Additionally, we offer a perspective on how new observational constraints, such as historical dust trends, satellite retrievals of quartz and feldspar surface abundances, recent measurements of mineral size distributions and mixing state at emission, and improved modeling with tailored ageing schemes, could help mitigate the existing uncertainties in estimating dust forcing via interactions with mixed-phase clouds.

How to cite: Pérez García-Pando, C., Chatziparaschos, M., Costa-Surós, M., Gonçalves Ageitos, M., Georgakaki, P., Nenes, A., Kanakidou, M., van Noije, T., Le Sager, P., Kanji, Z. A., Brodrick, P., and Grant, K.: Perspectives on the Desert dust Contribution to Ice Nucleation in Mixed-phase Clouds and Associated Radiative Forcing, EGU General Assembly 2024, Vienna, Austria, 14–19 Apr 2024, EGU24-16916, https://doi.org/10.5194/egusphere-egu24-16916, 2024.

EGU24-16983 | ECS | Posters on site | AS1.11

Supercooled liquid water representation with the LIMA 2-moment microphysical scheme during the ICICLE field campaign 

Mareva July Wormit, Benoît Vié, and Christine Lac

Supercooled cloud water is the source of a meteorological phenomenon with significant societal challenges: icing. Icing occurs when supercooled water droplets freeze upon contact with a solid surface and is even more intense with larger drops, resulting in stronger accretion. Anticipating the icing risk is crucial to ensure aviation safety, as ice on the fuselage can lead to a loss of lift. Icing as well occurs on wind turbines and train catenaries, making it a concern for both energy and transport sectors.

Supercooled water is often underestimated in numerical models. Our objectives are first to assess the two-moment microphysical scheme LIMA (Vié et al., 2016), second to identify the physical processes which are responsible for the lesser supercooled water before improving them.

To this end, numerical simulations of the research model Meso-NH (Lac et al., 2018) are compared to the observations of the ICICLE measurements campaign (https://www.eol.ucar.edu/field_projects/icicle). This airborne campaign was launched in February 2019 from Rockford (USA) by the USA’s Federal Aviation Administration. During 29 flights, microphysical parameters as the mixing ratio and the size of liquid and icy hydrometeors have been measured. These observations form an exceptional data set for studying the microphysical behaviour of models.

19 days, including all the 23 research flights of the campaign, were simulated. An extensive evaluation of the simulations was carried out, both on a flight-by-flight basis using Meso-NH’s flight simulator, and statistically combining observations from all flights. During the campaign, several cases of classical freezing rain, and lake effect situations, were sampled, allowing for a robust evaluation of model performance in these situations.

For lake effect cases, supercooled liquid water is forecast down to −30 °C, and mixed phase clouds are present between 0 °C and −10 °C, but cloud are almost completely icy around −20 °C. In freezing rain events, the precipitation tends to freeze again below the warm part of the cloud. To identify the sources of supercooled liquid water underestimation, a detailed analysis of microphysical processes budgets is performed. The impact of aerosols on forecasts is also investigated, using in-situ aerosol observations and CAMS reanalyses.

How to cite: July Wormit, M., Vié, B., and Lac, C.: Supercooled liquid water representation with the LIMA 2-moment microphysical scheme during the ICICLE field campaign, EGU General Assembly 2024, Vienna, Austria, 14–19 Apr 2024, EGU24-16983, https://doi.org/10.5194/egusphere-egu24-16983, 2024.

EGU24-19522 | Posters on site | AS1.11

Investigating the Impact of Aerosols on Liquid-Origin Cirrus from Global Observations and Reanalysis Data 

Odran Sourdeval, Athulya Saiprakash, Quentin Coopman, Silvia Bucci, and Tuule Müürsepp

Complementarily to their formation mechanism, the origin of cirrus (liquid or in-situ) can substantially affect their microphysical and radiative properties. Liquid-origin cirrus, which stem from the freezing of water droplets at cirrus temperatures, are typically characterised by high ice crystal concentrations and associated with strong cooling effect. However, the global occurence and distribution of this cirrus type as well as the environmental conditions in which they originate. The role of aerosols on liquid-origin cirrus, through their influence on liquid clouds, is also not well understood but can be critical for understanding radiative forcings associated with aerosol-cloud interactions and in implications of potential geo-engineering strategies.

This study investigates cirrus by coupling satellite and reanalysis dataset. Observations from lidar-radar satellite instruments (DARDAR-Nice) provide detailed retrievals of cirrus microphysical properties, such as ice water content and crystal number concentration. To trace the origins of cirrus clouds, we employ Lagrangian air mass trajectories based on ERA5 reanalyses, using FLEXPART. The presence and role of aerosols during the formation phase of these clouds, either in mixed-phase or warm regions, are assessed by integrating these trajectories with aerosol reanalysis products, specifically from CAMS. 

This joint cloud-aerosol dataset from satellite and reanalysis tools is created for one year of satellite observations. The global occurence of liquid-origin cirrus is analysed. The role of aerosols on the formation of liquid-origin clouds is finally investigated, in particular to understand the relevance of low-level aerosols on cirrus properties. Associated radiative effects will also be explored.

How to cite: Sourdeval, O., Saiprakash, A., Coopman, Q., Bucci, S., and Müürsepp, T.: Investigating the Impact of Aerosols on Liquid-Origin Cirrus from Global Observations and Reanalysis Data, EGU General Assembly 2024, Vienna, Austria, 14–19 Apr 2024, EGU24-19522, https://doi.org/10.5194/egusphere-egu24-19522, 2024.

EGU24-20442 | ECS | Posters on site | AS1.11

Secondary ice production over the Southern Atlantic Ocean: linking satellite data with aircraft observations 

Yasmin Aboel Fetouh, Jan Cermak, Corinna Hoose, and Emma Järvinen

In the past, numerous airborne in-situ measurements of mixed-phase clouds have exhibited a clear discrepancy between the observed ice particle and ice nucleating particle (INP) number concentrations of up to four orders of magnitude, with the highest differences observed in marine clouds. This suggests that primary ice nucleation is not the dominant source of cloud ice and that secondary ice production (SIP) plays a significant role in governing the ice phase in these clouds. Based on laboratory and field observations a number of SIP mechanisms have been hypothesized. However, most of these mechanisms are not well quantified and, therefore, only a few SIP mechanisms are included in weather models so far.

In our research, we aim to spatially extend the observations from aircraft campaigns by linking them to satellite data. Here we will show the work done linking the albedo and brightness temperatures from the 16 available spectral bands of Himawari-8, ranging from 0.47 – 13.3 µm, with the ice particle number concentrations observed during the SOCRATES campaign in low-level boundary layer clouds over the Southern Ocean. Finally, we employed multiple linear regression machine learning techniques and also made use of the SOCRATES campaign lidar/radar onboard.

How to cite: Aboel Fetouh, Y., Cermak, J., Hoose, C., and Järvinen, E.: Secondary ice production over the Southern Atlantic Ocean: linking satellite data with aircraft observations, EGU General Assembly 2024, Vienna, Austria, 14–19 Apr 2024, EGU24-20442, https://doi.org/10.5194/egusphere-egu24-20442, 2024.

EGU24-20507 | ECS | Posters on site | AS1.11

Representation of Arctic mixed-phase clouds in the ECMWF Integrated Forecasting System during MOSAiC 

Luise Schulte, Linus Magnusson, Richard Forbes, Jonathan Day, Vera Schemann, and Susanne Crewell

Mixed-phase clouds are common in the Arctic atmospheric boundary layer and their representation is challenging for models. Recent studies suggest that the ECMWF Integrated Forecast System (IFS) shows too many cloudy periods in the Arctic in summer and generally misses the periods with clear skies, while in winter the cloudy state is underrepresented.
We use ground-based remote sensing data from the MOSAiC campaign to assess systematic errors in modelled liquid cloud water over the whole MOSAiC period and combine this with more detailed analyses of selected cases.
In addition, we perform sensitivity tests to identify ways to improve the parametrization for Arctic mixed-phase clouds in the IFS.
We run cases in the Single Column Model (SCM) version of the IFS and investigate the representativity of model sensitivities in the SCM for the 3D model.

How to cite: Schulte, L., Magnusson, L., Forbes, R., Day, J., Schemann, V., and Crewell, S.: Representation of Arctic mixed-phase clouds in the ECMWF Integrated Forecasting System during MOSAiC, EGU General Assembly 2024, Vienna, Austria, 14–19 Apr 2024, EGU24-20507, https://doi.org/10.5194/egusphere-egu24-20507, 2024.

Mass loss of snow packs due to recrystallization processes and subsequent vapor fluxes are inherently difficult to measure experimentally. Present numerical advances enable new simulation tools to explore the otherwise invisible mass fluxes due to diffusive and convective water vapor transport. In this study we calculate the effective vapor fluxes as a function of the local mass transfer coefficient, snow depth, and a range of microstructure parameters given by porosity and specific surface area. A set of flow, heat transport and vapor transport equations re developed. Heat transport is characterized by the Rayleigh number while vapor transport depends on the Péclet and Damkhöler numbers. The latter measures the relative importance of vapor transfer to advective fluxes. For low Rayleigh numbers, the system behaves in a purely diffusive manner. however, convective transport mechanisms dominate for high Rayleigh values. Convection is found to enhance vapor transport. This is in agreement with previously unexplained mass losses in field observations. The effect of vapor mass transfer between the solid and gas phase is also analyzed. The results can be used for macroscale snow pack models to predict large scale mass loss due to sublimation for snow covered areas such as Antarctica, Greenland and seasonally covered Tundra.

How to cite: Hidalgo, J. J. and Krol, Q.: Effective vapor transport in snow: The role of convection and the local mass transfer coefficient, EGU General Assembly 2024, Vienna, Austria, 14–19 Apr 2024, EGU24-3827, https://doi.org/10.5194/egusphere-egu24-3827, 2024.

EGU24-6861 | ECS | PICO | CR6.2

Aeolian snow transport induces airborne snow metamorphism with implications for snowpack physical properties 

Sonja Wahl, Benjamin Walter, Franziska Aemisegger, Luca Bianchi, and Michael Lehning

Aeolian transport of snow is a cryospheric process prevalent in all snow-covered areas. It influences the energy and mass balance of these cold regions. Apart from the direct effects during the process, aeolian transport alters the snow’s microstructure, leaving behind a wind-blown snow layer with different snowpack characteristics than before the wind event. For high-resolution climate modeling in snow-covered regions, it is thus important to incorporate the immediate and lasting effects of wind-induced aeolian snow transport for an accurate representation of the energy and mass balances of a snowpack. Apart from mechanical mechanisms such as fragmentation and aggregation of snow crystals, the metamorphic mechanism (sublimation and deposition of water molecules on the suspended snow particles) can alter the microstructure of snow during aeolian transport. It is difficult to predict the relative importance of the two mechanisms for the evolution of the microstructure of wind-blown snow, not least because the process is happening on the micro-scale but is unfolding on large spatial scales on the respective particle trajectories. Thus, it is difficult to observe.
However, metamorphic processes leave a fingerprint on the snow’s composition of stable water isotopes whereas the mechanical mechanisms do not. Hence, monitoring the evolution of the stable water isotope signal of the snow can act as a macro-scale tracer for the metamorphic micro-scale processes. The stable water isotope signal can thus help to differentiate the processes at play during aeolian snow transport.
Here we show through observations of cold laboratory ring-wind tunnel experiments that aeolian transport of snow involves airborne snow metamorphism. We monitored the evolution of the microstructure and the isotopic composition of airborne snow through repeated sampling of snow from the air stream. In a total of 19 experiments we varied the temperature in a range of -20°C to -3°C and the transport times varied between 50 - 180 minutes. We find a rapid exponential decay in specific surface area (SSA) with transport time which reduces the SSA value to 35-70% of its starting value by the end of the experiments. Further, we observe a shift in the particle size distribution towards larger snow particles, both for the most abundant and maximum particle sizes with aeolian transport time. Simultaneously, the water isotope signature shows mainly an enrichment in δ18O and a decrease in d-excess which is a strong indicator for isotopic fractionation and thus evidence for the presence of metamorphic processes. Combining the results, we attribute the change in snow microstructure to airborne snow metamorphism. The unique combination of information on the isotopic composition and microstructure of airborne snow under well-constrained laboratory conditions can be used to develop parameterizations for the incorporation of airborne snow metamorphism in snow-process models.

How to cite: Wahl, S., Walter, B., Aemisegger, F., Bianchi, L., and Lehning, M.: Aeolian snow transport induces airborne snow metamorphism with implications for snowpack physical properties, EGU General Assembly 2024, Vienna, Austria, 14–19 Apr 2024, EGU24-6861, https://doi.org/10.5194/egusphere-egu24-6861, 2024.

EGU24-8976 | ECS | PICO | CR6.2

Spatiotemporal variability of turbulent fluxes over snow in mountain regions  

Rainette Engbers, Sergi González-Herrero, Nander Wever, Franziska Gerber, and Michael Lehning

Turbulent exchange of heat and moisture plays an important role in snow cover dynamics in mountain regions and governs the boundary layer dynamics. While these processes are subject to great spatiotemporal variability, particularly in complex terrain, virtually all measurements of heat, moisture and momentum fluxes are point observations. To quantify the spatial variability, and assess the representativeness of the observations, numerical modelling of the atmosphere and surface is a useful tool. Still, there is substantial uncertainty in the accuracy of how surface models capture this spatial variability, particularly in complex terrain with large spatial variability on small scales. These uncertainties can be partially attributed to (1) the use of Monin-Obukhov similarity theory (MOST) which has limitations in complex terrain due to the role of advection and (2) the errors in representing near-surface atmospheric gradients in the simulations. In this study, we analyse sources of errors in representing energy exchange over snow in mountain regions and look specifically at the spatiotemporal variability during different meteorological events in the region of Davos, Switzerland. To verify common modelling approaches with observations, we use model predictions of turbulent fluxes from CRYOWRF, the atmospheric model WRF coupled to the surface model SNOWPACK. The fluxes at different resolutions are compared to turbulent fluxes measured using the Eddy Covariance method (EC) and calculated with MOST. This model validation is done for different meteorological events representative of the local climate. Preliminary results indicate that the fluxes are highly spatially variable, being an order of magnitude higher on the leeside than on the windward side of a mountain ridge. This indicates that local heat fluxes are not representative of the whole mountain area, which has implications for the calculation of snow melt, sublimation and accumulation across mountainous terrain. The resolution of the model also plays a large role in representing the fluxes as the modelled fluxes differ greatly depending on the resolution. Our results quantify to what extent snow-atmosphere interactions and their spatial variability are correctly represented in state-of-the-art numerical weather and snow models. 


How to cite: Engbers, R., González-Herrero, S., Wever, N., Gerber, F., and Lehning, M.: Spatiotemporal variability of turbulent fluxes over snow in mountain regions , EGU General Assembly 2024, Vienna, Austria, 14–19 Apr 2024, EGU24-8976, https://doi.org/10.5194/egusphere-egu24-8976, 2024.

EGU24-12325 | PICO | CR6.2

A comparison of snow depth scaling patterns from TLS, UAV and Pleiades observations  

Jesús Revuelto, Pablo Mendoza, Cesar Deschamps-Berger, Esteban Alonso-González, Francisco Rojas-Heredia, and Juan Ignacio López-Moreno

Understanding the evolution of snowpack in heterogeneous mountain areas is a highly demanding task and requires the application of suitable observation techniques to retrieve snow properties at distinct spatial scales. In turn, once the reliability of these techniques is established, the comprehension of snowpack scaling properties helps to determine which processes are more relevant on the control of snow distribution and its temporal evolution. Previous studies have reported detailed observational datasets and insights on the main drivers of snowpack distribution through variogram analysis up to 500-800 m, identifying scale break lengths and their anisotropies. Here, we examine scale breaks derived from variogram analysis applied to snow depth observations at the Izas Experimental Catchment (located in Central Spanish Pyrenees) and the surrounding area for the period 2019-2023. To this end, we use data retrieved with three observation techniques: Terrestrial Laser Scanning (TLS-LiDAR, 12 acquisitions), Unmanned Aerial Vehicles (UAV-SfM, 20 acquisitions), and satellite stereo images (4 Pléiades acquisitions), covering different domains around the experimental site. First, we analyze the consistency among the observational techniques, and then we explore possible drivers explaining detected scale breaks through variogram analysis up to 4000 m. Overall, similar results were obtained with the three observational techniques, with a very high temporal consistency for the first detected scale break length and little variations with direction. We also found good agreement between the search distance used to compute the topographic position index (TPI), the first scale break length, and the mean distance between peak snow accumulations, which vary between 15 and 25 m, not only for the entire study domain, but also in manually delineated Hydrological Response Units.

How to cite: Revuelto, J., Mendoza, P., Deschamps-Berger, C., Alonso-González, E., Rojas-Heredia, F., and López-Moreno, J. I.: A comparison of snow depth scaling patterns from TLS, UAV and Pleiades observations , EGU General Assembly 2024, Vienna, Austria, 14–19 Apr 2024, EGU24-12325, https://doi.org/10.5194/egusphere-egu24-12325, 2024.

EGU24-12854 | ECS | PICO | CR6.2

Quantifying the Impact of Dynamic Lapse Regimes on Spatially-Distributed Snow Simulations 

Kristen Whitney, Sujay Kumar, John Bolten, Justin Pflug, Fadji Maina, Christopher Hain, David Mocko, and Melissa Wrzesien

Accurate characterization of surface meteorological distributions over coastal areas and complex terrain, especially the relationship between temperature and altitude, is essential for the accurate simulation of snowpack dynamics. This becomes increasingly difficult at spatial resolutions smaller than common gridded meteorological forcing datasets due to the sparsity of long-term temperature measurements and the influence of local factors like cool air pooling and inversions. Near-surface air temperatures (Ta) are often assumed to decrease with elevation at a constant rate of 6.5oC km-1, which could lead to large model errors in snow evolution and other processes key to snow hydrology, water resource management, and other applications. This study evaluates the impact of local dynamical adjustments to downscaled Ta on snow simulations over two coastal mountainous terrains using the Noah-MultiParameterization (NoahMP) land surface model. Forcings are derived from remote sensing and reanalysis precipitation products and the (Modern-Era Retrospective Analysis for Research and Applications, version 2) MERRA-2 atmospheric products (including Ta) at the downscaled 1-km resolution. Hourly lapse rates at each grid cell are calculated by applying linear regression to Ta and elevation from surrounding grid cells (within one grid lengths in the x or y direction) at the Ta native MERRA-2 resolution and applied to the downscaled 1-km Ta product. We will present the impact on simulated snow water equivalent, snow cover, and snow depth across simulations forced with the downscaled Ta (1) without lapse rate correction, (2) corrected with a constant lapse rate (6.5oC km-1), and (3) corrected with the dynamic hourly lapse rate. Results will be compared against remote sensing-based products.

How to cite: Whitney, K., Kumar, S., Bolten, J., Pflug, J., Maina, F., Hain, C., Mocko, D., and Wrzesien, M.: Quantifying the Impact of Dynamic Lapse Regimes on Spatially-Distributed Snow Simulations, EGU General Assembly 2024, Vienna, Austria, 14–19 Apr 2024, EGU24-12854, https://doi.org/10.5194/egusphere-egu24-12854, 2024.

To maintain computational efficiency and avoid adding too many uncertainties into Land Surface Models (LSMs) with fine-scale parameterization, many efforts have been made to improve sub-grid representations of heterogeneous landscapes. HydroBlocks LSM stands out as a model that employs advanced hierarchical clustering methods, utilizing field-scale satellite-derived data to construct sub-grid tiles or clusters. The Noah-MP land surface model is applied within each tile. Unlike conventional tiling approaches, knowing the spatial location of the clusters provides the opportunity to incorporate the interactions across the distinct clusters. Presently, they interact through the subsurface flow processes. Despite the comprehensiveness of these models, both Noah-MP and HydroBlocks lack consideration for the wind-induced snow transport which plays a pivotal role in snow-related hazards. Other than that, the sublimation and redistribution of wind-blown snow in exposed environments contributes significantly to variations in snow depth. It not only exerts local influence on surface water and energy balance, but also can have expansive impact since the snowmelt is critical for the water availability of downstream basins. To address this limitation, we propose the integration of a blowing snow module into HydroBlocks. This module, inspired by the Prairie Blowing Snow Model, consists of physical-based wind transport and sublimation algorithms. Clusters will be categorized into source and sink regions considering their topography and vegetation. The redistribution of snow mass at every timestep will be calculated based on the wind condition and the adjacent borders between clusters. This research seeks to pave the way for modeling other mass transport processes between tiles which considers the complex interactions within heterogeneous landscapes.

How to cite: Cai, J. and Chaney, N.: Integrating a Blowing Snow Module for Enhanced Representation of Snow Dynamics and Surface in the HydroBlocks modeling framework, EGU General Assembly 2024, Vienna, Austria, 14–19 Apr 2024, EGU24-13274, https://doi.org/10.5194/egusphere-egu24-13274, 2024.

EGU24-15202 | PICO | CR6.2

Wind tunnel experiments to characterize snow densification and SSA reduction caused by aeolian snow transport 

Benjamin Walter, Sonja Wahl, Hagen Weigel, and Henning Löwe

Snow precipitation frequently occurs under moderate to strong wind conditions, resulting in drifting and blowing snow. Processes like particle fragmentation and airborne metamorphism during snow transport result in microstructural modifications of the ultimately deposited snow. Despite the relevance (optically and mechanically) of surface snow for alpine and polar environments, this effect of wind on the snow microstructure remains poorly understood and quantified. Available descriptions of snow densification due to wind are exclusively derived from field measurements where conditions are difficult to control. Information on the effect of wind on the specific surface area (SSA) is basically nonexistent. The goal of this experimental study was to systematically quantify the influence of wind on the surface snow density and SSA for various atmospheric conditions (temperature, wind speed, precipitation intensity), and to identify the relevant processes. 

We conducted experiments in a cold laboratory using a closed-circuit ring wind tunnel with an infinite fetch to investigate wind-induced microstructure modifications under controlled atmospheric, flow and snow conditions. Artificially produced dendritic nature-identical snow was manually poured into the ring wind tunnel for simulating precipitation during the experiments. Airborne snow particles are characterized by high-speed imaging, and deposited snow is characterized by density and SSA measurements resulting in a comprehensive dataset.

            The high-speed images support a snow particle transport scheme in the saltation layer similar to natural conditions. We measured an increase of the densification rate with increasing wind speed which differs from available model parameterizations. The SSA was found to decrease under the influence of wind, while increasing wind velocities intensified the SSA decrease. For higher air temperatures (Ta > -5°C), both the densification and SSA rates significantly differ from the rather constant rates at lower temperatures. We attribute this to the effects of enhanced cohesion or sintering (density) and intensified airborne snow metamorphism (SSA) at higher air temperatures. A sensitivity experiment revealed a strong influence of airborne snow metamorphism on the SSA decrease. Our results provide a first step towards an improved understanding and modeling of the effect of aeolian snow transport on optically and mechanically relevant microstructural properties of surface snow.

How to cite: Walter, B., Wahl, S., Weigel, H., and Löwe, H.: Wind tunnel experiments to characterize snow densification and SSA reduction caused by aeolian snow transport, EGU General Assembly 2024, Vienna, Austria, 14–19 Apr 2024, EGU24-15202, https://doi.org/10.5194/egusphere-egu24-15202, 2024.

The snowpack plays a fundamental role in regulating the global climate thanks to its high albedo and thermal insulation properties, and for many regions of the world it also has very local and important impacts. Indeed, the snow is an important water reservoir, storing the water in solid state during cold months, and releasing it in liquid state during warmer months. But the snow is also the necessary condition for the development of rural places which base their economy on winter sports. However, a certain risk is always associated with snow when it deposits on the ground, since the snow can slide down, creating avalanches which may cause several damages to the local flora, fauna, buildings and infrastructures. Typically, the conditions that allow the occurrence of snow avalanches span from the point scale to the slope scale, and depend on the snowpack properties. Kilometer-resolution numerical models are not able to reproduce the slope-scale variability of the snowpack properties because of the complex interaction between the atmospheric flows and the topography at finer scale. To address this limitation, we apply several algorithms to downscale 1 km horizontal resolution WRF atmospheric simulations to 500 m horizontal resolution in order to force the snow cover model Alpine3D with more representative weather data. Additionally, we train a fully convolutional neural network to downscale 10 km resolution IMERG precipitation data to 1 km horizontal resolution, further downscaled to 500 m. Furthermore, 2m temperature point observations are interpolated at 500 m resolution using geostatistical techniques. Finally, we force Alpine3D with a combination of forecasted and observed data, obtaining improved simulation results compared to using only forecasted weather data. This implies that the use of a combination of simulated and observed weather data is particularly promising for the estimation of the snowpack properties at slope-scale resolution in regions characterized by complex topography, providing more reliable information for risk mitigation, and sustainable development of snow-prone areas.

How to cite: Raparelli, E. and Tuccella, P.: Improving snowpack simulation at slope-scale resolution with machine learning and geostatistical downscaling of observed and forecasted weather data., EGU General Assembly 2024, Vienna, Austria, 14–19 Apr 2024, EGU24-15809, https://doi.org/10.5194/egusphere-egu24-15809, 2024.

Mountain snowpack serves as a vital water source for both high-altitude regions and adjacent lowlands, significantly impacting local economies through its influence on tourism, communication, logistics, and recreational risks. However, mid-elevation snow cover is diminishing due to climate change (IPCC-2021), emerging as a critical concern in water management. Despite its importance, a lack of comprehensive understanding stems from a scarcity of well-distributed mountain snowpack observations and specific simulation tools. This knowledge gap is more pronounced in Mediterranean mountainous regions, where intricate processes of growth and ablation, high spatial variability, and a high inter-annual variability pose obstacles for models. To address these challenges, hyper-high resolution models (<1 km) have been developed, but they often come with significant computational expenses. As an alternative, SnowCast has been introduced, which nests ERA5 atmospheric reanalysis (ECMWF), the Intermediate Atmospheric Research model (ICAR, NCAR), and the Flexible Snow Model (FSM2, University of Edinburgh), incorporating custom parametrizations and high-resolution topographic forcing models. This approach enables highly parallelized computations, enhancing the efficiency of simulating multiple years. This capability allows the application of such resolution for climate studies while managing computational costs effectively. Validation through extensive fieldwork, automated snowpack monitoring, and satellite imagery shows that the model provides a realistic temporal and spatial representation of snow cover. In-depth analysis of model performance will be presented, along with discussions on potential new processes for implementation, exploration of additional validation techniques, and future prospects for coupling with a hydrological model.

How to cite: González Cervera, Á. and Durán, L.: SnowCast: Hyper-high resolution downscaling model. Snowpack simulation in a mountainous region in Central Spain (Peñalara Massif), EGU General Assembly 2024, Vienna, Austria, 14–19 Apr 2024, EGU24-15828, https://doi.org/10.5194/egusphere-egu24-15828, 2024.

EGU24-17057 | PICO | CR6.2

Snow on permafrost: the effect of spatial snow variability on soil temperature in Trail Valley Creek, NWT, Canada 

Inge Grünberg, Daniela Hollenbach Borges, Jennika Hammar, Nick Rutter, Philip Marsh, and Julia Boike

Snow is a potent insulator, influencing the temperature of the active layer and the permafrost in the Arctic region. However, our understanding of spatial patterns of snow properties and their interplay with vegetation remains limited due to scarcity of local and regional snow data. Furthermore, the duration, depth, and physical properties of the Arctic snow cover are changing with rising air temperature and new precipitation patterns. We study the spatial snow distribution and its drivers and consequences around the Trail Valley Creek research catchment in the Northwest Territories, Canada. Our dataset includes a 143 km² snow depth raster captured on April 2, 2023, at a 1-meter spatial resolution, as well as data from 13 spatially distributed loggers measuring air/snow temperature, soil surface temperature, and soil temperature at 8 cm depth from August 27, 2022, to August 9, 2023. Detailed information on vegetation types, structure, and soil properties at all locations is included. Our analysis covers the timing of soil freeze and thaw, snow and soil temperatures, and their correlation with vegetation characteristics, particularly focusing on April snow depth. Our findings underscore the pivotal role of snow in regulating soil temperature, making it a key driver for permafrost protection or thaw. The results reveal significant variability in April snow depth across the 13 study locations, ranging from no snow to 1.7 meters, resulting in winter minimum soil temperatures between -31°C and -4°C. The study confirms that thicker snow cover contributes to warmer soil temperatures. While the soil at 8 cm freezes uniformly in mid-October across all sites, snow patterns lead to high variability in soil thawing dates, which span one month between May 10 and June 08, 2023. Understanding the spatial patterns of snow depth, thermal properties, and timing is crucial for assessing the snow effect on soil temperature. The large range of winter soil temperatures, which we observed, may lead to differences in thaw depth development in the following summer and potentially to talik formation affecting permafrost stability.

How to cite: Grünberg, I., Hollenbach Borges, D., Hammar, J., Rutter, N., Marsh, P., and Boike, J.: Snow on permafrost: the effect of spatial snow variability on soil temperature in Trail Valley Creek, NWT, Canada, EGU General Assembly 2024, Vienna, Austria, 14–19 Apr 2024, EGU24-17057, https://doi.org/10.5194/egusphere-egu24-17057, 2024.

EGU24-19751 | ECS | PICO | CR6.2

A continuum mechanics perspective on the rheology of firn in the context of firn densification 

Timm Schultz, Angelika Humbert, and Ralf Müller

While the complex nonlinear rheology of ice is well known and often discussed, for example in the context of large-scale ice sheet modeling, calving, and isotropy occurring at shear margins, the rheology of firn is often considered to be rather simple. According to Truesdell’s first metaphysical principle, which states that ”all properties of a mixture must be mathematical consequences of properties of the constituents” (Truesdell, C. (1984), Rational Thermodynamics, Springer-Verlag, p. 221), the material behavior of firn should be related to that of ice, since firn is primarily a mixture of ice and air. What distinguishes firn from ice is its microstructure. The field of continuum mechanics provides methods to relate the microstructural properties of a material to its macroscopic material behavior.

Here we review a homogenization method developed for the densification of nonlinear creeping metallic powders and first applied to the simulation of firn densification by Gagliardini and Meyssonnier (1997, Annals of Glaciology, 24, pp. 242–248). The method links the rheology of ice to that of firn by describing firn as a porous medium with an ice matrix. The advantage of this approach is that it is formulated in all three spatial dimensions, allowing the inclusion of horizontal divergence due to ice flow without additional parameterization. A large database of dated firn cores allows the determination of the governing model parameters using an optimization approach. We discuss the results, advantages, and limitations of this approach, as well as validation strategies.

How to cite: Schultz, T., Humbert, A., and Müller, R.: A continuum mechanics perspective on the rheology of firn in the context of firn densification, EGU General Assembly 2024, Vienna, Austria, 14–19 Apr 2024, EGU24-19751, https://doi.org/10.5194/egusphere-egu24-19751, 2024.

EGU24-20320 | PICO | CR6.2

Monitoring snow depth by Integrating in an optimal way citizen science and other techniques 

David Pulido-Velazquez, Antonio Collados_Lara, Pedro Sánchez, Leticia Baena-Ruiz, Eulogio Pardo-Iguzquiza, Carlos Lorenzo-Carnicero, Juan Carlos García-Davalillo, Luis Carcavilla, Steven Fassnatch, Javier Herrero, Jose David Hidalgo, Victor Cruz Gallegos, Juan de Dios Gomez Gomez, Mónica Leonor Meléndez, Nemesio Heredia, Ignacio Lopez-Moreno, Jesús Revuelto, Helen Flynn, Amalia Romero, África de la Hera Portillo, Jorge Jódar, and Elisabeth Diaz-Losada

The snow depth (SD) is an excellent indicator of climate, yet a poorly monitored variable in many mountain ranges. A novel integrated approach is proposed for optimal monitoring of SD dynamics in the 5 National Parks located in Alpine (NPA) zones of Spain (i.e., Sierra Nevada, Guadarrama, Picos de Europa, Ordesa y Monte Perdido, and Aigüestortes i Estany de Sant Maurici). It will leverage the existing infrastructure of snow poles installed by the Snow Monitoring National Program in Spain (ERHIN). This program obtains SD measurements by direct observation from helicopter flights (1-3 per year). This monitoring activity has been drastically reduced in some mountain ranges during the economic crisis. The objective of this current work is to avoiding potential gaps in the valuable long-term SD timeseries of the pole measurements. An innovative Citizen Science Activity (CSA) methodology is being implemented to engage volunteers to collect the maximum number of photos of the snow poles. It is designed as a sports challenge, in which ranking and awards will be given to the most active participants. It aims to enhance the project with a minimum economic cost, and has the additional objective of raising awareness and encouraging responsible visits to these NPA. It has been tested in Sierra Nevada National Park, where we have identified the necessity to combine the information obtained from this CSA with other approaches to maximize the amount of useful information collected, and in order to reduce the uncertainty in snow distribution.

A number of automatic point sensors have been installed to collect additional snow depth data at snow poles with a high number of days with snow, as identified from a historical analyses of snow cover area (SCA). These locations also have higher uncertainty SD measurements, and thus far, there have been less opportunity for the citizen science collection of photos. In order to identify the most relevant snow poles, we have used a regression model that estimates the spatial distribution of snow depth and its uncertainty from snow cover area and snow depth data. since the high cost of this complementary monitoring actions needs to be considered. a multi-sensors experiment is being performed to identify the best cost-benefit automatic sensors (ultrasound sensors, time-lapse cameras, etc). Drone field campaigns will be also performed, together with distributed information from airborne LIDAR and high resolution Pléiades satellite imagery. Such field campaigns there are costly, and thus the CSA has been also extended to the other 4 NPA. We are using a variety of media (e.g., social networks, TV, radio, and newspapers) to disseminate and communicate the CSA activity in order to maximize participation.

Acknowledgements:
This research has been partially supported by the projects: STAGES-IPCC (TED2021-130744B-C21), SIGLO-PRO (PID2021-128021OB-I00), from the Spanish Ministry of Science, Innovation and Universities, SER-PM (2908/22) from the National Park Research Program, RISKYEARTH (Recovery funds), and SIERRA-CC (PID2022-137623OA-I00) funded by MICIU/AEI/10.13039/501100011033 and by FEDER, UE.

How to cite: Pulido-Velazquez, D., Collados_Lara, A., Sánchez, P., Baena-Ruiz, L., Pardo-Iguzquiza, E., Lorenzo-Carnicero, C., García-Davalillo, J. C., Carcavilla, L., Fassnatch, S., Herrero, J., Hidalgo, J. D., Cruz Gallegos, V., Gomez Gomez, J. D. D., Meléndez, M. L., Heredia, N., Lopez-Moreno, I., Revuelto, J., Flynn, H., Romero, A., de la Hera Portillo, Á., Jódar, J., and Diaz-Losada, E.: Monitoring snow depth by Integrating in an optimal way citizen science and other techniques, EGU General Assembly 2024, Vienna, Austria, 14–19 Apr 2024, EGU24-20320, https://doi.org/10.5194/egusphere-egu24-20320, 2024.

Extratropical cyclone (EC) is a main source of precipitation at midlatitudes, but its contribution to the Antarctic surface mass balance (SMB) still remains uncertain. Based on five global climate model simulations, we propose that it probably exists a tipping point of the SMB during the evolution of the Antarctic Ice Sheet (AIS), and EC greatly contributes to the tipping point. Before the tipping point, decreasing elevation of the AIS and warming sea surface temperature promote southward movement of ECs, leading to increased precipitation and inhibiting the AIS melting. However, EC becomes a negative contribution to SMB due to increased AIS surface temperature, runoff and rainfall. This study highlights that EC contributes to the tipping point of the AIS evolution.

How to cite: Xu, D. and Lin, Y.: A tipping point in the contribution of extratropical cyclones to Antarctic surface mass balance, EGU General Assembly 2024, Vienna, Austria, 14–19 Apr 2024, EGU24-234, https://doi.org/10.5194/egusphere-egu24-234, 2024.

EGU24-788 | ECS | Posters on site | AS1.13

Characterization of cirrus clouds in the arctic depending on ambient conditions 

Georgios Dekoutsidis, Silke Groß, Martin Wirth, Christian Rolf, Andreas Schäfler, and Florian Ewald

The increase of the average global temperature of the Earth’s atmosphere has been measured with various methods dating back to the 19th century. In the past few decades scientists have shown that the arctic regions are warming even faster than the global average. This phenomenon has been labeled Arctic Amplification. Cirrus clouds are a potential contributor to this phenomenon. They reflect only a small part of the incoming solar radiation and can absorb and reemit earth’s long-wave radiation, thus potentially having a warming effect. Warm Air Intrusion (WAI) events transport warm, water-vapor- and aerosol-rich airmasses from the mid-latitudes into the arctic and can also contribute to arctic amplification. On the one hand the transported airmasses are already warm and contain significant amounts of water vapor which is a strong greenhouse gas. On the other hand, the cirrus clouds that form during such an event might have different and potentially stronger effects on the radiation budget of the atmosphere. Since it has also been shown that WAI events in the arctic are becoming more frequent or long-lasting, it is important to study the effects these events have on the macrophysical and optical properties of cirrus clouds in the arctic.

The HALO-(AC)3 field campaign took place in March and April of 2022. One of the central goals of the campaign was to study WAI events in the arctic regions of the Northern Hemisphere. Among others, the German research aircraft HALO was used to perform remote sensing measurements. In this study we use data collected during this campaign by the combined water vapor differential absorption and high spectral resolution lidar system WALES and the HAMP cloud radar. We selected two research flights: RF03, performed during an active warm air intrusion event (WAI case) and RF17, performed during undisturbed arctic conditions (AC case). For these flights we calculated the relative humidity over ice (RHi) and the backwards trajectories using the Lagrangian analysis tool LAGRANTO and the CLaMS-Ice model, which combines the Chemical Lagrangian Model of the Stratosphere (CLaMS) with two-moment ice microphysics. Our aim is to provide an in-depth analysis of the two types of cirrus clouds and find potential differences between them.

The clouds of the WAI case had a greater mean geometrical and optical depth as well as a slightly higher linear depolarization ratio, as measured by WALES. The distributions of RHi for the WAI case had its maximum slightly over saturation and a small negative skewness, while the AC case had its maximum at saturation with a bigger negative skewness. The supersaturations within and at close proximity to the WAI clouds reached high values over 127% more frequently than for the AC case. Surprisingly, the backwards trajectories revealed that the AC case had a significant part being of liquid origin and formed via heterogeneous nucleation, whilst the WAI case was predominantly of in-situ origin with homogeneous nucleation being the dominant process.

How to cite: Dekoutsidis, G., Groß, S., Wirth, M., Rolf, C., Schäfler, A., and Ewald, F.: Characterization of cirrus clouds in the arctic depending on ambient conditions, EGU General Assembly 2024, Vienna, Austria, 14–19 Apr 2024, EGU24-788, https://doi.org/10.5194/egusphere-egu24-788, 2024.

EGU24-914 | ECS | Posters on site | AS1.13

Intense precipitation events during polar winter over the Academic Vernadsky station: clouds, precipitation and temperature extremes 

Anastasiia Chyhareva, Svitlana Krakovska, Irina Gorodetskaya, and Liudmyla Palamarchuk

West Antarctica and the Antarctic Peninsula are considered to be climate tipping point regions where climate change processes can cause irreversible impacts. The Antarctic Peninsula region has a unique ecosystem, which can be harmfully affected by these changes. In the past decades have from Pacific mid-latitudes and specifically atmospheric rivers, accompanied by mixed-phase clouds and precipitation, can lead to surface melt on both sides of the Antarctic Peninsula.

This study focused on intense precipitation events during the winter in the Southern Hemisphere in 2022 in the Antarctic Peninsula observed during the Year of Polar Prediction targeted observing periods. Polar WRF (v. 4.5) simulation data with grid step 1km and temporal resolution 10 minutes were analysed for the region of Academic Vernadsky station, Antarctic Peninsula mountains and former glacier Larsen B bay.

Distributions of clouds and precipitation were analysed, as well as their concentrations and phases in the cross-section of the mountains. Also, temperature profiles were examined in the cross-sections, specifically for the 2km profile.

According to the simulations data, based on Thompson’s microphysical scheme found that mixed phased and liquid clouds and precipitation could occur up to 3km even in August, which is climatically the coldest month over the coastal areas and mountains. Maximum concentrations of ice crystals and liquid droplets could exceed 1g/kg. After the intense precipitation that occur on the western Antarctic Peninsula slopes, strong warming up to 6°C in a 2km layer is simulated for the eastern slopes of AP (Larsen B ice shelf embayment).

Simulation results were compared with radiosounding data and instrumental measurements at the Akademic Vernadsky station. According to the radiosounding that were held during all events, Polar WRF underestimated the temperature in the lower troposphere (up to around 950hPa), which can impact the surface precipitation phase and temperature simulations. However, as far as Polar WRF simulations for wind speed, direction, temperature, and vertical movements are correlated with radiosounding data, we can assume that the distribution of considered microphysical and thermodynamical characteristics gained from Polar WRF simulations are trustable.  

How to cite: Chyhareva, A., Krakovska, S., Gorodetskaya, I., and Palamarchuk, L.: Intense precipitation events during polar winter over the Academic Vernadsky station: clouds, precipitation and temperature extremes, EGU General Assembly 2024, Vienna, Austria, 14–19 Apr 2024, EGU24-914, https://doi.org/10.5194/egusphere-egu24-914, 2024.

EGU24-1678 | ECS | Posters on site | AS1.13

Shortwave cloud warming effect observed over Greenland 

Haotian Zhang, Chuanfeng Zhao, Annan Chen, Xin Zhao, and Yue Zhou

Clouds play a pivotal role in regulating the Earth's energy budget, primarily by exerting a global net cooling effect through the competing effects of shortwave radiation shading and longwave radiation trapping. However, here we report a shortwave warming effect by clouds over Greenland, contrary to the conventional belief of a cooling effect. Utilizing satellite observations from the Greenland region during the summers from 2013 to 2022, we identify a positive shortwave cloud radiative forcing when the ratio of surface albedo to top-of-atmosphere (TOA) reflectivity surpasses 1.42, implying that cloud induced warming can occur in any place when the surface is bright enough compared with TOA. Moreover, we find that the shortwave cloud warming effect on the Earth-atmosphere system is particularly prominent for optically thin clouds. These findings are crucial for understanding the radiation budget over polar regions and improving the prediction of polar ice melting.

How to cite: Zhang, H., Zhao, C., Chen, A., Zhao, X., and Zhou, Y.: Shortwave cloud warming effect observed over Greenland, EGU General Assembly 2024, Vienna, Austria, 14–19 Apr 2024, EGU24-1678, https://doi.org/10.5194/egusphere-egu24-1678, 2024.

EGU24-1691 | ECS | Posters on site | AS1.13

The vertical structure of atmospheric rivers in Antarctica in the present-day and future 

Marlen Kolbe, Richard Bintanja, Eveline C. van der Linden, and Raul R. Cordero

Recent extremes in Antarctic temperature, surface melt and sea ice loss have been robustly linked to the occurrence of atmospheric rivers (ARs). However, the precise mechanisms that generate variations in the surface impacts of ARs are poorly understood, especially in the Antarctic region. Based on Arctic evidence that the vertical and horizontal advancement of ARs over sea ice strongly depends on the sea ice-preceding surface type, the season, as well as meteorological conditions, we investigate the vertical structure and propagation of extreme ARs reaching sea ice and the Antarctic ice sheet, and further quantify the associated surface impacts. We further link the wind speed and surface vertical structure and proximity of ARs to variations in turbulent mixing and radiative fluxes, which ultimately determine the impact on the surface and subsequent AR pathway. While previous studies have mostly detected ARs based on  observations and reanalyses, we additionally assess AR characteristics based on 6 CMIP6 models under present-day and future conditions (SSP5-8.5) to robustly study their propagation and impacts when reaching Antarctic sea ice and the ice sheet. 

How to cite: Kolbe, M., Bintanja, R., van der Linden, E. C., and Cordero, R. R.: The vertical structure of atmospheric rivers in Antarctica in the present-day and future, EGU General Assembly 2024, Vienna, Austria, 14–19 Apr 2024, EGU24-1691, https://doi.org/10.5194/egusphere-egu24-1691, 2024.

EGU24-3671 | ECS | Orals | AS1.13 | Highlight

Antarctic Atmospheric Rivers in Present and Future Climates 

Michelle Maclennan, Andrew Winters, Christine Shields, Léonard Barthelemy, Rudradutt Thaker, and Jonathan Wille

Atmospheric rivers (ARs) are long, narrow bands of moisture that propagate poleward from the midlatitudes and occasionally reach the Antarctic Ice Sheet. Despite occurring only ~1% of the time, Antarctic ARs contribute 10% of the annual precipitation and are major drivers for heatwaves, foehn events, and surface melting on ice shelves. While snowfall is currently the dominant impact of ARs over the grounded Antarctic Ice Sheet, the relative contribution of ARs to snowfall, rainfall, and surface melt may change in a warming climate, along with the frequency and intensity of AR events themselves. Here, we use the Community Earth System Model version 2 (CESM2) Large Ensemble to detect ARs during the current period (1980–2014) and future climate (2015–2100) under the SSP370 radiative forcing scenario. We use an AR detection threshold for the current period based on the 98th percentile of the meridional component of integrated vapor transport (vIVT). To account for projected future increases in atmospheric moisture content (Clausius-Clapeyron effect) and its impacts on vIVT, we scale our AR detection threshold for the future period by the relative change in integrated water vapor compared to the present-day climatology. We then describe how the frequency, intensity, and year-to-year variability in Antarctic ARs changes by the end of the 21st century by region, with links to changes in the large-scale atmospheric circulation accompanying ARs. Finally, we quantify AR-attributed precipitation, precipitation variability, and trends in the future climate, ultimately providing an early assessment of future AR-driven changes to Antarctic surface mass balance.

How to cite: Maclennan, M., Winters, A., Shields, C., Barthelemy, L., Thaker, R., and Wille, J.: Antarctic Atmospheric Rivers in Present and Future Climates, EGU General Assembly 2024, Vienna, Austria, 14–19 Apr 2024, EGU24-3671, https://doi.org/10.5194/egusphere-egu24-3671, 2024.

EGU24-4327 | ECS | Orals | AS1.13 | Highlight

Ground-based Remote Sensing of Aerosol, Clouds, Dynamics, and Precipitation in Antarctica - First results from a one-year campaign at Neumayer Station III in 2023 

Martin Radenz, Ronny Engelmann, Silvia Henning, Holger Schmithüsen, Holger Baars, Markus M. Frey, Rolf Weller, Johannes Bühl, Cristofer Jimenez, Johanna Roschke, Lukas Muser, Nellie Wullenweber, Sebastian Zeppenfeld, Hannes Griesche, Ulla Wandinger, and Patric Seifert

Novel ground-based remote sensing observations of aerosols and clouds have been carried out in Antarctica at the German Neumayer Station III (70.67°S, 8.27°W) for a whole year. The deployment of the mobile exploratory platform OCEANET-Atmosphere brought full ACTRIS aerosol and cloud profiling capabilities next to meteorological, radiation, and air chemistry in-situ observations at the Antarctic station. Neumayer III is currently the only station on a floating ice shelf that is manned throughout the year, providing excellent conditions for studying atmospheric effects on the Antarctic ice shelf.

For that deployment the standard instrumentation of OCEANET-Atmosphere (PollyXT Raman polarization Lidar, a HATPRO microwave Radiometer, a Cimel sun and lunar photometer, and Radiation sensors) was extended by a Mira-35 cloud radar, a scanning LITRA-S Doppler lidar and a Parsivel² optical disdrometer. Together, these instruments brought the full ACTRIS aerosol and cloud profiling capabilities to a region where sophisticated ground-based observations were not available. The synergy of the different instruments allows for detailed retrievals of aerosol and cloud properties, such as cloud-relevant aerosol properties, liquid droplet properties and ice crystal concentrations.

While data analysis is ongoing, three scientific highlights have already been identified during austral fall and winter, namely:

  • Observations of a persistent shallow mixed-phase cloud embedded in a plume of advected marine aerosol. State of the art microphysical retrievals are used to obtain aerosol and cloud microphysical properties. Closure between cloud-relevant aerosol particles and precipitating ice crystals was achieved, demonstrating that the cloud formed in an aerosol-limited environment.
  • Two extraordinary warm air intrusions: One with intense snowfall produced the equivalent of 10% of the yearly snow accumulation, a second one with record high temperatures and heavy icing due to supercooled drizzle.
  • Omnipresent aerosol layers in the stratosphere, contributing almost 50% to the aerosol optical depth of around 0.06 at 500nm. Lidar-derived optical signatures revealed sulphate aerosol in the stratosphere - most likely linked to the Hunga Tonga eruption in 2022.

We will present an overview of the campaign, the three highlights and provide an outlook on potential future usage of the dataset.

How to cite: Radenz, M., Engelmann, R., Henning, S., Schmithüsen, H., Baars, H., Frey, M. M., Weller, R., Bühl, J., Jimenez, C., Roschke, J., Muser, L., Wullenweber, N., Zeppenfeld, S., Griesche, H., Wandinger, U., and Seifert, P.: Ground-based Remote Sensing of Aerosol, Clouds, Dynamics, and Precipitation in Antarctica - First results from a one-year campaign at Neumayer Station III in 2023, EGU General Assembly 2024, Vienna, Austria, 14–19 Apr 2024, EGU24-4327, https://doi.org/10.5194/egusphere-egu24-4327, 2024.

EGU24-4752 | ECS | Orals | AS1.13

Open Water in Sea Ice Causes High Bias in Polar Low-Level Clouds in GFDL CM4 

Xia Li, Zhihong Tan, Youtong Zheng, Mitchell Bushuk, and Leo Donner

Global climate models (GCMs) struggle to simulate polar clouds, especially low-level clouds that contain supercooled liquid and closely interact with both the underlying surface and large-scale atmosphere. Here we focus on GFDL's latest coupled GCM–CM4–and find that polar low-level clouds are biased high compared to observations. The CM4 bias is largely due to moisture fluxes that occur within partially ice-covered grid cells, which enhance low cloud formation in non-summer seasons. In simulations where these fluxes are suppressed, it is found that open water with an areal fraction less than 5% dominates the formation of low-level clouds and contributes to more than 50% of the total low-level cloud response to open water within sea ice. These findings emphasize the importance of accurately modeling open water processes (e.g., sea ice lead-atmosphere interactions) in the polar regions in GCMs.

How to cite: Li, X., Tan, Z., Zheng, Y., Bushuk, M., and Donner, L.: Open Water in Sea Ice Causes High Bias in Polar Low-Level Clouds in GFDL CM4, EGU General Assembly 2024, Vienna, Austria, 14–19 Apr 2024, EGU24-4752, https://doi.org/10.5194/egusphere-egu24-4752, 2024.

EGU24-5220 | ECS | Posters on site | AS1.13

Clouds and precipitation in the initial phase of marine cold air outbreaks as observed by airborne remote sensing 

Imke Schirmacher, Sabrina Schnitt, Marcus Klingebiel, Nina Maherndl, Benjamin Kirbus, and Susanne Crewell

During Arctic marine cold air outbreaks (MCAOs), cold and dry air flows from the central Arctic southward over the open ocean. There, cloud streets form that transform to cellular convection downstream under extreme surface heat fluxes. MCAOs strongly affect the Arctic water cycle through large-scale air mass transformations and can lead to extreme weather conditions at mid-latitudes. The description of air mass transformations is still challenging partly because previous observations do not resolve fine scales and lack information about cloud microphysical properties. Therefore, we focus on the crucial initial phase of development within the first 170 km over open water of two MCAO events with different strengths observed during the HALO-(AC)3campaign. Both times the POLAR 5 and 6 aircraft flew several legs along the same track perpendicular to the cloud streets crossing the sea ice edge several times to allow a quasi-Lagrangian perspective. Based on high-resolution remote sensing and in-situ measurements, the development of the boundary layer, formation of clouds, onset of precipitation, and riming are studied. We establish a novel approach based on radar reflectivity measurements only to detect roll circulation that forms cloud streets.

For the event with the stonger contrast between surface and 850 hPa potential temperature (MCAO index), cloud tops are higher, more liquid-topped clouds exist, the liquid layer at cloud top is wider, and the liquid water path, mean radar reflectivity, amount of rime mass, precipitation rate and occurrence are larger compared to the weaker event. However, the width of the roll circulation is similar for both MCAO events. All parameters, moreover, evolve with distance over open water, as the boundary layer deepens and cloud top heights rise. Cloud streets form after traveling 15 km over open water. After 20 km, cloud cover increases to just below 100 % and after around 30 km, precipitation forms. We find that maxima in the rime mass have the same horizontal scale as the roll circulation. The presentation will highlight how cloud macro- and microphysical parameters vary with distance over open water and explain the differences between both MCAO events.

How to cite: Schirmacher, I., Schnitt, S., Klingebiel, M., Maherndl, N., Kirbus, B., and Crewell, S.: Clouds and precipitation in the initial phase of marine cold air outbreaks as observed by airborne remote sensing, EGU General Assembly 2024, Vienna, Austria, 14–19 Apr 2024, EGU24-5220, https://doi.org/10.5194/egusphere-egu24-5220, 2024.

EGU24-6156 | ECS | Posters on site | AS1.13

Ice crystal numbers in Arctic clouds over sea ice and ocean: satellite retrievals and cloud-resolving modelling 

Iris Papakonstantinou Presvelou and Johannes Quaas

Mixed-phase and ice clouds are prominent parts of the Arctic climate system. In particular, boundary layer clouds and their interactions with local aerosols may play an important role in the amplified warming that has been observed in the Arctic during the recent years. These aerosols which are known as ice nucleating particles (INPs) are necessary for the heterogeneous ice formation in temperatures above -38oC. Several in-situ observations have measured a high number of effective ice nucleating particles, possibly related to biological activity in the open ocean. In contrast, in our previous study analyzing the novel active remote sensing dataset DARDAR-Nice for ten years in the Arctic region (Papakonstantinou-Presvelou et al., 2022), we found an increased ice number in low-level clouds over sea ice compared to the open ocean, suggesting other possible factors that might contribute to this difference. Here we perform several sensitivity experiments with the ICON model at kilometer-scale resolution in order to investigate the effect of these factors to the ice number, namely the contribution of local INPs, blowing snow and secondary ice production.

How to cite: Papakonstantinou Presvelou, I. and Quaas, J.: Ice crystal numbers in Arctic clouds over sea ice and ocean: satellite retrievals and cloud-resolving modelling, EGU General Assembly 2024, Vienna, Austria, 14–19 Apr 2024, EGU24-6156, https://doi.org/10.5194/egusphere-egu24-6156, 2024.

EGU24-6664 | Orals | AS1.13 | Highlight

Antarctic precipitation: distributed observations during the POPE and AWACA campaigns 

Alexis Berne and Alfonso Ferrrone

Although the deployment of ground-based remote sensing instruments has made possible significant progress, Antarctic precipitation remains poorly understood, in particular away from the scientific stations where most field campaigns have taken place in the past. The PEA Orographic Precipitation Experiment (POPE) campaign took place at the Princess Elisabeth Antarctica station (Queen Maud Land, East Antarctica) during the austral summer 2019-2020. In this framework, a transect of three Doppler vertically profiling precipitation radars (MRR-PRO) was deployed from 20 to 30 km away from the station, in complete autonomy in the complex terrain of the Sor Rondane Mountains. The measurements collected during this campaign highlighted the complex interactions between the terrain and a dry layer likely due to katabatic winds, modulating the occurrence of precipitation in the area.
This POPE campaign also served as a test of the idea of deploying complex instruments dedicated to cloud and precipitation monitoring in complete autonomy to access relevant information away from stations, in areas poorly covered so far. This is a strong motivation for the AWACA project (ERC Synergy), which aims to study the atmospheric branch of the water cycle over Antarctica. AWACA started in September 2021 with the design and construction of autonomous observation platform units (4 in total) sheltering various sensors: surface meteorology, isotopic composition of water vapor and precipitation, and remote sensing of clouds and precipitation. The main deployment along a 1100-km transect between the Dumont d'Urville station at the coast and the Concordia station on the inner Plateau, is scheduled for the austral summer 2024-2025.
In this presentation, I will summarize the main results about precipitation from the POPE campaign as well as the main objectives of the AWACA project.

How to cite: Berne, A. and Ferrrone, A.: Antarctic precipitation: distributed observations during the POPE and AWACA campaigns, EGU General Assembly 2024, Vienna, Austria, 14–19 Apr 2024, EGU24-6664, https://doi.org/10.5194/egusphere-egu24-6664, 2024.

EGU24-8702 | ECS | Posters on site | AS1.13

Assessing the Performance of the Weather Research and Forecasting (WRF) Model in Simulating Atmospheric In-Cloud Icing Over Fagernesfjellet, Norway 

Pravin Punde, Yngve Birkelund, Muhammad Virk, and Xingbo Han

Atmospheric icing ensues when water droplets in the atmosphere freeze upon interacting with diverse objects, presenting substantial hazards to infrastructure and leading to disruptions in both road and air traffic. 

This study introduces a detailed analysis of in-cloud icing conducted specifically over Fagernesfjellet, Norway. Utilizing the Weather Research and Forecasting (WRF) model, ERA-5 data was employed for both initial and lateral boundary conditions. The simulation covers a three-month period from October 1, 2022, to December 31, 2022, with a grid spacing of 9,3,1 km.

Acknowledging the substantial influence of local terrain on icing conditions, the analysis prioritizes the highest model resolution. The determination of the icing load involves the utilization of a Makkonen ice accretion model, and the resultant values, alongside surface parameters, undergo validation against field measurements taken at Fagernesfjellet, Norway. The representation of supercooled liquid water (SLW) in numerical weather prediction (NWP) models is crucial for precise atmospheric icing forecasts. Hence, we conduct a comprehensive evaluation of the Thompson scheme's performance in simulating liquid water content (LWC) and, consequently, the icing load, along with general weather parameters associated with icing.

From our preliminary analysis, the WRF model showcases effectiveness in simulating in-cloud icing conditions. WRF adeptly reproduces crucial surface parameters such as temperature, pressure, relative humidity, wind speed, and direction. Nevertheless, there are discernible differences between the observed data and WRF results, particularly noticeable in the case of wind speed and direction.

How to cite: Punde, P., Birkelund, Y., Virk, M., and Han, X.: Assessing the Performance of the Weather Research and Forecasting (WRF) Model in Simulating Atmospheric In-Cloud Icing Over Fagernesfjellet, Norway, EGU General Assembly 2024, Vienna, Austria, 14–19 Apr 2024, EGU24-8702, https://doi.org/10.5194/egusphere-egu24-8702, 2024.

EGU24-9122 | Posters on site | AS1.13

Microphysical cloud properties in the initial phase of Arctic cold air outbreaks 

Marcus Klingebiel, Evelyn Jäkel, Michael Schäfer, André Ehrlich, and Manfred Wendisch

Cloud streets are a common feature of cold air outbreaks in the Arctic region. These are long, parallel bands of cumulus clouds that form perpendicular to the wind direction. They are caused by the interaction between the cold air mass and the warm ocean surface. Within the framework of (AC)³, the HALO-(AC)³ campaign was performed in spring 2022 involving several research aircraft to study cold air outbreaks and their belonging cloud streets. In this study we use a spectral imaging instrument, called AISA Hawk, to retrieve cloud microphysical properties in the very initial phase of these cloud streets and therefore focus on their development over the leads in the marginal sea ice zone. 

How to cite: Klingebiel, M., Jäkel, E., Schäfer, M., Ehrlich, A., and Wendisch, M.: Microphysical cloud properties in the initial phase of Arctic cold air outbreaks, EGU General Assembly 2024, Vienna, Austria, 14–19 Apr 2024, EGU24-9122, https://doi.org/10.5194/egusphere-egu24-9122, 2024.

A fundamental divide exists between previous studies which conclude that polar amplification does not occur without sea ice and studies which find that polar amplification is an inherent feature of the atmosphere independent of sea ice. We hypothesise that a representation of climatological ocean heat transport is key for simulating polar amplification in ice-free climates. To investigate this we run a suite of targeted experiments in the slab ocean aquaplanet configuration of CESM2-CAM6 with different profiles of prescribed ocean heat transport, which are invariant under CO2 quadrupling. In simulations without climatological ocean heat transport, polar amplification does not occur. In contrast, in simulations with climatological ocean heat transport, robust polar amplification occurs in all seasons. What is causing this dependence of polar amplification on ocean heat transport? Energy-balance model theory is incapable of explaining our results and in fact would predict that introducing ocean heat transport leads to less polar amplification. We instead demonstrate that shortwave cloud radiative feedbacks can explain the divergent polar climate responses simulated by CESM2-CAM6. Targeted cloud locking experiments in the zero ocean heat transport simulations are able to reproduce the polar amplification of the climatological ocean heat transport simulations, solely by prescribing high latitude cloud radiative feedbacks. We conclude that polar amplification in ice-free climates is underpinned by ocean-atmosphere coupling, through a less negative high latitude shortwave cloud radiative feedback that facilitates enhanced polar warming. In addition to reconciling previous disparities, these results have important implications for interpreting past equable climates and climate projections under high emissions scenarios.

How to cite: England, M. and Feldl, N.: Robust polar amplification in ice-free climates relies on ocean heat transport and cloud radiative effects , EGU General Assembly 2024, Vienna, Austria, 14–19 Apr 2024, EGU24-9946, https://doi.org/10.5194/egusphere-egu24-9946, 2024.

EGU24-10621 | ECS | Orals | AS1.13 | Highlight

Arctic Warm and Moist Air Intrusions in ICON Simulations 

Jan Landwehrs, Sofie Tiedeck, Sonja Murto, and Annette Rinke

Warm and moist air intrusions (WAI) contribute strongly to extreme warm events in the central Arctic and deliver a major part of the moisture transport into this region, with significant impacts on cloud formation and the surface energy balance. Within the PolarRES EU-project we use the ICON model to study such events both in case studies for the MOSAiC expedition and climate simulations.

MOSAiC provided comprehensive observations of two WAIs in mid-April 2020 when near-surface air temperatures reached the melting point for the first time in this spring. We evaluate different ICON-LAM set-ups, including a pan-Arctic domain with 11km horizontal resolution, as well as more confined domains at convection-permitting 2.5km resolution with varying cloud microphysics settings. A better agreement with local observations is found on the smaller model domains at higher resolution. Additionally, the representation of liquid water is improved by using a more complex two-moment cloud microphysics scheme, where a scenario with higher CCN (cloud condensation nuclei) concentration is found to be more suitable for the aerosol-rich intrusion around April 16.

In a climatological perspective we demonstrate the tracking of moisture intrusion events in decadal-scale climate simulations with ICON-LAM at 11km resolution in a pan-Arctic domain. We drive the regional model with ERA5 and selected CMIP6 GCMs to obtain vertically integrated water vapor transport at high spatial and temporal resolution. This is then used to identify, track and classify WAIs, to study their climatological characteristics, impacts and long-term trends under climate change.

How to cite: Landwehrs, J., Tiedeck, S., Murto, S., and Rinke, A.: Arctic Warm and Moist Air Intrusions in ICON Simulations, EGU General Assembly 2024, Vienna, Austria, 14–19 Apr 2024, EGU24-10621, https://doi.org/10.5194/egusphere-egu24-10621, 2024.

EGU24-11947 | ECS | Orals | AS1.13

Boundary-layer cloud modeling challenges on the North Slope of Alaska 

Kyle Fitch, Zachary Cleveland, McKenna Stanford, and Lindsay Dedrickson

The accurate modeling and prediction of cloud base heights is critical for energy balance calculations and aviation operations, alike. Low-level (i.e., boundary-layer) Arctic clouds can be difficult to model, making prediction of formation and dissipation challenging. Primarily mixed-phase, these clouds typically contain low quantities of supercooled liquid water and often slowly precipitate relatively small amounts of moderately and heavily rimed snow particles. While this appears to be the predominant cloudy state on the North Slope of Alaska (NSA), the delicate balance of microphysical, dynamical, radiative, surface coupling, and advective processes can rapidly shift to heavy snow (with various degrees of riming) or to a complete dissipation of the cloud layer without any precipitation, depending on the dominant processes. Here we strive to disentangle these various processes. First, we compare the predictive performances of four different numerical weather models in forecasting the presence and base-heights of low-level clouds: the High-Resolution Rapid Refresh - Alaska (HRRR-AK) model, the Polar Weather Research and Forecasting (Polar WRF) model, the Unified Model (UM), and the European Centre for Medium-range Weather Forecasting (ECMWF) model.  Initial results comparing model output at two U.S. Department of Energy Atmospheric Radiation Measurement (AMT) NSA sites, during the fall season in 2019 and 2022, show that the UM slightly outperforms the HRRR-AK in terms of accurately forecasting the presence of a low-level cloud layer (89% of the time). All models have a significant bias of 300 to 800 meters in forecasting cloud base height (lower than is observed); however, the UM and ECMWF models have the lowest biases. Finally, a case study for a particularly challenging April 2017 thin-cloud event is presented, wherein we compare the performance of four different bulk microphysical parameterization schemes using a higher-resolution large eddy simulation (LES) model, the WRF-LES. Initial results show that the Thompson scheme was the only one able to reproduce and sustain a substantial supercooled liquid layer, but it was unable to reproduce the transition from a deep, liquid-rich cloud to a thin layer with moderately and heavily rimed precipitation. This is the first step in linking simulated LES-scale riming processes with those parameterized at a coarser mesoscale model scale. This has important implications for forecasting low-level clouds in an operational environment, given the efficiency of the riming process.

How to cite: Fitch, K., Cleveland, Z., Stanford, M., and Dedrickson, L.: Boundary-layer cloud modeling challenges on the North Slope of Alaska, EGU General Assembly 2024, Vienna, Austria, 14–19 Apr 2024, EGU24-11947, https://doi.org/10.5194/egusphere-egu24-11947, 2024.

EGU24-13193 | Posters on site | AS1.13

Atmospheric Rivers vis-à-vis the Summer Seasonal Cycle and Regional Greenland Surface Melt 

William Neff, Christopher Cox, Mathew Shupe, and Michael Gallagher

Recent analysis [Mattingly et al., 2023] suggests that Atmospheric Rivers (ARs) in combination with planetary scale dynamics and coupled orographic processes (e.g., foehn effect), could lead to enhanced melting in northeast Greenland and could, in turn, be linked to increasing mass loss from outflow glaciers there [Khan et al., 2022]. The importance of large-scale dynamics, which is supported by other studies too (e.g., Neff et al., 2014), led us to examine more generally the patterns of summer melt over the whole of Greenland as influenced by factors such as the seasonal cycle, the frequency of ARs, and general synoptic influences.

Our AR detection method used ERA-5 reanalysis daily data at 65oN, 55oE and 850 hPa from 2000 through 2022, JJA, and for wind directions between 112.5o and 225.0o.  We carried out linear analysis correlation between integrated water vapor, IWV; tropospheric temperature, T850 hPa; tropospheric wind speed, WS 850 hPa; and melt fraction (MF) in an area over the southwest coast near where the typical AR track first encounters the ice sheet between 62-67oN and 50-47o E.  We found high correlation between high IWV and temperature; good correlation between IWV, coastal MF and T850 hPa; and  weak dependence of MF on southerly wind speed.

A consideration in quantifying the effects of ARs on total surface melt is the fact that their influence can extend over multi-day periods. The effect continues along the west coast after the warm front has passed over the ice sheet at the end of the AR life cycle when residual moist, warm air remains trapped in the downstream low along the 3-km high ice sheet, affecting surface energy budgets and where smaller less-ordered mesoscale circulations remain. In addition, because the initial northward transport occurs in concert with a strong ridge centered just east of the center of the ice sheet.  In our analysis we will show results associated with four melt areas: 1) near coastal to the west, 2) over the lower accumulation region such as in the area of the old Dye-2 radar site, 3) at the Summit of Greenland where melt is historically low but of increasing frequency of late, and 4) in the far northeast which was of interest in Mattingly et al. (2023). ARs directly affect the southwest ice sheet and their frequency can modulate MF near the shoulder seasons. Secondary effects along the east coast as the ridge passes, which may include subsidence (Mattingly et al. 2023), are weak but detectable. The frequency of ARs is less influential in the southwest in mid-summer when mean temperatures are warmer throughout the region. Melting in the northeast is only weakly related to ARs and generally follows to the seasonal cycle of warming.


Neff, W., et al. (2014, JGR, doi:10.1002/2014JD021470).

Khan, S. A., et al. (2022), E, Nature, doi:10.1038/s41586-022-05301-z.

Mattingly, K. S.,  et al.(2023), , Nature Communications, 14(1), 1743, doi:10.1038/s41467-023-37434-8.

How to cite: Neff, W., Cox, C., Shupe, M., and Gallagher, M.: Atmospheric Rivers vis-à-vis the Summer Seasonal Cycle and Regional Greenland Surface Melt, EGU General Assembly 2024, Vienna, Austria, 14–19 Apr 2024, EGU24-13193, https://doi.org/10.5194/egusphere-egu24-13193, 2024.

EGU24-13345 | ECS | Posters on site | AS1.13 | Highlight

Precipitation in the Arctic and Southern Ocean: new insights from aircraft and ship-borne measurements 

Larry Ger Aragon, Yi Huang, Peter May, Jonathan Crosier, Paul Connolly, Estefania Montoya Duque, and Keith Bower

Precipitation is an important component of the hydrologic cycle and sea ice mass balance in polar regions. However, precipitation products in high latitudes constitute the highest uncertainties among satellite retrievals and numerical models. These uncertainties arise from limited in-situ observations of high-latitude precipitation and the fundamental differences between the Arctic and Southern Ocean/Antarctic environments that complicate the key precipitation properties and associated processes. To help address this knowledge gap, this study uses recent aircraft and ship-borne measurements to understand better the microphysical properties of precipitation over the Arctic and Southern Ocean/Antarctic regions. For the Arctic case, select summertime precipitation events are examined using aircraft measurements from precipitation imaging probes. We present the microphysical properties of Arctic precipitation in terms of the dominant ice precipitation type, particle size distributions, and important bulk properties. For the Southern Ocean/Antarctic case, we use recent measurements from ship-borne disdrometer and dual-polarimetric radar and present the distinctive polarimetric signatures and surface precipitation properties of seven synoptic types across the Southern Ocean. We also demonstrate an improved radar rainfall retrieval algorithm for the region, considering the dominance of small raindrop sizes of less than one millimeter in Southern Ocean rainfall. This research is leading toward more accurate, high-resolution estimates of precipitation properties in high-latitude regions, crucial in advancing the understanding of a range of climatological and meteorological processes as well as in evaluations of weather and climate models.

How to cite: Aragon, L. G., Huang, Y., May, P., Crosier, J., Connolly, P., Montoya Duque, E., and Bower, K.: Precipitation in the Arctic and Southern Ocean: new insights from aircraft and ship-borne measurements, EGU General Assembly 2024, Vienna, Austria, 14–19 Apr 2024, EGU24-13345, https://doi.org/10.5194/egusphere-egu24-13345, 2024.

EGU24-14866 | Orals | AS1.13

Coordinated observations of the water cycle of marine cold-air outbreaks in the European Arctic during the ISLAS 2022 field campaign 

Harald Sodemann, Iris Thurnherr, Andrew Seidl, Alena Dekhtyareva, Aina Johannessen, Marvin Kähnert, Mari B. Steinslid, Sander Løklingholm, Lars R. Hole, Paul Voss, Lukas Papritz, Marina Dütsch, Robert O. David, Tim Carlsen, David M. Chandler, Patrick Chazette, Julien Totems, Alfons Schwarzenboeck, Franziska Hellmuth, and Julien Delanoe and the ISLAS2022 Team

Marine cold-air outbreaks (mCAOs) are a characteristic type of high-impact weather in the European Arctic and are characterized by an intense water cycle where polar cloud processes play an important role. Model simulations and weather forecasts of mCAO events are challenging and associated with poor predictability. One reason is that processes related to the water cycle interact with one another on a wide range of scales. In regional models, some of these processes are resolved and others are fully or partly parameterised. To test and improve numerical weather prediction models, additional observations and novel types of measurements of water vapour are highly demanded. Stable water isotopes are an increasingly available measurement, allowing to trace sub-grid scale processes, and providing the potential to constrain the mass budget of the atmospheric water cycle during mCAO events. During the ISLAS2022 field experiment (21 March to 10 April 2022), the stable isotope composition of water vapour and liquid samples, cloud structures, and other meteorological parameters were collected between Svalbard and Northern Scandinavia on various measurement platforms. Airborne survey flights to Svalbard provided the ocean evaporation signature and subsequent processing of water vapour during mCAO conditions. During a number of flights, mCAO airmasses were repeatedly sampled over a course of hours to days, allowing to characterize their thermodynamic evolution as clouds were first forming, then glaciating and precipitating. In addition, vapour isotope and sea water isotope measurements were taken continuously onboard R/V Helmer Hanssen between Tromsø and the Greenland west coast. Finally, coordinated land-based measurement activity over Northern Norway and Sweden allowed collection of precipitation samples, thus closing the mass budget of the mCAO events. Furthermore, using buoyancy-controlled meteorological balloons launched from Ny Ålesund, we additionally obtained continuous in-situ measurements of the boundary-layer evolution during the mCAO. We provide an overview over the airborne and ground-based measurement activities during the campaign and provide several examples to highlight the potential of the stable water isotope measurements to constrain the water budget of mCAOs in conjunction with traditional meteorological observations.

How to cite: Sodemann, H., Thurnherr, I., Seidl, A., Dekhtyareva, A., Johannessen, A., Kähnert, M., Steinslid, M. B., Løklingholm, S., Hole, L. R., Voss, P., Papritz, L., Dütsch, M., David, R. O., Carlsen, T., Chandler, D. M., Chazette, P., Totems, J., Schwarzenboeck, A., Hellmuth, F., and Delanoe, J. and the ISLAS2022 Team: Coordinated observations of the water cycle of marine cold-air outbreaks in the European Arctic during the ISLAS 2022 field campaign, EGU General Assembly 2024, Vienna, Austria, 14–19 Apr 2024, EGU24-14866, https://doi.org/10.5194/egusphere-egu24-14866, 2024.

EGU24-14968 | ECS | Orals | AS1.13

Insights into cloud biases over high-latitude oceans from a cloud-controlling factor framework 

Joaquin Blanco, Rodrigo Caballero, Steven Sherwood, and Lisa Alexander

A long-standing and pervasive problem within the modelling community is the proper representation of cloud albedo over the Southern Hemisphere (SH) oceanic region. Errors persist despite the extensive evidence that these are related to the unique microphysical characteristics of the austral clouds. In this study we investigate additional causes of cloud albedo biases over the 50˚–65˚ oceanic band using CMIP6 simulations and a cloud-controlling factor (CCF) approach on daily timescales. We gain further insight by replicating our method over the equivalent oceanic region in the Northern Hemisphere (NH).

Cloud albedo, computed from upwelling and downwelling shortwave radiation at surface and top of the atmosphere, is averaged into bins of vertical velocity, surface wind, and sea-surface temperature. The performance of fifteen models in both atmospheric-only and ocean-coupled configurations is evaluated against CERES satellite retrievals in combination with ERA5 reanalysis for the 2000–2014 period.

When averaging cloud albedo by vertical velocity bins, we find that shallow boundary-layer (deep convective) clouds are consistently underpredicted (overpredicted) over the high-latitude oceans of the SH. We repeat the method for the 50˚–65˚ band in the North Atlantic and Pacific oceans and find that similar compensating errors exist.

Another important result is that the SH cloud biases occur for sea-surface temperatures below 4°C. We show that a connection exists between this empirical finding and the biases as determined from microphysical effects, i.e.: a deficit of cloud albedo is due to models producing glaciated rather than supercooled liquid water clouds. Our CCF method allow us to see that in such cases, models tend to simulate NH clouds for the SH.

We also find that the positive sign of the cloud albedo hemispheric asymmetry (SH-NH difference over the 50°–65° band) is consistently predicted by nearly all models, many of which also predict a similar magnitude to observations. However, this is a consequence of compensating errors as individually most models tend to either overpredict or underpredict cloud albedo in both hemispheres.

How to cite: Blanco, J., Caballero, R., Sherwood, S., and Alexander, L.: Insights into cloud biases over high-latitude oceans from a cloud-controlling factor framework, EGU General Assembly 2024, Vienna, Austria, 14–19 Apr 2024, EGU24-14968, https://doi.org/10.5194/egusphere-egu24-14968, 2024.

Cold air outbreaks (CAOs) are a key component of the Arctic climate system, featuring intense convective cloud fields embedded in cold, dry air masses over relatively warm surfaces. Large-Eddy Simulation (LES) is a technique often used to investigate CAOs at high spatial and temporal resolutions, resolving the intricate processes involved and providing a wealth of virtual data. A complication with LES studies of CAOs is the typical absence of suitable observational data to fully constrain the simulations, and thus anchor them in reality. This study aims to use observational data from the recent airborn HALO-(AC)³ campaign in the Atlantic sector of the Arctic to drive LES experiments exclusively with observations. To this purpose data from Research Flights 10 and 11 are used, which probed a weak CAO in the Fram Strait on 29 and 30 March 2022. A Lagrangian model framework is adopted, making use of observations along the two-day low-level trajectory that stretched from close to the North Pole to the sea-ice free area Southwest of Svalbard. HALO observations are integrated into the reanalysis-based model forcing in an incremental way, yielding a suite of forcing datasets. These observational data consist of vertical soundings of thermodynamic state, pressure gradients, mesoscale divergence and advective tendencies, as
well as surface properties to act as boundary conditions. The LES code incorporates advanced representations for mixed-phase microphysical processes and radiative transfer, to allow a realistic representation of clouds and turbulence in the transforming low-level airmass. LES results obtained with
this setup are evaluated against independent HALO datasets on clouds and other boundary-layer properties. Inter-comparing the suite of LES runs with different forcing datasets elucidates the impacts of individual forcing components on the air mass transition and associated cloud evolution. 

How to cite: Paulus, F. and Neggers, R.: Studying Cloud Transformations in Cold Air Outbreaks using Large-Eddy Simulations Exclusively Driven by HALO-(AC)³ Campaign Data, EGU General Assembly 2024, Vienna, Austria, 14–19 Apr 2024, EGU24-15625, https://doi.org/10.5194/egusphere-egu24-15625, 2024.

EGU24-16011 | ECS | Posters on site | AS1.13

Differential absorption G-band radar for Arctic clouds and water vapor observations 

Sabrina Schnitt, Mario Mech, Jens Goliasch, Davide Ori, Thomas Rose, and Susanne Crewell

The Arctic climate is changing at fast pace. The contribution of low-level clouds to Arctic amplification feedback processes remains challenging to quantify as model evaluation requires continuous, high-quality observations in a demanding environment. Advancing the understanding of governing processes in mixed-phase clouds, ubiquitous in the Arctic, calls for temporally high-resolved measurements of cloud and precipitation microphysical properties as well simultaneous quantification of water vapor amount and profiles in all-weather conditions.

We present the novel and worldwide unique G-band Radar for Water vapor profiling and Arctic Clouds (GRaWAC) system, suitable to deliver these measurements. GRaWAC is a FMCW G-band radar with Doppler-resolving capabilities and simultaneous dual-frequency operation at 167 and 175GHz. The Differential Absorption Radar technique is applied to the measurements to derive temporally continuous water vapor profiles in cloudy and precipitating conditions, which closes a current gap in observational state-of-the-art instrumentation.

We reveal first measurements from a mid-latitudinal ground site and airborne test flights to illustrate GraWAC’s potential for water vapor, cloud and precipitation profiling. Based on instrument simulations, we outline the benefits of such observations at an Arctic ground-based supersite, such as AWIPEV station, Ny-Alesund, Spitsbergen. There, the G-band radar measurements will be embedded in a synergy of remote sensing instruments, including an operational microwave radiometer and a Ka- and W-band cloud radar, respectively. We highlight future applications of these synergistic measurements, and therein especially the multi-frequency radar space, for model evaluation studies targeting an improved representation of mixed-phase clouds in the Arctic.

How to cite: Schnitt, S., Mech, M., Goliasch, J., Ori, D., Rose, T., and Crewell, S.: Differential absorption G-band radar for Arctic clouds and water vapor observations, EGU General Assembly 2024, Vienna, Austria, 14–19 Apr 2024, EGU24-16011, https://doi.org/10.5194/egusphere-egu24-16011, 2024.

EGU24-16088 | ECS | Orals | AS1.13 | Highlight

Investigating potential sources of Ice Nucleating Particles around the Antarctic peninsula 

Floortje van den Heuvel, Mark Tarn, Benjamin Murray, and Thomas Lachlan-Cope

Clouds are a major source of uncertainty in climate model projections, especially in the Southern Ocean where the large model biases in short and long wave radiative fluxes affect the model representation of sea surface temperatures, sea ice and ultimately large scale circulation in the Southern Hemisphere. Evidence suggests that the poor representation of mixed phase clouds and the role of Ice Nucleating Particles (INPs) in these clouds are likely to be responsible for the model biases in this region. To understand how clouds will respond in a future climate we need to both better understand the effects and sources of INPs in the present, and attempt to anticipate the importance of new sources of INPs which could be revealed in a warming climate and by a reduction in glacial coverage.

In order to achieve this, we have dispersed samples of dusts from the Antarctic peninsula and James Ross Island in the Leeds aerosol chamber to characterise the size-resolved ice-nucleating activity of Southern high latitude dusts and to determine the heat lability of the INPs as a potential indicator for biogenic ice nucleators. We’ve also created suspensions from a number of Antarctic mosses and lichen to measure the ice-nucleating activity of these potential sources of INPs. Preliminary results indicate that the collected dusts nucleated ice at temperatures between -18 ºC and -14 ºC while mosses and lichen nucleated ice at temperatures ranging from -18 ºC to -6 ºC, depending on the source. Future work will include a comparison with ambient air filter samples collected around Rothera (Antarctic peninsula) and in the Arctic.

How to cite: van den Heuvel, F., Tarn, M., Murray, B., and Lachlan-Cope, T.: Investigating potential sources of Ice Nucleating Particles around the Antarctic peninsula, EGU General Assembly 2024, Vienna, Austria, 14–19 Apr 2024, EGU24-16088, https://doi.org/10.5194/egusphere-egu24-16088, 2024.

EGU24-16503 | ECS | Posters on site | AS1.13

Investigating Arctic Clouds and Water Vapor over Sea Ice: Airborne Passive Microwave Observations during HALO-(AC)3 

Nils Risse, Mario Mech, Catherine Prigent, and Susanne Crewell

Clouds and water vapor play a critical role in the water and energy balance of the Arctic. However, few field observations of these quantities over sea ice exist. Passive microwave observations provide high sensitivity to clouds and water vapor with high spatial and temporal coverage in polar regions. However, retrievals of atmospheric quantities from satellites and aircraft require a description of the variable sea ice emissivity, which depends on the properties of sea ice and snow. Recently, improved retrieval methods that derive sea ice and atmospheric properties simultaneously allowed for improved exploitation of the information from passive microwave observations.

This work presents liquid water path (LWP), ice water path (IWP), and integrated water vapor (IWV) retrieved from the HALO Microwave Package (HAMP) operated onboard the HALO aircraft during the HALO-(AC)3 field campaign in spring 2022 in the Fram Strait. The nadir-viewing HAMP measures along two water vapor bands (22.24 and 183.31 GHz), two oxygen bands (50-60 and 118.75 GHz), and the atmospheric windows at 31 and 90 GHz over different surface types. The retrieval accounts for variable surface emission through a joint surface-atmosphere optimal estimation scheme with the Passive and Active Microwave Radiative Transfer (PAMTRA) model.

The high spatial coverage of the HALO flights allows for assessing the spatial and temporal variability of the retrieved IWV, LWP, and IWP under various atmospheric and surface conditions. A particular focus lies on the warm air intrusion events and their related poleward changes in cloud properties and water vapor over sea ice that HALO captured. Furthermore, the hectometer-scale airborne observations allow statistical comparison with operational satellite products, reanalysis, and model simulations along the flight track. The HAMP observations will improve the characterization of clouds and water vapor in the Arctic and potentially improve the use of passive microwave satellite observations over sea ice.

How to cite: Risse, N., Mech, M., Prigent, C., and Crewell, S.: Investigating Arctic Clouds and Water Vapor over Sea Ice: Airborne Passive Microwave Observations during HALO-(AC)3, EGU General Assembly 2024, Vienna, Austria, 14–19 Apr 2024, EGU24-16503, https://doi.org/10.5194/egusphere-egu24-16503, 2024.

EGU24-17876 | Posters on site | AS1.13 | Highlight

How can the proposed  WIVERN satellite mission improve global snowfall measurements? 

Maximilian Maahn, Alessandro Battaglia, Anthony Illingworth, Pavlos Kollias, Stef Lhermitte, Filippo Emilio Scarsi, and Frederic Tridon

Snowfall is an important climate change indicator affecting surface albedo, glaciers, sea ice, freshwater storage, and cloud lifetime. Accurate snowfall measurements at high latitudes are particularly important for the mass balance of ice sheets and for sustaining healthy ecosystems, including fish and wildlife populations. Yet, snowfall remains a quantity which is hard to measure due to high spatial variability, the remoteness of polar regions and challenges associated with in situ measurements of snowfall. The recently decommissioned NASA CloudSat mission provided invaluable information about global snowfall climatology from 2006 to 2023. The CloudSat-based estimates of global snowfall are considered the reference for global snowfall estimates, but these data sets suffer from poor sampling and the inability to see shallow precipitation, which limits their use, for example, as input to surface mass balance models of the major ice sheets. WIVERN (WInd VElocity Radar Nephoscope) is one of the two remaining ESA Earth Explorer 11 candidate missions equipped with a conical scanning 94 GHz radar and a passive 94 GHz radiometer. The main objective of the mission is to measure global in-cloud winds using the Doppler effect, but can also quantify cloud ice water content and precipitation rate. 


This presentation discusses the potential of the WIVERN mission to provide improved estimates of global snowfall measurements. Compared to CloudSat, WIVERN's 800 km swath provides 70 times better coverage and its 42 degree angle of arrival significantly reduces the radar blind zone near the surface (especially over the ocean). In addition, WIVERN's radar is accompanied by a radiometer, which can further improve the estimation of snowfall rates. The improved sampling is demonstrated for specific regions ( Antarctica, Greenland) by computing the sampling error at different spatial and temporal scales via simulations of WIVERN vs. CloudSat orbits based on the snowfall rates produced by ERA5 reanalysis. Clutter and signal to clutter ratio simulations are performed for oceanic surfaces and orographic terrains by using a geometric–optics approach and the WIVERN illumination geometry.  Our results show that the WIVERN sampling strategy significantly reduces the uncertainty in polar snowfall estimates, making it a valuable product for climate model evaluation and as an input to surface mass balance models of the major ice sheets.

How to cite: Maahn, M., Battaglia, A., Illingworth, A., Kollias, P., Lhermitte, S., Scarsi, F. E., and Tridon, F.: How can the proposed  WIVERN satellite mission improve global snowfall measurements?, EGU General Assembly 2024, Vienna, Austria, 14–19 Apr 2024, EGU24-17876, https://doi.org/10.5194/egusphere-egu24-17876, 2024.

EGU24-18277 | ECS | Posters on site | AS1.13

Investigating the role of air mass history of Arctic black carbon in GCMs 

Roxana S. Cremer, Paul Kim, Sara M. Blichner, Emanuele Tovazzi, Ben Johnson, Zak Kipling, Thomas Kühn, Duncan Watson-Parris, David Neubauer, Phillip Stier, Alistair Sellar, Eemeli Holopainen, Ilona Riipinen, and Daniel G. Partridge

Black Carbon (BC) aerosols are known to be important for the Earth’s climate, yet their exact role to the changing of the Earth’s climate and Arctic amplification remains unclear. An accurate description of the BC life cycle in general circulation models (GCMs) can help reduce the uncertainties due to BC aerosols and specify BC's role in the Arctic.

In this study, several GCMs (ECHAM6.3-HAM2.3, ECHAM6.3-HAM2.3-P3, ECHAM6.3-HAM2.3-SALSA2 and UKESM1.0) are compared in terms of their representation of BC mass in the Arctic within the AeroCom project GCM Trajectory. A novel Lagrangian framework is employed to examine the history of air masses reaching the observational station Zeppelin, Svalbard. Therfore the removal processes were analysed along the trajectory and the GCMs compared with each other. The analysis emphasises the impact of remote emissions on local BC concentrations in the Arctic, indicating a longer BC lifetime compared to the global average. This underlines the importance of dry and wet scavenging parametrisations in the GCMs.


How to cite: Cremer, R. S., Kim, P., Blichner, S. M., Tovazzi, E., Johnson, B., Kipling, Z., Kühn, T., Watson-Parris, D., Neubauer, D., Stier, P., Sellar, A., Holopainen, E., Riipinen, I., and Partridge, D. G.: Investigating the role of air mass history of Arctic black carbon in GCMs, EGU General Assembly 2024, Vienna, Austria, 14–19 Apr 2024, EGU24-18277, https://doi.org/10.5194/egusphere-egu24-18277, 2024.

EGU24-18940 | Posters on site | AS1.13

Liquid water path derived from airborne observations over the sea-ice-free Arctic ocean 

Mario Mech, Maximilin Ringel, Nils Risse, and Susanne Crewell

Arctic Amplification is most evident in the rise of the near-surface air temperature observed in the last decades, which has been at least twice as strong as the global average. The mechanisms behind that are widely discussed. Many processes and feedback mechanisms still need to be better understood, especially those connected to clouds and their role in the water and energy cycle. Thereby, the cloud liquid water path (LWP) is an important cloud parameter, and it is important to know its occurrence and spatial variability. However, observing LWP is prone to high uncertainties, especially in the Arctic, leading to about a factor of two difference in satellite retrievals between microwave and near-infrared retrievals. Moreover, weather and climate models show significant differences in Arctic regions.

Within this contribution, we will present LWP observations over the sea-ice-free Arctic ocean from measurements conducted during four airborne campaigns conducted within the framework of the "Arctic Amplification: Climate relevant atmospheric and surface processes and feedback mechanisms (AC)3" during the last years over the Fram Strait West of Svalbard. The LWP has been derived by statistical retrieval approaches based on brightness temperature measurements of the Microwave Radar/radiometer for Arctic Clouds (MiRAC) operated onboard the Polar 5 research aircraft of the Alfred-Wegener Institute for Polar and Marine Research (AWI). The consistent LWP product has been used in a comparison study to validate satellite estimates from the Moderate Resolution Imaging Spectroradiometer (MODIS) and the Advanced Microwave Scanning Radiometer 2 (AMSR2) and the one from the ERA5 reanalyses. It could be seen that the various products reveal a characteristic shape of the LWP distribution, but their overall performance varies with season and synoptic situations, i.e., ERA5 does not produce larger LWP values and an over- or under-estimation for specific flights and too high LWP values for MODIS and too low for AMSR2 during cold air outbreak events.

How to cite: Mech, M., Ringel, M., Risse, N., and Crewell, S.: Liquid water path derived from airborne observations over the sea-ice-free Arctic ocean, EGU General Assembly 2024, Vienna, Austria, 14–19 Apr 2024, EGU24-18940, https://doi.org/10.5194/egusphere-egu24-18940, 2024.

EGU24-22016 | ECS | Posters virtual | AS1.13

Snowfall particle size distribution and precipitation observations in the Southern Ocean and coastal Antarctica 

Claudio Durán Alarcón, Irina Gorodetskaya, Diogo Luis, Alexis Berne, Michael Lehning, and Katherine Leonard

Snowfall is a key component to the Antarctic region, contributing significantly to the surface mass balance and influencing mean sea level changes. The intricate nature of ice particle microphysics, encompassing type, size, and structure, presents a great challenge in comprehending the processes of solid precipitation in Antarctica. The characteristics of individual ice crystals as they fall from clouds are crucial for understanding their formation and evolution along the vertical profile. Mechanisms such as aggregation, fragmentation, and riming play a pivotal role in accurately representing precipitation in numerical weather prediction models [1]. Despite their importance, the scarcity of observations for evaluating and validating these processes, particularly in the Southern Ocean and Antarctica, adds complexity. To address this gap, a comprehensive set of precipitation observations occurred during the Antarctic Circumnavigation Expedition (ACE) in the austral summer of 2016-2017 was carried out, utilizing diverse sensors aboard the research vessel Akademik Tryoshnikov. The observational toolkit included a snow particle counter (SPC), two total particle counters (Wenglors), vertical precipitation profiles from 24-GHz micro rain radar (MRR) observations, and manually collected Formvar samples. The Formvar technique, preserving ice particle shapes, offers insights into microphysical properties of ice crystals and snowflakes. SPC and Formvar were employed for particle size distribution (PSD) characterization and quantitative precipitation estimations (QPE) [2]. Precipitation was derived from MRR using the existing reflectivity (Ze)-snowfall (S) relationship for Antarctica [3,4,5]. During ACE, primary observations related to snowfall were near the coasts of the Antarctic Peninsula, Western Antarctica, and Adélie Land (Eastern Antarctica). In the last region, a large-scale event was observed by both the ACE expedition and a Multi-angle Snowflake Camera (MASC) at Dumont d’Urville station. Results showed good agreement between Formvar, SPC (size < 500µm), and MASC (size > 500µm) PSDs. Notably, the 20-µm resolution Formvar images exhibited significantly better performance for particles smaller than 500µm compared to MASC (35-µm resolution). Regarding QPE, all sources exhibited a large spread, particularly MRR estimations, sensitive to Ze-S relationship parameters. The use of PSD observations proved useful in making informed choices about these parameters. In monitoring snowfall precipitation, developing a multi-instrumental approach to overcome individual system limitations is crucial, reducing uncertainty.

References:

[1] Grazioli, J. et al. MASCDB, a database of images, descriptors and microphysical properties of individual snowflakes in free fall. Sci Data 9, 186 (2022).

[2] Sugiura, K. et al., Application of a snow particle counter to solid precipitation measurements under Arctic conditions. CRST, 58: 77-83, 2009.

[3] Grazioli, J. et al., Measurements of precipitation in Dumont d'Urville, Adélie Land, East Antarctica. TC 11, 1797–1811, 2017.

[4] Souverijns, N. et al., Estimating radar reflectivity – snowfall rate relationships and their uncertainties over Antarctica by combining disdrometer and radar observations. AR, 196: 211–223, 2017.

[5] M.S. Kulie and R. Bennartz, Utilizing Spaceborne Radars to Retrieve Dry Snowfall. JAMC, 48, 2564-2580.

Acknowledgements: PROPOLAR APMAR-2024, FCT ATLACE (CIRCNA/CAC/0273/2019) and ANR-APRES3. ACE was made possible by funding from the Swiss Polar Institute and Ferring Pharmaceuticals.

How to cite: Durán Alarcón, C., Gorodetskaya, I., Luis, D., Berne, A., Lehning, M., and Leonard, K.: Snowfall particle size distribution and precipitation observations in the Southern Ocean and coastal Antarctica, EGU General Assembly 2024, Vienna, Austria, 14–19 Apr 2024, EGU24-22016, https://doi.org/10.5194/egusphere-egu24-22016, 2024.

EGU24-529 | ECS | Posters on site | NH1.5

The Attachment Process of Negative Connecting Leader to the Lateral Surface of Downward Positive Leader in a +CG Lightning Flash 

Qi Qi, Bin Wu, Weitao Lyu, Ying Ma, Lyuwen Chen, Fanchao Lyu, and Yan Gao

In the lightning attachment process, the leader connecting behavior is an interesting topic. In the attachment process of a negative cloud-to-ground lightning flash, the “Tip to the lateral surface” connection type has been widely observed, and researchers have carried out a series of studies and discussions on the characteristics and the physical mechanisms of the leader connecting behavior. However, is there also a “Tip to the lateral surface” connecting behavior in the attachment process of the positive cloud-to-ground lightning flash? In this study, using high-speed video cameras operating with framing rates of 20 and 50 kiloframes per second, we captured an attachment process during a positive cloud-to-ground flash, which demonstrates the connection of the negative connecting leader (NCL) to the lateral surface of the downward positive leader (DPL) for the first time. When the NCL was initiated, the tip of the DPL had passed the initiation position of the NCL for about 50 m. A common streamer zone (CSZ) was observed when the three-dimensional distance between the NCL tip and the lateral surface of DPL was about 30 m. It is remarkable to note that a luminous segment (space stem/leader) with a length of about 7 m was captured within the CSZ during the attachment process. The connection between the NCL tip and the lateral surface of the DPL was caused by the development of the CSZ and its inner space leader.

How to cite: Qi, Q., Wu, B., Lyu, W., Ma, Y., Chen, L., Lyu, F., and Gao, Y.: The Attachment Process of Negative Connecting Leader to the Lateral Surface of Downward Positive Leader in a +CG Lightning Flash, EGU General Assembly 2024, Vienna, Austria, 14–19 Apr 2024, EGU24-529, https://doi.org/10.5194/egusphere-egu24-529, 2024.

EGU24-1238 | ECS | Posters on site | NH1.5

Optical observations of needles evolving into negative leaders in a positive cloud-to-ground lightning flash 

Bin Wu, Qi Qi, Weitao Lyu, Ying Ma, Lyuwen Chen, and Vladimir Rakov

High-speed video records of a single-stroke positive cloud-to-ground (+CG) flash were used to examine the evolution of eight needles developing more or less radially from the +CG channel. All these eight needles occurred during the later return-stroke stage and the following continuing current stage. Six needles, after their initial extension from the lateral surface of the parent channel core, elongated via bidirectional recoil events, which are responsible for flickering, and two of them evolved into negative stepped leaders. For the latter two, the mean extension speed decreased from 5.3 × 10^6 to 3.4 × 10^5 and then to 1.3 × 10^5 m/s during the initial, recoil-event, and stepping stages, respectively. The initial needle extension ranged from 70 to 320 m (N = 8), extension via recoil events from 50 to 210 m (N = 6), and extension via stepping from 810 to 1,870 m (N = 2). Compared with needles developing from leader channels, the different behavior of needle flickering, the longer length, the faster extension speed, and the higher flickering rate observed in this work may be attributed to a considerably higher current (rate of charge supply) during the return-stroke and early continuing-current stages of +CG flashes.

How to cite: Wu, B., Qi, Q., Lyu, W., Ma, Y., Chen, L., and Rakov, V.: Optical observations of needles evolving into negative leaders in a positive cloud-to-ground lightning flash, EGU General Assembly 2024, Vienna, Austria, 14–19 Apr 2024, EGU24-1238, https://doi.org/10.5194/egusphere-egu24-1238, 2024.

EGU24-1639 | Orals | NH1.5

Modelling the collision of streamers using the AMReX framework 

Christoph Köhn, Angel Ricardo Jara, Morten Jung Westermann, Mathias Gammelmark, and Elloise Fangel-Lloyd

Streamers, precursors of the hot, long lightning leaders, are small filamentary discharges with high electric fields at their tips. Experiments of laboratory discharges have shown that streamers in their corona can approach each other and it has been suggested that such collisions enhance the electric field in-between beyond the thermal runaway electric field accelerating electrons to the runaway regime thus generating X-rays. Streamer collision also plays a role in the interaction of wind turbine blades with lightning when streamers locally incept from the surface of blades and attract the downward moving lightning leader. Despite the relevance of streamer collisions in the runaway process or their role in the interaction of lightning with wind turbine blades, there have only been a few numerical studies due to computational limitations. We have therefore developed a novel 3D fluid model for streamer propagation implemented in the AMREX framework. AMREX allows us to solve drift-diffusion and Poisson equation using parallelization and GPU support to accelerate the block structured adaptive mesh refinement. We will present details of the implementation as well as a parameter study on typical streamer parameters (electron density, electric field, tip width and velocity,…) during streamer collision in various ambient fields and for various initial electron densities. We will also study various geometries with different displacements of the initial electrons perpendicular to the ambient electric field. Finally, we will interpret our results with respect to the runaway process and wind turbine-lightning interaction.

How to cite: Köhn, C., Jara, A. R., Westermann, M. J., Gammelmark, M., and Fangel-Lloyd, E.: Modelling the collision of streamers using the AMReX framework, EGU General Assembly 2024, Vienna, Austria, 14–19 Apr 2024, EGU24-1639, https://doi.org/10.5194/egusphere-egu24-1639, 2024.

The ground-level potential gradient (PG) or the atmospheric electric field, the air-Earth current density as well as the main Global Electric Circuit (GEC) parameters such as the ionospheric potential, global resistance and the total current, can be obtained from the EGATEC engineering model of the GEC (Odzimek et al. 2010) at the resolution of 3 hours. The model input data based on satellite cloud and lightning observation datasets from the period 1998-2006 for evaluating the activity of the GEC cloud generators, and the summer/winter and low/high solar activity conductivity model of Tinsley and Zhou (2006) allow calculating the GEC parameters in the summers and winters of the period. In this work we compare the modelling results to observations from the Stanislaw Kalinowski Geophysical Observatory in Świder, Poland (52°07' N, 21°14' E) of the ground-level potential gradient and conduction current density calculated from the newly digitised PG and positive conductivity data from 1965-2005. We also look for connections in the time variations of the model meteorological input and atmospheric electricity observational data. The work is supported by the Polish National Science Centre grant no 2021/41/B/ST10/04448.

How to cite: Odzimek, A., Tacza, J., Pawlak, I., and Kępski, D.: Analysis of time variations in the Global Electric Circuit parameters from the EGATEC model and Świder atmospheric electricity data, EGU General Assembly 2024, Vienna, Austria, 14–19 Apr 2024, EGU24-1658, https://doi.org/10.5194/egusphere-egu24-1658, 2024.

The different morphologies of lightning channels are caused by different electrical environments within the cloud, the charge distribution determines the lightning channel morphology, and the lightning morphology can reflect the charge structure to some extent. The distribution of charges is mainly determined by the dynamics and microphysical conditions in clouds, and turbulence plays a significant role in the distribution of charges. Due to the dependence of lightning morphology on the distribution of thunderstorm charges, which is regulated by thunderstorm dynamic effects, a relationship can be established between lightning morphology and thunderstorm dynamic effects.

In this study, the lightning channel was obtained from three-dimensional radiation source localization data from the Lightning Mapping Array at the Langmuir Laboratory of the New Mexico Institute of Mining and Technology. The fractal dimension was used to characterize the complexity of lightning channels, which was calculated by the box-counting method. The S-band dual-polarization Doppler radar data was used to estimate the cube root of the eddy dissipation rate (EDR, the EDR was estimated using the Python Turbulence Detection Algorithm). The EDR and radar radial velocity were used to represent the thunderstorm dynamic characteristics.

Superimposing EDR and radar radial velocities with LMA radiation sources, our analysis shows that the overall morphology and detailed morphology of the lightning channel correspond to different EDR characteristics. Lightning with complex channel morphology has a larger average FD and occurs in regions with large EDRs. In single lightning events, channels that extend directly within a certain height range without significant bifurcation and turning tend to propagate in the direction of decreasing EDRs, while channel bifurcations and turns usually occur in regions with large radial velocity gradients and large EDRs. This study shows the relationship between channel morphology and thunderstorm dynamics and provides a new method for the direct application of channel-level localization data to understand thunderstorm dynamics characteristics.

How to cite: Li, Y., Zhang, Y., Zhang, Y., and Krehbiel, P. R.: Analysis of the Relationship between the Morphological Characteristics of Lightning Channels and Turbulent Dynamics Based on the Localization of VHF Radiation Sources, EGU General Assembly 2024, Vienna, Austria, 14–19 Apr 2024, EGU24-2144, https://doi.org/10.5194/egusphere-egu24-2144, 2024.

EGU24-2536 | Posters on site | NH1.5

Lightning Activities near the Red Sea: Effects of Aerosols Morphology and Local Meteorology 

Ashraf Farahat and Maher Dayeh

Lightning activity is one of the global natural hazards that pose significant risks to human life and numerous aspects of society's technological infrastructure. Understanding the linkage between aerosols present in the atmosphere and lightning activity is important to further advance our knowledge of the global lightning activity cycle.

Saudi Arabia and Yemen host one of the world’s largest desert areas namely the Empty Quarter (al-Rubea Al-Khali). Moreover, Saudi Arabia is one of the world’s largest oil exporters with many water desalination, petrochemical, and cement industrial plants, while large cities in both Saudi Arabia and Yemen have large construction projects and vehicle emissions. This increases both natural and anthropogenic aerosol loading in both countries.  Meanwhile, the inland regions close to the Red Sea are one of the 500 hottest lightning regions in the world. This work identifies a possible correlation between lightning activity and aerosol loading.

Using data of individual lightning strokes from the Global Lightning Detection Network (GLD360), in conjunction with remote sensing measurements of the aerosol optical depth (AOD) obtained at 500 nm from the Moderate Resolution Imaging Spectroradiometer (MODIS) instrument onboard the Terra and Aqua satellites during active lightning days, we examine the evolution of lightning activity in two geographically and topologically different regions over Saudi Arabia and Yemen. One region extends inland to the desert (R1) and the other is in the southwest mountainous region that is close to the Red Sea (R2). In both regions, results from thunder days only indicate that lightning is strongly and positively correlated with the AOD loading, up to AOD ~ 0.8, after which the trend flattens or reverses direction. Results suggest the two opposite effects that aerosols could indirectly have on lightning activity are at play. The mountainous region exhibits a much stronger linear relation compared to the inland region. Furthermore, both regions exhibit seasonal and asynchronous lightning activity and AOD loading. The year 2018 in R1 shows very high lightning activity, likely linked to the 2018 intense dust storms in the region.

How to cite: Farahat, A. and Dayeh, M.: Lightning Activities near the Red Sea: Effects of Aerosols Morphology and Local Meteorology, EGU General Assembly 2024, Vienna, Austria, 14–19 Apr 2024, EGU24-2536, https://doi.org/10.5194/egusphere-egu24-2536, 2024.

EGU24-3358 | Orals | NH1.5

Investigation of the Electric Fields Related to Elves Simulations 

Petr Kaspar, Ivana Kolmasova, Ondrej Santolik, and Martin Popek

Elves are transient luminous events occurring above thunderclouds. They appear as an expanding ring of light at altitudes of 85 – 95 km with diameters of more than 200 km and lasting less than 1 ms. The elves are produced by electromagnetic pulses emitted by underlying high-peak current lightning discharges, which excite nitrogen molecules at the bottom of the ionosphere. We develop an electromagnetic model of elves, which consists of two steps. As the first step, we compute the horizontal part of the electric field at a height of 15 km from transmission line return stroke (RS) models without damping, with linear, and/or exponential damping of the current wave. Subsequently, we solve Maxwell’s equations self consistently for altitudes from 15 km to 95 km, including finite neutral and electron densities, and nonlinearities related to heating, ionization, and attachment of free electrons caused by the RS transient electric field. We show computed electric fields and optical emission rates at the heights of the development of elves. This procedure allows us to distinguish between the electrostatic, induction, and radiation part of the electric field and to investigate their role in the evolution of elves in the full wave simulations.

How to cite: Kaspar, P., Kolmasova, I., Santolik, O., and Popek, M.: Investigation of the Electric Fields Related to Elves Simulations, EGU General Assembly 2024, Vienna, Austria, 14–19 Apr 2024, EGU24-3358, https://doi.org/10.5194/egusphere-egu24-3358, 2024.

EGU24-3628 | Orals | NH1.5

Glow-terminating terrestrial gamma-ray flashes observed during the ALOFT Campaign 

Steven Cummer, Yunjiao Pu, Andrew Mezentsev, Marni Pazos, Morris Cohen, Nikolai Ostgaard, Mark Stanley, Timothy Lang, Martino Marisaldi, J. Eric Grove, Mason Quick, Hugh Christian, Christopher Schultz, Richard Blakeslee, Ian Adams, Phillip Bitzer, Martin Fullekrug, Bilal Qureshi, Bendik Husa, and Gerald Heymsfield and the additional members of ALOFT team

The ALOFT campaign targeted aircraft measurements of terrestrial gamma-ray flashes (TGFs) through NASA ER-2 overflights of strong thunderstorms.  We report here the analysis of glow-terminating TGFs (GT-TGFs) that occur at the end of some gamma-ray glows.  GT-TGFs were generated by most of the observed storms during the campaign and were prolifically generated by two specific storms that were particularly active in gamma ray production.  One unique feature of GT-TGFs is that they always occur within several tens of microseconds of a narrow bipolar event (NBE).  The characteristics of GT-TGFs and the associated NBE radio emissions will be described in detail.

How to cite: Cummer, S., Pu, Y., Mezentsev, A., Pazos, M., Cohen, M., Ostgaard, N., Stanley, M., Lang, T., Marisaldi, M., Grove, J. E., Quick, M., Christian, H., Schultz, C., Blakeslee, R., Adams, I., Bitzer, P., Fullekrug, M., Qureshi, B., Husa, B., and Heymsfield, G. and the additional members of ALOFT team: Glow-terminating terrestrial gamma-ray flashes observed during the ALOFT Campaign, EGU General Assembly 2024, Vienna, Austria, 14–19 Apr 2024, EGU24-3628, https://doi.org/10.5194/egusphere-egu24-3628, 2024.

EGU24-3670 | ECS | Orals | NH1.5

Using meteorological reanalysis to identify weather conditions for classifying atmospheric electricity data  

Hripsime Mkrtchyan, Giles Harrison, and Keri Nicoll

Atmospheric electricity Potential Gradient (PG) data has typically been classified by local weather conditions, such as by identifying data recorded during “fair weather” (FW) or in the absence of rainfall “no hydrometeors” (NH), to try and obtain globally representative values. In general, this approach is essential in obtaining global atmospheric circuit (GEC) signals. The weather information needed to do this is, however, only available from some of the sites providing atmospheric electricity measurements. For other sites, meteorological reanalysis – of which there are many products available, spanning different times and scales - may provide a data source for such classification of PG data. This study investigates the integration of ERA5 meteorological reanalysis data to identify FW and NH conditions and improves the quality of data used in long-term atmospheric electricity studies.  

Initial findings investigating the meteorological quantities show a strong correlation between wind speed, total cloud coverage and total precipitation from ERA5 and observed ground-based measurements at the Eskdalemuir and Lerwick sites. This is to be applied to classifying past atmospheric electricity data, specifically of the hourly potential gradient (PG), which were obtained at the Lerwick observatory from 1925 to 1984, and Eskdalemuir observatory, which made atmospheric electricity measurements from 1911-1981 (Harrison & Riddick, 2022; Märcz & Harrison, 2003). 

Identified criteria from ERA5 which best match for FW and NH conditions are implemented in historical data from the Lerwick and Eskdalemuir observatories, enhancing the reliability of past studies which is important for atmospheric electricity analyses. This supports the potential of ERA5 data for providing information to identify FW and NH conditions. From this, we are evaluating a range of methods to use the meteorological reanalysis, with the aim of recovering representative FW data at sites lacking meteorological measurements. 

How to cite: Mkrtchyan, H., Harrison, G., and Nicoll, K.: Using meteorological reanalysis to identify weather conditions for classifying atmospheric electricity data , EGU General Assembly 2024, Vienna, Austria, 14–19 Apr 2024, EGU24-3670, https://doi.org/10.5194/egusphere-egu24-3670, 2024.

EGU24-4116 | Orals | NH1.5

Stream Machine Learning for Lightning Nowcasting - Harnessing the Power of Continuously Updated Data 

Cesar Beneti, Luis Pavam, Luiz Oliveira, Marco Alves, Leonardo Calvetti, and Fernanda Verdelho

Uninterrupted access to electricity is a fundamental feature of civilization. In its absence, an all-embracing cessation of activities occurs, ranging from essential services to more frivolous activities. The maintenance of the energy supply is critical for society's day-to-day functions. The Brazilian state of Paraná (PR) is home to the world's second-largest hydropower plant, Itaipu, which, in conjunction with other power plants in the state, provides almost one-third of the power energy production in Brazil. The transmission lines that pervade PR are essential to Brazil's power distribution system, for hydropower generation is typically made far away from the regions that most demand it, being transported by transmission lines in an interconnected power grid. This type of asset mainly depends on the forecast of Cloud-to-Ground (CG) lightning, as it is one of the leading weather-related causes of power outages. Lightning and wind gusts are the two leading weather-related causes of disruptions, representing at least 23% of the known causes of energy disruption, as declared by the local power distribution company. Our study of lightning incidence and power outages from 2017-2021 indicates a correlation of 0.98 between these events, denoting that more outages must be lightning-related. Reliable CG lightning forecasts are crucial for proactive hazard mitigation. This work expounds on developing a Machine Learning (ML) model for CG lightning forecasting for PR. Our ML model predicts the occurrence or lack of CG lightning near power company assets in PR, defining a binary classification task. The model makes its predictions based on the past spatio-temporal conditions of lightning occurrences, requiring only past lightning data to forecast lightning. We chose to use a stream ML method, i.e., the model is continuously trained as new data arrives. Using a stream ML, we intend to harness the machine's capacity to continuously learn the patterns of lightning occurrence and power outages in real-time -- thus constructing an ever-updating model capable of adapting to transient weather conditions. Given its rapid training time and aptitude for classification tasks, the chosen algorithm was a Very Fast Decision Tree. The stream ML classifier outperforms a classic static ML model by 30% regarding the ROC AUC metric (stream: 71.80%, static: 40.85%) and 50% considering the Micro-f1 score (stream: 91.05%, static: 40.91%). These results arise from the highly dynamic nature of lightning, defining an ideal phenomenon for prediction based on a constantly updated stream of data. An automatic system for CG lightning forecasting for power company assets is helpful for risk management and operational planning. Future steps include increasing the lead time from ten min. to up to one hour, allowing for more time to prepare and anticipate hazards, preventing power outages, and optimizing personnel allocation.

How to cite: Beneti, C., Pavam, L., Oliveira, L., Alves, M., Calvetti, L., and Verdelho, F.: Stream Machine Learning for Lightning Nowcasting - Harnessing the Power of Continuously Updated Data, EGU General Assembly 2024, Vienna, Austria, 14–19 Apr 2024, EGU24-4116, https://doi.org/10.5194/egusphere-egu24-4116, 2024.

EGU24-4214 | Posters on site | NH1.5

Bottom-heavy charge structure and lightning discharges in Tibetan Plateau thunderstorms 

Xiushu Qie, Zhuling Sun, Fengquan Li, Lei Wei, Chunfa Sun, Kexin Zhu, Shanfneg Yuan, Dongxia Liu, and Rubin Jiang

The main charge region in thunderstorms over Lhasa city with an elevation of 3700 m is investigated by using a VHF interferometer, incorporating with fast antenna, weather radar and cloud-to-ground lightning location. The evolution of charge structure and its effects on lightning discharges were discussed in a bottom-heavy thunderstorm. During the early developing stage, the thunderstorm exhibited an inverted dipolar charge structure with negative charge center over the positive, and lower negative intracloud (IC) lightning occurred in between. Then an upper positive charge region appeared as the convection intensifying, and the charge structure exhibited obvious tripolar pattern and with large lower positive charge center (LPCC), and fewer positive IC discharges occurred in the upper dipole but lower negative IC lightning still dominated. As the thunderstorm entered the later mature stage, both negative IC between the lower dipole and positive IC between the upper dipole observed simultaneously. With gradually depleting of the positive charge carriers by precipitation, the LPCC weakened, the positive IC lightning between the upper dipole dominated, and two negative CG flashes were able to occur. In the later stage, positive IC dominated, although not much.  The study further confirms the previous conclusion (Qie et al., GRL, 2005) that weak thunderstorms are characterized by a bottom-heavy charge structure, and in the vigorous stage of thunderstorm, it may exhibit tripolar charge structure with a large LPCC, which has a significant impact on lightning types.

How to cite: Qie, X., Sun, Z., Li, F., Wei, L., Sun, C., Zhu, K., Yuan, S., Liu, D., and Jiang, R.: Bottom-heavy charge structure and lightning discharges in Tibetan Plateau thunderstorms, EGU General Assembly 2024, Vienna, Austria, 14–19 Apr 2024, EGU24-4214, https://doi.org/10.5194/egusphere-egu24-4214, 2024.

The evolution of charge structure plays a crucial role in thunderstorm electrification. In this paper, the signatures related to the upper charge regions consisting of charged ice crystals are analyzed in an isolated thunderstorm, observed by an X-band dual-polarized phased array weather radar (DP-PAWR), which operates in its normal operational mode which performs a volume scan with 110 elevations at a temporal resolution of 30 seconds. The radar data quality control is applied to polarized parameters of DP-PAWR, including the horizontal reflectivity ZH, differential propagation phase shift, and specific differential phase. The lightning data was obtained by a lightning detection system called LIDEN (LIghtning DEtection Network system) operated by the JMA. A flash group algorithm is employed to group lightning discharges into flash branches according to a spatial range, azimuth interval, and time criterion.


To explore the mean structure of upper charge regions in the convective part of the thunderstorms, an expanded quasi-vertical profile method is applied to examine the temporal evolution of microphysical processes of upper charge regions. The convective part in the isolated thunderstorm is defined as one separated from nearby storms by an area of composite ZH larger than 40 dBZ at and above -10℃ layer, and a criterion of correlation coefficient ρHV greater than 0.8 is used to remove poor quality radar data. Meanwhile, only the lightning flashes within the given volume are used to calculate the IC lighting flash rate and explore the signatures with the upper charge regions.


The results indicate that during the different stages from the early developing stage of isolated thunderstorms to the end of the mature stage, the upper charge regions above the -10 ℃ layer experienced an evolution process from initiation to development accompanied by the rise of the charge region in the updraft and the enhancement of charge concentration. In the mature stage of thunderstorm, the upper charge regions extended from the -30℃ layer to the cloud top, followed by a decay process in the upper charge region at the end of the mature stage, in which the IC lightning flash rate is larger than 60 flashes/min. At the same time, the mean structure evolution of the upper charge regions exhibited a good relationship with the in-cloud lightning flash rate.

How to cite: Wang, S.: Analysis of the Signatures Related to the Upper Charge Regions in an Isolated Thunderstorm Observed by Dual-Polarized Phased Array Weather Radar, EGU General Assembly 2024, Vienna, Austria, 14–19 Apr 2024, EGU24-4254, https://doi.org/10.5194/egusphere-egu24-4254, 2024.

Winter thunderstorms often exhibit compact vertical dimensions and lower heights of the major charge centers and are often accompanied by strong wind shear, with a propensity for positive cloud-to-ground strokes that can produce mesospheric transient luminous events (e.g. sprites, haloes, elves and jets). There are many optical observations confirming this over the Sea of Japan and the Mediterranean Sea, which are known to be the most convectively active regions during Northern Hemisphere winter.

We use a 3D quasi-electrostatic model (Haspel et al., 2022) with wintertime thunderstorm charge configurations to evaluate sprite inception regions in the mesosphere under various conditions typical of the Eastern Mediterranean. This is a is a relatively new, numerically robust model based on an analytical solution to Poisson’s equation that was developed specifically to handle non-symmetric charge configurations in a large 3D domain.  We address several key questions related to the onset of sprites in winter: (a) the minimum charge that enables sprite inception under the compact thunderstorm structures, (b) the effect of wind shear (lateral offsets of 3-5 km between the cloud charge centers) on the electric field and the location of the area of possible sprite inception, and (c) how the time difference between consecutive strokes in adjacent cumulonimbus clouds affects the size and location of the area of possible sprite inception. Additionally, we will present results of sensitivity studies on the discharge time and profile, showing how the area of possible sprite inception depends on this factor.


Reference

Haspel, C., G. Kurtser and Y. Yair (2022). The feasibility of a 3D time-dependent model for predicting the area of possible sprite inception in the mesosphere based on an analytical solution to Poisson's equation. Jour. Atmos. Sol. Terr. Phys.,230, 105853, doi:10.1016/j.jastp.2022.105853.

How to cite: Haspel, C. and Yair, Y.: Numerical simulations of the mesospheric region for sprite inception in winter thunderstorms over the Eastern Mediterranean, EGU General Assembly 2024, Vienna, Austria, 14–19 Apr 2024, EGU24-4618, https://doi.org/10.5194/egusphere-egu24-4618, 2024.

EGU24-4634 | ECS | Orals | NH1.5

Regional differences in thunderstorm intensity driven by monsoon and westerlies over the Tibetan Plateau 

Lei Wei, Xiushu Qie, Zhuling Sun, and Chen Xu

Thunderstorms are weak but frequent, and exhibit unique charge structures over the Tibetan Plateau (TP) where the average elevation is higher than 4 km. In this study, all detected thunderstorms over the TP between 1998 and 2013 by TRMM were divided into four intensity categories: weak, median, severe and extreme. This classification was based on the 75%, 90%, and 99% values of flash rate, maximum 40 dBZ height, minimum 85 GHz polarization-corrected temperature (PCT), and minimum 37 GHz PCT, respectively. The monthly distributions of thunderstorm intensity show that all categories mostly occur in summer over most regions of the TP, and in spring near the Himalayas. Although the peaks of thunderstorms occur during 1300-1600 LT, the thunderstorms occurring in the early morning and evening have a high probability of developing into severe and extreme thunderstorms. This is distinct from the thunderstorms over the Sichuan Basin, the surrounding areas, and the middle and lower reaches of the Yangtze River at the same latitude. On the basis of westerlies- and monsoon-dominated regions, as well as the altitude, the TP was divided into four regions: the eastern, northern, southern and western regions of the TP (namely ETP, NTP, STP and WTP, respectively). The ETP and STP are primarily influenced by the monsoon, with the ETP at a lower altitude than the STP. Conversely, the WTP and NTP are affected by the westerlies, with the WTP situated at a higher altitude than the NTP. Thunderstorms over the ETP are more likely to be severe and extreme than those over the NTP. The percentage of weak thunderstorms is highest over the WTP. It is found that the maximum top height, development depth, horizontal development area, and development volume at 20 dBZ, 30 dBZ, and 40 dBZ echoes are largest over the ETP, followed by the NTP and STP, while being smallest over the WTP. The results imply that thunderstorms influenced by the monsoon are larger and more likely to be severe and extreme than those influenced by the westerlies.

How to cite: Wei, L., Qie, X., Sun, Z., and Xu, C.: Regional differences in thunderstorm intensity driven by monsoon and westerlies over the Tibetan Plateau, EGU General Assembly 2024, Vienna, Austria, 14–19 Apr 2024, EGU24-4634, https://doi.org/10.5194/egusphere-egu24-4634, 2024.

EGU24-5346 | Posters on site | NH1.5

Spectral Analysis of High-Energy Radiation Events Observed during the ALOFT 2023 Campaign 

David Sarria, Nikolai Østgaard, Martino Marisaldi, Timothy Lang, Eric Grove, Mason Quick, Hugh Christian, Chris Schultz, Richard Blakeslee, Ian Adams, Rachael Kroodsma, Gerald Heymsfield, Andrey Mezentsev, Ingrid Bjørg Engeland, Anders Fuglestad, Nikolai Lehtinen, Kjetil Ullaland, Shiming Yang, Bilal Hasan Quresh, and Jens Søndergaard and the ALOFT Team

The Airborne Lighting Observatory for FEGS and TGFs (ALOFT) is equipped with a comprehensive set of instruments on-board a NASA ER-2 research aircraft for observing Terrestrial Gamma-ray Flashes (TGFs) and gamma-ray glows from thunderclouds. The ER-2 research aircraft flew at about 20 km altitude, above thunderstorms, from July 1st to July 30th, 2023, for a total flight time of about 60 hours.  The onboard instrument suite comprised several X/gamma-ray detectors, which spanned a dynamic range of four orders of magnitude in flux and covered the entire energy spectrum associated with the gamma-ray transients.

    During the campaign, we observed over 130 short gamma-ray transients, along with hundreds of gamma-ray glows. Several of these detections consisted of thousands of photon counts, allowing precise and unprecedented spectral analyses.

    In this study, we present a comprehensive spectral analysis of various events using a forward modeling technique and Monte-Carlo simulations. This approach enables us to constrain the source characteristics of these events, including their source energy spectrum, production altitude and offset, spatial extension, and the brightness (fluence) of the source RREA electrons.

How to cite: Sarria, D., Østgaard, N., Marisaldi, M., Lang, T., Grove, E., Quick, M., Christian, H., Schultz, C., Blakeslee, R., Adams, I., Kroodsma, R., Heymsfield, G., Mezentsev, A., Bjørg Engeland, I., Fuglestad, A., Lehtinen, N., Ullaland, K., Yang, S., Hasan Quresh, B., and Søndergaard, J. and the ALOFT Team: Spectral Analysis of High-Energy Radiation Events Observed during the ALOFT 2023 Campaign, EGU General Assembly 2024, Vienna, Austria, 14–19 Apr 2024, EGU24-5346, https://doi.org/10.5194/egusphere-egu24-5346, 2024.

Lightning now has designated as an Essential Climate Variable in the Global Climate Observing System to understand the climate change. Lightning detection from geostationary satellites enables continuous monitoring of lightning activity. The satellite-borne lightning imagers take advantage of optical imaging technology combined with multiple filtering methods to extract the weak signals of lightning from very strong background signals and eventually clustering to reconstruct the original lightning flashes. By using the observation data of Fengyun-4A Lightning Mapper Imager (LMI), the first geostationary satellite-borne lightning imager developed in China, the lightning activity and the optical characteristics of lightning flashes in China were analyzed. The lightning activity observed by LMI exhibits obvious regional, seasonal and diurnal variation properties. The flashes are mainly concentrated in the southeastern coastal region in China and the southwestern China. During the pre-monsoon period (March-May), LMI detected lightning outbreaks in southwestern China and its surrounding areas, while during the monsoon period (June-September), both eastern southwestern China and southeastern coastal region in China show a significant dense distribution of lightning flashes. The climatic characteristics of lightning activity and the simultaneous observations of Lightning Imaging Sensor (LIS) on the International Space Station (ISS) confirm the LMI observations. However, there is a difference between the absolute amounts of the LMI and LIS observations. The overall number of lightning flashes observed by LMI is relatively lower than that observed by LIS. In addition, the detection capability of LMI is higher at low latitudes compared to mid-latitudes, and is higher during daytime hours than that during nighttime hours. As for the flash properties, which mainly refer to the optical radiance, area, and duration of lightning flashes, there are also regional differences for these properties observed by LMI. The high values of flash properties are concentrated in southern China. The LMI observations are related to the radiometric response of its detector and the difference in spatial resolution within the large field of view of geostationary orbit observations.

How to cite: Hui, W. and Zhang, W.: Lightning Activity in China and Its Optical Characteristics Observed by Geostationary Satellite, EGU General Assembly 2024, Vienna, Austria, 14–19 Apr 2024, EGU24-5363, https://doi.org/10.5194/egusphere-egu24-5363, 2024.

EGU24-5400 | ECS | Posters on site | NH1.5

The intensity distribution of Terrestrial Gamma-ray Flashes from the ALOFT flight campaign 

Anders Fuglestad and the ALOFT team

In July 2023, the Airborne Lightning Observatory for FEGS and TGFs (ALOFT) flight campaign took place using a NASA ER-2 research aircraft flying over the Gulf of Mexico and the Caribbean Sea. The campaign consisted of about 60 flight hours at a cruise altitude of 20 km, using live telemetry to target gamma-ray glowing thunderclouds.

The payload consisted of several instruments including gamma-ray detectors with a dynamic range spanning four orders of magnitude in flux, an imaging array of optical photometers, electric field change meters, radiometers, and radar systems. In addition to several ground stations measuring very low frequency, low frequency, and very high frequency radio signals.

96 TGFs were detected by ALOFT. For 44 of these events, it was possible to get an estimate of the location of the source using both correlated optical pulses and lightning detection networks.

With the estimate of the source location and the gamma-ray observation from ALOFT. Monte Carlo simulations were used to get an estimate of the source intensity of the TGFs.

Based on the results it was determined that the vast majority of the 44 TGFs investigated have source intensities below the threshold needed to be observed from current satellite instruments, which indicates a large population of low intensity TGFs that has gone previously undetected. These results contribute to the open debate on the rarity of TGFs.

How to cite: Fuglestad, A. and the ALOFT team: The intensity distribution of Terrestrial Gamma-ray Flashes from the ALOFT flight campaign, EGU General Assembly 2024, Vienna, Austria, 14–19 Apr 2024, EGU24-5400, https://doi.org/10.5194/egusphere-egu24-5400, 2024.

EGU24-6398 | ECS | Orals | NH1.5

Side discharges on positively charged lightning leaders 

Shanfeng Yuan, Xiushu Qie, Rubin Jiang, and Dongfang Wang

Recent observations unveiled two types of side discharges associated with positive leaders: needle discharges and nearby bidirectional leaders. The formation mechanism and connections of two phenomena remained unclear due to the lack of synchronous optical detection and radio mapping data. Here we present the first high-speed video and low-frequency lightning mapping results. Negative branches of nearby bidirectional leaders can propagate after connecting to the parent positive channel, and needle discharges act as positive connecting leaders. Our research shows that positive leaders exhibit unconventional channel extensions, maintained by frequent recoil leaders, sharing characteristics with streamer discharges. Notably, when two approaching positive leaders develop in this manner, they can eventually collide. These findings significantly advance our understanding of side discharges on positive leaders, offering fresh insights into these intriguing phenomena.

How to cite: Yuan, S., Qie, X., Jiang, R., and Wang, D.: Side discharges on positively charged lightning leaders, EGU General Assembly 2024, Vienna, Austria, 14–19 Apr 2024, EGU24-6398, https://doi.org/10.5194/egusphere-egu24-6398, 2024.

EGU24-6468 | Posters on site | NH1.5

On the impact of thunder on cloud droplets and ice crystals  

Konstantinos Kourtidis and Stavros Stathopoulos

In the lightning channel pressures can be of the order of 100 atm and hence in the produced thunder, sound pressure levels (SPL) can be very high. Additionally, the thunder frequency spectra have peaks for peal and claps at around 100 Hz and around 50 Hz for rumble sounds, with intracloud lightning having peaks at even fewer Hz. These low frequencies are ideal for acoustically induced orthokinetic agglomeration of droplets. Thunder occurs in cloud environments where not only large numbers of droplets are present, but additionally the shockwave front expands at supersonic velocities and hence could cause near the lightning channel modulations of droplet size distributions and increase ice crystals numbers through e.g. vibrational breakup. We present calculations for the two mechanisms above (orthokinetic agglomeration and vibrational breakup) for typical cloud droplet sizes and concentrations, including also clouds containing desert dust. In thunderstorm conditions, it is found that acoustic orthokinetic agglomeration of droplets can be very effective and can produce very rapidly changes in the mean cloud droplet diameter. Also, it is found that the critical flow velocities, over which breakup occurs, is easily exceeded near the lightning channel and will lead to droplet and ice crystal breakup. We note that all models of ice crystal generation in clouds substantially underestimate the observed ice crystal numbers, and the mechanism presented here may be responsible for the discrepancy. We also note that these processes need further study to assess how they could interfere with the lightning generation process itself, through both charge redistribution in the modified droplet size distribution spectra, as well as the increase in vertical and turbulent transport velocities of the smaller ice crystals resulting from breakup. 

How to cite: Kourtidis, K. and Stathopoulos, S.: On the impact of thunder on cloud droplets and ice crystals , EGU General Assembly 2024, Vienna, Austria, 14–19 Apr 2024, EGU24-6468, https://doi.org/10.5194/egusphere-egu24-6468, 2024.

EGU24-6523 | Posters on site | NH1.5

ESTHER: a small project to investigate gamma-ray emissions in thunderstorms and volcanic lightning 

Alessandro Ursi and Danilo Reitano

Detecting terrestrial gamma-ray flashes (TGFs) from the ground is a relatively new frontier in atmospheric science and has opened up new avenues for research. Also, the recent detection of a TGF produced during the massive Hunga Tonga–Hunga Ha'apai eruption, pointed out the possibility that even volcanic lightning might produce gamma-ray emissions at MeV energies.

In this context, we present the Experiment to Study Thunderstorm High-Energy Radiation (ESTHER), a small project funded by the Italian National Institute for Astrophysics (INAF), aimed at monitoring from the ground gamma-ray emissions produced during thunderstorms and, possibly, by volcanic lightning. The ESTHER set-up consists of a gamma-ray detection system and a VLF radio receiver, to be installed on the top of the Etna volcano (Italy). The selected installation site is the Etnean Observatory of the Italian National Institute of Geophysics and Volcanology (INGV), located at 2,818 m altitude and laying less than 2.7 km from the main volcano craters.

An extensive analysis of the flash rate recorded at Mt. Etna in the last eight years pointed out that the mountain top is interested by strong lightning activity in the summer months, making it a suitable location for the investigation of lightning and associated high-energy phenomena. In particular, the largest fraction of discharges turned out to cluster nearby the mountain peak and right above the main volcano craters, where the frequent presence of volcanic ashes possibly increases the electrical conductivity, under conditions of humid air typical of thunderstorms, making the region above the volcano's top a natural trigger for lightning. Moreover, as for other volcanoes around the world, Etna has been documented to produce volcanic lightning (last times in 2015 and 2022). As a consequence, given the proximity of the Etnean Observatory to the main craters, ESTHER will enjoy a privileged location for investigating potential gamma-ray emissions produced either by thunderstorms and volcanic lightning. In conditions of clear sky, ESTHER will also provide an as much as possible continuous monitoring of the environmental gamma-ray background, allowing to point out potential variations of it before, during, or after volcanic eruptions. The ESTHER set-up will be installed and start its first data acquisitions in spring 2024.

How to cite: Ursi, A. and Reitano, D.: ESTHER: a small project to investigate gamma-ray emissions in thunderstorms and volcanic lightning, EGU General Assembly 2024, Vienna, Austria, 14–19 Apr 2024, EGU24-6523, https://doi.org/10.5194/egusphere-egu24-6523, 2024.

EGU24-7273 | Orals | NH1.5

Observation of positive Narrow Bipolar Events in the Mediterranean region 

Ivana Kolmašová, Ondřej Santolík, Serge Soula, Eric Defer, Yanan Zhu, Radek Lán, Stéphane Pedeboy, and Andrea Kolínská

Narrow Bipolar Events (NBEs) are brief intracloud (IC) discharge processes that generate powerful radiation in the HF and VHF radio bands. NBEs typically occur in isolation, but they have also been identified as initial events in IC lightning flashes. Their incidence is statistically correlated with the strength of convection. NBEs can exhibit both polarities and usually occur in the upper regions of the thundercloud.

We present, for the first time, properties of NBEs detected in the Mediterranean region. The dataset comprises 37 events recorded by broadband magnetic loops located at two sites in France. The events were identified using the list of NBEs from 2022 provided by the Earth Network. The frequency range of our broadband sensors enabled us to obtain detailed shapes of NBE pulses. We calculated rise times, full width at half maximum times, and zero-crossing times of NBE pulses to facilitate comparisons with observations of NBEs in other parts of the world. The majority of NBE pulses observed in the Mediterranean region were isolated events occurring above the land and displaying a simple bipolar waveform with an overshoot peak of the opposite polarity. For two events, we supplemented our observation with the data from the SAETTA (Suivi de l’Activité Electrique Tridimensionnelle Totale de l’Atmosphère) lightning mapping array. Additionally, we estimated the altitude of the NBE events and placed our observations in the meteorological contexts to determine why NBE occurrences in the Mediterranean region have been overlooked until now.


How to cite: Kolmašová, I., Santolík, O., Soula, S., Defer, E., Zhu, Y., Lán, R., Pedeboy, S., and Kolínská, A.: Observation of positive Narrow Bipolar Events in the Mediterranean region, EGU General Assembly 2024, Vienna, Austria, 14–19 Apr 2024, EGU24-7273, https://doi.org/10.5194/egusphere-egu24-7273, 2024.

EGU24-7900 | Orals | NH1.5

TGF and gamma-ray glow highlights from the ALOFT 2023 flight campaign 

Nikolai Ostgaard, Timothy Lang, Martino Marisaldi, Eric Grove, Mason Quick, Hugh Christian, Cristopher Schultz, Richard Blakeslee, Ian Adams, Rachael Kroodsma, Gerald Heymsfield, Andrey Mezentsev, David Sarria, Ingrid Bjorg Engeland, Anders Fuglestad, Nikolai Lehtinen, Kjetil Ullaland, Shiming Yang, Bilal Hasan Qureshi, and Jens Sondergaard and the ALOFT team

During the summer of 2023 the  Airborne Lighting Observatory for FEGS and TGFs (ALOFT) field campaign was performed. With a NASA ER-2 research aircraft, flying at 20 km altitude, ALOFT was searching for Terrestrial Gamma ray Flashes (TGF) and gamma-glowing thunderclouds in Central America and Caribbean. The ALOFT payload included a comprehensive number of instruments:

1) Several gamma-ray detectors covering four orders of magnitude dynamic range in flux as well as the full energy range for TGF/gamma-ray glow detection (UIB-BGO and ISTORM).

2) Fly’s Eye GLM Simulator (FEGS), an imaging array of photometers sensitive to different wavelengths, and electric field change meters.

3) Lightning Instrument Package (LIP), giving three component electric field measurements.

4) a suite of microwave radiometers and radars for cloud characterization: the Advanced Microwave Precipitation Radiometer (AMPR), Configurable Scanning Submillimeter-wave Instrument/Radiometer (CoSSIR), Cloud Radar System (CRS), and X-band Radar (EXRAD)


5) An extensive set of ground-based radio observations.


For all the 10 flights, 60 hours total, realtime gamma-ray detections were downlinked. Due to this simple but novel mission concept, we knew in real time if the aircraft was passing a gamma-glowing cloud and the pilot was instructed to return to the same thundercloud as long as the cloud was glowing. During the campaign ALOFT observed a total of 130 transient gamma-ray events and hundreds of gamma-ray glows. With the richness of the ALOFT observations we learned that thundercloud can glow for much longer than minute scale and over much larger areas than previously reported. We also learned that transient gamma-ray events come in a large variety and new types of events were discovered.  In this presentation we will give an overview of the main results and discoveries by the ALOFT campaign


How to cite: Ostgaard, N., Lang, T., Marisaldi, M., Grove, E., Quick, M., Christian, H., Schultz, C., Blakeslee, R., Adams, I., Kroodsma, R., Heymsfield, G., Mezentsev, A., Sarria, D., Bjorg Engeland, I., Fuglestad, A., Lehtinen, N., Ullaland, K., Yang, S., Hasan Qureshi, B., and Sondergaard, J. and the ALOFT team: TGF and gamma-ray glow highlights from the ALOFT 2023 flight campaign, EGU General Assembly 2024, Vienna, Austria, 14–19 Apr 2024, EGU24-7900, https://doi.org/10.5194/egusphere-egu24-7900, 2024.

EGU24-7927 | Orals | NH1.5

A novel view of gamma-ray glows from the ALOFT 2023 flight campaign 

Martino Marisaldi, Nikolai Østgaard, Timothy J. Lang, J. Eric Grove, Mason Quick, Hugh Christian, Christopher J. Schultz, Richard Blakeslee, Ian S. Adams, Rachael A. Kroodsma, Gerald M. Heymsfield, Andrey Mezentsev, David Sarria, Ingrid Bjørge-Engeland, Anders Fuglestad, Nikolai Lehtinen, Kjetil Ullaland, Shiming Yang, Bilal Hasan Qureshi, and Jens Søndergaard and the ALOFT team

The Airborne Lightning Observatory for FEGS and TGFs (ALOFT) was a field campaign targeted at Terrestrial Gamma-ray Flashes (TGFs) and gamma-ray glows from thunderclouds. The campaign was successfully carried out during July 2023, for a total of 60 flight hours in the Gulf of Mexico and the Caribbean. The scientific payload was flown on a NASA ER-2 research aircraft, capable to fly at 20 km altitude above thunderclouds. The payload included a suite of gamma-ray detectors spanning four orders of magnitude dynamic range in flux, and a complete suite of instruments for the characterisation of the electrical and optical activity, and the thundercloud environment. A key asset of the mission was the real-time downlink of gamma-ray count rates, which enabled the immediate identification of gamma-ray glowing regions. The pilot was then instructed to turn and pass over the same glowing region to explore its spatial extension and duration.

ALOFT resulted in the detection of hundreds of gamma-ray glows, anticipating a revolution in our understanding of the phenomenon. Thunderclouds were observed to glow for hours and over several thousands of square kilometers, making glows a much more pervasive phenomenon than previously reported. Glows show significant time variability from seconds down to millisecond time scale, suggesting a relation to short transients such as TGFs more complex than previously thought. Glows are observed in association with the overpass of active convective cores, 20-25 km in size, yet their time variability and intensity modulation suggest a more complex spatial structure.

These observations challenge the current view of glows as quasi-stationary phenomena related to relatively stable electrification conditions. The observed glows show highly dynamic temporal and spatial structures and are closely related to the development phases of active thunderclouds. These observations call for a rethinking of the assumptions at the basis of current modeling efforts.

How to cite: Marisaldi, M., Østgaard, N., Lang, T. J., Grove, J. E., Quick, M., Christian, H., Schultz, C. J., Blakeslee, R., Adams, I. S., Kroodsma, R. A., Heymsfield, G. M., Mezentsev, A., Sarria, D., Bjørge-Engeland, I., Fuglestad, A., Lehtinen, N., Ullaland, K., Yang, S., Qureshi, B. H., and Søndergaard, J. and the ALOFT team: A novel view of gamma-ray glows from the ALOFT 2023 flight campaign, EGU General Assembly 2024, Vienna, Austria, 14–19 Apr 2024, EGU24-7927, https://doi.org/10.5194/egusphere-egu24-7927, 2024.

EGU24-7940 | Orals | NH1.5

LOFAR Observations of the Initial Stage of IC Dart Leaders 

Brian Hare, Olaf Scholten, Paulina Ťureková, Steven Cummer, Joseph Dwyer, Ningyu Liu, Chris Sterpka, and Sander ter Veen

In previous work we have found that dart leaders quench needle activity; where dart leaders are charge pulses that re-trace previously established lightning leader channels, and needles are small repeating negative discharges that propagate away from positive lightning channels. We hypothesized that dart leaders could be quenching needles by carrying negative charge away from the region of needle activity. Therefore, in order to further explore the interactions between dart leaders and needles, we are investigating the beginnings of different dart leaders with the LOFAR radio telescope, which uses hundreds of antennas in northern Netherlands to image lightning in the 30-80 MHz band with meter and nanosecond level accuracy. We have found that, consistent with previous work, dart leaders start slow with weak radio emission and then accelerate over a period roughly around 50 µs in duration until they reach a maximum speed and radio intensity. However, we also observe that the power of the radio emissions from the dart leaders exhibits large, randomly-timed, variations. These variations do not appear to be a form of leader stepping. The time-differences between individual peaks in the time trace is significantly longer than the width of each peak (or pulse) that is dominated by the antenna function, (FWHM ~ 50 ns). One possible explanation could be that the power fluctuations are consistent with Poisson statistical variations of radio sources (possibly streamers), which would imply that at any point in time the radio emission is dominated by a small number of strong emitters, as opposed to millions of small streamers. A second possible explanation is that the fluctuations could be due to small-scale structural variations along the previously established plasma channel, which we have observed in previous work.

How to cite: Hare, B., Scholten, O., Ťureková, P., Cummer, S., Dwyer, J., Liu, N., Sterpka, C., and ter Veen, S.: LOFAR Observations of the Initial Stage of IC Dart Leaders, EGU General Assembly 2024, Vienna, Austria, 14–19 Apr 2024, EGU24-7940, https://doi.org/10.5194/egusphere-egu24-7940, 2024.

EGU24-7982 | ECS | Posters virtual | NH1.5

Enhancement of Catastrophic Positive Cloud to Ground Lightning in recent years over Maharashtra (India): Role of Dust Aerosols 

Abhijeet Gangane, Sunil Pawar, Prajna Priyadarshini, and Venkatachalam Gopalakrishnan

Many studies have shown that aerosols can influence microphysical processes inside thunderclouds that could affect charge-generation processes. Cloud to Ground (CG) lightning data from Ground-based observations (IITM-LLN) over the State of Maharashtra, India, from 2014 to 2023, have been analyzed here to study the percentage and physical mechanism associated with the enhancement of catastrophic Positive CG in total CG lightning. Our analysis shows that the average positive CG percentage remains above 25% during the monsoon (July-September) and post-monsoon (October-November). This increased percentage of positive CG is attributed to elevated dust aerosol concentration over the study region during the monsoon and post-monsoon periods. An enormous amount of dust can be seen during the Indian Summer Monsoon (ISM) over the Arabian Desert and neighborhood extending up to the western Indian (Maharashtra) region. Dust aerosol intrusion into the thunderstorm acts as Ice nuclei (IN) as well as Cloud Condensation Nuclei (CCN) and can influence charge separation processes inside the cloud. In recent years, we observed an enhancement of Dust AOT over Maharashtra state, indicating that the increasing trend in Positive CG lightning is closely linked to the transport of desert dust from the Middle East and elevated aerosol content during the post-monsoon season. Here, we propose that these high concentrations of dust aerosols near the cloud base acting as IN produce a high concentration of ice crystals in the lower portion of the cloud, which can form a strong positive charge region in the lower part of the mixed-phase region by non-inductive charging mechanism. This strong positive charge region in the lower portion of the mixed phase region may be responsible for the observed increased percentage of positive CG over the study region.

How to cite: Gangane, A., Pawar, S., Priyadarshini, P., and Gopalakrishnan, V.: Enhancement of Catastrophic Positive Cloud to Ground Lightning in recent years over Maharashtra (India): Role of Dust Aerosols, EGU General Assembly 2024, Vienna, Austria, 14–19 Apr 2024, EGU24-7982, https://doi.org/10.5194/egusphere-egu24-7982, 2024.

EGU24-7996 | ECS | Posters on site | NH1.5

Monte Carlo Error Analysis of Lightning Interferometry with LOFAR 

Paulina Turekova, Brian Hare, Olaf Scholten, Steven Cummer, Joseph Dwyer, Ningyu Liu, Chris Sterpka, and Sander ter Veen
The LOFAR radio telescope works on a principle of radio interferometric imaging. It coherently sums the signal of hundreds of antennas in northern Netherlands, covering the 30-80 MHz window of the very high frequency (VHF) band of 30-300 MHz. We are using the TRI-D algorithm to extract 3-D polarization data of a lightning flash observed by LOFAR. TRI-D functions by coherently summing recorded voltages, accounting for the antenna function, polarization, and geometric time delay for each voxel. The result is split into time slices. A coherent intensity is calculated for each time slice, and the maximum of this value is set as a source location. The outcome is a reconstructed source location and polarization as seen by the LOFAR antennas. We are now exploring the accuracy of TRI-D in response to realistic parameters. In this work, we perform a Monte Carlo error analysis which simulates the voltages on each antenna from an assumed dipole emitter, adds normally distributed noise, and then reconstructs the source properties with TRI-D. The difference between the simulated input and the reconstruction gives us an estimate of the resulting error bars. We will show a detailed account of the interferometry technique that produces our data, the Monte Carlo simulation that tests the accuracy of our model and finally, our polarization results.

How to cite: Turekova, P., Hare, B., Scholten, O., Cummer, S., Dwyer, J., Liu, N., Sterpka, C., and ter Veen, S.: Monte Carlo Error Analysis of Lightning Interferometry with LOFAR, EGU General Assembly 2024, Vienna, Austria, 14–19 Apr 2024, EGU24-7996, https://doi.org/10.5194/egusphere-egu24-7996, 2024.

EGU24-8002 | ECS | Posters on site | NH1.5

Measuring evaporation-condensation charging of individual aerosol particles 

Andrea Stoellner, Isaac Christopher David Lenton, Caroline Muller, and Scott Russell Waitukaitis

Although cloud electrification has been studied for hundreds of years, it is still not fully understood [1]. The most promising charging mechanism – ice crystal-graupel collision charging – answers some of our questions, but leaves us with others. Why do ice crystals and graupel charge on collision in the first place? And why do they reverse their charging behavior below a certain temperature? To get some insights we take a step back and look at the charging behavior of individual aerosol particles in a humid environment. Shavlov et al. [2] suggest that the hydroxide and hydronium ions formed by the autodissociation of water are sufficient to cause charging during evaporation and condensation of water droplets or surface-adsorbed water on solid particles. This small amount of charge could be a precursor to bigger charge exchange during collision.

            We aim to test this hypothesis by levitating individual aerosol particles in an optical trap and measuring their charge while varying humidity. Our setup allows for trapping of different types of solid and liquid particles in the micrometer size range, like water droplets and silica microspheres. In the future we also hope to study ice crystals. Figure 1 shows an illustration of the measurement principle. The particle’s charge is measured by applying a sinusoidal electric field and observing the resulting particle motion. The Mie scattering pattern of the particle furthermore gives information about the particle’s size and refractive index, both at equilibrium and during evaporation/condensation. The experiment allows us to control the relative humidity, pressure and air ion concentration around as well as air flow across the particle.

Ultimately we hope to contribute to a better understanding of the microphysical processes involved in thundercloud electrification and adjacent electrical phenomena in the atmosphere. 

FIGURE 1. Optical tweezers (wavelength λ = 532 nm) holding a solid or liquid aerosol particle. A sinusoidal electric field is applied between the two electrodes and the resulting particle motion as well as the particle’s Mie scattering pattern are recorded.

Acknowledgments

This project has received funding from the European Research Council (ERC) under the European Union’s Starting Grant (A. Stoellner, I.C.D. Lenton & S.R. Waitukaitis received funding from ERC No. 949120, C. Muller received funding from ERC No. 805041).


References

  • Berdeklis, P. and List, R. (2001) J Aerosol Sci. 58(18) 2751–2770.
  • Shavlov A. et al. (2018) J Aerosol Sci. 123 17-26.

How to cite: Stoellner, A., Lenton, I. C. D., Muller, C., and Waitukaitis, S. R.: Measuring evaporation-condensation charging of individual aerosol particles, EGU General Assembly 2024, Vienna, Austria, 14–19 Apr 2024, EGU24-8002, https://doi.org/10.5194/egusphere-egu24-8002, 2024.

EGU24-9355 | Posters on site | NH1.5

Dynamics of global lightning activity on different time scales as indicated by Schumann resonance frequency variations 

Gabriella Sátori, Tamás Bozóki, Earle Williams, Ernő Prácser, Raidiel Puig, and Rachel Albrecht

The electromagnetic waves in the Schumann resonance (SR) frequency range (<100 Hz) radiated by natural “lightning antennas” excite the Earth-ionosphere cavity confined between the Earth’s surface and the ionospheric D-region of ~100 km height. This contribution provides observational evidence for the relationships between the variations of peak frequencies of the first three modes and the global/regional lightning dynamics based on SR observations of the vertical electric field component, EZ, at Nagycenk (NCK), Hungary, Central Europe. Lightning source-observer distance-dependent frequency variations are considered on the annual, seasonal and diurnal time scale as well as during specific events when squall-line formation of lightning activity in South America moves toward NCK. The observations are interpreted with model calculations. The distance-dependent frequency variation has important applications to climate issues as well.

How to cite: Sátori, G., Bozóki, T., Williams, E., Prácser, E., Puig, R., and Albrecht, R.: Dynamics of global lightning activity on different time scales as indicated by Schumann resonance frequency variations, EGU General Assembly 2024, Vienna, Austria, 14–19 Apr 2024, EGU24-9355, https://doi.org/10.5194/egusphere-egu24-9355, 2024.

EGU24-9526 | Orals | NH1.5

On the radio wave polarization of Saturn lightning 

Georg Fischer, Ulrich Taubenschuss, David Pisa, and Masafumi Imai

The radio waves with Saturn lightning origin have been studied since the first detection by Voyager 1, but their wave polarization has rarely been explored. Fischer et al. (2007, JGR 112, A12308) examined lightning from a storm located at 35° south latitude and found its radio emissions below 2 MHz to be highly polarized (80%) in a right-handed circular sense with respect to the wave propagation direction. They explained this by absorption of the extraordinary mode in Saturn's ionosphere and the dominance of the ordinary mode emission, as the radio waves are propagating against a direction of the magnetic field when coming from a source in the southern hemisphere. A limited examination of Saturn lightning from the so-called Great White Spot at 35° north latitude by Fischer et al. (2011, Nature 475, 75-77) revealed radio wave polarization in the left-handed sense. In this presentation we will show the radio wave polarization of lightning from various other storms in Saturn's atmosphere, which have not been examined until today. In this way we want to corroborate the hypothesis that the sense of the circular radio wave polarization of Saturn lightning depends on the hemispherical location of the storm.

How to cite: Fischer, G., Taubenschuss, U., Pisa, D., and Imai, M.: On the radio wave polarization of Saturn lightning, EGU General Assembly 2024, Vienna, Austria, 14–19 Apr 2024, EGU24-9526, https://doi.org/10.5194/egusphere-egu24-9526, 2024.

EGU24-9986 | ECS | Orals | NH1.5 | Highlight

Potential gradient as a predictor of fog 

Caleb Miller, Keri Nicoll, Chris Westbrook, and R. Giles Harrison

Although fog is an important weather phenomenon, it remains difficult to predict using traditional methods. This could be improved by new observations-based nowcasting systems. It has long been understood that fog affects measurements of atmospheric electricity. However, there has been disagreement in the literature on whether these changes contain information which is valuable for fog prediction beyond other commonly used methods. Here, results are presented which show that the potential gradient (PG), a measure of atmospheric electricity, could be used as an additional diagnostic in predicting fog for timescales of several hours. A much larger dataset of fog and PG is examined than has been previously possible, which allows for a more robust understanding of the behaviour of the PG during radiation fog. It is found to increase by a median of 58 V/m by the start of the event. In addition, this increase is found to begin over two hours in advance of the fog, 30% of the time. This shows that PG may contain useful fog nowcasting information. A number of individual fog case studies are presented and the applicability of the general results to these specific cases is discussed. 

How to cite: Miller, C., Nicoll, K., Westbrook, C., and Harrison, R. G.: Potential gradient as a predictor of fog, EGU General Assembly 2024, Vienna, Austria, 14–19 Apr 2024, EGU24-9986, https://doi.org/10.5194/egusphere-egu24-9986, 2024.

EGU24-10352 | Orals | NH1.5

Cloud Microphysical Characteristics Associated with Blue Corona Discharges at thundercloud tops 

Dongshuai Li, Alejandro Luque, Torsten Neubert, Olivier Chanrion, Yanan Zhu, Jeff Lapierre, Nikolai Østgaard, and Víctor Reglero

Blue corona discharges are bursts of streamer discharges often observed at the top of thunderclouds, but the conditions in the clouds that generate them are not well understood.

The cloud microphysical parameters related to them are important for future empirical studies and for theoretical models and simulations. Previous studies modeled the scattering and absorption emissions from blue corona discharges by assuming mean particle radius of 10–20 μm and densities of 1–2.5 × 10^8 m^−3, resulting in photon mean free paths of 1–20 m.

Here we present the first-ever estimate of important microphysical parameters related to blue corona discharges based on data measurements from the CALIPSO lidar. The results showed that most blue corona discharges were associated with ice particles with a radius of ∼50 μm and a number density of ∼ 2 × 10^7 m^−3, resulting in a photon mean free path of ∼3 m.

Around 20% of the blue corona discharges coincide with Narrow Bipolar Events (NBEs) indentified from the Earth Networks Total Lightning Network.The altitudes of blue corona discharges that were identified as NBEs are derived from both the optical and radio bands. It revealed that in six out of nine cases, the R^2 value was greater than 0.85, indicating a good agreement between the two methods and supporting our estimate of the photon mean free path as 3 m. However, in the shallowest and deepest cases, there was some discrepancy between the altitudes determined by the two methods, suggesting more complex cloud microphysical parameters. Possible reasons for the discrepancy, such as the homogeneous approximation for the cloud's microphysical parameters and the simplification of the source length, will be discussed.

How to cite: Li, D., Luque, A., Neubert, T., Chanrion, O., Zhu, Y., Lapierre, J., Østgaard, N., and Reglero, V.: Cloud Microphysical Characteristics Associated with Blue Corona Discharges at thundercloud tops, EGU General Assembly 2024, Vienna, Austria, 14–19 Apr 2024, EGU24-10352, https://doi.org/10.5194/egusphere-egu24-10352, 2024.

EGU24-11101 | Orals | NH1.5

Mapping out lightning processes in both the VHF and VLF using LOFAR and the Met Office’s lightning detection system, LEELA 

Graeme Marlton, Brian Hare, Olaf Scholten, Mike Protts, Ed Stone, Sue Twelves, and Francesco Devoto

Lightning is one of the most destructive meteorological phenomena being a hazard to people and objects on the ground as well as aircraft. In addition to the strong currents and optical emission from a lightning stroke broadband radio emissions are also produced from the VLF to VHF. The LOw Frequency ARray (LOFAR) telescope centred in the Netherlands consists of a large array of VHF (30-300 MHz) receivers which can be configured to image a lightning strike in the 30-80 MHz bandwidth. The Met Office Lightning Electromagnetic Emission Location using Arrival time differencing LEELA system operates in the VLF (3-30 kHz). It also archives the raw incoming VLF data allowing the individual VLF waveforms to be analysed. From a lightning flash recorded in June 2021 over the Netherlands, 8 distinct events were detected by both systems. Here we present an analysis of these 8 events which include dart leaders, negative leaders, an intensely radiating negative leader and a cloud to ground strike. Initial results show that while both systems co-locate the events they are sensitive to different processes within the lightning strike process. VHF emission from a lightning strike is observed for periods of 30-40 ms and captures the development of the lightning channel. However, VLF emission is observed for much shorter periods of a few ms likely corresponding to the rapid vertical movement of charge during the strikes.

How to cite: Marlton, G., Hare, B., Scholten, O., Protts, M., Stone, E., Twelves, S., and Devoto, F.: Mapping out lightning processes in both the VHF and VLF using LOFAR and the Met Office’s lightning detection system, LEELA, EGU General Assembly 2024, Vienna, Austria, 14–19 Apr 2024, EGU24-11101, https://doi.org/10.5194/egusphere-egu24-11101, 2024.

EGU24-11257 | Orals | NH1.5

Locating charged regions in extensive layer cloud 

R.Giles Harrison and Keri Nicoll

Extensive layer clouds are common in Earth’s atmosphere. They acquire charge at their upper and lower boundaries, from the vertical current flowing in the global atmospheric electric circuit. The quantity of charge collected is related to the current, the transition distance from clear air to cloudy air at the cloud boundary, and the background cosmic ray ionisation. The transition distance is the region in which a change in conductivity occurs, which determines the charge acquisition. This differs between cloud top and cloud base. At cloud top, the boundary transition distance is closely related to the temperature inversion, which can be less than the transition distance at cloud base. At cloud base, the transition distance depends on droplet growth rate and updraft speed. The combined effects of the local ionisation, current flow and conductivity gradient leads to droplet charging.

Using instrumentation carried on enhanced meteorological radiosondes, the extent of the charged region in extensive layer clouds has been observed with specially developed cloud sensors operating at multiple optical wavelengths, simultaneously with the in situ electrical measurements. (Further, in some situations, ceilometer measurements of backscatter are also available). These soundings are compared with modelled profiles of droplet properties and layer cloud charges, for situations characteristic of mid-latitude and polar clouds. Effects of the droplet size distribution on the layer cloud electrification are also investigated, and responses to variations in cosmic ray ion production.

Charging is known to affect some aspects of the microphysical behaviour of droplets, such as their evaporation and growth rates. This may in turn influence properties of layer clouds in the climate system.

How to cite: Harrison, R. G. and Nicoll, K.: Locating charged regions in extensive layer cloud, EGU General Assembly 2024, Vienna, Austria, 14–19 Apr 2024, EGU24-11257, https://doi.org/10.5194/egusphere-egu24-11257, 2024.

EGU24-11482 | Orals | NH1.5 | Highlight

Thundercloud high-energy radiation production by long streamers 

Nikolai Lehtinen, David Sarria, Martino Marisaldi, Andrey Mezentsev, Nikolai Østgaard, Steven Cummer, and Yunjiao Pu

The novel Streamer Parameter Model (SPM) [Lehtinen, 2021, doi:10.1007/s11141-021-10108-5] allows to quickly calculate the shape, velocity, and electric field of an electric streamer in air, without resorting to lengthy hydrodynamic simulations. A streamer propagates faster as its length grows. When the streamer length exceeds several meters, the velocity may become comparable to the speed of light, which necessitates correcting the model for relativistic effects. Such long streamers may describe the experimentally observed fast positive and negative breakdown. We propose that they may produce large quantities of relativistic runaway electrons, and therefore x-rays. This is facilitated by several conditions: (1) electric fields at the streamer tip may be sufficiently close to the so-called thermal runaway threshold (~30 MV/m), at which free electrons may accelerate from thermal energies up to relativistic energies; (2) in negative streamers, the energetic electrons are synchronized in velocity with the streamer front; (3) the streamer tip radius may exceed tens of centimeters, providing a large volume of the high field where the thermal runaway acceleration may take place.

We apply SPM to long streamer propagation inside a thundercloud and calculate the relativistic runaway electron production, as well as radio, optical and x-ray radiation. The calculations are compared to the observations of Narrow Bipolar Events (NBE), Terrestrial Gamma Flashes (TGF), and luminous phenomena obtained during the recent ALOFT campaign.

How to cite: Lehtinen, N., Sarria, D., Marisaldi, M., Mezentsev, A., Østgaard, N., Cummer, S., and Pu, Y.: Thundercloud high-energy radiation production by long streamers, EGU General Assembly 2024, Vienna, Austria, 14–19 Apr 2024, EGU24-11482, https://doi.org/10.5194/egusphere-egu24-11482, 2024.

EGU24-11937 | Orals | NH1.5

Feedback Effects in Positive Corona and Relativistic Runaway Discharges 

Victor Pasko, Sebastien Celestin, Anne Bourdon, Reza Janalizadeh, and Jaroslav Jansky

We discuss characteristic scales and direct physical analogy between the photoionization feedback in conventional positive corona discharges in air and the photoelectric feedback in discharges driven by relativistic runaway electrons in air. In a positive corona system the avalanche of electrons in bulk of discharge volume is initiated by specific distribution of photoionization far away from the electrode.  Under inception conditions in positive corona each electron arriving at the anode creates on average just enough seed electrons in discharge volume through photoionization to replicate itself. Under these self-sustained steady state conditions, photoionization feedback produces just enough secondary electrons upstream of the avalanche to maintain the system in steady state. Analogically, in case of relativistic electron avalanches a feedback process is realized when X-rays emitted by these electrons travel backwards with respect to the electron motion and generate new relativistic electron seeds due to the photoelectric absorption in air. It is demonstrated that terrestrial gamma-ray flashes are produced by growth of long bidirectional lightning leader system consisting of positive and stepping negative leaders. The spatial extent of streamer zones of a typical lightning leader with tip potential exceeding several tens of megavolts is on the order of 10–100 m. The photoelectric absorption of bremsstrahlung radiation generated by avalanching relativistic runaway electrons occurs efficiently on the same spatial scales. The intense multiplication of these electrons is triggered when the size of the negative leader streamer zone crosses a threshold of approximately 100 m (for sea-level air pressure conditions) allowing self-replication of these avalanches due to the upstream relativistic electron seeds generated by the photoelectric absorption.

References: 
Pasko et al., GRL, 50, e2022GL102710, 2023, https://doi.org/10.1029/2022GL102710
Pasko et al., PSST, 32, 075014, 2023, https://doi.org/10.1088/1361-6595/ace6d0

How to cite: Pasko, V., Celestin, S., Bourdon, A., Janalizadeh, R., and Jansky, J.: Feedback Effects in Positive Corona and Relativistic Runaway Discharges, EGU General Assembly 2024, Vienna, Austria, 14–19 Apr 2024, EGU24-11937, https://doi.org/10.5194/egusphere-egu24-11937, 2024.

Terrestrial gamma-ray flashes (TGFs), powerful bursts of gamma-rays produced within our atmosphere, often occur in association with lightning. However, the mechanisms for generating the large number of runaway electrons required to account for the TGF luminosities remain uncertain. For example, TGFs might be produced by cold-runaway electron production from streamer heads and/or leader tips in the high-field regions near lightning, or TGFs might be produced by the self-sustained production of runaway electrons by relativistic feedback involving backward propagating runaway positrons and backscattered x-rays. Because both mechanisms could possibly occur in the presence of lightning leaders, it has been challenging to test which TGF production mechanisms are important. In this work, detailed simulations are used to test whether TGFs may be produced by thunderstorm electrification alone, without the presence if lightning. It is found that rapid thunderstorm charging may first produce strong gamma-ray glows, followed by large pulses of gamma-rays, followed by multi-pulsed TGFs similar to the TGFs first observed by CGRO/BATSE. Furthermore, the ionization produced by the high-energy particles partially discharges the electric field in some regions while amplifying the field in other regions, potentially allowing for the initiation of narrow bipolar events (NBEs) and/or lightning. If confirmed, such sequence of events would be strong evidence for the relativistic feedback mechanism.

How to cite: Dwyer, J. and Liu, N.: Gamma-ray glows and terrestrial gamma-ray flashes produced by thunderstorm electrification without lightning , EGU General Assembly 2024, Vienna, Austria, 14–19 Apr 2024, EGU24-12103, https://doi.org/10.5194/egusphere-egu24-12103, 2024.

EGU24-12247 | ECS | Orals | NH1.5

Investigating Storm Charge Distribution Trends with Intracloud Lightning Polarity Data 

Elizabeth DiGangi, Jeff Lapierre, and Yanan Zhu

There are, at present, two accepted primary paradigms for thunderstorm charge distribution using a simple tripole model: “normal” polarity storms, which are characterized by a central negative charge region, an upper positive charge region, and sometimes a lower positive charge region; and “inverted” polarity storms, which are characterized by a central positive charge region, an upper negative charge region, and sometimes a lower negative charge region. The real distribution of thunderstorm charge is known to be more complex than the tripole model can represent, but the normal/inverted paradigm is still widely used in the field. Characterizing storms as having a normal or inverted polarity has been a subject of interest in lightning research since discovering that inverted storms produce a larger-than-average fraction of positive amplitude cloud-to-ground (CG) lightning compared with normal storms. +CG lightning is understood to have generally higher peak currents and a much greater probability of producing continuing current than -CGs, which is relevant for research into subjects like lightning-initiated wildfires and transient luminous events. Thunderstorm charge distribution is also directly related to storm microphysics and thermodynamics, which, in turn, links it to the meteorological characteristics of storms and storm environments.

Most published research on storm polarity has either investigated large-scale trends in +CG versus -CG frequency from long-range lightning detection systems (LDSs), or has used LDSs which map lightning in 3D to infer storm polarity directly from intracloud (IC) lightning leader propagation patterns. Data on IC lightning from long-range LDSs is a resource which, to our knowledge, has not yet been used to study bulk storm charge structures. It stands to reason that if inverted storms favor the production of more +CGs than normal storms, then they would also favor the production of more -ICs. The goal of this study is therefore to interrogate several years of lightning data from the Earth Networks Total Lightning Network (ENTLN) to determine whether or not IC peak current information can be used to study storm charge structure and the geographic distributions of inverted and normal polarity storms.

How to cite: DiGangi, E., Lapierre, J., and Zhu, Y.: Investigating Storm Charge Distribution Trends with Intracloud Lightning Polarity Data, EGU General Assembly 2024, Vienna, Austria, 14–19 Apr 2024, EGU24-12247, https://doi.org/10.5194/egusphere-egu24-12247, 2024.

EGU24-12606 | Posters on site | NH1.5

CubeSpark: Space-based 3-D Lightning Mapping using a Constellation of Radio Frequency Sensors 

Sonja Behnke, Kim Katko, Harald Edens, Patrick Gatlin, Timothy Lang, William Haynes, Paul Snow, Jeremiah Rushton, Joellen Renck, Charley Weaver, Larry Bronisz, Jacob Pratt, Steven Dobson, Nikhil Pailoor, Jackson Remington, and Sarah Stough

CubeSpark is a new concept for a constellation of CubeSats that combines bi-spectral optical lightning imaging with radio frequency (RF) sensing to provide a 3-D lightning detection capability with global coverage from low-Earth Orbit. The development of CubeSpark is a collaboration between Los Alamos National Laboratory and NASA Marshall Space Flight Center. CubeSpark innovates over current ground and space-based global lightning capabilities by determining the altitude of lightning radiation sources, enabling new science in thunderstorm processes and the impact of lightning on climate. The key to determining the altitude of lightning is using a constellation of RF sensors to make coordinated measurements of impulsive RF radiation sources, similar to the approach of a ground-based lightning mapping array. The RF measurements will be enhanced with bi-spectral optical sensors to improve overall lightning detection efficiency and provide additional, complementary information about lightning processes.

This presentation introduces the CubeSpark mission concept and science applications with a focus on the RF hardware under development. Two challenges of space-based RF lightning detection are ionospheric effects and RF noise from both the satellite bus and anthropogenic sources from Earth. While the process of removing ionospheric dispersion from broadband waveforms for time-of-arrival (TOA) estimation is well established, CubeSpark further reduces ionospheric impacts on TOA by using a circularly polarized antenna, which suppresses one of the birefringent wave modes. For noise reduction, the CubeSpark receiver leverages programmable high- and low-pass filters to allow for on-orbit modifications of its passband. A benchtop demonstration of the RF hardware has been completed.

How to cite: Behnke, S., Katko, K., Edens, H., Gatlin, P., Lang, T., Haynes, W., Snow, P., Rushton, J., Renck, J., Weaver, C., Bronisz, L., Pratt, J., Dobson, S., Pailoor, N., Remington, J., and Stough, S.: CubeSpark: Space-based 3-D Lightning Mapping using a Constellation of Radio Frequency Sensors, EGU General Assembly 2024, Vienna, Austria, 14–19 Apr 2024, EGU24-12606, https://doi.org/10.5194/egusphere-egu24-12606, 2024.

EGU24-12658 | Posters on site | NH1.5

GLM lightning flashes observed during ASIM triggers over Tropical South America 

Carlos Morales, Joan Montanyà, Jesus Lopéz, Oscar Van Der Velde, Nicolai Østgaard, Torsten Neubert, and Víctor Reglero

The Atmosphere-Space Interactions Monitor (ASIM) on board the International Space Station (ISS) is collecting data of lightning and Terrestrial Gamma Flashes (TGF) over the globe since April 2018 by means of two suites: i) modular multispectral imaging array (MMIA); and ii) modular X and gamma-ray sensors (MXGS). MMIA responds to lightning flashes, while high energy detector (HED) and low energy detector (LED) of MXGS are employed to estimate TGF spectra and source. Based on these features, ASIM is providing a large dataset of MMIA, LED and HED triggers that are used identify potential TGF events that require an extra imaging analysis to depict the exact location and validation. Upon such measurements, this study employs coincident ASIM and GLM lightning flashes over Tropical South America (90-30W and 20S-10N) to inspect if the electrically active thunderstorms present unequivocal features associated with each ASIM trigger, i.e., MMIA, LED, HED and TGF. Electrically active thunderstorms were identified as contiguous GLM lightning flashes clustered at 0. 1 x 0.1 degrees on ± 30 minutes of ASIM trigger time following Barnes et al. (2015) and Morales et al. (2021) procedures. During the period of 2018 and 2021, we were able to find 30,417 active thunderstorms that have lightning flashes within ± 3 seconds of trigger time (19,546 during the night and 10,871 during the day). Of those thunderstorms, 343 (1,745) were identified with HED, 278 (1,752) with LED, 12,858 (27811) with MMIA and 49 (116) with TGF within 0-200 ms (200ms-3 sec) of the trigger time. The spatial distribution of those thunderstorms do not show any lightning hot spot. MMIA thunderstorms coincide with the location of HED and LED thunderstorms, except HED thunderstorms over the Peruvian Andes mountain range. Moreover, we did not find any TGF thunderstorms along the mountain regions, especially in Peru and Ecuador. The 60 minutes lightning activity (# flashes/per minute) reveal that TGF thunderstorms show higher lightning flash rates than the MMIA, HED and LED triggered thunderstorms, in addition of a sudden lightning flash rate increase prior to the TGF trigger and sustained high lightning activity for the following 10 minutes. HED and LED show similar lightning temporal evolution (flash rate increase before the trigger and decay afterwards), but LED triggered thunderstorms have higher flash rates over the entire 60 minutes time period. MMIA triggered thunderstorms show the lowest flash rates and almost steady lightning activity during the entire 60 minutes. Based on 90% confidence level of T-Student test, we found that TGF and MMIA thunderstorms are statistical different during the entire 60 minute time period, meaning that not all MMIA thunderstorms produce TGFs. In another hand, we can state that HED and LED triggers are good indicators of TGF emissions, since they are not statistically different, meaning that these parameters could be used as triggers to identify TGF occurrences.

How to cite: Morales, C., Montanyà, J., Lopéz, J., Van Der Velde, O., Østgaard, N., Neubert, T., and Reglero, V.: GLM lightning flashes observed during ASIM triggers over Tropical South America, EGU General Assembly 2024, Vienna, Austria, 14–19 Apr 2024, EGU24-12658, https://doi.org/10.5194/egusphere-egu24-12658, 2024.

EGU24-13074 | ECS | Posters on site | NH1.5 | Highlight

A Deep Learning Approach to Lightning Nowcasting and Forecasting 

Randall Jones, Joel Thornton, Dale Durran, Lyatt Jaeglé, Christopher Wright, and Robert Holzworth

Lightning plays a fundamental role in Earth’s climate system and is a frequently occurring natural hazard. However, lightning remains a relatively unpredictable area of meteorology, especially in terms of lightning frequency per convective event, with limited ability for nowcasting and forecasting of lightning occurrence. The goal of this study is to develop a deep learning algorithm able to replicate lightning stroke density on a climatological average, as well as on a convective feature basis. We use a convolutional neural network (CNN) containing combinations of the following variables at 0.5-degree by 0.5-degree spatial resolution and a 3-hourly temporal-resolution over a domain that encompasses most of the Western Hemisphere: lightning from the World-Wide Lightning Location Network (WWLLN), precipitation rate from NASA’s Integrated Multi-satellite Retrievals for GPM (IMERG) and convective available potential energy (CAPE), cloud base height (CBH), two-meter temperature (T2M) and zero degree level (ZDL) from the European Centre for Medium-Range Weather Forecasting (ECMWF). We train the CNN on the years from 2010 to 2018, and tested on the years 2019 to 2022. Model performance was evaluated on a four-year average through changes to the initial seed used to train the model, the loss function used, transformations to the lightning dataset, and changing the spatial and temporal resolution of the input datasets. We further examined the value of 11 input variable combinations, from single variables to all five variables used in training. Preliminary results show that changing the initial seed, as well as changing the loss function from mean squared error to mean-squared logarithmic error, does not greatly impact model performance when running the model with more than one input variable. Results vary amongst the variable combinations, but amongst the different initial seeds and loss functions, the r-squared values remain above 0.75 for every model configuration over both land and ocean. Model performance is improved when using higher time resolution training set but not necessarily a higher spatial resolution. For example, a 1-degree by 1-degree spatial resolution and a 3-hourly time resolution resulted in an r-squared between predicted and observed lightning frequency 0.1 higher than that using 0.5-degree by 0.5-degree spatial resolution and a daily time resolution. The model is able to reproduce the approximate evolution of lightning stroke density of individual convective events, but tends to overestimate the stroke density on a 3-hourly basis. Future work will include a steeper penalty for overestimating lightning occurrence during training. These results show that larger-scale weather forecasting and earth system models could significantly improve lightning stroke density parameterizations by incorporating deep learning results.

How to cite: Jones, R., Thornton, J., Durran, D., Jaeglé, L., Wright, C., and Holzworth, R.: A Deep Learning Approach to Lightning Nowcasting and Forecasting, EGU General Assembly 2024, Vienna, Austria, 14–19 Apr 2024, EGU24-13074, https://doi.org/10.5194/egusphere-egu24-13074, 2024.

EGU24-13383 | ECS | Posters on site | NH1.5

Peak currents of terminating flashes in thunderstorm ground enhancements around Mt Aragats, Armenia 

Gayane Karapetyan, Earle Williams, Hripsime Mkrtchyan, and Reik V. Donner

Thunderstorm ground enhancements (TGEs) are high-energy particle fluxes detected at the ground level during thunderstorms. It has been observed that some TGEs experience abrupt termination by lightning strikes (Chilingarian 2015, Tsuchiya 2013, Williams et al., 2022) often accompanied by simultaneous reductions in flux. Understanding the origin and parameters of terminating lightning can provide insights into the distribution of electric fields and potential within thunderclouds. 

Thundercloud potential is a key factor in determining the maximum peak current of lightning. One expects a linear relationship between peak current and cloud potential because the charge that is deposited on the leader channel is proportional to the leader potential (e.g. Chronis et. al. 2015). 

This study evaluates peak currents in terminating flashes documented in TGEs observed around Mt Aragats (Armenia) using a ground-based VLF lightning detection network, GLD360. A total of 71 terminating flashes have been identified over a period of 6 years (2017-2022). The events documented at Aragats were detected by particle detectors that showed the abrupt decrease in flux associated with lightning. These events were accurately timed using an EFM100 electric field mill (resolution of 2Hz). Thereafter, correlations between these events and the corresponding GLD360 lightning events were established, using millisecond precision times of GLD360 and electric field mill.

Our findings show that the mean peak current of this collection of terminating flashes (45 kA) is 3.4 times higher than that of the general population of lightning flashes measured in the same location (13.6 kA) over a similar period of time. However, it is difficult to define the relationship between the change in electric field during TGE or lightning and the peak currents. It appears that lightning with smaller peak currents tends to have larger values of the change of electric field, while lightning with larger peak currents is characterized by an average change in the electric field.

This research provides insights into peak currents of terminating lightning flashes with general parameters of the TGEs, such as duration and flash rate. Additionally, it shows that flashes with extremely high peak currents occur during thunderstorms with smaller flash rates and are located within 10 km distance from the particle detectors. Furthermore, flash rates of thunderstorms with terminating lightning are larger compared to general thunderstorms without TGEs.

How to cite: Karapetyan, G., Williams, E., Mkrtchyan, H., and Donner, R. V.: Peak currents of terminating flashes in thunderstorm ground enhancements around Mt Aragats, Armenia, EGU General Assembly 2024, Vienna, Austria, 14–19 Apr 2024, EGU24-13383, https://doi.org/10.5194/egusphere-egu24-13383, 2024.

EGU24-13989 | Posters on site | NH1.5

C3IEL, the Cluster for Cloud evolution ClImatE and Lightning mission to study convective clouds at high spatial and temporal resolutions 

Eric Defer, Celine Cornet, Daniel Rosenfeld, Cecile Cheymol, Adrien Deschamps, Alex Frid, Laurene Gillot, Vadim Holodovsky, Avner Kaidar, Raphael Peroni, Colin Price, Didier Ricard, Antoine Rimboud, Yoav Schechner, Aviad Shmaryahu, and Yoav Yair

The French-Israeli space-borne C3IEL (Cluster for Cloud evolution, ClImate and Lightning) mission aims at providing new insights on convective clouds, at high spatial and temporal resolutions, close to the scales of the individual convective eddies. The mission will simultaneously characterize the convective cloud dynamics, the interactions of clouds with the surrounding water vapor, and the lightning activity.

The C3IEL mission consists in a short-baseline (~150 km) train of 2 synchronized nano-satellites. Each nano-satellite carries a visible camera (670 nm) for cloud imagery at a spatial resolution of ~20 meters, near-infrared water vapor imagers (1.04, 1.13 et 1.37 µm) measuring in and near the water vapor absorption bands, and a lightning imager (777.4 nm) and at least one photometer (777.4 nm).

The scientific objectives of the C3IEL mission, i.e. documenting the 3D evolution of the clouds’ surface, entrainment of water vapor, and electrification, will be first reminded. Then, we will introduce the satellite train configuration, the different sensors of the mission and the innovative and different observational strategy that will be applied during daytime and nighttime. We will then detail the expected observations and products, including the ones related to lightning.

How to cite: Defer, E., Cornet, C., Rosenfeld, D., Cheymol, C., Deschamps, A., Frid, A., Gillot, L., Holodovsky, V., Kaidar, A., Peroni, R., Price, C., Ricard, D., Rimboud, A., Schechner, Y., Shmaryahu, A., and Yair, Y.: C3IEL, the Cluster for Cloud evolution ClImatE and Lightning mission to study convective clouds at high spatial and temporal resolutions, EGU General Assembly 2024, Vienna, Austria, 14–19 Apr 2024, EGU24-13989, https://doi.org/10.5194/egusphere-egu24-13989, 2024.

EGU24-14531 | ECS | Posters virtual | NH1.5

Identifying atmospheric conditions for intermittent, small-scale lightning discharges near the top of thunderstorms 

Reinaart van Loon, Jelle Assink, Olaf Scholten, Brian H Hare, and Hidde Leijnse

Despite its impact on society, many aspects of lightning, including the initiation and propagation, remain poorly understood. This also applies to a distinct type of intermittent small-scale lightning discharges recorded by the Low-Frequency Array (LOFAR) in the Netherlands (Scholten et al., 2023). The so-called “sparkles” seem uncorrelated and occur relatively high up in thunder clouds near the tropopause. This research investigates the meteorological conditions under which sparkles exist.  

Previous literature suggests a correlation between sparkles and strong updrafts. One hypothesis proposes that powerful updrafts overshooting the level of neutral buoyancy causes a charged screening layer aloft to be entrained into the cloud, resulting in charge pockets. Alternatively, some hypothesize that turbulence plays a vital role in discharge initiation and charge sedimentation. Therefore, intense turbulence near the top of strong updrafts could not only initiate numerous discharges, but could also influence the lightning structures through the spatial charge distribution. 

This project aims to improve the understanding of sparkles by comparing high- resolution LOFAR lighting data with meteorological data. Specifically, thunderstorm dynamics are studied using data from satellites, radar and the HARMONIE weather forecast model. Following the hypotheses, relations are explored between sparkling activity and factors such as updrafts strength, turbulence, mixing, and entrainment of the air aloft.

Scholten, O., Hare, B. M., Dwyer, J., Liu, N., Sterpka, C., Assink, J., ... & Veen, S. T. (2023). Small‐Scale Discharges Observed Near the Top of a Thunderstorm. Geophysical Research Letters, 50(8), e2022GL101304. 

How to cite: van Loon, R., Assink, J., Scholten, O., Hare, B. H., and Leijnse, H.: Identifying atmospheric conditions for intermittent, small-scale lightning discharges near the top of thunderstorms, EGU General Assembly 2024, Vienna, Austria, 14–19 Apr 2024, EGU24-14531, https://doi.org/10.5194/egusphere-egu24-14531, 2024.

EGU24-14754 | Orals | NH1.5

Quantitative detection device for NOx of centimeters-discharge and its preliminary applications in laboratory long spark and rocket-triggered lightning 

Rubin Jiang, Yufan Ren, Ruiling Chen, Hongbo Zhang, Mingyuan Liu, Xinran Xia, Jianwen Wu, Dongfang Wang, Kun Liu, and Xiushu Qie

A quantitative detection device for nitrogen oxides (NOx) produced by the centimeters-scale discharge channel is designed, consisting of a container made of high-strength acrylic Plexiglas, two copper metal electrodes fixed to the top and bottom of the container, a pumping system and a back-end NOx detector. Inside the container, the gap between the two copper electrodes is 4 cm in length. When a discharge occurs between the electrodes, the NOx produced by the air ionization are confined within the container to provide a quantitative measurement. The device can be used in the laboratory long spark and rocket-triggered lightning scenarios, with container volumes of 12.2 L and 58.8 L, respectively, both of which ensure an accurate measurement of the discharge current. In the laboratory long spark scenario, the device is placed under the discharge electrode of the Marx generator. As the discharge is generated, the discharge strikes the upper copper metal electrode and leads to the gap breakdown within the container, then the current is released through the bottom copper metal electrode to the ground. In the rocket-triggered lightning scenario, the device is fixed between the current sensor and the grounding system. The triggered discharge leads to the gap breakdown within the container, and the current is also released through the bottom copper metal electrode to the ground. After the discharge, the gas in the canister is pumped to the NOx concentration meter. The instruments used are the Thermo, which uses a chemical method to measure NO and NOx concentrations with a time resolution of 1 minute, and the LGR-NO2, which uses an optical method to measure NO2 concentrations with a time resolution of 1 second. The preliminary experiment shows that the 4 cm long discharge due to the laboratory long spark with a peak current of about 2 kA produced 6.8×10¹⁷ NO2 molecules. In an unsuccessful triggering lightning case, the discharges due to the precursors also lead to significant NOx signals.

How to cite: Jiang, R., Ren, Y., Chen, R., Zhang, H., Liu, M., Xia, X., Wu, J., Wang, D., Liu, K., and Qie, X.: Quantitative detection device for NOx of centimeters-discharge and its preliminary applications in laboratory long spark and rocket-triggered lightning, EGU General Assembly 2024, Vienna, Austria, 14–19 Apr 2024, EGU24-14754, https://doi.org/10.5194/egusphere-egu24-14754, 2024.

EGU24-15389 | ECS | Posters on site | NH1.5

TGFs observed by the ALOFT 2023 flight campaign during an ISS overpass 

Ingrid Bjørge-Engeland, Nikolai Østgaard, Timothy Lang, Martino Marisaldi, J. Eric Grove, Mason Quick, Hugh Christian, Christopher Schultz, Richard Blakeslee, Ian Adams, Rachael Kroodsma, Gerald Heymsfield, Andrey Mezentsev, David Sarria, Anders Fuglestad, Nikolai Lehtinen, Kjetil Ullaland, Shiming Yang, Bilal Hasan Qureshi, and Jens Søndergaard and the ALOFT team

During the Airborne Lightning Observatory for FEGS and TGFs (ALOFT) campaign in July 2023, the International Space Station (ISS), at an altitude of approximately 410 km, passed over the same region as covered by ALOFT within a short time period on the 24th of July. The ALOFT campaign, which carried gamma-ray detectors, photometers, and instruments for characterizing the electrical activity and the cloud environment, flew at an altitude of approximately 20 km and covered thunderstorms over the Gulf of Mexico and Caribbean during its 60 flight hours. The Atmosphere-Space Interactions Monitor (ASIM) is mounted on the ISS, with its Modular X- and Gamma-ray Sensor (MXGS) designed for observing TGFs. During the ISS overpass, ALOFT observed six TGFs within less than two minutes that were all within the field of view of the ASIM instrument. However, none of the TGFs were detected by ASIM. Here we present the six TGFs observed by ALOFT during the ISS overpass and discuss their source properties. The ASIM non-detection provides a strong upper limit on the TGF fluence.

How to cite: Bjørge-Engeland, I., Østgaard, N., Lang, T., Marisaldi, M., Grove, J. E., Quick, M., Christian, H., Schultz, C., Blakeslee, R., Adams, I., Kroodsma, R., Heymsfield, G., Mezentsev, A., Sarria, D., Fuglestad, A., Lehtinen, N., Ullaland, K., Yang, S., Hasan Qureshi, B., and Søndergaard, J. and the ALOFT team: TGFs observed by the ALOFT 2023 flight campaign during an ISS overpass, EGU General Assembly 2024, Vienna, Austria, 14–19 Apr 2024, EGU24-15389, https://doi.org/10.5194/egusphere-egu24-15389, 2024.

EGU24-15691 | ECS | Posters on site | NH1.5

Supervised Machine Learning for the Automatic Classification of Triggers from ASIM/MXGS on board the ISS 

Jose E. Adsuara, Javier Navarro-González, Paul Connell, Víctor Reglero, Nikolai Østgaard, and Torsten Neubert

During ASIM operations from June 2018 until the end of 2019, 486 TGFs were observed. For this task, the ASDC (ASIM Science Data Center) dealt with numerous triggers from the instrument (5000 per week). The relocation of the instrument from EPF SDX to EPF SDN (Starboard Deck Nadir) of the Columbus ISS Module on January 10, 2022, demonstrated that the MXGS location capabilities could be used not only for TGF location but also for imaging GRB events, as its Field of View in the SDN port encompasses both Earth and space.

It's worth noting that only a few of the ASIM triggers correspond to TGF events. There is a screening process employing a series of algorithms to detect and discard false positives (triggers that are not TGFs). Nevertheless, the ASIM archive retains all data from every trigger. Due to the extended operational time, there is currently a sufficiently large database that enables us to present the initial results here using novel machine learning methods, such as kernel methods or neural networks, for the automatic categorization of both present and future events.

Furthermore, our interest goes beyond mere classification, as we are currently investigating whether various explainability methods applied to these techniques can assist in identifying the relevant features of the signal for such classification. The aim of this work is to provide a tool to quantify new physical processes that could be the cause of instrument triggers and to examine whether there is a connection with the Earth-Space global circuit.

How to cite: Adsuara, J. E., Navarro-González, J., Connell, P., Reglero, V., Østgaard, N., and Neubert, T.: Supervised Machine Learning for the Automatic Classification of Triggers from ASIM/MXGS on board the ISS, EGU General Assembly 2024, Vienna, Austria, 14–19 Apr 2024, EGU24-15691, https://doi.org/10.5194/egusphere-egu24-15691, 2024.

EGU24-16929 | Orals | NH1.5

Constraining electrification of volcanic plumes through numerical simulation 

Michael Herzog, Vishnu Nair, Alexa Van Eaton, and Ted Mansell

Technological improvements over the past decade have dramatically increased lightning detection from explosive eruptions worldwide. The underwater Hunga Tonga-Hunga Ha’apai volcano eruption in January 2022 in Tonga produced more lightning than any storm yet documented in the modern satellite era. These observations of volcanic lightning capture the imagination of the public and provide novel ways to monitor explosive hazards in near real time. In this presentation, we present the first results from the numerical simulation of the electrification of a volcanic plume using the volcanic plume model ATHAM. The electrification mechanisms of fracto-emission and triboelectrification along with the macroscopical transport of the charge carrying plume components have been modelled in ATHAM to make this the first numerical model to quantify volcanic electrification. We also present first results of discrete lightning discharges which are diagnosed as continuous branching regions defined by local net charge density and electric potential. 

The enhanced modelling capability of ATHAM opens new routes into the study of explosive eruptions and nowcasting of volcanic ash hazards for aviation and downwind communities. 

How to cite: Herzog, M., Nair, V., Van Eaton, A., and Mansell, T.: Constraining electrification of volcanic plumes through numerical simulation, EGU General Assembly 2024, Vienna, Austria, 14–19 Apr 2024, EGU24-16929, https://doi.org/10.5194/egusphere-egu24-16929, 2024.

EGU24-17483 | ECS | Orals | NH1.5

Characterisation and modelling of lightning strikes as point events in time and space 

Uldis Zandovskis, Davide Pigoli, and Bruce D. Malamud

Lightning, a spatio-temporal phenomenon, comprises of individual strikes with specific occurrence times and spatial coordinates. This study models and characterises lightning strikes from single thunderstorms, treating each strike as a point event. Utilising real-world datasets, we characterise and model lightning strikes' physical properties. Our analysis involves two severe UK thunderstorm systems, selected based on published synoptic analyses. These systems enable subdivision of the lightning dataset into subsets, each representing a distinct thunderstorm. Our two major storm systems feature three thunderstorms each: Storm system A with 7955, 11988, and 5655 strikes over the English Midlands on 28 June 2012; Storm system B with 4218, 455, and 1926 strikes characterised over the northern England on 1-2 July 2015. These six datasets exemplify individual thunderstorms and a total of three physical attributes are : movement speed, lightning inter-event time distribution, and spatial spread about the storm track. Applying least-squares plane and linear fits in the spatio-temporal and lag spaces, we estimate movement speeds of 47-59 km/h and 67-111 km/h for Storm systems A and B, respectively. The inter-event time distribution ranges from 0.01 to 100 seconds, with density peaks around 0.1 seconds and at 1-10 seconds. Autocorrelation analysis in natural time reveals significant autocorrelation in all storms, varying from short-range to long-range. For spatial spread, calculated as the distance from the storm track to the strikes, we employ a linear filter to establish the storm track. This analysis yields typical spatial spreads up to 80 km in either northing or easting dimensions, with an outlier of 226 km in the northing dimension for one storm. The paper concludes with a synthetic lightning strike model. This model allows selection of individual storms' starting points, directions, and movement speeds, generating point events based on our characterisation findings. This comprehensive study of lightning strikes in time and space accurately reflects severe thunderstorms' behaviour and informs statistical models for simulating lightning events.

How to cite: Zandovskis, U., Pigoli, D., and Malamud, B. D.: Characterisation and modelling of lightning strikes as point events in time and space, EGU General Assembly 2024, Vienna, Austria, 14–19 Apr 2024, EGU24-17483, https://doi.org/10.5194/egusphere-egu24-17483, 2024.

EGU24-18529 | Orals | NH1.5

Analysis of an upward discharge above a thundercloud over Mediterranean Sea 

Serge Soula, Gabriel Hausknost, Axel Ventre, Sylvain Coquillat, Janusz Mlynarczyk, and Alex Hermant

On the night of November 1st, 2022, several weather photographers obtained remarkable photos showing a jet-like phenomenon with long blue filaments above a Mediterranean storm. An unprecedented set of optical and electrical data, including two pictures, one movie, VHF sources from a Lightning Mapping Array (LMA), detections from a LLS and Current Moment Waveforms from an ELF detection, makes it possible to characterize this event. It consists of a two-part upward luminous channel emerging from the cloud top at 11.8 km of altitude, developing up to 14.2 km and topped with blue streamers up to 17.2 km. It is embedded in a flash which starts with a positive 25 kA-discharge followed by a continuing current during 75 ms associated with VHF sources at 10 km. Contrary to blue jets and blue starters which have a positive polarity, the luminous event above the cloud is identified as a negative leader followed by three channel brightenings linked to the negative charge of a positive cloud dipole. The luminous event-producing flash is preceded by a convective surge and a production of positive flashes within the same region of the cloud. The triggering conditions and mechanisms of the event share similarities with gigantic jets, especially its polarity and a reduced upper positive charge.

How to cite: Soula, S., Hausknost, G., Ventre, A., Coquillat, S., Mlynarczyk, J., and Hermant, A.: Analysis of an upward discharge above a thundercloud over Mediterranean Sea, EGU General Assembly 2024, Vienna, Austria, 14–19 Apr 2024, EGU24-18529, https://doi.org/10.5194/egusphere-egu24-18529, 2024.

EGU24-18594 | Orals | NH1.5 | Highlight

Observations of thunderstorms with a neuromorphic camera: First results of the THOR-DAVIS experiment on the International Space Station. 

Olivier Chanrion, Nicolas Pedersen, Yoav Yair, Martin Stendel, Andreas Mogensen, Dongshuai Li, Andreas Stokholm, and Torsten Neubert

THOR-DAVIS is an experiment on the International Space Station to observe thunderclouds and their electrical activity with a neuromorphic camera and a co-aligned video camera. A neuromorphic camera, or 'event camera,' only reads pixels when there is a change in pixel illumination, allowing for a temporal resolution that may reach 10 microseconds. Launched by the SpaceX Commercial Resupply Service mission on June 5, 2023, THOR-DAVIS was part of Danish ESA astronaut Andreas Mogensen’s Huginn mission. The scientific focus was to conduct video observations of electrical activity at the cloud tops and the stratosphere above and to extract their altitudes. The technical objective was to test the neuromorphic concept for observations of thunderstorms from space. Andreas Mogensen performed 15 days of observations, passing over 48 thunderstorms, most forecasted by us a day in advance following a procedure inherited from previous ISS experiments (THOR (2015), ILAN-ES (2022)) and some at his own initiative. In all, 36 thunderstorms were recorded in both cameras, totaling ~3 hours of observations. Most notably, Andreas Mogensen secured the first observations of sprites and of an elve with a neuromorphic camera. In addition, numerous lightning flashes, including spider lightning with leader branches extending above the clouds, were observed. The presentation will provide an overview of the THOR-DAVIS payload design, laboratory measurements, and some of the observations from the ISS.

How to cite: Chanrion, O., Pedersen, N., Yair, Y., Stendel, M., Mogensen, A., Li, D., Stokholm, A., and Neubert, T.: Observations of thunderstorms with a neuromorphic camera: First results of the THOR-DAVIS experiment on the International Space Station., EGU General Assembly 2024, Vienna, Austria, 14–19 Apr 2024, EGU24-18594, https://doi.org/10.5194/egusphere-egu24-18594, 2024.

EGU24-18787 | Orals | NH1.5

Machine Learning to predict Downbursts in Japan Based on Total Lightning and Ground Precipitation Data 

Alexander Shvets, Yasuhide Hobara, Shiho Miyashita, Hiroshi Kikuchi, Jeff Lapierre, and Elizabeth DiGangi(

In this study, using total lightning data from the Japan Total Lightning Network (JTLN) and precipitation data from X-band MP radar, machine learning with a Random Forest model was used to successfully classify the occurrence of downbursts in Japan. TL data associated with the event is collected from JTLN which consists of 11 Earth Networks Total Lightning Sensorsover Japan (data set in 2017, currently 16 stations nationwide) deployed by the UECand jointly operated with Earth Networks. These sensors can detect lightning pulses with a spatial resolution of 500 m. TL parameters such as types of lightning (IC and CG), time of occurrence (UT), location (latitude-longitude), and lightning polarity were collected for each lightning discharge. Ground precipitation data (temporal resolution of 1min, spatial resolution of 250m) from the Ministry of Land, Infrastructure, Transport, and Tourism’s eXtended RAdar Information Network (XRAIN) composed of 26 C-band radars and 39 X-band multiparameter (X-MP) radars are used. Fourteen thunderstorms causing gusty winds and 33 of those without causing gusty winds that occurred in Japan from 2014 to 2017 were analyzed. AITCC (Algorithm for the Identification and Tracking of Convective Cells) was applied to track both precipitation cell and associated lightning discharges. By using Random Forest model, the importance of variables was derived, and it was shown that lightning jump is one of the most important variables for predicting downbursts. This implies that the updrafts inside the clouds are closely related to the occurrence of a significant increase in lightning, followed by a downburst. The prediction accuracy was highest for models that included both lightning and precipitation, followed by lightning-only and precipitation-only models, confirming the importance of data fusion for improving prediction accuracy.

How to cite: Shvets, A., Hobara, Y., Miyashita, S., Kikuchi, H., Lapierre, J., and DiGangi(, E.: Machine Learning to predict Downbursts in Japan Based on Total Lightning and Ground Precipitation Data, EGU General Assembly 2024, Vienna, Austria, 14–19 Apr 2024, EGU24-18787, https://doi.org/10.5194/egusphere-egu24-18787, 2024.

EGU24-20590 | Orals | NH1.5

Re-discharges on preexisting negative leader channels of a positive cloud-to-ground lightning flash  

Zhuling Sun, Xiushu Qie, Mingyuan Liu, and Fengquan Li

Using the lightning VHF interferometer, three types of discharges on the preexisting negative leader channels of a positive cloud-to-ground lightning flash were observed. The first type involved small-scale cluster discharges during the simultaneous development of the upper horizontally negative leader and downward positive leader before the return stroke. These discharges exhibited similar characteristics and radiation features as the needle-like discharges on the positive leader. Over time, their occurrence positions progressed toward the head of the negative leader, and some cluster discharges had the potential to develop into new negative branches. The other two types of re-discharges occurred after the return stroke. Immediately after the return stroke, rapid discharges initiated near the head of the negative leader, developed along the preexisting negative leader channel, and caused the decayed negative leaders to progress forward again. Subsequently, numerous lateral discharges breaking down the air occurred, distributed widely throughout the negative leader channel. These discharges developed rapidly, gradually slowing down over time until the long continuous current ended. In comparison to the positive leader discharges before the return stroke, which showed no obvious recoil leader discharges, the negative leader channel was more prone to extinguish. These re-discharges on the preexisting negative leader channel were influenced by both radial and longitudinal electric fields of flash channels, and they could also generate a backward surging current wave to sustain the discharge process on the positive leader or grounded channel.

How to cite: Sun, Z., Qie, X., Liu, M., and Li, F.: Re-discharges on preexisting negative leader channels of a positive cloud-to-ground lightning flash , EGU General Assembly 2024, Vienna, Austria, 14–19 Apr 2024, EGU24-20590, https://doi.org/10.5194/egusphere-egu24-20590, 2024.

EGU24-20630 | Orals | NH1.5

eLMA: Supercells over the Upgraded Ebro 3D Lightning Mapping Array and High-speed Observations of Lightning in the Near-Ultraviolet 

Oscar van der Velde, David Romero, Jesús López, Joan Montanyà, and Nicolau Pineda

In 2011, the Ebro 3D Lightning Mapping Array was the first LMA installed outside the USA, consisting of 12 stations in 2012-2014 and was subsequently split in half in 2015 to facilitate a LMA in Colombia.

Thanks to research infrastructure service funding from the Spanish government and the European Union (MCIN/AEI/10.13039/501100011033/ and NextGenerationEU, project EQC2021-006957-P), the Ebro LMA has been upgraded to a wider area network operating 15 latest technology LMA stations operating on solar power in the Ebro Valley region (western Catalonia and eastern Aragón). New services are offered: (1) Real-time tracking of lightning flashes across northeastern Spain, available to the public via the website elma.upc.edu. (2) Archive of plotted data that can be browsed freely, including for the old Ebro LMA data. (3) Raw/processed data can be requested. (4) LMA rental is possible for field campaigns.

We developed a new processing & visualization tool for flash/thunderstorm analysis and future integration with the new EUMETSAT Lightning Imager (LI). It is written in the Julia programming language for its speed of processing with the Makie interactive graphics package. Additionally, we present a new tool for displaying regional maps of actual (not computed) LMA station contributions to assess the network performance. The capabilities of the new Ebro LMA are showcased with record-setting horizontal lightning flashes, several large-hail producing supercells with high flash rates, a lightning hole, and rising turrets of small flashes and sparks at the cloud top, which can now be isolated and analyzed with the Julia visualization tool. The electrical evolution features of these supercells are examined in relation to their timeline of severe weather production.

Additionally, a Vision Research Phantom TMX 6410 and UV-sensitive Lambert HiCATT 25 image intensifier with optics and filters were acquired, and is also available to third parties via eLMA rental services. During spring/summer 2023 it has been successfully used to image lightning leaders through a 337 nm optical narrowband filter (10 nm width) similar to imaging systems of the Atmosphere-Space Interactions Monitor (ASIM), at speeds of 65,000 to 320,000 frames per second. We found that observation distances <4 km are needed in order to be able to see the stepped leader in negative cloud-to-ground flashes. However, in only one case, of an intense burst of horizontal leader activity below the cloud base, negative streamers can be clearly distinguished and the stepping process analyzed over time. At greater distances only return strokes and dart leaders are tracked through the 337 nm filter. In fact, a >418 ms long continuing current negative return stroke (cut off by end of buffer) was observed. Also, the system captured elves, nocturnal optical emissions at the base of the ionosphere (85 km) over Mediterranean winter thunderstorms, clearly showing the typical double-wave structure originally reported by photometer arrays.

How to cite: van der Velde, O., Romero, D., López, J., Montanyà, J., and Pineda, N.: eLMA: Supercells over the Upgraded Ebro 3D Lightning Mapping Array and High-speed Observations of Lightning in the Near-Ultraviolet, EGU General Assembly 2024, Vienna, Austria, 14–19 Apr 2024, EGU24-20630, https://doi.org/10.5194/egusphere-egu24-20630, 2024.

EGU24-20763 | ECS | Orals | NH1.5

Low-frequency sferics associated with consecutive Terrestrial Gamma-ray Flashes  

Hongbo Zhang, Xiushu Qie, and Gaopeng Lu

Terrestrial Gamma-ray Flashes (TGFs) are brief and intense emissions of hard X-rays and gamma-rays originating inside thunderstorms. It has been observed that TGF occurs much less frequently than lightning. However, the TGF generation conditions and mechanism of are not clear, such as why just the TGF-associated lightning produces TGF while others not. Consecutive TGFs detected by space-based platform are usually several seconds to 1-2 minutes apart, and they come from same meteorological environment and even from the same storm cells. This provides a possibility to understand the relationship between lightning and TGF. Based on Fermi high-energy photons observations and the ground low-frequency (LF) lightning sferics measurements, more than 10 pairs of consecutive TGFs with synchronous LF lightning waveform are analyzed. Preliminary results show that the sferics of each TGF pairs are almost same, while they vary with different pairs. More details will be shown. In addition, some TGFs detected by ASIM and the associated lightning will also be introduced.

How to cite: Zhang, H., Qie, X., and Lu, G.: Low-frequency sferics associated with consecutive Terrestrial Gamma-ray Flashes , EGU General Assembly 2024, Vienna, Austria, 14–19 Apr 2024, EGU24-20763, https://doi.org/10.5194/egusphere-egu24-20763, 2024.

Based on the work of several PhD students in Amsterdam, we now have a verified model for positive streamers in air. For streamer propagation a fluid model is sufficient, while for branching the discreteness of the photo-ionization events has to be taken into account. The model results on propagation and branching have both been validated on experiments in Eindhoven, and hence a few streamers can now be modeled quantitatively in 3D. However,  bursts or coronas with hundreds and more streamers are computationally not feasible. Instead of this, models of dielectric breakdown type should be developed, but based on the now known microscopic basis. We present two results in this direction: 1. The identification of steady positive and negative streamers and a revision of the concept of the stability field. 2. The analysis of streamer heads as coherent structures which allows a macroscopic characterization of the streamer head dynamics by few parameters such as radius, velocity, maximal and minimal field, ionization degree etc. (up to now only for positive streamers). Together with the branching simulations, these are stepping stones towards a reduced model of dielectric breakdown type for multi-streamer structures.

The models were developed and evaluated by the PhD students Dennis Bouwman, Hani Francisco, Baohong Guo, Xiaoran Li and Zhen Wang under the supervision of Jannis Teunissen and Ute Ebert in Amsterdam, and the experiments used for model validation were performed by Ph.D. students Siebe Dijcks and Yihao Guo under the supervision of Sander Nijdam in Eindhoven. For the reduced model, we collaborate with Alejandro Luque in Granada, Spain.

How to cite: Ebert, U.: Towards quantitative modeling of multi-streamer processes in 3D, EGU General Assembly 2024, Vienna, Austria, 14–19 Apr 2024, EGU24-20811, https://doi.org/10.5194/egusphere-egu24-20811, 2024.

EGU24-20835 | ECS | Orals | NH1.5

3D Geolocation of Simulated Lightning Sources from Low-Earth Orbit 

Jackson Remington, Sonja Behnke, Harald Edens, Patrick Gatlin, Timothy Lang, Nikhil Pailoor, Mason Quick, and Sarah Stough

The recent removal of the Lightning Imaging Sensor from the International Space Station has left an observational gap in lightning detection from low-Earth orbit (LEO). However, new studies have demonstrated the potential for 3D geolocation of lightning sources using orbiting sensors. The Cubespark mission concept aims to take advantage of these developments by deploying a constellation of satellites with radio frequency (RF) sensors and optical imagers to not only map lightning locations, but also to collect bi-spectral flash images. These new capabilities include mapping storm charge structure, flash channel structure, and distinguishing microphysical processes throughout flash development, helping link microphysics and convective processes with overall flash and storm structure around the globe from LEO.

In this study, we simulate lightning RF sources in the very high frequency (VHF) band, extrapolate their signals to space-based detection using an improved ionospheric model, and reconstruct their 3D locations using a time-of-arrival (TOA) minimization algorithm. Various constellation configurations, locations, and atmospheric conditions are considered in order to identify and quantify the three main sources of geolocation error: geometric, ionospheric, and instrumental effects. The promising results of this study emphasize the potential of space-based 3D lightning mapping under diverse conditions. 3D resolution is shown to be better than 1-2 km in many cases, enabling new global applications in meteorology and climate sciences. Here we present a selection of these geolocation results as seen from space alongside recent advancements, paving the way for a future generation of LEO lightning mappers.

How to cite: Remington, J., Behnke, S., Edens, H., Gatlin, P., Lang, T., Pailoor, N., Quick, M., and Stough, S.: 3D Geolocation of Simulated Lightning Sources from Low-Earth Orbit, EGU General Assembly 2024, Vienna, Austria, 14–19 Apr 2024, EGU24-20835, https://doi.org/10.5194/egusphere-egu24-20835, 2024.

EGU24-20882 | ECS | Orals | NH1.5

Mixed Mode of Charge Transfer During an Upward Positive Flash at Säntis Tower 

Toma Oregel-Chaumont, Antonio Šunjerga, Marcos Rubinstein, and Farhad Rachidi

The term “mixed mode of charge transfer to ground for initial continuous current (ICC) pulses” in the context of upward lightning flashes was first proposed by Zhou et al. 2011 [1] to describe fast pulses, distinct from the classical M-component mode of charge transfer, superposed on the slowly varying initial-stage current of upward negative flashes they observed at the Gaisberg Tower in Austria. The pulses in question were associated with leader/return-stroke processes occurring in decayed or newly created branches of the plasma channel connecting to the grounded, current-carrying channel, with junction points below the cloud base (height < 1 km) [1,2].

Herein, we report, to the best of our knowledge, the first observation of a mixed-mode-type pulse during the initial stage of an upward positive flash that was initiated from the Säntis Tower in Switzerland. The Mt. Säntis Lightning Research Facility, which recorded the flash, consists of a current measurement system installed in the mountaintop tower (2.5 km ASL), slow and fast electric field sensors and X-ray detectors 20 m from the tower base, an additional fast E-field sensor 15 km away, as well as full HD cameras and a high-speed camera (HSC) at various distances, among other systems (see Šunjerga et al. 2021 for details [3]).

The observed flash, categorized as a Type 1 from its current waveform (see Romero et al. 2013 for definition [4]), occurred at 16:24:03 UTC on July 24th, 2021, during the Laser Lightning Rod project [5]. Its “return stroke”-like main pulse was confirmed from HSC footage to have been triggered by a downward-connecting leader with a junction height of approximately 369±5 m AGL, well below the defined cut-off of 1 km. Interestingly, though the 12 kA peak current is reasonable for a mixed-mode pulse, the current and E-field risetimes were both >10 μs, more characteristic of a M-component-type ICC pulse [2].

These observations are important to improving our understanding of the charge transfer mechanisms in upward lightning flashes, which regularly damage wind turbines, telecommunications towers, and airplanes during take-off and landing.


References:

[1] Zhou, H., Diendorfer, G., Thottappillil, R., Pichler, H., Mair, M. (2011). Mixed mode of charge transfer to ground for initial continuous current pulses in upward lightning. In 2011 7th Asia-Pacific International Conference on Lightning (pp. 677–681). Chengdu, China: IEEE. https://doi.org/10.1109/APL.2011.6110212

[2] Zhou, H., Rakov, V. A., Diendorfer, G., Thottappillil, R., Pichler, H., Mair, M. (2015). A study of different modes of charge transfer to ground in upward lightning. Journal of Atmospheric and Solar-Terrestrial Physics, 125–126, 38–49. https://doi.org/10.1016/j.jastp.2015.02.008

[3] Šunjerga, A., Mostajabi, A., Paolone, M., Rachidi, F., Romero, C., Hettiarachchi, P., … Smith, D. (2021). Säntis Lightning Research Facility Instrumentation. International Conference on Lightning Protection, 6.

[4] Romero, C., Rachidi, F., Rubinstein, M., Paolone, M., Rakov, V. A., Pavanello, D. (2013). Positive lightning flashes recorded on the Säntis tower from May 2010 to January 2012: POSITIVE LIGHTNING SÄNTIS TOWER. Journal of Geophysical Research: Atmospheres, 118(23), 12,879-12,892. https://doi.org/10.1002/2013JD020242

[5] Houard, A., Walch, P., Produit, T., Moreno, V., Mahieu, B., Šunjerga, A., … Wolf, J.-P. (2023). Laser-guided lightning. Nature Photonics, 17(3), 231–235. https://doi.org/10.1038/s41566-022-01139-z

How to cite: Oregel-Chaumont, T., Šunjerga, A., Rubinstein, M., and Rachidi, F.: Mixed Mode of Charge Transfer During an Upward Positive Flash at Säntis Tower, EGU General Assembly 2024, Vienna, Austria, 14–19 Apr 2024, EGU24-20882, https://doi.org/10.5194/egusphere-egu24-20882, 2024.

EGU24-20981 | Orals | NH1.5 | Highlight

Energy from extraterrestrial sources is driving arctic lightning 

Eija Tanskanen and Marzieh Khansari

The possible effect of solar activity on lightning has been studied for a long period of time. Specifically, the relationship between sunspot number and lightning activity has been investigated, although the results still remain inconclusive across regions and time. In some regions, a positive correlation is found, in others a negative one. Thus, it is important to explore other solar-geomagnetic variables possibly influencing lightning activity.

In order to examine the possible relationship between solar activity and lightning activity we will study lightning and geomagnetic activity at the latitudes of 50° to 70° together with the solar and solar wind observations (SDO, ACE, OMNI database).  Data from the Nordic lightning location system (NORDLIS) was used for lightning strikes and geomagnetic measurements from Sodankylä Geophysical Observatory, INTERMAGNET and IMAGE for geomagnetic disturbances. Our analysis showed a strong correlation between high-speed streams and lightning activity as well as with geomagnetic activity during solar cycle 23. All parameters peaked in 2003 during the early declining phase of solar cycle 23 and showed similar trends over the solar cycle. The correlation was strong and significant between latitudes 62° and 66°.  The best coupling was found at 63° and 65°, where solar wind variability explained 86% and 88% of the variability of lightning activity, respectively. We hypothesize that this correlation is because of a much larger number of energetic particles due to an exceptionally high number of HSS during solar cycle 23. Penetration of these highly energetic particles to the atmosphere and production of high energetic secondary electrons can lead to runaway breakdown in thunderclouds and initiation of lightning.

How to cite: Tanskanen, E. and Khansari, M.: Energy from extraterrestrial sources is driving arctic lightning, EGU General Assembly 2024, Vienna, Austria, 14–19 Apr 2024, EGU24-20981, https://doi.org/10.5194/egusphere-egu24-20981, 2024.

EGU24-21048 | Orals | NH1.5

Employing VLF and field mill measurements to predict lightning activity 

Moacir Lacerda and Carlos Augusto Morales Rodrigues

The STORM-T Laboratory of University of São Paulo (USP) – Brazil operates a VLF long range lightning detection network known as STARNET (Morales et al., 2014) and a local field mill network. We have developed and implemented two operational schemes to predict the thunderstorm activity and propagation for the next 30 minutes (Now-STARNET) and the probability of occurrence of lightning strikes in a local area within 10 minutes (YANSA – Lacerda et al., 2022). Now-STARNET scheme is based on the cell-tracking algorithm proposed by Betz et al. (2008) to identify active thunderstorms over South America (90-30W and 60S-10N). STARNET lightning measurements are hourly accumulated over grids of 0.1 x 0.1 degrees and those cumulative grids are used to identify active thunderstorms that are defined as contiguous lightning grids. For each identified thunderstorm, we retrieve the lightning activity every 1 minute and the area, speed and direction of propagation every 5 minutes. Based on these temporal and dynamical features we adjust polynomial functions to forecast the position of active thunderstorms (must have lightning activity in the last 5 minutes) for the next 30 minutes every 5 minutes. Finally, the projected areas are used to identify the Brazilian cities that will have lightning activity to issue warnings. YANSA tool uses the temporal variation of the vertical electrical field observed by field mills to compute the time between the first lightning pulse and the first cloud-to-ground stroke as defined by Rodrigues and Lacerda (2022). Based on the elapsed time and the magnitude of the electrical field, YANSA issues different warning messages (no-risk, low, moderate, high and extreme risk) that help the users to know the probability of CG occurrence and time spam for lighting activity. YANSA was configured to use 4 field mills deployed in the USP campus transmitting every 1 minute and issue warning of lightning activity in area of the university. For the conference we will present the skills of both Now-STARNET and YANSA tools in predicting lightning activity and lightning strikes by means of contingency table tests, i.e., POD, FAR and CSI. For Now-STARNET we will use STARNET measurements of 2022 and 2023 and explore how the skills change with thunderstorm size and location. For YANSA, we will use LINET and STARNET lightning strokes observed in the vicinity of the University of São Paulo during the period of 2023 to validate each message.

Rodrigues F. and M. Lacerda, "Warning of lightning risk for the first lightning produced by a thunderstorm using electric field mill network records," 2022 36th International Conference on Lightning Protection (ICLP), Cape Town, South Africa, 2022, pp. 720-723, doi: 10.1109/ICLP56858.2022.9942596.

Lacerda, M. Rodrigues, F., Verly, R., Morales C.A.R. (2023). Monitoring lightning activity by using the YANSA platform to emit warnings of lightning risk in real time with an electric field mill network. risk for the first lightning produced by a thunderstorm using electric field mill network records," 2022 36th International Conference on Lightning Protection (ICLP), Cape Town, South Africa, 2022,


How to cite: Lacerda, M. and Morales Rodrigues, C. A.: Employing VLF and field mill measurements to predict lightning activity, EGU General Assembly 2024, Vienna, Austria, 14–19 Apr 2024, EGU24-21048, https://doi.org/10.5194/egusphere-egu24-21048, 2024.

Lightning is an essential climate variable that could be influenced by climate change processes. In this study, wintertime lightning data over the Mediterranean Sea (MS) during the period 2009-2019 from the World-Wide Lightning Location Network were analyzed together with corresponding observational and modeled data of solar activity, atmospheric dynamics and seawater chemistry. The results of this analysis demonstrate that solar activity is the dominant parameter that influences lightning activity over the MS. Where, wintertime lightning intensity and frequency for lightning with energy >0.5 MJ over the MS is 237 and 517 times greater during the solar maximum compared to the minimum, respectively. In contrast, lightning activity parameters have a significantly smaller dependence on climate change parameters, including convective available potential energy, seawater salinity, pH and total alkalinity. Therefore, it is highly unlikely that trends in lightning activity over the MS due to climate change will be detectable in the near future.

How to cite: Asfur, M., Price, C., and Silverman, J.: Is winter cloud-to-sea-surface lightning activity over the Mediterranean Sea during 2009-2019 strongly influenced by solar activity?, EGU General Assembly 2024, Vienna, Austria, 14–19 Apr 2024, EGU24-22350, https://doi.org/10.5194/egusphere-egu24-22350, 2024.

EGU24-22447 | ECS | Orals | NH1.5

3D location estimation of lightning charges using electrostatic field changes 

Sho Yui, Yukihiro Takahashi, and Mitsutero Sato

Floods caused by the development of cumulonimbus clouds cause significant damage, especially in tropical areas, such as the Southeast Asian region. Lightning strikes in cumulonimbus clouds have been shown to correlate with a time lag of several tens of minutes preceding heavy rainfall. Therefore, it is expected that lightning observations will help us to forecast heavy rainfall. Especially, if we could know the 3-dimensional distribution of lightning charges, this information might be a good proxy way of knowing thunderstorm development.  Here, we improved 3D estimation of lightning charges using electrostatic field measurement. In this method the electrostatic field changes caused by lightning stroke are observed with a network consisting  of sensors installed at multiple locations at about 5 km interval. Based on those data, three-dimensional location and amount of charges removed by lightning stroke can be estimated. A previous study using same kind of data conducted a brute force calculation, which is not practical because it takes about 2 minutes longer than the typical interval of lightning stroke in the active thunderstorm. In this study, we propose a new method using interpolation analysis by kriging, which results in significant reduction of the estimation time to about 8 seconds. This improving will allow us to analyse more data we took so far and make the new model of thunderstorms.

This research is supported by Science and Technology Research, Partnership for Sustainable Development (SATREPS), Japan Science and Technology Agency (JST) / Japan International Cooperation Agency (JICA).

How to cite: Yui, S., Takahashi, Y., and Sato, M.: 3D location estimation of lightning charges using electrostatic field changes, EGU General Assembly 2024, Vienna, Austria, 14–19 Apr 2024, EGU24-22447, https://doi.org/10.5194/egusphere-egu24-22447, 2024.

EGU24-4236 | Posters on site | AS1.15

JAXA Level-2 Algorithms, Validations and Applications Preparation for the EarthCARE 

Takuji Kubota and Hajime Okamoto

Earth Clouds, Aerosols and Radiation Explorer (EarthCARE) mission (Illingworth et al. 2015) is designed to produce the maximum synergetic collaboration of European and Japanese science teams (Wehr et al. 2023, Eisinger et al. 2024). The EarthCARE products will be developed and distributed from both JAXA and ESA. Continuous exchanges of information have been conducted between Japan and Europe through the Joint Algorithm Development Endeavor (JADE). CPR, ATLID and MSI Level-2 provide cloud mask, cloud phase and cloud microphysics (such as cloud effective radius, liquid water content, optical depth, etc) for the respective sensor products, together with the synergy products by using the combination of the sensors. Further, the CPR provides the Doppler velocity measurement (which gives the vertical information of the in-cloud velocity), and precipitation products. ATLID Level-2 includes aerosol flagging, aerosol component type (such as dust, black carbon, sea salt and water soluble), as well as the aerosol optical properties including aerosol extinction. The cloud and aerosol products will be used to derive the radiative flux at shortwave and longwave, whose consistency with the BBR will be checked to produce the final radiation product by 4-sensors.

EarthCARE synthetic data using a global storm-resolving (NICAM) and Joint-Simulator (Joint Simulator for Satellite Sensors) have been developed in Japan and used in the JAXA L2 algorithm developments (Roh et al. 2023).

Validation activities are necessary to distribute the scientific products whose quality and reliability are assured. The JAXA is planning the validation activities by utilization of the existing observation network, campaign observation, and cross comparison with other satellite data.

Furthermore, a wide range of application research activities will be planned to achieve the mission objectives. EarthCARE observation data will contribute to understanding cloud, aerosol, and radiation processes, evaluations and improvements of climate models and numerical weather prediction (NWP) models, and atmospheric quality monitoring. JAXA is conducting joint-works with universities and research institutes. The Intergovernmental Panel on Climate Change (IPCC) report published in August 2021, “Climate Change 2021: The Physical Science Basis. Contribution of Working Group I to the Sixth Assessment Report of the IPCC”, summarizes that the cloud feedback remains the largest contribution to overall uncertainty, and contributions to mitigate the uncertainty can be expected by new insights by the EarthCARE observations.

This presentation will introduce JAXA Level 2, Validation and Applications Preparation for the EarthCARE mission.

How to cite: Kubota, T. and Okamoto, H.: JAXA Level-2 Algorithms, Validations and Applications Preparation for the EarthCARE, EGU General Assembly 2024, Vienna, Austria, 14–19 Apr 2024, EGU24-4236, https://doi.org/10.5194/egusphere-egu24-4236, 2024.

EGU24-8203 | Posters on site | AS1.15

Validation of EarthCARE Cloud and Precipitation Products through the WegenerNet 3D Open-Air Laboratory facilities 

Jürgen Fuchsberger, Andreas Kvas, Gottfried Kirchengast, Ulrich Foelsche, Esmail Ghaemi, Robert Galovic, Daniel Scheidl, and Christoph Bichler

The WegenerNet 3D Open-Air Laboratory for Climate Change Research, located in southeastern Austria in an area of about 22 km x 16 km around the city of Feldbach (46.93°N, 15.90°E), provides a unique setup for atmospheric monitoring and validation of satellite data products. Its 3D instrumentation consists of a polarimetric X-band Doppler weather radar, a microwave radiometer for vertical profiling of temperature, humidity, and cloud liquid water, an infrared cloud structure radiometer, and a water-vapor-mapping GNSS station network. These 3D sensors complement the high-density WegenerNet hydrometeorological ground station network, which is comprised of 156 stations measuring precipitation, temperature, humidity, and (at selected locations) wind as well as soil parameters.

This highly synergistic measurement setup enables robust internal cross-evaluation, calibration and quality control for obtaining reliable observations and derived WegenerNet data products. The 3D instrumentation is operational since mid-2021 and will provide a consistent validation reference data record throughout the EarthCARE mission lifetime. With its ground-based observations of cloud base height, melting layer base and top heights, liquid water content, precipitation rates, and hydrometeor classification, the WegenerNet contributes specifically to the validation of EarthCARE L2a and L2b cloud and precipitation data products. This presentation summarizes the validation preparation activities carried out so far, with focus on the EarthCARE validation rehearsal, and gives an outlook on the planned post-launch validation work during the actual cal/val phase.

How to cite: Fuchsberger, J., Kvas, A., Kirchengast, G., Foelsche, U., Ghaemi, E., Galovic, R., Scheidl, D., and Bichler, C.: Validation of EarthCARE Cloud and Precipitation Products through the WegenerNet 3D Open-Air Laboratory facilities, EGU General Assembly 2024, Vienna, Austria, 14–19 Apr 2024, EGU24-8203, https://doi.org/10.5194/egusphere-egu24-8203, 2024.

EGU24-8361 | Posters on site | AS1.15

Harnessing the power of forward models: past, present and future 

Robin Hogan, Shannon Mason, Fabian Jakub, and Mark Fielding

Variational retrievals, data assimilation, and model evaluation in observation space, all rely on accurate instrument simulators, or forward models. The scientific challenge is to find innovative approximations to the radiative transfer that make them fast enough to use iteratively, while retaining accuracy. In this presentation I will summarize how the development of various forward models, particularly in the context of synergistic retrievals from EarthCARE and the A-Train, has the capability to reveal important cloud and precipitation properties that would otherwise remain hidden, and potentially even to develop new satellite concepts. For example, our radar and lidar “Multiscatter” model enables the extinction profile to be retrieved in ice and liquid clouds even in the presence of lidar multiple scattering.  Our “FLOTSAM” solar radiance model can work with profiles containing arbitrary combinations of particles, and surprisingly can help improve rain-rate retrievals by better providing the additional information needed to partition the radar path-integrated attenuation into the contributions from liquid clouds and rain. The Two-Stream Source Function (TSSF) infrared and microwave radiance model enables us to interpret 94-GHz brightness temperature, which provides important additional information on precipitating ice and liquid clouds.  I will end by presenting a new radiance model for cloud/storm-resolving models that can efficiently represent horizontal radiation transport between columns; this could enable future retrievals and assimilation to take full account of 3D radiative effects.

How to cite: Hogan, R., Mason, S., Jakub, F., and Fielding, M.: Harnessing the power of forward models: past, present and future, EGU General Assembly 2024, Vienna, Austria, 14–19 Apr 2024, EGU24-8361, https://doi.org/10.5194/egusphere-egu24-8361, 2024.

EGU24-8607 | Posters on site | AS1.15 | Highlight

EarthCARE, ESA’s Cloud and Aerosol Mission, Preparing for Launch 

Thorsten Fehr, Dirk Bernaerts, Jonas von Bismarck, Patrick Deghaye, Michael Eisinger, Björn Frommknecht, Timon Hummel, Robert Koopman, Stephanie Rusli, and Kotska Wallace

The influence of clouds on incoming solar and reflected thermal radiation remains the largest contribution to the overall uncertainty in climate feedbacks due to the diverse cloud formation processes. Furthermore, climate models still show deficiencies in correctly representing aerosol-cloud interactions and precipitation patterns limiting the overall confidence in climate predictions.

Global observations of vertical cloud ice and liquid water profiles with simultaneous and collocated solar and thermal flux observation will provide crucial data to address this uncertainty. Furthermore, collocated global observation of vertical aerosol profiles and types are required to address their direct effects and indirect aerosol-cloud-interaction effects.

In response to these needs, the European Space Agency (ESA), in cooperation with the Japan Aerospace Exploration Agency (JAXA), plans to launch the Earth Cloud, Aerosol and Radiation Explorer Mission, EarthCARE – ESA’s Cloud and Aerosol mission – in May 2024.

The two active instruments embarked on the satellite, a cloud-aerosol lidar (ATLID) and a cloud Doppler radar (CPR), together with the passive multispectral imager (MSI) and broad-band radiometer (BBR), will provide synergistically derived vertical profiles of cloud ice and liquid water, aerosol type, precipitation, as well as heating rates, solar and thermal top-of-atmosphere radiances with the objective to reconstruct top-of-the-atmosphere short- and longwave fluxes at an accuracy of 10 Wm-2 on a 10 km×10 km scene. The mission aims to significantly improve our understanding in the cloud and aerosol radiative feedback mechanisms, and their representation in climate and weather forecasting models.

The presentation will provide an up-to-date overview of the mission and science status weeks before the planned EarthCARE launch on a Falcon-9 rocket beginning of May 2024 from Vandenberg, USA. It will cover the mission’s science objectives, main performances of the three ESA instruments, expected science advances and foreseen validation activities. A detailed presentation on the data products, ground processing and data quality assurance will be provided by T. Hummel et al. at EGU24.

How to cite: Fehr, T., Bernaerts, D., von Bismarck, J., Deghaye, P., Eisinger, M., Frommknecht, B., Hummel, T., Koopman, R., Rusli, S., and Wallace, K.: EarthCARE, ESA’s Cloud and Aerosol Mission, Preparing for Launch, EGU General Assembly 2024, Vienna, Austria, 14–19 Apr 2024, EGU24-8607, https://doi.org/10.5194/egusphere-egu24-8607, 2024.

EarthCARE will continue the record of spaceborne radar, lidar, and radiometric measurements that was begun in 2006 by CloudSat, CALIPSO, MODIS and CERES within the A-Train of satellites. EarthCARE’s multispectral imager (MSI), three-view broadband radiometer (BBR), Doppler-capable cloud profiling radar (CPR) and high-spectral resolution atmospheric lidar (ATLID) provide some advances over the instruments within the A-Train, and the single platform will improve the coregistration of synergistic measurements. Ultimately, the greatest novelty of the EarthCARE mission may arise from its highly coordinated L2 production models, which cover products ranging from single-instrument detection, target classification, and retrieval products, to synergistic retrievals, radiative transfer modelling, and finally top-of-atmosphere radiative closure assessment. Central to the ESA L2 production model is the synergistic (ATLID-CPR-MSI) “best estimate” retrieval of all clouds, aerosols and precipitation in the atmosphere, called ACM-CAP.

ACM-CAP is based on the CAPTIVATE optimal estimation retrieval algorithm, which includes sophisticated and efficient representations of hydrometeor fallspeeds to constrain ice particle density and raindrop size, ice particle scattering properties, radar and lidar multiple scattering, passive solar, thermal and microwave radiances, and the HETEAC model for aerosol properties. To test our retrieval and enhance scientific continuity between EarthCARE and the A-Train, we have developed an equivalent CloudSat-CALIPSO-MODIS retrieval product, called CCM-CAP, based on the same retrieval algorithm. 

In this talk we provide an overview of the ACM-CAP product, its capabilities and its place within the EarthCARE ESA production model. Using CCM-CAP, we present case studies and evaluation of the retrieved cloud and precipitation properties, and discuss how the challenges for unified retrievals in complex and layered scenes will inform the regimes of interest for validation and evaluation once EarthCARE data are available.

How to cite: Mason, S., Hogan, R., Bozzo, A., and Courtier, B.: Synergistic and unified retrieval of clouds, aerosols and precipitation from EarthCARE and the A-Train: the ACM-CAP and CCM-CAP products, EGU General Assembly 2024, Vienna, Austria, 14–19 Apr 2024, EGU24-8811, https://doi.org/10.5194/egusphere-egu24-8811, 2024.

EGU24-9113 | Orals | AS1.15

Illuminating the Interplay between Clouds, Aerosols, and Radiation: Introducing the ESA EarthCARE L2 processing chain. 

Gerd-Jan van Zadelhoff and David Donovan and the CARDINAL team

The interactions between clouds, aerosols, and solar and terrestrial radiation play  key roles in the Earth’s Climate. Despite a long history of satellite observations, further high-quality novel observations are needed for atmospheric model evaluation and process studies. It has been recognized that true height-resolved global observations of cloud and aerosol properties are essential for making progress. EarthCARE is an upcoming ESA/JAXA mission scheduled to fly in 2024, focusing on providing these observations.

Operating in a sun-synchronous orbit at 393 km altitude with a descending node at 14:00, EarthCARE's payload comprises two innovative active (Atmospheric UV High spectral resolution Lidar - ATLID and Cloud Profiling Doppler Radar - CPR provided by Japan) and two passive (Multi-Spectral Imager - MSI and Broad-Band Radiometer - BBR) instruments. Using these instruments, EarthCARE will provide global profiles of clouds, aerosols, and precipitation properties, along with co-located radiative TOA flux measurements. These atmospheric microphysical properties and associated radiative fluxes will be used to evaluate the representation of aerosols, clouds, and precipitation in weather forecast and climate models, contributing to the improvement of parameterization schemes. 

The ESA scientific retrieval processors fully exploit the synergy of these observations. EarthCARE will provide twenty-five science (Level 2) products. These products include nadir profiles of cloud, aerosol and precipitation properties along with constructed three-dimensional cloud-aerosol-precipitation domains and associated derived radiative properties, such as heating rates. The final L2 processor compares the forward modeled top-of-atmosphere broad-band radiances and fluxes based on the constructed 3D atmospheric scenes with those measured by the BBR in order to assess and improve the quantitative understanding of the role of clouds and aerosols in the Earth's radiation budget.

This presentation will provide an overview of the EarthCARE mission, its data processors and scientific products.

How to cite: van Zadelhoff, G.-J. and Donovan, D. and the CARDINAL team: Illuminating the Interplay between Clouds, Aerosols, and Radiation: Introducing the ESA EarthCARE L2 processing chain., EGU General Assembly 2024, Vienna, Austria, 14–19 Apr 2024, EGU24-9113, https://doi.org/10.5194/egusphere-egu24-9113, 2024.

EarthCARE, equipped with a suite of passive and active sensors, including Cloud Profiling Radar (CPR), Atmospheric LIDar (ATLID), Multi-Spectral Imager (MSI), and Broad Band Radiometer (BBR), is designed for comprehensive studies of clouds, aerosols, precipitation, and their radiation impact. The CPR's Doppler capability is crucial for assessing the terminal velocity of rain and ice particles and understanding convective motions.

Global storm-resolving models (GSRMs, Satoh et al. 2019; Stevens et al. 2019) have been used to generate detailed simulations of mesoscale convective systems using a kilometre-scale horizontal grid. New observations, such as the Doppler velocity from EarthCARE, will provide new insights into the evaluation and improvement of a GSRM.

Moreover, the utilization of satellite simulators — comprehensive radiative transfer models designed to simulate satellite signals using outputs from atmospheric models like GSRMs — plays a crucial role in this process. These simulators are integral for assessing, enhancing, and aligning numerical models with satellite observation data.

This study investigates EarthCARE's potential to enhance GSRM evaluations and improvements using a satellite simulator. We also introduce our collaboration with a satellite remote sensing group in developing retrieval algorithms.

How to cite: Roh, W. and Satoh, M.: EarthCARE's Potential to Evaluate a Global Storm-Resolving Model Using a Satellite Simulator, EGU General Assembly 2024, Vienna, Austria, 14–19 Apr 2024, EGU24-9144, https://doi.org/10.5194/egusphere-egu24-9144, 2024.

EGU24-9240 | Orals | AS1.15

EarthCARE Processors and Products: Status Update and Outlook 

Timon Hummel, Dirk Bernaerts, Jonas von Bismarck, Patrick Deghaye, Michael Eisinger, Thorsten Fehr, Björn Frommknecht, Robert Koopman, Stephanie Rusli, Vasileios Tzallas, and Kotska Wallace

The Earth Cloud Aerosol and Radiation Explorer (EarthCARE) is a satellite mission carried out by the European Space Agency (ESA) in collaboration with the Japan Aerospace Exploration Agency (JAXA) to measure global profiles of aerosol, cloud and precipitation properties along with radiative fluxes and derived warming rates, with the goal of advancing our understanding of cloud-aerosol and radiation interactions and the Earth's radiative budget.

In order to fulfil its objectives, the EarthCARE mission will collect co-registered observations from a suite of four instruments located on a common platform. The optical payload encompasses the three ESA instruments, namely an ATmospheric LIDar (ATLID), a Multi-Spectral Imager (MSI) and a BroadBand Radiometer (BBR). The fourth instrument, provided by JAXA, is the Cloud Profiling Radar (CPR). The two active instruments (ATLID and CPR) will provide vertical profiles of the atmosphere along the satellite nadir path. The two passive instruments (BBR and MSI) will provide scene context information to support the active instruments data interpretation.

The presentation will provide an update on the status of EarthCARE processors and products prior to launch, focusing on ESA's ground science data processing chain, which includes the production of calibrated instrumental data (Level 1 data products) and retrieved geophysical data (Level 2 data products). Further, we will introduce the Data Innovation and Science Cluster (DISC) for the mission exploitation phase (E2). The DISC brings together several groups of instrument and product experts in one cluster to establish a comprehensive product quality assurance framework, including activities related to product algorithm evolution, data assimilation, calibration, validation support, and performance monitoring of ESA's EarthCARE products.

How to cite: Hummel, T., Bernaerts, D., von Bismarck, J., Deghaye, P., Eisinger, M., Fehr, T., Frommknecht, B., Koopman, R., Rusli, S., Tzallas, V., and Wallace, K.: EarthCARE Processors and Products: Status Update and Outlook, EGU General Assembly 2024, Vienna, Austria, 14–19 Apr 2024, EGU24-9240, https://doi.org/10.5194/egusphere-egu24-9240, 2024.

EGU24-10363 | ECS | Posters on site | AS1.15

Using AEOLUS Aerosol Assimilation to pave the way for EarthCARE 

Thanasis Georgiou, Athanasios Tsikerdekis, Konstantinos Rizos, Emmanouil Proestakis, Antonis Gkikas, Eleni Drakaki, Anna Kampouri, Holger Baars, Athena Augousta Floutsi, Eleni Marinou, Angela Benedetti, Will McLean, Christian Retscher, Dimitris Melas, and Vassilis Amiridis

EarthCARE, ESA’s and JAXA’s joint mission, is expected to launch in 2024 carrying ATLID, a high-spectral resolution lidar with depolarization capability. The instrument will provide valuable data for characterizing atmospheric aerosols and for improving atmospheric composition modelling. The aim of this study is to show how working with ESA’s Aeolus wind mission prepares us for taking advantage of ATLID.

Aeolus, which launched in 2018 and deorbited in 2023, was not specifically designed to observe aerosols but still provided aerosol products. Due to the lack of a cross-polar channel, it underestimated the aerosol-related backscatter by as much as 50% in scenes with non-spherical particles. During the ESA L2A+ project, an enhanced aerosol product was developed through data fusion with other data sources (such as NASA’s CALIPSO mission) to account for Aeolus deficiencies. The impact of this new product was assessed through assimilation experiments in regional NWP models, showing both the direct improvements of the new product, as well as the betterment of aerosol fields in regional models through assimilation of a profiling instrument. Our results were validated using data from the ESA-ASKOS tropical campaign, which took place in Cabo Verde during Summer and Autumn of 2021 and 2022.

The open-source tools created for Aeolus are further developed to support EarthCARE. Working with simulated data, we show the impact of ATLID profile assimilation on both the representation of aerosols in the model, as well as the impact on numerical weather prediction through radiative feedback. The experiments are done using the Weather Research and Forecasting (WRF) model, alongside the Data Assimilation Research Testbed (DART), with AEOLUS and EarthCARE support added.

The L2A+ team acknowledges support by ESA in the framework of the "Enhancing Aeolus L2A for depolarizing targets and impact on aerosol research and NWP project (4000139424/22/I-NS). This work was supported by computational time granted from the National Infrastructures for Research and Technology S.A. (GRNET S.A.) in the National HPC facility - ARIS - under project ID pr014048_thin.

How to cite: Georgiou, T., Tsikerdekis, A., Rizos, K., Proestakis, E., Gkikas, A., Drakaki, E., Kampouri, A., Baars, H., Floutsi, A. A., Marinou, E., Benedetti, A., McLean, W., Retscher, C., Melas, D., and Amiridis, V.: Using AEOLUS Aerosol Assimilation to pave the way for EarthCARE, EGU General Assembly 2024, Vienna, Austria, 14–19 Apr 2024, EGU24-10363, https://doi.org/10.5194/egusphere-egu24-10363, 2024.

EGU24-11671 | Posters on site | AS1.15

Performance Analysis of the ATLID Lidar: A Multi-Parameter Statistical Approach Using L1 Data 

Artem Feofilov, Hélène Chepfer, and Vincent Noël

Recognizing the need for a comprehensive lidar system performance analysis, we present a method for day-to-day assessment of the ATLID/EarthCARE lidar system. Unlike traditional calibration/validation methods involving in situ measurements or comparisons with ground-based, air- and space-borne instruments, our approach dispenses with the need for a second instrument. Instead, we focus on stability control checks using the atmosphere and surface as a 'reference,' assuming their properties remain constant during the lidar mission's lifetime.

Leveraging L1 data flow, our method evaluates critical performance aspects, including the stability of ATLID channels, accuracy of cross-talk coefficients, and the consistency of day- and nighttime noise. Employing a clustering algorithm on scattering ratio histograms, we monitor radiation detection stability globally across diverse atmospheric scenarios.

Defining 11 parameters related to surface reflection, stratospheric noise, and scattering ratio histograms, we showcase the feasibility of our approach using CALIOP L1 data. We also present results from our analysis of simulated ATLID data, demonstrating the sensitivity of the proposed quality control indicators to various experimental issues.

How to cite: Feofilov, A., Chepfer, H., and Noël, V.: Performance Analysis of the ATLID Lidar: A Multi-Parameter Statistical Approach Using L1 Data, EGU General Assembly 2024, Vienna, Austria, 14–19 Apr 2024, EGU24-11671, https://doi.org/10.5194/egusphere-egu24-11671, 2024.

EGU24-12553 | Posters on site | AS1.15

Presenting lidar surface returns as Aeolus product with the outlook on future spaceborne lidar missions including EarthCARE and Aeolus-2  

Lev D. Labzovskii, Gerd-Jan van Zadelhoff, David P. Donovan, Jos de Kloe, L. Gijsbert Tilstra, Ad Stoffelen, Piet Stammes, and Damien Josset

We previously discovered the sensitivity of Aeolus lidar surface returns (LSR) to surface characteristics and reported very good agreement of LSR with Lambertian Equivalent Reflectances from passive remote sensing instruments for the first year of Aeolus on orbit. In this way, we provided the first evidence that active remote sensing can be used for retrieving unidirectional UV surface reflectivity. Here, as a continuation of this effort, we report the detailed methodological solutions for retrieving and evaluating LSR to be implemented as official L2A product during Phase-F of Aeolus project for its entire lifetime. Unlike our previous report that relied on detecting surface bin using our own methodology and assumptions, we now align the approach of detecting surface bins with the official Aeolus processing methodology for retrieving LSR and elaborate on the resultant differences. Besides that, we report how this successful application of atmospheric spaceborne lidar data for inferring land surface reflectivity properties can be translated for future lidar missions such as EarthCARE and Aeolus-2. On one hand, our results will briefly introduce all the details of the LSR retrieval for Aeolus with its unique and complex optical setup (highly-non nadir incidence and UV wavelength) for broad audience for the first time. On the other hand, we will shed light on the opportunities and challenges of LSR-alike retrievals for future lidar spaceborne missions, thereby trying to minimize the key methodological uncertainties associated with implementation of LSR algorithms.

How to cite: Labzovskii, L. D., van Zadelhoff, G.-J., Donovan, D. P., de Kloe, J., Tilstra, L. G., Stoffelen, A., Stammes, P., and Josset, D.: Presenting lidar surface returns as Aeolus product with the outlook on future spaceborne lidar missions including EarthCARE and Aeolus-2 , EGU General Assembly 2024, Vienna, Austria, 14–19 Apr 2024, EGU24-12553, https://doi.org/10.5194/egusphere-egu24-12553, 2024.

EGU24-12971 | Orals | AS1.15

How lessons learned during previous validation campaigns are guiding our airborne validation of EarthCARE  

Florian Ewald, Silke Groß, Martin Wirth, and Julien Delanoe͏̈

Radar and lidar are valuable active remote sensing techniques to assess global ice cloud properties from space. Recent global climate model studies are increasingly relying on ice cloud products obtained from the synergy of the radar and lidar satellites in the A-Train constellation. For the first time, the upcoming ESA/JAXA satellite mission EarthCARE will acquire radar-lidar measurements from a single platform, ensuring the continuity of vertical resolved ice cloud products on a global scale. Due to additional and higher resolved measurements and a more comprehensive retrieval framework, a seamless transition from A-Train products cannot be taken for granted.  In this light and with the imminent launch of EarthCARE, it is now crucial to establish a validation strategy for the EarthCARE products using airborne measurements.

During the A-Train era, we learned numerous lessons and gained experience with coordinated aircraft and satellite underpasses which we performed during several airborne campaigns. During these exercises, the German research aircraft HALO was equipped with a EarthCARE-like payload consisting of a high spectral resolution lidar (HSRL) system at 532 nm, a high-power cloud radar at 35 GHz, a microwave radiometer package, and passive radiation measurements. Coordinated flights were performed with other airborne platforms carrying instruments at different wavelengths (DLR Falcon, Safire Falcon and ATR) or for validation with in-situ measurements (FAAM BAe-146) as well as below the A-Train satellite tracks.

In this presentation, we will give an overview of our lessons learned and how they are guiding our airborne validation strategy. Going along with the commissioning of EarthCARE, we will employ HALO with its remote sensing payload in the PERCUSION campaign later this year. Based from multiple locations in the tropical Atlantic (Cape Verde and Barbados) and Europe (Oberpfaffenhofen), underflights of EarthCARE will be performed. The comparison with the dataset acquired during A-Train underpasses will allow us to determine if derived cloud products can be directly compared or if conversions are necessary. By sharing our knowledge and plans with the wider community, we hope to foster helpful discussions to consolidate our airborne validation strategy for EarthCARE.

How to cite: Ewald, F., Groß, S., Wirth, M., and Delanoe͏̈, J.: How lessons learned during previous validation campaigns are guiding our airborne validation of EarthCARE , EGU General Assembly 2024, Vienna, Austria, 14–19 Apr 2024, EGU24-12971, https://doi.org/10.5194/egusphere-egu24-12971, 2024.

EGU24-13604 | Orals | AS1.15

Radiative closure assessment using A-Train satellite data for the EarthCARE mission 

Zhipeng Qu, Jason Cole, Howard Barker, Meriem Kacimi, Shannon Mason, Robin Hogan, and Ben Courtier

The EarthCARE mission will perform continuous radiative closure assessment utilizing both 1D and 3D broadband (BB) radiative transfer (RT) models. The radiance and flux calculations from these models will be compared to observations obtained through EarthCARE's Broadband Radiometer (BBR). The inputs for the RT models will be derived from synergistic retrievals of cloud and aerosol properties, facilitated by the Clouds, Aerosol and Precipitation from Multiple Instruments using a Variational Technique (CAPTIVATE) algorithm. In preparation for the EarthCARE launch, this study involves the application of CAPTIVATE to A-Train data, with the resultant cloud, aerosol, and precipitation properties serving as inputs for the RT models. The outcomes of these models will be utilized in a radiative closure assessment, incorporating measurements from the Clouds and the Earth's Radiant Energy System (CERES). The analyses center on discerning differences between 1D and 3D RT calculations, as well as differences between RT calculations and measurements obtained from the CERES.

How to cite: Qu, Z., Cole, J., Barker, H., Kacimi, M., Mason, S., Hogan, R., and Courtier, B.: Radiative closure assessment using A-Train satellite data for the EarthCARE mission, EGU General Assembly 2024, Vienna, Austria, 14–19 Apr 2024, EGU24-13604, https://doi.org/10.5194/egusphere-egu24-13604, 2024.

EGU24-14900 | Posters on site | AS1.15

EC-KLIM – Coordination of German EarthCARE Validation 

Sabrina Zechlau, Silke Groß, Ulla Wandinger, and Holger Baars

The joint ESA and JAXA Earth Explorer mission EarthCARE is designed to close gabs in the knowledge of aerosol, clouds and their interactions, and effects on radiation. For this the platform comprises four remote sensing instruments observing the vertical structure of the atmosphere with a highly spectral resolving lidar and a doppler cloud radar. Together with a hyperspectral imager radiation fluxes can be inferred and compared to the measurements of the on-board broad band radiometer. Based on these four instruments EarthCARE will provide over 40 data products, which are partly synergistic products of observations of all instruments. For the success of the mission it is therefore crucial to exactly validate the individual data products and to quantify their errors. A variety of observational sources are used, reaching from ground-based stations and networks to airborne measurements, and from satellite observations to modelled data. Already in the past a number of dedicated validation campaigns to prepare for validation from German research institutes were carried out with eg. the ground-based cloud observation system LACROS or with an EarthCARE-like payload on board the German research aircraft HALO. After launch a continuous validation of EarthCARE products will be necessary. For this the German Initiative for the Validation of EarthCARE (GIVE) bundles the expertise of the German atmospheric research community and aims at the validation of the entire chain of EarthCARE Level 1 and 2 products and the evaluation of related algorithms and instrument calibrations. The GIVE project will include dedicated campaigns as well as long‐term support over the lifetime of the mission. Here we want to introduce in general the German project EC-KLIM (former project office) to prepare for the use of EarthCARE, and especially of the GIVE project. We will present an overview of past preparation campaigns and of planned German validation activities.

How to cite: Zechlau, S., Groß, S., Wandinger, U., and Baars, H.: EC-KLIM – Coordination of German EarthCARE Validation, EGU General Assembly 2024, Vienna, Austria, 14–19 Apr 2024, EGU24-14900, https://doi.org/10.5194/egusphere-egu24-14900, 2024.

EGU24-15182 | ECS | Orals | AS1.15

Using synthetic EarthCARE Cloud Profiling Radar data to develop validation methodologies for ground-based cloud radar sites 

Lukas Pfitzenmaier, Nils Risse, Pavlos Kollias, Bernat Puigdomenech Treserras, and Imke Schirmacher

The value of permanent, multi-sensor surface-based observatories that collect continuous long-term observations for satellite L2 data products has grown significantly over the last 10-15 years. Examples of such established surface-based networks include the Aerosol, Clouds, and Trace Gases Research Infrastructure (ACTRIS) network, the US Department of Energy Atmospheric Radiation Measurements (ARM) observatories, and the recently established 94-GHz Miniature Network for EarthCARE Reference Measurements (FRM4Radar).

The core of the work presented is the use of the developed transformation of suborbital to orbital radar data by Orbital-Radar. This simple L1 transformational operator converts L1 suborbital (ground-based or airborne) measurements to the EarthCARE Cloud Profiling Radar (CPR) L1 observations. The transformational operator ensures that the orbital to suborbital comparison accounts for differences in the sampling geometry, measurement uncertainty, and instrument sensitivity and simulates the impact of the surface echo. Furthermore, the operator simulates the EarthCARE characteristic reflectivity and Doppler velocity errors.

Applying such a tool to long-time data sets allows to generate the optimal foundation for a statistical analysis of the EarthCARE CPR performance. Hence, the optimal sampling for CPR and ground-based data can be estimated, and the CPR detection of clouds and precipitation processes near the ground can be analyzed and evaluated. In addition, it shows how critical ground-based networks are and that they play an essential role in evaluating satellite measurements and products. Tools like Orbital-Radar may help evaluate future CPR satellite missions, expanding the L1 transformational operator to other spaceborne radar systems.

How to cite: Pfitzenmaier, L., Risse, N., Kollias, P., Puigdomenech Treserras, B., and Schirmacher, I.: Using synthetic EarthCARE Cloud Profiling Radar data to develop validation methodologies for ground-based cloud radar sites, EGU General Assembly 2024, Vienna, Austria, 14–19 Apr 2024, EGU24-15182, https://doi.org/10.5194/egusphere-egu24-15182, 2024.

EGU24-16225 | Posters on site | AS1.15

The EarthCARE ATLID profile processors 

David Donovan, Gerd-Jan van Zadelhoff, and Ping Wang

ATLID (Atmospheric Lidar) is the lidar to be embarked on the Earth Clouds and Radiation Explorer (EarthCARE) mission. EarthCARE is a joint ESA-JAXA mission and will embark a cloud/aerosol lidar (ATLID), a cloud-profiling Radar (CPR) a multispectral cloud/aerosol imager (MSI) and a three—view broad-band radiometer (BBR). ATLID is a 355nm high-spectral-resolution, polarization sensitive lidar.

The accurate retrieval of aerosol and cloud properties from space-based lidar is a challenging endeavor, even when the extra information provided by an HSRL system is exploited. The generally low signal-to-noise (SNR) ratios involved coupled with the need to respect the structure of the aerosol and cloud fields being sensed are particular challenges.

Over the past several years, cloud/aerosol algorithms have been developed for ATLID that have focused on the challenge of making accurate retrievals of cloud and aerosol extinction and backscatter specifically addressing the low SNR nature of the lidar signals and the need for intelligent binning/averaging of the data. Two of these ATLID processors are A-FM (ATLID featuremask) and A-PRO (ATLID profile processor). A-FM uses techniques adapated from the field of image processing to detect the presence of targets at high resolution while A-PRO (using A-FM as input) preforms a multi-scale optimal-estimation technique in order to retrieve both aerosol and cloud extinction and backscatter profiles.

Adaptations of the A-FM and A-PRO processors have been developed for Aeolus (called AEL-FM and AEL-PRO, respectively) and have been introduced into the Aeolus L2a operational processor. In this presentation A-FM and A-PRO will be described. Results based on simulated data for A-FM and A-PRO and results using AEL-FM and AEL-PRO using Aeolus observations will be presented and discussed.


How to cite: Donovan, D., van Zadelhoff, G.-J., and Wang, P.: The EarthCARE ATLID profile processors, EGU General Assembly 2024, Vienna, Austria, 14–19 Apr 2024, EGU24-16225, https://doi.org/10.5194/egusphere-egu24-16225, 2024.

EGU24-17361 | Posters on site | AS1.15

EarthCARE Cal/Val Campaigns - Overview 

Jonas von Bismarck, Robert Koopman, Stephanie Rusli, Malcolm Davidson, Dirk Bernaerts, Kotska Wallace, Thorsten Fehr, Timon Hummel, Vasileios Tzallas, Bjoern Frommknecht, and Michael Eisinger


The Earth Cloud Aerosol and Radiation Explorer (EarthCARE) is a satellite mission developed by the European Space Agency (ESA) in collaboration with the Japan Aerospace Exploration Agency (JAXA) to measure global profiles of aerosol, cloud and precipitation properties along with radiative fluxes and derived warming rates, with the goal of advancing our understanding of cloud-aerosol and radiation interactions and the Earth's radiative budget.  
 

Assuring the data quality of EarthCARE science products early after launch is an essential effort. This will be realised based on contributions from the independent EarthCARE validation team (ECVT) under coordination by ESA as well as monitoring-, calibration- and campaign activities performed under ESA (co-)management.  


An early focus to stabilize the data quality will be on airborne activities underflying the satellite with remote sensing and in-situ payloads. This will be done either in the context of larger science field campaigns or in individual activities, flanked by ground based measurement activities. 


The presentation will give an overview of ESA’s planned EarthCARE campaign activities, both directly implemented by ESA and in collaboration with science teams, and selected airborne and ground based instrument developments critical for the EarthCARE validation. 

How to cite: von Bismarck, J., Koopman, R., Rusli, S., Davidson, M., Bernaerts, D., Wallace, K., Fehr, T., Hummel, T., Tzallas, V., Frommknecht, B., and Eisinger, M.: EarthCARE Cal/Val Campaigns - Overview, EGU General Assembly 2024, Vienna, Austria, 14–19 Apr 2024, EGU24-17361, https://doi.org/10.5194/egusphere-egu24-17361, 2024.

EGU24-17575 | Posters on site | AS1.15

Cloud and Precipitation Microphysical Retrievals from the EarthCARE Cloud Profiling Radar: The C-CLD Product 

Kamil Mroz, Bernat Puidgomènech Treserras, Alessandro Battaglia, and Pavlos Kollias

This presentation delves into the C-CLD processor and its output product, both named the same, developed for the EarthCARE mission. The C-CLD processor has been designed to extract detailed microphysical properties of clouds and precipitation from the EarthCARE Cloud Profiling Radar data. The algorithm introduces a significant advancement by incorporating Doppler velocity information for the first time in space-borne radar retrievals. Our approach integrates an optimal estimation method to deduce vertical profiles of hydrometeor water content and particle characteristic size, employing reflectivity, mean Doppler velocity measurements, and path-integrated attenuation. The algorithm's robustness is further amplified by an ensemble-based method in the ice regions, ensuring both accuracy and consistency in the forward model relations.

Emphasizing the algorithm's advancements, we present a comprehensive overview of its theoretical basis and development. This includes the validation process, performance sensitivity analysis and quantification of the information content. The presentation will demonstrate the retrieval efficacy in diverse atmospheric conditions, ranging from warm to cold rain and snow.

In addition to algorithmic developments, our research also emphasizes the importance of iterative testing and refinement. Our approach combines model simulations with actual campaign datasets, which include both in-situ and remote sensing measurements, to validate and refine our methods. The rigorous analysis of data from campaigns like CADDIWA or IMPACTS, provided insights that allowed us to improve the C-CLD algorithm, ensuring its robustness and improving the reliability of its retrievals.

How to cite: Mroz, K., Puidgomènech Treserras, B., Battaglia, A., and Kollias, P.: Cloud and Precipitation Microphysical Retrievals from the EarthCARE Cloud Profiling Radar: The C-CLD Product, EGU General Assembly 2024, Vienna, Austria, 14–19 Apr 2024, EGU24-17575, https://doi.org/10.5194/egusphere-egu24-17575, 2024.

EGU24-17933 | ECS | Posters on site | AS1.15

Aerosol dust absorption - measurements with a reference instrument (PTAAM-2λ) and impact on the climate as measured in airborne  JATAC/CAVA-AW 2021/2022 campaigns 

Jesús Yus-Díez, Luka Drinovec, Marija Bervida, Uroš Jagodič, Blaž Žibert, Matevž Lenarčič, Eleni Marinou, Peristera Paschou, Nikolaos Siomos, Holger Baars, Ronny Engelmann, Arnett Skupin, Cordula Zenk, Thorsten Fehr, Andres Alastuey, Adolfo Gonzalez-Romero, Marco Pandolfi, Carlos Perez García-Pando, and Griša Močnik

Aerosol absorption coefficient measurements classically feature a very large uncertainty, especially given the absence of a reference method. The most used approach using filter-photometers is by measuring the attenuation of light through a filter where aerosols are being deposited. This presents several artifacts, with cross-sensitivity to scattering being most important at high single scattering albedo with the error exceeding 100%. 

We present lab campaign results where we have resuspended dust samples from different mid-latitude desert regions and measured the dust absorption and scattering coefficients, their mass concentration and the particle size distribution. The absorption coefficients were measured with two types of filter photometers: a Continuous Light Absorption Photometers (CLAP) and a multi-wavelength Aethalometer (AE33). The  dual-wavelength photo-thermal interferometer (PTAAM-2λ) was employed as the reference. Scattering coefficients were measured with an Ecotech Aurora 4000 nephelometer. The mass concentration was obtained after the weighting of filters before and after the sampling, and the particle size distribution (PSD) was measured by means of optical particle counters (Grimm 11-D).

Measurements of the scattering with the nephelometer and absorption with the PTAAM-2λ we obtained the filter photometer multiple scattering parameter and cross-sensitivity to scattering as a function of the different sample properties. Moreover, by determining the mass concentration and the absorption coefficients of the samples, we derived the mass absorption cross-sections of the different dust samples, which can be linked to their size distribution as well as to their mineralogical composition.

The focus of the JATAC campaign in September 2021 and September 2022 on and above Cape Verde Islands was on the calibration/validation of the ESA Aeolus satellite ALADIN lidar, however, the campaign also featured secondary scientific climate-change objectives. As part of this campaign, a light aircraft was set-up for in-situ aerosol measurements. Several flights were conducted over the Atlantic Ocean up to and above 3000 m above sea level during intense dust transport events. The aircraft was instrumented to determine the absorption coefficients using a pair of Continuous Light Absorption Photometers (CLAPs) measuring in the fine and coarse fractions separately, with parallel measurements of size distributions in these size fractions using two Grimm 11-D Optical Particle Size Spectrometers (OPSS). In addition, we performed measurements of the total and diffuse solar irradiance with a DeltaT SPN1 pyranometer.

The combination of the absorption and PSD with source identification techniques enabled the separation of the contributions to  absorption by dust and black carbon. The atmospheric heating rate of these two contributions was determined by adding the irradiance measurements. Therefore, the integration of the results from the Using laboratory resuspension experiments  to interpret the airborne measurements is of great relevance for the determination  of the radiative effect of the Saharan Aerosol Layer as measured over the tropical Atlantic ocean.

How to cite: Yus-Díez, J., Drinovec, L., Bervida, M., Jagodič, U., Žibert, B., Lenarčič, M., Marinou, E., Paschou, P., Siomos, N., Baars, H., Engelmann, R., Skupin, A., Zenk, C., Fehr, T., Alastuey, A., Gonzalez-Romero, A., Pandolfi, M., Perez García-Pando, C., and Močnik, G.: Aerosol dust absorption - measurements with a reference instrument (PTAAM-2λ) and impact on the climate as measured in airborne  JATAC/CAVA-AW 2021/2022 campaigns, EGU General Assembly 2024, Vienna, Austria, 14–19 Apr 2024, EGU24-17933, https://doi.org/10.5194/egusphere-egu24-17933, 2024.

EGU24-18417 | ECS | Orals | AS1.15

Advancements in COSP Lidar Simulator Development for Aeolus Satellite Instrument and Future Applications for Earth Care 

Marie-Laure Roussel, Hélène Chepfer, Olivier Chomette, and Marine Bonazzola

The Aeolus mission,  conducted by the European Space Agency (ESA), relies on lidar technology to measure global wind profiles and observe Earth's atmosphere, and in particular clouds that will be the subject of special attention with the incoming Earth Care mission. In future climate predictions generated through climate models, clouds represent the greatest source of uncertainty. Therefore, it is crucial to study them, especially within the atmospheric column, as their vertical distribution has a radiative impact which is poorly known. Active lidar remote sensing technology onboard satellites is a valuable way of conducting measurements accross the atmosphere. However, cloud comparison between observational data and models is challenging due to differences in their definitions. To address this issue, a simulator is employed to model cloud-specific features as they would appear to a given instrument if it were flying over the modeled Earth.

This research initiative enhances the functionalities of the existing CFMIP Observation Simulator Package (COSP) (Bodas Salcedo, 2011). Our developments rest on the advancements achieved in adapting COSP for various satellite instruments in the past (Chepfer, 2006 & 2008) and its improvements over the years (Swales, 2018 - Bonazzola, 2023). The ongoing work focuses on refining the specifities of the current simulator to meet the unique requirements of the lidar of the Aeolus satellite and preparing thoses of ATLID onboard Earth Care satellite.

The success of this development is optimistic for the future creation of the simulator of the lidar of the Earth Care satellite that may be launched this year, showing the adaptability and versatility of this tool. Ultimately, these advancements contribute to the broader scientific community by providing a sophisticated tool for the analysis of satellite data and the validation of model predictions across various satellite missions (Cesana, 2013).

How to cite: Roussel, M.-L., Chepfer, H., Chomette, O., and Bonazzola, M.: Advancements in COSP Lidar Simulator Development for Aeolus Satellite Instrument and Future Applications for Earth Care, EGU General Assembly 2024, Vienna, Austria, 14–19 Apr 2024, EGU24-18417, https://doi.org/10.5194/egusphere-egu24-18417, 2024.

EGU24-18425 | ECS | Posters on site | AS1.15

Aerosol Light Extinction Coefficient Closure - Comparison of Airborne In-situ Measurements with LIDAR measurements during JATAC/CAVA-AW 2021/2022 campaigns 

Marija Bervida Mačak, Jesús Yus-Díez, Luka Drinovec, Uroš Jagodič, Blaž Žibert, Matevž Lenarčič, Eleni Marinou, Peristera Paschou, Nikolaos Siomos, Holger Baars, Ronny Engelmann, Annett Skupin, Athina Augusta Floutsi, Cordula Zenk, Thorsten Fehr, and Griša Močnik

The JATAC campaign in September 2021 and September 2022 on and above Cape Verde Islands resulted in a large in-situ and remote measurement dataset. Its main objective was the calibration and validation of the ESA satellite Aeolus ALADIN Lidar. The campaign also featured secondary scientific objectives related to climate change. Constraining remote sensing measurements with those provided by in-situ instrumentation is crucial for proper characterization and accurate description of the 3-D structure of the atmosphere.

We present the results performed with an instrumented light aircraft (Advantic WT-10) set-up for in-situ aerosol measurements. Twenty-seven flights were conducted over the Atlantic Ocean at altitudes around and above 3000 m above sea level during intense dust transport events. Simultaneous measurements with PollyXT, and eVe ground-based lidars took place, determining the vertical profiles of aerosol optical properties, which were also used to plan the flights.

The aerosol light extinction coefficient was obtained at three different wavelengths as a combination of the absorption coefficients determined using Continuous Light Absorption Photometers (CLAP) and the scattering coefficients measured with an Ecotech Aurora 4000 nephelometer, which also measured the backscatter fraction. The particle size distributions above 0.3 µm diameter were measured with two Grimm 11-D Optical Particle Size Spectrometers (OPSS). Moreover, CO2 concentration, temperature, aircraft GPS position and altitude, air and ground speed were also measured.

We compare the in-situ aircraft measurements of the aerosol extinction coefficients with the AEOLUS lidar derived extinction coefficients, as well as with the ground-based eVe and PollyXT lidar extinction coefficients when measurements overlapped in space and time. The comparison was performed at the closest available wavelengths, with in-situ measurements inter/extrapolated to those of the lidar systems.

In general we find an underestimation of the extinction coefficient obtained by lidars compared to the in-situ extinction coefficient. The slopes of regression lines of ground-based lidars, PollyXT and eVe, against the in-situ measurements are characterised by values ranging from 0.61 to 0.7 and R2 between 0.71 and 0.89. Comparison further suggests better agreement between Aeolus ALADIN lidar and the in-situ measurements. Relationship described by fitting the Aeolus to in-situ data is characterised by the slope value 0.76 and R2 of 0.8.

The causes of better agreement of the in-situ measurements with the ALADIN lidar than with the surface based ones are being studied, with several reasons being considered: a) lower spatial and temporal resolution which homogenize the area of study in comparison with the very fine vertical variations of the aerosols, which can be detected with the surface-based measurements, impairing the comparison with highly vertically resolved ground-lidar measurements while not affecting averaged space-borne lidar; b) the effect of lower clouds/ Saharan air layers on the attenuation of the lidar signal.

The presented results show the importance of the comparison of the remote with in-situ measurements for the support of the research on evolution, dynamics, and predictability of tropical weather systems and provide input into and verification of the climate models.

How to cite: Bervida Mačak, M., Yus-Díez, J., Drinovec, L., Jagodič, U., Žibert, B., Lenarčič, M., Marinou, E., Paschou, P., Siomos, N., Baars, H., Engelmann, R., Skupin, A., Floutsi, A. A., Zenk, C., Fehr, T., and Močnik, G.: Aerosol Light Extinction Coefficient Closure - Comparison of Airborne In-situ Measurements with LIDAR measurements during JATAC/CAVA-AW 2021/2022 campaigns, EGU General Assembly 2024, Vienna, Austria, 14–19 Apr 2024, EGU24-18425, https://doi.org/10.5194/egusphere-egu24-18425, 2024.

The National Research Institute for Earth Science and Disaster Resilience owns five scanning Ka-band cloud radars. Using these radars, we are planning to validate the cloud profiling radar (CPR) of the EarthCARE satellite. The EarthCARE CPR only observes along the line directly under the satellite path and has a return period of about 25 days. Therefore, we will facilitate the comparison by collecting data from what we can consider to be the similar region as the EarthCARE path. Statistical validation will be performed by creating a Contoured Frequency by Altitude/Temperature Diagram (CFAD/CFTD) and comparing the distributions. Both case and relatively long-term comparisons are possible. On the other hand, although the opportunity is rare, it is possible to compare the vertical profiles at the intersection with the vertical (RHI) observations of the ground-based radar if the EarthCARE path comes within the range of the ground-based cloud radar with the observation range of 30 km. Three-dimensional observations using Plan Position Indicator (PPI) scans can be used to generate data on the Cartesian grid (CAPPI data). From this CAPPI data, it is possible to create a vertical cross section along the path of the EarthCARE satellite. Because of the limited number of elevation angles, the comparison is relatively coarse in the vertical direction. Since this observation is not done in the vertical direction, only radar reflectivity is used for comparison, not Doppler velocity. Other methods of verifying liquid water contents using cloud radar and microwave radiometer are also under consideration.

How to cite: Ohigashi, T. and Misumi, R.: Ground-based scanning Ka-band cloud radar observations for validation of EarthCARE Cloud Profiling Radar (CPR), EGU General Assembly 2024, Vienna, Austria, 14–19 Apr 2024, EGU24-18461, https://doi.org/10.5194/egusphere-egu24-18461, 2024.

EGU24-18670 | ECS | Posters on site | AS1.15

A sensitivity study using the ATLID lidar simulator and upcoming plans for the validation of EarthCARE mission 

Peristera Paschou, Eleni Marinou, Jos de Kloe, Dave Donovan, Gerd-Jan van Zadelhoff, Kalliopi-Artemis Voudouri, and Vassilis Amiridis

The Earth Clouds, Aerosol and Radiation Explorer (EarthCARE) is a joint mission of the European Space Agency (ESA) and the Japan Aerospace Exploration Agency (JAXA) for monitoring the aerosols, clouds, and precipitation, and for radiation closure studies. The Atmospheric Lidar (ATLID) is a High Spectral Resolution Lidar system and one of the four instruments that will be deployed onboard the platform. ATLID will use linearly polarized emission at 355 nm while pointing at 3o off-nadir and will detect the molecular (Rayleigh) and particulate (Mie) backscattered signals as well as the cross-polar component of the backscatter signals, aiming to provide profiles of the optical properties of aerosols and optically thin clouds such as the particle backscatter and extinction coefficients, and the depolarization ratio. In preparation for the calibration and validation (cal/val) activities that will be performed for ATLID upon the EarthCARE launch in May 2024, a lidar simulator tool (CARDINAL Campaign Tool; CCT) has been developed for providing realistic simulations of the ATLID lidar signals and the Level 1 (L1) products of the attenuated particulate (Mie) backscatter, the attenuated molecular (Rayleigh) backscatter, and the attenuated cross-polar backscatter. In brief, the CCT workflow includes the parametrization of an atmospheric scene with the use of model fields and/or measurements from airborne or ground-based lidars, a lidar radiative transfer model, and an instrument model based on the ATLID design. The CCT simulates the lidar signals that would be recorded from ATLID for the provided atmospheric scene and obtains the corresponding ATLID L1 products.

In this study, measurements of eVe lidar from the ASKOS campaign (Cabo Verde, 2021/2022), are used as an input in the simulator for obtaining realistic ATLID L1 profiles. eVe lidar is a combined linear/circular polarization Raman lidar operating at 355 nm for aerosol profiling and consists ESA’s ground reference system for the cal/val of the ESA Aeolus and EarthCARE missions. Several cases of different aerosol layers and cirrus clouds are investigated.

Furthermore, the simulated ATLID L1 profiles will be used in the Level 2A processing chain (A-PRO) to derive realistic profiles of the particle backscatter and extinction coefficients, and the linear depolarization ratio. The realistic ATLID L2A profiles will be compared with the corresponding L2 profiles from eVe lidar, aiming to investigate the detection sensitivity of ATLID products on real aerosol layers.

Upcoming plans for the validation of EarthCARE mission include the exploitation of eVe lidar in an overpass cross point. The key aspects of this validation will be presented. In brief, the system will undergo an upgrade to enhance its capabilities for the cal/val activities of EarthCARE mission, retaining its combined linear/circular configuration while incorporating state-of-the-art equipment tailored for measurements on multiple scattering effects and automations to enhance the measurement procedures.

How to cite: Paschou, P., Marinou, E., de Kloe, J., Donovan, D., van Zadelhoff, G.-J., Voudouri, K.-A., and Amiridis, V.: A sensitivity study using the ATLID lidar simulator and upcoming plans for the validation of EarthCARE mission, EGU General Assembly 2024, Vienna, Austria, 14–19 Apr 2024, EGU24-18670, https://doi.org/10.5194/egusphere-egu24-18670, 2024.

EGU24-18904 | Posters on site | AS1.15

Use of EarthCARE products within the EUMETSAT validation facility for Level 2 Cloud products   

Loredana Spezzi, Alessio Bozzo, Phil Watts, John Jackson, and Andre Belo do Couto

The EUMETSAT central facility generates and disseminates several cloud products from both geostationary and low-Earth orbit passive sensors, which serve a variety of applications, spanning from nowcasting, to numerical weather prediction to climate monitoring. The retrieved cloud parameters include cloud/dust/ash detection, cloud top height and microphysics (particle effective radius and optical thickness). All EUMETSAT products are validated and continuously quality monitored against independent reference data to ensure state-of-the-art algorithm performance, product quality/accuracy compliant with user and operational service requirements, and stability and continuity/consistency over time (i.e., coping with instrument degradation, algorithm evolutions, updated calibration, etc.).

This contribution provides an overview of the tools developed at EUMETSAT to perform the monitoring and validation of cloud products against lidar/radar measurements, which have established themselves as a trustworthy source for the detection of cloud layers and superior to any other validation data source when it comes to estimate the cloud height, particle microphysical and optical properties. We focus on the status of these tools and the plans for their further development and release to users. The tools are fully automated and handle the validation of products from both geostationary and polar-orbiting satellites, including data download and organisation, instrument co-location and the development of comparison metrics. The toolkit includes:

  • A tool performing the validation of EUMETSAT against space-based radar and lidar measurements. For almost two decades (since 2006), the CloudSat and CALIPSO observations have been the prime reference source for this validation. EarthCARE will provide the natural continuation to the observations provided by these two instruments, which reached their end of life in autumn 2023. We discuss the use of EarthCARE products as envisaged in the validation activities with a particular focus on the retrieval of cloud properties based on the synergistic use of lidar, radar and multi-spectral imager data. Furthermore, the higher sensitivity measurements expected from HSRL and CPR on board EarthCARE with respect to CALIPSO and CloudSat will require careful investigations in order to transfer the current experience in the use of A-Train products as a validation reference to the new EarthCARE products.
  • A tool performing the validation of EUMETSAT cloud products against ground-based radar and lidar measurements from ACTRIS (the European Research Infrastructure for the observation of Aerosol, Cloud and Trace Gases), specifically using the cloud products generated by the ACTRIS-Cloudnet processing facility maintained by the Finnish Meteorological Institute (FMI). This validation activity fills in the gap between CloudSat/CALIPSO end of life and EarthCARE launch.
  • METIS-Clouds (Monitoring and Evaluation of Thematic Information from Space), a web application tool providing access to the collection of monitoring and validation results of EUMETSAT cloud products, on a global and regional level. This collection is exploited by both the in-house algorithm developers (to identify and fix issues, bugs, etc.) and the users (to assess the product accuracy).

How to cite: Spezzi, L., Bozzo, A., Watts, P., Jackson, J., and Belo do Couto, A.: Use of EarthCARE products within the EUMETSAT validation facility for Level 2 Cloud products  , EGU General Assembly 2024, Vienna, Austria, 14–19 Apr 2024, EGU24-18904, https://doi.org/10.5194/egusphere-egu24-18904, 2024.

EGU24-20094 | Posters on site | AS1.15

Radiative fluxes estimation for the Broadband Radiometer (BBR) on EarthCARE: The BMA-FLX product 

Almudena Velazquez Blazquez, Carlos Domenech, Edward Baudrez, Nicolas Clerbaux, and Carla Salas Molar

The Broad-Band Radiometer (BBR) instrument on the EarthCARE satellite will provide accurate outgoing solar and thermal radiances at the Top of the Atmosphere (TOA) obtained in an along track configuration at three fixed viewing directions (nadir, fore and aft).

The operational BMA-FLX product on top-of-atmosphere radiative fluxes, is based on a radiance-to-flux conversion algorithm mainly fed by the unfiltered broad-band radiances, obtained in the BM-RAD product, auxiliary data from EarthCARE L2 cloud products and modelled geophysical databases. The conversion algorithm models the angular distribution of the reflected solar radiation and thermal radiation emitted by the Earth-Atmosphere system, and returns geometry independent flux estimates to be used for the radiative closure assessment of the Mission.

Different methodologies are employed for the solar and thermal BBR ADMs. Models for SW radiances are created for different scene types and constructed from Clouds and the Earth’s Radiant Energy System (CERES) data using a feed-forward back-propagation artificial neural network (ANN) technique. The LW angular models are derived through multiple regressions on brightness temperatures and brightness temperature differences of the multispectral imager (MSI) 10.8 µm and 12 µm channels, and corresponding LW fluxes obtained by using a large database of LibRadtran and SBDART radiative transfer simulations.

Both retrieval algorithms exploit the multi-viewing capability of the BBR by applying the radiance to flux conversion algorithms to each of the BBR views, which have been previously collocated at a reference level in order to minimize parallax effects. The reference height where the three BBR measurements are co-registered corresponds to the height where most reflection or emission takes place and depends on the spectral regime. LW observations are co-registered at the cloud top height while SW reference height is instead selected by minimizing the flux differences between nadir, fore and aft fluxes. The derived fluxes from the collocated views are then combined into a single flux value at the selected reference level.

Verification of the algorithms has been carried out using the 3 test scenes developed by the EarthCARE team using the Environment Canada and Climate Change’s Global Environmental Multiscale model (GEM). The BBR solar and thermal flux retrieval algorithms have been successfully employed to retrieve radiative fluxes over the 3 test scenes. Comparisons with the true fluxes from the GEM model provide RMSE < 5 W/m² for the LW fluxes and < 15 W/m² for the SW fluxes.

How to cite: Velazquez Blazquez, A., Domenech, C., Baudrez, E., Clerbaux, N., and Salas Molar, C.: Radiative fluxes estimation for the Broadband Radiometer (BBR) on EarthCARE: The BMA-FLX product, EGU General Assembly 2024, Vienna, Austria, 14–19 Apr 2024, EGU24-20094, https://doi.org/10.5194/egusphere-egu24-20094, 2024.

EGU24-20108 | Posters on site | AS1.15

EarthCARE mission for global height-resolved cloud particle categories and vertical motion 

Kaori Sato and Hajime Okamoto

Improved representation of ice-phase processes in numerical models necessitates an enhanced understanding of ice-particle microphysics/radiative properties and their respective formation conditions. The EarthCARE JAXA L2 standard/research algorithms for clouds, precipitation and vertical motions aims at providing more detailed information of cloud particle categories and associated cloud microphysics/radiative properties from ATLID-CPR-MSI synergy. In particular, measurements from CPR Doppler and ATLID are expected to enable more comprehensive exploration of the relation between different cloud particle categories and the dynamical conditions. Based on complimentary information from long-term A-train data, the cloud particle category classification methodology planned for EarthCARE is tested and a new dataset has been developed. With this dataset, the geographical dependence of the occurrence of different ice cloud particle habit category and their properties that will be further investigated in detail from EarthCARE observations are discussed. Activities related to JAXA L2 validations from EU-Japan collaboration are developing new ways of combining ground-based active sensors and detailed surface observation of snow and rain to improve the quantification of precipitation and particle type retrievals. These studies would be valuable for further assessing the physical processes associated with cloud-precipitation formation from the EarthCARE mission.

How to cite: Sato, K. and Okamoto, H.: EarthCARE mission for global height-resolved cloud particle categories and vertical motion, EGU General Assembly 2024, Vienna, Austria, 14–19 Apr 2024, EGU24-20108, https://doi.org/10.5194/egusphere-egu24-20108, 2024.

EGU24-20116 | Orals | AS1.15

PACE-PAX validation campaign – validating PACE and supporting Earthcare 

Ivona Cetinić, Kirk Knobelspiesse, Brian Cairns, and Monserrat Piñol Solé

NASA’s Plankton, Aerosol, Clouds and ocean Ecosystems (PACE) Mission, scheduled to be launched in early 2024, will produce a variety of ocean color, aerosol, cloud and land surface data products from its three sensors. Some of these products will be created with established ‘heritage’ algorithms, and others are new, representing recent algorithm development and the unique measurement capability of the PACE sensors. A crucial part of the validation activities is the PACE Postlaunch Airborne eXperiment (PACE-PAX), that is planned to occur in September of 2024. This dedicated field campaign, due to its platform and instrumental setup, offers an opportunity to support not only PACE, but the EarthCARE mission as well, opening opportunities for validation, new collaborations, and development of new algorithms for both Earth science missions.

How to cite: Cetinić, I., Knobelspiesse, K., Cairns, B., and Piñol Solé, M.: PACE-PAX validation campaign – validating PACE and supporting Earthcare, EGU General Assembly 2024, Vienna, Austria, 14–19 Apr 2024, EGU24-20116, https://doi.org/10.5194/egusphere-egu24-20116, 2024.

EGU24-20244 | Posters on site | AS1.15

Development of JAXA L2 algorithms to retrieve cloud properties and vertical velocity for the EarthCARE mission 

Hajime Okamoto, Kaori Sato, Tomoaki Nishizawa, and Hiroaki Horie

JAXA L2-algorithms for cloud properties and vertical velocity were developed for the EarthCARE mission. CPR will be the first 94GHz Doppler cloud radar in space and ATLID is the 355nm-high spectral resolution lidar that can provide backscattering, extinction and depolarization ratio. The JAXA L2 standard cloud products will be derived by using (1) CPR-only algorithms without Doppler velocity, (2) CPR and ATLID algorithms and (3) CPR. ATLID and MSI algorithms. The JAXA L2 research product will be produced by using Doppler velocity (Vd) from CPR in addition to above. The products include cloud mask, cloud particle type, cloud particle categories, terminal velocity and vertical air motion. The L2 algorithms correspond to the extended version to those for CloudSat, CALIPSO (Hagihara et al., 2010 for cloud mask, Yoshida et al., 2010 and Kikuchi et al., 2017 for cloud particle type and Okamoto et al., 2010, Sato and Okamoto 2011 for cloud microphysics) and the latter has been distributed as JAXA EarthCARE A-train products. Vd may be affected by aliasing and the correction algorithm was developed. After the correction, Vd is effective to discriminate clouds and precipitation in cloud particle type products. It is also effective to specify the upward motion in convections. Cloud particle type algorithms for CPR use Vd and Ze for the better discrimination of clouds and precipitation. Two-dimensional diagram of lidar ratio and depolarization ratio from ATLID enables to retrieve ice particle categories (Okamoto et al., 2019, 2020, Sato and Okamoto 2023). The knowledge of particle categories reduce the uncertainties in the retrieved microphysics. Recently developed physical model (Sato et al., 2018) and vectorized physical model (Sato et al., 2019) were implemented into the algorithms to account multiple scattering contribution to the signals.

Synergetic ground-based observation system has been constructed in NICT Koganei, Tokyo. The ground-based system consists of 94GHz high-sensitivity-cloud radar (HG-SPIDER) and electric scanning cloud radar (ES-SPIDER), Multi-Field-of-view Multiple Scattering Polarization Lidar (Okamoto et al., 2016, Nishizawa et al., 2021), high spectral resolution lidar (Jin et al., 2020), direct-detection Doppler lidar (Ishii et al., 2022), coherent Doppler lidar (Iwai et al., 2013) and wind profiler. Cloud mask, particle type, cloud particle category, cloud microphysics, terminal velocity and vertical motion are retrieved by the system and can be used to evaluate L2 products.

How to cite: Okamoto, H., Sato, K., Nishizawa, T., and Horie, H.: Development of JAXA L2 algorithms to retrieve cloud properties and vertical velocity for the EarthCARE mission, EGU General Assembly 2024, Vienna, Austria, 14–19 Apr 2024, EGU24-20244, https://doi.org/10.5194/egusphere-egu24-20244, 2024.

EGU24-22410 | Orals | AS1.15

Development of JAXA L2 algorithm to retrieve aerosol and cloud properties using ATLID and MSI 

Tomoaki Nishizawa, Rei Kudo, Eiji Oikawa, Akiko Higurashi, Yoshitaka Jin, Kaori Sato, and Hajime Okamoto

We have developed JAXA L2 algorithm to retrieve aerosol and cloud optical properties using data of 355nm high spectral resolution lidar (HSRL) with depolarization measurement function “ATLID” onboard EarthCARE satellite, to determine the global distribution of aerosols and clouds and to better understand cloud-aerosol interactions and their climate impacts. Using the three channel data of the ATLID, the developed algorithm estimates (1) extinction coefficient, backscatter coefficient and depolarization ratio of particles (aerosols and clouds) without assuming a particle lidar ratio, (2) identifies molecule-rich, aerosol-rich, or cloud-rich slab layers, (3) classifies particle type (e.g., dust and maritime), (4) retrieves planetary boundary layer height, and (5) estimates extinction coefficients for several main aerosol components such as dust, sea-salt, carbonaceous, and water-soluble aerosols using difference in depolarization and light absorption properties of the aerosol components. Furthermore, we have developed aerosol retrieval algorithm using both the ATLID and multi-spectral imager “MSI”. This algorithm retrieves vertically mean mode-radii for dust and fine-mode aerosols as well as the extinction coefficients for the four aerosol components using the three channels of the ATLID and radiances at 670nm and 865nm of MSI. The algorithms described above were developed based on our developed algorithm for the CALIOP and MODIS measurements. In the presentation, the overview of the algorithms and their performance will be described. In addition, related studies will be presented.

How to cite: Nishizawa, T., Kudo, R., Oikawa, E., Higurashi, A., Jin, Y., Sato, K., and Okamoto, H.: Development of JAXA L2 algorithm to retrieve aerosol and cloud properties using ATLID and MSI, EGU General Assembly 2024, Vienna, Austria, 14–19 Apr 2024, EGU24-22410, https://doi.org/10.5194/egusphere-egu24-22410, 2024.

EGU24-22426 | Posters on site | AS1.15

Enhancing Satellite Validation in Antarctica: A Novel K2W Methodology for Comparing Ground-Based Measurements at K-band with Spaceborne Radar Observations Collected at W band 

Alessandro Bracci, Kaori Sato, Luca Baldini, Federico Porcú, Roberta Paranunzio, and Hajime Okamoto

Validating satellite measurements and geophysical retrievals is crucial for Earth observation missions, particularly in remote regions like Antarctica. This task faces challenges due to the harsh environment, logistical complexities, equipment maintenance, and operational costs. In Antarctica, where satellite observations play a pivotal role in estimating precipitation, validating satellite products through ground-based measurements is imperative but limited.

Cloud Profiling Radar (CPR) on NASA's CloudSat satellite provides reflectivity profiles at W-band (94 GHz), while the upcoming ESA/JAXA EarthCARE satellite will offer Doppler profiles in addition to reflectivity profiles. Despite efforts to enhance instrumentation for ice particle profiling at some Antarctic research stations, widely-used instruments include the Micro Rain Radar (MRR) and laser disdrometers.

This work introduces a novel validation methodology, K2W, which combines ground-based reflectivity profiles at K-band (24 GHz) from MRR and laser disdrometer observations. K2W enables the simulation of reflectivity and Doppler profiles at W-band, facilitating the validation of satellite-borne radar measurements at 94 GHz.

A comparison between CloudSat reflectivity profiles and K2W profiles during a satellite overpass at the Italian Antarctic station “Mario Zucchelli” revealed a mean difference of 0.2 dB at the lowest satellite radar range bin, with a time lag within ±12.5 min and distance within 25 km around the CloudSat overpass. Additionally, K2W simulated the 94 GHz Doppler velocity below 1 km altitude expected by EarthCARE, yielding a standard deviation of the simulated Doppler velocity less than 0.2 m s-1.

The use of simulated K2W profiles significantly enhances precipitation quantification over Antarctica and validates satellite measurements with reduced attenuation compared to ground-based W-band radar. K2W, utilizing MRR and disdrometer available at most Antarctic stations, broadens the scope for validation sites. The proposed methodology extends its applicability to assessing EarthCARE CPR Doppler velocity products and Level 2 standard precipitation products at various ground observation sites.

How to cite: Bracci, A., Sato, K., Baldini, L., Porcú, F., Paranunzio, R., and Okamoto, H.: Enhancing Satellite Validation in Antarctica: A Novel K2W Methodology for Comparing Ground-Based Measurements at K-band with Spaceborne Radar Observations Collected at W band, EGU General Assembly 2024, Vienna, Austria, 14–19 Apr 2024, EGU24-22426, https://doi.org/10.5194/egusphere-egu24-22426, 2024.

EGU24-1493 | ECS | Posters on site | AS1.16

Overview of Secondary Ice Production In the Deep Convective Microphysics Experiment (DCMEX) 

Kezhen Hu, Gary Lloyd, HuiHui Wu, Keith Bower, Mike Flynn, Nike Marsden, Tom Choularton, Martin Daily, Ben Murray, Hugh Coe, Paul Connolly, Graeme Nott, Chris Reed, Waldemar Schledewitz, Martin Gallagher, and Alan Blyth

Secondary ice formation has long been a problem in cloud physics. This affects the radiation properties, precipitation development and the lifetime of mixed-phase clouds.  We conducted multiple flights over the Magdalena Mountain region in New Mexico to provide high-resolution information on the spatio-temporal distribution of ice phase evolution and the linkage between convective cloud thermodynamic and secondary ice processes. A combination of high-resolution cloud spectrometers (including 3VCPI, 2DS, HVPS, and CDP) were used to provide measurements of the evolution of cloud particle and precipitation concentrations, sizes, and morphology. Those data were used to identify and assess primary and secondary ice production (SIP) contributions compared with measured INP concentrations to characterise the frequency of SIP events, where precipitation particles first form and how they interact with cloud dynamics. The initial results suggest that most ice enhancement events in these clouds occurred in the temperature range of -5 °C to -10 °C, while occasionally even larger concentrations were observed between -22.5 °C and -25 °C. The results also show that observed secondary ice in the temperature range from -25 °C to -30 °C was more related to the updraft regions. The next step is to produce more detailed explanations and results by examining these data in conjunction with the cloud thermodynamic background.


How to cite: Hu, K., Lloyd, G., Wu, H., Bower, K., Flynn, M., Marsden, N., Choularton, T., Daily, M., Murray, B., Coe, H., Connolly, P., Nott, G., Reed, C., Schledewitz, W., Gallagher, M., and Blyth, A.: Overview of Secondary Ice Production In the Deep Convective Microphysics Experiment (DCMEX), EGU General Assembly 2024, Vienna, Austria, 14–19 Apr 2024, EGU24-1493, https://doi.org/10.5194/egusphere-egu24-1493, 2024.

EGU24-1580 | ECS | Posters on site | AS1.16

Understanding the tropical high-cloud feedback through the ice-water-path lens 

Jakob Deutloff, Ann Kristin Naumann, Manfred Brath, and Stefan Buehler

The response of tropical high clouds to global warming has the potential to produce an important climate feedback but remains poorly constrained. To improve our understanding of the tropical high-cloud feedback, we develop a conceptual model of the high-cloud radiative effect as a function of the ice water path (IWP) and surface temperature. This model provides a framework for analysing how changes in IWP distribution and cloud top height with surface warming can generate a tropical high-cloud feedback. By including the entire IWP range, it improves on previous conceptual models that rely on cloud fractions. To parameterize our conceptual model, we use atmospheric profiles from global simulations with the ICOsahedral Nonhydrostatic weather and climate model (ICON) with 5 km horizontal resolution, which are used to calculate the radiative fluxes offline with the line-by-line Atmospheric Radiative Transfer Simulator (ARTS). This setup allows us to “switch off” the high clouds in the radiative transfer calculations to better study the radiative effect of high clouds over low clouds. Our conceptual model represents the main physical processes underlying the high-cloud radiative effect and is able to reproduce the results from the ARTS simulations. It therefore provides a valuable framework for analysing the tropical high-cloud feedback produced by climate models and helps to understand the origin of the associated uncertainties.

How to cite: Deutloff, J., Naumann, A. K., Brath, M., and Buehler, S.: Understanding the tropical high-cloud feedback through the ice-water-path lens, EGU General Assembly 2024, Vienna, Austria, 14–19 Apr 2024, EGU24-1580, https://doi.org/10.5194/egusphere-egu24-1580, 2024.

EGU24-1986 | ECS | Posters on site | AS1.16

A systematic evaluation of high-cloud controlling factors 

Sarah Wilson Kemsley, Peer Nowack, and Paulo Ceppi

Clouds strongly modulate the top-of-the-atmosphere (TOA) energy budget. While most evidence indicates that changes in cloud-induced radiative anomalies at the TOA likely amplifies warming, the magnitude of this global cloud feedback remains highly uncertain. “Cloud Controlling Factor” (CCF) analysis is an approach that can be used to tackle this uncertainty, deriving relationships between large-scale meteorological drivers and cloud-radiative anomalies which can subsequently be used to constrain cloud feedback. However, the choice of meteorological controlling factors is crucial for a meaningful constraint, and while there is rich literature investigating ideal CCF setups for low-level clouds, there is a distinct lack of analogous research that explicitly targets high clouds.

Here, we use ridge regression to systematically evaluate CCFs that specifically target high cloud formation and cessation using historical data. We evaluate the addition of five candidate CCFs to previously established core CCFs within large spatial domains to predict longwave high-cloud radiative anomalies: upper-tropospheric static stability (SUT), sub-cloud moist static energy, convective available potential energy, convective inhibition, and upper-tropospheric wind shear. We identify an optimal configuration including SUT, and show that the spatial distribution of the  SUT  ridge regression coefficients are congruent with the physical drivers of known high-cloud feedbacks. We further deduce that inclusion of SUT into observational constraint frameworks may reduce uncertainty associated with changes in anvil cloud amount as a function of climate change. These results highlight upper-tropospheric static stability as an important CCF for high clouds and longwave cloud feedback, which we begin to explore using modelled data under an abrupt quadrupling of CO(abrupt-4xCO2).

How to cite: Wilson Kemsley, S., Nowack, P., and Ceppi, P.: A systematic evaluation of high-cloud controlling factors, EGU General Assembly 2024, Vienna, Austria, 14–19 Apr 2024, EGU24-1986, https://doi.org/10.5194/egusphere-egu24-1986, 2024.

EGU24-3815 | ECS | Posters on site | AS1.16

Influence of contrasting sea surface temperature warming patterns on atmospheric circulation and cloud feedbacks 

Anna Mackie, Michael P. Byrne, and Andrew I.L. Williams

Climate sensitivity, defined as the global-mean surface temperature change due to a doubling of atmospheric CO2, is a key metric for quantifying the Earth system response to increasing greenhouse gases. Estimates of climate sensitivity vary widely, making it difficult for societies to prepare for the impacts of climate change. Uncertainty in climate sensitivity is driven primarily by uncertainty in how clouds will respond to warming. But how clouds respond to climate change depends strongly on the geographic pattern of warming: the so-called ‘pattern effect’. This recently-discovered phenomenon is crucial to narrowing uncertainty in climate projections, yet fundamental understanding of the processes underpinning the pattern effect is underdeveloped. In particular, the potential role of changes in atmospheric circulation as a crucial link between warming patterns and cloud feedbacks remains unclear. 

Here we use a series of idealised GCM simulations and a moist static energy (MSE) framework to investigate the coupling between tropical sea surface temperature (SST) warming, circulation changes and cloud feedbacks. In the simulations the SST of different ‘patches’ of the tropical ocean are perturbed, resulting in strongly non-linear cloud responses. We demonstrate that the circulation response is also non-linear and closely coupled to the cloud response. Specifically, SST warming in the west Pacific leads to a reduction in ascent fraction – the proportion of the atmosphere that is ascending at 500 hPa – over the tropical ocean, associated with an increased top-of-atmosphere shortwave cloud radiative effect.  In contrast, SST warming in the east Pacific has little effect on ascent fraction. We develop a framework for estimating ascent fraction as a function of near-surface MSE, inclusive of an entraining-plume model to account for dry-air mixing into moist ascending air. We demonstrate how this framework can provide insight into both the circulation changes associated with patterned SST warming and the resulting cloud feedbacks. 

How to cite: Mackie, A., Byrne, M. P., and Williams, A. I. L.: Influence of contrasting sea surface temperature warming patterns on atmospheric circulation and cloud feedbacks, EGU General Assembly 2024, Vienna, Austria, 14–19 Apr 2024, EGU24-3815, https://doi.org/10.5194/egusphere-egu24-3815, 2024.

EGU24-4149 | Orals | AS1.16

Anvil cloud thinning in high-resolution models implies greater climate sensitivity 

Adam Sokol, Casey Wall, and Dennis Hartmann

Anvil clouds produced by tropical convection are expected to shrink in area as the climate warms, and the associated radiative feedback has long been the subject of controversy. In the World Climate Research Programme’s (WCRP) recent assessment of equilibrium climate sensitivity (ECS), the anvil area feedback was the least certain of any individual feedback process but was nevertheless estimated to be significantly negative. Here we show that such a negative feedback is not supported by an ensemble of high-resolution atmospheric models. On the contrary, the models suggest that changes in high cloud area and opacity act as a modest positive feedback. The positive opacity component arises from the disproportionate reduction in the area of thick, climate-cooling anvils relative to thin, climate-warming clouds. This suggests that thick cloud area is tightly coupled to the rate of convective overturning—which is expected to slow with warming—whereas thin cloud area is influenced by other processes. The cloud response is examined from a novel perspective that treats high ice clouds as part of an optical continuum as opposed to entities with fixed opacity. The positive feedback differs significantly from previous estimates and leads to a 0.3 °C increase in the WCRP estimate of ECS and a 10% widening of the likely range. We find that constraining the response of thin, high clouds in the Tropics to warming is critical for improved estimates of cloud feedback and global change.

How to cite: Sokol, A., Wall, C., and Hartmann, D.: Anvil cloud thinning in high-resolution models implies greater climate sensitivity, EGU General Assembly 2024, Vienna, Austria, 14–19 Apr 2024, EGU24-4149, https://doi.org/10.5194/egusphere-egu24-4149, 2024.

EGU24-5449 | ECS | Posters on site | AS1.16

Secondary ice production within mixed-phase clouds in cold air outbreaks over the North Atlantic.  

Michael Biggart, Tom Choularton, Martin Gallagher, Keith Bower, Gary Lloyd, and Benjamin Murray

In-cloud measurements of ice crystal concentrations often greatly exceed ice nucleating particle (INP) concentrations. This discrepancy can be accounted for by secondary ice production (SIP), describing mechanisms producing new ice crystals from the presence of existing primary ice particles. As ice particle formation in clouds strongly influences precipitation and earth’s radiative balance, accurate representation of SIP processes is critical for global climate and weather prediction model simulations. However, the dominant SIP mechanisms operating in different cloud systems remain poorly understood. This study aims to improve understanding of SIP within mixed-phase clouds associated with cold air outbreaks (CAOs). We examine in-situ ice particle and ice-nucleating particle measurements made in October-November 2022, using the UK FAAM BAE 146 research aircraft, during a set of CAOs in the North-western Atlantic over the Labrador Sea. This flight campaign comprised part of the M-PHASE project, part of the NERC-funded CloudSense programme, which aims to reduce uncertainties in climate sensitivity due to clouds. Detailed measurements of cloud microphysical properties were made to study the evolution of stratocumulus clouds as they advect southwards before breaking up under increasingly convective conditions.

In-cloud ice crystal concentrations measured with 2D-S (size range 10 - 1280 μm) and HVPS (size range 150 μm - 19.2 mm) optical array probes frequently exceeded INP concentrations measured at the same temperature. Peak ice particle concentrations greater than 200 L-1 were recorded on numerous flights, several orders of magnitude above INP concentrations. These ice concentration enhancements were observed between -5 and -10 oC, within the active temperature range for the Hallett-Mossop SIP process. Analysis of corresponding ice particle imagery from the 2D-S and Cloud Particle Imager instruments shows that small hollow columns, often mixed with larger heavily rimed particles, were the dominant ice crystal habits, providing further evidence of rime splintering. A second ice concentration peak at around -17oC was also observed. Large irregularly shaped ice crystals were present during this period, suggesting that fragmentation due to ice-ice collisions may be another active SIP mechanism.

We identify a series of SIP events across the flight campaign, with their short-lived nature suggesting ice multiplication is active across limited spatial extents. These segments of elevated ice concentrations are heavily populated by ice crystals of diameter < 100μm. Overall, SIP is observed to increase across convective regions of the CAO, with stratocumulus regions upwind often consisting mainly of supercooled water.

This work provides critical information for numerical modelling studies requiring detailed representation of SIP processes within mixed-phase clouds across the transition region from stratocumulus to convective regimes in CAOs. 

How to cite: Biggart, M., Choularton, T., Gallagher, M., Bower, K., Lloyd, G., and Murray, B.: Secondary ice production within mixed-phase clouds in cold air outbreaks over the North Atlantic. , EGU General Assembly 2024, Vienna, Austria, 14–19 Apr 2024, EGU24-5449, https://doi.org/10.5194/egusphere-egu24-5449, 2024.

EGU24-6008 | Orals | AS1.16

Spontaneous formation of OH radical and H2O2 at the liquid-ice interface 

Junwei Song and Christian George

Recently, intensive new particle formation (NPF) events have been observed in the upper troposphere/lower stratosphere (UTLS), where ice formation is predominant. Atmospheric oxidants including hydroxyl radical (OH∙) and hydrogen peroxide (H2O2) play important roles in these NPF events. However, the underlying formation mechanisms of OH∙ and H2O2 remain poorly understood. Here we propose that spontaneous formation of OH∙ and H2O2 is occurring at the liquid-ice interface during ice freezing, acting as so far unconsidered source of oxidants in the UTLS. This production is induced by the Workman-Reynold effect which predicts that a freezing potential appears in a freezing salt solution and thus an electric field is formed at the liquid-ice interface.

In this work, solutions containing disodium terephthalate (TA, ~5 x 10⁻⁵ M) were frozen either by immersion into an ethanol bath (-20 ºC) or into liquid nitrogen, and then melted. These steps were repeated creating freezing-melting cycles (n = 0-25). The solutions were then analyzed by a fluorescent spectroscopy to monitor the formation of 2-hydroxyterephthalic acid (TAOH), a product of the reaction of TA with OH∙. The production of TAOH was observed to be positively correlated with the number of freezing-melting cycles, demonstrating the formation of OH∙ during the freezing process. A series of salt solutions containing either NaCl, NH4Cl, NaBr, NaI, NaIO3 at different concentrations i.e.,10-6-100 M were also frozen and melted, and analyzed for their content in H2O2. Also here, our results confirmed the H2O2 production at the liquid-ice interface for the freezing salt solutions. In the case of NaCl, the maximum H2O2 production was observed at the concentration of ~10-4 M. Furthermore, the production rate of H2O2 at the NaCl concentration range of 10-4-10-2 M, was in agreement with the known Workman-Reynold freezing potential values. In order to investigate the role of OH∙ recombination in the H2O2 formation, mixed solutions of NaCl (~10-4 M) and TA (~5 x 10⁻⁵ M) subjected to different freezing-melting cycles were analyzed. The production rate of H2O2 was higher than that of TAOH by a factor of ~65, suggesting less significant effect of TA as a OH∙ scavenger on H2O2 formation. Overall, our experimental results provide direct evidence that OH∙ and H2O2 are formed spontaneously at the liquid-ice interface due to the Workman-Reynold effect. This study could improve our ability to describe the multiphase oxidation processes of the UTLS regions.

How to cite: Song, J. and George, C.: Spontaneous formation of OH radical and H2O2 at the liquid-ice interface, EGU General Assembly 2024, Vienna, Austria, 14–19 Apr 2024, EGU24-6008, https://doi.org/10.5194/egusphere-egu24-6008, 2024.

EGU24-8440 | ECS | Orals | AS1.16

Plant pollen and spores as sources of ice nucleating particles 

Nina L. H. Kinney, Matthew I. Gibson, Daniel Ballesteros, and Thomas F. Whale

Soluble molecules released from plant pollen can nucleate ice from supercooled water and are an enigmatic source of atmospherically relevant biological ice nucleators. Recently, it has been highlighted that ice nucleating particles from pollen may possess greater potential to impact cloud glaciation than previously considered, as fragments generated by pollen bursting under atmospheric conditions could act as carriers of ice nucleating molecules, with significantly longer residence times than whole pollen grains1,2. Previous studies have indicated a range in ice nucleation activity across pollen samples, but still relatively little is known about the structure of the molecules responsible or the basis for this variability3,4.

Our collaboration with the Royal Botanic Gardens, Kew, UK has enabled the collection of over fifty pollen samples from across taxa, from representatives with different pollination methods, pollination times and growth climates. Immersion mode ice nucleation experiments reveal that the ice nucleation ability of pollen is highly diverse; amongst our collections we identify particularly active samples (mean freezing temperature of microlitre droplets, T50 = -7.6 °C for Pinus mugo pollen solution) and others with far lower activity (T50 = -23.8 °C for Musa rubra pollen solution). Examining the relationship between this activity and selected characteristics, no dependency on various plant and pollen features could be determined, which may indicate that the ice nucleating molecules from pollen fulfil a distinct biological function and nucleate ice incidentally.

Looking to earlier diverging plant lineages, we tested the activity of fern spores and find that they also release molecules in water which can nucleate ice. These ice nucleating molecules demonstrate absorbances consistent with polysaccharides from pollen. Ferns colonise diverse habitats and their spores, primarily transported by wind, are present in quantities comparable to pollen grains in the air over vegetated regions5. Better understanding these potential sources of atmospheric ice nuclei is essential for improving climate model prediction of their impacts. Our results suggest that these ice nucleating molecules evolved prior to the divergence of seed plants and are conserved in the spores and pollen of extant plants across the phylogeny.

References

1. Burkart, J., Gratzl, J., Seifried, T., Bieber, P. & Grothe, H. Subpollen particles (SPP) of birch as carriers of ice nucleating macromolecules. Biogeosciences Discuss. 1–15 (2021).

2. Werchner, S. et al. When Do Subpollen Particles Become Relevant for Ice Nucleation Processes in Clouds? J. Geophys. Res. Atmos. 127, e2021JD036340 (2022).

3. Pummer, B. G., Bauer, H., Bernardi, J., Bleicher, S. & Grothe, H. Suspendable macromolecules are responsible for ice nucleation activity of birch and conifer pollen. Atmos. Chem. Phys. 12, 2541–2550 (2012).

4. Dreischmeier, K., Budke, C., Wiehemeier, L., Kottke, T. & Koop, T. Boreal pollen contain ice-nucleating as well as ice-binding ‘antifreeze’ polysaccharides. Sci. Rep. 7, 1–13 (2017).

5. Després, V. R. et al. Primary biological aerosol particles in the atmosphere: A review. Tellus, Ser. B Chem. Phys. Meteorol. 64, (2012).

How to cite: Kinney, N. L. H., Gibson, M. I., Ballesteros, D., and Whale, T. F.: Plant pollen and spores as sources of ice nucleating particles, EGU General Assembly 2024, Vienna, Austria, 14–19 Apr 2024, EGU24-8440, https://doi.org/10.5194/egusphere-egu24-8440, 2024.

EGU24-8556 | ECS | Posters on site | AS1.16

Climate sensitivity, the pattern effect, and cloud parametrisation 

Kai-Uwe Eiselt and Rune Grand Graversen

Climate sensitivity changes over time in numerical global climate models (GCMs) due to a so-called “pattern effect”. That is, surface-warming patterns evolve over time to favour different geographical regions giving rise to different climate feedbacks, thus changing climate sensitivity over time.

One of the most important climate feedbacks is the cloud feedback and it has been shown that the pattern effect may strongly impact the strength of this feedback in GCMs. Here we perform slab-ocean model simulations with different versions of the Community Earth System Model (CESM). Different patterns of ocean heat transport convergence (Q-flux) are prescribed, inducing different patterns of surface warming. Notably, the prescribed Q-flux changes average to zero in the global mean, thus introducing no net forcing. We show that (1) net-zero forcing Q-flux changes can have surprisingly large effects on the climate, (2) that the impact strongly depends on the geographic pattern of the Q-flux change and, (3) that different cloud parametrisations may imply different impacts of the same patterns.

While these results may have important implications for the quantification of the pattern effect and climate sensitivity in climate models, we caution against overinterpretation, as preliminary experiments with fully coupled models indicate a weaker sensitivity to similar pattern changes.

How to cite: Eiselt, K.-U. and Graversen, R. G.: Climate sensitivity, the pattern effect, and cloud parametrisation, EGU General Assembly 2024, Vienna, Austria, 14–19 Apr 2024, EGU24-8556, https://doi.org/10.5194/egusphere-egu24-8556, 2024.

EGU24-8877 | Posters on site | AS1.16

Searching for the atomic scale mechanism of ice nucleating particles: hydration layer structures on K-Feldspar microcline surfaces from a combination of atomistic simulation and atomic force microscopy 

Bernhard Reischl, Rasmus Nilsson, Adam Foster, Franziska Sabath, Tobias Dickbreder, Ralf Bechstein, and Angelika Kühnle

Ice and mixed-phase clouds can form at moderate supercooling on seed particles through heterogeneous ice nucleation, but despite numerous experimental and computational investigations, understanding heterogeneous ice nucleation remains one of the great challenges in atmospheric science. While feldspar mineral dust particles have been identified as particularly good ice nucleating particles, they can exhibit different chemical composition and crystal structure, making it difficult to determine the atomistic details of the ice nucleation mechanism, both experimentally, and computationally. Here, we present systematic atomistic molecular dynamics studies of hydration layer structures at the interfaces of K-feldspar maximum microcline (001), (010), and (100) surfaces and water, at room temperature and moderate supercooling. Simulations on the fully hydroxylated α-terminated (001) cleavage plane reveal a complex lateral structure in the first water layer and a less ordered second layer. At room temperature, water exchange within the first hydration layer and between the first and second hydration layers occurs on a sub-nanosecond timescale. We also observe that surface potassium ions can go into solution and return to vacant surface sites on a timescale of tens of nanoseconds, but this causes surprisingly minor perturbations within the first hydration layer if the sampling time is sufficient. Hydration layer structures from simulation are in very good agreement with 3D atomic force microscopy data recently obtained for the first time on a freshly cleaved microcline surface in pure water (Dickbreder et al., 2024) – validating the accuracy of the atomistic model and providing an interpretation of the experimental data. However, the simulated hydration layer structures on the low energy (001) or (010) surfaces do not exhibit a lattice match with faces of cubic or hexagonal ice. Only the higher energy (100) surface with slightly strained lattice parameters can stabilize an ice interface at moderate supercooling in the simulations. Our results confirm previous findings (Kiselev et al., 2017; Soni and Patey, 2019) and indicate that the good ice nucleating properties of feldspars likely result from more complex active sites, possibly involving changes in surface chemistry, or topographic features such as defects, strained lattices, or step edges, which we are currently investigating.

Dickbreder, T., Sabath, F., Reischl, B., Nilsson, R. V. E., Foster, A., Bechstein, R. and Kühnle, A.: Atomic structure and water arrangement on K-feldspar microcline (001), accepted in Nanoscale, DOI:10.1039/d3nr05585j, 2024.

Kiselev, A., Bachmann, F., Pedevilla, P., Cox, S. J., Michaelides, A., Gerthsen, D., and Leisner, T.: Active sites in heterogeneous ice nucleation—the example of K-rich feldspars, Science, 355, 367–371, 2017.

Soni, A. and Patey, G. N.: Simulations of water structure and the possibility of ice nucleation on selected crystal planes of K-feldspar, J. Chem. Phys., 150, 214501, 2019.

How to cite: Reischl, B., Nilsson, R., Foster, A., Sabath, F., Dickbreder, T., Bechstein, R., and Kühnle, A.: Searching for the atomic scale mechanism of ice nucleating particles: hydration layer structures on K-Feldspar microcline surfaces from a combination of atomistic simulation and atomic force microscopy, EGU General Assembly 2024, Vienna, Austria, 14–19 Apr 2024, EGU24-8877, https://doi.org/10.5194/egusphere-egu24-8877, 2024.

EGU24-10690 | Posters on site | AS1.16

Radiative effect of thin cirrus clouds in the extratropical lowermost stratosphere and tropopause region 

Reinhold Spang, Rolf Müller, and Alexandru Rap

Cirrus clouds play an important role in the radiation budget of the Earth; nonetheless, the radiative effect of ultra thin cirrus clouds in the tropopause region and in the lowermost stratosphere remains poorly constrained. These clouds have a small vertical extent and optical depth, and are frequently neither observed even by sensitive sensors nor considered in climate model simulations. In addition, their shortwave (cooling) and longwave (warming) radiative effects are often in approximate balance, and their net effect strongly depends on the shape and size of the cirrus particles. However, the CRyogenic Infrared Spectrometers and Telescopes for the Atmosphere instrument (CRISTA-2) allows ultra thin cirrus clouds to be detected. Here we use CRISTA-2 observations in summer 1997 in the northern hemisphere midlatitudes together with the Suite Of Community RAdiative Transfer codes based on Edwards and Slingo (SOCRATES) radiative transfer model to calculate the radiative effect of observed ultra thin cirrus.
Using sensitivity simulations with different ice effective particle size and shape, we provide an estimate for the uncertainty of the radiative effect of ultra thin cirrus in the extratropical lowermost stratosphere and tropopause region during summer and - by extrapolation of the summer results - for winter.
Cloud top height and ice water content are based on CRISTA-2 measurements, while the cloud vertical thickness was predefined to be 0.5 or 2 km. Our results indicate that if the ice crystals of these thin cirrus clouds are assumed to be spherical, their net cloud radiative effect is generally positive (warming). In contrast, assuming aggregates or a hexagonal shape, their net radiative effect is generally negative (cooling) during summer months and very likely positive (warming) during winter. The radiative effect is in the order of +/-(0.1-0.01) W/m2 for a realistic global cloud coverage of 10%, similar to the magnitude of the contrail cirrus radiative forcing (of ~0.1 W/m2). The radiative effect is also dependent on the cloud vertical extent and consequently the optically thickness and effective radius of the particle size distribution (e.g. effective radius increase from 5 to 30~microns results in a factor ~6 smaller long and shortwave effect respectively). The properties of ultrathin cirrus clouds in the lowermost stratosphere and tropopause region need to be better observed and ultra thin cirrus clouds need to be evaluated in climate model simulations.

--

How to cite: Spang, R., Müller, R., and Rap, A.: Radiative effect of thin cirrus clouds in the extratropical lowermost stratosphere and tropopause region, EGU General Assembly 2024, Vienna, Austria, 14–19 Apr 2024, EGU24-10690, https://doi.org/10.5194/egusphere-egu24-10690, 2024.

EGU24-11003 | Posters on site | AS1.16

Two years of aerosol and cloud observations from the Antarctic Peninsula. 

Tom Lachlan-Cope, floortje van den Heuvel, Michael Flynn, Joanna Dyson, and Daniel Smith

Clouds over the Southern Ocean and Antarctica are poorly represented within climate models. It is thought that our poor understanding of aerosol-cloud interaction at these latitudes could play a major role in biasing models towards consistently underpredicting cloud formation in these regions. Unfortunately, there are few studies of aerosols and their impact on clouds at high southern latitudes and those that do exist concentrate on the summer period. Here we present two years of observations from Rothera Station on the Antarctic Peninsula.


The East Beach Hut clean air facility at Rothera Station has a comprehensive set of online aerosol instruments measuring size, composition, and the capacity to act as a Cloud Condensation Nuclei (CCN) in addition to offline filter samplers from which the concentration of Ice Nucleating Particle (INP) can be derived. Measurements of the aerosol precursor gas, dimethly sulphide are also available in addition to a micropulse LiDAR to give information on cloud properties. The object of these measurements is to identify the composition and source of the cloud nuclei active at high latitudes so they can be correctly incorporated within climate models through new or revised parameterisations.


Here we report on the first two years of measurements and identify the correlation between chemical composition, biological activity and cloud nuclei activation.. We will present a comparison of aerosol and cloud nuclei during the Antarctic Summer and Winter of 2021-2023, offering an initial assessment of the different sources of CCN and INP observed during these periods.

How to cite: Lachlan-Cope, T., van den Heuvel, F., Flynn, M., Dyson, J., and Smith, D.: Two years of aerosol and cloud observations from the Antarctic Peninsula., EGU General Assembly 2024, Vienna, Austria, 14–19 Apr 2024, EGU24-11003, https://doi.org/10.5194/egusphere-egu24-11003, 2024.

EGU24-11320 | ECS | Posters on site | AS1.16

The impact of mixed-phase cloud processes on radiative fluxes over the Southern Ocean in a convection-permitting model 

Daniel Smith, Ian Renfrew, Floor van den Heuvel, Tom Lachlan-Cope, Ian Crawford, Keith Bower, and Mike Flynn

Atmospheric and climate models have large biases in their short and long wave radiative fluxes over the Southern Ocean, leading to significant errors in their sea surface temperature, sea ice and large scale circulation. The primary cause for these biases is the representation of low-level clouds, both at the macro- and micro-scale. We assess the performance of a convection-permitting configuration of the Met Office Unified Model (MetUM) over the Southern Ocean using satellite and aircraft observations from the 2023 special observing period of the Southern Ocean Clouds (SOC) field experiment. We focus on the model’s sensitivity to the microphysics schemes. Firstly, the impact of ice nucleating particles (INP) parametrizations via sensitivity experiments using different temperature dependent INP distributions: (i) from Cooper (1986); (ii) as derived for the east Antarctic coast; and (iii) a new distribution derived from observations from the west Antarctic Peninsula during the SOC experiment. Secondly, we examine the impact of the parameterized overlap between ice and water within a grid box (the mixed-phase overlap factor), which modifies mixed-phase process rates, for example the Wegener–Bergeron–Findeisen process and riming.


Reducing the INP concentration to values observed over the Southern Ocean results in top of the atmosphere (TOA) radiative fluxes closer to observations. The lower INP concentrations result in lower ice water content and higher liquid water content, leading to brighter and more widespread cloud; this increases the albedo, resulting in a more accurate simulation of the TOA radiation. Equally, a large sensitivity in the top of the atmosphere fluxes is seen when changing the mixed-phase overlap factor. Decreasing (increasing) the mixed-phase overlap factor results in less (more) ice and more (less) liquid reducing the TOA fluxes. Decreasing the mixed-phase overlap factor results in TOA fluxes closer to the satellite observations. In summary, simulations using INP concentrations suitable for the Southern Ocean result in simulations closer to observed but other parametrizations in the microphysics scheme are equally important for accurate simulations of radiative fluxes.

How to cite: Smith, D., Renfrew, I., van den Heuvel, F., Lachlan-Cope, T., Crawford, I., Bower, K., and Flynn, M.: The impact of mixed-phase cloud processes on radiative fluxes over the Southern Ocean in a convection-permitting model, EGU General Assembly 2024, Vienna, Austria, 14–19 Apr 2024, EGU24-11320, https://doi.org/10.5194/egusphere-egu24-11320, 2024.

EGU24-11511 | ECS | Posters on site | AS1.16

Atomic structure of pristine and water-covered microcline (001) – A prerequisite for understanding the ice nucleation mechanism on feldspar mineral dust particles 

Tobias Dickbreder, Franziska Sabath, Bernhard Reischl, Rasmus V. E. Nilsson, Adam S. Foster, Ralf Bechstein, and Angelika Kühnle

The aggregate state of water in clouds has a fundamental impact on the clouds’ properties such as reflectivity and lifetime. Consequently, it is crucial for the development and improvement of climate models to understand the mechanism of ice nucleation under atmospheric conditions. Most atmospheric ice nucleation is heterogeneous caused by the interaction between water droplets and ice nucleating particles. Under mixed-phase cloud conditions, one of the most important ice nucleating particles are feldspar minerals. Recent scanning electron microscopy studies have shown that ice nucleation on cleavage planes of K-rich feldspars predominantly takes place at step edges and pores (Kiselev, 2017). This has also been confirmed by video and atomic force microscopy on the micrometer scale (Holden, 2019). However, experimental insights into the atomic-scale structure of the most ice-nucleation active K-feldspar microcline are still missing, and, thus, the mechanism behind ice nucleation on feldspar minerals remains elusive. Here, we present high-resolution atomic force microscopy (AFM) data revealing the atomic structure of the microcline (001) surface in its pristine state and in contact with water (Dickbreder, 2024). AFM images of the pristine microcline (001) surface kept under ultrahigh-vacuum conditions, reveal features consistent with a hydroxyl-terminated surface. This finding suggests that water in the residual gas readily reacts with the surface highlighting the high reactivity of the as-cleaved surface. Indeed, corresponding density functional theory calculations confirm a dissociative water adsorption. Three-dimensional AFM measurements performed at the mineral-water interface unravel a layered hydration structure with two features per surface unit cell. Comparison with MD calculations suggest that the structure observed in AFM corresponds to the second hydration layer rather than the first water layer. We are convinced that the combination of structural information of the pristine and water-covered microcline (001) surface will contribute to uncovering the atomic-scale mechanism behind the exceptional ice-nucleation activity of feldspar minerals.


References:

Atkinson, J. D., Murray, B. J., Woodhouse, M. T., Whale, T. F., Baustian, K. J., Carslaw, K. S., Dobbie, S., O’Sullivan, D., Malkin, T. L., Nature, 498, 355-358, 2013.

Dickbreder, T., Sabath, F., Reischl, B., Nilsson, R. V. E., Foster, A., Bechstein, R. and Kühnle, A., Nanoscale, DOI:10.1039/d3nr05585j, 2024.

Holden, M. A., Whale, T. F., Tarn, M. D., O’Sullivan, D., Walshaw, R. D., Murray, B. J., Meldrum, F. C., Christenson, H. K., Science Advances, 5, 4316, 2019.

Kiselev, A., Bachmann, F., Pedevilla, P., Cox, S. J., Michaelides, A., Gerthsen, D., and Leisner, T., Science, 355, 367–371, 2017.

How to cite: Dickbreder, T., Sabath, F., Reischl, B., Nilsson, R. V. E., Foster, A. S., Bechstein, R., and Kühnle, A.: Atomic structure of pristine and water-covered microcline (001) – A prerequisite for understanding the ice nucleation mechanism on feldspar mineral dust particles, EGU General Assembly 2024, Vienna, Austria, 14–19 Apr 2024, EGU24-11511, https://doi.org/10.5194/egusphere-egu24-11511, 2024.

EGU24-11598 | Posters on site | AS1.16

Ice production in northern hemisphere cold air-outbreak clouds: two contrasting aircraft campaigns 

Benjamin Murray and the M-Phase Team

Cold-air outbreaks (CAOs) are common high-impact weather events that produce extensive boundary layer clouds that have a substantial influence on our planet’s climate. These clouds are often supercooled and therefore their properties are susceptible to the formation of ice.  The amount of ice in these clouds has been identified as being particularly important for defining the magnitude of the cloud-climate feedback and climate sensitivity.

To address ice production in northern hemisphere CAOs we conducted two contrasting aircraft campaigns in 2022.  One campaign (ACAO, 11 flights) was in March in the Norwegian and Barents Sea where cold air flowed from the ice-covered Arctic Ocean. The other (M-Phase, 12 flights) was in October-November and focused on the Labrador Sea with air coming from the Arctic Archipelago. In both campaigns, we used similar instruments on the FAAM BAe-146 research aircraft designed to probe the aerosol properties, cloud microphysics and atmospheric thermodynamics of the CAO events.  Flight sorties were designed to study aerosol-cloud interactions as the CAO developed through the stratus and into the cumulus regime.

We found that INP concentrations in these Northern Hemisphere CAOs were orders of magnitude greater than CAO events over the Southern Ocean.  The springtime ACAO cases had systematically greater INP (and aerosol) concentrations than the autumnal Labrador Sea M-Phase cases. The presence of substantial amounts of mineral dust in the springtime Arctic, despite all local sources being covered in ice and snow, implies a reservoir of old INPs and aerosol in the springtime Arctic that originated from the low latitudes. This is supported by our global aerosol model. Primary ice production by INPs is shown to define the ice concentrations in the stratus regime in many cases, but in the cumulus regime there are pockets of very high ice concentrations that are indicative of secondary ice production.

Our modelling work has demonstrated that INPs are key to defining the stratus to cumulus transition and the cases are providing an excellent test for the high-resolution regional modelling with the Met Office Unified Model.  We are also using ACAO cases to study how INPs interact with clouds in CAOs, where warm temperature INPs are preferentially lost through nucleation scavenging. Furthermore, we envisage that the data from these campaigns will provide a valuable resource for model development, hypothesis testing and contrasting with other CAO campaigns in other places and times. 

Given the stark contrast of primary ice production in CAO clouds in different locations and times around the globe, we conclude that the primary production of ice in model CAO clouds should be linked to the aerosol properties and knowledge of the local INP population to reduce uncertainty in cloud feedback and climate sensitivity.

How to cite: Murray, B. and the M-Phase Team: Ice production in northern hemisphere cold air-outbreak clouds: two contrasting aircraft campaigns, EGU General Assembly 2024, Vienna, Austria, 14–19 Apr 2024, EGU24-11598, https://doi.org/10.5194/egusphere-egu24-11598, 2024.

EGU24-12083 | ECS | Posters on site | AS1.16

Extending measurements of ice nucleation activity to large-size mineral dust particles 

Sebastian Vergara Palacio, Franziska Vogel, Romy Fösig, Adolfo González-Romero, Konrad Kandler, Xavier Querol, Nsikanabasi Silas Umo, Corinna Hoose, Ottmar Möhler, Carlos Pérez García-Pando, and Martina Klose

Mineral dust is considered one of the most important seeds for heterogeneous ice nucleation in clouds. In the past decades, several studies have worked on establishing a relationship between mineral dust, number concentration, nucleation temperature, supersaturation, and the number of ice crystals. The explored dust particle-size range was usually limited to a few micrometers for two main reasons: (1) larger and heavier particles are difficult to keep suspended in an experimental setting; and (2) the fraction of coarser aerosol was considered negligible. However, recent studies have shown that dust particles as large as 100 μm or even more can be transported over long distances, leaving a knowledge gap concerning their role as ice-nucleating particles.

In this work, we aim to contribute to closing this gap by investigating the ice nucleation activity for large-size mineral dust particles, extending the studied size range to particles of up to several tens of microns. For this purpose, we used natural dust samples with different mineralogical composition, collected consistently during field campaigns in Morocco and in Iceland, and segregated into five different size classes. In the framework of the MICOS (Dust-induced ice nucleation: effects of Mineralogical COmposition and Size) campaign, we conducted experiments with the Aerosol Interaction and Dynamics in the Atmosphere (AIDA) chamber and with the Ice Nucleation Spectrometer of the Karlsruhe Institute of Technology (INSEKT), in which the size-segregated samples were tested at different temperatures in the range between -16 and -27 °C. The ice nucleation efficiency was quantified in terms of the ice nucleation active surface site (INAS) density approach for the immersion freezing mode. Preliminary results from the AIDA and INSEKT experiments are presented, in which we extended the size range at which cloud chamber experiments are typically conducted.

How to cite: Vergara Palacio, S., Vogel, F., Fösig, R., González-Romero, A., Kandler, K., Querol, X., Umo, N. S., Hoose, C., Möhler, O., Pérez García-Pando, C., and Klose, M.: Extending measurements of ice nucleation activity to large-size mineral dust particles, EGU General Assembly 2024, Vienna, Austria, 14–19 Apr 2024, EGU24-12083, https://doi.org/10.5194/egusphere-egu24-12083, 2024.

EGU24-12198 | Orals | AS1.16 | Highlight

Sources and abundance of ice nucleating particles derived from long-term measurements at high time resolution 

Ottmar Möhler, Pia Bogert, Alexander Böhmländer, Nicole Büttner, Kristina Höhler, Larissa Lacher, Romy Ullrich, and Franziska Vogel

Ice Nucleating Particles (INPs), a minor and strongly temperature dependent fraction of atmospheric aerosol particles, are key players in the weather and climate systems be inducing the formation of ice in mixed-phase and cirrus clouds. There is increasing evidence that INPs not only induce the formation of precipitation in particular over continental areas, but also have an important impact on a number of radiatively important clouds types throughout the troposphere.

New insight into the abundance, types, and sources of INPs, and by that also into their various roles in the atmosphere, can be obtained by longer-term measurements at high time resolution. Such measurements can be conducted with the PINE (Port-able Ice Nucleation Experiment) instrument, which was developed for both, flexible operation during dedicated laboratory experiments on ice nucleation processes and for automated operation during longer-term INP monitoring activities in the field.

This contribution will give a short introduction into the topics of primary ice formation and ice-nucleating particles, and will present and discuss examples of recent longer-term records of INP measurements with the PINE instrument at different European field sites like the Sonnblick Observatory in Austria, the Helmos observatory in Greece, the Zeppelin observatory in Spitzbergen, or the National Atmospheric Observatory Kosetice in the Czech Republic. These locations will also become observatories as part of the pan-European infrastructure ACTRIS for longer-term monitoring of aerosols and INPs.

How to cite: Möhler, O., Bogert, P., Böhmländer, A., Büttner, N., Höhler, K., Lacher, L., Ullrich, R., and Vogel, F.: Sources and abundance of ice nucleating particles derived from long-term measurements at high time resolution, EGU General Assembly 2024, Vienna, Austria, 14–19 Apr 2024, EGU24-12198, https://doi.org/10.5194/egusphere-egu24-12198, 2024.

EGU24-12214 | ECS | Orals | AS1.16

Shaping the Tropical Anvil Cloudiness: the relative roles of net convective detrainment and vapor deposition in controlling the tropical high cloud fraction in an extratropically-warmed climate 

S. R. Monisha Natchiar, Mark Webb, Hugo Lambert, Geoffrey Vallis, Cyril Morcrette, Christopher Holloway, and Denis Sergeev

Improving the estimates of global climate sensitivity relies on understanding the mechanisms that control the fractional coverage of tropical anvil clouds. Even small changes in the tropical anvil cloud coverage have been shown to significantly impact the radiative budget of the Earth. Most general circulation models and cloud resolving models depict a decrease in the tropical anvil cloud cover with surface warming. According to the "stability-iris" hypothesis, this reduction is thermodynamically controlled by the changes in the upper-tropospheric static stability, which in turn is governed by the peak of the radiatively-driven clear-sky convergence. However, the influence of the changes in the atmospheric dynamics independent of the local SST changes remains relatively less explored due to the difficulty in segregating the dynamical influence from the local thermodynamic influence on the tropical anvil cloud cover.

Using idealized general circulation model simulations from the Met Office Unified Model, our study aims to understand the dynamical impact on the fractional cloudiness of tropical high clouds with global warming. To achieve this, we propose a novel method to separate the dynamical effects from the local thermodynamical effects by warming the extratropics and keeping the tropical sea surface temperatures unchanged. We thereby focus on the mechanisms underpinning the changes in the tropical high clouds resulting from changes in the atmospheric dynamics induced by extratropical warming. We find that the depositional growth of ice cloud condensates has relatively greater significance than the net convective detrainment of condensates in controlling the reduction of the fractional cloudiness over a considerable altitude range of the upper troposphere in the deep tropics.

How to cite: Natchiar, S. R. M., Webb, M., Lambert, H., Vallis, G., Morcrette, C., Holloway, C., and Sergeev, D.: Shaping the Tropical Anvil Cloudiness: the relative roles of net convective detrainment and vapor deposition in controlling the tropical high cloud fraction in an extratropically-warmed climate, EGU General Assembly 2024, Vienna, Austria, 14–19 Apr 2024, EGU24-12214, https://doi.org/10.5194/egusphere-egu24-12214, 2024.

Aerosol-cloud interactions and ice production processes are important uncertainties in models of mixed-phase cold-air outbreak (CAO) clouds, which are vital for the estimation of cloud-phase feedback. Our model simulation results show that the sensitivities of the mixed-phase cloud properties during the two selected CAO cases are different, with Ice Nucleating Particle (INP) concentrations having a strong influence for both case studies, but the cloud droplet number concentration and the HM (Hallett-Mossop) efficiency only affect the warmer case. We also find that the simulations showing the best performance compared to observations are not consistent across multiple satellite-observed cloud properties, which suggests a possible structural deficiency in the model. The two cases are CAO events over the Labrador Sea, 15 March 2022 and 24 October 2022, with the latter one coinciding with the M-Phase aircraft campaign. The regional Met Office Unified Model coupled with a two-moment microphysics scheme was used to quantify the sensitivity of cloud cover, stratocumulus-to-cumulus transition, and cloud radiative properties to cloud droplet number concentration, INP concentration and efficiency of the HM process. Recent studies have aimed to understand how these two aspects influence CAO clouds, but have not compared the sensitivities under different environmental conditions or with a realistic temperature-dependent parameterisation for INPs. This study provides an instructive perspective on how cloud microphysics affects mixed-phase CAO clouds under different environmental conditions, and serves as a good basis for exploring the whole uncertain cloud microphysics parameter space across a range of environmental conditions.

How to cite: Huang, X., Field, P., Murray, B., Grosvenor, D., Van Den Heuvel, F., and Carslaw, K.: Sensitivity of mixed-phase cold-air outbreak clouds to aerosol-cloud interactions and ice production processes depends on environmental conditions: a comparison between spring and autumn CAO case studies over the Labrador Sea, EGU General Assembly 2024, Vienna, Austria, 14–19 Apr 2024, EGU24-12568, https://doi.org/10.5194/egusphere-egu24-12568, 2024.

EGU24-12784 | ECS | Posters on site | AS1.16

Source apportionment and parameterization of ice nucleating particles observed at a high-altitude station in the north-eastern Mediterranean in autumn 2021 during the CALISHTO campaign 

Kunfeng Gao, Romanos Foskinis, Georgakaki Paraskevi, Stergios Vratolis, Konstantinos Granakis, Anne-Claire Billault-Roux, Franziska Vogel, Ottmar Möhler, Alexis Berne, Konstantinos Eleftheriadis, Alexandros Papagiannis, and Athanasios Nenes

Aerosol source apportionment improves the understanding of aerosol-cloud interaction processes and benefits the parameterization of ice nucleating particles (INPs), which also contributes to the predictability of climate models for quantifying the impacts of aerosols on the changing climate. This study, which took place in the frame of the Cloud-Aerosol InteractionS in the Helmos background TropOsphere (CALISHTO) campaign, investigates the interactions between mixed-phased clouds and aerosol particles at Helmos Mt. in Peloponnese, Greece (north-eastern Mediterranean). The source apportionment of INPs originating from different aerosol sources is achieved by identifying exclusive characteristics of relevant air masses. A synergy of measurement techniques was employed, including in-situ measurements for INP number concentration and aerosol property characterization, remote sensing techniques for atmospheric condition observations, as well as modelling simulations for calculating aerosol particle footprints.

The number concentration of INPs was observed in the mixed-phase cloud regime (>−27°C) in both the planetary boundary layer (PBL) and the free troposphere (FT). The results show that one in a million of aerosol particles can serve as INPs under the background condition in FT. The presence of precipitation/clouds may enrich INPs by suspending biological particles from near ground sources or releasing cloud-processed particles when the observation site is above PBL. The intrusion of remotely transported air masses leads to increased INPs for conditions above PBL, suggesting the observed INPs are of both local and remote origins. In addition, the INP abundance of different sources spans a range of three orders of magnitude and increases following the order of marine aerosols, continental aerosols, and then dust plumes. Biological particles are approximate to INPs observed in continental and marine aerosols, whereas mineral dust particles dominate the observed INPs when dust plumes are present. Furthermore, a case study on a calendar day was performed to investigate the effects of precipitation/clouds on INP abundance in the PBL. In contrast observations above the PBL, the presence of precipitation/clouds may lead to wet removal of aerosol particles and thus, decreased INPs.

Statistical analysis suggests that INP concentration in the mixed-phase cloud regime is significantly correlated with fluorescent particles, including biological and non-biological particles such as dust particles associated with fluorescent materials. The ratio of fluorescent to nonfluorescent particles and the ratio of coarse (>1.0 μm) to fine (<1.0 μm) particles are also found to be significantly correlated with observed INPs from different aerosol sources. Such properties further constrain the ice formation ability of aerosol particles showing fluorescence and are then used to improve the parameterization of INPs as a function of temperature, particle number concentration and the fluorescent or coarse particle ratio. The adapted INP parameterizations are demonstrated to be able to predict >90% INP observations within an uncertainty range of a factor of 10. The improved predictabilities of the adapted INP parameterizations are demonstrated by comparisons to parameterizations reported in the literature, and the improvement will reduce the uncertainties in cloud physics simulations.

How to cite: Gao, K., Foskinis, R., Paraskevi, G., Vratolis, S., Granakis, K., Billault-Roux, A.-C., Vogel, F., Möhler, O., Berne, A., Eleftheriadis, K., Papagiannis, A., and Nenes, A.: Source apportionment and parameterization of ice nucleating particles observed at a high-altitude station in the north-eastern Mediterranean in autumn 2021 during the CALISHTO campaign, EGU General Assembly 2024, Vienna, Austria, 14–19 Apr 2024, EGU24-12784, https://doi.org/10.5194/egusphere-egu24-12784, 2024.

EGU24-13392 | Posters on site | AS1.16

Investigating lignin’s ice nucleation mechanisms by applying nano-particle synthesis and high-speed cryo-microscopy 

Paul Bieber, Anna Zeleny, and Nadine Borduas-Dedekind

Due to the changing climate, wildfires globally have been increasing in size and intensity. With the increase of these biomass burning events there is a surge of organic aerosols present in the atmosphere. Recent evidence from our group and the community suggests that organic aerosols can catalyze heterogeneous ice nucleation.1–3 Currently, heterogeneous ice nucleation is the largest source of uncertainty in climate models as it governs the formation of mixed-phase clouds, important climate regulators linked to annual precipitation and global cloud coverage. We are interested in what impact an increase in atmospheric biomass burning aerosols will have on mixed-phase cloud formation.

An important component of organic biomass aerosols is lignin, a macromolecule which provides strength and structure to vascular plants. Lignin has been measured as a notably recalcitrant component of organic aerosols following biomass burning events.4,5 To elucidate the role of morphology and size of biomass burning organic aerosols in ice nucleation, we synthesized nanoparticles from commercially available Kraft lignin via a facile nanoprecipitation process.6,7 The nanoparticles were centrifugally separated by size, characterized by dynamic light scattering (DLS) and by transmission electron microscopy (TEM), then tested for their freezing ability in our home-built Freezing Ice Nuclei Counter (FINC).8 Next, the freezing mechanism and location of onset freezing for lignin was investigated using a high-speed camera on a cryo-microscope.9 Cylindrical droplets, between two glass slides, were frozen to localize the onset location of freezing at the air-water interface (AWI) or in the bulk of the droplets. Videos of single freezing events were recorded with a time resolution of over 2000 frames per second.

Our preliminary results suggest that lignin nanoparticles ranging in size from 50 – 500 nm in diameter are ice active at -15 ºC, well above the background freezing of the instrument (-25 °C). Normalizing the freezing data to mass and surface area suggests that aggregation facilitates ice nucleation. Moreover, the high-speed videos suggest that lignin’s ice nucleation activity is higher closer to the AWI of a droplet, indicating that hydrophobic interactions could be responsible for the aggregation of lignin and adsorption at the AWI, similar to the behavior of surfactants. These findings help understand how lignin within biomass burning organic aerosols are able to nucleate ice and hence impact the ice crystal concentration in mixed-phase clouds.

References:

(1)        Bogler, S.; Borduas-Dedekind, N. Atmospheric Chem. Phys. 2020, 20 (23), 14509–14522.

(2)        Knopf, D. A. et al., Atmos Chem Phys 2014, 14 (16), 8521–8531.

(4)        Shakya, K. M. et al., Environ. Sci. Technol. 2011, 45 (19), 8268–8275.

(5)        Myers-Pigg, A. N. et al., Environ. Sci. Technol. 2016, 50 (17), 9308–9314.

(6)        Lievonen, M. et al., Green Chem. 2016, 18 (5), 1416–1422.

(7)        Zou, T. et al., J. Phys. Chem. B 2021, 125 (44), 12315–12328.

(8)        Miller, A. J. et al., Atmospheric Meas. Tech. 2021, 14 (4), 3131–3151.

(9)        Bieber, P.; Borduas-Dedekind, N. ChemRxiv 2023. (preprint)

How to cite: Bieber, P., Zeleny, A., and Borduas-Dedekind, N.: Investigating lignin’s ice nucleation mechanisms by applying nano-particle synthesis and high-speed cryo-microscopy, EGU General Assembly 2024, Vienna, Austria, 14–19 Apr 2024, EGU24-13392, https://doi.org/10.5194/egusphere-egu24-13392, 2024.

EGU24-13746 | Orals | AS1.16

Estimating Climate Sensitivity from UV satellite observations and CMIP6 models since 1980 

Clark Weaver, Dong Wu, Gordon Labow, David Haffner, Lauren Borgia, Laura McBride, and Ross Salawitch

We construct a long-term record of Top of Atmosphere shortwave (SW) albedo of clouds and aerosols from 340 nm radiances observed by NASA and NOAA satellite instruments from 1980 to 2013. We compare our SW cloud+aerosol albedo with simulated cloud albedo from both AMIP and historical CMIP6 simulations from 47 climate models. While most historical runs did not simulate our observed spatial pattern of the trends in albedo over the Pacific Ocean, four models qualitatively simulate our observed patterns. Those historical models and the AMIP models collectively estimate an Equilibrium Climate Sensitivity (ECS) of ~3.5oC, with an uncertainty from 2.7 to 5.1oC. Our ECS estimates are sensitive to the instrument calibration which drives the wide range in ECS uncertainty. We force the calibrations to have a near neutral change in reflectivity over the Antarctic ice sheet. Our observations show no sign of dissipating marine stratocumulus clouds. Instead, they show increasing cloudiness over the eastern equatorial Pacific and off the coast of Peru as well as neutral cloud trends off the coast of Namibia and California.

 To produce our SW cloud+aerosol albedo we first retrieve a Black-sky Cloud Albedo and empirically correct the sampling bias from diurnal variations. Then we estimate the broadband proxy albedo using multiple non-linear regression along with several years of CERES cloud albedo to obtain the regression coefficients. We validate our product against CERES data from the years not used in the regression. Zonal mean trends of our SW cloud+aerosol albedo show reasonable agreement with CERES as well as the Extended Pathfinder Atmospheres (Patmos-x) observational dataset.

How to cite: Weaver, C., Wu, D., Labow, G., Haffner, D., Borgia, L., McBride, L., and Salawitch, R.: Estimating Climate Sensitivity from UV satellite observations and CMIP6 models since 1980, EGU General Assembly 2024, Vienna, Austria, 14–19 Apr 2024, EGU24-13746, https://doi.org/10.5194/egusphere-egu24-13746, 2024.

EGU24-13967 | ECS | Orals | AS1.16

Heterogeneous Ice Nucleation of Microplastics before and after Oxidation 

Teresa M. Seifried, Sepehr Nikkho, Aurelio Morales Murillo, Lucas J. Andrew, Edward R. Grant, and Allan K. Bertram

Many recent studies point to the environmental threat posed by microplastic pollution, both in waterways and as transmitted globally in the atmosphere.1,2 Airborne microplastics impact the climate by the direct absorption and scattering of radiation3 and may act indirectly to influence cloud formation and precipitation by means of heterogeneous ice nucleation.4 But, the true efficiency of microplastics as ice-nucleating particles and its implications for cloud formation remain largely unknown.

Here, we present evidence for ice nucleation in immersion freezing mode induced by various microplastics suspended in water. This study focuses on seven distinct microplastic morphologies in substances composed of polypropylene (PP), polyethylene (PE) and polyethylene terephthalate (PET). For each polymer type, we analyzed at least one commercially-available microplastic sample and one generated from the breakdown of a commonly used commercial product. PP needles, PP fibers and PET fibers nucleated ice at temperatures relevant for mixed-phase cloud formation, with T50 values of -20.88 °C ± 0.52, -23.24°C ± 0.21 and -21.93°C ± 0.51, respectively. The number of ice nucleation sites per surface area (ns(T)) ranged from 10-1 to 104 cm-2 in a temperature interval of -15 to -25°C. In addition, we conducted oxidation experiments, exposing the samples to ozone and UV light, resulting in a decrease of nucleation temperatures among the ice-active microplastics. The presented data holds significant potential for integration into climate models, facilitating estimations of their impact on cloud formation.


(1) Dris, R.; Gasperi, J.; Rocher, V.; Saad, M.; Renault, N.; Tassin, B. Microplastic Contamination in an Urban Area: A Case Study in Greater Paris. Environ. Chem. 2015, 12 (5), 592–599. https://doi.org/10.1071/EN14167.

(2) Allen, S.; Allen, D.; Baladima, F.; Phoenix, V. R.; Thomas, J. L.; Le Roux, G.; Sonke, J. E. Evidence of Free Tropospheric and Long-Range Transport of Microplastic at Pic Du Midi Observatory. Nat Commun 2021, 12 (1), 7242. https://doi.org/10.1038/s41467-021-27454-7.

(3) Revell, L. E.; Kuma, P.; Le Ru, E. C.; Somerville, W. R. C.; Gaw, S. Direct Radiative Effects of Airborne Microplastics. Nature 2021, 598 (7881), 462–467. https://doi.org/10.1038/s41586-021-03864-x.

(4) Ganguly, M.; Ariya, P. A. Ice Nucleation of Model Nanoplastics and Microplastics: A Novel Synthetic Protocol and the Influence of Particle Capping at Diverse Atmospheric Environments. ACS Earth Space Chem. 2019, 3 (9), 1729–1739. https://doi.org/10.1021/acsearthspacechem.9b00132.

How to cite: Seifried, T. M., Nikkho, S., Morales Murillo, A., Andrew, L. J., Grant, E. R., and Bertram, A. K.: Heterogeneous Ice Nucleation of Microplastics before and after Oxidation, EGU General Assembly 2024, Vienna, Austria, 14–19 Apr 2024, EGU24-13967, https://doi.org/10.5194/egusphere-egu24-13967, 2024.

EGU24-15019 | Posters on site | AS1.16

Overview of DCMEX project, progress made towards goals, and measurements of primary ice particles 

Alan Blyth and Declan Finney and the DCMEX team

The Deep Convective Microphysics EXperiment (DCMEX) was held in and around the convective clouds that formed and grew steadily over the Magdalena Mountains near Socorro, New Mexico during July and August, 2022. The overall goal of DCMEX is to reduce the uncertainty in cloud feedbacks associated with deep convection by improving the representation of microphysical processes in the UM/CASIM model. It is part of the NERC CloudSense programme that aims to reduce the uncertainty in climate sensitivity due to clouds. The aim of the field campaign was to make observations of the aerosols, ice nucleating particles (INPs), and the microphysics and dynamics of the clouds in order to both make new discoveries and to provide novel measurements to improve models. Measurements were made with the FAAM aircraft, ground-based aerosol instruments, radars and routinely with the NEXRAD radars and GOES-17 satellite instruments. In this talk, we will present an overview of the project and of the progress that has been made so far towards the overall goals, such as a new representation of INP in CASIM based on the observations and good measurements of the ice concentrations at several temperatures and stages of development. We will also present results on the observations of primary ice in the context of the measured INPs

How to cite: Blyth, A. and Finney, D. and the DCMEX team: Overview of DCMEX project, progress made towards goals, and measurements of primary ice particles, EGU General Assembly 2024, Vienna, Austria, 14–19 Apr 2024, EGU24-15019, https://doi.org/10.5194/egusphere-egu24-15019, 2024.

Organic aerosols make up a considerable mass fraction of atmospheric particulate matter, and impact air quality and climate. In the atmosphere, organic aerosols are exposed to different relative humidities (RH), often ranging between 20% to 100% RH. Gas-particle partitioning of water equilibrates the aerosol particles with the ambient RH, forming aqueous organic aerosols. When exposed to solar radiation, photochemical reactions can occur within the aqueous organic aerosol particles. Such photochemical interactions are often enhanced at the interface formed between the aqueous organic phase and the surrounding air. Depending on the changes in composition these photochemical reactions can induce phase transitions of the particles, including liquid-liquid phase separation, resulting in aqueous organic aerosols with multiple condensed phases. Understanding of the interfacial photochemical reaction and impacts on the number of phases in aqueous organic aerosols remains poor but is critical to assess the impacts of aqueous organic aerosols on air pollution and climate. For example, the number of phases in aqueous organic aerosol particles impacts their reactivity and cloud formation potential, with important implications for air quality and climate.

Here, we propose how the combination of spectroscopy and microscopy tools can be exploited to address this issue: Sum-frequency generation, a surface-sensitive, nonlinear optical spectroscopy method, is used to investigate bulk laboratory proxies of atmospheric aqueous organic aerosols and study changes in their chemical surface composition, as a function of solar irradiation. In addition, we use optical microscopy, to directly study the number of condensed phases in individual particles of the same aerosol system. The combined methods provide microscopic- and molecular-level insights how photochemical reactions impact the phase behavior of aqueous organic aerosols.

How to cite: Abdelmonem, A. and Mahrt, F.: Combining surface spectroscopy and optical microscopy can provide evidence of phase separation induced by photochemical aging of organic aerosol, EGU General Assembly 2024, Vienna, Austria, 14–19 Apr 2024, EGU24-15080, https://doi.org/10.5194/egusphere-egu24-15080, 2024.

EGU24-15843 | ECS | Posters on site | AS1.16

Investigating the Molecular-Scale Mechanism of Deposition Ice Nucleation on Silver Iodide Surfaces 

Golnaz Roudsari, Mária Lbadaoui-Darvas, André Welti, Athanasios Nenes, and Ari Laaksonen

Heterogeneous ice nucleation is a ubiquitous process in the natural and built environment. Deposition ice nucleation, according to the traditional view,, occurs in a subsaturated water vapor environment without the presence of supercooled water on the solid, ice-forming surface. This process is notably significant among the various ice formation mechanisms in high-altitude cirrus and mixed-phase clouds. Despite its significance, our understanding of the microscopic mechanism of deposition ice nucleation remains quite limited. This study introduces an adsorption-based mechanism for deposition ice nucleation through results from a combination of atomistic simulations, experiments and theoretical modeling.

Silver iodide (AgI) particles prove highly efficient as ice-nucleating particles (INPs), commonly employed in rain seeding, and stand as one of the most potent laboratory surrogates for ice nucleation. In this study, AgI is used as a substrate for the simulations. The study involves a combination of grand canonical Monte Carlo and molecular dynamics (GCMC/MD) techniques to investigate deposition ice nucleation on AgI. We find that water initially adsorbs in clusters which merge and grow over time to form layers of supercooled water. Ice nucleation on silver iodide requires at minimum the adsorption of 4 molecular layers of water. Guided by the simulations we propose the following fundamental freezing steps: 1) Water molecules adsorb on the surface, forming nanodroplets. 2) The supercooled water nanodroplets merge into a continuous multilayer when they grow to about 3 molecular layers thick. 3) The layer continues to grow until the critical thickness for freezing is reached. 4) The critical ice cluster continues to grow.

How to cite: Roudsari, G., Lbadaoui-Darvas, M., Welti, A., Nenes, A., and Laaksonen, A.: Investigating the Molecular-Scale Mechanism of Deposition Ice Nucleation on Silver Iodide Surfaces, EGU General Assembly 2024, Vienna, Austria, 14–19 Apr 2024, EGU24-15843, https://doi.org/10.5194/egusphere-egu24-15843, 2024.

EGU24-15951 | ECS | Posters on site | AS1.16

Exploring the role of aggregation in ice-nucleating macromolecules of Betula pendula pollen 

Florian Reyzek, Nadine Bothen, Ralph Schwidetzky, Teresa Seifried, Paul Bieber, Ulrich Pöschl, Konrad Meister, Mischa Bonn, Janine Fröhlich-Nowoisky, and Hinrich Grothe

A wide range of aerosols, including dust, soot, and biological particles, can serve as ice nuclei, initiating the freezing of supercooled cloud droplets. This process significantly impacts cloud characteristics, and consequently, weather and climate. Among biological ice nuclei, some exhibit exceptionally high nucleation temperatures. While Ice Nucleating Macromolecules (INMs) found on pollen are typically not among the most active ice nuclei, they are abundant, as evidenced by their presence throughout the tissues of trees. Notably, recent studies have shown that certain tree-based INMs, such as those from Betula pendula, demonstrate ice nucleation activity above -10°C. These findings suggest that INMs emitted from the biosphere could play a more significant role in atmospheric processes than previously understood.

Our research delves into the properties of Betula pendula INMs through comprehensive ice-nucleation assays. We explore the stability of these INMs and the factors influencing their ice nucleation activity. Our approach integrates experimental data with size measurements and chemical analyses to better comprehend the underlying mechanisms.

Our findings reveal that Betula pendula INMs comprise three distinct classes active at -6°C, -15°C, and -18°C, each present in varying concentrations. We observed that freeze-drying and freeze-thaw cycles markedly alter their ice nucleation capacity. Additionally, heat treatments and chemical analysis suggest that these INM classes may be size-varying aggregates, with larger aggregates being more efficient at nucleating ice. This hypothesis aligns with previous studies on fungal and bacterial ice nucleators. Our research highlights the significance of birch INMs in atmospheric ice nucleation, not only because of their prevalence but also due to their occasional but notable high nucleation temperatures.

How to cite: Reyzek, F., Bothen, N., Schwidetzky, R., Seifried, T., Bieber, P., Pöschl, U., Meister, K., Bonn, M., Fröhlich-Nowoisky, J., and Grothe, H.: Exploring the role of aggregation in ice-nucleating macromolecules of Betula pendula pollen, EGU General Assembly 2024, Vienna, Austria, 14–19 Apr 2024, EGU24-15951, https://doi.org/10.5194/egusphere-egu24-15951, 2024.

EGU24-16314 | ECS | Posters on site | AS1.16

Insights from a Year-long Study on Ice-Nucleating Particles in Helsinki 

Germán Perez Fogwill, André Welti, Patipun Nontasin, Linnea Mustonen, Ana Álvarez Piedehierro, and Katrianne Lehtipalo

This study explores the seasonal dynamics of ice-nucleating particles (INPs) in Helsinki over a year. Using an automatic sampler, we collected atmospheric particle samples daily onto filters, which were subsequently analyzed offline through drop freezing experiments in our laboratory. The year-long measurements are used to study the temporal variations and seasonal patterns of INP concentrations in Helsinki. Measurements of different meteorological variables are also considered for the study. Additionally, we present case studies with higher temporal resolution. The offline laboratory analysis of the collected filters enables the characterization of INP concentrations in an urban environment with changing aerosols sources in different seasons. The presented results contribute to the understanding of the variation of INPs in an environment where anthropogenic activity is a main contributor to the present aerosol load.

How to cite: Perez Fogwill, G., Welti, A., Nontasin, P., Mustonen, L., Álvarez Piedehierro, A., and Lehtipalo, K.: Insights from a Year-long Study on Ice-Nucleating Particles in Helsinki, EGU General Assembly 2024, Vienna, Austria, 14–19 Apr 2024, EGU24-16314, https://doi.org/10.5194/egusphere-egu24-16314, 2024.

EGU24-16526 | Posters on site | AS1.16

Phase state of water adsorbed on ice nucleating particles 

André Welti, Yrjö Viisanen, Ana A. Piedehierro, and Ari Laaksonen

Barnes and Sänger (1961) suggested that a substance only becomes active at nucleating ice when the adsorbed water on the surface is in an ice-like state, and that there should be a correspondence between the temperature of ice nucleation and the “freezing” of adsorbed water.
We present spectroscopic measurements that allow to simultaneously determine the amount of adsorbed water and whether the adsorbed water is liquid or ice-like. These measurements are conducted using a new setup that allows to expose test substances to a broad temperature and humidity range while recording the diffuse infrared reflectance spectrum of the adsorbed water. The phase state of the adsorbed water with decreasing temperature is then compared to the ice nucleation temperature of the test substance, which is measured using a continuous flow diffusion chamber.

References:

Barnes, G. T., and Sänger, R., ZAMP 12, 159 (1961).


How to cite: Welti, A., Viisanen, Y., Piedehierro, A. A., and Laaksonen, A.: Phase state of water adsorbed on ice nucleating particles, EGU General Assembly 2024, Vienna, Austria, 14–19 Apr 2024, EGU24-16526, https://doi.org/10.5194/egusphere-egu24-16526, 2024.

EGU24-18918 | Posters on site | AS1.16

Causes of large climate model spread in equatorial Pacific cloud feedback 

Peter Hill, Declan Finney, and Mark Zelinka

Climate models remain the best tools for predicting the impact of climate change on quantities relevant to human activity, such as precipitation, surface temperature and occurrence of severe weather events. Since many of these changes scale with the models equilibrium climate sensitivity, it is crucial to understand the differences in climate sensitivity between the models, which are primarily driven by inter-model differences in cloud feedbacks.

Inter-model differences in cloud feedbacks are largest in the equatorial Pacific. Focussing on the area from 10°S - 10°N, and 160°E – 270°E, we find an inter-model standard deviation in cloud feedback of ~1.36 W m-2 K-1. Using appropriate weighting to account for the area of this region, this equates to a contribution to the global mean cloud feedback uncertainty of ~ 0.07 W m-2 K-1, which represents approximately 20% of the inter-model spread in global mean cloud feedback. Local differences in cloud feedback between models in this region are even larger and may have implications for regional circulation and precipitation changes. This region is also notable as an exception to the high correlation in cloud feedbacks between coupled and atmosphere-only models.

In this presentation we will describe analysis of the causes of the inter-model spread in cloud feedbacks in this region. We shall demonstrate that the spread in domain-mean feedback in this region is due to inter-model differences in both dynamic and thermodynamic cloud feedbacks and show how this relates to changes in the properties of different cloud types amongst different models. We will also describe the use of empirical orthogonal function analysis to identify consistent cloud feedback patterns in this region across the ensemble of models and explain the causes of these patterns.

How to cite: Hill, P., Finney, D., and Zelinka, M.: Causes of large climate model spread in equatorial Pacific cloud feedback, EGU General Assembly 2024, Vienna, Austria, 14–19 Apr 2024, EGU24-18918, https://doi.org/10.5194/egusphere-egu24-18918, 2024.

EGU24-18961 | ECS | Orals | AS1.16

Airborne observations of ice-nucleating particles in the vicinity of developing deep convective clouds during the North American monsoon 

Martin Daily, Joseph Robinson, Declan Finney, James McQuaid, Benjamin Murray, and Alan Blyth

Deep convective clouds play crucial roles in atmospheric processes, generating lightning, severe weather, and significant rainfall, while their extensive anvils reflect solar radiation. However, models face limitations due to a lack of understanding of microphysical processes in these clouds. Ice-nucleating particles (INP), essential for initiating primary ice production, have only rarely been measured in air directly relevant for convective clouds. This makes separating the roles of primary and secondary ice difficult to resolve. Here we report the abundance and likely composition of INP during the Deep Convective Microphysics Experiment (DCMEX) campaign in New Mexico, USA, using measurements made from the FAAM BAe 146 aircraft during flights over and around the Magdalena Mountains. Orographic convective clouds frequently form directly above these mountains during the monsoon season (July-August), making the locality uniquely suited for sampling the aerosol, including INP, that become entrained into the clouds. INP were collected on filters during sampling circuits around the mountain range at varying altitudes and then analysed offline for immersion mode ice-nucleating activity using droplet freezing assays. Repeated measurements over a period of weeks enabled us to observe changes in the INP population with changes in airmass origin and also the vertical INP profile.

Overall INP concentrations observed were high (0.1 – 1 L-1 at -10 °C) but consistent with previous observations of INP in dominantly continentally influenced air, with some INP active up to -5 °C frequently observed. Vertically resolved sampling revealed a deep and consistently present coarse aerosol layer extending from 0.5km up to 3km above ground, within which we found that the INP were evenly distributed.

Aerosol number and size-resolved compositional properties, derived using data from underwing optical probes and filter analysis with scanning electron microscopy with energy dispersive spectroscopy (SEM-EDX) respectively, were then related to the INP activity of our samples to infer composition and origin. When comparing our samples to laboratory parameterisations of aerosol classes’ ice-nucleating activity, mineral dust could account for the INP activity seen at low temperatures but were too active at higher temperatures, instead more consistent with fertile soil dust.

Throughout the campaign, there was a change in air mass origin from the northwest to the southeast and back again, however this shift did not significantly affect the INP population. When comparing our INP spectra to the parametrization of primary ice crystal number concentration by Cooper (1986), it was noted that overall, it predicts the range of our INP observations well but does not capture the observed curved shape of INP spectra at higher temperatures.

This study underscores the persistent presence of INP in growing deep convective clouds, providing insights to refine microphysics in cloud models. Comparisons with actual cloud microphysical observations would confirm primary and secondary ice production processes.

How to cite: Daily, M., Robinson, J., Finney, D., McQuaid, J., Murray, B., and Blyth, A.: Airborne observations of ice-nucleating particles in the vicinity of developing deep convective clouds during the North American monsoon, EGU General Assembly 2024, Vienna, Austria, 14–19 Apr 2024, EGU24-18961, https://doi.org/10.5194/egusphere-egu24-18961, 2024.

EGU24-187 | ECS | Posters on site | AS1.17

Recent enhancement and prolonged occurrence of MJO over the Indian Ocean and their impact on Indian summer monsoon rainfall 

Keerthi Sasikumar, Debashis Nath, Xu Wang, Wen Chen, and Song Yang

The Madden–Julian oscillation (MJO) is one of the leading modes of tropical intra-seasonal variability, which exerts significant impacts on the weather and climate across the globe, particularly in the tropics. MJO affects the Asian monsoon by producing enhanced and suppressed convection during the active and break periods, respectively. In the recent decades, the heat content of Indo-western Pacific Ocean has increased significantly, which strengthened the MJO activity. Previous studies also have shown that the expansion of Indo-western Pacific warm pool led to the warping of MJO life cycle, which decreases its residence time over the Indian Ocean (IO) and increases over the Pacific Ocean. Here we show that in the boreal summer months, MJO amplitude has strengthened during the global warming hiatus or rapid IO warming period (1999–2015) compared to the previous period (1982–1998). In the later period, MJO exhibits a faster regeneration over the western IO, and its residence time has increased in the western hemisphere and western IO but decreased in the eastern IO and eastern Pacific Ocean. The strengthening of MJO and the readjustment in its residence time are due to the local MJO feedback on the IO and the La Nina like sea surface temperature pattern in the Pacific Ocean. The prolonged MJO activity leads to bursts of rainfall over the Indian subcontinent in Phase 3 and Phase 4, influencing the active spells of the Indian summer monsoon and causing heavy rainfall over central India and East Asia.

How to cite: Sasikumar, K., Nath, D., Wang, X., Chen, W., and Yang, S.: Recent enhancement and prolonged occurrence of MJO over the Indian Ocean and their impact on Indian summer monsoon rainfall, EGU General Assembly 2024, Vienna, Austria, 14–19 Apr 2024, EGU24-187, https://doi.org/10.5194/egusphere-egu24-187, 2024.

EGU24-471 | ECS | Posters on site | AS1.17

Sensitivity Analysis of Filtering Methods for Tropical Easterly Waves Classification 

Maria Juliana Valencia Betancur, Johanna Yepes, John F. Mejia, Alejandro Builes-Jaramillo, and Hernan D. Salas

Tropical easterly waves (TEWs) are quasi-periodic wave disturbances found within the easterly trade winds during boreal summer and autumn. They influence the synoptic-scale circulation dynamics in tropical America and contribute up to 50% of the seasonal precipitation (June to November) over northern South America. This study evaluates the sensitivity of different spectral bands in classifying TEWs based on daily vorticity at 700 hPa during the Organization of Tropical East Pacific Convection (OTREC) campaign. TEWs were identified in real-time using data from NOAA's Marine Tropical Surface Analysis. Complementarily, we refined TEWs identification by correlating it with 700 hPa filtered relative cyclonic vorticity from ERA5. To consider the uncertainties associated with the TEWs chronology selection, we employed two filtering methodologies: the Fast Fourier Transform (FFT) with periodicity bands of 3–10 days, 2.5–12 days, and 2.5–15 days, as well as the Ensemble Empirical Mode Decomposition (EEMD) with periodicity bands of 3–6 days, 4-12 days, and 3–15 days. Thirteen TEWs were initially reported by NOAA as crossing the Caribbean at 80°W. In our study, we further analyzed these waves by correlating areas characterized by westward-moving features of filtered relative cyclonic vorticity at the same longitude. Through this analysis, distinct classifications emerged using different filters, revealing the presence of 5 to 9 TEWs. The results show that TEWs classification is sensible to the filtering methods and periodicity band windows.

How to cite: Valencia Betancur, M. J., Yepes, J., Mejia, J. F., Builes-Jaramillo, A., and Salas, H. D.: Sensitivity Analysis of Filtering Methods for Tropical Easterly Waves Classification, EGU General Assembly 2024, Vienna, Austria, 14–19 Apr 2024, EGU24-471, https://doi.org/10.5194/egusphere-egu24-471, 2024.

EGU24-994 | ECS | Posters on site | AS1.17

Toward the Local Identification of Equatorial Waves  

Joao B. Cruz, José M. Castanheira, and Carlos C. daCamara

Equatorial waves (EWs) are synoptic to planetary-scale disturbances in the tropical atmosphere and are associated to a variety of tropical atmospheric phenomena. For instance, EWs can couple with convection, modulating a substantial fraction of cloud and rainfall variability in the tropics. Space-time filtering techniques that rely on the projection of data onto the structures of EWs are widely used in the literature. Such projection methods are employed with multiple purposes, including the unravelling of physical mechanisms underlying tropical atmospheric phenomena and the evaluation of numerical weather predictions in the tropics. However, most projection techniques rely on the global structures of these waves and, to our knowledge, there have not been efforts toward developing methodologies that identify EWs locally, i.e. over regions covering specific longitude ranges. This type of approach would highly decrease both the amount of data required and the computational power needed to identify EWs. Furthermore, it could potentially reduce the artificial effects local forcings may have on global projections.

This work makes use of the meridional and zonal structures of the solutions to the free Laplace tidal equations, known as Hough vector harmonics. By exploiting the properties of these solutions, we propose a methodology that allows for the identification of EWs over specific longitude ranges and perform a local analysis of fundamental wave properties.


This work was supported by IDL (UIDB/50019/2020) and CESAM (UIDP/50017/2020+UIDB/50017/2020+LA/P/0094/2020) through national funds by Fundação para Ciência e Tecnologia I.P./MCTES (FCT), Portugal.

How to cite: B. Cruz, J., Castanheira, J. M., and C. daCamara, C.: Toward the Local Identification of Equatorial Waves , EGU General Assembly 2024, Vienna, Austria, 14–19 Apr 2024, EGU24-994, https://doi.org/10.5194/egusphere-egu24-994, 2024.

This study investigated radiative effects on kinetic and potential energy budgets associated with rapid intensification of Typhoon Mujigae in 2015 by conducting sensitivity experiments with Weather Research and Forecasting (WRF) model simulation. We found that the inclusion of radiative effects mainly increases the symmetric rotational kinetic energy, while the radiative effects are from infrared longwave radiative effects. The comparison in symmetric potential energy and symmetric rotational kinetic energy budget between the sensitivity experiments excluding the radiative effects and solar shortwave radiative effects only reveals that the inclusion of infrared longwave radiative effects destabilizes the moist atmosphere and increases the conversion from symmetric potential energy to symmetric divergent kinetic energy , which reduces symmetric potential energy and enhances symmetric rotational kinetic energy through the strengthened conversion from symmetric divergent kinetic energy to symmetric rotational kinetic energy.

How to cite: Zhang, C. and Li, X.: Radiative Effects on Kinetic and Potential Energy Budgets Associated with Rapid Intensification of Typhoon Mujigae in 2015, EGU General Assembly 2024, Vienna, Austria, 14–19 Apr 2024, EGU24-1354, https://doi.org/10.5194/egusphere-egu24-1354, 2024.

Tropical cyclone (TC) Khanun in 2017 was simulated in this study by the Weather Research and Forecasting (WRF) model. The observation-validated simulation data were used to examine dominant dynamic processes resulting in the contraction of the radius of maximum kinetic energy of symmetric rotational flow. The contraction rate was quantified by calculating the radial derivatives of symmetric rotational kinetic energy budget. The radius of maximum symmetric rotational energy was contracted rapidly before rapid intensification (RI) and moved inward slowly, then barely moved, and moved inward slowly again during RI.

The conversion from kinetic energy of asymmetric rotational flow to symmetric rotational flow induced by advection of asymmetric rotational tangential wind by asymmetric divergent radial wind at dominant azimuthal wavenumber-1 asymmetry and convergence of inward flux of symmetric rotational flow led to the rapid contraction before RI. During RI, symmetric rotational energy grew in the lower troposphere significantly, and upward flux convergence was equally important as inward flux convergence of symmetric rotational flow, which caused the first slow contraction. The conversion from kinetic energy of symmetric divergent wind to symmetric rotational flow associated with co-locations of maximum symmetric rotational energy and maximum symmetric inward radial flow produced stationary maximum symmetric rotational energy. Finally, horizontal and vertical flux convergence of symmetric rotational flow, and the conversion from environmental kinetic energy to symmetric rotational kinetic energy through the interaction between symmetric rotational flow and symmetric radial environmental flow generated the second slow contraction.

How to cite: Shi, Y. and Li, X.: Contraction of the radius of maximum symmetric rotational kinetic energy during the intensification of Tropical Cyclone Khanun (2017), EGU General Assembly 2024, Vienna, Austria, 14–19 Apr 2024, EGU24-1355, https://doi.org/10.5194/egusphere-egu24-1355, 2024.

EGU24-1431 | ECS | Posters on site | AS1.17

Impact of the Indian Ocean Basin Mode on Tropical Cyclone Genesis in the North Indian and Western North Pacific Oceans 

Erandani Lakshani Widana Arachchige, Wen Zhou, Johnny C. L. Chan, and Xuan Wang

This study investigates the diverse influence of the Indian Ocean Basin Mode (IOBM) on tropical cyclone (TC) genesis in the north Indian Ocean (NIO) and western North Pacific (WNP) Ocean. Three types of warm (W1-W3) and cold IOBM (C1-C3) years are identified based on their persistence and connectivity with the Indian Ocean Dipole (IOD) mode. Type 1 is when the IOBM is decayed without conversion to the IOD, and type 2 is the conversion of the IOBM to the IOD with a phase change as a W event converts to a cold IOD or vice versa. Type 3 is a W event transforming into a positive IOD or a C event transforming into a negative IOD. During W1, in the WNP, TC genesis locations shift northward. They are less intense, whereas W3 TCs shift toward the southern WNP, far away from land, and significantly intensify from July to September (JAS). On the other hand, NIO TCs from October to December (OND) during W2 events are more concentrated in the Bay of Bengal (BoB). The W1–associated Genesis Potential Index (GPI) shows enhancement over the southern NIO from April to June (AMJ), extending into the WNP from JAS to OND. Most importantly, there is an increase in TCs south of 10°N in the WNP due to W3 and C2 events modulating vertical wind shear, mid-tropospheric relative humidity, relative vorticity at 850 hPa, and other related physical mechanisms. In contrast, a decrease in TCs south of 10°N in the WNP is caused by mechanisms associated with W2 and C3 events.Overall, changes in the large-scale environmental factors provide the background for the observed TC variation in both ocean basins during three types of IOBMs. This study, therefore, presents a detailed picture of the impact of IOBM events on TC activity over the NIO and WNP.

Key Words: Indian Ocean Basin Mode, north Indian Ocean, western North Pacific, warm and cold IOBM, Genesis Potential Index

How to cite: Widana Arachchige, E. L., Zhou, W., C. L. Chan, J., and Wang, X.: Impact of the Indian Ocean Basin Mode on Tropical Cyclone Genesis in the North Indian and Western North Pacific Oceans, EGU General Assembly 2024, Vienna, Austria, 14–19 Apr 2024, EGU24-1431, https://doi.org/10.5194/egusphere-egu24-1431, 2024.

EGU24-2215 | ECS | Posters on site | AS1.17

Modulations of local rainfall in Northeast Australia associated with the Madden Julian Oscillation 

Thi Lan Dao, Claire L. Vincent, Yi Huang, Joshua S. Soderholm, and Dale S. Roberts

This study investigates the interaction of the Madden Julian Oscillation (MJO) with local scale forcings in regulating precipitation and its diurnal variation over coastal areas in Northeast (NE) Australia. Radar results show that the variation of rainfall with MJO phases exhibits both large-scale and local-scale influences. During the enhanced convection phases of the MJO, widespread increased rainfall signals are generated by large-scale forcings associated with the MJO convection, but the environmental factors controlling the type and amount of precipitation during each phase is different. By contrast, the locally enhanced rainfall probability during suppressed convection phases of the MJO possibly results from mesoscale convective systems such as sea breezes and the interaction of easterly trade-winds and topography. The amplitude of the rainfall diurnal cycle in suppressed convection phases is generally larger than in enhanced convection phases of the MJO. However, the impact of the MJO on diurnal rainfall characteristics (e.g., diurnal timing and amplitude) varies from phase to phase suggesting that each MJO phase needs to be considered separately. Simulations from the UK Met-Office Unified Model with grid-spacing of 2.2 km have been used to understand the processes driving this observed interaction of large-scale and mesoscale variability. The simulations show that coastal rainfall during suppressed convection phases of the MJO is sensitive to the trade-wind inversion height as well as moisture distribution. The findings are important for assessing numerical model skills at small scales and highlight the importance of process-based understanding at these scales.

How to cite: Dao, T. L., L. Vincent, C., Huang, Y., S. Soderholm, J., and S. Roberts, D.: Modulations of local rainfall in Northeast Australia associated with the Madden Julian Oscillation, EGU General Assembly 2024, Vienna, Austria, 14–19 Apr 2024, EGU24-2215, https://doi.org/10.5194/egusphere-egu24-2215, 2024.

Synoptic-scale disturbances prevail over the tropical western North Pacific during boreal summer. Those disturbances are generated over the equatorial western-central Pacific and propagate northwestward to the tropical western North Pacific. They may cause extremely heavy rainfall events and serve as initial disturbances for tropical cyclone genesis. The intensity of the synoptic-scale disturbance over the tropical western North Pacific is closely related to the El Niño–Southern Oscillation (ENSO) that modulates the seasonal atmospheric fields over the source regions, along the propagation paths, and over the impact regions of the synoptic-scale disturbances. ENSO displays a diverse range of amplitude, spatial pattern and temporal evolution. In view of the increasing frequency of extreme ENSO events under global warming and their substantial consequences, it is essential to investigate the relationship between the intensity of the synoptic-scale disturbances over the tropical western North Pacific and ENSO of varying amplitudes. In this talk, we will present evidences for the nonlinear response of the synoptic-scale disturbance intensity over the tropical western North Pacific during boreal summer to the amplitude of ENSO. A distinct difference is revealed between the nonlinear response of the synoptic-scale disturbance intensity over the tropical western North Pacific to the amplitude of El Niño and La Niña events. Physical explanation will be provided for the above feature based on observational analysis and numerical model experiments.

How to cite: Gu, Q., Wu, R., and Yeh, S.-W.: Nonlinear response of summertime synoptic-scale disturbance intensity over the tropical western North Pacific to ENSO amplitude, EGU General Assembly 2024, Vienna, Austria, 14–19 Apr 2024, EGU24-2239, https://doi.org/10.5194/egusphere-egu24-2239, 2024.

    This study investigates interagency discrepancies among best-track estimates of tropical cyclone (TC) intensity in the western North Pacific, provided by the Joint Typhoon Warning Center (JTWC), the China Meteorological Administration (CMA), and the Regional Specialized Meteorological Center (RSMC) Tokyo during 2013–2019. The results reveal evident differences in maximum wind speed (MSW) estimates, where linear systematic differences are significant. However, the Dvorak parameter (CI) numbers derived from the MSWs reported by the three agencies are internally consistent. Further analysis suggests that the remained CI discrepancies are related to differences in the estimation of intensity trends, initial intensities, and TC positions among these datasets. In addition, the CI estimates provided by the JTWC for TCs over the open ocean are generally higher than those reported by the CMA and RSMC. However, the CMA (RSMC) tends to estimate stronger intensity for TCs in the China (Japan) mainland and coastal zone than those in the open ocean with the same intensity in JTWC dataset. This pattern potentially reflects the extensive use of surface observations by these two agencies for landfalling and offshore TCs. These results may help the research community to get more accurate details about the TCs in WNP from the best track datasets of different agencies.

How to cite: Bai, L., Xu, Y., Tang, J., and Guo, R.: Interagency discrepancies in tropical cyclone intensity estimates over the western North Pacific in recent years, EGU General Assembly 2024, Vienna, Austria, 14–19 Apr 2024, EGU24-2780, https://doi.org/10.5194/egusphere-egu24-2780, 2024.

EGU24-2914 | Posters on site | AS1.17

Maintenance of MJO Convection by Radiative Feedbacks   

Eric Maloney and Wei-Ting Hsaio

The maintenance mechanisms for the Madden-Julian oscillation (MJO) remain an area of active research, and may include a combination of radiative feedbacks, wind-evaporation feedbacks, and moistening produced by lower tropospheric convective heating. This presentation will revisit the importance of radiative feedbacks for supporting MJO convection with a new GPCP precipitation dataset and NASA CERES radiative heating profiles. Prior work by Adames and Kim with the GPCP v1.3 precipitation product and NOAA OLR indicated that radiative feedbacks are strongly supportive of MJO convection as viewed through the vertically integrated moist static energy budget, and provide a strong scale selection mechanism. This presentation uses the newer GPCP v3.2 product to show that while radiative feedbacks still provide a strong scale selection mechanism, the overall strength of radiative feedbacks are weaker than with GPCP1.3. This suggests that the relative role of other feedbacks such as wind-evaporation feedbacks for supporting MJO convection may be more important than once thought.


This presentation also uses NASA CERES radiation profiles in a vertically-resolved moisture budget framework that employs the tropical weak temperature gradient assumption to determine the impact of radiative feedbacks on the MJO moisture budget. It is shown that longwave cloud radiative feedbacks onto MJO moisture anomalies are enhanced in the Indian Ocean and southern Maritime Continent region compared to other parts of the tropics, suggesting stronger support for MJO convection there. This finding is consistent with prior work by Mayta and Adames suggesting that the MJO most closely resembles a moisture mode in that region. It is hypothesized that enhanced vertical shear in the Indian Ocean and southern Maritime Continent supports convective organization that fosters greater cloud-radiative feedbacks.

How to cite: Maloney, E. and Hsaio, W.-T.: Maintenance of MJO Convection by Radiative Feedbacks  , EGU General Assembly 2024, Vienna, Austria, 14–19 Apr 2024, EGU24-2914, https://doi.org/10.5194/egusphere-egu24-2914, 2024.

EGU24-3598 | Orals | AS1.17

Dynamical controls of mesoscale water vapor variability in the tropical western Pacific 

Adrian Tompkins, Alejandro Casallas, and Michie Vianca De Vera

Idealized simulations of radiative-convective equilibrium (RCE) with cloud resolving models have been used as a numerical laboratory to understand how diabatic processes can drive convective clustering, which in turn leads to significant drying of the free troposphere and increase in spatial humidity variability.  These processes, such as feedbacks between radiation, clouds and water vapor have been found to have relevance for numerous large-scale modes of convective organization, such as the width of the upward branch of the Hadley cell, ENSO and the Madden Julian Oscillation.  However, the controls of water vapor associated with convective variability on the sub-1000km mesoscale are less well known.  We adopt a simple multivariate analysis technique previously used to assess convective organization in RCE, and apply it to analyze convective organization and its impact on column integrated humidity (precipitable water, PW) variability for order 106 km2 mesoscale-size boxes in the tropical western Pacific warm pool region lying on or to the north of the equator.  We find that during the boreal summer/autumn periods, when sea surface temperature (SST) gradients are very limited in the target regions, convection remains mostly random and the horizontal PW gradients are small on these scales, this despite the action of diabatic feedbacks such as LW-cloud feedbacks and surface latent heat fluxes that are acting to  force clustering of convection. In stark contrast, during the other months of the year, when the zones are subject to a weak meridional SST gradient of SST (> 10-3 K km-1), convection is mostly aggregated over the warmer SSTs, with much larger PW gradients associated with an increase of clear sky OLR exceeding 10 W m-2. However, this situation is regularly disturbed by intermittent, multi-day episodes of more homogeneous convection distribution and limited spatial PW gradients. During these periods the SST-PW relationship flips, and the convecting regions are found over the coldest SSTs.  By using an index based on the SST-PW covariance, we construct a composite of 44 such events over a 4 year period which shows that they are associated with a westward-propagating, convectively-coupled Rossby wave like mode that is symmetric about the equator.  An independent multivariate (SST-PW) rotated EOF analysis confirms this, indicating the robustness of the result. We hypothesize that the longer-term variations in an convective organization index which was directly related to the tropics-wide energy budget (Bony et al. 2020) may be driven by the frequency of occurrence of these westward propagating modes, that seem to act as a primary control on mesoscale water vapor variability in the warm pool region in the boreal winter and spring months.

How to cite: Tompkins, A., Casallas, A., and Vianca De Vera, M.: Dynamical controls of mesoscale water vapor variability in the tropical western Pacific, EGU General Assembly 2024, Vienna, Austria, 14–19 Apr 2024, EGU24-3598, https://doi.org/10.5194/egusphere-egu24-3598, 2024.

Quickly intensifying tropical cyclones (TCs) are exceptionally hazardous for Atlantic coastlines.  An analysis of observed maximum changes in wind speed for Atlantic TCs from 1971-2020 indicates that TC intensification rates have already changed as anthropogenic greenhouse gas emissions have warmed the planet and oceans.  Mean maximum TC intensification rates are up to 28.7% greater in a modern era (2001-2020) compared to a historical era (1971-1990).  In the modern era, it is about as likely for TCs to intensify by at least 50 kts in 24 hours, and more likely for TCs to intensify by at least 20 kts within 24 hours than it was for TCs to intensify by these amounts in 36 hours in the historical era.  Finally, the number of TCs that intensify from a Category 1 hurricane (or weaker) into a major hurricane within 36 hours has more than doubled in the modern era relative to the historical era.  Significance tests suggest that it would have been statistically impossible to observe the number of TCs that intensified in this way during the modern era if rates of intensification had not changed from the historical era.    

How to cite: Garner, A.: Observed Increases in North Atlantic Tropical Cyclone Peak Intensification Rates, EGU General Assembly 2024, Vienna, Austria, 14–19 Apr 2024, EGU24-4089, https://doi.org/10.5194/egusphere-egu24-4089, 2024.

This study classifies 407 developing disturbances (DEV) and 2309 nondeveloping disturbances (NONDEV) over the western North Pacific into five large-scale circulation patterns, namely the pre-existing cyclone (PC), easterly wave (EW), zonal wind convergence (CON), zonal wind shear line (SL), and mixed zonal wind convergence and shear line (CON-SL) patterns. The SL pattern has the highest TC yield percentage, followed by the CON-SL, while the EW is the least favorable pattern. The composite analysis shows that upper-level divergence, midlevel relative humidity, and surface heat flux (SHF) growth are crucial to the disturbance development in all the five patterns. Besides, large lower-level barotropic kinetic energy conversion and a well-developed primary circulation are good indicators for disturbance development in the PC, EW, and CON rather than in the SL and CON-SL patterns. Furthermore, for the PC, EW and CON patterns, the DEV features strong and rapidly growing SHF and mesoscale convective systems (MCS) closer to the disturbance center, which allows deep-layer warming and moistening, and drives a deep secondary circulation. Interestingly, due to an environment with high lower-level vorticity, the SL and CON-SL patterns typically foster a relatively mature primary circulation with strong SHF and MCS concentrated close to the center, especially for the NONDEV at the pre-genesis stage. However, a drier mid-to-upper-level environment for the NONDEV inhibits deep convection and causes insufficient upper-level suction, which may explain its shallow secondary circulation and therefore poor potential to develop further.

How to cite: Wang, Z. and Chen, G.: Comparison between Developing and Nondeveloping Disturbances for Tropical Cyclogenesis in Different Large-Scale Flow Patterns over the Western North Pacific, EGU General Assembly 2024, Vienna, Austria, 14–19 Apr 2024, EGU24-4324, https://doi.org/10.5194/egusphere-egu24-4324, 2024.

EGU24-4564 | ECS | Orals | AS1.17

On the vorticity statistics in the Atlantic and East Pacific ITCZ 

Divya Sri Praturi and Bjorn Stevens

We investigate the small scale dynamical controls on the Intertropical convergence zone (ITCZ) in the Atlantic and East Pacific basins using 5 year, global km-scale coupled atmosphere-ocean-land simulations. To this end, using an ITCZ-based coordinate system, we develop a composited view of the zonal mean statistics of potential vorticity (PV) during Boreal Summer (JJA) at geopotential heights of 0.3, 1.5 and 4 km. The ITCZ-based coordinate system is defined locally at each longitude, such that the ITCZ latitude — identified as the latitude where the column water vapor is a maximum — constitutes the origin. The zonal, 5-year JJA mean latitudes of the Atlantic and East Pacific ITCZ determined based on this definition are 7.8°N and 10.8°N, respectively. The thus obtained composited PV profiles are robust with low inter-annual variability. The PV profiles exhibit a similar structure in both the basins of interest: a gradual increase in the PV values with latitude, followed by a sharp increase in the PV values in the ITCZ due to latent heating. The necessary conditions for the instability of the zonal flow are met, as the sign of the meridional gradient of PV is reversed at the ITCZ. The magnitudes of PV statistics in and around the Atlantic ITCZ are slightly smaller than those of the East Pacific ITCZ. The differences in PV values in the basins can be explained using one of the processes governing the vertical vorticity in the ITCZ, i.e., vortex stretching due to convergence. The vortex stretching term is proportional to the Coriolis parameter, i.e., for a given convergence rate in the ITCZ, more northern ITCZ latitudes could experience greater jumps in vertical vorticities. We also find that at geopotential heights of 0.3 and 1.5 km, the monthly mean relative vertical vorticity in the ITCZ increases as the ITCZ moves to the North. 

How to cite: Praturi, D. S. and Stevens, B.: On the vorticity statistics in the Atlantic and East Pacific ITCZ, EGU General Assembly 2024, Vienna, Austria, 14–19 Apr 2024, EGU24-4564, https://doi.org/10.5194/egusphere-egu24-4564, 2024.

EGU24-4620 | ECS | Posters on site | AS1.17

Association between torrential rainfall and tropical cyclone induced remote moisture transport over East Asia 

Shiqi Xiao, Aoqi Zhang, Yilun Chen, and Weibiao Li

There is increasing attention to torrential rainfall remote from tropical cyclones (TCs). However, the relationship between precipitation and TC induced remote moisture transport over decades is still unknown. To find the relationship above, we used objective identification of TC induced remote moisture transport to obtain spatiotemporal evolution of clusters and rainfall characteristics inside the clusters. The contribution of TC induced remote moisture transport to annual mean rainfall over North China and surroundings are 5–15 % higher than that over South China and surroundings. TC cases that induced remote heavy rainfall over two regions are listed. The tracks of TC induced remote moisture transport are generated using spatiotemporal digraphs. We used double Gaussian function to fit the relationship heavy rainfall frequency and moisture transport height, and used sigmoid function for the relationship between heavy rainfall frequency and moisture transport intensity derived from thousands of clusters over decades. The moisture transport height of peak heavy rainfall frequency over TC induced remote moisture transport are significantly higher than the transport without TC effect. The moisture transport intensity threshold for heavy rainfall frequency over 20 % is smaller over South China and surroundings than that over North China and surroundings. Those results above have quantified the relationship between heavy rainfall and moisture transport inside clusters, which is beneficial to forecast of torrential rainfall remote from TCs.

How to cite: Xiao, S., Zhang, A., Chen, Y., and Li, W.: Association between torrential rainfall and tropical cyclone induced remote moisture transport over East Asia, EGU General Assembly 2024, Vienna, Austria, 14–19 Apr 2024, EGU24-4620, https://doi.org/10.5194/egusphere-egu24-4620, 2024.

EGU24-5312 | ECS | Posters on site | AS1.17

Assessing the validity of simple models for tropical cyclones in high resolution simulations 

Giousef Alexandros Charinti

Existing theoretical models for tropical cyclones have been instrumental in understanding the mechanisms under which their intensification occurs. The potential intensity (PI) which was first introduced by Emanuel 1986, provides an upper bound for the intensity a tropical cyclone can achieve based on the environmental conditions. However, this model and others naturally assume idealized settings which do not necessarily occur in the real world. Using simulations from the high resolution cloud resolving model SAM in rotating radiative-convective equilibrium settings, we assess the validity of these idealizations in the simulations. We find that some idealizations, such as assuming convection on a moist adiabat in the eyewall, are only partially valid. In order to understand why these deviations from the theory occur, we look at different possible mechanisms missing in simple models, such as upper level processes and entrainment.

How to cite: Charinti, G. A.: Assessing the validity of simple models for tropical cyclones in high resolution simulations, EGU General Assembly 2024, Vienna, Austria, 14–19 Apr 2024, EGU24-5312, https://doi.org/10.5194/egusphere-egu24-5312, 2024.

EGU24-5466 | ECS | Posters on site | AS1.17

Abrupt ending of MJO by CCKW precipitation leaves swath of flooding across Indonesia 

Natasha Senior, Adrian Matthews, Ben Webber, Jaka Paski, Danang Nuriyanto, Donaldi Permana, and Richard Jones

Convectively coupled equatorial Kelvin waves (CCKWs) are eastward propagating weather systems that locally organise convection and have been linked to precipitation extremes across the Maritime Continent (MC). They are often embedded in convectively active phases of the Madden-Julian Oscillation (MJO) which too propagates eastwards but influences convection in the MC over longer timescales and larger areas. Previous high impact weather case studies have linked CCKWs to local precipitation extremes. In this study, we examine a case study during July 2021 of multiple CCKWs embedded within an active MJO. The final CCKW traversed the western MC causing precipitation extremes across equatorial Indonesia that lead to numerous reports of flooding and landslides, with the West Kalimantan region the worst affected. The MJO event itself was abruptly terminated following the passage of this CCKW. Through analysis of the moisture budget we find that the rainfall exceeded the convergence of moisture to produce the pronounced drying. Prior to the local MJO termination, we find there was enhanced westward propagating diurnal activity across the equatorial MC coinciding with a steady increase of total column water. We also examine observations of the extreme rainfall event in the West Kalimantan province. Comparing different deterministic model configurations, we find that the convection permitting models generally perform better when there are not multiple CCKWs present within the initial conditions. This research highlights how CCKWs should not simply be viewed as convective systems that locally affect weather but have the potential to have devastating impacts over the entire equatorial MC especially when involved in multiscale interactions both with the diurnal cycle and with the MJO.

How to cite: Senior, N., Matthews, A., Webber, B., Paski, J., Nuriyanto, D., Permana, D., and Jones, R.: Abrupt ending of MJO by CCKW precipitation leaves swath of flooding across Indonesia, EGU General Assembly 2024, Vienna, Austria, 14–19 Apr 2024, EGU24-5466, https://doi.org/10.5194/egusphere-egu24-5466, 2024.

EGU24-5958 | Posters on site | AS1.17 | Highlight

Freddy: breaking record for Tropical Cyclone precipitation? 

Enrico Scoccimarro, Paolo Lanteri, and Leone Cavicchia

Depending on the location on the Earth planet, the amount of precipitation associated with Tropical Cyclones (TCs) can reach 20% of the total yearly precipitation over land and up to 40% over some ocean regions. TC induced freshwater flooding has been suggested as the largest threat to human lives due to TCs. Therefore, a reliable quantification of the precipitation amount associated with each past TC is important for a better definition of the TC fingerprint on the climate. The temporal and horizontal resolution of state-of-the-art observational datasets and atmospheric reanalysis give the possibility to quantify the TC-associated precipitation over the Earth planet following the observed TC tracks. In this work we compare results from different observational and reanalysis datasets in terms of TC-associated precipitation, to verify the consistency between them. A particular focus is given to the record-breaking TC Freddy (Southern Indian Ocean, 2023).  Here we show that the time-varying bias in TC associated precipitation, due to the positive trend in assimilated observations, makes it difficult to assess long-term trend investigation based on reanalysis: to this aim we need to build on state-of-the-art General Circulation Models, free to evolve under historical radiative forcing. This work is part of CLINT EU project activity (grant agreement ID: 101003876; DOI: 10.3030/101003876).

How to cite: Scoccimarro, E., Lanteri, P., and Cavicchia, L.: Freddy: breaking record for Tropical Cyclone precipitation?, EGU General Assembly 2024, Vienna, Austria, 14–19 Apr 2024, EGU24-5958, https://doi.org/10.5194/egusphere-egu24-5958, 2024.

EGU24-6300 | ECS | Posters on site | AS1.17

Investigating the complexity of Mediterranean Tropical-like cyclones through the use of the vertically integrated Moist Static Energy Budget 

Miriam Saraceni, Lorenzo Silvestri, and Paolina Bongioannini Cerlini

In the literature, Mediterranean hurricanes, i.e., mesoscale cyclones exhibiting tropical characteristics for at least a brief portion of their lifespan, are often labeled as "medicanes". However, the debate on how to classify such cyclones remains open. Initially, a Mediterranean cyclone was designated as a "medicane" if it displayed a central "eye" and spiral cloud bands around the core. Due to their low rate of occurrence,  the mechanisms contributing to the formation of medicanes have been investigated in a relatively restricted set of case studies. Generally, the initiation phases of "medicane" life cycles exhibit similarities, with all systems displaying growth through the interaction of an upper-tropospheric potential vorticity (PV) streamer and a low-level baroclinic region, as commonly observed in extratropical cyclones. However, during the mature stages, baroclinic forcing, air–sea interactions, and convection may significantly influence cyclone development. Recently, a general classification has been proposed, based on a limited number of cases, dividing "medicanes" into three groups: Group 1, where baroclinic instability plays a significant role throughout the cyclones' lifetime; Group 2, where baroclinicity is relevant only in the initial stage, and, akin to tropical cyclones, the theory of wind-induced surface heat exchange can explain their intensification; and Group 3, encompassing cyclones developing through a synergy between baroclinic and diabatic processes. The lack of a clear physical definition for medicanes has led to diverse climatologies, necessitating the identification or establishment of criteria for effectively determining which cyclones within this broad category resemble their tropical counterpart. In this study, the investigation of genesis and intensification processes is carried out by analysing the vertically integrated moist static energy (h', with h = cp T + Lv q  + gt) budget for a subset of twenty-three among the most studied Mediterranean cyclones labeled as "medicanes" from 1969 to 2023.  To cover all chosen cyclones and use a consistent dataset the cyclone tracking, analysis, and budget computation are done employing the ERA5 reanalysis. After tracking the cyclones, the budget is computed within a radius around the cyclone center (from 300 km to 800 km), at least three times the radius of the cyclone, according to each cyclone's size. Within the budget, the increase of h' variance connects radiative, convective, and moisture feedback with the increase in the vertically integrated humidity, temperature, and geopotential variance. The budget, previously employed in studies of convective organization in the context of the Radiative Convective Equilibrium (RCE) in the tropics has been successfully applied also to tropical cyclones. Here, it is utilized firstly to capture the nature of the former subset of cyclones, understanding objectively through the budget, and specifically with the variance increase of each moist static energy term, which of these cyclones can be assimilated into the tropical-like framework. Additionally, this approach has given insights into the radiative, convective, and moisture feedback mechanisms driving cyclone intensification for these cases. Preliminary findings suggest that the established groups in the literature can be reconciled through the budget, enabling the identification of genuinely tropical-like cyclones using this method.

How to cite: Saraceni, M., Silvestri, L., and Bongioannini Cerlini, P.: Investigating the complexity of Mediterranean Tropical-like cyclones through the use of the vertically integrated Moist Static Energy Budget, EGU General Assembly 2024, Vienna, Austria, 14–19 Apr 2024, EGU24-6300, https://doi.org/10.5194/egusphere-egu24-6300, 2024.

EGU24-6417 | Orals | AS1.17 | Highlight

Ocean-Atmosphere Observations and Key Results from the 2021-2023 Atlantic Hurricane Saildrone Missions 

Gregory Foltz, Chidong Zhang, Andy Chiodi, Dongxiao Zhang, Edoardo Mazza, Edward Cokelet, Lev Looney, Hauke Schulz, Nan-Hsun Chi, Jun Zhang, Ajda Savarin, Hyun-Sook Kim, Eugene Burger, Francis Bringas, and Catherine Edwards

During the 2021-2023 Atlantic hurricane seasons, 24 Saildrone uncrewed surface vehicles (USVs) were deployed in the western Atlantic Ocean, Caribbean Sea, and Gulf of Mexico to collect ocean-atmosphere data within hurricane eyewalls. Sixteen different USVs intercepted tropical storms and hurricanes a total of 26 times, all with sustained wind measurements of at least tropical storm force (34 kt). Four USVs measured sustained hurricane-force winds (64+ kt) in the eyewalls of Hurricanes Sam (2021), Fiona (2022), Idalia (2023), and Lee (2023). An important advantage of the USVs compared to other observing platforms is that they can be actively steered into the paths of hurricanes and record data continuously during eyewall transects, enabling new insights into air-sea interaction processes in extreme conditions. This presentation gives an overview of the key observations and scientific results from the 2021-2023 missions. Direct measurements of the air-sea momentum flux and drag coefficient (Cd) from the USVs’ 20-Hz wind data show a distinct peak in Cd at wind speeds of around 40-50 kt and then a decrease and leveling off as winds approach 80 kt. These results extend findings from previous studies with direct covariance flux measurements, which were limited to winds of less than 50 kt. Measurements from the USVs also show diminished surface ocean cooling under the cores of Hurricanes Sam and Idalia due to strong upper-ocean salinity stratification, emphasizing the importance of salinity observations in the western Atlantic and Gulf of Mexico for potential improvements in hurricane intensity prediction.

How to cite: Foltz, G., Zhang, C., Chiodi, A., Zhang, D., Mazza, E., Cokelet, E., Looney, L., Schulz, H., Chi, N.-H., Zhang, J., Savarin, A., Kim, H.-S., Burger, E., Bringas, F., and Edwards, C.: Ocean-Atmosphere Observations and Key Results from the 2021-2023 Atlantic Hurricane Saildrone Missions, EGU General Assembly 2024, Vienna, Austria, 14–19 Apr 2024, EGU24-6417, https://doi.org/10.5194/egusphere-egu24-6417, 2024.

EGU24-7240 | Orals | AS1.17

Relationship between Tropical Cyclone Size Asymmetry and Anomalous Motion 

Xiaodong Tang, Huilin Li, and Juan Fang

Challenges persist in accurately predicting sharp changes in tropical cyclone (TC) motion over a short period of time, even with the employment of state-of-art forecasting technologies. The precise connection between these sudden changes and specific TC structure remains unclear. Here, we delve into the relationship between TC asymmetry (TCA) of outer-core size and anomalous motion, using best-track data spanning the period from 2001 to 2022. Results indicate that TCs characterized by lower TCA tend to display more pronounced deflections than their normal motion. Furthermore, fast-moving TCs exhibit heightened asymmetry and a propensity to accelerate, whereas slow-moving ones lean towards greater symmetry. In addition, TCs demonstrating substantial angular deviations are more prevalent at lower speeds, while fast-moving ones rarely generate anomalous deflections. These findings provide valuable insights into the potential impact of TCA on anomalous TC motion, which can ultimately be used to enhance the accuracy of TC track forecasting.

How to cite: Tang, X., Li, H., and Fang, J.: Relationship between Tropical Cyclone Size Asymmetry and Anomalous Motion, EGU General Assembly 2024, Vienna, Austria, 14–19 Apr 2024, EGU24-7240, https://doi.org/10.5194/egusphere-egu24-7240, 2024.

EGU24-7283 | ECS | Posters on site | AS1.17

Investigating Cloud Microphysical Properties: A Comprehensive Study Using High-Resolution Numerical Simulations and Observations in the Indian Ocean Region 

Samira El Gdachi, Pierre Tulet, Anne Rechou, Frederic Burnet, and Maud Leriche


Located at 21°07'S, 55°32'E, Reunion Island, a mountainous island in the Indian Ocean, is an extraordinary site for studying the formation and life cycle of slope clouds. The island is influenced by southeast trade winds, reaching peak intensity in winter (June-August) and moderating during summer (December to February). These winds create pronounced conditions along the southwest and northeast edges, accompanied by a leeward circulation in the northwest, notably in the Maïdo area. Sea and valley breezes converge on the slopes of Maïdo, facilitating the advection of oceanic air masses and initiating convection on the mountainous terrain. Duflot et al. (2019) have substantiated that this convective process leads to the daily formation of clouds, typically exhibiting shallow vertical development and containing minimal water content.

An intensive measurement campaign, BIOMAÏDO (Bio-physicochemistry of Tropical Clouds at Maïdo), took place from March 11 to April 7, 2019, at Reunion Island, in order to study the chemical and biological composition of the air mass, the formation processes of secondary organic matter in heterogeneous environments, the dynamics and evolution of the boundary layer, and the macro- and micro-physical properties of clouds.

In this study, cloud microphysical properties are examined and analyzed using observations from the campaign, followed by a comparison with a high-resolution (100m horizontal resolution) numerical simulation with the Meso-NH model. Among the two microphysical schemes (ICE3 and LIMA; Liquid Ice Multiple Aerosol), the model is initialized with the two-moment microphysical scheme LIMA, which is parameterized using aerosol CCN properties initialization derived from ground aerosol measurements (3 modes) and vertical balloon profile aerosol concentrations.

Firstly, a sensitivity study on the microphysical scheme will be presented. It demonstrates that clouds form simultaneously in both schemes. However, clouds exhibit greater vertical development in the ICE3 scheme. Additionally, cloud dissipation occurs an hour earlier in the LIMA scheme.

Subsequently, an analysis through a microphysical variable balance will be conducted to identify the primary thermodynamic processes characterizing the formation and dissipation of slope clouds.

How to cite: El Gdachi, S., Tulet, P., Rechou, A., Burnet, F., and Leriche, M.: Investigating Cloud Microphysical Properties: A Comprehensive Study Using High-Resolution Numerical Simulations and Observations in the Indian Ocean Region, EGU General Assembly 2024, Vienna, Austria, 14–19 Apr 2024, EGU24-7283, https://doi.org/10.5194/egusphere-egu24-7283, 2024.

EGU24-7615 | ECS | Posters on site | AS1.17

Influence of Drag Coefficient for Tropical Cyclone Intensification by Numerical Simulations.  

Hiroaki Yoshioka, Hironori Fudeyasu, Ryuji Yoshida, Junshi Ito, Takeshi Horinouchi, and Kosuke Ito

A project ”Moonshot Goal 8” was established to study the possible weakening of typhoon intensity due to artificial interventions supported by Japan Science and Technology Agency. One of our measures is to increase the sea surface drag near typhoons by using obstacles such as large ships.

The maximum potential intensity theory suggests that the equilibrium intensity decreases as the surface drag coefficient increases.

Still, few numerical studies tested it for real tropical cyclones (TCs). Some studies used fine-resolution simulations (e.g., with a sub-kilometer grid) to agree with the theoretical indication, but the number of cases is limited by calculation resources. Also, no studies have been conducted to elucidate the effect of surface drag coefficient change in a limited oceanic region.

Therefore, we aim to conduct a comprehensive study on how TC would react to surface drag change over limited regions that can be set in various ways. Now, we focused on the intensification of Typhoon Faxai in 2019 and conducted sensitivity experiments by changing the drag coefficient (CD) over the circle area around it. In this study, we ran the Scalable Computing for Advanced Library and Environment (SCALE) at a coarse horizontal resolution of 5 km. The resultant central pressure and maximum 10m wind speed were sensitive to CD, especially for the value. These were reduced almost linearly and weakened by about 60% of the control run (CTL) when CD was set to 3.0 times that in CTL. Additionally, the results of the sensitivity to a radius of changing CD area showed that maximum wind speed during the mature stage has remained unchanged when over 100 km radius area changed.

We will conduct further studies until the meeting.

How to cite: Yoshioka, H., Fudeyasu, H., Yoshida, R., Ito, J., Horinouchi, T., and Ito, K.: Influence of Drag Coefficient for Tropical Cyclone Intensification by Numerical Simulations. , EGU General Assembly 2024, Vienna, Austria, 14–19 Apr 2024, EGU24-7615, https://doi.org/10.5194/egusphere-egu24-7615, 2024.

Deep convection gives rise to large upper level clouds that strongly interact with radiation and are important to the climate energy budget. From an object-oriented perspective, these individual deep cloud systems are characterized by a well depicted cloud shield life cycle, starting with small cloud extents that grow at varying rates before decaying and vanishing. A simple formulation of the growth rate of the cloud shield has been proposed that links together the growth rate on the convective part of the cloud, the mass flux of both the convective and stratiform parts of the cluster and a simple removal sink term (Elsaesser et al., 2022). In this presentation we first show using a suite of satellite observations (infrared from geostationary satellites, GPM radar, etc.) that the functional form of the proposed equation is well suited to quantify the shield growth rate. We then focus on RCE simulations, with deep cloud system objects post processed, to explore the relative role of each term of the growth rate budget. Three different models are used in the same RCEMIP-like configurations. The results show that the budget equation works very well for each model, although the time constants require model-dependent adjustments. We will further show in Vienna the commonalities and the specificities of each model.

How to cite: Roca, R., Fiolleau, T., and Elsaesser, G.: Growth rate of deep convective system cloud shields: satellite observations and km-scale radiative convective equilibrium simulations, EGU General Assembly 2024, Vienna, Austria, 14–19 Apr 2024, EGU24-7675, https://doi.org/10.5194/egusphere-egu24-7675, 2024.

EGU24-8141 | ECS | Orals | AS1.17

The Indian Easterly Jet During the Pre-Monsoon Season in India 

Hannah Croad, Jonathan Shonk, Amulya Chevuturi, Andrew Turner, and Kevin Hodges

We identify for the first time an Indian Easterly Jet (IEJ) in the mid-troposphere during the pre-monsoon season, using ERA5 reanalysis data.  The IEJ is weaker and smaller in zonal extent than the African Easterly Jet over West Africa, with a climatological location of 10°N, 60–90°E, 700 hPa, and strength 6–7 m s−1 during March–May. The IEJ is a thermal wind associated with low-level meridional gradients in temperature (positive) and moisture (negative), resulting from equatorward moist convection in the ITCZ and poleward dry convection arising due to surface heating of northern India and surrounding inland desert regions. The IEJ is associated with a negative meridional potential vorticity gradient, therefore satisfying the Charney-Stern necessary condition for instability.  However, no wave activity is detected in various metrics, suggesting that the potential for combined barotropic-baroclinic instability is not often realized. This is likely related to the small zonal extent of the jet, with insufficient time for wave growth, or the lack of upstream orography. The IEJ is found to be linked with the meteorology of pre-monsoon India. IEJ strong years feature increased near-surface temperatures and drier conditions over India, while the opposite is found in IEJ weak years. Initial investigations did not indicate strong relationships between the IEJ state and the El Nino-Southern Oscillation or the Madden Julian Oscillation, although more detailed investigations are needed to clarify this.  This study provides an introduction to the IEJ’s role in pre-monsoon dynamics, and a platform for further research. This includes identifying any links with pre-monsoon meteorological hazards (heatwaves and thunderstorms) and potential impacts on the subsequent monsoon, and understanding large-scale conditions that drive changes in the IEJ.

How to cite: Croad, H., Shonk, J., Chevuturi, A., Turner, A., and Hodges, K.: The Indian Easterly Jet During the Pre-Monsoon Season in India, EGU General Assembly 2024, Vienna, Austria, 14–19 Apr 2024, EGU24-8141, https://doi.org/10.5194/egusphere-egu24-8141, 2024.

EGU24-8728 | ECS | Orals | AS1.17 | Highlight

Advancing seasonal hurricane predictions using causal AI 

Beata Latos, Il-Ju Moon, and Dong-Hoon Kim

In recent decades, the Atlantic region has seen more frequent and intense hurricanes, with the 2023 season ranking as the fourth-most active on record. Despite progress in understanding hurricane dynamics and identifying precursors, challenges persist in seasonal predictions.

Conventional correlation measures often fall short in capturing causal relationships. Therefore, in this study, we employed the causal AI discovery tool PCMCI+ — a combination of the PC (Peter and Clark) algorithm and the Momentary Conditional test. PCMCI+ excels at uncovering causal relationships in time series data by addressing issues like autocorrelation, indirect links and common drivers.

PCMCI+ was applied to nearly 150 lagged atmospheric and oceanic monthly ERA-5 time series from January to May between 1980 and 2022. Precursor regions, identified based on their causal links to hurricane numbers, were determined. Linear regression models and random forests were then used to predict hurricane numbers for each season.

Results indicate that adopting PCMCI+ to select causal precursor regions significantly improved the accuracy of seasonal hurricane predictions, achieving a correlation of over 0.9 between observed and predicted numbers. While this study contributes to improved forecast precision, its primary focus is on exploring and discussing identified causes. The selected precursor regions are explained in the context of atmosphere-ocean interactions, providing valuable insights into their role in hurricane formation.

This work was funded by the Korea Meteorological Administration Research and Development Program under Grant (RS-2023-00237121).

How to cite: Latos, B., Moon, I.-J., and Kim, D.-H.: Advancing seasonal hurricane predictions using causal AI, EGU General Assembly 2024, Vienna, Austria, 14–19 Apr 2024, EGU24-8728, https://doi.org/10.5194/egusphere-egu24-8728, 2024.

EGU24-9275 | ECS | Posters on site | AS1.17

A Reanalysis-Based Global Tropical Cyclone Tracks Dataset for the Twentieth Century (RGTrack-20C) 

Guiling Ye, Jeremy Cheuk-Hin Leung, Wenjie Dong, Jianjun Xu, Weijing Li, Weihong Qian, and Banglin Zhang

Given the large impacts of tropical cyclones (TCs) on human society, the response of TC activity to climate change has widely drawn attention from both society and scientists. However, assessing how historical TC activity, especially intensity, evolved with climate change has proven challenging due to incomplete TC records in the early years. Here, we introduce the Reanalysis-Based Global Tropical Cyclone Tracks Dataset for the Twentieth Century (RGTracks-20C), which is reconstructed from the National Oceanic and Atmospheric Administration (NOAA) Twentieth Century Reanalysis (20CRv3) using two tropical cyclone tracking algorithms. Validations based on observations in the modern satellite era verify the ability of the RGTracks-20C to capture the climatology and long-term variability of TC numbers, tracks, duration, and intensity across various ocean basins. Furthermore, the RGTracks-20C fills the gaps of the incomplete TC track information, including position and intensity, in the early observational data. The RGTracks-20C is the first publicly available reanalysis-based century-long global TC track dataset, providing an alternative data reference for future research about climate change and TC-related disasters.

How to cite: Ye, G., Leung, J. C.-H., Dong, W., Xu, J., Li, W., Qian, W., and Zhang, B.: A Reanalysis-Based Global Tropical Cyclone Tracks Dataset for the Twentieth Century (RGTrack-20C), EGU General Assembly 2024, Vienna, Austria, 14–19 Apr 2024, EGU24-9275, https://doi.org/10.5194/egusphere-egu24-9275, 2024.

The highly nonlinear moisture-precipitation relationship P(r) is a simple statistical model for tropical precipitation P that takes column relative humidity r as its only input variable. Its simplicity and robustness make the relationship useful for conceptual models and as a tool for model diagnostics. We use 10 years of daily ERA5 Reanalysis data to test if P(r) can reproduce the tropical land-ocean contrast of precipitation which we quantify by the tropical precipitation ratio χ(t), defined as the ratio between the spatiotemporal mean rain rate over land and ocean. We find that P(r) can adequately reproduce both magnitude and phase of the average seasonal cycle of χ(t) as long as we take into account that P(r) gets modified by the presence of land and that the relationship varies seasonally over both land and ocean. Since the values of χ(t) indicate that precipitation is enhanced over tropical land, we investigate in a second step whether this enhancement is explained by the distinct P(r) relationships over land and ocean, i.e. whether it rains more over land than over ocean for a given value of r, or by distinct land and ocean humidity distributions, or both. Our results show that the influence of the land surface on P(r) has the effect of disfavoring precipitation over land rather than enhancing it. Precipitation enhancement over land, thus, stems from the distinct humidity distributions over land and ocean with the land distribution exhibiting a more pronounced tail towards high r values compared to the ocean distribution.

How to cite: Schmidt, L. and Hohenegger, C.: Tropical land-to-ocean precipitation differences explained in the framework of the moisture-precipitation relationship, EGU General Assembly 2024, Vienna, Austria, 14–19 Apr 2024, EGU24-10815, https://doi.org/10.5194/egusphere-egu24-10815, 2024.

EGU24-12050 | ECS | Orals | AS1.17

Modulation of the Maritime Continent diurnal cycle of precipitation by the Madden-Julian Oscillation 

Jack Mustafa, Adrian Matthews, Rob Hall, and Karen Heywood

The manifestation of the diurnal cycle (DC) over the Maritime Continent is influenced by the large-scale environment, including the state of the Madden–Julian Oscillation (MJO). It is widely recognised in existing literature that the amplitude of the DC of precipitation is greatest at around the same time as, or perhaps slightly ahead of, greatest mean precipitation. However, there is weaker consensus on the impact of the MJO (if any) on the phase of the DC.

Here, the boreal winter (DJF) composite DC of precipitation is calculated for each of the 8 MJO phases (P1–8) defined by Wheeler and Hendon (2004), using 20 years of IMERG — the state-of-the-art gridded satellite-derived precipitation data product with 30-minute resolution. With such high temporal resolution, subtle changes in the phase of the DC can be, and are, identified. The western sides of Sumatra, Borneo and Java typically experience an earlier than usual diurnal precipitation maximum around P5–6, while the eastern sides of these islands experience an earlier than usual diurnal precipitation maximum around P2–3. An analogous west–east divide in DC phase regime is also observed over certain water bodies, such as the Makassar Strait. The magnitude of this phase fluctuation is greatest across eastern Sumatra, parts of eastern Borneo, the western Java Sea and the eastern Makassar Strait, where a range of DC phase of over four hours is frequently observed. The opposing nature of the western and eastern local regimes is a consequence of changes to the direction of phase propagation; westward phase propagation is favoured over the Makassar Strait and the eastern sides of Sumatra and Borneo during P2–3, while eastward phase propagation dominates across entire islands and water bodies during P5–6.

If, by extension, the DC of cloud cover shows strong regional fluctuations in timing, these results will have significant implications for the influence of the MJO on regional radiation budgets.

How to cite: Mustafa, J., Matthews, A., Hall, R., and Heywood, K.: Modulation of the Maritime Continent diurnal cycle of precipitation by the Madden-Julian Oscillation, EGU General Assembly 2024, Vienna, Austria, 14–19 Apr 2024, EGU24-12050, https://doi.org/10.5194/egusphere-egu24-12050, 2024.

A simple model is used to analyse the relation between the phenomenon of convective aggregation at small scales and  larger scale variability, including MJO-like behaviour, that results from coupling between dynamics and moisture in the tropical atmosphere. The model is based on the  single-layer dynamical equations coupled to a moisture equation to represent the dynamical effects of latent heating and radiative heating. The moisture variable q evolves through the effect of horizontal convergence, nonlinear horizontal advection and diffusion. Following previous work, the coupling between moisture and dynamics is included in such a way that a horizontally homogenous state may be unstable to inhomogeneous disturbances and, as a result, localised regions evolve towards either dry or moist states, with respectively divergence or convergence in the horizontal flow. The behaviour of the model system is investigated using a combination of theory and numerical simulation. The spatial organisation of the moist and dry regions demonstrates a spatial coarsening that, if moist regions and dry regions are interpreted respectively as convecting and non-convecting, represents a form of convective aggregation. When the weak temperature gradient (WTG) approximation (i.e. a local balance between heating and convergence) applies and horizontal advection is neglected the system reduces to a nonlinear reaction-diffusion equation for q and the coarsening is a well-know aspect of such systems. When nonlinear advection of moisture is included the large-scale flow that arises from the spatial pattern of divergence and convergence leads to a distinctly different coarsening process. When  thermal and frictional damping and f-plane rotation are included in the dynamics, there is dynamical length scale Ldyn that sets an upper limit for the spatial coarsening of the moist and dry regions. The f-plane results provide a basis for interpreting the behaviour of the system on an equatorial β-plane, where the dynamics implies a displacement in the zonal direction of the divergence relative to q and hence to coherent equatorially confined zonally propagating disturbances, comprising separate moist and dry regions. In many cases the propagation speed and direction depend on the equatorial wave response to the moist heating, with the relative strength of the Rossby wave response to the Kelvin wave response determining whether the propagation is eastward or westward. The key overall properties of the propagating disturbances, the spatial scale and the phase speed, depend on nonlinearity in the coupling between moisture and dynamics and any linear theory for such disturbances therefore has limited usefulness. The model described here, in which the moisture and dynamical fields vary in two spatial dimensions and important aspects of nonlinearity are captured, provides an intermediate model between theoretical models based on linearisation and one spatial dimension and three-dimensional GCMs or convection-resolving models.

How to cite: Haynes, P. and Davison, M.: A simple dynamical model linking radiative-convective instability, convective aggregation and large-scale dynamics, EGU General Assembly 2024, Vienna, Austria, 14–19 Apr 2024, EGU24-12620, https://doi.org/10.5194/egusphere-egu24-12620, 2024.

EGU24-12646 | ECS | Posters virtual | AS1.17

Exploring the dynamics of Tropical Cyclones in the Eastern Tropical Atlantic: a Weather Types perspective 

Paolo Besana, Marco Gaetani, Christoph Fischer, Cyrille Flamant, Tanguy Jonville, Andreas Fink, and Peter Knippertz

Studying Major Tropical Cyclones (MaTCs) is vital due to their significant impact on natural resource management, infrastructure resilience, and disaster preparedness, especially in vulnerable regions.

However there exists a gap in our understanding of the MaTC development and occurrence processes, particularly in the Eastern Tropical Atlantic (ETA) and on the Atlantic coast of West Africa where the interaction with African Easterly Waves (AEWs) appears to be a crucial aspect. In fact, although some AEWs evolve into MaTCs, a clear causal relationship between the two phenomena has not been established yet. In particular, the reason why only some AEWs evolve into MaTCs and other MaTCs evolve without an AEW's contribution has not been elucidated yet. 

The primary focus of this study is the characterization of the MaTCs in terms of “Weather Types” (WTs), which represent distinct atmospheric states showing persistence over days.

The aim of this research is to answer the following scientific questions:

1)Without explicitly describing the dynamic system or solving it analytically, how can WTs be utilized to characterize the patterns of atmospheric circulation in the ETA?

2)Which specific WTs exert a more significant influence on the frequency or occurrence of MaTCs in the region, assuming such a dependency exists?

3)How do MaTCs and AEWs interact with respect to the atmospheric circulation expressed through WTs?

To answer these questions we employed Self-Organizing Maps and Hierarchical Agglomerative Clustering to analyze atmospheric variables extracted from the ECMWF Reanalysis v5 (ERA5) and ECMWF Atmospheric Composition Reanalysis 4 (EAC4) reanalyses. Moreover, detailed information on the location, maximum winds, central pressure, and size of cyclones is extracted from the National Hurricane Centre database (HURDAT), while AEWs are identified and tracked by an algorithm developed at the Karlsruhe Institute of Technology (AEWDAT). 

This approach enables the identification of eight distinct WTs characterizing the atmospheric circulation in a region including ETA and the Atlantic coast of West Africa, making it possible to observe how the occurrence of a specific WT is suppressive or favorable for the occurrence of a MaTC. 

The analysis shows specific atmospheric conditions under which AEWs and MaTCs co-occur: in this sense we have identified WTs that are associated with the occurrence of a MaTC together with an AEW or with a MaTC alone. 

These results improve our knowledge on the relationship between AEWs and MaTCs as they provide the atmospheric circulation context in which they interact. 

The insights gained from this study may contribute to the field by offering a refined methodological framework, employing a WT-centric approach, and providing a comprehensive analysis of MaTC dynamics in the context of atmospheric circulation. 

How to cite: Besana, P., Gaetani, M., Fischer, C., Flamant, C., Jonville, T., Fink, A., and Knippertz, P.: Exploring the dynamics of Tropical Cyclones in the Eastern Tropical Atlantic: a Weather Types perspective, EGU General Assembly 2024, Vienna, Austria, 14–19 Apr 2024, EGU24-12646, https://doi.org/10.5194/egusphere-egu24-12646, 2024.

EGU24-13227 | ECS | Orals | AS1.17

Understanding the role of rain evaporation during tropical cyclogenesis 

Giuseppe Ciardullo, Yi-Ling Hwong, Leonardo Primavera, and Caroline Muller
Current studies about the role of rain evaporation in the development of deep clouds and storms, show that reduced rain evaporation leads to a significant aggregation of clouds in space. This aggregation process has been called “moisture-memory aggregation”. Rain evaporation removal in the boundary layer seems to be the major contributor to triggering the spatial clustering of clouds
The absence of cold pools, which are cold regions below clouds created by rain evaporation and known to hinder aggregation, has been suggested as the leading cause, but the precise physical mechanisms underlying this type of aggregation remains unclear. Our study aims to fill this gap. Cloud-resolving simulations in idealized, doubly-periodic geometry, are conducted, comparing results with and without rain evaporation in the boundary layer. We focus on the clustering of clouds into a large-scale tropical cyclone. 
The goal is to assess the sensitivity of clouds to rain evaporation during the processes preceding the formation of the tropical cyclone. The role of cold pools in the upscale growth of cloud clusters, hypothesized in earlier studies, is also exploited by Proper Orthogonal Decomposition (POD) technique. Energy associated spectra of both the spatial and temporal components are studied separately on three different ranges of scales.
The impact on atmospheric circulations is also investigated by a thermodynamical characterization, through the distributions of temperature, water vapor content and relative humidity. 

How to cite: Ciardullo, G., Hwong, Y.-L., Primavera, L., and Muller, C.: Understanding the role of rain evaporation during tropical cyclogenesis, EGU General Assembly 2024, Vienna, Austria, 14–19 Apr 2024, EGU24-13227, https://doi.org/10.5194/egusphere-egu24-13227, 2024.

EGU24-13617 | ECS | Orals | AS1.17

Tropical cyclone intensity estimation using two geostationary satellite data and deep learning 

Hyeyoon Jung, Il-Ju Moon, and Dong-Hoon Kim

Tropical cyclones (TCs) are among the most severe and destructive natural events, and they have a major detrimental impact on both the economy and society. This study used Geo-KOMPSAT-2A (GK2A) satellite data to estimate TC intensity in the western North Pacific based on a convolutional neural network (CNN) model. Given that the GK2A data cover only the period since 2019, we applied transfer learning to the model using information learned from previous Communication, Ocean, and Meteorological Satellite (COMS) data, which cover a considerably longer period (2011–2019). Transfer learning is a powerful technique that can improve the performance of a model even if the target task is based on a small amount of data. Experiments with various transfer learning methods using the GK2A and COMS data showed that the frozen–fine-tuning method had the best performance due to the high similarity between the two datasets. The test results for 2021 showed that employing transfer learning led to a 20% reduction in the root mean square error (RMSE) compared to models using only GK2A data. For the operational model, which additionally used TC images and intensities from six hours earlier, transfer learning reduced the RMSE by 5.5%. Because continuous long-term data are not always available for TC intensity estimation based on geostationary satellite images, these results imply that transfer learning may constitute a new advance in this area.

Acknowledgement. This research was supported by Korea Institute of Marine Science & Technology Promotion (KIMST) funded by the Korea Coast Guard (RS-2023-00238652, Integrated Satellite-based Applications Development for Korea Coast Guard).


How to cite: Jung, H., Moon, I.-J., and Kim, D.-H.: Tropical cyclone intensity estimation using two geostationary satellite data and deep learning, EGU General Assembly 2024, Vienna, Austria, 14–19 Apr 2024, EGU24-13617, https://doi.org/10.5194/egusphere-egu24-13617, 2024.

The selection of physical parameterization schemes for tropical cyclone (TC) forecasts has required a substantial amount of effort. In general, the evaluation of physical parameterization schemes and their combined performance was based solely on the deterministic forecast, which had inherent limitations in representing the overall performance of physical parameterization schemes due to the model uncertainty. This study introduces an uncertainty-informed framework of evaluating and selecting the combination of physical parameterization schemes for TC forecasts, based on the ensemble forecast that could include the model uncertainty roles. The performance ranking of the scheme combination based on the ensemble mean error is found to be distinct from that based on the deterministic forecast error. Moreover, differences in both ensemble mean errors and ensemble spreads for various scheme combinations highlight the importance of considering two metrics concurrently, i.e., via the quality of the forecast distribution as a whole, to assess the forecast performance. Consequently, the ensemble Continuous Ranked Probability Score (eCRPS) is used to quantify the performance of the scheme combinations, and it is demonstrated that the performance is more comprehensive than that in the deterministic context. Finally, the well-performed scheme combination for the forecasts of six intense TCs is chosen from the evaluated schemes in the context of model uncertainty, based on the overall quality of TC track and intensity forecast distributions.

How to cite: Wang, X. and Tan, Z.-M.: On the Combination of Physical Parameterization Schemes for Tropical Cyclone Track and Intensity Forecasts in the Context of Uncertainty, EGU General Assembly 2024, Vienna, Austria, 14–19 Apr 2024, EGU24-13792, https://doi.org/10.5194/egusphere-egu24-13792, 2024.

We simulate the Madden-Julian oscillation (MJO) over an aquaplanet with uniform surface temperature using the multiscale modeling framework (MMF) configuration of the Energy Exascale Earth System Model (E3SM-MMF). The simulated MJOs have similar spatial structures and propagation behavior to observations. To explore the processes involved in the propagation and maintenance of the MJO, we perform a vertically resolved moist static energy (MSE) analysis for the MJO (Yao, Yang, and Tan 2022; Yao and Yang 2023). Unlike the column-integrated MSE analysis, our method quantifies how individual physical processes amplify and propagate the MJO’s characteristic vertical structure. We find that radiation, convection, and boundary layer processes all contribute to maintaining the MJO, balanced by the large-scale MSE transport. Furthermore, large-scale dynamics, convection, and boundary layer processes all contribute to the eastward propagation of the MJO, while radiation slows the propagation. We further show that the MJO can still self-emerge when radiative heating rate is horizontally homogenized, highlighting that convective and boundary-layer MSE transports are sufficient to sustain the MJO. These transport processes might be overlooked in the column-integrated MSE analysis.

How to cite: Yang, D., Hannah, W., and Yao, L.: Vertically resolved analysis of the Madden-Julian Oscillation highlights the role of convective transport of moist static energy, EGU General Assembly 2024, Vienna, Austria, 14–19 Apr 2024, EGU24-13921, https://doi.org/10.5194/egusphere-egu24-13921, 2024.

The Madden–Julian oscillation (MJO) is the most predominant tropical intraseasonal variability and is a source of modulating global weather patterns. An accurate simulation of the MJO still remains a challenge for general circulation models (GCMs), and in fact, climate simulations with GCMs often struggle with the mean state-variability tradeoff. For this issue, a global storm-resolving climate simulation, which a recent increase in computing power makes possible, is expected to be a useful way because of its merit of direct coupling between moist processes and dynamics.

The present study examines the MJO representation in an AMIP-type ~10-year simulation with the Nonhydrostatic Icosahedral Atmospheric Model (NICAM) at 3.5-km horizontal resolution, in comparison with that in one of conventional GCMs (MIROC6). This NICAM simulation successfully reproduces the realistic initiation frequency, propagation, and hierarchical structure of MJO convection, as well as realistic mean states (e.g., mean tropical precipitation), whereas MIROC6 overly underestimates the number of robust MJO events, and the activity of westward-propagating synoptic-scale waves embedded within MJO convective envelopes. As specific processes, the enhanced mixed Rossby-gravity wave-like systems seem to be a precursor and building blocks of the MJO simulated with NICAM at least over the Indian Ocean, consistent with several observational studies. In addition, NICAM-MJO propagation into the western Pacific is helped by high-frequency intermittent advective moistening that can be triggered by the upper-tropospheric PV intrusion from the extratropics. This feature is also found in some of observed MJO events.

Our results suggest that good MJO simulations can attribute to representing the feedback from a complex of synoptic-scale waves onto MJO convective envelopes appropriately, and that the extratropics sometimes plays an active role in MJO dynamics. A success in simulating and scrutinizing these cross-scale interactions about the MJO is one of clear merits of kilometer-scale climate simulations without the assumption of a priori scale separation and quasi-equilibrium characteristics.

How to cite: Takasuka, D.: MJO initiation and propagation simulated with a global kilometer-scale climate simulation: Implication for the cross-scale interaction, EGU General Assembly 2024, Vienna, Austria, 14–19 Apr 2024, EGU24-14122, https://doi.org/10.5194/egusphere-egu24-14122, 2024.

EGU24-14608 | ECS | Orals | AS1.17

Does the tropical atmosphere support Doppler shifted MRG waves? 

Shreya Keshri and Suhas Ettammal

MRG wave belongs to one of the major synoptic scale modes of tropical atmospheric variability and they exhibit the properties of both slowly evolving Rossby and quickly evolving gravity type wave disturbances. Since the MRG waves bridges the gap between the low-frequency and high frequency modes of variability, it is crucial to understand the underlying dynamics of the MRG waves to improve the tropical weather and extended range forecasts. Many previous studies reported the observation of Doppler shifting of MRG waves in the western Hemisphere (e.g. Yang et al. 2003, 2007, Yang and Hoskins 2016 etc). Nevertheless, a comprehensive study of eastward propagating Doppler shifted MRG (E-MRG) waves and their frequency of occurrence relative to the westward propagating MRG waves is missing. In this study, we investigate the E-MRG wave events at 200 hPa pressure level using the wave fitting and Empirical Mode Decomposition (EMD) based wave event identification methodology. We have found 743 E-MRG wave events for the period 1979-2022 and a large fraction of them occur in the westerly duct during boreal winter seasons. It is noteworthy that E-MRG wave events account 33% of the total MRG wave events in the western Hemisphere during boreal winter seasons. As expected from the linear wave theory, 75% of the E-MRG wave events occur when the background winds are westerly. On the contrary, a notable fraction of the E-MRG events occur when the background winds are easterly. Detailed analysis reveals that westerly phase of the large-scale Kelvin waves setup the conducive environment for MRG wave events to be Doppler shifted and explain more than 75% of the E-MRG wave events that occur when the background winds are easterly. In addition to that the observation of strong link between the intrusion of eastward propagating extratropical disturbances and the E-MRG wave events support the extratropical-tropical interaction theory of Hoskins and Yang, 2016. The study underscores the importance of multiscale interactions and its realistic representation in the climate and numerical weather prediction models.

How to cite: Keshri, S. and Ettammal, S.: Does the tropical atmosphere support Doppler shifted MRG waves?, EGU General Assembly 2024, Vienna, Austria, 14–19 Apr 2024, EGU24-14608, https://doi.org/10.5194/egusphere-egu24-14608, 2024.

EGU24-15011 | ECS | Orals | AS1.17 | Highlight

Changes in the Seasonality of North Atlantic Tropical Cyclones 

Dario Treppiedi, Gabriele Villarini, Leonardo V. Noto, Enrico Scoccimarro, Wenchang Yang, and Gabriel A. Vecchi

The North Atlantic hurricane season is officially recognized to start on June 1st and end on November 30th. The awareness of this time window is crucial both for federal, state and local agencies as well as the general public to put in place preparation and mitigation efforts to mitigate the impacts of this natural hazard. However, there is an underlying assumption of stationarity in the seasonality of these storms, implying a lack of narrowing or expanding of the hurricane season over the years. Here, we consider the days when tropical cyclones happen (TCdays) to model their seasonality using circular statistics, which is the appropriate modeling framework due to the nature of this quantity. By using mixtures of distributions to model the inter-annual variability of the TCdays, we find an expansion of the tails of the distributions over the period 1966 – 2020 for the North Atlantic basin, leading to a more prolonged hurricane season over the recent decades. These results will be explained in terms of physical drivers, providing insights into the mechanisms that could be responsible for the observed lengthening of the hurricane season.

How to cite: Treppiedi, D., Villarini, G., Noto, L. V., Scoccimarro, E., Yang, W., and Vecchi, G. A.: Changes in the Seasonality of North Atlantic Tropical Cyclones, EGU General Assembly 2024, Vienna, Austria, 14–19 Apr 2024, EGU24-15011, https://doi.org/10.5194/egusphere-egu24-15011, 2024.

EGU24-15249 | Posters on site | AS1.17

Sensitivity analysis of hurricane Paulette with convection-permitting ICON simulations 

Fabian Senf and Roxana Cremer

Tropical cyclones are impressive phenomena of tropical meteorology and form spatially highly organised structures. To shed more light on microphysical sensitivities of hurricanes, we present the initial outcomes of a sensitivity analysis of hurricane Paulette simulated with the German weather and climate model ICON. Paulette occurred in the North-Atlantic basin in September 2020 and was simulated with variable settings for model parameterisations and horizontal grid spacings down to hectometre. The study especially explores the microphysical details of the simulated hurricane case. In our examination, we find interesting sensitivities to Cloud Condensation Nuclei (CCN) type and concentration and to vertical resolution. Changes in the top-of-the-atmosphere radiation fluxes are presented in detail. Insights gained from this analysis contribute to the broader understanding of model performance in simulating microphysical processes such as the formation of cloud ice and precipitation.

How to cite: Senf, F. and Cremer, R.: Sensitivity analysis of hurricane Paulette with convection-permitting ICON simulations, EGU General Assembly 2024, Vienna, Austria, 14–19 Apr 2024, EGU24-15249, https://doi.org/10.5194/egusphere-egu24-15249, 2024.

EGU24-15547 | ECS | Posters on site | AS1.17

Resonant excitation of Kelvin waves by interactions of subtropical Rossby waves and the zonal mean flow 

Katharina Meike Holube, Frank Lunkeit, Sergiy Vasylkevych, and Nedjeljka Žagar

Kelvin waves are an important component of the tropical wave circulation. While the excitation of Kelvin waves by tropical convection is well understood, the influence of subtropical Rossby wave dynamics on the Kelvin waves has received relatively little attention. Our research investigates a Kelvin wave excitation mechanism through interactions of Rossby waves and the zonal subtropical jet. The investigation is carried out with a spherical rotating shallow-water model, using a quasi-geostrophic zonal jet as initial condition. The basis functions of the model are the eigensolutions of the linearized equations, which are identified with atmospheric waves. The model formulation thus includes the Rossby and Kelvin waves as prognostic variables. With an external forcing that impacts only the Rossby waves, Kelvin waves can be excited in the model through the wave-mean flow interactions and wave-wave interactions. The main finding is that Kelvin waves are resonantly excited by interactions of the Rossby waves and the mean flow, provided the Doppler-shifted frequencies of the Rossby waves and the Kelvin waves match. The wave-mean flow interactions are found to be stronger than the wave-wave interactions. The resonant Kelvin wave excitation is one of the possible mechanisms for the influence of the extratropical circulation on tropical waves.

How to cite: Holube, K. M., Lunkeit, F., Vasylkevych, S., and Žagar, N.: Resonant excitation of Kelvin waves by interactions of subtropical Rossby waves and the zonal mean flow, EGU General Assembly 2024, Vienna, Austria, 14–19 Apr 2024, EGU24-15547, https://doi.org/10.5194/egusphere-egu24-15547, 2024.

EGU24-15819 | ECS | Orals | AS1.17

Influence of Subtropical Jets on the Equatorial Spectrum: implications for future changes in Kelvin waves and MJO variance 

Hagar Bartana, Chaim Garfinkel, Chen Schwartz, Ofer Shamir, and Jian Rao
Projected changes of tropical Convectively Coupled Equatorial Waves (CCEWs)  due to increased greenhouse gases, and the dynamical mechanism that forces those changes, are investigated in 13 state-of-the-art models from phase 6 of the Coupled Model Intercomparison Project (CMIP6).   The equatorial wave spectrum in the historical simulation from most of these models quantitatively (and even quantitatively) resembles that observed, a remarkable improvement from CMIP5. Most models project a future increase in power spectra for the Madden-Julian Oscillation  (MJO), while nearly all project a robust increase for Kelvin Waves (KW). In contrast, the power spectrum weakens for most other wavenumber-frequency combinations, including higher wavenumber Equatorial Rossby waves (ER). In addition to strengthening, KW also shift toward higher phase speeds (or equivalent depths). These changes are even more pronounced in models with smaller biases in their historical simulations.

The qualitatively different projected response of the different CCEWs (e.g., KW strengthening vs. ER weakening) suggest that dynamical forcings have an important role in the physical mechanism of the changes. This hypothesis is tested using targeted simulations of the Model of an Idealised Moist Atmosphere (MiMA) in which we impose perturbations in upper-troposphere zonal winds mimicking projected end-of-century changes in wind. These simulations demonstrate that future changes in KW and the MJO strongly depend on changes in the South Pacific subtropical jet. A similar dependence is also evident in the CMIP6 models. However, the winds in the south Pacific subtropical jets in the historical simulation of these CMIP6  models  are highly biased, and models with a stronger change in the jet tend to project a stronger intensification of both the MJO and KW. It is therefore necessary to account for this bias in the subtropical winds in order to provide more reliable projections of the KW and the MJO.

How to cite: Bartana, H., Garfinkel, C., Schwartz, C., Shamir, O., and Rao, J.: Influence of Subtropical Jets on the Equatorial Spectrum: implications for future changes in Kelvin waves and MJO variance, EGU General Assembly 2024, Vienna, Austria, 14–19 Apr 2024, EGU24-15819, https://doi.org/10.5194/egusphere-egu24-15819, 2024.

EGU24-21575 | ECS | Posters on site | AS1.17

Multivariate forecasting of tropical cyclones using combined neural networks 

Yegor Hudozhnik and Andreas Windisch

Tropical cyclones (TCs) are hazardous and destructive events that pose a threat to human life every year. Since the beginning of the meteorological observation era, predicting the behavior of cyclones has always been an issue. It has been proven that with climate change due to global warming, the proportion of stronger TCs increases, increasing the danger and potential harm of TCs.
Numerous techniques have been developed over the years and are used in ensembles to detect, predict, and classify TCs. Nevertheless, the tasks in the field of TC prediction are considered challenging because the development of TC systems exhibits nonlinear behavior and depends on many environmental factors.
Conventional TC forecasting methods are computationally intensive and require a relatively large amount of energy and time. Due to ongoing global warming, the behavior of TCs may constantly change and therefore requires the use of modern, environmentally friendly and more flexible learning methods for estimating and predicting the future behavior of TCs.
In recent years, the study of the application of Deep Learning (DL) in this area proved to be highly effective. These methods are designed to facilitate the prediction process, as well as automatically detect possible trends that may occur over time. DL methods provide the most modern statistical analysis and can thus exert their influence on research.
In our research, we have applied a novel approach of incorporating two-dimensional meteorological data to forecast the track and intensity of TCs together with scalar data of location, intensity, and temporal information. We have built and tested numerous sequence-to-sequence forecasting models based on ConvLSTM2D neural network layers and tested two-dimensional data compression using autoencoders as a data preparation technique. Our experiments have shown that the multivariate forecast yields perspective results. We have also succeeded in detecting the influence of recent trends in changes of TC behaviour in recent years and proved the ability of neural networks to fit themselves to those trends.

How to cite: Hudozhnik, Y. and Windisch, A.: Multivariate forecasting of tropical cyclones using combined neural networks, EGU General Assembly 2024, Vienna, Austria, 14–19 Apr 2024, EGU24-21575, https://doi.org/10.5194/egusphere-egu24-21575, 2024.

EGU24-268 | ECS | Orals | AS1.18

Heavy-Precipitating Mid-Tropospheric Cyclonic Systems of the Indian Summer Monsoon in a Warming Climate 

Sumit K. Mukherjee, Ayantika Dey Choudhury, and Raghavan Krishnan

Since the last couple of decades, western India has been experiencing persistent, intense rain episodes frequently during the summer monsoon season. Most of the pluvial episodes are accompanied by diverse convective systems modulated by the background monsoon circulation. As the climate warms, the changing environmental conditions affect the nature and intensity of the weather systems. This study discusses the evolving large-scale conditions under global warming, along with the recent changes in the occurrence of a special class of heavy-precipitating synoptic systems, the mid-tropospheric cyclones (MTCs). Observed particularly over the Northeast Arabian Sea, MTCs exhibit pronounced mid-level vorticity with minimal signature at the surface. Observational results suggest significant increasing trends in deep convection and heavy precipitation over western India during the summer monsoon season. The background conditions are dominated by warming in the Arabian Sea and the Indian Ocean, accompanied by strengthening of cyclonic circulation and ascending motion at mid-level over western India. An objective vortex identification using reanalysis dataset indicates a rise in the seasonal frequency and duration of heavy precipitating mid-tropospheric cyclonic systems over western India, resulting in a significant amplification of precipitation from these systems. Furthermore, outputs from seven global climate models of the Coupled Model Intercomparison Project Phase 6 (CMIP6) are used to assess the potential changes in the large-scale patterns conducive to the development and sustenance of mid-tropospheric cyclonic systems over western India with continued global warming following the Shared Socioeconomic Pathway 5-8.5 (SSP5-8.5) scenario. The models project stronger moisture transport over western India that triggers greater moisture convergence along the Indian west coast, aided by elevated water vapor content due to local sea surface warming. We also notice an increase in seasonal mean ascent and relative vorticity, particularly, at the middle troposphere, thereby creating a favorable setting for the occurrence of MTCs and the deep convective clouds in the late 21st century. This interplay between circulation–convection–precipitation on different spatiotemporal scales over the South Asian monsoon domain carries significant implications for assessment of regional hydrological extremes in a warming climate.

How to cite: K. Mukherjee, S., Dey Choudhury, A., and Krishnan, R.: Heavy-Precipitating Mid-Tropospheric Cyclonic Systems of the Indian Summer Monsoon in a Warming Climate, EGU General Assembly 2024, Vienna, Austria, 14–19 Apr 2024, EGU24-268, https://doi.org/10.5194/egusphere-egu24-268, 2024.

EGU24-823 | ECS | Orals | AS1.18 | Highlight

What drives variability of the Australian summer monsoon? 

Hanna Heidemann, Josephine Brown, and Sugata Narsey

The variability of northern Australian rainfall is related to local processes and remote teleconnections, which operate on subseasonal to interdecadal timescales. This includes the Madden-Julian Oscillation, Indian Ocean Dipole, El Niño-Southern Oscillation (ENSO) and Interdecadal Pacific Oscillation. The influence of these climate drivers and local sea surface temperatures (SSTs) on northern Australian rainfall evolves during the wet season, from austral spring through to autumn. Our study shows that ENSO as well as SSTs in the Timor Sea, Arafura Seas and Coral Sea are the key sources of rainfall variability in the pre-monsoonal months September to November. SST indices explained up to 50% of variance in observed northern Australian rainfall in October and November between 1940 and 2023. However, the teleconnection between northern Australian rainfall and ENSO, and also the influence of local SSTs, breaks down with the onset of the Australian summer monsoon in late December. This leads to 0% explained variance in northwestern Australian rainfall and 9% explained variance in northeastern Australian rainfall in January using SST indices only. This presentation will discuss which processes and feedbacks might instead drive rainfall variability over northern Australia during the monsoon season and how they differ from pre- and post-monsoonal conditions.

How to cite: Heidemann, H., Brown, J., and Narsey, S.: What drives variability of the Australian summer monsoon?, EGU General Assembly 2024, Vienna, Austria, 14–19 Apr 2024, EGU24-823, https://doi.org/10.5194/egusphere-egu24-823, 2024.

EGU24-962 | ECS | Posters on site | AS1.18

Shifting precipitation pattern during Indian summer monsoon 

Akanksha Sharma and Ashok Priyadarshan Dimri

Precipitation has a significant degree of temporal and spatial variability over the Indian region. A small change in precipitation frequency and its distribution may affect agriculture and water resources and can lead to extreme events such as flood and drought. Number of precipitating days and their spatial distribution has significant impact on many aspects of the socio-economic environment. In present study, 91-days climatology is used to enhance robustness and to reduce uncertainty of the time series. Further, Mann Kendall trend test and Pettitt’s test for change point detection is used for analysis of the number of precipitating days and corresponding precipitation over India and its sub-regions. India Meteorological Department (IMD) gridded dataset and ERA5 reanalysis dataset having resolution 0.25° x 0.25° is used for the period 1902-2020 and 1940-2020 respectively. Our results show that there is a positive trend of number of precipitating days and precipitation over northwest and negative trend over central northeast and northeast India. Indicating a westward shift of precipitation during monsoon season. Change point analysis shows majority of these changes occur after 1970. Positive precipitation anomaly is observed in the month of September over India, with the exception of the hilly and central northeast showing extension of higher precipitation from month of July-August to July-August-September. This extension is probably due to the strengthening of wind during recent time (1971-2020) which brought more moisture to the Indian landmass. Furthermore, increased moisture transfer from the Bay of Bengal has also been seen compared to the early period (1940-1970). Overall, the results of this study will help in understanding the impact of climate change on Indian summer monsoon that will assist in policy making and adapting water management practices.

How to cite: Sharma, A. and Dimri, A. P.: Shifting precipitation pattern during Indian summer monsoon, EGU General Assembly 2024, Vienna, Austria, 14–19 Apr 2024, EGU24-962, https://doi.org/10.5194/egusphere-egu24-962, 2024.

EGU24-1774 | Orals | AS1.18

Impact of AMV on rainfall intensity distribution and timing of theWest African Monsoon in DCPP-C-like simulations 

Elsa Mohino, Paul-Arthur Monerie, Juliette Mignot, Moussa Diakhaté, Markus Donat, Christopher David Roberts, and Francisco Doblas-Reyes

Previous studies agree on an impact of the Atlantic Multidecadal Variability (AMV) on total seasonal rainfall amounts over the Sahel. However, whether and how AMV affects the distribution of rainfall or the timing of the West African Monsoon is not well known. Here we seek to explore these impacts by analyzing daily rainfall outputs from climate model simulations with an idealized AMV forcing imposed in the North Atlantic, which is representative of the observed one. The setup follows a protocol largely consistent with the one proposed by the Component C of the Decadal Climate Prediction Project (DCPP-C). We start by evaluating model's performance in simulating precipitation, showing that models underestimate it over the Sahel, where the mean intensity is consistently smaller than observations. Conversely, models overestimate precipitation over the Guinea Coast, where too many rainy days are simulated. In addition, most models underestimate the average length of the rainy season over the Sahel, some due to a too late monsoon onset and others due to a too early cessation. In response to a persistent positive AMV pattern, models show an enhancement in total summer rainfall over continental West Africa, including the Sahel. Under a positive AMV phase, the number of wet days and the intensity of daily rainfall events are also enhanced over the Sahel. The former explains most of the changes in seasonal rainfall in the northern fringe, while the latter is more relevant in the southern region, where higher rainfall anomalies occur. This dominance is connected to the changes in the number of days per type of event: the frequency of both moderate and heavy events increases over the Sahel’s northern fringe. Conversely, over the southern limit, it is mostly the frequency of heavy events which is enhanced, affecting the mean rainfall intensity there. Extreme rainfall events are also enhanced over the whole Sahel in response to a positive phase of the AMV. Over the Sahel, models with stronger negative biases in rainfall amounts compared to observations show weaker changes in response to AMV, suggesting systematic biases could affect the simulated responses. The monsoon onset over the Sahel shows no clear response to AMV, while the demise tends to be delayed and the overall length of the monsoon season enhanced between 2 and 5 days with the positive AMV pattern. The effect of AMV on the seasonality of the monsoon is more consistent to the west of 10ºW, with all models showing a statistically significant earlier onset, later demise and enhanced monsoon season with the positive phase of the AMV. Our results suggest a potential for the decadal prediction of changes in the intraseasonal characteristics of rainfall over the Sahel, including the occurrence of extreme events.

How to cite: Mohino, E., Monerie, P.-A., Mignot, J., Diakhaté, M., Donat, M., Roberts, C. D., and Doblas-Reyes, F.: Impact of AMV on rainfall intensity distribution and timing of theWest African Monsoon in DCPP-C-like simulations, EGU General Assembly 2024, Vienna, Austria, 14–19 Apr 2024, EGU24-1774, https://doi.org/10.5194/egusphere-egu24-1774, 2024.

EGU24-1908 | ECS | Orals | AS1.18 | Highlight

Future land use influences on the global monsoon: An energetic perspective 

Nora L. S. Fahrenbach, Robert Jnglin Wills, and Steven J. De Hertog

Understanding the impact of future land use changes on the global monsoon system is crucial for the economy, water supply and food security. Here, we use future deforestation and afforestation simulations under different SSP scenarios from 10 CMIP6 models participating in the Land Use Model Intercomparison Project (LUMIP). We apply an energy flux potential (EFP) framework to connect shifts in the Intertropical Convergence Zone and regional monsoons to changes in the atmospheric energy transport, and examine the contribution from individual flux components (latent heat flux, sensible heat flux, shortwave and longwave radiation). The linearity of this method allows us to attribute atmospheric EFP changes to different land and ocean regions without the need for additional simulations.

We find consistent zonal-mean precipitation shifts over oceanic regions across models in the deforestation and afforestation scenarios. However, changes in the global monsoon (as represented by zonal-mean precipitation changes over land) show large model dependence. The energy flux analysis reveals a consistent mechanism across models: The surface latent heat flux is the dominant driver of land use-induced changes in EFP in the tropics. In most regions and models, an increase in the latent heat flux component of EFP corresponds to tropical precipitation decrease and vice versa.

Our regional analysis reveals that remote oceanic energy-budget anomalies are the main contributor to the global EFP patterns and monsoon precipitation anomalies for all models, while land energy-budget anomalies modulate both patterns over land. Decomposing the EFP pattern into the contribution from different land regions indicates model consensus regarding the strong contribution from North and South America to the land-only anomaly, while inter-model differences primarily stem from different model responses to African land use change. These findings highlight the complexity of rainfall shifts to future land use change scenarios and also emphasize the value of the energy flux potential method to quantitatively link remote forcing to regional rainfall changes.

How to cite: Fahrenbach, N. L. S., Jnglin Wills, R., and De Hertog, S. J.: Future land use influences on the global monsoon: An energetic perspective, EGU General Assembly 2024, Vienna, Austria, 14–19 Apr 2024, EGU24-1908, https://doi.org/10.5194/egusphere-egu24-1908, 2024.

EGU24-3014 | Posters on site | AS1.18

Multidecadal variability and decadal prediction of wintertime surface air temperature over the East Asian winter monsoon domain 

Jianping Li, Tiejun Xie, Xinxin Tang, Hao Wang, Cheng Sun, Juan Feng, Fei Zheng, and Ruiqiang Ding

This paper studies the influence of the winter NAO on the multidecadal variability of winter East Asian surface air temperature (EASAT) and its decadal prediction. The observational analysis shows that the winter EASAT and East Asian minimum SAT (EAmSAT) display strong in-phase fluctuations and a significant 60–80-year multidecadal variability, apart from a long-term warming trend. The winter EASAT experienced a decreasing trend in the last two decades, which is conducive to the occurrence of winter extremely cold events in East Asia in recent years. The winter NAO leads the detrended winter EASAT by 12–18 years with a maximumly significant positive correlation at the leading time of 15 years. Further analysis shows that ENSO may affect winter EASAT interannual variability, but does not affect the robust leading relationship between the winter NAO and EASAT. We present the coupled oceanic-atmospheric bridge (COAB) mechanism of the NAO influences on winter EASAT multidecadal variability through its accumulated delayed effect of ~15 years on the Atlantic Multidecadal Oscillation (AMO) and Africa–Asia multidecadal teleconnection (AAMT) pattern. BaseThis paper studies the influence of the winter NAO on the multidecadal variability of winter East Asian surface air temperature (EASAT) and its decadal prediction. The observational analysis shows that the winter EASAT and East Asian minimum SAT (EAmSAT) display strong in-phase fluctuations and a significant 60–80-year multidecadal variability, apart from a long-term warming trend. The winter EASAT experienced a decreasing trend in the last two decades, which is conducive to the occurrence of winter extremely cold events in East Asia in recent years. The winter NAO leads the detrended winter EASAT by 12–18 years with a maximumly significant positive correlation at the leading time of 15 years. Further analysis shows that ENSO may affect winter EASAT interannual variability, but does not affect the robust leading relationship between the winter NAO and EASAT. We present the coupled oceanic-atmospheric bridge (COAB) mechanism of the NAO influences on winter EASAT multidecadal variability through its accumulated delayed effect of ~15 years on the Atlantic Multidecadal Oscillation (AMO) and Africa–Asia multidecadal teleconnection (AAMT) pattern. Based on the COAB mechanism an NAO-based linear model for predicting winter decadal EASAT is constructed, with good hindcast performance. The winter EASAT for 2020–2034 is predicted to keep on fluctuating downward until ~2025, implying a high probability of occurrence of extremely cold events in coming winters in East Asia, and then turn towards sharp warming. The predicted 2020/21 winter EASAT is almost the same as the 2019/20 winter.d on the COAB mechanism an NAO-based linear model for predicting winter decadal EASAT is constructed, with good hindcast performance. The winter EASAT for 2020–2034 is predicted to keep on fluctuating downward until ~2025, implying a high probability of occurrence of extremely cold events in coming winters in East Asia, and then turn towards sharp warming. The predicted 2020/21 winter EASAT is almost the same as the 2019/20 winter.

How to cite: Li, J., Xie, T., Tang, X., Wang, H., Sun, C., Feng, J., Zheng, F., and Ding, R.: Multidecadal variability and decadal prediction of wintertime surface air temperature over the East Asian winter monsoon domain, EGU General Assembly 2024, Vienna, Austria, 14–19 Apr 2024, EGU24-3014, https://doi.org/10.5194/egusphere-egu24-3014, 2024.

This study identifies break events of the South China Sea (SCS) summer monsoon (SCSSM) based on 42 years of data from 1979 to 2020, and investigates their statistical characteristics and associated atmospheric anomalies. A total of 214 break events are identified by examining the convection evolution during each monsoon season. It is found that most events occur between June and September and show a roughly even distribution. Short-lived events (3–7 days) are more frequent, accounting for about two thirds of total events, with the residual one third for long-lived events (8–24 days).

The SCSSM break is featured by drastic variations in various atmospheric variables. Particularly, the convection and precipitation change from anomalous enhancement in adjoining periods to a substantial suppression during the break, with the differences being more than 60 W m−2 for outgoing longwave radiation (OLR) and 10 mm d−1 for precipitation. This convection/precipitation suppression is accompanied by an anomalous anticyclone in the lower troposphere, corresponding to a remarkable westward retreat of the monsoon trough from the Philippine Sea to the Indochina Peninsula, which reduces the transportation of water vapor into the SCS. Besides, the pseudo-equivalent potential temperature (θse) declines sharply, mainly attributable to the local specific humidity reduction caused by downward dry advection. Furthermore, it is found that the suppressed convection and anomalous anticyclone responsible for the monsoon break form near the equatorial western Pacific and then propagate northwestward to the SCS.

How to cite: Bi, M., Xu, K., and Lu, R.: Monsoon Break over the South China Sea during Summer: Statistical Features and Associated Atmospheric Anomalies, EGU General Assembly 2024, Vienna, Austria, 14–19 Apr 2024, EGU24-3424, https://doi.org/10.5194/egusphere-egu24-3424, 2024.

The Tibetan Plateau (TP), known as Earth's “Third Pole”, has experienced significant warming since 1980. As an important component of the summer monsoon, the TP rapid warming profoundly impacts both Asian and global climate systems. While previous studies focused on surface temperature, our research uses multiple reanalysis datasets to investigate atmospheric temperature changes over the TP. All three reanalysis datasets revealed an upper tropospheric warming above the TP centered around 250 hPa. The upper tropospheric warming rate is approximately 0.3 K/decade over the 1980-2021 period, faster than those at the same latitude. An energy budget analysis is performed to attribute this warming to different processes. The primary contribution arises from the convection process, contributing around 0.4K/decade. Cloud warms the upper troposphere by an additional 0.2K/decade. Other radiative processes and adiabatic processes play counterpart roles that weaken the upper tropospheric warming. The warming center is most significant in spring. In contrast to other seasons, warming in spring primarily results from the adiabatic process, rather than the convection process. Although different in specific values, all three reanalysis datasets show a similar contribution ratio of each physical process.

How to cite: Wei, Y. and Wang, Y.: Quantifying Contributions from Different Physical Processes to the Atmospheric Warming over the Tibetan Plateau, EGU General Assembly 2024, Vienna, Austria, 14–19 Apr 2024, EGU24-3865, https://doi.org/10.5194/egusphere-egu24-3865, 2024.

EGU24-4467 | ECS | Orals | AS1.18

The Impacts of Inundating Australia on Australian Monsoon 

Zhiyuan Yang, Sugata Narsey, Dongryeol Ryu, Murray Peel, Min-Hui Lo, and Kaighin McColl

Large-scale perturbations in land surface characteristics have been found to induce disturbances in the overlying atmosphere via land-atmosphere coupling. The perturbations can lead to changes in hydroclimatic variables, such as precipitation and air temperature, or in atmospheric circulation patterns. However, the local and remote atmospheric responses to continental-scale changes in land surface water have not been well studied in Australia. In this study, using the Community Earth System Model 2 (CESM2) of the National Center for Atmospheric Research (NCAR), we investigate the changes in Australian monsoon, which primarily impacts the northern Australian climate, in response to an extreme surface condition: the whole Australia being treated as a shallow lake in model simulations. The simulation results show that a continental-scale lake would extend the Australian monsoon season via earlier onset and later end. We find that the most significant changes in the simulated precipitation occur during the pre-monsoon period (e.g., early October to mid November). Considering that the traditional scheme used to explain monsoonal rainfall by the theory of land-sea thermal contrasts is not consistent with the simulated precipitation patterns, this study analyzes the changes in moist static energy (MSE) budget, the simulation with a hypothetical lake features an atmospheric condition that favors the formation of precipitation: increased moisture convergence and dry static energy divergence, which might be associated with the increased net energetic forcing and export of MSE. We also confirm the dominant role of atmospheric circulation in determining the variability of precipitation over northern Australia in wet season via examining the regional moisture recycling. A relative impact computation upon components in the moisture budget shows that the dynamic component of the vertical advection of moisture contributes the most to the temporal evolution of precipitation over northern Australia in wet season.

How to cite: Yang, Z., Narsey, S., Ryu, D., Peel, M., Lo, M.-H., and McColl, K.: The Impacts of Inundating Australia on Australian Monsoon, EGU General Assembly 2024, Vienna, Austria, 14–19 Apr 2024, EGU24-4467, https://doi.org/10.5194/egusphere-egu24-4467, 2024.

EGU24-4822 | Orals | AS1.18 | Highlight

Climate change is not the primary cause of extreme monsoons in Pakistan 

Moetasim Ashfaq, Nathaniel Johnson, Fred Kucharski, Noah Diffenbaugh, Adnan Abid, and Katherine Evans

Monsoons have been frequently severe in Pakistan in the last few decades, leading to extreme droughts and floods of unprecedented proportions. The wide belief is that these changing precipitation patterns are mainly due to climate change. However, considering this region's long history of floods and droughts, it is unwise to rule out the role of natural climate variability without a careful diagnosis. This study examines the contribution of oceanic and atmospheric variability to unusual precipitation distributions in Pakistan. We find that variations in sea surface temperatures in the tropical Pacific and northern Arabian Sea and internal atmospheric variability related to the circumglobal teleconnection pattern and the subtropical westerly jet stream account for 74% of monthly summer precipitation variability in the 21st century. Several of these forcings have co-occurred with record strength during episodes of extreme monsoons, compounding the overall effect. Climate change may have contributed to increased variability and the in-phase co-occurrences of the identified mechanisms, but further research is required to confirm any such connection.

How to cite: Ashfaq, M., Johnson, N., Kucharski, F., Diffenbaugh, N., Abid, A., and Evans, K.: Climate change is not the primary cause of extreme monsoons in Pakistan, EGU General Assembly 2024, Vienna, Austria, 14–19 Apr 2024, EGU24-4822, https://doi.org/10.5194/egusphere-egu24-4822, 2024.

EGU24-5941 | ECS | Orals | AS1.18

Future changes in South Asian summer monsoon circulation under global warming: Role of the Tibetan Plateau heating 

Haolin Luo, Ziqian Wang, Chao He, Deliang Chen, and Song Yang

The South Asian summer monsoon (SASM) is a significant monsoon system that exerts a profound impact on climate and human livelihoods. According to 38 models from the Coupled Model Intercomparison Project Phase 6 (CMIP6), the SASM circulation is projected to weaken significantly under global warming as seen in the weakened low-level westerly wind over the northern tropical Indian Ocean; however, the associated climate dynamics is still under debate. Here, we identify that the weakened low-level westerly wind is closely related to the enhanced diabatic heating over the Tibetan Plateau (TP), which corresponds with increased summer precipitation in the future. Further analyses and numerical experiments suggest that the intensified TP heating triggers an anomalous meridional circulation with ascending motions over the plateau and descending motions to the south, leading to an anomalous low-level anticyclone over the northern tropical Indian Ocean. This anticyclone greatly weakens the prevailing low-level westerly wind of the SASM through easterly anomalies at the anticyclone’s southern flank. Moisture budget analysis further reveals that increased atmospheric water vapor, rather than the vertical dynamic component, makes the largest contribution to the increased precipitation over the TP. This result confirms that the enhanced TP heating is a driver of atmospheric circulation change and contributes to weakening the SASM circulation.

How to cite: Luo, H., Wang, Z., He, C., Chen, D., and Yang, S.: Future changes in South Asian summer monsoon circulation under global warming: Role of the Tibetan Plateau heating, EGU General Assembly 2024, Vienna, Austria, 14–19 Apr 2024, EGU24-5941, https://doi.org/10.5194/egusphere-egu24-5941, 2024.

EGU24-7033 | ECS | Orals | AS1.18 | Highlight

The role of midlatitude dry air during the withdrawal of the Indian monsoon 

Akshay Deoras, Andrew Turner, Ambrogio Volonté, and Arathy Menon

The Indian summer monsoon (ISM) supplies over 75% of the country’s annual precipitation, profoundly impacting lives of over a billion people. Significant variability in the timing of its onset and withdrawal has a direct impact on the agricultural sector and other users of water resources. Previous studies have shown that a wedge of mid-tropospheric dry air emanating from the midlatitudes is present over India during early summer, which is much shallower in the vertical toward the southeast of India. Following the strengthening of low-level monsoon winds during the onset, the dry air retreats from the southeast due to increased moistening by shallow cumulus congestus clouds, driving the north-westward progression of the ISM. The withdrawal of the ISM is observed to progress in a southeast direction during September–October, but there is a lack of a conceptual model. In this study, we use observations and the ERA5 reanalysis to understand the dynamics and thermodynamics of the withdrawal. We find that a mid-level dry intrusion re-appears over the northwest of India around mid-September. Vertical profiles associated with this dry air show how the most unfavourable environment for deep convection occurs in the northwest, where the withdrawal occurs first. As the withdrawal progresses, the wedge of dry air deepens throughout its horizontal extent and descends. This stabilises the troposphere, suppressing deep convection and ultimately driving the withdrawal toward the southeast. By mid-October, the dry air engulfs most of India, causing the ISM to withdraw from the entire country. Thus, the strengthening of the mid-level dry advection from the midlatitudes can explain the withdrawal of the ISM, and the mechanism driving the local withdrawal can be considered as the reverse of that at play during the progression of the onset. This work establishes a new paradigm for the withdrawal of the Indian monsoon in terms of midlatitude interactions, which could be tested for other monsoon regions.

How to cite: Deoras, A., Turner, A., Volonté, A., and Menon, A.: The role of midlatitude dry air during the withdrawal of the Indian monsoon, EGU General Assembly 2024, Vienna, Austria, 14–19 Apr 2024, EGU24-7033, https://doi.org/10.5194/egusphere-egu24-7033, 2024.

EGU24-7080 | ECS | Posters on site | AS1.18

Summer monsoon transition induced microseisms observed at the South China Sea seabed 

Yulong Zhou, Fansheng Kong, Han Zhang, Zhangju Liu, Weiwei Ding, and Jiabiao Li

It has long been recognized that complex interactions and energy conversions between the atmosphere-ocean system and the solid Earth can generate strong ambient noise field, known as microseisms which can be detected worldwide. Under the vast majority of circumstances, such seismic energy is believed to be induced by tropical cyclones. Whether unidirectional propagating winds, such as monsoons, can generate microseisms lacks solid seismic evidence. Here we utilize broadband seismic data recorded by seven ocean-bottom seismometers (OBSs) deployed in the South China Sea basin and 17 terrestrial stations to systematically investigate possible influences of the summer monsoon transition on the microseisms. Spectral analyses over time reveal significant seismic energy in the secondary microseisms frequency band (0.1−0.5 Hz) during 18th to 29th May, coinciding with the period of the summer monsoon transition occurring in the South China Sea. Polarization analyses and time-space variation of offshore surface wind field indicate that the source region of the observed secondary microseisms is located at the South China Sea. Given the absence of tropical cyclones during this time, we attribute the observed strong secondary microseisms to the summer monsoon transition. When the near-surface wind field is transformed to be southwest, ocean waves are driven to propagate northeastward and interact with an opposing wave train which represents precursor waves and is reflected by coastlines, generating the secondary microseisms. This study provides solid evidence for a causal link between the monsoon transition and microseisms, highlighting the potential of applying ocean bottom seismic observations for monitoring and characterizing monsoon transition and ocean activities.

How to cite: Zhou, Y., Kong, F., Zhang, H., Liu, Z., Ding, W., and Li, J.: Summer monsoon transition induced microseisms observed at the South China Sea seabed, EGU General Assembly 2024, Vienna, Austria, 14–19 Apr 2024, EGU24-7080, https://doi.org/10.5194/egusphere-egu24-7080, 2024.

EGU24-7210 | Posters on site | AS1.18

Drought risks based on changes in atmospheric evaporative demand due to plant response to CO2 levels 

Kyung-Ja Ha, Ji-Hye Yeo, Daeha Kim, and Hyeonho Lee

The temperature and CO2 increase due to global warming are expected to exacerbate atmospheric water demand, worsening future drought conditions. Recent studies have revealed that evapotranspiration is regulated by stomatal response in response to CO2 increase. However, understanding droughts defined based on evapotranspiration remains incomplete as it does not adequately integrate plant responses to anticipated drought conditions. In this study, we aimed to evaluate the frequency and extent of future drought events by comparing the Evaporative Stress Index (ESI) using two potential evapotranspiration (Ep) values capturing atmospheric evaporative demand. The first Ep utilized past data and predictions from the Coupled Model Intercomparison Project Phase 6, assuming a constant surface resistance (rs) without considering plant responses. The second Ep accounted for the sensitivity of rs to increased CO2. Our findings indicate a significant increase in rs due to elevated CO2, leading to substantial changes in drought frequency and extent. While both non-vegetative response and plant response are expected to increase in future scenarios, an ESI that ignores plant responses tends to overestimate drought risk. Therefore, our study emphasizes the importance of integrating the sensitivity of rs to evaporative demand and CO2 level increases when assessing drought risk.

How to cite: Ha, K.-J., Yeo, J.-H., Kim, D., and Lee, H.: Drought risks based on changes in atmospheric evaporative demand due to plant response to CO2 levels, EGU General Assembly 2024, Vienna, Austria, 14–19 Apr 2024, EGU24-7210, https://doi.org/10.5194/egusphere-egu24-7210, 2024.

EGU24-7608 | Posters on site | AS1.18

Future projection of East Asian Summer Monsoon precipitation under 1.5°C, 2°C, and 3°C global warming levels 

MinAh Sun, Hyun Min Sung, Jisun Kim, Jae-Hee Lee, Sungbo Shim, and Young-Hwa Byun

The East Asian summer monsoon (EASM) is an influential climate system that contributes to approximately 70% of the annual precipitation in the Asia region. Extensive research has been conducted on monsoon changes in response to future climate. In this study, we analyzed the characteristics of the EASM considering specific global warming level (GWL) using Coupled Model Inter-comparison Project 6 (CMIP6) simulations. The 30 CMIP6 models effectively captured the migration of the monsoon in present-day (PD), showing a pattern correlation coefficient of 0.91, which represents an improvement over values reported in previous studies. Dividing the monsoon period into P1 (first primary peak; 33-41 pentad) and P2 (from P1 to the withdrawal; 42-50 pentad), the frequency and amount of weak to moderate precipitation rates are predominantly higher in P2, while the frequency and amount of moderate to extreme precipitation rates are notably higher in P1. The CMIP6 models project a significant increase in precipitation under a warming climate, accompanied by a longer duration due to earlier onset and delayed termination. Under the three GWLs, the projected precipitation frequency decreases below moderate precipitation rates, while it significantly increases above strong precipitation rates. Additionally, the precipitation tendencies in both P1 and P2 are similar to those of the total period, with significant changes evident at the 3.0 °C GWL. These precipitation changes are associated with an increase in precipitation amount above the 97th percentile and influence the future changes in the EASM under a warmer climate. 

How to cite: Sun, M., Sung, H. M., Kim, J., Lee, J.-H., Shim, S., and Byun, Y.-H.: Future projection of East Asian Summer Monsoon precipitation under 1.5°C, 2°C, and 3°C global warming levels, EGU General Assembly 2024, Vienna, Austria, 14–19 Apr 2024, EGU24-7608, https://doi.org/10.5194/egusphere-egu24-7608, 2024.

EGU24-7759 | Orals | AS1.18

What advances monsoon onset over India? 

Bidyut Bikash Goswami and Caroline Muller

In the monsoon regions, atmospheric convection is typically stronger over the oceans than over land. Rainfall over land is potentially affected by the dynamic response of the atmosphere to deep convection over the adjacent oceans. Here, we show, in the case of the Indian summer monsoon, that enhanced atmospheric deep convection over the Bay of Bengal ∼2 weeks before onset, advances monsoon onset over India. Since the sea surface temperature of the Bay of Bengal is already hot during spring, warm anomalies further enhance convection that drives a convergence of low-level winds. A part of this circulation response blows from central India to the Bay of Bengal. It paves the way for monsoon circulation over India and advances the onset of monsoon. We tested this hypothesis using an atmospheric model forcing it by warm sea surface temperature anomalies over the Bay of Bengal 10-15 days before monsoon onset.

How to cite: Goswami, B. B. and Muller, C.: What advances monsoon onset over India?, EGU General Assembly 2024, Vienna, Austria, 14–19 Apr 2024, EGU24-7759, https://doi.org/10.5194/egusphere-egu24-7759, 2024.

Locust infestation has been a serious threat to agriculture and its occurrence of locust infestation is closely related to the climate condition, especially drought. Because agriculture was the main economic activity of China in historical time, damages on agricultural produce due to locust infestation had been recorded continuously in national chronicles for more than 2000 year. In this study, we will utilize the locust infestation records in Chinese historical documents in 1358-1911 to form temporal and spatial series, perform statistical analyses and infer possible changes in East Asian monsoon climate during this period.

We will utilize the digitized meteorological record database in China, called REACHES (Reconstructed East Asian Climate Historical Encoded Series. See Wang et a., 2018, Nature: Scientific Data, 5, 180288), to extract locust records in 1358-1911 corresponding to Ming and Qing dynasties of China to perform analysis. In a previous study (Lin et al., 2020) we had shown that the locust infestation is closely related to the general drought condition in Qing dynasty (1644-1911). In the present study we expand the total period length to include Ming dynasty. We will perform time series analysis as well as spatial analysis to understand the relation of locust infestation and other climate variables.

Previous studies of locust infestation in East Africa by United Nations show that the movement6s of locust swarms are closely related to monsoon fronts. Our preliminary analysis shows that this also appears to be the case in the movements of East Asian locusts. Thus it is possible that we can use the locust infestation series to reconstruct past changes in East Asian monsoon climate.

How to cite: Wang, P. K.: Locust infestation in China in 1358-1911 and its relation with changes in East Asian monsoon climate, EGU General Assembly 2024, Vienna, Austria, 14–19 Apr 2024, EGU24-7856, https://doi.org/10.5194/egusphere-egu24-7856, 2024.

Seasonal prediction of East Asia summer monsoon rainfall (EASMR) is in great demand but remains challenging, because the relationships between the Asian monsoon system and precursors are nonstationary and exhibit significant decadal changes. The present study aims to 1) examine decadal variations of the relationships between the EASMR and predictors used in previous studies and 2) establish a new prediction model using a Bayesian dynamical linear model (DLM), which is capable of capturing the time-evolving relationships between the predictand and predictors whereas the conventional static linear model cannot.

Two predictors were selected previously to predict the EASMR. One is the sea level pressure tendency anomalies over the tropical eastern Pacific from late spring to early summer, which represents remote forcing related to ENSO and has a stable effect on EASMR throughout the analysis period. The other is the sea surface temperature anomaly difference between the northern Indian Ocean (IO) and the WNP during spring through early summer (called IOWPSST), which denotes local air-sea interaction that affects the WNP subtropical high. Results show that the IOWPSST has strong influence on EASMR during 1979 to 2003 (period 1), while from 2004-2017 (period 2) its connection to EASMR evidently weakens. This nonstationary relationship is due to the non-persistence of the enhanced WNP subtropical high during period 2, which is associated with the positive-to-negative phase transition of the Interdecadal Pacific Oscillation since ~2000.

A new prediction model was established using the two predictors with Bayesian DLM. The cross-validation method and a 9-yr independent forward-rolling forecast is applied to test the hindcast and actual forecast ability. Results show that the Bayesian DLM has higher hindcast/forecast skill and lower mean square error compared with static linear model, suggesting that the DLM has advantage in predicting EASMR and is a promising method for seasonal prediction.

How to cite: Xing, W., Han, W., and Zhang, L.: Improving the prediction of East Asia summer monsoon precipitation using a Bayesian dynamic linear model, EGU General Assembly 2024, Vienna, Austria, 14–19 Apr 2024, EGU24-8515, https://doi.org/10.5194/egusphere-egu24-8515, 2024.

The Siberian High (SH), an important atmospheric system over Eurasia, exhibits notable seasonality—forming in autumn and peaking in the boreal winter. Many previous studies have revealed the characteristics of the SH in its peak phase; however, the SH formation process remains unclear. This study examined the climatological characteristics of SH formation with a cumulative sea-level-pressure series over the Siberian region based on observational data. First, the SH formation dates were objectively detected in both the climatology (October 1, 55th pentad) and individual years. Then, the thermodynamic processes around SH formation were investigated based on these formation dates. The results indicated that, in the lower troposphere, an anticyclonic circulation dominates over the Eurasian continent after SH formation. In the middle troposphere, an anomalous northeast–southwest-oriented ridge and trough appear over upstream of the SH and the coast of Northeast Asia, respectively. In the upper troposphere, the subtropical westerly jet, with its entrance located over the SH, intensifies and migrates southward, accompanying the amplification of its secondary circulation that features downward (upward) motion over Siberia (south of the Tibetan Plateau). The combined effects of the jet-associated circulation, negative vorticity advection and cold advection associated with the ridge and trough, and diabatic cooling contribute to high-level convergence and large-scale subsidence over the SH area, thereby resulting in SH formation. Further diagnosis reveals that dynamic processes play a more important role in SH formation than the thermal processes do.

How to cite: Chen, L.: Processes and mechanisms of the initial formation of the Siberian High during the autumn-to-winter transition, EGU General Assembly 2024, Vienna, Austria, 14–19 Apr 2024, EGU24-8860, https://doi.org/10.5194/egusphere-egu24-8860, 2024.

EGU24-9447 | ECS | Posters on site | AS1.18

Role of Anthropogenic Forcing and Decadal Oscillations on the Delayed Withdrawal of Indian Summer Monsoon 

Aneesh Sundaresan, Tamás Bódai, Sivarajan Sijikumar, and Susmit Subhransu Satpathy

            The mean Indian summer monsoon (ISM) rainfall as well as the duration of monsoon spell have a profound impact on the agriculture practice in the country. Due to the recent increase in surface temperature, global circulation patterns exhibit considerable changes which also affects the characteristics of ISM. The present study aims to find out any long-term changes in the monsoon onset and withdrawal dates over different parts of India and the possible mechanisms behind it. During the last four decades, the trend analysis of ISM onset dates over south India and north-west (NW) India shows an early onset in both regions. However, the trends are statistically less significant. In the case of the monsoon withdrawal dates, trends over NW India and south India show a statistically significant delay of about 6 days/decade and 3.25 days/decade, respectively. As a result, the monsoon season over NW India and south India shows a lengthening of about 7.8 days/decade and 3.5 days/decade, respectively. During the withdrawal phase of the ISM, a stronger monsoon low-level jet and an enhancement of the ISM rainfall have been observed in recent decades. The enhancement in rainfall activity and the strengthening of the low-level jet in the withdrawal phase reaffirms the delayed withdrawal of the ISM in recent decades.

            The role played by factors such as Indian Ocean warming, Atlantic Multidecadal Oscillation (AMO) and Pacific Decadal Oscillation (PDO) on the ISM withdrawal is examined. The AMO has changed its phase from negative to positive in recent decades, particularly after about 1998, which might have played a key role in enhancing the meridional tropospheric temperature gradient. The stronger meridional tropospheric temperature gradient and the Eurasian surface warming observed in recent decades might played a key role in the delayed monsoon withdrawal over NW India. The CESM2 large ensemble data analysis shows that both the external forcing as well as the decadal phase shift of the AMO and PDO, favour the delayed withdrawal, while the latter plays a dominant role.

How to cite: Sundaresan, A., Bódai, T., Sijikumar, S., and Satpathy, S. S.: Role of Anthropogenic Forcing and Decadal Oscillations on the Delayed Withdrawal of Indian Summer Monsoon, EGU General Assembly 2024, Vienna, Austria, 14–19 Apr 2024, EGU24-9447, https://doi.org/10.5194/egusphere-egu24-9447, 2024.

EGU24-9454 | ECS | Posters on site | AS1.18

Trend and Variability in the Long-Term Relationship Between Eurasian Snow Cover and Indian Summer Monsoon Rainfall 

Dr Pushpa Pandey, Dr Michael Kunz, Dr Suneet Dwivedi, and Dr Bhupendra Nath Goswami

The predictability of Indian Summer Monsoon Rainfall at any given time period depends on the strength of its relationship with predictable drivers like the El Nino–Southern Oscillation (ENSO) that are known to undergo significant epochal variations. While the relationship between Eurasian snow cover fraction and Indian Summer Monsoon Rainfall has also shown a similar epochal variability in recent decades, its stationarity on centennial or longer timescales remains unknown. In the present work two indices of snow cover fraction have been unraveled, on the basis of the observed relationship between the dominant modes of Indian Summer Monsoon Rainfall variability and snow cover fraction over a period of 115 years (1901–2015), that encapsulate its spatio-temporal variability. It has been observed that the relationship between the snow cover fraction indices and Indian Summer Monsoon rainfall have a statistically significant increasing trend with a weak multidecadal variability superimposed on it, making significant positive correlation between the two highly probable in the coming decades. With snow cover fraction driving the North Atlantic Oscillation (NAO) that subsequently drives the Indian Summer Monsoon Rainfall variability, it has been demonstrated that the NAO plays a pivotal role in modulating the teleconnection between the Indian Summer Monsoon Rainfall and snow cover fraction on a multidecadal time scale.

Keywords: El Nino–Southern Oscillation, North Atlantic Oscillation

How to cite: Pandey, D. P., Kunz, D. M., Dwivedi, D. S., and Goswami, D. B. N.: Trend and Variability in the Long-Term Relationship Between Eurasian Snow Cover and Indian Summer Monsoon Rainfall, EGU General Assembly 2024, Vienna, Austria, 14–19 Apr 2024, EGU24-9454, https://doi.org/10.5194/egusphere-egu24-9454, 2024.

EGU24-10229 | ECS | Orals | AS1.18

Synchronization patterns of heavy rainfalls between North India and the Sahel Zone on daily timescales 

Felix Strnad, Kieran Hunt, Niklas Boers, and Bedartha Goswami

The dominant drivers of boreal summer precipitation variance in tropical and subtropical regions are the Asian and the North African Summer Monsoon. 
Despite extensive investigation into regional precipitation dynamics, the interaction between these monsoon systems remains hardly understood.
This study employs a complex climate network approach based on extreme rainfall events to uncover synchronously occurring heavy rainfall patterns. 
We identify a synchronization trend during the peak monsoon period in July, linking the rainfall in North India to that in the Sahel Zone.
Our findings indicate that La Ni\~na-like conditions in combination with the Boreal Summer Intraseasonal Oscillation (BSISO) foster the synchronization. 
The convective clouds are subsequently transported by an intensified tropical easterly jet toward North Africa, introducing unusual convection over the Sahel region.

How to cite: Strnad, F., Hunt, K., Boers, N., and Goswami, B.: Synchronization patterns of heavy rainfalls between North India and the Sahel Zone on daily timescales, EGU General Assembly 2024, Vienna, Austria, 14–19 Apr 2024, EGU24-10229, https://doi.org/10.5194/egusphere-egu24-10229, 2024.

EGU24-10455 | Orals | AS1.18

Monsoon precipitation biases in storm-resolving NextGEMS Earth System Models 

Simona Bordoni and Adrian M. Tompkins

Global Earth System Models at storm-resolving resolutions (SR-ESM, with horizontal resolutions of ~4km) are being developed as part of the nextGEMS collaborative European EU’s Horizon 2020 programme.  Within the Storms & Ocean theme, we are exploring how resolving convective storms, ocean mesoscale eddies, and air-sea interaction on these scales influences tropical circulations and associated precipitation, and their variability.

In this talk, we evaluate the representation of the characteristics of the wet season over core monsoon regions in these SR-ESM, which include assessment of the seasonal cycle of precipitation, the timing of monsoon onset and retreat, and the total accumulated precipitation. These existing biases are compared to those seen in CMIP6 models and  interpreted through the lens of both local and remote moist energy diagnostics based on modern theories of monsoons. Local diagnostics include relative moist static energy (MSE) defined as the difference between local and tropical-mean near surface MSE, which has been recently introduced as a simple measure of the lower and upper-level influences on convective stability and shown to correlate well with monsoon onset dates in both CMIP6 simulations (Bombardi and Boos 2021) and idealized aquaplanet simulations we have conducted. The influence of possible remote biases, such as those of extratropical origin, are explored through analysis of the equator-to-pole MSE gradient. This contrast is central to vertically integrated energy budget frameworks that link changes in monsoonal precipitation to changes in meridional energy fluxes, which in turn scale with the meridional near-surface MSE gradients under diffusive approximations. Biases in this gradient result in smaller or greater advection of low-level MSE into monsoon regions, hence resulting in wet or dry biases, respectively, in monsoonal rainfall.

How to cite: Bordoni, S. and Tompkins, A. M.: Monsoon precipitation biases in storm-resolving NextGEMS Earth System Models, EGU General Assembly 2024, Vienna, Austria, 14–19 Apr 2024, EGU24-10455, https://doi.org/10.5194/egusphere-egu24-10455, 2024.

EGU24-10696 | ECS | Posters on site | AS1.18 | Highlight

African monsoon changes in the Late Cenozoic from the climate modelling perspective 

Daniel Boateng and Sebastian G. Mutz

Africa's climate underwent significant hydroclimate changes in the Late Cenozoic. For instance, the repeated phases of aridification across the continent played a crucial role in shaping the region’s biodiversity and hominid evolution. Consequently, understanding the historical climate variations in the region becomes essential for reconstructing its paleoenvironment and paleobiological history. Moreover, past climates can be used as analogues for potential future climates and thus help us understand the implications of future climate scenarios. The precipitation seasonality and variability in the region are predominantly driven by the African monsoons, which exhibit intricate climate dynamics controlled by both regional and large-scale atmospheric teleconnections. However, due to the complexity of these dynamics and teleconnections, even state-of-the-art General Circulation Models (GCMs) still struggle to accurately reconstruct its past climate variability and provide reliable future projections.

Here, we simulate the response of the African monsoons to different late Cenozoic paleoenvironmental changes, such as atmospheric CO2 concentration (pCO2), orbital forcing, palaeogeography, vegetation, and orography (including the topographic evolution of the East African Rift System (EARS)). We performed time-specific simulations with a high-resolution setup of the GCM ECHAM5-wiso and the paleoenvironmental boundary conditions for the Middle Miocene climate optimum (MMCO; 16.9-14.7 Ma), Middle Miocene climate transition (MMCT; 14.7-13.8 Ma), Mid-Pliocene (MP; ~3 Ma), the Last Glacial Maximum (LGM; ~21 ka), the Mid-Holocene (MH; ~6 ka), and the pre-industrial (PI; the reference year 1850).

Furthermore, we conducted topographic sensitivity experiments of the EARS under the MMC and MMCT conditions to understand the role of tectonics in the evolution of Africa’s climate and atmospheric dynamics. We focused our analysis on disentangling the thermodynamic effects (e.g., water vapour content changes) and dynamic effects (e.g., Hadley circulation) on the monsoon changes and associated atmospheric dynamics (e.g., African Easterly Jet, Somalia Jet, Tropical Easterly Jets, low-level westerlies). Overall, the study provides an overview of hydroclimate and climate dynamics changes over Africa for the past 20 Ma, contributing to the understanding of the feedback between changes in pCO2, orbital forcing, and tectonic events that are relevant for improving future climate prediction.

How to cite: Boateng, D. and G. Mutz, S.: African monsoon changes in the Late Cenozoic from the climate modelling perspective, EGU General Assembly 2024, Vienna, Austria, 14–19 Apr 2024, EGU24-10696, https://doi.org/10.5194/egusphere-egu24-10696, 2024.

EGU24-10904 | ECS | Posters on site | AS1.18

Future changes in the South American Monsoon System and its consequences over south-eastern Peru 

Santos J. González-Rojí, Martina Messmer, Christoph C. Raible, and Thomas F. Stocker

Tropical regions in South America are characterized by rich biodiversity, diverse climatic zones and heterogenous weather. This heterogeneity is caused by the South American Monsoon System (SAMS) and the atmospheric low-level jets (LLJ). Both atmospheric circulation features have a critical role in the distribution of moisture and precipitation. The regions located where the rainforest meets the Andes are highly affected by these LLJs. One example is the department of Madre de Dios, located in south-eastern Peru. Its economy and the well-being of the population are highly dependent on natural resources provided by the ecosystem. Hence, understanding how the SAMS and the associated LLJs will change under global warming is important for water management in the region. To investigate the climate change signals, we employ the Weather Research and Forecasting model (WRF; version 3.8.1) at convection-permitting scales (up to 1 km). Two 30-year periods of a global climate simulation are dynamically downscaled for the present (1981–2010) and the future (2071–2100). Thereby, we consider the mitigation scenario representative concentration pathway (RCP) 2.6 and the high-emission scenario RCP8.5.

The validation of the simulation for the present period indicates that while precipitation amounts fall within the range of observational datasets such as PISCO or CHIRPS, a cold bias is found from April to July compared to ERA5 or CRU. The bias in temperature is potentially caused by biases in the driving global climate simulations and by the difference in land elevation between WRF and observational datasets.

The comparison of present and future simulations shows changes in both temperature and precipitation in Madre de Dios. The climate projections indicate an increase in temperature of 1 and 3 °C under the RCP2.6 and RCP8.5 scenarios, respectively. Precipitation is projected to overall decrease in Madre de Dios. During the rainy season from September to April, the average decrease is 5 and 12 % under the RCP2.6 and RCP8.5 scenarios, respectively. During the dry season from May to August, the rain is reduced by more than 50 % in both scenarios. The general reduction in precipitation seems to be related to the changes in the SAMS under climate change, which include a less intense Bolivian High during the peak months of December and January (particularly in RCP8.5), a less intense Chaco Low in February, and a more intense Atlantic Tropical High that extends much further into the continent in both climate scenarios from April to August. These changes reduce the occurrence of LLJ events under both climate scenarios, and consequently, affecting precipitation east of the Andes.

How to cite: González-Rojí, S. J., Messmer, M., Raible, C. C., and Stocker, T. F.: Future changes in the South American Monsoon System and its consequences over south-eastern Peru, EGU General Assembly 2024, Vienna, Austria, 14–19 Apr 2024, EGU24-10904, https://doi.org/10.5194/egusphere-egu24-10904, 2024.

EGU24-11517 | ECS | Orals | AS1.18

Distinct response of Asian summer precipitation and monsoon circulation to orbital forcing during Heinrich events 

MingQiang Liang, Qiuzhen Yin, Yong Sun, Chao Zhang, Zhipeng Wu, and Wei Liu

Climatic fingerprint of Heinrich (H) events was characterized by widespread megadroughts over the Asian monsoon region, accompanied by a systemic weakening of Asian summer monsoon. However, recent hydroclimate proxies suggest that South China experienced increased precipitation contrasting with the prevalent megadrought conditions during the Heinrich events. Our simulations performed with the HadCM3 model show that changes in insolation alone can induce spatiotemporal discrepancies in precipitation over the Asian summer monsoon region. During the H1, 3, 4, 5, 6 events, the amplification of the land-sea pressure contrast in response to a positive solar insolation gradient during boreal summer intensifies moisture transport from the ocean to the Asian monsoon region. The ensuing moisture divergence, combined with anomalous downdrafts, results in decreased precipitation in the South Asian Summer Monsoon (SASM) region, but converse situation for the East Asian Summer Monsoon (EASM) region. During the H2 event, the increased precipitation across the Yangtze River Valley sharply contrasts with the widespread drought over the ASM region. This is attributed to an enhancement of a southerly warm-moist vapor transport along the western edge of the subtropical Western North Pacific anticyclone and an enhancement of a northerly cold-dry vapor transport along the western edge of the Aleutian cyclone, which converge over the Yangtze River Valley. Our results further show an in-phase relationship between the SASM and EASM circulation strengths in response to orbital forcing. This is driven by the combined influence of the land-sea thermal contrast and the migration of the Intertropical Convergence Zone, supporting Kutzbach's hypothesis.

How to cite: Liang, M., Yin, Q., Sun, Y., Zhang, C., Wu, Z., and Liu, W.: Distinct response of Asian summer precipitation and monsoon circulation to orbital forcing during Heinrich events, EGU General Assembly 2024, Vienna, Austria, 14–19 Apr 2024, EGU24-11517, https://doi.org/10.5194/egusphere-egu24-11517, 2024.

EGU24-11919 | ECS | Orals | AS1.18

Impact of Hindu Kush Himalayan snow cover change on Monsoon Circulation 

Manuel Tobias Blau, Pratik Kad, Jenny V. Turton, and Kyung-Ja Ha

Mountain snow cover is an integral part of our climate system that impacts ecosystems and the biosphere that rely on river systems. In recent years, the Hindu Kush-Himalayan regions have experienced a significant decline in snow cover, which is primarily attributed to global warming. However, understanding the nonlinear trends associated with these changes remains a challenge. Here, we explore the relationship between snow cover change and monsoon dynamics within the context of a changing climate, specifically examining the role of land-atmosphere interaction. The study's findings reveal a clear connection between the declining snow cover and monsoon circulation, which is explained through multiple models and grounded in mean state changes. This result highlights the crucial role of snow cover in the dynamics of monsoon.

How to cite: Blau, M. T., Kad, P., Turton, J. V., and Ha, K.-J.: Impact of Hindu Kush Himalayan snow cover change on Monsoon Circulation, EGU General Assembly 2024, Vienna, Austria, 14–19 Apr 2024, EGU24-11919, https://doi.org/10.5194/egusphere-egu24-11919, 2024.

Although the South American monsoon (SAM) is the main source of precipitation over most of the continent, the effects of anthropogenic climate change on it remain unclear. Most recent projections from CMIP6 multimodel ensembles show very weak signal of total SAM precipitation change, and sometimes climate change information from different sources seems confusing and contradictory for the public and decision makers. As SAM affects the most populated areas and those with largest contribution to agricultural production and hydroelectric power generation, its future behavior should be clearly detailed and supported by a dynamical framework able to explain it, so as to better serve decision-makers in planning actions to respond to climate change and adopt effective policies for climate adaptation.

The existence of a dynamic framework that explains the major climate changes projected by the best-performing models gives coherence to the different monthly changes throughout the monsoon season, which otherwise seem incomprehensible and can lead to discrepant interpretations if not understood within a correct dynamic context. The lack of significant future change in total monsoon precipitation does not mean that there are no changes of great interest in different phases of the monsoon season.

There are two aspects that prompted the approach of the present study: i) model projections of future SST indicate an El Niño-like warming pattern in the central-east equatorial Pacific; ii) the impacts of the present climate El Niño events on South America (SA) display a tendency to spring-summer reversal of precipitation anomalies in central-east SA (CESA), which results in little or no change in the total monsoon precipitation in this region.

Twelve CMIP6 selected models were evaluated not only for their simulation of South American climatology, but also for their simulation of ENSO and its impacts on SA. Several of them did not produce satisfactory ENSO. The changes projected by the ensemble of seven models that best reproduced ENSO and the climatology of SA indicate a more EN-like future climate. Consistently, the main climate changes projected for the SAM resemble the observed EN impacts, remarkably including the tendency to spring-summer reversal of precipitation anomalies in CESA, from dryer spring to wetter summer. While the total monsoon precipitation shows little or no change in this region, there is reduction of early monsoon rainfall and increase of the peak season rainfall, which results in a delay and shortening of the monsoon season. The dynamical effect of the EN-like SST changes shapes the spring response via teleconnection, and thermodynamical processes trigger the changes from spring to summer in CESA, which is part of the core monsoon region. Also coherently with EN impacts, drier conditions prevail in central-northern-eastern Amazon throughout the monsoon season thanks to changes in the Walker circulation, while in southeast SA, precipitation increases due to tropics-extratropics teleconnection.

The changes projected by the all-model ensemble are much weaker and confusing. This clear description of climate change throughout the monsoon season and its connection with intensified EN effects is easy to understand and use, as these effects are reasonably known.

How to cite: Grimm, A. M. and Padoan, D.: Towards robust and actionable information on monsoon climate change in South America, EGU General Assembly 2024, Vienna, Austria, 14–19 Apr 2024, EGU24-13343, https://doi.org/10.5194/egusphere-egu24-13343, 2024.

A weak Indian summer monsoon (ISM) strengthens an El Niño via generating a cyclonic circulation over the northwestern Pacific. The westerly anomaly on the southern flank of this cyclone generates eastward anomaly in the mixed layer, induces warm zonal advection, and excites oceanic downwelling Kelvin waves, deepening the thermocline in equatorial eastern Pacific and resulting in cold vertical advection. The influence of monsoon-induced Pacific wind anomaly on ENSO is mainly achieved by changing the zonal advective feedback and thermocline feedback. CMIP6 models show a large diversity for the impact of ISM on ENSO, related to the diverse amplitudes of ISM among the models. Models simulating a stronger ISM display more robust features of ISM-induced anomalous circulation over the northwestern Pacific, and the larger equatorial wind anomalies on the south flank of the anomalous circulation affect ENSO evolution more significantly by causing stronger ocean-atmosphere coupling processes.

       The future changes in the ISM’s impacts on ENSO also exhibit a large spread among the CMIP6 models. The uncertainty in the projections is linked to the diverse changes in the response of anomalous circulation over the northwestern Pacific to ISM. The models showing an increased (decreased) sensitivity of anomalous circulation over the northwestern Pacific to ISM simulate enhanced (weakened) ISM’s impacts on ENSO under global warming, even though the amplitudes of ISM remain unchanged

How to cite: Yang, S., Lin, S., and Dong, B.: Dynamical Processes of the Impact of Indian Summer Monsoon on ENSO: Observation, Model Simulation and Future Change, EGU General Assembly 2024, Vienna, Austria, 14–19 Apr 2024, EGU24-13998, https://doi.org/10.5194/egusphere-egu24-13998, 2024.

The interannual variability (IAV) of All India summer rainfall (AIMR) is low, with a Coefficient of variation (COV) around 9% of the long-term mean. Though regulated by global and regional sea surface temperatures, we explore the cause of low COV of AIMR due to the spatial distribution of rainfall. We find that the variability of AIMR is affected by the spatial covariance between the subregions with different rainfall characteristics, such as the arid western and wet northeast regions. By removing regions, one at a time, from the Indian region, we find that COV increases after removing the Northeast (NE) region due to negative covariance between NE and other sub-regions of India, especially Central India (CI). Further research is ongoing to explore the moisture distribution over the subregions and understand the negative covariance using a moisture tracking algorithm. We plan to investigate the contributions to rainfall distribution from oceanic and terrestrial sources. This study may reveal how the spatial distribution of rainfall influences the IAV of AIMR, emphasizing the significance of terrestrial and oceanic moisture contributions.

How to cite: Chandel, V. and Ghosh, S.: Role of spatial covariance in regulating interannual variability of Indian Summer Monsoon rainfall, EGU General Assembly 2024, Vienna, Austria, 14–19 Apr 2024, EGU24-14603, https://doi.org/10.5194/egusphere-egu24-14603, 2024.

The pattern of Monsoon rainfall across the Ganga-Brahmaputra-Meghna (GBM) basin is crucial for supporting various farming and ecological systems and play a significant role in affecting the basin’s food-water security, well-being, and prosperity. However, the understanding of Monsoon activity is limited due to the poor representation of large-scale processes in the climate models and their coarser resolution. This study utilises sub-daily precipitation from finer resolution CMIP6 HighResMIP models to study the changes in properties of monsoon rainfall based on the timing (onset/offset/duration) of the Monsoon and the trend in rainfall (total and extreme rainfall). All models show a delay in the monsoon but there is disagreement in trends in retreat and duration of the monsoon. Also, CMCC models project a decline in magnitude of rainfall whereas NERC models project an increasing trend. The models output is also evaluated against the reference datasets like MSWEP and ERA5 reanalyses. Our study highlights the uncertainty in climate models to capture the monsoon rainfall and disagreements in results across different horizontal resolutions and nature of models. Importantly, the delay in future Monsoon supported by all models have a strong implication on agriculture and economy of the delta.

How to cite: Ali, H. and Fowler, H.: Understanding the future Monsoon activity across the Ganga-Brahmaputra-Meghna basin using CMIP6 HighResMIP models  , EGU General Assembly 2024, Vienna, Austria, 14–19 Apr 2024, EGU24-15435, https://doi.org/10.5194/egusphere-egu24-15435, 2024.

EGU24-15851 | ECS | Posters on site | AS1.18 | Highlight

Monsoon Planet: Studying Monsoon Dynamics in an Idealized Setup 

Anja Katzenberger, Stefan Petri, Georg Feulner, and Anders Levermann

Monsoon systems transport water and energy across the globe, making them a central component of the global circulation system. Each monsoon system has its own regional characteristics ranging from particular continental shapes to dynamic vegetation patterns and the influence of mountain ranges. This individuality makes it difficult to access the common core meridional monsoon dynamics by only using observations or realistic simulations. Idealized frameworks have proven to be useful approaches to study monsoon systems with regard to their commonalties. Here, we present the latest insight of our work on the Monsoon Planet – an aquaplanet setup with an idealized circumglobal land stripe.

How to cite: Katzenberger, A., Petri, S., Feulner, G., and Levermann, A.: Monsoon Planet: Studying Monsoon Dynamics in an Idealized Setup, EGU General Assembly 2024, Vienna, Austria, 14–19 Apr 2024, EGU24-15851, https://doi.org/10.5194/egusphere-egu24-15851, 2024.

EGU24-16112 | ECS | Posters on site | AS1.18

The impacts of northern hemisphere high-latitude climate on northeastern Australian summer monsoon evolution during the Holocene 

Ge Shi, Hong Yan, Wenchao Zhang, John Dodson, Henk Heijnis, and Mark Burrows

Influenced by the northern hemisphere high-latitudes, many of the millennial-centennial scale climate changes originating in the North Atlantic have been detected even in southern hemisphere. However, the linkage between hemispheres on orbital-suborbital time scales has not been firmly examined due to the absence of records from the Southern Hemisphere. Here we present such a record from Bromfield Swamp in tropical northeastern Australia. The Australian Summer Monsoon index (AuSMI) of the last 13.5 ka was reconstructed basd on the principal component analysis (PCA) of five proxies, the Rb/Sr, Ti/Ca, Al/Ca, mean grain size and organic content. The results reflected a weak AuSM influence during the Bolling-Allerod event and with a somewhat stronger influence during the YD event. During the Holocene, there was a decreasing AuSM before ~7.8 cal kyr BP, and then it enhanced from middle to late Holocene. The AuSM change was out of phase/ in phase with the East Asian summer monsoon/ East Asian winter monsoon during the Holocene, and all of them changed parallel with the northern-southern hemisphere temperature gradient. This implied the dominance of interhemispheric thermal contrast to the highly coupled East Asian-Australian monsoon changes, by modulating the Intertropical Convergence Zone migration, which was influenced by the retreat of northern hemisphere ice sheet from early to middle Holocene and the local summer insolation changes during the late Holocene. The study highlights the likelihood that high latitude northern hemisphere played a major role in the evolution of the northeastern Australian summer monsoon.

How to cite: Shi, G., Yan, H., Zhang, W., Dodson, J., Heijnis, H., and Burrows, M.: The impacts of northern hemisphere high-latitude climate on northeastern Australian summer monsoon evolution during the Holocene, EGU General Assembly 2024, Vienna, Austria, 14–19 Apr 2024, EGU24-16112, https://doi.org/10.5194/egusphere-egu24-16112, 2024.

Tropical and subtropical precipitation impact millions of people via agriculture and rainfall driven disasters. However, a wide spread remains in future regional projections of low-latitude precipitation, dominated by uncertain shifts in rainfall, and models continue to show a variety of biases in the location and intensity of rain.

The Energy Flux Equator framework has emerged as a powerful tool in interpreting the location of low-latitude rainfall via atmospheric heat transport (AHT), which in turn can be understood through the top of atmosphere and surface energy fluxes. Recent work using a novel decomposition of the zonal-mean AHT suggests that its spatial structure is dominated by the meridional structure of the latent heat flux. Here, we apply this decomposition to investigate intermodel differences in AHT on the seasonal timescale.

We find that throughout the year, intermodel differences in total AHT and the latitude of maximum zonal mean precipitation both correlate strongly with the heat transport contribution attributed to evaporation. Curiously, spatial regressions appear to suggest that evaporation over land provides a key contribution to this spread, despite the net surface heat flux over land being close to balanced. To interrogate the causality underlying this correlation with land evaporation, we make use of the 1pctCO2-bgc simulations, in which only the carbon cycle responds to increasing carbon dioxide, with one consequence being altered evapotranspiration.

How to cite: Geen, R., Laguë, M., and Fajber, R.: Exploring the role of evaporation in atmospheric heat transport and seasonal low-latitude precipitation biases in CMIP6, EGU General Assembly 2024, Vienna, Austria, 14–19 Apr 2024, EGU24-16770, https://doi.org/10.5194/egusphere-egu24-16770, 2024.

In a retrograde Earth simulation using the fully coupled MPI-ESM, we find that the climate in the Sahara goes from arid to monsoonal. By understanding this transition of the Sahara, we can gain insights into some of the key processes necessary for the existence of monsoons. We find that theories of monsoons based on land-sea thermal contrast and meridional shifts in the interhemispheric convergence zone (ITCZ) are not adequate to explain this change in the climate of the Sahara. Hence, we use the energetics of monsoons, which is based on local moist static energy and moisture budgets. In the regular forward-rotating Earth, the net energy input into the atmospheric column (NEI) is negative over the Sahara, implying a net energy import over the region. The reversed winds in the retrograde simulation advect moisture from the Arabian Sea and the equatorial Atlantic into the Sahara during the boreal summer. The greenhouse effect of water vapor instantaneously reduces the outgoing longwave radiation, thereby increasing the NEI. As NEI becomes positive, the Sahara exports energy, increasing convection (and, hence, monsoon precipitation). The increased cloud cover further enhances NEI through cloud radiative feedback, strengthening the monsoon. Therefore, we conclude that the radiative effects of water vapor and clouds are an essential ingredient for monsoons.

How to cite: Jalihal, C. and Mikolajewicz, U.: The role of water vapor and cloud radiative effects in monsoons: Perspectives from retrograde Earth simulation, EGU General Assembly 2024, Vienna, Austria, 14–19 Apr 2024, EGU24-16987, https://doi.org/10.5194/egusphere-egu24-16987, 2024.

EGU24-17834 | ECS | Orals | AS1.18

Onset Periods: a novel approach to understand the onset of the monsoon season 

Marcia Zilli, Neil Hart, and Francesca Morris

In recent decades, several studies have proposed different methodologies to reliably identify the onset of the rainy season in monsoon climates, considering either a single variable, usually precipitation, or a combination of rainfall with other dynamic and thermodynamic variables (e.g. wind, specific humidity). These methodologies tend to define a single onset date, which can fail to diagnose critical characteristics of early season rainfall such as wet/dry spell phasing and intensity. Here, we propose a novel approach to identify the transition from dry to wet seasons as a period (6-8 weeks on average) with a positive gradient of the FFT-filtered precipitation, indicative of a steady increase in rainfall. This approach allows the characterisation of critical onset period rainfall characteristics, including information about wet and dry spell frequency and total precipitation, which is a valuable advance on typical single-date onset methods. Preliminary results considering observational and reanalysis datasets indicate a good agreement between the onset day identified using a traditional methodology and the onset periods over South America and Africa. A more in-depth analysis of the identified onset periods can provide further insights into the role of intraseasonal and interannual variability on the precipitation regimes. We also identified regions with distinct changes in the onset periods timing and related precipitation characteristics when considering present and future climate simulations, including simulations using convective-permitting models. For example, the method is able to distinguish that parts of eastern Brazil are projected to have a later onset period with more intense wet days, whereas in eastern Amazon the key signal is more dry days during the onset period, leading to a weaker intensity of onset. In addition to identifying the rainy season onset periods, this approach also identifies other onset periods, further classified as false onset (interval with positive filtered precipitation gradient followed by the onset period), second onset (interval with a secondary increase in the filtered precipitation gradient after the onset period), or wet spells (occurring during the dry season). These periods provide valuable information about spells of increased precipitation outside the rainy season onset, such as wet spells during the dry seasons or false onsets before the primary rainy season. When recurrent, they can indicate the influence of interannual or intraseasonal variability in off-season precipitation. As the core statistics that emerge from this approach are related to the intensity and phasing of rainfall rather than absolute amounts, future developments will focus on implementing the method in a seasonal forecast system, where only a few months of data are available, with the potential to obtain forecast skill which circumvents absolute rainfall biases.

How to cite: Zilli, M., Hart, N., and Morris, F.: Onset Periods: a novel approach to understand the onset of the monsoon season, EGU General Assembly 2024, Vienna, Austria, 14–19 Apr 2024, EGU24-17834, https://doi.org/10.5194/egusphere-egu24-17834, 2024.

EGU24-18707 | ECS | Orals | AS1.18

Role of Dynamical and Thermodynamical processes in shaping Diurnal Cycle of Rainfall over the Western Ghat of India 

Utkarsh Verma, Samir Pokhrel, and Subodh Kumar Saha

Diurnal Variability is one of the most fundamental modes of the global climate system arising from solar radiation variations. The precipitation over the Indian subcontinent region has significant diurnal variation as per the topographical settings of the landmass. Among the various regions with the maximum diurnal amplitude (MDA) of precipitation over India, MDA over Western Ghat (WG) is perfectly aligned along the coastal boundary.

The peculiarity of the WG region is the position of the coastally aligned mountain range stretching from Gujarat to Kerala with an average elevation of 1200m and during monsoon season with the presence of speedy low-level jet (LLJ), this range acts as a barrier to anchor precipitation over them. The MDA over this region tends to be positioned slightly inland, on the windward side of the hills and is closely associated with the geographic locations of mountain peaks over WG. Here we have attempted to understand the phase and amplitude of diurnal precipitation variation on two distinct physical regimes predominantly governed either by dynamics (DR) or thermodynamics (TR). Based on the speed of the (LLJ) we have identified 370 and 458 days from the monsoon season of 21 years, with dominant physical processes being dynamical and thermodynamical respectively. We found a substantial enhancement of MDA over the entire span of the WG region encompassing the region over the sea, coast, and land during TR which is in stark contrast to DR where MDA is concentrated mostly over the coastal side northern and central western Ghat region. This difference is also visible in the diurnal phase with gradual (abrupt) changes in TR (DR). During TR the weakened LLJ leads to the local thermodynamics to dominate, and very strong land and sea breezes are initiated, along with an unstable hot and humid boundary layer making favorable conditions for diurnal precipitation to take place. This is entirely different in DR wherein the stronger LLJ does not allow to establish a stronger temperature gradient between land and ocean leading to a lessening of diurnal rain. The storm-top height indicates the presence of low-level congestus (deep congestus) clouds during DR (TR). Thus, the diurnal rain, along with cloud types and involved microphysics is totally different in these two physical regimes. This study will be very useful for identifying the errors in the diurnal rain simulated by models segregated by dynamical or thermodynamical processes separately.

How to cite: Verma, U., Pokhrel, S., and Saha, S. K.: Role of Dynamical and Thermodynamical processes in shaping Diurnal Cycle of Rainfall over the Western Ghat of India, EGU General Assembly 2024, Vienna, Austria, 14–19 Apr 2024, EGU24-18707, https://doi.org/10.5194/egusphere-egu24-18707, 2024.

EGU24-19848 | Posters on site | AS1.18

Mid-Latitude Controls on Monsoon Onset and Progression (the MiLCMOP project) 

Andrew Turner, Ambrogio Volonte, Akshay Deoras, and Arathy Menon

The monsoon onset typically starts in southern India by 1 June, taking around 6 weeks to cover the country.  During the monsoon, intraseasonal variations give rise to active and break periods in the rains.  Being able to better predict the monsoon onset, its progression, and active and break events would be of great interest to society.  The onset timing is already known to be influenced by tropical intraseasonal variability, but new research has shown that the mid-latitudes exert a powerful control, the full extent of which is not properly quantified or understood. 

The MiLCMOP project aims to answer the following: (1) How are the pace and steadiness of monsoon progression affected by interactions with the extratropics? (2) What are the mechanisms of extratropical control on monsoon progression and variability? (3) How do the causal extratropical and tropical drivers of monsoon progression offset or reinforce each other? 

Our initial work has tested a new hypothesis that monsoon progression can be described as a “tug-of-war” between tropical and extratropical airmasses.  This “tug-of-war” is unsteady, with a back and forth of the two airmasses before the moist tropical flow takes over for the season.  We demonstrate this for a case study of the 2016 season for India, while also drawing analogies with other monsoon regions, such as for the East Asian monsoon, in which we show the competition between extratropical and tropical flows in establishing the Mei Yu front as it progresses across China.

Current activities revolve around the identification of statistical relationships between monsoon onset and progression and perturbations to the subtropical westerly jet, including blocking anticyclones, meridionally propagating troughs and cyclonic features near the Tibetan Plateau.  Additional focus is also devoted to the relationship between the monsoon advancement and the strength, extent and orientation of the intrusion of mid-tropospheric dry air flowing towards India from westerly and northwesterly quadrants.

Other methods will include use of vorticity budgets and Lagrangian feature tracking in case studies of fast and slow onsets, to suggest the dominant mechanisms by which extratropical drivers affect monsoon onset and progression.  Model experiments will help isolate these mechanisms.  Finally, novel causal inference techniques will help disentangle the effects of extratropical drivers from those in the tropics. 

How to cite: Turner, A., Volonte, A., Deoras, A., and Menon, A.: Mid-Latitude Controls on Monsoon Onset and Progression (the MiLCMOP project), EGU General Assembly 2024, Vienna, Austria, 14–19 Apr 2024, EGU24-19848, https://doi.org/10.5194/egusphere-egu24-19848, 2024.

The Himalayas is the main water source for two major river systems in South Asia, the Ganges and the Brahmaputra. Rivers from this region are predominately fed by precipitation associated with the Indian Summer Monsoon (ISM) which is variable and influenced by large-scale atmospheric circulation patterns and anomalies, where El Niño-Southern Oscillation (ENSO) plays a dominant role. Here, we use a causal discovery method to assess the relationships and causal links associated with the influence of ENSO on ISM precipitation over the Himalayas, and how this is regulated by the Walker and Hadley circulation cells. In particular, we aim to clarify the direction and strength of causal linkages involving four time series/ indices representing ENSO, the Walker circulation, the monsoon Hadley circulation, and  summer monsoon Himalayan precipitation.   Apart from ENSO data, which is available for a longer period, the rest other data are from ERA5 that cover longer records, starting from 1940 to 2022. We demonstrate that the influence of ENSO on Himalayan precipitation mediated by the circulation dynamics can be quantified on monthly timescales (i.e., at few months lag). Starting from the two-way interaction between two parameters, we increased the complexity of the causal effect network analysis in steps and finally ended with all four indices. Our results show that it is possible to identify causal links with corresponding time delays and the links are moderately robust in most cases. Our findings also indicate that the influence of ENSO on the regional summer monsoon Hadley cell can arise via the pathways of regional Walker cell in the Himalayan sector. Improving our understanding of Himalayan precipitation and relevant regulatory mechanisms play an important role in India’s socioeconomic structure though it is still a neglected area compared to the vast amount of research those focused on all India rainfall. Our analyses using the sophisticated approach of causal network analyses will advance our knowledge on ISM and complement the gap.

How to cite: Muszynski, G., Orr, A., and Roy, I.: Using a causal discovery approach to analyse linkages among ENSO, circulation fields, and summer monsoon precipitation over the Himalayas, EGU General Assembly 2024, Vienna, Austria, 14–19 Apr 2024, EGU24-20701, https://doi.org/10.5194/egusphere-egu24-20701, 2024.

EGU24-778 | ECS | Posters on site | AS1.19

The Record-Breaking Precipitation Event of December 2022 in Portugal: Synoptic Background 

Tiago Ferreira, Ricardo M. Trigo, Alexandre M. Ramos, Tomás Gaspar, and Joaquim G. Pinto

Extreme precipitation over western Iberia is mostly concentrated in the winter half-year. While relatively rare, intense precipitation events can disrupt and are often associated with major human, social and economic damages. Most of the time these extreme precipitation events are triggered by intense extratropical cyclones and associated frontal systems. However, in the last decade a number of studies have shown the important role played by Atmospheric Rivers (ARs) in the occurrence of extreme precipitation events in western Europe, particularly in the Iberia Peninsula.

In this study we analyse the all-time 24h record-breaking precipitation values recorded in Lisbon, Portugal between the 12 and 13 December 2022 in terms of the synoptic background. We obtained a comprehensive synoptic characterization of the atmospheric circulation between the 1st and 15th of December, considering a wide range of meteorological fields, such as vertically integrated water vapor flux, sea level pressure, geopotential height and divergence at the 850 hPa isobar, divergence at the 200 hPa, vertical velocity at the 500 hPa and temperature and specific humidity at 900 and 600 hPa.

Results show that on the 8 December by 06 UTC an extratropical cyclone was present in the middle of the North Atlantic, with a high moisture content and that by 18 UTC on the following day a cut-off low was formed in the northwest Atlantic. This cut-off system was well characterized by relatively high vertical velocities and convergence at the low levels, combined with high rates of evaporation acquired over the Gulf Stream, intensifying the moisture content to its south side. Both systems converged on 10 December by 12 UTC and by the 18 UTC the algorithm detected an AR located southward of the extratropical cyclone. The combination between high IVT values, with maxima ranging between 947 kg m-1 s-1 and 1227 kg m-1 s-1, with a dynamical component characterised by winds above 20 m/s, as well as a suitable vertical motion, allowed the system to evolve and maintain the AR characteristics for 72 h. The AR progressed towards Iberia, affecting Portugal and central Spain as an extreme AR event, leading to the 24h precipitation record of 134.6 mm measured at the Geophysical Institute in Lisbon, the highest value since continuous measurements started in the 1860. The previous record was registered on the 18 February 2008, with a value of 118.4 mm.

This work was supported by the Portuguese Science Foundation (FCT) through the project AMOTHEC (DRI/India/0098/2020) with DOI 10.54499/DRI/India/0098/2020 and also through national funds (PIDDAC) – UIDB/50019/2020. Tiago Ferreira was supported by FCT through PhD grant UI/BD/154496/2022.

How to cite: Ferreira, T., M. Trigo, R., M. Ramos, A., Gaspar, T., and G. Pinto, J.: The Record-Breaking Precipitation Event of December 2022 in Portugal: Synoptic Background, EGU General Assembly 2024, Vienna, Austria, 14–19 Apr 2024, EGU24-778, https://doi.org/10.5194/egusphere-egu24-778, 2024.

One of the challenges in climate change studies is understanding the moisture source, oceanic or terrestrial, responsible for the recent increase in global land precipitation evident by ERA-5 reanalysis data.  To explain the moisture source responsible for increase in the land precipitation we have used the d-excess value of precipitation which distinctly inherits the signature of various processes in the hydrological cycle and has been widely used for the validation of general circulation models. We created a global monthly time series of d-excess value (1978-2021) using precipitation isotope data (n= 62,665) from 913 sites. Since 1996, the enigmatic surge in the d-excess value aligns with the rise in the global land precipitation which cannot be explained by the already known moisture source of the global water cycle. Such a huge spike in d-exces value suggests an increase in contribution from the terrestrial moisture, especially from the evaporation of irrigated groundwater, a component which was not considered in the global hydrologic cycle. To feed the growing population, introduction of multiple cropping seasons and a decrease in the frequency of global land precipitation led to an increase in the groundwater-dependent agricultural practice. Previous studies have shown that the extraction of groundwater for irrigation is so huge and significant that it has been held responsible for global sea level rise  and drift of Earth’s rotation axis. In Spite of that, the remotely sensed data and land surface models partition the moisture sources of water cycle in the various components; such as transpiration, open water evaporation,  canopy interception, bare soil evaporation and  snow sublimation, however, never considered the coupling of groundwater with atmosphere. Therefore, to understand the global hydrological cycle, the moisture and energy exchange between groundwater and atmosphere, via evaporation of irrigated water, should be considered. Here, the enigmatic rise in d-excess value, equivalent to glacial-interglacial scale variation, signifies human domination in the global hydrological cycle.


How to cite: Ajay, A. and Sanyal, P.: Coupling of Groundwater with Atmosphere: A New Anthropogenic Component in the Global Hydrological Cycle, EGU General Assembly 2024, Vienna, Austria, 14–19 Apr 2024, EGU24-963, https://doi.org/10.5194/egusphere-egu24-963, 2024.

EGU24-1442 | ECS | Orals | AS1.19

Extreme atmospheric rivers in a warming climate 

Shuyu Wang, Xiaohui Ma, Shenghui Zhou, Lixin Wu, Hong Wang, Zhili Tang, Guangzhi Xu, Zhao Jing, Zhaohui Chen, and Bolan Gan

Extreme atmospheric rivers (EARs) are responsible for most of the severe precipitation and disastrous flooding along the coastal regions in midlatitudes. However, the current non-eddy-resolving climate models severely underestimate (~50%) EARs, casting significant uncertainties on their future projections. Here, using an unprecedented set of eddy-resolving high-resolution simulations from the Community Earth System Model simulations, we show that the models’ ability of simulating EARs is significantly improved (despite a slight overestimate of ~10%) and the EARs are projected to increase almost linearly with temperature warming. Under the Representative Concentration Pathway 8.5 warming scenario, there will be a global doubling or more of the occurrence, integrated water vapor transport and precipitation associated with EARs, and a more concentrated tripling for the landfalling EARs, by the end of the 21st century. We further demonstrate that the coupling relationship between EARs and storms will be reduced in a warming climate, potentially influencing the predictability of future EARs.

How to cite: Wang, S., Ma, X., Zhou, S., Wu, L., Wang, H., Tang, Z., Xu, G., Jing, Z., Chen, Z., and Gan, B.: Extreme atmospheric rivers in a warming climate, EGU General Assembly 2024, Vienna, Austria, 14–19 Apr 2024, EGU24-1442, https://doi.org/10.5194/egusphere-egu24-1442, 2024.

The northwest China (NWC) is situated in an arid and semi-arid inland, rendering its ecosystem highly susceptible to precipitation changes. Previous studies have revealed the wetting trend and potential moisture sources of the NWC, while not clearly quantified the moisture (water vapor and precipitation) sources and its interannual variability. Here, by performing and analyzing CAM5.1 simulation for 40 years, with a coupled atmospheric water tracer algorithm (AWT), we find that the dominant sources of summer moisture over NWC are from terrestrial sources (81.8% of vapor and 77.4% of precipitation), i.e. from the North Asia (NA), Europe (EUP), southern Tibetan Plateau (STP), and southeastern China (SEC), rather than the oceanic sources. Due to the influence of synoptic patterns, the precipitation-conversion efficiency of water vapor from the southwest airflow (STP and SEC) is higher than that from the northwest airflow (NA and EUP). We also find that despite a general increasing trend in humidification, the fluctuation from relatively dry to wet years still persists in the NWC influenced by the increased transport of moisture from terrestrial sources (NA and STP).

How to cite: Qian, P.: Quantifying the moisture and precipitation sources over Northwest China and investigating the source differences in dry and wet summer seasons, EGU General Assembly 2024, Vienna, Austria, 14–19 Apr 2024, EGU24-1515, https://doi.org/10.5194/egusphere-egu24-1515, 2024.

EGU24-3270 | ECS | Orals | AS1.19

New insights into the Pacific Walker Circulation from an 800-year-long water isotope-based reconstruction ensemble  

Georgina Falster, Bronwen Konecky, Sloan Coats, and Samantha Stevenson

The Pacific Walker Circulation (PWC) has a major influence on weather and climate worldwide. But our understanding of 1) its response to external forcings; and 2) its internal variability across timescales remain unclear. This is in part due to the length of the observational record, which is too short to disentangle forced responses from internal variability. 

Here we assess the internal variability of the PWC as well as its response to the two largest external forcings of the Common Era: volcanic eruptions and anthropogenic forcing. We do this using a new annually-resolved, multi-method, palaeoproxy-derived PWC reconstruction ensemble spanning 1200-2000. The reconstruction is derived from 59 palaeoclimate proxy records, mostly from the Iso2k database of water isotope proxy records (Konecky et al., 2020). The basis for the reconstruction is previous work by Falster et al. (2021), demonstrating that global water isotope variability has a strong mechanistic link with the PWC via its major influence on the global water cycle. The PWC reconstruction ensemble comprises 4800 members that sample uncertainty from observational data, reconstruction method, and record chronologies. 

We identify a significant PWC weakening in the 1-3 years following large volcanic eruptions, similar to the response seen in some climate models. However, we find no significant industrial-era (1850-2000) PWC trend relative to the preceding 650 years, which contrasts the PWC weakening simulated by most climate models. In fact, the strength of the PWC is not correlated with global mean temperature across timescales. We also find that the 1992-2011 PWC strengthening—previously attributed either to volcanic or anthropogenic aerosol forcing—was indeed anomalous, but not unprecedented as compared to the past 800 years. Hence it may have occurred due to decadal internal variability. The one place we did identify an industrial-era PWC change is in the power spectrum, where a post-1850 shift to lower-frequency variability suggests a subtle anthropogenic influence. 

References:

Konecky, B. L., McKay, N. P., Churakova (Sidorova), O. V., Comas-Bru, L., Dassié, E. P., DeLong, K. L., Falster, G. M., Fischer, M. J., Jones, M. D., Jonkers, L., Kaufman, D. S., Leduc, G., Managave, S. R., Martrat, B., Opel, T., Orsi, A. J., Partin, J. W., Sayani, H. R., Thomas, E. K., Thompson, D. M., Tyler, J. J., Abram, N. J., Atwood, A. R., Cartapanis, O., Conroy, J. L., Curran, M. A., Dee, S. G., Deininger, M., Divine, D. V., Kern, Z., Porter, T. J., Stevenson, S. L., von Gunten, L., and Iso2k Project Members: The Iso2k database: a global compilation of paleo-δ18O and δ2H records to aid understanding of Common Era climate, Earth Syst. Sci. Data, 12, 2261–2288, 2020.

Falster, G., B. Konecky, M. Madhavan, S. Stevenson, and S. Coats: Imprint of the Pacific Walker Circulation in Global Precipitation δ18O. J. Climate, 34, 8579–8597, 2021.

How to cite: Falster, G., Konecky, B., Coats, S., and Stevenson, S.: New insights into the Pacific Walker Circulation from an 800-year-long water isotope-based reconstruction ensemble , EGU General Assembly 2024, Vienna, Austria, 14–19 Apr 2024, EGU24-3270, https://doi.org/10.5194/egusphere-egu24-3270, 2024.

EGU24-3622 | ECS | Orals | AS1.19

Diabatic Amplification of Atmospheric River Intensity by Marine Heatwaves: Multi-Scale Air-Sea Interaction and Implications for Marine Heatwave Dissipation 

Christoph Renkl, Hyodae Seo, Élise Beaudin, Anthony Wilson, Art Miller, and Emanuele Di Lorenzo

The climate along the US West Coast is profoundly affected by the extratropical ocean and air-sea interaction near the coast, influencing moisture transport and valuable precipitation that play an important role in agricultural and water resource management efforts. On a basin scale, seasonal to interannual anomalies in the atmospheric circulation can create persistent upper-ocean temperature anomalies known as marine heatwaves (MHWs). These anomalous SST conditions have direct impact on air-sea fluxes, thereby influencing diabatic processes associated with synoptic-scale weather patterns, such as atmospheric rivers (ARs). Given the heat and moisture pickup by the ARs from the oceans, these multi-scale MHW-AR interactions may also represent a potential mechanism for dissipation of MHWs. This study examines diabatic multi-scale coupled air-sea interaction processes between persistent MHWs and synoptic-scale ARs, and evaluate their downstream effects on the coastal and inland climate.

Here, we present a comprehensive analysis based on observations and high-resolution, large-ensemble regional coupled model simulations targeting a series of landfalling ARs that interacted with warm SST anomalies during the Northeast Pacific MHW event in winter 2014/2015. Sensitivity simulations are conducted where various aspects of the observed MHW feature are removed from the ocean component of the coupled model to quantify the diabatic modification of the AR moisture and energy budgets. Our results show that MHWs exert diabatic forcing of the lower troposphere via enhanced latent heat flux from the ocean to the atmosphere and an associated increase in evaporation. This ultimately represents a nontrivial moisture source leading to an amplification of ARs indicated by a robust increase in rainfall intensity. Furthermore, the model results suggest noticeable shifts in the precise landfalling locations of the AR, the statistical significance of which is being assessed via ongoing ensemble simulations. The implications of MHW dissipation arising from the diabatic interaction between ARs and MHW will be discussed.

How to cite: Renkl, C., Seo, H., Beaudin, É., Wilson, A., Miller, A., and Di Lorenzo, E.: Diabatic Amplification of Atmospheric River Intensity by Marine Heatwaves: Multi-Scale Air-Sea Interaction and Implications for Marine Heatwave Dissipation, EGU General Assembly 2024, Vienna, Austria, 14–19 Apr 2024, EGU24-3622, https://doi.org/10.5194/egusphere-egu24-3622, 2024.

EGU24-6878 | ECS | Orals | AS1.19

Using stable water isotopes to improve our understanding of snow processes across scales 

Sonja Wahl, Benjamin Walter, Hans Christian Steen-Larsen, Franziska Aemisegger, Laura J. Dietrich, and Michael Lehning

Cryospheric processes and interactions between the cryosphere and other Earth system components are complex, host important climate feedbacks and are often difficult to measure. Yet their understanding is crucial for predicting the evolution of the cryosphere in a changing climate. Stable water isotopes are natural tracers of phase change processes within the hydrological cycle. The variability of the individual and combined isotope species offer a way to constrain environmental climatic conditions during phase change processes. Thus, they are a prime tool to investigate air-snow interactions, which are at the core of one of the most uncertain but eminently important climate feedbacks. In polar settings these phase change processes are predominantly vapor deposition and snow or ice sublimation. However, the principle of isotopic fractionation during sublimation has been controversially discussed and the usefulness of tracing stable water isotopes in cryospheric processes is thus debated.
Here we demonstrate through field observations and laboratory experiments that air-snow humidity exchange leaves an isotopic fingerprint in the snow isotopic composition. We present in-situ data from the Greenland Ice Sheet and new results from cold-laboratory wind tunnel experiments. The measurements comprise isotopic signatures of snow, vapor and of the humidity flux itself. We show that snow sublimation is a fractionating process and outline how this information can be used to improve cryospheric process understanding. Specifically, we investigate the process of drifting and blowing snow by observing the evolution of both vapor and snow isotopic composition during cold-laboratory wind tunnel experiments. We document the existence of hitherto unobserved airborne snow metamorphism; a process observable on the macro-scale only through the lens of stable water isotopes. Based on the combined observations of in-situ surface humidity fluxes and wind tunnel experiments we discuss a physical explanation for the observed isotopic fractionation during snow sublimation. These insights and the data set will be the basis for determining the fractionation factors associated with airborne snow metamorphism. Our results have important implications for the interpretation of stable water isotope signals from snow and ice cores and challenge the translation of the second-order parameter d-excess signal in polar regions as moisture source signal.

How to cite: Wahl, S., Walter, B., Steen-Larsen, H. C., Aemisegger, F., Dietrich, L. J., and Lehning, M.: Using stable water isotopes to improve our understanding of snow processes across scales, EGU General Assembly 2024, Vienna, Austria, 14–19 Apr 2024, EGU24-6878, https://doi.org/10.5194/egusphere-egu24-6878, 2024.

A 25-year record from the United States Network for Isotopes in Precipitation (USNIP) using data from seventy-three sampling sites reveals the dynamic role of moisture sources and storm tracks in controlling the precipitation geochemistry at a continental scale. Our study provides a fresh perspective on processes governing the water isotope cycle beyond the classic role of temperature. We report that Climate Oscillations (COs) combine to influence synoptic climatology and atmospheric transport patterns, thereby driving spatiotemporal distribution of precipitation 18O, 2H and d-excess values. The relationship between the individual COs and the isotopic composition of precipitation is spatially, temporally, and geographically inconsistent with varying time periods of linear (positive/negative), non-linear, or no coherence. The interactions between COs drive variations in isotope fractionation associated with evaporation (moisture source dynamics) and transport (storm track pathways and degree of rainout) of moisture. These are mirrored in the spatiotemporal precipitation isotope patterns across contiguous USA and supported by airmass trajectory analysis. We use the USNIP observational dataset to validate and test process representation in the variable-resolution isotope-enabled Community Earth System Model-version 2 (VR-iCESM2) with regional grid refinement to ~12.5 km over the contiguous US. To explore the relative influences of origin, transport, and condensation of water vapor on precipitation isotope patterns, we use process-oriented water tags in the VR-iCESM2 that track physical properties at the evaporation source locations, Rayleigh rainout effect, and precipitation condensation temperature. We find the model prediction to be deficient in coastal regions which improves in the continental interior, but ‘nudging’ the model with atmospheric thermodynamic properties and grid refinement leads to an overall enhancement in model performance relative to low resolution (~100 km) iCESM simulations. Evaluating and improving water cycling processes in climate models using spatially dense, long-term observational datasets of water isotopes, such as USNIP, will improve interpretations of paleoclimate records and predictions of future changes.

How to cite: Dar, S. S., Macarewich, S., Klein, E., and Welker, J.: 25 years of precipitation isotopic composition across the USA: Assessment of non-linearities associated with moisture source dynamics and storm track variations in the Community Earth System Model, EGU General Assembly 2024, Vienna, Austria, 14–19 Apr 2024, EGU24-7663, https://doi.org/10.5194/egusphere-egu24-7663, 2024.

EGU24-11548 | Posters on site | AS1.19

Adjustment of the Marine Atmospheric Boundary-Layer to the North Brazil Current during the EUREC4A-OA Experiment 

Hervé Giordani, Carlos Conejero, and Lionel Renault

The EUREC4A-OA experiment (January - February 2020. Bony et al., 2017) took place in the Northwest Tropical Atlantic. Atmospheric simulations were performed at kilometric scale during the EUREC4A-OA experiment (47 days) in order to estimate the sensitivity of the Marine Atmospheric Boundary-Layer (MABL) thermodynamics and circulation to the SST front associated with the North Brazil Current (NBC) and to the SST diurnal cycle. It will be shown that the NBC SST front and associated eddies «Couloir des Tourbillons» strongly control the MABL properties (Surface Pressure, Surface Heat Fluxes, Temperature, Wind, Vertical Shear, Precipitable Water, Liquid Water Content ...), while the diurnal cycle of the SST alters these properties by 5 to 10%.

A full MABL water budget has shown that the precipitable water (PW) results of the balance between the total Advection and entraiment at the MABL top, which drains water out the MABL, and surface evaporation that fills in the MABL. It will be shown that the NBC increases the loss of water by advection and by entrainment and increases the gain of water by surface evaporation, by 80 mm in 47 days. The diurnal cycle of SST amplifies these responses by 30 mm in the NBC.

Some components of the MABL energy budget will be also presented.

How to cite: Giordani, H., Conejero, C., and Renault, L.: Adjustment of the Marine Atmospheric Boundary-Layer to the North Brazil Current during the EUREC4A-OA Experiment, EGU General Assembly 2024, Vienna, Austria, 14–19 Apr 2024, EGU24-11548, https://doi.org/10.5194/egusphere-egu24-11548, 2024.

EGU24-11684 | Orals | AS1.19

A New Lens on Atmospheric Rivers 

Shakeel Asharaf, Bin Guan, and Duane Waliser

This presentation introduces the ROTated Atmospheric river coordinaTE (ROTATE) system – a storm-centric coordinate system designed specifically for analyzing long, narrow filamentary regions of intense water vapor transport in the lower atmosphere or so-called atmospheric rivers (ARs). It effectively preserves key AR signals in the time mean that may be lost or obscured in simple averaging due to diverse AR orientations and shapes. We used ROTATE to look at crucial characteristics of atmospheric rivers such as how wet the air is, how fast the wind blows, how much water vapor is being transported, and how much rain falls. We found more apparent AR patterns with ROTATE compared to the conventional non-rotated AR centroid-based compositing approach. The new method also helps us see finer details in rain distributions over land versus over the oceans. It is further apparent that the ROTATE system more distinctly delineates the finer details in precipitation distributions for landfalling and oceanic ARs. Overall, the ROTATE system has the potential to serve as a valuable tool for better comparing and understanding the characteristics, processes, and impacts of ARs across different regions. Details about the analysis and challenges associated with the current results will be discussed in this presentation.

How to cite: Asharaf, S., Guan, B., and Waliser, D.: A New Lens on Atmospheric Rivers, EGU General Assembly 2024, Vienna, Austria, 14–19 Apr 2024, EGU24-11684, https://doi.org/10.5194/egusphere-egu24-11684, 2024.

EGU24-12550 | ECS | Orals | AS1.19

Seeking consensus between Eulerian and Lagrangian moisture tracking methods for precipitation origin analysis in Atmospheric Rivers 

Alfredo Crespo-Otero, Damian Insua-Costa, and Gonzalo Míguez-Macho

Global warming is increasingly aggravating hydro-climate extremes, such as floods and droughts. In this context it is essential to understand the complex dynamics of the atmospheric branch of the water cycle, including the link between evaporation and precipitation. For this reason, many studies have investigated the origin of the moisture that feeds precipitation, which has led to a better understanding of atmospheric water transport. However, the lack of observations has prevented a direct validation of the different moisture tracking tools used for this purpose, and it is common to find large discrepancies between the results they provide.

To fill this gap, we compare two different Lagrangian methodologies for moisture tracking based on the FLEXible PARTicle dispersion model (FLEXPART) against the Eulerian “Water Vapor Tracers” technique based on WRF (WRF-WVTs). Considering the results of WRF-WVTs as “ground truth”, we explore the discrepancies between the Eulerian and Lagrangian approaches for five precipitation events associated with ARs and, based on that, propose some physics-based adjustments to the Lagrangian tools. Our results show that Lagrangian methodologies using evaporation data instead of specific humidity data provide results much closer to those of WRF-WVTs. Specifically, they reduce large biases that underestimate remote sources (such as tropical ones), while overestimating local contributions. When we introduce our physical corrections, both methods improve remarkably, which means that these biases are strongly reduced and the results provided by the different techniques reach a consensus.

How to cite: Crespo-Otero, A., Insua-Costa, D., and Míguez-Macho, G.: Seeking consensus between Eulerian and Lagrangian moisture tracking methods for precipitation origin analysis in Atmospheric Rivers, EGU General Assembly 2024, Vienna, Austria, 14–19 Apr 2024, EGU24-12550, https://doi.org/10.5194/egusphere-egu24-12550, 2024.

EGU24-14310 | Posters on site | AS1.19

Atmospheric moisture transport in Central Europe – rivers or streams 

Agnieszka Wypych

The diversity of water vapor content in the air is crucial for the regional analysis of atmospheric precipitation occurrences. The amount of water vapor carried by the air mass over a specific area can vary significantly depending on the current characteristics of air circulation, with a key role played by atmospheric rivers. These rivers originate from the meridional transport of water vapor and have a significant impact on Europe through the interaction with extratropical cyclones.
The aim of the work is to assess the intensity of water vapor transport over Europe and the extent of its inland penetration.
Atmospheric rivers/streams will be identified based on ECMWF ERA5 reanalyses data from 1991 to 2023 and CMIP6 future projections until the year 2100.
Selected cases of intense water vapor transport over the European region, especially Central Europe, will be compared with the occurrence of atmospheric precipitation.

How to cite: Wypych, A.: Atmospheric moisture transport in Central Europe – rivers or streams, EGU General Assembly 2024, Vienna, Austria, 14–19 Apr 2024, EGU24-14310, https://doi.org/10.5194/egusphere-egu24-14310, 2024.

EGU24-14966 | Orals | AS1.19

From atmospheric water isotopes measurement to firn core interpretation in coastal sites: A method for isotope-enabled atmospheric models in East Antarctica 

Christophe Leroy-Dos Santos, Elise Fourré, Cécile Agosta, Mathieu Casado, Alexandre Cauquoin, Martin Werner, Simon Alexander, Marshall Lewis, Vincent Favier, Tessa Vance, Derryn Harvie, Olivier Cattani, Benedicte Minster, Frédéric Prié, Olivier Jossoud, Leila Petit, and Amaëlle Landais

In a context of global warming, it is key to estimate the evolution of the atmospheric hydrological cycle and temperature in the polar regions. Since records are only available from satellite data for the last 40 years, one of the best ways to access longer records is to use climate proxies in firn cores. The water isotopic composition of firn cores is widely used to reconstruct past temperature variations. However, both temperature and atmospheric water cycle (origin of the precipitation, deposition and post-deposition effects) influence the isotopic composition of snow. We present a 2-year long time series of vapor and precipitation isotopic composition measurement at Dumont D’Urville (DDU), a coastal station in Adélie Land. This unique data set is first used to study the link between hydrological cycle and weather regimes at DDU. It is found that both continental and oceanic air masses impact the signal. Then, this record is used to evaluate the Global Climate Model ECHAM6-wiso equipped with water stable isotopes which is able to reproduce the observed isotopic signal. This result permits further use of ECHAM6-wiso to interpret water isotopic profiles on short firn cores. Using this methodology, we evaluate ECHAM6-wiso atmospheric outputs at two other East Antarctic coastal sites: Davis  and Neumayer stations.

How to cite: Leroy-Dos Santos, C., Fourré, E., Agosta, C., Casado, M., Cauquoin, A., Werner, M., Alexander, S., Lewis, M., Favier, V., Vance, T., Harvie, D., Cattani, O., Minster, B., Prié, F., Jossoud, O., Petit, L., and Landais, A.: From atmospheric water isotopes measurement to firn core interpretation in coastal sites: A method for isotope-enabled atmospheric models in East Antarctica, EGU General Assembly 2024, Vienna, Austria, 14–19 Apr 2024, EGU24-14966, https://doi.org/10.5194/egusphere-egu24-14966, 2024.

EGU24-15660 | ECS | Posters on site | AS1.19

Machine learning analysis for predicting spatial distribution and key influencers of stable isotope patterns in European precipitation 

Dániel Erdélyi, Zoltán Kern, István Gábor Hatvani, Polona Vreča, Klara Žagar, Frederic Huneau, Aurel Perșoiu, Markus Leuenberger, Sonja Lojen, Oliver Kracht, Astrid Harjung, Pekka Rossi, Kaisa-Riikka Mustonen, and Jeffrey Welker

Natural abundance variations in stable isotope ratios of hydrogen and oxygen are important environmental tracers with a significant range of applications  (e.g., the exploration of the present water cycle, paleoclimate reconstructions, ecology, and food authenticity). These applications and research themes are often based on spatially explicit predictions of precipitation isotopic variations obtained from point sample collections and measurements through various interpolation techniques. The derivation of spatially continuous and georeferenced isotope databases, known as isotopic landscapes (isoscapes), has been considered most effective through regression kriging for precipitation beginning in the early 2000s. However, the number of interpolation methods used in geostatistics has increased rapidly in recent decades, with new machine learning algorithms becoming increasingly important and proving more successful than conventional methods for certain isotopic parameters. In the present research we present a monthly 10 x 10 km European isoscape based on state-of-the art hybrid machine learning method that combines LASSO Regression and Random Forest (Zhang et al., 2019) for spatial predictions for 1973-2022. Data were retrieved from the IAEA/WMO Global Network of Isotopes in Precipitation (no. of stations: 329) and other national datasets from about 10 countries (no. of stations: ~150).

A pilot study (for 2008-2017; Erdélyi et al. 2023) indicated the highest prediction error for the northern premises. This suggested the incorporation of sea ice as an additional predictor, since a Pan-Arctic precipitation stable isotope study pointed out that sea ice cover change is a key driver of oceanic moisture sources (Mellat et al., 2021). Results indicate an overwhelming importance of minimum temperature with the variable representing sea ice cover, ranking among the least influential parameters. The analysis fails to consider moisture source effects, transport distances, and secondary processes of recycling associated with evaporation and transpiration from landscapes across Europe. These results provide a more refined prediction due to the higher station density compared to previous models and thanks to the hybrid model, a more accurate prediction of monthly precipitation stable isotope compositions is expected for the critical areas including the latitudinal margins as well as the mountainous zones.

Activities for this presentation were supported by the IAEA (CRP F31006, CRP F33024, TC-project RER7013, Contract 23550/R0) and WATSON Cost Action 19120. This research was also funded by UEFISCDI Romania, grants number PN-III-P2-2.1-PED-2019-4102, PN-III-P4-ID-PCE-2020-2723 and ARIS (Grants P1-0143, N1-0054, N1-0309, J6-3141, J6-50214).


Erdélyi, D., Kern, Z., Nyitrai, T., et al. (2023). Predicting the spatial distribution of stable isotopes in precipitation using a machine learning approach: a comparative assessment of random forest variants. International Journal of Geomathematics, 14:14. doi:10.1007/s13137-023-00224-x

Mellat, M., Bailey, H., Mustonen, K-R., Marttila, H., Klein, E. S., Gribanov, K., ... Welker, J. M. (2021). Hydroclimatic Controls on the Isotopic (δ18 O, δ2 H, d-excess)  Traits of Pan-Arctic Summer Rainfall Events. Frontiers in Earth Science, 9:651731. doi:10.3389/feart.2021.651731

Zhang, H., Nettleton, D., & Zhu, Z. (2019). Regression-enhanced random forests. arXiv preprint arXiv:1904.10416.

How to cite: Erdélyi, D., Kern, Z., Hatvani, I. G., Vreča, P., Žagar, K., Huneau, F., Perșoiu, A., Leuenberger, M., Lojen, S., Kracht, O., Harjung, A., Rossi, P., Mustonen, K.-R., and Welker, J.: Machine learning analysis for predicting spatial distribution and key influencers of stable isotope patterns in European precipitation, EGU General Assembly 2024, Vienna, Austria, 14–19 Apr 2024, EGU24-15660, https://doi.org/10.5194/egusphere-egu24-15660, 2024.

EGU24-16154 | ECS | Orals | AS1.19

Unraveling the moisture transport in the North Atlantic trade-wind region using passive tracers and stable water isotopes 

Svetlana Botsyun, Stephan Pfahl, Franziska Aemisegger, Leonie Villiger, and Ingo Kirchner

The atmospheric hydrologic cycle and the formation of shallow cumulus clouds in the marine trade-wind region are important for the Earth’s radiative budget and climate sensitivity. Furthermore, the understanding of air mixing and transport processes in the atmosphere is crucial for interpreting measurements and records of stable water isotopes. However, the representation of these processes in climate models is subject to large uncertainties. Here we investigate moisture transport and its impact on the isotopic signature in the North Atlantic trade-wind region. We use the regional COSMO model equipped with stable water isotopes and passive water tracers to quantify the contributions of the different evaporation sources to moisture contents and their isotope signals in the free troposphere of the western tropical Atlantic. For the time period of the EUREC4A field campaign (January-February 2020), convection-resolving high-resolution (5 km) nudged simulations are performed, allowing a comparison with field data. Passive tracers (water tagging) are combined with prognostic water isotope simulations to determine the specific isotopic fingerprints of the diagnosed moisture pathways. In January and February 2020, the tropical Atlantic region is characterized by alternating large-scale circulation regimes with distinct isotopic signatures. Humid conditions in the middle troposphere (300-650 hPa) over the island of Barbados are related to easterly and south-easterly moisture transport, while dry conditions correspond to extratropical transport from the north and west. Our modeling approach, together with the unprecedented observational data from the EUREC4A campaign, offers exciting new opportunities to evaluate and ultimately improve the representation of the tropical water cycle in climate models.

How to cite: Botsyun, S., Pfahl, S., Aemisegger, F., Villiger, L., and Kirchner, I.: Unraveling the moisture transport in the North Atlantic trade-wind region using passive tracers and stable water isotopes, EGU General Assembly 2024, Vienna, Austria, 14–19 Apr 2024, EGU24-16154, https://doi.org/10.5194/egusphere-egu24-16154, 2024.

EGU24-16667 | ECS | Posters on site | AS1.19

Impact of increased evaporation from an increasingly ice-free Arctic on land precipitation 

Yubo Liu and Qiuhong Tang

The loss of Arctic sea ice is conducive to more Arctic evaporation, which can alter precipitation through moisture cycling and transport. However, the extent of this influence remains uncertain. Our work focuses on Arctic seas where seasonal sea ice has retreated significantly. The Arctic evaporation was tracked to establish a link between changes in both sea ice and precipitation over land during the cold season (October to March). Our results show a significant one-third increase in Arctic moisture contribution to land precipitation. Despite Arctic moisture comprising a relatively small proportion of land precipitation, its heightened contribution significantly influenced the precipitation, especially over lands adjacent to the Arctic. Our findings highlight that the progressively ice-free Arctic tends to contribute to a gradual yet discernible shift in the climatological land precipitation, which may lead to an elevated risk of extreme disasters.

How to cite: Liu, Y. and Tang, Q.: Impact of increased evaporation from an increasingly ice-free Arctic on land precipitation, EGU General Assembly 2024, Vienna, Austria, 14–19 Apr 2024, EGU24-16667, https://doi.org/10.5194/egusphere-egu24-16667, 2024.

EGU24-17899 | ECS | Orals | AS1.19

Decade-Long Isotopic Analysis (18O & 2H) of Daily Precipitation in the Malaya Peninsula: Understanding the Complex Hydrometeorology 

Harsh Oza, Ludvig Löwemark, George Kontsevich, Akkaneewut Jirapinyakul, Sakonvan Chawchai, Helmut Duerrast, Mao-Chang Liang, Midhun Madhavan, and Chung-Ho Wang

The Malaya Peninsula, uniquely positioned between the South China Sea to the east and the Indian Ocean to the west presents a unique geographic vantage point for the study of ocean-ocean and ocean-atmosphere-land interactions, particularly in the context of climate change. Its proximity to the Indo-Pacific Warm Pool (IPWP) makes the region a critical nexus where global temperature rise intersects with significant ocean-atmosphere processes, such as Hadley and Walker circulations, El Niño-Southern Oscillation (ENSO), Indian Ocean Dipole (IOD), and Madden–Julian Oscillation (MJO). These processes and their teleconnections play a pivotal role in shaping the regional climate, profoundly influencing rainfall patterns and freshwater availability in the peninsula. 

In our research, we conducted a decade-long analysis of oxygen and hydrogen isotopes in daily rainfall samples collected from Krabi, Thailand, a region situated in the northern Malaya Peninsula. Krabi faces the Andaman Sea and is characterized by a tropical monsoon climate. The region's climate is predominantly influenced by the North-South migration of the Intertropical Convergence Zone (ITCZ), which governs the patterns of summer and winter monsoonal rainfall. The diverse topography of Krabi plays a critical role in local weather patterns, potentially intensifying the complexity of the region's dual monsoon system. The time series analysis of isotopic data brings to light three distinct patterns superimposed over the daily variability. There's a clear seasonal cycle, primarily driven by changes in moisture sources, indicating shifts in atmospheric moisture transport with the seasons. Additionally, multi-year patterns suggest the influence of complex ocean-atmospheric processes, likely reflecting teleconnections between the Western Pacific and Indian Oceans. Intriguingly, we also observed a long-term trend of isotopic depletion without corresponding changes in rainfall volume, hinting at the potential impacts of ocean warming and broader climate change.

This study underscores the importance of understanding the nuanced interplay of land, ocean, and atmospheric systems in regional rainfall dynamics. It has significant implications for regional climate models and paleoclimatic research. It highlights the sensitivity of the Malaya Peninsula's climate to both local topographical features and global oceanic phenomena, offering crucial insights into the regional responses to ongoing global climatic changes.

How to cite: Oza, H., Löwemark, L., Kontsevich, G., Jirapinyakul, A., Chawchai, S., Duerrast, H., Liang, M.-C., Madhavan, M., and Wang, C.-H.: Decade-Long Isotopic Analysis (18O & 2H) of Daily Precipitation in the Malaya Peninsula: Understanding the Complex Hydrometeorology, EGU General Assembly 2024, Vienna, Austria, 14–19 Apr 2024, EGU24-17899, https://doi.org/10.5194/egusphere-egu24-17899, 2024.

EGU24-18497 | ECS | Posters on site | AS1.19

Changes in the concurrence of atmospheric rivers and explosive cyclones in the North Atlantic 

Ferran Lopez-Marti, Mireia Ginesta, Davide Faranda, Anna Rutgersson, Pascal Yiou, Lichuan Wu, and Gabriele Messori

The explosive development of extratropical cyclones and the presence of atmospheric rivers play a crucial role in driving some types of extreme weather in the mid-latitudes, like compound flood-windstorm events. Although these phenomena are individually well-established and their relationship has been studied previously, there is still a gap in our understanding of how a warmer climate may affect their concurrence. Here, we focus on evaluating the current climatology and assessing changes in the future climate of the concurrence between atmospheric rivers and explosive cyclones in the North Atlantic.

We use both the ERA5 and ERA-Interim reanalysis between 1980 to 2009 from October to March to evaluate the concurrence of atmospheric rivers and explosive cyclones in the current climate. To accomplish this, we first independently detect and track atmospheric rivers and extratropical cyclones. Next, we classify each cyclone as either explosive or non-explosive and define concurrence with an atmospheric river if the latter is detected within 1500 km of the minimum sea level pressure of the cyclone. We further analyse several CMIP6 climate models for the historical scenario (1980-2009) and for the future scenarios SSP1-2.6, SSP2-4.5 and SSP5-8.5 at the end of the century (2070-2099).

Our findings reveal that atmospheric rivers are more often detected in the vicinity of explosive cyclones than non-explosive cyclones in all datasets. Moreover, we identified a significant increase in the concurrences and the atmospheric river intensity in all the future scenarios analysed. As such, our work provides a novel statistical relation between explosive cyclones and atmospheric rivers in climate projections, a characterization of both in future climates and a new climatology of the concurrences for a higher-resolution reanalysis.

How to cite: Lopez-Marti, F., Ginesta, M., Faranda, D., Rutgersson, A., Yiou, P., Wu, L., and Messori, G.: Changes in the concurrence of atmospheric rivers and explosive cyclones in the North Atlantic, EGU General Assembly 2024, Vienna, Austria, 14–19 Apr 2024, EGU24-18497, https://doi.org/10.5194/egusphere-egu24-18497, 2024.

EGU24-18507 | ECS | Orals | AS1.19

Quantifying the contribution of oceanic evaporation to tropical cyclone development with WRF-age  

Jianhui Wei, Patrick Olschewski, Qi Sun, Yu Li, Patrick Laux, and Harald Kunstmann

Global warming is accelerating the global water cycle. On a short temporal scale, such acceleration may modify weather regimes and, thus, potentially increase the number of compound weather and climate events. Among them, tropical cyclones can bring destructive high winds, torrential rain, storm surges and occasionally tornadoes in association with a variety of hazards, especially in coastal urban regions. In this study, we apply a newly developed WRF-age model, i.e., the Weather Research and Forecasting model enhanced with an age-weighted water tracking approach, to a coastal urban region in Southeast China. The source and transport of atmospheric water vapor in one Northwest Pacific Ocean cyclone, here, Hato in August 2017, are exemplarily examined by means of tracking oceanic evaporation. Two indices, i.e., the contribution ratio and the atmospheric water residence time, are used to better understand how much and how fast the oceanic evaporation contributes to the development of tropical cyclone Hato. Our simulation results show that, within 24 hours, the contribution ratio of the tagged oceanic evaporation to the total water vapor researches up to around 25%. In addition, the spatial pattern of the atmospheric water residence time shows that the oceanic evaporation below the rainbands of Hato (around 9 hours) fuels faster in its development than the oceanic evaporation from the surrounding region (15 hours). These findings emphasize the important role of oceanic evaporation to tropical cyclone development. Our study demonstrates that the WRF-age model can be applied to quantify the acceleration of tropical cyclone development under global warming.

How to cite: Wei, J., Olschewski, P., Sun, Q., Li, Y., Laux, P., and Kunstmann, H.: Quantifying the contribution of oceanic evaporation to tropical cyclone development with WRF-age , EGU General Assembly 2024, Vienna, Austria, 14–19 Apr 2024, EGU24-18507, https://doi.org/10.5194/egusphere-egu24-18507, 2024.

EGU24-18906 | ECS | Posters on site | AS1.19

Computing precipitations with a 1D vertical (radiative-convective) model using zero parameterizations. 

Quentin Pikeroen and Didier Paillard

The main philosophy in building a climate model is to represent the most possible number of phenomena, with the purpose of answering the most possible number of questions, with one unique perfect model. For this purpose, climate models have historically evolved from energy balance models, to radiative-convective models, to general circulation models, to the earth system model, with growing complexity. While this approach is relevant in some domains (e.g. climate services), more simple models could answer simple questions (e.g. calculate the mean temperature or precipitations for paleoclimates). Moreover, all climate models use parameterizations to represent the processes with unknown or not numerically solvable physical laws. Moreover, to make them accurate, all climate models tune their parameters. For example, in the atmosphere in the vertical direction, the energy flux often obeys a Fourier-like law with a "conductivity" coefficient tuned to fit observations. The approach we use is entirely different, and because of that, we need to rebuild everything from scratch. We want to construct a simple atmospheric model with no parameterizations (the ultimate goal could be to couple it to a vegetation or an ice model and run long simulations).

We use the MEP hypothesis (maximum entropy production) to do so. This hypothesis has been used in realistic cases with parameterizations, or without parameterizations in more theoretical cases (like 2-box models). However, we aim to construct a full climate model with the MEP hypothesis. First, we restrict ourselves to a vertical tropical atmosphere: a radiative-convective model. Only stationary states are considered. Also, the relative humidity is fixed at 100%. A realistic radiative code is used, and convection is computed with the MEP hypothesis. The computed temperatures fit well with the observations. Also, precipitations can be computed and are coherent with observations. This means that almost only the knowledge of radiative transfer is needed to obtain a good order of magnitude of precipitations. In recent developments, the model has allowed deep convection, leading to slightly different precipitations. When relative humidity is allowed to vary; in the simple convection case, the MEP solution gives a 100% relative humidity almost everywhere; and the deep convection case gives a non-trivial relative humidity profile.

Because MEP is only a hypothesis, we still need to find out if the MEP solution is the exact solution. However, it must represent some upper bound in the system because it corresponds to a maximum. It is already interesting to explore what this upper bound is.

How to cite: Pikeroen, Q. and Paillard, D.: Computing precipitations with a 1D vertical (radiative-convective) model using zero parameterizations., EGU General Assembly 2024, Vienna, Austria, 14–19 Apr 2024, EGU24-18906, https://doi.org/10.5194/egusphere-egu24-18906, 2024.

EGU24-19539 | ECS | Posters on site | AS1.19

Antarctic water stable isotopes in the global atmospheric model LMDZ6: from climatology to boundary layer processes 

Niels Dutrievoz, Cécile Agosta, Camille Risi, Étienne Vignon, Sébastien Nguyen, Amaelle Landais, Elise Fourré, Christophe Leroy-Dos Santos, Mathieu Casado, Inès Ollivier, Jean Jouzel, Didier Roche, Benedicte Minster, and Frédéric Prié

Water-stable isotopic compositions of snow or ice (here δ18O and δD) represent the main way to reconstruct past temperature in Antarctica, and one way to interpret these isotopic signals is through the use of isotope-enabled atmospheric general circulation models. In this study, we combine isotopic observations from surface snow samples, daily precipitation and water vapour to evaluate the LMDZ6iso model in Antarctica from climatic to seasonal and sub-daily time scale. Time-averaged δ18O in precipitation from LMDZ6iso for the period 1980-2022 is in excellent agreement with δ18O of surface snow samples across the continent, but there is a strong disagreement for d-excess at cold temperature sites. For sub-annual time scale analyses, we focus on two sites in East Antarctica: the coastal station Dumont d'Urville and the continental station Concordia. The model accurately reproduces the seasonal isotopic cycle of daily precipitation at both stations, with better performances at Concordia. Moving from statistical evaluation to process analyses, we use water vapour isotopes to study water exchanges in the boundary layer. LMDZ6iso performs well in representing the observed diurnal isotope cycle at both sites. However, the model simulates a larger vapour δ18O depletion than observed during the night at Concordia. We analyse the contribution of each physical process affecting isotope concentrations in LMDZ6iso to show what controls the vapour isotope signal. At Concordia, surface sublimation during the day is the main driver of the diurnal cycle of vapour isotopes, whereas at Dumont d'Urville, daily isotope variations are driven by surface sublimation and turbulence during the day and by air advection from the katabatic flow during the night.


How to cite: Dutrievoz, N., Agosta, C., Risi, C., Vignon, É., Nguyen, S., Landais, A., Fourré, E., Leroy-Dos Santos, C., Casado, M., Ollivier, I., Jouzel, J., Roche, D., Minster, B., and Prié, F.: Antarctic water stable isotopes in the global atmospheric model LMDZ6: from climatology to boundary layer processes, EGU General Assembly 2024, Vienna, Austria, 14–19 Apr 2024, EGU24-19539, https://doi.org/10.5194/egusphere-egu24-19539, 2024.

EGU24-19562 | ECS | Posters virtual | AS1.19

The role of Dry Intrusions in the formation and intensification of Atmospheric Rivers impacting France 

Kim Andreas Weiss, Tomás Gaspar, Albenis Pérez-Alarcón, Shira Raveh-Rubin, Joaquim G. Pinto, and Alexandre M. Ramos

Extra-tropical storms over the North Atlantic often leads to socio-economic impacts over Western Europe, associated with strong winds and precipitation. Such storms can be associated with so-called Atmospheric Rivers (ARs) which are relatively narrow regions of concentrated water vapor (WV) and strong winds where intense horizontal moisture transport can take place. In turn, the moisture availability along the cyclone path and the ARs lifetime can be impacted by boundary layer processes. For example, the occurrence of Dry Intrusions (DI) associated with previous cyclones can strongly destabilize the planetary boundary layer (PBL) leading to enhanced moisture uptake over the ocean. This can support the formation and/or intensification of the ARs themselves.

The objective of this study is to understand the influence of DI on the moisture uptake in the PBL and transport associated with ARs impacting France.

With this aim, an adapted version of the detection algorithm developed by Ramos et al. (2015), was applied to ERA-5 reanalysis targeting events impacting the Atlantic coast of France. A total of 300 AR-events were detected over the extended winter (ONDJFM) spanning the years 1979 to 2023. Indeed, the most intense landfalling ARs are associated with intense precipitation and high wind speeds over western France.

For a subset of these AR-events, occurring between 1992 and 2022, the Lagrangian FLEXPART model using ERA5-data was applied to calculate the moisture sources for these events. This approach allows for the tracking of air masses 10 days backward in time from the target region (5°W to 0.5°E and 43.75°N to 50°N). 

Additionally, the occurrence of DI outflows (from 1979 onward) was based on its Lagrangian detection in ERA5 to assign possible DI outflows overlapping with the source regions of moisture uptake.

Our results suggest a relationship between the areas of DIs and moisture uptake, indicating the possibility of the DI exerting influence on the formation and intensification of ARs. Overall, this work serves as a preliminary investigation for the upcoming North Atlantic Waveguide, Dry Intrusion, and Downstream Impact Campaign (NAWDIC) recently endorsed by the World Weather Research Programme (WWRP).

How to cite: Weiss, K. A., Gaspar, T., Pérez-Alarcón, A., Raveh-Rubin, S., Pinto, J. G., and Ramos, A. M.: The role of Dry Intrusions in the formation and intensification of Atmospheric Rivers impacting France, EGU General Assembly 2024, Vienna, Austria, 14–19 Apr 2024, EGU24-19562, https://doi.org/10.5194/egusphere-egu24-19562, 2024.

EGU24-544 | ECS | PICO | HS7.9

Land-Atmosphere Interactions over North West Himalaya 

Ashish Navale and Karthikeyan Lanka

Precipitation can originate from evaporated water over oceans and land in remote locations or from local terrestrial sources. The precipitation due to these local sources is called recycled precipitation. Recycled precipitation has been used extensively to study land-atmosphere interaction and has shown to be helpful when studying the relationship between atmospheric or terrestrial variables and precipitation. Mountainous areas such as the Himalaya, Tibetan Plateau, Alps, Andes, and the Rocky Mountains are a hotspot for high local recycling and land-atmosphere interaction. The North West Himalaya (NWH) has drawn attention recently to the issue of climate change due to the region's drastically reduced rainfall and rapidly rising temperature over the past century. Climate change also affects the large number of processes involved in land-atmosphere interaction. The complex topography and heterogeneous climate of NWH makes it challenging to understand the land-atmosphere interaction in this region. In this study, we use an Eulerian water tagging method implemented into the Weather Research and Forecasting (WRF) model to study land-atmosphere interaction in NWH. This method is considered one of the most accurate techniques to quantify recycled precipitation. We simulated summer (June, July, August, and September) and winter (December, January, February, and March) precipitation in the NWH for twenty years from 2001 to 2020.

Results show that, due to availability of more thermal energy the summer experienced more recycling than winter. The western disturbances in winter and southwest monsoon during summer contributes to the locally evapotranspirated moisture and affects the recycling ratio of NWH. However, the irregular western disturbances lead to high variability in the winter recycling ratio. Our analysis shows a strong diurnal cycle of recycling ratio in NWH which peaks in the afternoon. The trend analysis from twenty years although did not show any significant trend in recycled precipitation, other variables affecting land-atmosphere interaction such as soil moisture, latent heat and 2-meter air temperature showed significant trends in NWH. We also studied land-atmosphere interaction over two contrasting regions: the foothills of Himalaya and the high-elevation region. The recycled precipitation was high in the lower elevations during summer and at higher elevations during winter. We also found higher land-atmosphere interaction during summer at higher elevations and during both summer and winter at foothills. However, due to continuous precipitation along the foothills of NWH, a brief shift in soil moisture to a wet regime is expected during monsoon which reduces the influence of soil moisture on the atmosphere leading to low land-atmosphere interaction. However, good land-atmosphere interaction exists throughout the summer in the higher Himalaya, where this change in regime is not apparent.

How to cite: Navale, A. and Lanka, K.: Land-Atmosphere Interactions over North West Himalaya, EGU General Assembly 2024, Vienna, Austria, 14–19 Apr 2024, EGU24-544, https://doi.org/10.5194/egusphere-egu24-544, 2024.

EGU24-1391 | ECS | PICO | HS7.9 | Highlight

US Corn Belt enhances regional precipitation recycling 

Zhe Zhang, Cenlin He, Fei Chen, Gonzalo Miguez-Macho, Changhai Liu, and Roy Rasmussen

Precipitation recycling, characterized by the contribution of local evapotranspiration (ET) to local precipitation, is a critical component of the
regional water cycle. In the US Corn Belt, vast croplands and irrigation applications have markedly modified surface energy and water balance, which in
turn modulates precipitation recycling. However, previous studies often neglected the complex hydrological and crop physiological processes at land surface with an oversimplified assumption. In this study, we aim to understand the precipitation recycling in the US Corn Belt with explicit shallow groundwater dynamics, crop growth, and irrigation processes in the WRF model, with the water vapor tracer (WVT) capability to track ET directly from croplands. We found that the croplands exhibit a strong cooling effect on air temperatures and increasing summer precipitation. The increase in precipitation can be attributed to enhanced precipitation recycling, ranging from 11 to 22%, and much stronger seasonality during summer growing seasons. Such cooling effect and contribution to precipitation recycling is more significant in a drought year compared to normal and wet years, depending on both large-scale moisture advection and local moisture source. Our results have important implications to modeling ecohydrology and agricultural management in the Earth system, understanding precipitation recycling in the entire water cycle and designing sustainable water resource governance.

How to cite: Zhang, Z., He, C., Chen, F., Miguez-Macho, G., Liu, C., and Rasmussen, R.: US Corn Belt enhances regional precipitation recycling, EGU General Assembly 2024, Vienna, Austria, 14–19 Apr 2024, EGU24-1391, https://doi.org/10.5194/egusphere-egu24-1391, 2024.

EGU24-1607 | PICO | HS7.9

Impacts of irrigation on local, regional, and remote climate 

Min-Hui Lo and Hung-Chen Chen

Irrigation significantly impacts climate across local, regional, and remote scales. This critical agricultural practice transforms local land surface properties, leading to increased soil moisture and consequent changes in the surface energy balance. Such changes typically result in cooler local surface temperatures due to higher latent heat flux from enhanced evapotranspiration. Beyond its local effects, irrigation substantially influences regional climate and hydrology. The introduction of additional moisture into the atmosphere from irrigated areas can alter regional atmospheric dynamics, potentially affecting cloud formation and modifying precipitation patterns. While irrigation practices can be beneficial for agriculture, they may also have unintended consequences on regional climates, including altering rainfall distribution. Furthermore, the implications of irrigation can extend to remote climate systems. Irrigation-induced redistribution of heat and moisture can influence atmospheric circulation patterns and atmospheric wave dynamics, impacting hydroclimate far beyond the immediate area of irrigation. These remote effects underscore the interconnected nature of global climate systems and the extensive impact of localized human activities like irrigation.

In sum, irrigation exerts a cascading influence on climate systems at various scales. It reshapes local surface conditions, drives changes in regional atmospheric processes, and has potential implications for remote climates. Comprehending these complex interactions is crucial for formulating sustainable irrigation strategies and addressing the broader climatic impacts of such practices.

How to cite: Lo, M.-H. and Chen, H.-C.: Impacts of irrigation on local, regional, and remote climate, EGU General Assembly 2024, Vienna, Austria, 14–19 Apr 2024, EGU24-1607, https://doi.org/10.5194/egusphere-egu24-1607, 2024.

Land use and cover change (LULCC) is an important climatic forcing. However, it is challenging to quantify the responses of local precipitation to LULCC forcing due to the complex interaction between the land surface and atmosphere. The ecologically fragile Loess Plateau (LP) of China has experienced evident changes in precipitation patterns, but the underlying mechanism remains unclear. The biophysical effects of LULCC on precipitation and the water vapor balance in the LP region were quantified based on the LULCC forcing experiments from the sixth phase of the Coupled Model Intercomparison Project (CMIP6). We found that the selected 11 Earth system models (ESMs) reproduced the general spatial pattern of annual precipitation on the LP region, with slight overestimation in the southern LP. The multimodel ensemble (MME) average showed that global LULCC forcing exerted a negative effect on long-term mean precipitation in this region during the period of 1850-2014. In particular, it decreased evidently during the period from 1850 to 1960, with a reduction of approximately 14.1 mm. However, a positive effect was detected for the period of 1961-2014, with an increase of 6.4 mm in annual precipitation. This is largely related to the intensified water vapor transport in the southern boundary and westerly belt of the LP region resulting from global LULCC forcing. Furthermore, water vapor balance analysis showed that global LULCC forcing resulted in a divergence in water vapor transport within the LP region, leading to a net water vapor output to the surrounding regions. These findings highlight the importance of considering global LULCC, in addition to regional LULCC, in studying regional climate change and associated impacts on the water cycle.

How to cite: Qiu, L.: Importance of biophysical forcing of global land cover to local precipitation and water vapor budget on the Loess Plateau of China, EGU General Assembly 2024, Vienna, Austria, 14–19 Apr 2024, EGU24-5039, https://doi.org/10.5194/egusphere-egu24-5039, 2024.

EGU24-6236 | ECS | PICO | HS7.9

Regional impacts of simulated irrigation in the IPSL climate model. 

Pierre Tiengou, Agnès Ducharne, Frédérique Cheruy, Yann Meurdesoif, and Pedro Arboleda

The recent years have shown increasing interest and effort to include simulation of irrigation in Earth System Models to better account for the effects of this anthropogenic process on climate. We present here preliminary results about the impacts of simulated irrigation on surface-atmosphere interactions using LMDZ and ORCHIDEE, the atmosphere and land surface components of the IPSL Climate Model. The DYNAMICO-LMDZ configuration, coupling the physics of LMDZ to the recent icosahedral dynamical core DYNAMICO, is run as a Limited Area Model (LAM) to conduct a regional study over North-Eastern Spain. The simulation domain encompasses the Ebro valley where the LIAISE (Land-surface Interactions with the Atmosphere In Semi-Arid Environment) field campaign was conducted in 2021. This campaign was specifically designed to provide better understanding of the local and regional impacts of irrigation and the surface heterogeneities it creates. A new representation of irrigation, based on a soil moisture deficit approach, has recently been developed in ORCHIDEE and simulations are run with and without it to assess the impacts of simulated irrigation in the model. Direct effects at the land-surface interface (soil moisture, turbulent fluxes, temperature) are studied first, before focusing on the structure of the boundary layer and precipitations. Field observations from the campaign are used to evaluate the model, and the outputs will also be compared to higher-resolution simulations that have been conducted using the Meso-NH model in the context of the LIAISE project. The impacts of irrigation will be studied using various resolutions of the LAM from 10 to 50km, to better understand the scales at which land-surface coupling processes can be explicitly resolved by the dynamics of the model, and assess the importance of parametrizating these processes.

How to cite: Tiengou, P., Ducharne, A., Cheruy, F., Meurdesoif, Y., and Arboleda, P.: Regional impacts of simulated irrigation in the IPSL climate model., EGU General Assembly 2024, Vienna, Austria, 14–19 Apr 2024, EGU24-6236, https://doi.org/10.5194/egusphere-egu24-6236, 2024.

EGU24-8049 | ECS | PICO | HS7.9 | Highlight

Global terrestrial moisture recycling in Shared Socioeconomic Pathways 

Arie Staal, Pim Meijer, Maganizo Kruger Nyasulu, Obbe Tuinenburg, and Stefan Dekker

The global water cycle has undergone considerable changes since pre-industrial times due to global climate change and land-use changes. These drivers will almost certainly continue to change during the course of this century. However, where, how, and to which extent terrestrial moisture recycling will change as a result remains unclear.

Mutually consistent scenarios of climate change and land-use changes for the 21st century are provided by the Shared Socioeconomic Pathways (SSPs). The SSPs provide a framework of five different narratives involving varying degrees of challenges associated with mitigation or adaptation. From each narrative follow different implications for emissions, energy, and land use. The SSPs serve as the conceptual framework behind the sixth generation of the Coupled Model Intercomparison Project, CMIP6.

Terrestrial moisture recycling is often assessed using atmospheric moisture tracking models. An example is UTrack, a Lagrangian model to track moisture through three-dimensional space. Here we present a new forward-tracking version of UTrack that is forced by output of a CMIP6 model to study how terrestrial moisture recycling may change across the globe until the end of the  21st century in a range of SSPs, from mild to severe: SSP1-2.6, SSP2-4.5, SSP3-7.0, and SSP5-8.5. For this forcing, we chose the Norwegian Earth System Model version 2, or NorESM2. It has a temporal resolution of one day and a spatial resolution of 1.25° × 0.9375° at eight pressure levels.

We find that across the 21st century, the global terrestrial moisture recycling ratio decreases with the severity of the Shared Socioeconomic Pathways (SSPs). We calculate a decrease in global terrestrial precipitation recycling by 2.1% with every degree of global warming. Because the SSPs represent internally consistent scenarios of both global warming and global land cover changes, it is hard to distinguish the relative contributions of these two, but the evidence points at a major influence of global warming on moisture recycling.

We find spatial differences in trends in recycling ratios, but which are broadly consistent among SSPs. If a change in precipitation (either drying or wetting) coincides with an increase in terrestrial precipitation recycling ratio, we call it land-dominated. We call the change in precipitation ocean-dominated if it coincides with a decrease in terrestrial precipitation recycling ratio. Land dominance tends to occur in regions with already large terrestrial precipitation recycling ratios, mainly interior South America (land-dominated drying) and eastern Asia (land-dominated wetting). Land-dominated drying may also happen in eastern Europe, in central America and in subtropical sub-Saharan Africa. Ocean-dominance, mainly in the form of wetting, is found primarily in the high northern latitudes and in central Africa.

We also simulated the changes in basin recycling for the 27 major river basins of the world, confirming the overall tendency of decreasing recycling with severity of the SSP, as well as its spatial variations.

How to cite: Staal, A., Meijer, P., Nyasulu, M. K., Tuinenburg, O., and Dekker, S.: Global terrestrial moisture recycling in Shared Socioeconomic Pathways, EGU General Assembly 2024, Vienna, Austria, 14–19 Apr 2024, EGU24-8049, https://doi.org/10.5194/egusphere-egu24-8049, 2024.

The ecological restoration benefits in the Yellow River Basin (YRB) are significant, characterized by increased vegetation and reduced sediment. However, afforestation has resulted in elevated water consumption, posing a threat to the sustainability of ecological functions and socio-economic water use. Previous studies treating evapotranspiration (ET) as absolute water consumption and neglecting the precipitation increase from water recycling, have introduced considerable uncertainty and limited our understanding and prediction of the process. By combining GLEAM ET data and UTrack data, we depicted the contribution of ET in the YRB to local and surrounding basin precipitation .Our study reveals a substantial increase in ET in the YRB from 1980 to 2020. ET in this basin contributes to precipitation in both local and downstream areas through moisture recycling. On average, ET contributes 107 mm/yr of precipitation locally (21%), with the primary contribution from the Upper and Middle region. Additionally, ET contributes 63, 23, 20, and 20 mm/yr of precipitation to the Haihe River Basin, Yangtze Basin, Huaihe River Basin, and Songliao River Basin, respectively. Alongside the increase in ET, its contribution to precipitation is also rising, diminishing outward from the YRB. The increased ET brings about approximately 11 mm/yr of additional precipitation to YRB, offsetting about a quarter of the ET increase. We also provide a schematic diagram illustrating the water cycle in the YRB, elucidating the proportions of each component. This work contributes to a clearer understanding of the basin's hydrological processes, offering scientific support for water resource management and sustainable development in the changing conditions of the YRB.

How to cite: Zhang, H. and Wang, S.: Increased evapotranspiration in the Yellow River basin brings additional precipitation locally and downwindwards, EGU General Assembly 2024, Vienna, Austria, 14–19 Apr 2024, EGU24-8107, https://doi.org/10.5194/egusphere-egu24-8107, 2024.

EGU24-9778 | PICO | HS7.9

Estimating the impact of irrigation and groundwater pumping on regional hydroclimate using an Earth System Model 

Yusuke Satoh, Yadu Pokhrel, Hyungjun Kim, and Tokuta Yokohata

Irrigation is an anthropogenic forcing to the Earth-system that alters the water and heat budgets at the land surface, leading to changes in regional hydro-climate conditions over a range of spatiotemporal scales. These impacts of irrigation are anticipated to escalate in the future due to increased food demand and the pervasive effects of climate change. Thus, it is imperative to better understand the nature, extent, and mechanisms through which irrigation affects the Earth's system. However, despite its increasing importance, irrigation remains a relatively nascent component in the Earth-system modeling community, necessitating advancements in modeling and a deepened understanding.

Our research aims to improve the quantitative understanding of the impacts of irrigation and groundwater use as anthropogenic drivers on regional climate and environmental changes. To this end, we developed an improved Earth-system modeling framework that is based on MIROC-ES2L (Hajima et al 2020 GMD) coupled with hydrological human-activity modules (Yokohata et al. 2020 GMD). This model enables the simulation of a coupled natural-human interaction including hydrological dynamics associated with irrigation processes. Employing this Earth-system model, we carried out a numerical experiment in T85 spatial resolution, utilizing an AMIP style set-up. Here, our ensemble simulation allows for statistical quantification of the irrigation impact differentiating them from the uncertainties arising due to natural variability.

Through our investigation, we have identified specific regions and seasons where irrigation exerts a discernible influence on regional hydro-climate. Notably, our results show substantial disparities—larger than or comparable to inter-annual variability—between simulations incorporating and excluding the irrigation process, particularly in heavily irrigated regions such as Pakistan and India. Our model demonstrates that the introduction of moisture into the soil through irrigation alters the hydrological balance of the land surface, consequently influencing the overlying atmosphere. Conversely, we found significant uncertainty in the impact estimate for some regions, even those heavily irrigated, such as the central United States and eastern China, indicating the challenges of robustly estimating irrigation impacts with limited samples. This underscores the necessity for an appropriate statistical approach to evaluate the impact of irrigation, considering the inherent variability. Furthermore, our study delves into estimating regional variations in the contributions of groundwater and surface water use to these impacts. Emphasizing the importance of a more nuanced understanding of regional characteristics in irrigation impact assessments, our research underscores the significance of coupled earth system models in comprehending and predicting the intricate interplay between human activities and the Earth's climate system.

How to cite: Satoh, Y., Pokhrel, Y., Kim, H., and Yokohata, T.: Estimating the impact of irrigation and groundwater pumping on regional hydroclimate using an Earth System Model, EGU General Assembly 2024, Vienna, Austria, 14–19 Apr 2024, EGU24-9778, https://doi.org/10.5194/egusphere-egu24-9778, 2024.

EGU24-12725 | ECS | PICO | HS7.9 | Highlight

Hydrological implications of future tree cover change and climate change 

Imme Benedict, Freek Engel, Caspar T. J. Roebroek, and Anne J. Hoek van Dijke

The availability of fresh water over land may become increasingly scarce under climate change. Future large scale tree cover changes can either enhance or mitigate this water scarcity. Previous work focused mostly on the impact of tree cover change in our current climate. Instead, we investigate the impact of climate change and future global tree cover change on precipitation, evapotranspiration, and runoff (water availability) in a future climate. To do so, multiple datasets and methodologies are combined; data from five CMIP6 models, a future tree cover change dataset, six Budyko models and a moisture recycling dataset. With this interdisciplinary data-driven approach the separate and combined effects of future climate change and future large-scale tree cover change can be quantified. The changes in water availability are studied on grid cell level (1 by 1 degrees), averaged over the globe, and aggregated for selected river basins (Yukon, Mississippi, Amazon, Danube and Murray-Darling).

Globally averaged, future climate change results in an increase in runoff where future tree cover change decreases the runoff. Both effects are of similar magnitude and lead to a limited net effect in water availability compared to the present climate. However, locally, the effects of tree cover change and climate change can be substantial, resulting in changes in water availability of more than 100 mm/year, either positive or negative. For the five selected river basins different responses in direction and magnitude of water availability are found due to future tree cover change under climate change. In all catchments, except the Mississippi basin, the climate change signal dominates over the tree cover change signal. For the Mississippi basin we find a dominant impact of tree cover change, opposite to the climate change signal, resulting in reduced water availability.

How to cite: Benedict, I., Engel, F., Roebroek, C. T. J., and Hoek van Dijke, A. J.: Hydrological implications of future tree cover change and climate change, EGU General Assembly 2024, Vienna, Austria, 14–19 Apr 2024, EGU24-12725, https://doi.org/10.5194/egusphere-egu24-12725, 2024.

EGU24-13419 | ECS | PICO | HS7.9

Irrigation impact on thermodynamics in weather forecast modelling 

Kirsten Maria FLORENTINE Weber, Linus Magnusson, Gianpaolo Balsamo, Margarita Choulga, Souhail Boussetta, Xabier Pedruzo Bagazgoitia, and Gabriele Arduini

By 2030, over 300 million hectares worldwide will be irrigated, constituting the second most significant anthropogenic influence on land use following urbanisation. Our study focuses on an irrigated Terrestrial Environmental Observatories (TERENO)/Integrated Carbon Observation System (ICOS) site in Germany, unveiling irrigation's immediate effects on soil moisture, latent heat flux, skin and soil temperature. As we strive to seamlessly integrate irrigation processes into the ECMWF Integrated Forecasting System (IFS), our investigation extends to an offline model, ECLand, including dynamical vegetation. Introducing a perturbed precipitation field offers a refined perspective of mimicking irrigation. The feedback provides us with insights into the coupling of simple irrigation representation on thermodynamic variables, ensuring optimal benefits for the IFS. After verification with remote sensing data, the next step involves coupling water fluxes to stomatal conductance via photosynthesis, shedding light on the preliminary influence of irrigation on enhanced vegetation growth. This aims to untangle irrigation effects of increased soil moisture and greening. 

How to cite: Weber, K. M. F., Magnusson, L., Balsamo, G., Choulga, M., Boussetta, S., Pedruzo Bagazgoitia, X., and Arduini, G.: Irrigation impact on thermodynamics in weather forecast modelling, EGU General Assembly 2024, Vienna, Austria, 14–19 Apr 2024, EGU24-13419, https://doi.org/10.5194/egusphere-egu24-13419, 2024.

EGU24-15039 | ECS | PICO | HS7.9

Fate and changes in moisture evaporated from the Tibetan Plateau (2000–2020) 

Chi Zhang, Deliang Chen, Qiuhong Tang, Jinchuan Huang, and Mei Yan

The Tibetan Plateau (TP) has been termed the “Asian water tower” and it plays an important role in regulating the Asian water cycle, which affects billions of people. Although the areal mean evaporation of the TP is not high, the total evaporation integrated over the vast terrain of the TP is huge and may strongly influence downwind regions. However, the ultimate fate of this evaporation moisture remains unclear. This study tracked and quantified TP-originating moisture using an extended WAM2Layers model. The findings reveal that the involvement of moisture from the TP in the downwind precipitation is most pronounced near the eastern boundary of the TP and gradually diminishes eastward. Consequently, the TP moisture ratio in precipitation reaches the highest of over 30% over the central-eastern TP. 44.9–46.7% of TP annual evaporation is recycled over the TP, and 65.1–66.8% of the TP evaporation is reprecipitated over terrestrial China. Moisture recycling of TP origin shows strong seasonal variation, with seasonal patterns largely determined by precipitation, evaporation and wind fields. High levels of evaporation and precipitation over the TP in summer maximize local recycling intensity and recycling ratios. Annual precipitation of TP origin increased mainly around the northeastern TP during 2000–2020. This region consumed more than half of the increased TP evaporation. Further analyses showed that changes in reprecipitation of TP origin were consistent with precipitation trends in nearby downwind areas: when intensified TP evaporation meets intensified precipitation, more TP moisture is precipitated out. This study also analyzed the uncertainty due to different tracking modes in WAM2Layers, i.e., backward and forward moisture tracking. In forward moisture tracking, the annual precipitation recycling ratio (PRR) of the TP was estimated to be 26.9–30.8%. However, due to the non-closure issue of the atmospheric moisture balance equation, the annual PRR in backward tracking could be ~6% lower.

How to cite: Zhang, C., Chen, D., Tang, Q., Huang, J., and Yan, M.: Fate and changes in moisture evaporated from the Tibetan Plateau (2000–2020), EGU General Assembly 2024, Vienna, Austria, 14–19 Apr 2024, EGU24-15039, https://doi.org/10.5194/egusphere-egu24-15039, 2024.

EGU24-16857 | ECS | PICO | HS7.9

Reconciling bilateral connections of atmospheric moisture within the hydrological cycle 

Simon Felix Fahrländer, Elena De Petrillo, Marta Tuninetti, Lauren Seaby Andersen, Luca Monaco, Luca Ridolfi, and Francesco Laio

To improve our understanding of how we are connected globally through water flows, at scales relevant to policy and management, is imperative for global water stewardship. It is therefore crucial to describe the fate of moisture in the atmosphere by evaluating the global moisture inter-dependencies at the country level.  However, few studies have addressed global moisture inter-dependencies at the country level.

In this study, we present a novel dataset of country-to-country atmospheric moisture flows, including both terrestrial and oceanic sources, and propose an approach to assure the closure of the global and country-scale atmospheric water balance. By adopting an analogy with international trade analysis, we employ an iterative proportional fitting method to adjust the bilateral exchanges of water vapor from sources to sinks, ensuring that the total imported (exported) atmospheric moisture equals the total precipitation (evaporation) derived from ERA5 on an annual basis. 

Relevant analysis to understand water inter-dependencies between countries and regions can be performed from the bilateral matrix we present. We assess the terrestrial moisture recycling ratio (TMR) as the portion of countries’ or regions’ precipitation originating from terrestrial evaporation. Furthermore, we estimate a global TMR of 36%, while we find the highest TMRs are those of Eastern Asia (64%), Eastern Europe (68%), and Central Africa (79%). The bilateral structure of the dataset allows also to shed light on key links (and relative weights) dominating the exchange of atmospheric moisture between two countries or regions, thus supporting inter-countries water governance. For example, Central Africa receives 80% of its terrestrially sourced precipitation from Eastern Africa, while Eastern Europe evenly gets moisture from four distinct links, Eastern Asia, Central Asia, Southern Europe and Northern Europe, covering 70% of its import from terrestrial sources. 

Future studies can leverage the dataset to explore nations’ links in the global atmospheric moisture flow network and assess their role in the global hydrological cycle.

How to cite: Fahrländer, S. F., De Petrillo, E., Tuninetti, M., Andersen, L. S., Monaco, L., Ridolfi, L., and Laio, F.: Reconciling bilateral connections of atmospheric moisture within the hydrological cycle, EGU General Assembly 2024, Vienna, Austria, 14–19 Apr 2024, EGU24-16857, https://doi.org/10.5194/egusphere-egu24-16857, 2024.

EGU24-17252 | ECS | PICO | HS7.9 | Highlight

Impacts of the Three Gorges Dam on regional precipitation: based on high resolution simulation 

Peiyi Peng, Yiming Zhang, and Xu Di

The Three Gorges Dam (TGD), as the largest hydropower project, resulting in increasing water area from 408km2 to 1084km2 and extending waterway into 660 km. It is obvious that land use change would influence regional precipitation, but affected region owing to the TGD is on dispute. Moreover, the highest resolution of previous studies is 1.5 km, however the width of artificial lake formed by the TGD is about 1.1 km. To this end, we address the need of a higher resolution of numerical simulation by running weather research and forecast (WRF) model with 3 two-way nested domains. Two simulations under different land use (with or without TGD) are compared. Results showed that regional precipitation is suppressed owing to TGD to some extent. More precisely, increasing precipitation happens in downwind region, whereas decreasing precipitation occurs upwind region. Besides, water surface expansion leads to a reduction in surface temperature within 0~5 km of surrounding area. The TGD construction increase specific humidity and surface within 5 km buffer. That is because water surface expansion results in moisture surplus in nearby region.

How to cite: Peng, P., Zhang, Y., and Di, X.: Impacts of the Three Gorges Dam on regional precipitation: based on high resolution simulation, EGU General Assembly 2024, Vienna, Austria, 14–19 Apr 2024, EGU24-17252, https://doi.org/10.5194/egusphere-egu24-17252, 2024.

EGU24-19575 | ECS | PICO | HS7.9

Analysis of moisture recycling at unprecedented resolution in the western Mediterranean region  

Damián Insua Costa, Jessica Keune, Akash Koppa, Christian Massari, and Diego G. Miralles

The western Mediterranean region is a climate change hotspot, where the increase in temperature far exceeds the global average. This is causing its hydrological cycle to be highly impacted, with an increase in the frequency and intensity of droughts, extreme precipitation and floods. For this reason, a more holistic understanding of the atmospheric branch of water cycle and its connexion to meteorological changes is needed. Here we use satellite-based observational data recently generated within the 4DMED-Hydrology ESA project to analyse the atmospheric water transport in the region at an unprecedented resolution. Specifically, we combine a Lagrangian back-trajectory model for moisture tracking (FLEXPART–HAMSTER; Keune et al., 2022) with observed evaporation and precipitation data to quantify moisture recycling at 1 km spatial resolution. Our results show average local precipitation recycling rates close to 30% in summer months, in agreement with previous studies (Batibeniz et al., 2020), but this rate is highly variable over time, being much higher in periods of drought, when water supply is most needed. Likewise, the results reveal that evaporation recycling is highly spatially variable, meaning that moisture evaporated in some parts of the Mediterranean region is much more efficiently rained within the same region than others. For instance, in the Po Valley, the fraction of evaporation that returns to the region as rain is much higher than in its surroundings, which is why we consider it as a Mediterranean moisture source hotspot. Our findings demonstrate how meteorological anomalies can affect the transfer of water through the atmosphere in the region, and highlight the importance of investing in high-resolution Earth observation to advance our understanding of the different branches of the hydrological cycle. 

References: 

Keune, J., Schumacher, D. L., & Miralles, D. G. (2022). A unified framework to estimate the origins of atmospheric moisture and heat using Lagrangian models. Geoscientific Model Development, 15(5), 1875–1898. https://doi.org/10.5194/gmd-15-1875-2022 

Batibeniz, F., Ashfaq, M., Önol, B., Turuncoglu, U. U., Mehmood, S., & Evans, K. J. (2020). Identification of major moisture sources across the Mediterranean Basin. Climate Dynamics, 54, 4109-4127. https://doi.org/10.1007/s00382-020-05224-3 

How to cite: Insua Costa, D., Keune, J., Koppa, A., Massari, C., and G. Miralles, D.: Analysis of moisture recycling at unprecedented resolution in the western Mediterranean region , EGU General Assembly 2024, Vienna, Austria, 14–19 Apr 2024, EGU24-19575, https://doi.org/10.5194/egusphere-egu24-19575, 2024.

EGU24-20936 | ECS | PICO | HS7.9 | Highlight

Atmospheric moisture recycling and its influence in the Sudd Region in the Upper Nile Basin 

Yueyang Chen and Asaad Shamseldin

Moisture recycling, is defined as the precipitation in a region which is partially contributed
by evapotranspiration from the same region. It is the interaction between terrestrial hydrology
and atmospheric processes, and plays a crucial role in forming local water resources and
affecting local climate. Up to date, global moisture recycling at regional and continental
scales has been understood relatively well, the patterns of local moisture recycling and the
main variables impacting it remain unclear. For wetlands, the evaporation alters local climate
by re-precipitation in surrounding regions, which can also be analysed from the viewpoint of
moisture recycling. Yet, there is rare research has been done in this viewpoint to analyse and
manage water resources of wetlands. It is thus of importance to carry out such research to
unveil it. As the largest wetland in Africa, the Sudd region has relatively large precipitation
recycling contributed by the surrounding regions, as well as large swampy areas of upper
Nile Basin, which makes it an appropriate study case for the moisture recycling of wetlands.
In this research, it is the first time to carry out atmospheric moisture recycling of Sudd region,
considering anthropogenic activities such as engineering practices, hydro-politics and
complex system. In this article, we will present multi-year hydro-climatology patterns of
Sudd, and the calculation results from Water Accounting Model-Two Layers (WAM-
2layers), including water vapor sources of its precipitation, and the reprecipitation of its
evapotranspiration. We will also analyse their spatial distributions, origin and destination, and
find the multi-year average moisture recycling ratio of the basin. From our calculation, it is as
high as 24% in some regions. In summary, this work shows that Sudd region is of great
significance to the neighbouring regions in terms of moisture recycling, and this would be
also useful to provide a practical basis for planning by considering local land-atmosphere
interaction.

How to cite: Chen, Y. and Shamseldin, A.: Atmospheric moisture recycling and its influence in the Sudd Region in the Upper Nile Basin, EGU General Assembly 2024, Vienna, Austria, 14–19 Apr 2024, EGU24-20936, https://doi.org/10.5194/egusphere-egu24-20936, 2024.

EGU24-599 | ECS | Posters on site | AS1.22

Langragian analysis of the extreme-windstorm dynamics associated to post-tropical cyclone Leslie landfall in Portugal 

Miguel Lima, Luana C. Santos, Rita M. Cardoso, Pedro M. M. Soares, and Ricardo M. Trigo

Windstorms in Europe are responsible for more than half of the economic loss associated with natural disasters. In October 2018 a post-tropical cyclone, formerly Hurricane Leslie, made landfall in continental Portugal. This event was characterized by very intense winds, with a gust record-hitting value of 176 km/h registered near Figueira da Foz, a coastal city located in the center of the country. The main factors causing this event of extreme winds were likely a “cold-conveyor belt jet” or a “jet sting”, roughly 12 hours after losing its main tropical characteristics. Despite the strong impact associated with this windstorm there are still few studies modeling this kind of dynamics, and here we present a simulation and thorough analysis of the rare dynamics linked with this post-tropical cyclone affecting western Europe.

The WRF-ARW model, version 4.4.1, was used to numerically model Leslie as it transitioned from a hurricane to post-tropical cyclone. Three one-way nested domains were used with a large (5 km), medium (1 km), and lower (200m) resolution, with 68 hybrid levels (15 m - 20 hPa). The larger domain covers the Iberian Peninsula and a large portion of the Atlantic Ocean nearby, while the inner ones are focussed in the central and northern sectors of continental Portugal - the most affected areas. Initial and boundary conditions were retrieved from the GFS operational analysis at 0.25º spacing, in 6-hour intervals. Due to the difficulties modeling this cyclone, nudging was used in the outer domain to ensure that the cyclone would make landfall as close as possible to the real location.

Several state-of-the-art thermodynamics-based diagnostics were used to analyze in-depth the midlatitude cyclone dynamics observed in the recently transitioned cyclone Leslie. Midlatitude cyclone-related dynamics were identified in the simulation, leading to the extreme winds in the most impacted region. The set of final simulated data reveals a close resemblance to the real event, with parameterized wind gusts presenting a lower intensity around 140 km/h, but the largest values impacting approximately the same region of center Portugal. A Langragian approach was also used to study particle trajectories and evaluate the atmospheric circulation leading to the extreme winds showing vertical downdrafts up to 4 m/s. This study highlights the catastrophic potential a post-tropical cyclone such as Leslie has and, while at the end of their life-time with presumably less intensity, storms of this type should not be disregarded for warnings and need to be considered in general evaluations of midlatitude storm impacts.

Acknowledgements: This work was funded by the Portuguese Fundação para a Ciência e a Tecnologia (FCT) I.P./MCTES through national funds (PIDDAC) – UIDB/50019/2020. M. M. Lima was supported through the PhD MIT Portugal MPP2030-FCT programme grant PRT/BD/154680/2023. L. C. Santos is supported by the EarthSystems Doctoral School, at University of Lisbon, supported by Portuguese Fundação para a Ciência e a Tecnologia (FCT) project UIDP/50019/2020-2023, University of Lisbon.

How to cite: Lima, M., C. Santos, L., M. Cardoso, R., M. M. Soares, P., and M. Trigo, R.: Langragian analysis of the extreme-windstorm dynamics associated to post-tropical cyclone Leslie landfall in Portugal, EGU General Assembly 2024, Vienna, Austria, 14–19 Apr 2024, EGU24-599, https://doi.org/10.5194/egusphere-egu24-599, 2024.

EGU24-1418 | ECS | Posters on site | AS1.22 | Highlight

Windstorm losses in Europe - What to gain from damage datasets 

Julia Moemken, Gabriele Messori, and Joaquim G. Pinto

Windstorms are among the most impacting natural hazards affecting Western and Central Europe. Information on the associated impacts and losses are essential for risk assessment and the development of adaptation and mitigation strategies. In this study, we compare reported and estimated windstorm losses from five datasets belonging to three categories: Indices combining meteorological and insurance aspects, natural hazard databases, and loss reports from insurance companies. We analyse the similarities and differences between the datasets in terms of reported events, the number of storms per dataset and the ranking of specific storm events for the period October 1999 to March 2022 across 21 European countries.

A total of 94 individual windstorms were documented. Only 11 of them were reported in all five datasets, while the large majority (roughly 60%) was solely recorded in single datasets. Results show that the total number of storms is different in the various datasets, although for the meteorological indices such number is fixed a priori. Additionally, the datasets often disagree on the storm frequency per winter season. Moreover, the ranking of storms based on reported/estimated losses varies in the datasets. However, these differences are reduced when the ranking is calculated relative to storm events that are common in the various datasets. The results generally hold for losses aggregated at European and at country level.

Overall, the datasets provide different views on windstorm impacts. Thus, to avoid misleading conclusions, we use no dataset as “ground truth” but treat all of them as equal. We suggest that these different views can be used to test which features are relevant for calibrating windstorm models in specific regions. Furthermore, it could enable users to assign an uncertainty range to windstorm losses. We conclude that a combination of different datasets is crucial to obtain a representative picture of windstorm associated impacts.

How to cite: Moemken, J., Messori, G., and Pinto, J. G.: Windstorm losses in Europe - What to gain from damage datasets, EGU General Assembly 2024, Vienna, Austria, 14–19 Apr 2024, EGU24-1418, https://doi.org/10.5194/egusphere-egu24-1418, 2024.

EGU24-1553 | ECS | Posters on site | AS1.22

An Investigation into the Role of the Ocean for Seasonal Predictability of European Windstorms 

Kelvin S. Ng and Gregor C. Leckebusch

Extreme extra-tropical cyclones and related windstorms are the most dangerous and costly meteorological hazards in Europe. The latest state-of-the-art seasonal forecast suites show now usable forecast skill for basic parameters like mean temperature or precipitation for mid-latitude Europe on lead times of up to 4 months (Nov-Feb). One avenue for skilful prediction of extremes is the now-proven forecast skill for large-scale climate modes, as these directly influence extreme windstorms. Improved ability to simulate successfully the relevant large-scale climate patterns like e.g., the North-Atlantic Oscillation, the East-Atlantic pattern, and/or the Scandinavian pattern opens up a prominent route to progress the forecast skill for extreme storms.

Nevertheless, recent publications have shown that even in the current model suites, the existing skill for forecasting the frequency or intensity of windstorm tail events, is not fully explained by those dominant large-scale variability patterns. Furthermore, studies revealed a potential connectivity of storm count predictions to stratospheric sudden warming events and also highlighting the influence of atmosphere-ocean coupling. Recent developments in the forecast skill of the upper-ocean heat content and the role of re-emerging temperature anomalies for the European winter climate allow to explore another pathway with potentially predictive power, the role of ocean-atmosphere interaction. Ocean-atmosphere interaction caused e.g., by the NAO have been increasingly recognised but have not been systematically linked to the ability to predict extreme severe windstorms on a seasonal time scale. In this presentation, we will present preliminary results of the role of ocean on the predictability of European windstorms.

How to cite: Ng, K. S. and Leckebusch, G. C.: An Investigation into the Role of the Ocean for Seasonal Predictability of European Windstorms, EGU General Assembly 2024, Vienna, Austria, 14–19 Apr 2024, EGU24-1553, https://doi.org/10.5194/egusphere-egu24-1553, 2024.

EGU24-1736 | ECS | Posters on site | AS1.22 | Highlight

Intra-seasonal variability of temporal clustering of European winter windstorms 

Sophie Feltz, Gregor C. Leckebusch, Kelvin S. Ng, and Tim Kruschke

Severe European winter windstorms are one of the most damaging natural hazards and thus a major threat to societies. Clustered European winter windstorms, storms that occur in quick succession over a specific period of time over a fixed location, can result in amplified structural and environmental damage and accumulated losses. Yet, variability of storm clustering on intra-seasonal timescales has not been fully investigated. We analyse winters (DJF) for the period 1981-2016 from ERA5 reanalysis, where tracks and storm impact footprints are identified through the impact-oriented wind-based tracking algorithm WiTRACK.  

We quantify the magnitude of clustering using the widely employed dispersion statistic as used in Mailier et al. (2006). The spatial distribution of clustering on 45- and 30-day timescales as well as the time development of clustering on even shorter 30-, 20-, 15- and 11-days reference periods are investigated. Thus, in a seamless approach from seasonal to synoptic clustering. Results from both windstorm clustering of tracks and the storm footprints will be presented. Preliminary findings suggest an increase in clustering occurrence in the later half of the winter season on 45- and 30-day timescales.  On shorter timescales (<30 days), depending on location, distinct periods of increased clustering e.g., in the middle and the end of the season can be identified.

How to cite: Feltz, S., Leckebusch, G. C., Ng, K. S., and Kruschke, T.: Intra-seasonal variability of temporal clustering of European winter windstorms, EGU General Assembly 2024, Vienna, Austria, 14–19 Apr 2024, EGU24-1736, https://doi.org/10.5194/egusphere-egu24-1736, 2024.

EGU24-1974 | ECS | Posters virtual | AS1.22

Shifting of Western Disturbances winter precipitation over Western Himalayas 

Pooja Pooja and Ashok Priyadarshan Dimri

The Indian Himalayan region receives an enormous amount of precipitation due to synoptic weather systems known as Western Disturbances (WDs). WDs are east-ward propagating systems embedded in the Subtropical Westerly Jetstream (SWJ). The main objective of this study is to investigate the change in magnitude and dynamics of WDs precipitation over the western Himalayan region. In this study, different observational datasets (IMD, AHRODITE, GPCP, GPCC, and ERA5) were selected to compare and assess the magnitude of WDs precipitation for the period 1987–2020 during the winters (DJF: December, January, and February). Further, to examine the structure of WDs precipitation at the pressure level of 200hPa, ERA5 Reanalysis datasets having a similar resolution of 25 km with the gridded dataset of the Indian Meteorological Department (IMD) are used for the analysis. WDs moisture sources from the Arabian Sea are assessed at 23 pressure levels (1000–200 hPa) for further understanding of WDs dynamics. Our study shows the daily shifting of WDs precipitation towards February during the winters and an intriguing decrease in daily WDs precipitation in recent years. During the study, we found that WDs precipitation contributed a significant amount of precipitation (~80%) over the Western Himalayan region of the Indian subcontinent. Using Theil-Sen method, trend analysis was performed, showing a decreased trend of WDs precipitation in recent years The present findings indicate that WDs have changed their precipitation characteristics and dynamics due to climate change. The number of active WDs days is decreasing. Our results show there is enough moisture present over the Bay of Bengal region other than WDs which helps in sustaining and replenishing glaciers over the Indian Himalayan region.

How to cite: Pooja, P. and Dimri, A. P.: Shifting of Western Disturbances winter precipitation over Western Himalayas, EGU General Assembly 2024, Vienna, Austria, 14–19 Apr 2024, EGU24-1974, https://doi.org/10.5194/egusphere-egu24-1974, 2024.

EGU24-3651 | ECS | Orals | AS1.22

Air-Sea Flux Influences on Extratropical Cyclone and Atmospheric River Mesoscale Development and Upstream Temporal Clustering 

Juan Crespo, Catherine Naud, Rosa Luna-Niño, James Booth, and Derek Posselt

Latent and sensible heat fluxes (LHF and SHF, respectively) within the marine boundary layer are believed to play a significant role in the genesis and evolution of Extratropical Cyclones (ETCs) and Atmospheric Rivers (ARs, often associated with ETCs in the midlatitudes). However, consistent observations of air-sea interactions with in-situ observatories are limited in both time and space, and traditional polar orbiting satellites may miss large swaths in the lower midlatitudes due to their orbits, leading to daily gaps in coverage where the most robust fluxes often occur and change rapidly. Satellite missions like CYGNSS (Cyclone Global Navigation Satellite System) have filled in data gaps by providing improved observations over the lower midlatitudes of air-sea interactions. These improved observations of air-sea processes, coupled with observations of cloud and precipitation structure within ETCs and ARs from other satellites, like GPM and MODIS, can help one begin to link the correlations between surface heat fluxes to changes of the mesoscale features within these synoptic-scale systems. Previous studies have shown the correlation of observed surface heat fluxes to precipitation and cloud thickness increases along the frontal regions. Still, they have only looked at the connections between ETCs and ARs when LHF and SHF were at their strongest or the peak intensity of the system, not during its early formation (or just before formation) when they may be at their strongest. 

Additionally, recent studies have examined through idealized models how surface heat fluxes within an ETC can impact the development of ETCs and ARs upstream of the primary cyclone and lead to multiple ETCs in succession, often called a family or temporal clustering of ETCs and ARs. This clustering can lead to significant and excessive precipitation over parts of the globe, such as the United States West Coast in early 2023, with successive ARs over one month. Improved observations of real-world conditions can help us better understand the interplay within these systems. This presentation will highlight the role air-sea interactions may have during the genesis and early evolution of ETCs and ARs, the correlations to cloud and precipitation structure changes, the upstream impacts, and setting the groundwork that will be able to show that air-sea interactions directly impact the development of these systems.

How to cite: Crespo, J., Naud, C., Luna-Niño, R., Booth, J., and Posselt, D.: Air-Sea Flux Influences on Extratropical Cyclone and Atmospheric River Mesoscale Development and Upstream Temporal Clustering, EGU General Assembly 2024, Vienna, Austria, 14–19 Apr 2024, EGU24-3651, https://doi.org/10.5194/egusphere-egu24-3651, 2024.

EGU24-3675 | Orals | AS1.22 | Highlight

Poleward intensification of midlatitude extreme winds under warmer climate 

Emanuele Silvio Gentile, Ming Zhao, and Kevin Hodges

In this work, we investigate the global impact of midlatitude cyclones on the geographical distribution and intensity of near-surface extreme wind speeds in a warmer climate. We use  state-of-the-art high-resolution general circulation models developed by the Geophysical Fluid Dynamics Laboratory. Results indicate a clear poleward shift of extreme wind speeds, driven by the associated shift in midlatitude storm tracks, and attributed to global warming and associated changes in general circulations. The total number of midlatitude cyclones decreases by roughly 4%, but the proportion of cyclone-associated extreme wind speed events increases by 10% in a warmer climate. Notably, the research has identified Northwestern Europe, the British Isles, and the West Coast of North America as hot spots with the greatest socio-economic impacts from increased cyclone-associated extreme winds. In addition, we also use the GFDL ultra-high resolution global storm resolving model to study cyclone-associated extreme winds.

How to cite: Gentile, E. S., Zhao, M., and Hodges, K.: Poleward intensification of midlatitude extreme winds under warmer climate, EGU General Assembly 2024, Vienna, Austria, 14–19 Apr 2024, EGU24-3675, https://doi.org/10.5194/egusphere-egu24-3675, 2024.

EGU24-3750 | ECS | Orals | AS1.22

Perturbation Energetics of the December 2022 Bomb Cyclone over North America 

Emerson DeLarme, Jianping Li, Hongyuan Zhao, Yuan Liu, and Ruipeng Sun

Bomb cyclones over land are an understudied phenomenon. As such, there are open questions about the underlying physical processes, for example, why do bomb cyclones stop deepening. Atmospheric energetics is a prevalent approach to solve such problems, however the commonly used method of Available Potential Energy is not valid at local scales. Therefore, this study aims to provide further insight into the life cycle of bomb cyclones, specifically over land, by conducting a case study of the bomb cyclone that occurred over North America at the end of December 2022, focusing on the energetics using the Perturbation Potential Energy (PPE) framework. Hourly ERA5 reanalysis data provides the improved time resolution needed to study the evolution of such a rapidly developing system. PPE analysis of the evolution of this bomb cyclone reveals a possible stop signal to the positive feedback loop associated with explosive deepening. Further research is needed to clarify the mechanics associated with this thermodynamic signal.

How to cite: DeLarme, E., Li, J., Zhao, H., Liu, Y., and Sun, R.: Perturbation Energetics of the December 2022 Bomb Cyclone over North America, EGU General Assembly 2024, Vienna, Austria, 14–19 Apr 2024, EGU24-3750, https://doi.org/10.5194/egusphere-egu24-3750, 2024.

EGU24-5188 | ECS | Posters on site | AS1.22

A climatology of Mediterranean cyclones and compound weather extremes 

Alice Portal, Olivia Martius, Shira Raveh-Rubin, and Jennifer L Catto

Mediterranean cyclones are the main driver of surface weather extremes in the Mediterranean region. In this work we establish a new procedure for the attribution of different types of meteorological extremes to Mediterranean cyclones, where we also distinguish the presence of different airflows (warm conveyor belts, dry intrusions) and fronts composing the structure of a cyclone. We apply the procedure to a dataset of rain-wind and wave-wind compound extremes extracted from ERA5 reanalysis in a recent climatological period, and show that the majority of weather compounds occurring in the Mediterranean area is indeed linked to the presence of a nearby cyclone. The association of compound rain-wind events with Mediterranean cyclones locally surpasses an 80% level, while interesting differences between transition seasons and winter are detected. Winter cyclones - generally stronger, larger and distinctively baroclinic - are associated with a higher compound density. The de-construction of the cyclone in airflows and fronts evidences a strong association of rain-wind compounds with regions of warm conveyor belt ascent, and of wave-wind compounds with regions of dry intrusion outflow.

How to cite: Portal, A., Martius, O., Raveh-Rubin, S., and Catto, J. L.: A climatology of Mediterranean cyclones and compound weather extremes, EGU General Assembly 2024, Vienna, Austria, 14–19 Apr 2024, EGU24-5188, https://doi.org/10.5194/egusphere-egu24-5188, 2024.

EGU24-6370 | ECS | Posters on site | AS1.22

A catastrophe model for Windstorm in Italy: developing a stochastic windstorm event set adjusted with open-access reanalysis datasets 

Lorenzo Aiazzi, Simone Persiano, Michele Bottazzi, Glauco Gallotti, Antonio Petruccelli, Farid Ait-Chaalal, and Giovanni Leoncini

Windstorms are one of the most destructive natural disasters in Europe, causing considerable human and economic impacts, ranging from fatalities and injuries to damage to agriculture, infrastructures, and properties. The European Commission’s Joint Research Centre (JRC) estimates annual losses of 5 €-billion for the European Union and United Kingdom (Spinoni et al., 2020). While in these areas there is not high confidence on the projected changes in windstorm intensity and frequency due to climate change (Ranasinghe et al., 2021), damages resulting from windstorms will most likely increase in the future due to the appreciation of asset values (Spinoni et al., 2020).

Although Italy is one of the most affected European countries, with annual absolute losses estimated above 0.5 €-billion (Spinoni et al., 2020), windstorm is still considered to be a secondary peril. However, severe windstorm events in the last few years (e.g., Storm Vaia in October 2018) have raised an increasing interest of the Italian insurance industry in understanding and modelling this peril.

In this context, we aim at developing a catastrophe model that quantifies the financial impacts of windstorms on the insurance market in Italy. To this aim, here we perform the calibration of a stochastic windstorm event set for the hazard component of the model. Uncalibrated footprints are obtained from simulation outputs of global and regional numerical models. Then, historical event footprints are extracted from open-access reanalysis datasets (e.g., ERA5, CERRA) and used to correct the climatology of the stochastic set and to adjust the wind-speeds of its individual events. This analysis is expected to be preparatory for the development of a comprehensive catastrophe model that combines wind hazard with exposure and vulnerability to assess windstorm-related financial losses in Italy.


References:

Ranasinghe, R., et al., 2021: Climate Change Information for Regional Impact and for Risk Assessment. In Climate Change 2021: The Physical Science Basis. Contribution of Working Group I to the Sixth Assessment Report of the Intergovernmental Panel on Climate Change [Masson-Delmotte, V., et al., (eds.)]. Cambridge University Press, Cambridge, United Kingdom and New York, NY, USA, pp. 1767–1926, doi: 10.1017/9781009157896.014.

Spinoni, J., et al., 2020: Global warming and windstorm impacts in the EU, EUR 29960 EN, Publications Office of the European Union, Luxembourg, 2020, ISBN 978-92-76-12955-4, doi:10.2760/039014. JRC118595.

How to cite: Aiazzi, L., Persiano, S., Bottazzi, M., Gallotti, G., Petruccelli, A., Ait-Chaalal, F., and Leoncini, G.: A catastrophe model for Windstorm in Italy: developing a stochastic windstorm event set adjusted with open-access reanalysis datasets, EGU General Assembly 2024, Vienna, Austria, 14–19 Apr 2024, EGU24-6370, https://doi.org/10.5194/egusphere-egu24-6370, 2024.

EGU24-7310 | ECS | Orals | AS1.22

Unlocking the dynamics of extreme wind speeds of North Atlantic storms 

Jun-Hyeok Son, Christian L.E. Franzke, and Seok-Woo Son

North Atlantic extra-tropical storms are some of the most severe weather systems, causing enormous economic damages and threatening human lives. In general, these storms are characterized by strong cyclonic convergent surface winds, upward vertical flow, and precipitation. In specific confined areas inside the storm where downward flows occur with clear sky, extreme surface wind speeds are observed. Such a horizontal variation of vertical wind direction and surface wind speed can cause severe and damaging impacts; however, the underlying key dynamics are not understood. Here we show the dynamical and thermodynamical linkage between the horizontal wind impinging on the frontal surface at the lower troposphere, downward flow, and very intense surface wind speeds inside the storm. The anti-clockwise cyclonic wind into the cold frontal area is mainly responsible for generating the downward flow, which transports the high-altitude horizontal momentum to the surface layer causing intense surface wind speeds. About half of North Atlantic storms accompany the downward wind, and that downward flow is more frequently observed in the southern and western part of the storm center. Overall results illuminated in this paper have a far-reaching impact in multiple ways to enhance forecasting skills for devastating weather events associated with extra-tropical storms.

How to cite: Son, J.-H., Franzke, C. L. E., and Son, S.-W.: Unlocking the dynamics of extreme wind speeds of North Atlantic storms, EGU General Assembly 2024, Vienna, Austria, 14–19 Apr 2024, EGU24-7310, https://doi.org/10.5194/egusphere-egu24-7310, 2024.

EGU24-7801 | ECS | Posters on site | AS1.22

Environmental Characteristics Associated with the Tropical Transition of Mediterranean Cyclones 

Lisa Bernini, Leone Cavicchia, Fabien Desbiolles, Antonio Parodi, Claudia Pasquero, and Enrico Scoccimarro

Using tracks from a reference dataset (Flaounas et al., 2023), cyclones in the Mediterranean Sea have been classified based on thermal winds (Hart, 2003). This classification allowed us to explore the major differences between extra-tropical cyclones with a cold inner core and tropical-like cyclones with a
deep inner warm core. For that purpose, the time evolution along the cyclones’ lifetime of different environmental characteristics taken from the ERA5 reanalysis has been studied. Warm-core cyclones are characterized by higher surface wind speeds, larger air-sea fluxes, and more intense precipitations. In comparison to cold-core cyclones, their development is favored by low wind shear and high moisture levels in the mid-troposphere. Different proxies also attest the major importance of the convective process in the establishment of the warm core. Finally, their dissipation seems to be driven by an abrupt decrease in the mid-level moisture content. This decrease is possibly related to the occlusion phase of the cyclone, and not to a limitation of moisture supply at the surface due to landfall.

How to cite: Bernini, L., Cavicchia, L., Desbiolles, F., Parodi, A., Pasquero, C., and Scoccimarro, E.: Environmental Characteristics Associated with the Tropical Transition of Mediterranean Cyclones, EGU General Assembly 2024, Vienna, Austria, 14–19 Apr 2024, EGU24-7801, https://doi.org/10.5194/egusphere-egu24-7801, 2024.

EGU24-8101 | ECS | Posters on site | AS1.22

Past and future Mediterranean cyclone characteristics using a regional climate model 

Onno Doensen, Martina Messmer, Woon Mi Kim, and Christoph Raible

Extratropical cyclones play a dominant role in the Mediterranean. They are important for local water supplies, but they can also cause severe damage due to heavy winds, extreme precipitation and coastal floods. Over the last decades, a decrease in the number of extratropical cyclones in the Mediterranean has been observed. Climate models suggest that this decreasing trend will continue in the future under global warming, leading to fewer storms and dryer conditions over the region compared to the present. However, it is much less clear how extreme cyclones in the Mediterranean will respond to climate change. Our previous study, based on a simulation from the Community Earth System Model (CESM) covering the last 3500 years, indicates that extreme cyclones show a distinct centennial variability in frequency, cyclone-related precipitation and wind speed. In addition, we found a weak relation between atmospheric circulation modes and varying cyclone characteristics across different regions in the Mediterranean. However, the coarse horizontal resolution of CESM (2.0°×2.5°) is not very well suited to resolve the mesoscale cyclones that often occur in the Mediterranean. For this study, we downscaled the CESM simulation for the period 1821–2100 (RCP8.5 scenario from 2005 onwards) to a horizontal grid resolution of 20 km using the Weather Research and Forecasting (WRF) model. The WRF simulation can resolve the cyclone characteristics in the Mediterranean more accurately than CESM. Additionally, the WRF simulation is able to reproduce the complexity of cyclone-related wind speed and precipitation in a much more detailed way. Preliminary results show a strong decrease in cyclone frequency as a result of global warming. However, this trend is much less clear for extreme cyclones with respect to wind speed and precipitation. Using the long downscaled WRF simulation, we intend to identify characteristics in CESM that lead to extreme wind and precipitation in the downscaled simulation. Additionally, we will investigate the most extreme wind and precipitation events in the Mediterranean to understand what processes are better captured at smaller scales than in the global model.

How to cite: Doensen, O., Messmer, M., Kim, W. M., and Raible, C.: Past and future Mediterranean cyclone characteristics using a regional climate model, EGU General Assembly 2024, Vienna, Austria, 14–19 Apr 2024, EGU24-8101, https://doi.org/10.5194/egusphere-egu24-8101, 2024.

EGU24-10642 | ECS | Orals | AS1.22

Synoptic perspective on the conversion and maintenance of local available potential energy in extratropical cyclones 

Marc Federer, Lukas Papritz, Michael Sprenger, Christian M. Grams, and Marta Wenta

The global atmospheric circulation is maintained by the conversion of available potential energy (APE) into kinetic energy. At midlatitudes, this conversion occurs to a large extent in extratropical cyclones through baroclinic instability. Although kinetic energy is easily defined locally, APE is typically defined as a global integral. Therefore, local APE conversion is not well understood.

Here, we investigate local APE conversion within the North Atlantic storm track using ERA5 reanalysis data. We utilize a recently introduced formulation of APE, which is exact and defined locally for individual air parcels. First, we explore APE conversion during a period of rapid cyclogenesis, which we then extend to a climatology of extratropical cyclones.

Our results indicate that the synoptic upper-level flow determines the distribution of high APE values, which are primarily located in the high-latitude upper troposphere. We show that APE is converted locally into kinetic energy by descending air parcels within the ageostrophic circulation, for example, induced by a jet streak upstream of an extratropical cyclone. The local APE originates not only from advection from the polar, upper-tropospheric APE reservoir, but also from local generation by vertical motion. In fact, the net baroclinic conversion of APE to kinetic energy is the result of much larger positive and negative local contributions. Thus, the global Lorenz energy cycle is more complex on synoptic scales. In addition, we show that surface heat fluxes resulting from air-sea interactions and latent heat release act as diabatic sinks for APE. However, the effect of surface heat fluxes is small compared to the conversion of APE to kinetic energy, as little APE is located in the mid-latitude lower troposphere.

In summary, the study shows that the local APE perspective allows the energetics of North Atlantic extratropical cyclones to be better understood in terms of local APE advection as well as adiabatic (ascent and descent) and diabatic effects.

How to cite: Federer, M., Papritz, L., Sprenger, M., Grams, C. M., and Wenta, M.: Synoptic perspective on the conversion and maintenance of local available potential energy in extratropical cyclones, EGU General Assembly 2024, Vienna, Austria, 14–19 Apr 2024, EGU24-10642, https://doi.org/10.5194/egusphere-egu24-10642, 2024.

EGU24-11704 | Posters on site | AS1.22

Climate change signature on Euro-Mediterranean lee cyclogenesis 

Lorenzo Sangelantoni, Stefano Tibaldi, Leone Cavicchia, Daniele Peano, and Enrico Scoccimarro

This study explores whether and why a warmer climate induces alterations in climatological statistics and the underlying physical features of lee cyclogenesis in the Euro-Mediterranean region.

The investigation focuses on a specific cyclogenesis type, wherein orography (the Alps), influences the spatial structure and growth rate of the cyclone.

This regional scale phenomenon is inspected within the framework of a general weakening and poleward shift of the mid-latitude jet. This large-scale signal, despite being evident in zonal-averaged results from the majority of climate models, remains subject to considerable uncertainty when specific regions and seasons are considered. This uncertainty stems from the intricate interplay and delicate equilibrium among numerous competing mechanisms.

The analysis focuses on historical and future trends during the cold semesters across the Euro-Mediterranean region. The historical period is examined using ERA5 reanalysis spanning from 1940 to the present, supplemented by a higher-resolution regional reanalysis product (COSMO-REA6) at approximately 6 km resolution, covering the period 1995-2019 over the Euro-CORDEX (EUR11) domain. State-of-the-art high-resolution climate models are employed to assess historical reproducibility and future trends through an ensemble of global climate models from the HighResMIP initiative.

Methodologically, two distinct approaches are pursued. Firstly, changes in statistical properties of lee cyclogenesis are examined, along with composites of precipitation and wind extremes footprint, utilizing two tracking algorithms: TempestExtremes (Ullrich et al., 2021) and TRACK (Hodges, 1994). These algorithms differ in their identification/tracking variables, i.e., mean sea level pressure and 850hPa relative vorticity, respectively. Secondly, an empirical orthogonal function (EOF) analysis is employed to evaluate whether dominant spatial patterns of relevant variables (e.g., mean sea level pressure and 500hPa geopotential height) associated with cyclogenesis undergo significant changes across different time segments.

This investigation is conducted as a spin-off of the Copernicus-ECMWF-funded contract C3S2_413 - Enhanced Operational Windstorm Service. The findings aim to enhance our understanding of the complex dynamics of Euro-Mediterranean lee cyclogenesis in the context of a changing climate, providing further insights for climate science and operational windstorm services.

How to cite: Sangelantoni, L., Tibaldi, S., Cavicchia, L., Peano, D., and Scoccimarro, E.: Climate change signature on Euro-Mediterranean lee cyclogenesis, EGU General Assembly 2024, Vienna, Austria, 14–19 Apr 2024, EGU24-11704, https://doi.org/10.5194/egusphere-egu24-11704, 2024.

EGU24-13459 | ECS | Orals | AS1.22

Assessing high-resolution global climate models in simulating subtropical cyclones over the southeast coast of Brazil 

Andressa Andrade Cardoso and Rosmeri Porfírio da Rocha

Subtropical cyclones when occurring close to the coast can be very dangerous for human activities bringing high amounts of precipitation, intense winds and gusts in the coastal cities. This can lead to natural hazards and risks, such as floods, inundations, and even deaths. Over the southeast coast of Brazil, seven subtropical cyclones occur on average each year, with higher frequency in austral summer and autumn.  However, there are still few studies focusing on its global models climatology and future projections. It is crucial to evaluate how accurate are the global climate models of the new HighResMIP-CMIP6 dataset, with fine horizontal high-resolution, in representing subtropical cyclones in the historical period. Thus, this study assesses the classification of the subtropical cyclones based on two reanalyses (ERA5 and ERA-Interim) to evaluate the fine-resolution HighResMIP-CMIP6 datasets.  First, we tracked all cyclones over the South Atlantic Ocean applying an automatic scheme using relative vorticity at 925 hPa. Then, the vertical structure of the cyclones are accessed by calculating three parameters (symmetry, thermal wind at low and upper levels) from the cyclone phase space approach. Finally, we classified subtropical features using an automatic scheme based on a pre-establish threshold. In general, the approach is able for classifying subtropical cyclones providing realistic climatology. Overall, for the total of cyclones, ERA5, ERAInterim and HighResMIP-CMIP6 reproduce similar areas of great cyclogenetic activity over the eastern coast of South America.  In terms of frequency, it is greater in ERA5 than ERAInterim, for both total and subtropical cyclones, while a similar behavior is noted in relation to the seasonal frequency. HighResMIP-CMIP6 tends to overestimate the total of cyclones in subtropical latitudes, impacting directly the frequency of the subtropical ones. 

How to cite: Andrade Cardoso, A. and Porfírio da Rocha, R.: Assessing high-resolution global climate models in simulating subtropical cyclones over the southeast coast of Brazil, EGU General Assembly 2024, Vienna, Austria, 14–19 Apr 2024, EGU24-13459, https://doi.org/10.5194/egusphere-egu24-13459, 2024.

EGU24-14305 | Posters on site | AS1.22

Towards AI-enhanced prediction of Mediterranean cyclones 

Leone Cavicchia, Enrico Scoccimarro, and Silvio Gualdi

Intense cyclones form frequently in the Mediterranean region, with the potential to cause damage to life and property when they hit highly populated coastal areas. Cyclone impacts are caused by the associated strong winds, flash flooding and storm surge. The social and economic impacts are not limited to the Mediterranean area, as cyclones forming in the region can affect Central Europe. While the skill of weather models to forecast such events has dramatically improved over the last decade, the seasonal predictability of Mediterranean cyclones lags behind due to the limitations on horizontal resolution in probabilistic forecasts requiring a large ensemble of simulationss. Improving the climate prediction at a seasonal scale of those extreme events would be of great benefit for society, enabling better disaster risk management and reducing the economic losses they cause. A better prediction of climate extremes would also directly benefit a number of economic sectors such as the insurance and re-insurance industry.

The ambition of the CYCLOPS project is to use Artificial Intelligence techniques to enhance the prediction skills of Mediterranean cyclones in a state-of-the-art Seasonal Prediction System. Here we present initial results making use of AI to link those extreme events to their large-scale driver. The training of different machine learning models is performed using ERA5 reanalysis data. The assessment of model skill is evaluated on the C3S operational seasonal forecast in hindcast mode. The performance of machine learning models of varying complexity (e.g. random forest, artificial neural networks) is evaluated.

How to cite: Cavicchia, L., Scoccimarro, E., and Gualdi, S.: Towards AI-enhanced prediction of Mediterranean cyclones, EGU General Assembly 2024, Vienna, Austria, 14–19 Apr 2024, EGU24-14305, https://doi.org/10.5194/egusphere-egu24-14305, 2024.

EGU24-14720 | ECS | Posters on site | AS1.22

Mergers as the Maintenance Mechanism of Cutoff Lows: A Case Study over Europe in July 2021 

Koryu Yamamoto, Keita Iga, and Akira Yamazaki

A cutoff low that covered Central Europe in the middle of July 2021 brought heavy rainfall and severe flooding, resulting in more than 200 fatalities. This low was formed by a trough on 11 July and merged with another cutoff low around 12–13 July. Analysis of the energy budget and potential vorticity suggests that the main cutoff low was maintained through the merger with another cutoff low; this was the dominant contributor to maintenance of the main cutoff low around 12–13 July. The results of Lagrangian trajectory analyses support this conclusion. Analysis of diabatic PV modification during the merger indicates that radiation acts mainly to enhance the potential vorticity of the parcels when they move from another cutoff low into the main cutoff low, especially in the upper layer (~ 350 K). However, that effect is not pronounced in the lower layer (~ 330 K). These results demonstrate that cutoff lows can be maintained through the merger with another cutoff low and underline the need to consider diabatic processes when investigating mergers.

How to cite: Yamamoto, K., Iga, K., and Yamazaki, A.: Mergers as the Maintenance Mechanism of Cutoff Lows: A Case Study over Europe in July 2021, EGU General Assembly 2024, Vienna, Austria, 14–19 Apr 2024, EGU24-14720, https://doi.org/10.5194/egusphere-egu24-14720, 2024.

EGU24-16593 | ECS | Posters on site | AS1.22

High-impact storms during the extended winters of 2018–2021 in the Iberian Peninsula 

Ana C. R. Gonçalves, Raquel Nieto, and Margarida L. R. Liberato

During the extended winter period from December 2017 to April 2021, the Iberian Peninsula (IP) was impacted by several high-impact storms characterized by intense precipitation and/or strong winds. This study provides a detailed assessment of the events, including synoptic conditions, large-scale dynamics associated with the storms, and a climatological analysis aimed at improving public understanding and preventing natural disasters. The analysis of the cyclones’ variability indicates that their maximum intensity varies between 955 hPa and 985 hPa, with a duration of two to four days, and the most frequent occurrence (eight events) was in January. At the peak of maximum intensity, the composite anomaly patterns showed lower mean sea level pressure (MSLP) values (−21.6 hPa), higher water vapor values (327.6 kg m−1s−1), and wind speed at 250 hPa exceeding 29.6 m s−1 the mean values. Additionally, there were high anomaly values of equivalent potential temperature (θe) of 19.1 °C at 850 hPa, sea surface temperature (SST) anomaly values of −1 °C, and negative anomaly values of surface latent heat flux (QE) (−150 W m−2) close to the IP. During the days impacted by the storms, the recorded values surpassed the 98th percentile in a significant percentage of days for daily accumulated precipitation (34%), instantaneous wind gusts (46%), wind speed at 10 m (47%), and concurrent events of wind/instantaneous wind gusts and precipitation (26% and 29%, respectively). These findings allow us to describe their meteorological consequences on the IP, particularly the effects resulting from intense precipitation such as floods, and strong winds associated with various destructive impacts. Finally, clear, real-time, and predictive information about weather systems and their impacts is crucial for the public to understand and enable effective responses to mitigate these natural hazards damage.

Keywords: extreme events; extratropical cyclones; explosive development cyclones; winter storms; Iberian Peninsula.


Acknowledgments

This work was funded by the Portuguese Fundação para a Ciência e a Tecnologia (FCT) I.P./MCTES through national funds (PIDDAC)–UIDB/50019/2020 (https://doi.org/10.54499/UIDB/50019/2020), UIDP/50019/2020 (https://doi.org/10.54499/UIDP/50019/2020) and LA/P/0068/2020 (https://doi.org/10.54499/LA/P/0068/2020), and project WEx-Atlantic (PTDC/CTAMET/29233/2017, LISBOA-01-0145-FEDER-029233, NORTE-01-0145-FEDER-029233). FCT is also providing for Ana Gonçalves doctoral grant (2021.04927.BD). The EPhysLab group was also funded by Xunta de Galicia, Consellería de Cultura, Educación e Universidade, under project ED431C 2021/44 “Programa de Consolidación e Estructuración de Unidades de Investigación Competitivas.


 References

Gonçalves, A.C.R.; Nieto, R.; Liberato, M.L.R. Synoptic and Dynamical Characteristics of High-Impact Storms Affecting the Iberian Peninsula during the 2018–2021 Extended Winters. Atmosphere 2023, 14, 1353. https://doi.org/10.3390/atmos14091353

How to cite: C. R. Gonçalves, A., Nieto, R., and L. R. Liberato, M.: High-impact storms during the extended winters of 2018–2021 in the Iberian Peninsula, EGU General Assembly 2024, Vienna, Austria, 14–19 Apr 2024, EGU24-16593, https://doi.org/10.5194/egusphere-egu24-16593, 2024.

EGU24-16634 | ECS | Posters on site | AS1.22

Drivers of Cold Frontal Hourly Extreme Precipitation: A Climatological Study 

Armin Schaffer, Tobias Lichtenegger, Douglas Maraun, Heimo Truhetz, and Albert Ossó

Understanding the processes driving extreme precipitation is paramount to socioeconomic interest. In the mid-latitudes extreme precipitation events are strongly associated with cold fronts. By exploring drivers across a wide range of scales, this study aims to improve our understanding of processes influencing frontal precipitation. Past research predominately focused on detailed studies of individual frontal extreme events. Here we present the first climatological study of frontal characteristics and their impact on precipitation.
Using hourly resolved ERA5 data, cold fronts are detected using the equivalent potential temperature gradient, and associated conditions from the synoptic to the meso-scale are identified. Further, seasonal and regional dependencies are explored. Quantile regression models are employed to find the strongest drivers of frontal precipitation and to quantify these relationships. Additionally, composite analysis are used to study the synoptic conditions and meso-scale structure of extreme events.
Findings reveal that humidity close to the frontal boundary, convergence of different scales and the low level jet speed contribute most to formation of extreme precipitation events. Interestingly, we discovered that stronger fronts, characterized by a significant change in humidity, do not always lead to a higher chance of extreme precipitation. This is evident in the weak correlation between the humidity gradient and frontal precipitation, in contrast with the relationship observed for the temperature gradient.
The findings of this study improve our understanding of cold frontal processes. Additionally, they provide the foundation to evaluate model performance and climate change projections. 

How to cite: Schaffer, A., Lichtenegger, T., Maraun, D., Truhetz, H., and Ossó, A.: Drivers of Cold Frontal Hourly Extreme Precipitation: A Climatological Study, EGU General Assembly 2024, Vienna, Austria, 14–19 Apr 2024, EGU24-16634, https://doi.org/10.5194/egusphere-egu24-16634, 2024.

EGU24-17127 | ECS | Orals | AS1.22

A Cold Frontal Life Cycle Climatology and Front-Cyclone Relationships over the North Atlantic and Europe during Winter 

Tobias Lichtenegger, Armin Schaffer, Douglas Maraun, Albert Osso Castillon, and Heimo Truhetz

Atmospheric fronts and cyclones play an important role in day-to-day weather variability, especially in the mid-latitudes and during the winter season. Severe rainfall and windstorm events are often associated with the passage of a front or a cyclone. While there are many studies of individual fronts and climatologies based on objectively detected fronts, there is no comprehensive study considering the whole frontal life cycle over time. Therefore, a front and cyclone tracking algorithm, based on overlapping features at consecutive time steps, is used together with an improved front detection method to detect and track cold fronts and cyclones over the North Atlantic and Europe in the extended winter season (October - March) in the ERA5 reanalysis dataset. Several life cycle characteristics, e.g. the duration, velocity, frontogenesis and -lysis regions as well as dynamic and thermodynamic frontal parameters are defined to investigate the frontal life cycle and the conditions and processes in the frontal region. Fronts are linked to their parent cyclone to study relationships between frontal and cyclonic properties. The study confirms that fronts are mostly formed over the western and central North Atlantic and travelling along the main storm track into the European continent. During positive phases of the North Atlantic Oscillation, fronts are travelling faster and further and are associated with stronger precipitation and surface wind speeds over their whole life cycle. Stronger cyclones are related to stronger dynamics in the frontal region.

How to cite: Lichtenegger, T., Schaffer, A., Maraun, D., Osso Castillon, A., and Truhetz, H.: A Cold Frontal Life Cycle Climatology and Front-Cyclone Relationships over the North Atlantic and Europe during Winter, EGU General Assembly 2024, Vienna, Austria, 14–19 Apr 2024, EGU24-17127, https://doi.org/10.5194/egusphere-egu24-17127, 2024.

EGU24-18002 | ECS | Orals | AS1.22

Power outages in windstorms: the influence of rainfall preconditioning, wind direction and season 

Colin Manning, Sean Wilkinson, Hayley Fowler, Elizabeth Kendon, and Sarah Dunn

Windstorms are the main cause of large power outages in the UK. Faults to electricity distribution networks during windstorms are predominantly a result of windthrow, the uprooting or breakage of trees by winds that then fall on assets such as overhead lines. The impact of strong winds on windthrow is influenced by a several conditions: trees uproot more easily in saturated soils, they are more vulnerable to strong winds from unusual directions, and they are more susceptible to strong winds in the growing season when their leaves catch the wind. Despite this, risk assessments of impacts, such as power outages, during windstorms generally focus on wind intensity alone. Here, we quantify the influence of contributing variables of windthrow including antecedent rainfall, wind direction of the maximum wind gust, and the season a windstorm occurs in. We demonstrate that including them in a logistic regression model alongside wind speed can improve the predictive skill of the number of electricity faults during windstorms compared to a reference model that only includes wind speed. The analysis uses fault data from the National Fault and Interruption Scheme (NaFIRs) database during the period 2006-2018 in four regions in the UK: South Wales, Southwest England, East Midlands, and West Midlands. Meteorological data is provided by ERA5. Each variable is shown to modulate the impact of strong winds and improve predictive skill, though with some regional variability. The probability of a high fault numbers in a windstorm with winds exceeding 25 m/s can be doubled following high rainfall accumulations and five times higher when strong winds come from a direction that deviates more than 40 degrees south or west from the prevailing south-westerly direction. Furthermore, this probability is doubled in summer months compared to winter. These results can help improve impact forecasting during windstorms and highlight the importance of including these variables in historical and future risk assessments of assets vulnerable to windthrow. Ignoring such contributions may lead to misrepresentation of risk and potential maladaptation, particularly for electricity distribution networks that will undergo a huge transformation as we reduce our dependence on greenhouse gases in the future.

How to cite: Manning, C., Wilkinson, S., Fowler, H., Kendon, E., and Dunn, S.: Power outages in windstorms: the influence of rainfall preconditioning, wind direction and season, EGU General Assembly 2024, Vienna, Austria, 14–19 Apr 2024, EGU24-18002, https://doi.org/10.5194/egusphere-egu24-18002, 2024.

EGU24-19896 | ECS | Posters on site | AS1.22

Climate change's influence on Cut-off Lows in the future 

Aditya N. Mishra, Douglas Maraun, Reinhard Schiemann, Kevin Hodges, and Giuseppe Zappa

Cut-off Lows (COLs) are mid-latitude storms that are detached from the main westerly flow. They tend to propagate slower than other mid-latitude storms and are often harbingers of heavy and persistent rainfall. COLs have long been subject to thorough studies that have examined the physical structure and climatology across both hemispheres, however, their assessment in models is relatively low. In fact, there is no study on future changes in COLs in models. In this study, we analyze the cut-off lows in the northern hemisphere in the historic and future time slices in the CMIP6 dataset to study the frequency, duration, and intensity of the cut-off lows alongside the changes in velocity. Results show that the COL season, which is currently mostly limited to summer, extends into spring over Europe, North America, and Asia. This rise in activity in spring is more pronounced for COLs that are long-lasting and also have higher intensity maxima, i.e., the most impactful ones. Moreover, COL propagation velocity for persistent systems is due to slow down over North America in the summer. Slow-moving COLs are known to cause heavy localized rainfall. Through this study, we fill the information gap on the first insights of projected future changes in COLs by using TRACK to detect and trace COLs in the SSP5-8.5 projections of the CMIP6 ensemble.


How to cite: Mishra, A. N., Maraun, D., Schiemann, R., Hodges, K., and Zappa, G.: Climate change's influence on Cut-off Lows in the future, EGU General Assembly 2024, Vienna, Austria, 14–19 Apr 2024, EGU24-19896, https://doi.org/10.5194/egusphere-egu24-19896, 2024.

EGU24-20374 | ECS | Orals | AS1.22

How do winter-time extratropical cyclones change in the future over South Africa? 

Sandeep Chinta, Adam Schlosser, Xiang Gao, and Kevin Hodges

Extratropical cyclones (ETCs) in South Africa usually occur during the winter (June to August), specifically influencing the Western Cape, causing extreme rain and strong winds. We investigate future changes in these winter-time ETCs using the simulations from three CORDEX-CORE Africa models. Each of these models was driven by three Coupled Model Intercomparison Project phase 5 (CMIP5) General Circulation Models (GCMs), resulting in nine sets of simulations. The simulations are from 1970-2100, with scenarios starting from 2006. We identified the cyclone tracks using the Hodges tracking algorithm, which used 6-hourly relative vorticity data at 850 hPa level. We chose a 20-year historical period from 1986 to 2005 for comparison with a future period of the same length from 2080 to 2099, focusing on the Representative Concentration Pathway (RCP) 8.5 scenario for the future projections. We observed a projected decrease in the number of ETCs in the future. The average track distance and duration are also projected to reduce. These reductions are statistically significant. We explored the future changes in the ETC-associated rainfall, which is also projected to be reduced in the future. We are currently looking at extending our analysis with the high-resolution 4 km gridded Climate Predictions for Africa (CP4A) data and see how our earlier results compare with the high-resolution data.

How to cite: Chinta, S., Schlosser, A., Gao, X., and Hodges, K.: How do winter-time extratropical cyclones change in the future over South Africa?, EGU General Assembly 2024, Vienna, Austria, 14–19 Apr 2024, EGU24-20374, https://doi.org/10.5194/egusphere-egu24-20374, 2024.

EGU24-118 | Posters on site | HS2.1.5

Precipitation, temperature, and vegetation indices analysis for Saudi Arabia region: Feasibility of Google Earth Engine 

Zaher Mundher Yaseen, Bijay Halder, Mohamed A. Yassin, and Sani I. Abba

Climatic disaster is continuously triggering environmental degradation and thermal diversification over the earth's surface. Global warming and anthropogenic activities are the triggering factors for thermal variation and ecological diversification. Saudi Arabia has also recorded precipitation, temperature, and vegetation dynamics over the past decades. Therefore, monitoring past precipitation, temperature, and vegetation condition information can help to prepare future disaster management plans and awareness strategies. The Precipitation Estimation from Remotely Sensed Information using Artificial Neural Networks - Climate Data Record (PERSIANN-CDR) from the Center for Hydrometeorology and Remote Sensing (CHRS) data portal and Moderate Resolution Imaging Spectroradiometer (MODIS) are applied for precipitation, Land Surface Temperature (LST), Enhance Vegetation Index (EVI), and Normalized Difference Vegetation Index (NDVI) from 2003 to 2021 respectively. Yearly mean LST, EVI, NDVI, and precipitation values are calculated through the Google Earth Engine (GEE) cloud computing platform. MODIS-based LST datasets recorded the highest temperatures is 43.02 °C (2003), 45.56 °C (2009), 47.83 °C (2015), and 49.24 °C (2021) respectively. In between nineteen years, the average mean LST increased by 6.22 °C and the most affected areas are Riyadh, Jeddah, Abha, Dammam, and Al Bahah. The mean Precipitation is recorded around 776 mm, 842 mm, 1239 mm, and 1555 mm for the four study periods, while the high precipitation area is Jazan, Asir, Baha, and Makkah provinces. In between nineteen years, 779 mm of precipitation is increasing in Saudi Arabia.  Similarly, the NDVI vegetation indices observed 0.885 (2003), 0.871 (2009), 0.891 (2015), and 0.943 (2021), while EVI observed 0.775 (2003), 0.776 (2009), 0.744 (2015), and 0.847 (2021). The R2 values of the LST and EVI correlation is 0.0239 (2003), 0.0336 (2009), 0.0136 (2015) and 0.0175 (2021) similarly correlation between LST and NDVI is 0.0352 (2003), 0.0265 (2009), 0.0183 (2015) and 0.0161 (2021) respectively. The vegetation indices indicate that the green space is gradually increasing in Saudi Arabia and the highly vegetated lands are Meegowa, An Nibaj, Tabuk, Wadi Al Dawasir, Al Hofuf, and part of Qaryat Al Ulya. This analysis indicates that the temperature is increasing but precipitation and green spaces are increasing because of the groundwater recharge through dam construction, precision agriculture, and planned build-up is helps to prepare Saudi Arabia as a green country. Therefore, more attention to preparing the strategic agricultural plants as well as other vegetation and artificial groundwater recharge can improve the country as a green nation. This analysis might help to prepare future planning, awareness, and disaster management teams to prepare for future disasters and strategic steps for sustainable development.

How to cite: Yaseen, Z. M., Halder, B., Yassin, M. A., and Abba, S. I.: Precipitation, temperature, and vegetation indices analysis for Saudi Arabia region: Feasibility of Google Earth Engine, EGU General Assembly 2024, Vienna, Austria, 14–19 Apr 2024, EGU24-118, https://doi.org/10.5194/egusphere-egu24-118, 2024.

Water is scarce in the northern Chihuahuan Desert, with ~350 mm/yr precipitation, potential evapotranspiration at 1800mm/yr, and rising mean annual temperatures by >2°C since 1960. The main water resources are the Ogallala, Pecos Valley, Dockum, and Edwards-Trinity Plateau aquifers, with depletion rates of ~1 m/yr. Despite the arid climate, the Monahans and Kermit dune fields host perched water tables 1-10 m below the surface, in up to 40 m of aeolian sand spanning the past ca. 2.6 ma, and isolated from the underlying Pecos Valley Aquifer by a Pliocene/Pleistocene fluvial gravel-rich clay. A 3D model based on borehole lithology shows a topographic inversion with a southwest-trending paleo-slope infilled with aeolian sand. The aeolian stratigraphy and basin modeling indicate progressive infilling by aeolian sand with periods of pluvial lake formation and soil development, with groundwater providing dune field stability for vertical accretion and limiting aeolian erosion. Cores of sediments retrieved from the Monahans and Kermit dune fields were sampled for OSL ages and yielded ages up to 500 ka 20 m below the surface of the dunes, with identified deposition periods between 545-470 ka, 300-260 ka, 70-45 ka and post 16 ka. A set of three monitoring wells equipped with data loggers revealed aquifer recharge of 35-40 cm in the Spring and Fall consistent with regional precipitation variability, and a daily recharge cycle of 3-8 mm potentially linked to plant uptake or gravitational forces. Deuterium and 18O isotopic ratios for the dune field aquifers indicate an evaporative enriched water source compared to the Pecos Valley Aquifer, Pecos River, and Chihuahuan Desert precipitation, consistent with local precipitation. Apparent 14C ages <1360 yr for aquifer waters from the upper 1 m indicate recent meteoric recharge. Older 14C ages of > 1.3 to 2.2 ka for waters ~30 m deep and at the western edge of the aquifer indicate mixing with Holocene recharge waters in a southwest flowing aquifer. In contrast, the Pecos Valley Aquifer yields 14C ages of ca. 0.9 to 40 ka with the youngest ages near the dune fields, which suggests recharge from these perched aquifers.

How to cite: Fournier, A. and Forman, S.: Origin, gradient, and recharge processes of perched aquifers of the Monahans and Kermit dune fields, northern Chihuahuan Desert, Texas, USA , EGU General Assembly 2024, Vienna, Austria, 14–19 Apr 2024, EGU24-765, https://doi.org/10.5194/egusphere-egu24-765, 2024.

EGU24-1165 | ECS | Orals | HS2.1.5

Agrohydrological modelling approach for assessing the impact of climate change on water resources and land management in the Messinian region, Greece. 

ismail bouizrou, Giulio Castelli, Gonzalo Cabrera, Lorenzo Villani, and Elena Bresci

The Mediterranean region is highly susceptible to the consequences of warming, leading to an increasing of extreme events such as droughts, severe heat waves, and precipitation events. The Messinia watershed (MW) is predominantly characterized by olive cultivation, encompassing approximately 70% of the landscape. These olive orchards constitute a vital component of the Mediterranean ecosystem, playing a crucial role in regional agriculture. The MW is a perfect illustration of a Mediterranean watershed significantly impacted by climate change, as well as soil degradation and a lack of effective land management practices.

In this context, agro-hydrological modelling emerges as a potent tool to address soil degradation and enhance water resource retention within the olive orchards at the watershed scale. To achieve this objective, the SWAT+ agrohydrological model was chosen for a comprehensive assessment of the potential impacts of climate change on water resources and ecosystems in the Messinia region. The adopted modelling approach involved both hard and soft calibration techniques, simulating four sub-watersheds of Messinia by incorporating remote sensing data, including evaporation and soil moisture, for multi-criteria model calibration.

The calibrated model was subsequently employed to assess the potential impacts of climate change on water resources and ecosystems in the Messinia region, utilizing various RCM climate scenarios. Our findings are valuable for addressing soil degradation, as well as for guiding land and water management practices in the Messinian watershed.


This research was carried out within the SALAM-MED project, funded by the Partnership for Research and Innovation in the Mediterranean Area Programme (PRIMA).

The content of this abstract reflects the views only of the author, and the Commission cannot be held responsible for any use that may be made of the information contained therein.


How to cite: bouizrou, I., Castelli, G., Cabrera, G., Villani, L., and Bresci, E.: Agrohydrological modelling approach for assessing the impact of climate change on water resources and land management in the Messinian region, Greece., EGU General Assembly 2024, Vienna, Austria, 14–19 Apr 2024, EGU24-1165, https://doi.org/10.5194/egusphere-egu24-1165, 2024.

Desertification on the Mongolian Plateau is deepening, and sand and dust have great negative impacts on many countries in East Asia. Based on meteorological and socio-economic data in the context of climate change, this study analyzed the driving mechanisms and impacts of desertification and water body area response on the Mongolian Plateau using, among others, the GTWR model. The following conclusions were drawn: the area of the Mongolian Plateau showed a decreasing trend from 1990 to 2019, and the number of lakes larger than 1 km2 decreased by 173 or 537.3 km2 in Inner Mongolia, and by 737 or 2875.1 km2 in Mongolia, and all of them were dominated by lakes of 1-10 km2; and the analysis of the correlation between the area of the water bodies showed that the The reasons driving the change of water body area in Inner Mongolia Autonomous Region and Mongolia are similar and different, soil moisture and precipitation have obvious promotion effects, economic development and livestock numbers have different degrees of negative impacts on different countries; The GTWR model is used to represent the impacts of different influencing factors on the water body area in time and space, and the evaporation and GDP are shifted from slight inhibition to promotion, and the population and temperature are both inhibited. Soil moisture and livestock numbers are contributing; Surface water resource monitoring is important to deepen the desertification of the Mongolian Plateau and to provide better water resource recommendations and protection measures for the Mongolian Plateau.

How to cite: Yan, Y. and Cheng, Y.: Study of water body area changes in the desertification process of the Mongolian Plateau and analysis of driving factors, EGU General Assembly 2024, Vienna, Austria, 14–19 Apr 2024, EGU24-1185, https://doi.org/10.5194/egusphere-egu24-1185, 2024.

EGU24-2567 | ECS | Orals | HS2.1.5 | Highlight

GIRHAF (Gridded hIgh-resolution Rainfall for the Horn of AFrica): a new rainfall product for detailed applications in a region beset by climate hazards 

Manuel F. Rios Gaona, Katerina Michaelides, and Michael Bliss Singer

Rainfall is one of the most important inputs for applications such as hydrological modelling, water resource allocation, flood/drought analysis, and climatic risk assessments. Currently, there exist numerous (global) products offering rainfall estimates at various spatio-temporal resolutions. Nevertheless, there are still places on Earth where the coverage and/or quality of such products is limited due to sparse ground-control data, thus constraining the robustness of input rainfall for hydrological and climate applications. Located in Eastern Africa, the Horn of Africa (HOA) is a place where climate impacts like droughts and floods frequently inflict a huge toll on the lives and livelihoods of millions residing in subsistence rural communities. For places like this, high resolution rainfall data are fundamental to understanding the availability of water resources, flood hazard, and soil moisture dynamics relevant to crop yields and pasture availability.

Here we introduce GIRHAF (Gridded hIgh-resolution Rainfall for the Horn of AFrica), which is a 20-year rainfall product, with a spatio-temporal resolution of 0.05°×0.05°, every 30 minutes. GIRHAF is based on downscaling CHIMES (Climate Hazards center IMErg with Stations) a pentad operational rainfall product which corrects microwave signals in IMERG (Integrated Multi-satellitE Retrievals for GPM -Global Precipitation Measurement mission-) by in situ rain gauging networks. The goal of this product is to offer the HOA region high-resolution rainfall fields that can support more detailed mechanistic analyses of historical rainfall and can also provide the base dataset required to develop stochastic rainfall models capable of simulating forecasted or projected climate scenarios. It is our aspiration that GIRHAF will enable improved responses to climatic hazards as well as better water resources management in the HOA region, and perhaps to allow people of this region to better prepare to future climate scenarios.

How to cite: Rios Gaona, M. F., Michaelides, K., and Singer, M. B.: GIRHAF (Gridded hIgh-resolution Rainfall for the Horn of AFrica): a new rainfall product for detailed applications in a region beset by climate hazards, EGU General Assembly 2024, Vienna, Austria, 14–19 Apr 2024, EGU24-2567, https://doi.org/10.5194/egusphere-egu24-2567, 2024.

EGU24-4462 | ECS | Posters on site | HS2.1.5

Modeling the impact of climate and land use changes on future water resources dynamics in central Sicily, Italy 

Shewandagn Lemma Tekle and Brunella Bonaccorso

Drought events, worsened by climate change, produce detrimental impacts on freshwater availability especially in arid and semi-arid regions. The situation becomes more critical when these hydrologic extremes combine with land use change mainly caused by anthropogenic factors, such as urbanization, intensive farming, and industrial activities. The present study is designed to investigate the combined impacts of climate and land use changes on the future freshwater  stored in the artificial reservoirs of three adjacent river basins located in the central Sicily (Italy), i.e: Verdura (2 active reservoirs with capacities 9.2 Mmc and 4.19 Mmc), Imera Meridionale (one active reservoir with capacity 15 Mmc), and Platani (one active reservoir with capacity 20.7Mmc), using the Soil and Water Assessment Tool (SWAT) model. The reservoirs are used for irrigation, drinking water supply, and electric power generation. Future climate variables such as rainfall, minimum and maximum temperatures were derived from an ensemble Regional Climate Models for two main representative concentration pathway (RCP) scenarios, such as an intermediate emission scenario (RCP4.5) and a severe emission scenario (RCP8.5). A coupled multi-layer perceptron neural networks and cellular automata (MLP-CA) model was implemented to simulate future land use of the region considering the CORINE land cover in 2000, 2006, 2012, and 2018 as a reference dataset. The future land use is then projected until the mid-century (2048) in a six-year interval using the validated MLP-CA model. The soil data from the European soil data center (EUSDAC) was used as input for the SWAT model. The result indicated that the basins could experience a decrease in inflows to the reservoirs. The separate evaluation of climate change and land use changes indicated that the effect of climate change on streamflow variation is more pronounced than the effect of land use change only. In this study, we introduced new hydrological insights into the region by analyzing the attributions of climate change, land use change, and coupled climate and land use changes on the future freshwater availability which were overlooked in the previous studies. The implementation of the proposed approach can contribute to design environmentally sustainable and climate resilient river basin management strategies.


Keywords: MLP-CA, Land use change, Climate change, SWAT, Hydrological modeling, Water availability

How to cite: Tekle, S. L. and Bonaccorso, B.: Modeling the impact of climate and land use changes on future water resources dynamics in central Sicily, Italy, EGU General Assembly 2024, Vienna, Austria, 14–19 Apr 2024, EGU24-4462, https://doi.org/10.5194/egusphere-egu24-4462, 2024.

EGU24-5604 | Orals | HS2.1.5

An integrated hydrological modeling approach to assess the natural groundwater recharge trends in a Mediterranean coastal aquifer 

Anis Chekirbane, Khaoula Khemiri, Constantinos Panagiotou, and Catalin Stefan

Integrating physical models with socio-economic considerations is essential to sufficiently analyze complex hydrological systems and design effective strategies for groundwater management. This integrated approach offers an effective means of detecting links between aquifer properties and groundwater processes. This study aims to assess the impact of human activities and climate changes on groundwater resources. In particular, the final goal is to quantify the spatial distribution of natural groundwater recharge, which is needed to assess the impact of anthropogenic factors on sustainable groundwater management in the Chiba watershed, NE of Tunisia as an example of a stressed hydrosystem.

The proposed methodology is based on the estimation of natural groundwater recharge through hydrological modeling with the use of the SWAT model while considering land use/land cover changes occurring within the study area, coupled with the DPSIR (Drivers-Pressures-States-Impacts-Responses) socio-economic approach for time period 1985-2021. The surveys were constructed and processed based on the probability of occurrence for the degree of satisfaction with arguments related to the DPSIR parameter within the category of the 5-point Likert scale (ranging from level 1 - very low to level 5 - very high), including mean, standard deviation, and the consensus (CnS).
Chiba watershed was selected as a case study since its climate is representative of the Tunisian semi-arid context, and due to the high vulnerability of the existing groundwater systems with respect to human activities.

The hydrological simulations suggest a gradual decrease of 33% in the aquifer's natural recharge over the entire time period. The long-term average value of the annual recharge rate per sub-basin does not exceed 3 mm/year, keeping groundwater recharge levels in the basin relatively low. This observation is mainly attributed to climate change with CnS of 0.6 and over-exploitation of the water sources for irrigation purposes (CnS = 0.62), leading to aquifer depletion and degradation of groundwater-dependent ecosystems (CnS = 0.73). These results suggest that different management practices, such as more conservative water use (CnS = 0.6), long-term monitoring and Managed Aquifer Recharge (MAR) with wastewater (CnS = 0.76), can help rural residents to diversify their economies while preserving these water resources. However, although attempts of MAR have been undertaken, they remain insufficient to counter the pressure on the coastal aquifer, underlining the importance of preserving the fragile semi-arid landscape.

The proposed approach is applicable to other regions having similar climatic and socio-economic conditions. It also demonstrates that pure modeling solutions need to be coupled to the socio-economic approaches to be able to constitute a solid asset for sustainable water resources management of stressed hydro-systems.


Acknowledgments

This work is funded by National Funding Agencies from Germany,  Cyprus, Portugal, Spain, and Tunisia under the Partnership for Research and Innovation in the Mediterranean Area (PRIMA) and supported under Horizon 2020 by the European Union’s Framework for Research and Innovation.

How to cite: Chekirbane, A., Khemiri, K., Panagiotou, C., and Stefan, C.: An integrated hydrological modeling approach to assess the natural groundwater recharge trends in a Mediterranean coastal aquifer, EGU General Assembly 2024, Vienna, Austria, 14–19 Apr 2024, EGU24-5604, https://doi.org/10.5194/egusphere-egu24-5604, 2024.

EGU24-6984 | ECS | Posters on site | HS2.1.5

Westerly aridity in the western Tarim Basin driven by global cooling since the mid-Pleistocene transition 

Hongye Liu, Rui Zhang, Gaowen Dai, and Yansheng Gu

To explore the relationship between the global change, westerlies, and central Asian aridity, we report ~1.1 Ma local sedimentary environment changes according to high-resolution gamma ray (GR) from downhole logging, Grain size, magnetic susceptibility (MS), rubidium/strontium (Rb/Sr) ratios and total organic carbon (TOC) of an 800-m core (KT11) from the Kashgar region in the western Tarim Basin, arid zone of China. Four dominant sedimentation types, including lacustrine facies, delta facies, fluvial facies, and aeolian dunes, were identified through lithology and grain size frequency curves. The 1.1 Ma sedimentary successions experienced delta deposits with fluvial and aeolian deposits and lacustrines (1.1-0.6 Ma), alternating fluvial and aeolian facies with the occurrence of deltas and lacustrines (0.6-0.15 Ma), and aeolian facies interbedded with deltas and fluvial facies (0.15 Ma-present). Spectral analyses of the GR, MS, and Rb/Sr data reveal cycles with ~70 m, ~30 m and ~14 m wavelengths. These cycles represent ~100-kyr short-eccentricity, ~40-kyr obliquity and ~20-kyr precession frequencies, respectively and mainly are driven by orbitally forced climate change.

Stepwise drying sedimentary conditions and enhanced desertification indicated by increasing Rb/Sr ratios and proportion of aeolian sands, and decreasing TOC since the past 1.1 Ma, implied intensified westerlies, likely resulted from ice volume expansion and ongoing global cooling according to geological record comparison and simulations during the Last Glacial Maximum compared to preindustrial conditions, which may have controlled the expansion of the permanent deserts in inland Asia. These persistent drying trends and intensified westerly circulation in arid regions during glacial periods after the mid-Pleistocene Transition indicated by larger amplitudes of aeolian sand proportion than prior to 0.6 Ma are similar to those in the interior monsoonal Asia, where the larger-amplitude of median grain size indicated enhanced East Asian Winter monsoon intensity and drier glacials.

How to cite: Liu, H., Zhang, R., Dai, G., and Gu, Y.: Westerly aridity in the western Tarim Basin driven by global cooling since the mid-Pleistocene transition, EGU General Assembly 2024, Vienna, Austria, 14–19 Apr 2024, EGU24-6984, https://doi.org/10.5194/egusphere-egu24-6984, 2024.

EGU24-7068 | ECS | Orals | HS2.1.5

Exploring Drought Patterns in the Headwaters of the Tarim River Basin through an Integrated Surface-Groundwater Drought Index 

Xiaohan Yu, Xiankui Zeng, Dongwei Gui, Dong Wang, and Jichun Wu

The Tarim River Basin, China's largest inland river, has been grappling with persistent drought challenges. Over 90% of its water resources originate from the headwaters, heavily relying on groundwater. Existing drought indices often compartmentalize considerations of surface water and groundwater variables. Consequently, there is a necessity for a comprehensive drought index that accounts for the interplay between surface water and groundwater. This study employs the Copula function to formulate the Standardized Precipitation Evapotranspiration Groundwater Index (SPEGI), incorporating surface water (precipitation minus evaporation) and groundwater (changes in total water storage observed by GRACE satellite minus changes in output from the VIC model). SPEGI is computed using a moving average approach across various time scales (1, 3, 6, 12 months) and is juxtaposed with traditional indices such as Standardized Precipitation Evapotranspiration Index (SPEI), Standardized Soil Moisture Index (SSMI), and Standardized Groundwater Index (SGI). The findings underscore that SPEGI, grounded in the integrated consideration of surface and groundwater variables, provides a more comprehensive depiction of drought conditions in the study area. In contrast to traditional indices, SPEGI not only accounts for short-term precipitation and evaporation changes but also effectively reveals the characteristics of groundwater fluctuations. Additionally, by comparing SPEGI with NDVI data, the study delves into the desertification process in the region. The research discerns that SPEGI's assessment of drought resilience is more sensitive, manifesting an increasing trend in the desertification process with the enlargement of SPEGI's sliding window. Overall, this research contributes novel methodologies and empirical evidence for fostering sustainable water resource utilization and informing climate change adaptation decisions within the basin.

How to cite: Yu, X., Zeng, X., Gui, D., Wang, D., and Wu, J.: Exploring Drought Patterns in the Headwaters of the Tarim River Basin through an Integrated Surface-Groundwater Drought Index, EGU General Assembly 2024, Vienna, Austria, 14–19 Apr 2024, EGU24-7068, https://doi.org/10.5194/egusphere-egu24-7068, 2024.

EGU24-7611 | ECS | Orals | HS2.1.5

Locating unsustainable water supplies for supporting ecological restoration in China's drylands 

Fengyu Fu, Shuai Wang, and Xutong Wu

China, with vast dryland areas, has undertaken extensive ecological restoration (ER) projects since the late 1970s. While ER is a crucial means against desertification and land degradation, it must be implemented in a water-sustainable manner to avoid exacerbating the carbon–water trade-off, especially in water-limited drylands. However, there is still limited research on accurately identifying water unsustainable ER regions in China's drylands. Here, we developed a water supply–demand indicator, namely, the water self-sufficiency (WSS), defined as the ratio of water availability to precipitation. With the use of remote sensing and multisource synthesis datasets combined with trend analysis and time series detection, we conducted a spatially explicit assessment of the water sustainability risk of ER in China's drylands over the period from 1987 to 2015. The results showed that 17.15% (6.36 Mha) of ER areas face a negative shift in the WSS (indicating a risk of unsustainability), mainly in Inner Mongolia, Shanxi, and Xinjiang provinces, driven by evapotranspiration. Moreover, 29.34% (10.9 Mha) of the total ER areas, whose area is roughly double that of water unsustainable ER areas, exhibit a potential water shortage with a significant WSS decline (-0.014 yr-1), concentrated in Inner Mongolia, Shaanxi, and Gansu provinces. The reliability of our findings was demonstrated through previous studies at the local scale and an analysis of soil moisture changes. Our findings offer precise identification of water unsustainable ER regions at the grid scale, providing more specific spatial guidance for ER implementation and adaptation in China's drylands.

How to cite: Fu, F., Wang, S., and Wu, X.: Locating unsustainable water supplies for supporting ecological restoration in China's drylands, EGU General Assembly 2024, Vienna, Austria, 14–19 Apr 2024, EGU24-7611, https://doi.org/10.5194/egusphere-egu24-7611, 2024.

EGU24-8825 | ECS | Orals | HS2.1.5

Assessing stream water scarcity and groundwater roles under global change in a Mediterranean watershed: the Onyar River basin (NE Catalonia, Spain) 

Paula Gabriela Cordoba Ariza, Ramon J. Batalla, Sergi Sabater, and Josep Mas-Pla

Mediterranean basins face significant water scarcity which requires examining long-term data to evaluate their trends in water availability and quality and assess management options. In this presentation, we explore the historical streamflow changes, the influencing climatic —streamflow, precipitation, temperature, and evapotranspiration (PET and AET)— and land-use factors, and the evolution of surface water quality in the Onyar River (Inner Catalan basins, NE Spain; 295 km2) during the last decades (1960-2020).

Results highlight a consistent decline in streamflow, most pronounced over the last two decades, accompanied by an increase in PET, and a probable decrease in groundwater recharge. These changes co-occurred with higher concentrations of river water ammonium and nitrate. We attribute these patterns to changes in land use such as afforestation and intensive fertilization, as well as increased groundwater withdrawal, particularly during irrigation seasons. Additional factors include growing urban water demand and the discharges of treated wastewater back into the river system. Evaluation of the relationship between groundwater and surface water using end-member mixing analysis of hydrochemical data points out an interesting scale-dependence behaviour: groundwater baseflow from alluvial formations was relevant in the smallest subbasins, whereas regional groundwater flow involving deeper aquifers could significantly contribute to stream discharge in the lowest zones of the basin. Since water balance alteration in the future climate scenarios will reduce the contribution of the headwater flow as well as groundwater storage and baseflow generation, reclaimed wastewater shows up as a relevant source to maintain stream runoff, yet its quality is low and might not be properly diluted by rainfall originated runoff.

These observations provide a comprehensive overview of the declining water quantity and quality in the Onyar River network, attributing these trends to an interplay of climatic and anthropogenic factors. They urge for integrated water resources management strategies to mitigate the implications of these environmental changes, such as protecting baseflow generating areas as well as controlling reclaimed wastewater quality.

Funding: G. Córdoba-Ariza acknowledges funding from Secretariat of Universities and Research from Generalitat de Catalunya and European Social Fund for her FI fellowship (2022 FI_B1 00105). 

How to cite: Cordoba Ariza, P. G., Batalla, R. J., Sabater, S., and Mas-Pla, J.: Assessing stream water scarcity and groundwater roles under global change in a Mediterranean watershed: the Onyar River basin (NE Catalonia, Spain), EGU General Assembly 2024, Vienna, Austria, 14–19 Apr 2024, EGU24-8825, https://doi.org/10.5194/egusphere-egu24-8825, 2024.

Intermittent rivers and ephemeral streams represent half of the global river network and span all climates. The intermittent rivers and ephemeral streams is a short-hand term for all flowing water that ceases to flow or that dries up completely at some point in time and/or space They are more frequent in arid and semi-arid areas but are also present in temperate, tropical humid, boreal, and alpine areas, where they are mainly located in headwaters. Their abundance is increasing due to climate change and water withdrawals for human activities.

The objective of this study is to represent the spatio-temporal dynamics of flow intermittence at the reach level in river of the seven sub-catchments of the Maures massif (between 1.5 km² and 70 km²).

First, two hydrological continuous models of varying complexities are performed: GR6J (lumped and conceptual), and SMASH (spatially distributed and conceptual) in terms of temporal calibration/validation, by dissociating dry and wet years, to asses the models’ability to simulate observed drying event over time. The metrics are based on daily flow records observed in the 7 catchments since 1968 to 2023.

In the second part, a regionalization method is tested on the spatially distributed model (SMASH). The HDA-PR approach (Hybrid Data Assimilation and Parameter Regionalization) incorporating learnable regionalization mappings, based on multivariate regressions is used. This approach consist to search for a transfer function that quantitatively relates physical descriptors to conceptual model parameters from multi-gauge discharge in order to produce a regional model.

Flow condition observed from multiple data sources (daily flow time series from gauging stations, phototrap installed along the river network taking daily pictures from 2021-04-01 to 2023-31-12, daily conductivity measurements series from 2021-01-01) are used to validate the ability of the regional model to simulate flow intermittence (prediction of dry events) at river section level.

The distributed modelling approach, with a high-resolution conceptual hydrological modeling at 0.250 km² and coupled with Hybrid Data Assimilation and Parameter Regionalization descriptors shows results highlight the effectiveness of HDA-PR surpassing the performance of a uniform regionalization method with lumped model parameters. However, the results on smallest catchments area are lowest.

The study shows the interest of using daily photos which are a good indication of the hydrogical state of the streams to obtain intermittence data and increasing the spatial coverage of observations in order to validate regional model.

How to cite: Folton, N., De Fournas, T., Colléoni, F., and Tolsa, M.: Modelling the intermittence of watercourses in the small French Mediterranean catchments of the Maures massif (Réal Collobrier ) with the SMASH platform (Spatially distributed Modelling and ASsimilation for Hydrology) , EGU General Assembly 2024, Vienna, Austria, 14–19 Apr 2024, EGU24-9681, https://doi.org/10.5194/egusphere-egu24-9681, 2024.

EGU24-9899 | Orals | HS2.1.5

60,000 years of hydrologic connectivity on the Australian dryland margins: the case of the Willandra Lakes World Heritage Area 

Kathryn Fitzsimmons, Markus Fischer, Colin Murray-Wallace, Edward Rhodes, Tobias Lauer, Maike Nowatzki, Kanchan Mishra, and Nicola Stern

Australia is big, flat, old and arid: it is the driest inhabited continent on Earth. The catastrophic flooding of recent years has demonstrated not only the potential for extreme conditions at both ends of the hydroclimatic scale, but also how little we understand of the interplay between climatic, hydrological, and surface-process mechanisms affecting this part of the world. We know still less about long-term hydrological dynamics, particularly for the dry inland where water resources are scarce and land surfaces are susceptible to erosion, requiring careful management.

Records of past hydrological variability can help inform us about changing hydroclimate states and their impact on the land surface. The Willandra lakes system, located on the desert margins of southeastern Australia, is one of the few dryland areas which preserves long-term sedimentary records of hydrologic change. The headwaters of these lakes lie in the temperate highlands hundreds of kilometres to the east; as a result, lake filling and drying reflects the interaction between rainfall in the watershed and hydrologic connectivity across the catchment and between the lakes. Environmental change in the Willandra is recorded in the sediments of the lake shoreline dunes, preserved as semi-continuous deposition of different lake facies over 60,000 years.

Here we investigate long-term hydrologic connectivity across the Willandra lakes and their catchment. Our approach uses a novel integration of lake-level reconstruction based on lunette sedimentology, stratigraphy and luminescence geochronology, with hydrologic and palaeoclimatic modelling of key event time slices over the last 60 ky. We characterize the land-surface response to various hydroclimate states, so improving our understanding of dryland atmosphere-hydrosphere interactions.

How to cite: Fitzsimmons, K., Fischer, M., Murray-Wallace, C., Rhodes, E., Lauer, T., Nowatzki, M., Mishra, K., and Stern, N.: 60,000 years of hydrologic connectivity on the Australian dryland margins: the case of the Willandra Lakes World Heritage Area, EGU General Assembly 2024, Vienna, Austria, 14–19 Apr 2024, EGU24-9899, https://doi.org/10.5194/egusphere-egu24-9899, 2024.

EGU24-10078 | ECS | Orals | HS2.1.5 | Highlight

Wheat irrigation in Marrakech conditions: A Simulation Study using SALTMED 

El Houcine El Moussaoui, Aicha Moumni, Said Khabba, and Abderrahman Lahrouni

In Morocco, agriculture accounts for 80-90% of water resources. Available data show that the performance of current irrigation systems remains low to medium, with water losses at plots ranging from 30 to 40%, divided between percolation and evaporation. Gravity irrigation is almost total in the study area, resulting in significant percolation losses. In principle, this percolation contributes mainly to the recharge of the aquifer.

The purpose of this study was to evaluate, by simulation, the impact of irrigation techniques on wheat yield and growth using the generic agro-environmental model SALTMED under the climatic and soil conditions of zone R3, which is an irrigation area located in the region of Sidi Rahal about 40 km east of the city of Marrakech in the plain of Haouz. We started the study by calibrating the model based on two parameters: photosynthetic efficiency and harvest index. After calibration, we compared different irrigation techniques implemented in the model (surface irrigation, sprinkler irrigation, and drip irrigation). Simulation results showed that the drip irrigation technique is the most economical, exhibiting the lowest losses attributed to percolation and soil evaporation. Notably, percolation, a significant contributor to groundwater recharge, measured approximately 255.5 mm/season. In addition, the irrigation practice in the study area appears to be overestimated during the observed season and could be reduced by half, according to SALTMED. When the irrigation dose is halved, the simulated yield (grain and total biomass) decreases by only 1.33%.

How to cite: El Moussaoui, E. H., Moumni, A., Khabba, S., and Lahrouni, A.: Wheat irrigation in Marrakech conditions: A Simulation Study using SALTMED, EGU General Assembly 2024, Vienna, Austria, 14–19 Apr 2024, EGU24-10078, https://doi.org/10.5194/egusphere-egu24-10078, 2024.

EGU24-10387 | ECS | Orals | HS2.1.5

Nitrogen modeling and performance of Multi-Soil-Layering (MSL)bioreactor treating domestic wastewater in rural community 

Sofyan Sbahi, Naaila Ouazzani, Abdessamed Hejjaj, Abderrahman Lahrouni, and Laila Mandi

The multi-soil-layering (MSL) bioreactor has been considered in the latest research as an
innovative bioreactor for reducing the level of pollutants in wastewater. The efficiency of the
MSL bioreactor towards nitrogen pollution is due to the mineralization of organic nitrogen in
aerobic layers to ammonia, and reactivity of ammonia nitrogen with soil and gravel by its
adsorption into soil layers followed by nitrification and denitrification processes when the
alternating phases of oxygenated/anoxic conditions occurs in the filter. In this study, we have
examined the performance of the MSL bioreactor at different hydraulic loading rates (HLRs)
and predicted the removal rate of nitrogen. To improve the prediction accuracy of the models,
the feature selection technique was performed before conducting the Neural Network model.
The results showed a significant removal (p <0.05) efficiency for five-day biochemical
oxygen demand (BOD 5,  86%), ammonium (NH 4 + , 83%), nitrates (NO 3 − , 81%), total kjeldahl
nitrogen (TKN, 84%), total nitrogen (TN, 84%), orthophosphates (PO 4 3− , 91%), and total
coliforms (TC, 1.62 Log units). However, no significant change was observed in the nitrite
(NO 2 − ) concentration as it is an intermediate nitrogen form. The MSL treatment efficiency
demonstrated a good capacity even when HLR increased from 250 to 4000 L/m 2 /day,
respectively (e.g., between 64% and 86% for BOD 5 ). The HLR was selected as the most
significant (p < 0.05) input variable that contribute to predict the removal rates of nitrogen.
The developed models predict accurately the output variables (R 2  > 0.93) and could help to
investigate the MSL behavior.

How to cite: Sbahi, S., Ouazzani, N., Hejjaj, A., Lahrouni, A., and Mandi, L.: Nitrogen modeling and performance of Multi-Soil-Layering (MSL)bioreactor treating domestic wastewater in rural community, EGU General Assembly 2024, Vienna, Austria, 14–19 Apr 2024, EGU24-10387, https://doi.org/10.5194/egusphere-egu24-10387, 2024.

EGU24-11799 | ECS | Orals | HS2.1.5 | Highlight

Exploring the mechanisms controlling dryland hydroclimate in past 'warmer worlds' 

Monika Markowska, Hubert B. Vonhof, Huw S. Groucutt, Michael D. Petraglia, Denis Scholz, Michael Weber, Axel Gerdes, Richard Albert, Julian Schroeder, Yves S. Krüger, Anna Nele Meckler, Jens Fiebig, Matthew Stewart, Nicole Boivin, Samuel L. Nicholson, Paul S. Breeze, Nicholas Drake, Julia C. Tindall, Alan M. Haywood, and Gerald Haug

Drylands cover almost half of Earth’s land surfaces, supporting ~30% of the world’s population. The International Panel on Climate Change predicts increasing aridification and expansion of drylands over the course of this century. As we approach new climate states without societal precedent, Earth’s geological past may offer the best tool to understand hydroclimate change under previously, allowing us to elucidate responses to external forcing. Paleo-records from previously warm and high-CO2 periods in Earth’s past, such as the mid-Pliocene (~3 Ma), point towards higher humidity in many dryland regions. 

Here, we examine desert speleothems from the hyper-arid desert in central Arabia, part of the largest near-continuous chain of drylands in the world, stretching from north-western Africa to the northern China, to elucidate substantial and recurrent humid phases over the past 8 million years. Independent quantitative paleo-thermometers suggest that mean annual air temperatures in central Arabia were approximately between 1 to 5 °C warmer than today. The analyses of the isotopic composition (δ18O and δ2H) of speleothem fluid inclusion waters, representing ‘fossil rainwater’, reveal an aridification trend in Arabia from the Late Miocene to Late Pleistocene during Earth’s transition from a largely ‘ice-free’ northern hemisphere to an ‘ice-age’ world. Together, our data provide evidence for recurrent discrete wetter intervals during past warmer periods, such as the Pliocene. Data-model comparisons allow us to assess the agreement between our paleoclimate data and climate model output using the HadCM3 isotope-enabled model simulations during past ‘warmer worlds’ – namely the mid-Piacenzian warm period (3.264 to 3.025 Ma). To assess the hydroclimate response to external forcing, we examine model output from a series of sensitivity experiments with different orbital configurations allowing us to postulate the mechanisms responsible for the occurrence of humid episodes in the Arabian desert, with potential implications for other dryland regions at similar latitudes. Together, our approach unveils the long-term controls on Arabian hydroclimate and may provide crucial insights into the future variability.

How to cite: Markowska, M., Vonhof, H. B., Groucutt, H. S., Petraglia, M. D., Scholz, D., Weber, M., Gerdes, A., Albert, R., Schroeder, J., Krüger, Y. S., Meckler, A. N., Fiebig, J., Stewart, M., Boivin, N., Nicholson, S. L., Breeze, P. S., Drake, N., Tindall, J. C., Haywood, A. M., and Haug, G.: Exploring the mechanisms controlling dryland hydroclimate in past 'warmer worlds', EGU General Assembly 2024, Vienna, Austria, 14–19 Apr 2024, EGU24-11799, https://doi.org/10.5194/egusphere-egu24-11799, 2024.

EGU24-12194 | ECS | Orals | HS2.1.5

High resolution surface soil moisture microwave products: intercomparison and evaluation over Spain 

Nadia Ouaadi, Lionel Jarlan, Michel Le Page, Mehrez Zribi, Giovani Paolini, Bouchra Ait Hssaine, Maria Jose Escorihuela, Pascal Fanise, Olivier Merlin, Nicolas Baghdadi, and Aaron Boone

Surface soil moisture (SSM) products at high spatial resolution are increasingly available, either from the disaggregation of coarse-resolution products such as SMAP and SMOS, or from high-resolution radar data such as Sentinel-1. In contrast to coarse resolution products, there is a lack of intercomparison studies of high spatial resolution products, which are more relevant for applications requiring the plot scale. In this context, the objective of this work is the evaluation and intercomparison of three high spatial resolution SSM products on a large database of in situ SSM measurements collected on two different sites in the Urgell region (Catalonia, Spain) in 2021. The satellite SSM products are: i) SSMTheia product at the plot scale derived from a synergy of Sentinel-1 and Sentinel-2 using a machine learning algorithm; ii) SSMρ product at 14 m resolution derived from the Sentinel-1 backscattering coefficient and interferometric coherence using a brute-force algorithm; and iii) SSMSMAP20m product at 20 m resolution obtained from the disaggregation of SMAP using Sentinel-3 and Sentinel-2 data. Evaluation of the three products over the entire database showed that SSMTheia and SSMρ yielded a better estimate than SSMSMAP20m, and SSMρ is slightly better than SSMTheia. In particular, the correlation coefficient is higher than 0.4 for 72%, 40% and 27% of the fields using SSMρ, SSMTheia and SSMSMAP20m, respectively. The lower performance of SSMTheia compared to SSMρ is due to the saturation of SSMTheia at 0.3 m3/m3. The time series analysis shows that SSMSMAP20m is able to detect rainfall events occurring at large scale while irrigation at the plot scale are not caught. This is explained by the use of Sentinel-2 reflectances, which are not linked to surface water status, for the disaggregation of Sentinel-3 land surface temperature. The approach can therefore be improved by using high spatial and temporal resolution thermal data in the perspective of new missions such as TRISHNA and LSTM. Finally, the results show that although reasonable estimates are obtained for annual crops using SSMTheia and SSMρ, poor performance is observed for trees, suggesting the need for better representation of canopy components for tree crops in SSM inversion approaches.

How to cite: Ouaadi, N., Jarlan, L., Le Page, M., Zribi, M., Paolini, G., Ait Hssaine, B., Escorihuela, M. J., Fanise, P., Merlin, O., Baghdadi, N., and Boone, A.: High resolution surface soil moisture microwave products: intercomparison and evaluation over Spain, EGU General Assembly 2024, Vienna, Austria, 14–19 Apr 2024, EGU24-12194, https://doi.org/10.5194/egusphere-egu24-12194, 2024.

    The Yellow River (YR) is 5464 km long and the cradle of Chinese civilization. It is also well known for being the most sediment-laden river and having the largest vertical drop over its course. Although the YR accounts for only 3% of China’s water resources, it irrigates 13% of its cropland. Exceptional historical documents have recorded frequent occurrence of YR flooding events that resulted in huge losses of lives and property.
    The earliest observational record of YR runoff, beginning in 1919 at the Shanxian gauge station, is too short to study centennial-scale variability. Since the start of the Anthropocene in the 1960s, frequent human activities have resulted in large deviation between observed streamflow. The reconstruction of annual historical natural runoff of the YR is necessary to quantify the amount of anthropogenic YR water consumption in recent decades. Tree rings, with the merits of accurate dating and annual resolution, have been widely used in runoff reconstruction worldwide. In this study, 31 moisture-sensitive tree-ring width chronologies, including 860 trees and 1707 cores, collected within the upper-middle YR basins were used to reconstruct natural runoff for the middle YR course over the period 1492–2013 CE.
    The reconstruction provides a record of natural YR runoff variability prior to large-scale human interference. Most of the extreme high/low runoff events in the reconstruction can be verified with historical documents. The lowest YR flow since 1492 CE occurred during 1926–1932 CE and the YR runoff in 1781 is the highest. These two extreme values could be regarded as a benchmark for future judicious planning of water allocation. Since the late 1980s, observed YR runoff has fallen out of its natural range of variability, and there was even no water flow for several months each year in the lower YR course during 1995 to 1998. Especially concerning was that the inherent 11-year and 24-year cycles of YR became disordered following the severe drought event in late 1920s, and eventually disappeared after the 1960s.
    Year-to-year variability in YR water consumption by human activities (WCHA) was quantified, which showed good association between crop yields and acreage in Ningxia and Inner Mongolia irrigation regions. Meanwhile, WCHA was strongly negatively correlated with sediment load at Toudaoguai and Shanxian stations, which led to a 58% reduction of sediment load in Toudaoguai (upper reach) and 29% in Shanxian (middle reach). 
    If human activities continue to intensify, future YR runoff will be further reduced, and this will negatively impact agriculture, human lives, and socioeconomic development in the middle and lower basins of the YR. To reduce the risk of recurring cutoff of streamflow in the YR lower basin, water should be allocated judiciously. Our reconstructed YR natural runoff series are important for future YR water resource management. In addition, our results also provide an important model of how to distinguish and quantify anthropogenic influence from natural variability in global change studies.

How to cite: Liu, Y.: Changes and attribution of natural runoff in the Yellow River over the past 500 years, EGU General Assembly 2024, Vienna, Austria, 14–19 Apr 2024, EGU24-13979, https://doi.org/10.5194/egusphere-egu24-13979, 2024.

EGU24-14057 | ECS | Posters on site | HS2.1.5

Turbulent fluxes at kilometer scale determined by optical-microwave scintillometry in a heterogeneous oasis cropland of the Heihe River Basin 

Feinan Xu, Weizhen Wang, Chunlin Huang, Jiaojiao Feng, and Jiemin Wang

Observations of kilometer-scale turbulent fluxes of sensible (H) and latent heat (LE) are required for the validation of flux estimate algorithms from satellite remote-sensing data and the development of parameterization schemes in the hydro-meteorological models. Since 2019, two sets of Optical and Microwave scintillometer (OMS) systems have been operated in the Heihe River Basin of northwestern China, one on an alpine grassland of upper reaches, another on an oasis cropland of middle reaches, to measure both the areal H and LE. Combined with the observations of eddy-covariance (EC) and meteorological tower systems in both sites, an improved procedure for OMS data processing is proposed. The newly proposed procedure especially improves the preprocessing of raw scintillation data, properly uses the current probably better Lüdi et al. (2005) method in deriving meteorological structure parameters, and chooses the coefficients of similarity functions by Kooijmans and Hartogensis (2016) in calculating fluxes. Evaluated with the results of rather homogeneous grassland, the area-averaged H and LE over the heterogeneous oasis are then determined. Estimates of H and LE agree reasonably well with those obtained from EC in most cases. However, the most interesting is that LE over the oasis during the early crop growing stages is clearly larger than that of EC; while both agree well during the longer crop grown periods. Footprint analysis shows that, compared with EC, the OMS has clearly larger source area that contains a slight area of orchard and shelterbelts distributed near the light path, leading to larger LE during the early stages of crop growth. The area-averaged evapotranspiration (ET) over the oasis is then analyzed more acceptably, which varies from 3 to 5 mm day-1 depending on meteorological conditions during the 39 days of the crop growing period. These results are used to validate the Penman-Menteith-Leuning Version 2 (PML-V2) scheme.

How to cite: Xu, F., Wang, W., Huang, C., Feng, J., and Wang, J.: Turbulent fluxes at kilometer scale determined by optical-microwave scintillometry in a heterogeneous oasis cropland of the Heihe River Basin, EGU General Assembly 2024, Vienna, Austria, 14–19 Apr 2024, EGU24-14057, https://doi.org/10.5194/egusphere-egu24-14057, 2024.

    Recurrent droughts in history, especially climatic aridity since the mid-20th century have aroused great social anxiety about the water resources in the Chinese Loess Plateau (CLP). Given lacking of extended instrumental-like records, new precipitation reconstructions in the CLP are badly needed for objectively evaluating the current precipitation situation, understanding the spatial-temporal differences, and serving for predicting the future. Here we present a tree-ring-based 248-year regional precipitation reconstruction (P8–7) in the Heichashan Mountain, which can significantly represent the past dry-wet variations in the eastern CLP (ECLP). P8–7 explains 48.72% of the instrumental record, reveals a wetting trend since the early 2000s and attains the second wettest period over the past 248 years in 2014–2020 AD. The 1920s/2010s is recorded as the driest/wettest decade. 1910–1932 AD ranks as the driest period over the past centuries. The 19th century is comparatively wet while the 20th century is dry. Precipitation in the ECLP and western CLP (WCLP) has changed synchronously over most time of the past two centuries. However, regional difference exists in the 1890s–1920s when a gradually drying occurred in the ECLP, while not evident in the WCLP, although the 1920s megadrought occurred in the CLP. Moreover, the 20th-century drying in the ECLP begins in the 1950s, later than the WCLP. It reveals that P8–7 variability is primarily influenced by the Asian Summer Monsoon and related large-scale circulations. The seismic phase shift of the contemporaneous Northern Hemispheric temperature may also be responsible for the 1920s megadrought.

How to cite: Cai, Q. and Liu, Y.: Hydroclimatic characteristics on the Chinese Loess Plateau over the past 250 years inferred from tree rings, EGU General Assembly 2024, Vienna, Austria, 14–19 Apr 2024, EGU24-14189, https://doi.org/10.5194/egusphere-egu24-14189, 2024.

EGU24-16291 | ECS | Orals | HS2.1.5

A New Perspective on Agricultural Drought Periods: A Mediterranean Semi-Arid Context 

Kaoutar Oukaddour, Michel Le Page, and Younes Fakir

Extreme weather events have an increasing repercussions on ecosystems in recent years. By comprehending how vegetation responds to climatic extremes, their effects may be mitigated. In a semi-arid Mediterranean region, this study examines the temporal connections of the main triggers of agricultural drought, low precipitation, vegetation growth, thermal stress, and soil water deficit. Drought periods and their characteristics were determined using a revised run theory approach. The Pearson correlations across various spatial scales revealed a moderate to low degree of concordance among the drought indices. This discrepancy can be attributed to the geographical heterogeneity and climatic variations observed among the agrosystems within the basin.

The cross-correlation analysis demonstrated the cascading impacts resulting from reduced precipitation. During drought events, the significant connection between precipitation deficits and vegetation persists for at least one month across most index pairs. This suggests that agricultural drought occurrences can be temporally linked through the selected drought indices. The study unveiled short-, mid-, and long-term effects of precipitation deficiencies on soil moisture, vegetation, and temperature. As anticipated, variables like soil moisture and surface temperature, being more instantaneous, exhibited no lag in response to precipitation. Notably, vegetation anomalies at the monthly time step displayed a two-month lag, indicating a preceding impact of vegetation on precipitation.

Employing the run theory to identify drought events and stages with different thresholds revealed substantial variability in drought characteristics namely the duration, the magnitude magnitude, and the intensity. This variability was notably influenced by the selection of both normality and drought thresholds.

How to cite: Oukaddour, K., Le Page, M., and Fakir, Y.: A New Perspective on Agricultural Drought Periods: A Mediterranean Semi-Arid Context, EGU General Assembly 2024, Vienna, Austria, 14–19 Apr 2024, EGU24-16291, https://doi.org/10.5194/egusphere-egu24-16291, 2024.

EGU24-17049 | ECS | Orals | HS2.1.5

Potential of the Photochemical Reflectance Index in Understanding Photoinhibition and Improving Irrigation Water Efficiency in the Mediterranean Zone 

Zoubair Rafi, Saïd Khabba, Valérie Le Dantec, Patrick Mordelet, Salah Er-Raki, Abdelghani Chehbouni, and Olivier Merlin

Morocco's semi-arid region faces challenges due to limited water resources, necessitating efficient irrigation practices for sustainable agriculture. Precision agriculture, coupled with advanced technologies like the Photochemical Reflectance Index (PRI), holds great potential for optimizing irrigation water usage and enhancing crop productivity in this environment. This abstract provides a comprehensive overview of integrating precision agriculture techniques, PRI, and Net Radiation (Rn) to improve irrigation water efficiency and maximize crop productivity in Morocco's semi-arid zone. The study presents and analyzes an experimental investigation of the PRI signal in a winter wheat field throughout an agricultural season to comprehend its dependence on agro-environmental parameters such as global radiation (Rg) and Rn. Rn directly impacts the energy absorbed by plants, a crucial factor for photosynthesis. Elevated Rn levels generally increase energy availability for photosynthetic processes, resulting in higher chlorophyll fluorescence and PRI values. However, excessive Rn can lead to photoinhibition, damaging the photosynthetic apparatus and reducing photosynthetic efficiency. Understanding the interplay between net radiation, PRI, and photoinhibition is crucial for optimizing agricultural practices. Monitoring and managing net radiation levels allow farmers to ensure that the energy available for photosynthesis remains within the optimal range, minimizing the risk of photoinhibition while maximizing crop productivity. Additionally, the daily water stress index based on PRI (PRIj), developed independently of structural effects related to leaf area index (LAI), showed a coefficient of determination (R2) of 0.74 between PRIj and Rn. This reflects the extent of excessive light stress experienced by the wheat field throughout the experiment. In conclusion, the integration of precision agriculture techniques, specifically PRI, offers a promising approach to enhance irrigation water efficiency in Morocco's semi-arid zone. By employing this innovative tool, farmers can optimize water usage, reduce environmental impacts, and ensure the long-term sustainability of agriculture.

How to cite: Rafi, Z., Khabba, S., Le Dantec, V., Mordelet, P., Er-Raki, S., Chehbouni, A., and Merlin, O.: Potential of the Photochemical Reflectance Index in Understanding Photoinhibition and Improving Irrigation Water Efficiency in the Mediterranean Zone, EGU General Assembly 2024, Vienna, Austria, 14–19 Apr 2024, EGU24-17049, https://doi.org/10.5194/egusphere-egu24-17049, 2024.

EGU24-17321 | ECS | Orals | HS2.1.5

Quantifying Olive Tree Evapotranspiration in Semi-Arid Regions through Remote Sensing-Based SEBAL Model: Validation with Optical-Microwave Scintillometer 

Hamza Barguache, Jamal Ezzahar, Mohamed Hakim Kharrou, Said Khabba, Jamal Elfarkh, Abderrahim Laalyej, Salah Er-Raki, and Abdelghani Chehbouni

Accurately assessing sensible (H) and latent (LE) heat fluxes, along with evapotranspiration, is crucial for comprehending the energy balance at the biosphere-atmosphere interface and enhancing agricultural water management. Although the eddy covariance (EC) method is commonly employed for these measurements, it has limitations in providing spatial representativeness beyond a few hundred meters. Addressing this challenge, optical-microwave scintillometers (OMS) have emerged as a valuable tool, directly measuring kilometer-scale H and LE fluxes. These measurements serve to validate satellite remote sensing products and model simulations, such as the Surface Energy Balance Algorithm for Land (SEBAL). In this study, OMS measurements were utilized to assess the fluxes simulated by the SEBAL model at the Agdal olive orchard near Marrakech city. The results revealed that SEBAL's estimated sensible heat fluxes were 3% higher than those measured by OMS, while latent heat fluxes were approximately 15% lower. Based on these findings, we infer that OMS can effectively validate satellite-driven surface energy balance models, thereby supporting agricultural water management.

How to cite: Barguache, H., Ezzahar, J., Kharrou, M. H., Khabba, S., Elfarkh, J., Laalyej, A., Er-Raki, S., and Chehbouni, A.: Quantifying Olive Tree Evapotranspiration in Semi-Arid Regions through Remote Sensing-Based SEBAL Model: Validation with Optical-Microwave Scintillometer, EGU General Assembly 2024, Vienna, Austria, 14–19 Apr 2024, EGU24-17321, https://doi.org/10.5194/egusphere-egu24-17321, 2024.

EGU24-17560 | ECS | Posters virtual | HS2.1.5

Estimation of Irrigation Water Demand in the Southern Mediterranean Region through Explicit Integration of Irrigation Processes in a Land Surface Model: A Case Study of the Tensift Catchment (Morocco). 

Ahmed Moucha, Lionel Jarlan, Pére Quintana-Segui, Anais Barella-Ortiz, Michel Le Page, Simon Munier, Adnane Chakir, Aaron Boone, Fathallah Sghrer, Jean-christophe Calvet, and Lahoucine Hanich

The utilization of water by various socio-economic sectors has made this resource highly sought after, especially in arid to semi-arid zones where water is already scarce and limited. In this context, effective management of this resource proves to be crucial. Our study aims to: evaluate the performance of the new irrigation module in ISBA, quantify the water balance, and assess the impact of climate change and anthropogenic factors on this resource by the horizon of 2041-2060, utilizing high-resolution futuristic forcings from the study (Moucha et al., 2021). To assess the ISBA model with its new irrigation module, we initially compared observed and predicted fluxes with and without activation of the irrigation module. Subsequently, we compared irrigation water inputs at the ORMVAH-defined irrigated perimeters within the Tensift basin. The results of this evaluation showed that the predictions of latent heat flux (LE) considering all available stations in the basin shifted from -60 W/m² for the model without irrigation to -15 W/m². This indicates that the integration of the new irrigation system into ISBA significantly improves the predictions of latent heat flux (LE) over the period 2004-2014 compared to the regular model. Considering the irrigated perimeters, the study results demonstrated that the model with the integration of the irrigation module was capable of replicating the overall magnitude and seasonality of water quantities provided by ORMVAH despite a positive bias. Exploration of the water balance at the Tensift basin level revealed the ISBA model's ability, equipped with its irrigation module, to describe complex relationships among precipitation, irrigation, evapotranspiration, and drainage. Finally, the assessment of the impact of climate change and vegetation cover for the period 2041-2060, utilizing high-resolution SAFRAN forcings projected to the same horizon (Moucha et al., 2021), revealed an increase in irrigation water needs. These results are of paramount importance in the context of sustainable water resource management in arid and semi-arid regions.

How to cite: Moucha, A., Jarlan, L., Quintana-Segui, P., Barella-Ortiz, A., Le Page, M., Munier, S., Chakir, A., Boone, A., Sghrer, F., Calvet, J., and Hanich, L.: Estimation of Irrigation Water Demand in the Southern Mediterranean Region through Explicit Integration of Irrigation Processes in a Land Surface Model: A Case Study of the Tensift Catchment (Morocco)., EGU General Assembly 2024, Vienna, Austria, 14–19 Apr 2024, EGU24-17560, https://doi.org/10.5194/egusphere-egu24-17560, 2024.

EGU24-17649 | ECS | Orals | HS2.1.5

Comprehensive Analysis of Hydrological Dynamics and Uncertainties in the Moroccan High Atlas: A Focus on Seasonal Precipitation, Runoff, and Flood Events 

Myriam Benkirane, Abdelhakim Amazirh, El Houssaine Bouras, Adnane Chakir, and Said Khabba

The Mediterranean regions, particularly the Moroccan High Atlas, is exposed to natural risks associated with the hydrological cycle, notably intense precipitation events that trigger sudden floods. This research delves into the subtleties of hydrological dynamics in the High Atlas watersheds, specifically in the Zat watershed, to comprehend the seasonality of precipitation and runoff and elucidate the origins of floods.

The results reveal a strong correlation between observed and simulated hydrographs, affirming the model's capability to capture complex hydrological processes. Evaluation metrics, particularly the Nash coefficient, demonstrate a robust model performance during the calibration phase, ranging from 61.9% to 90%. This attests to the model's ability to reproduce the dynamic nature of hydrological systems in the Moroccan High Atlas.

It is noteworthy that the study identifies the snowmelt process as a significant factor of uncertainty in runoff flooding parameters. The complexities associated with snowmelt, especially in the context of spring precipitation, emerge as a crucial factor influencing uncertainties in the simulated results. This finding underscores the importance of accurately representing snowmelt dynamics in hydrological simulations for regions prone to natural risks.

Moreover, the integration of Probability Distribution Functions and Monte Carlo simulations, coupled with rigorous evaluation metrics, enhances our understanding of calibration parameter uncertainties and validates the model's performance. The identified influence of snowmelt on runoff flooding parameters provides crucial insights for future model improvements and the development of effective mitigation strategies in regions vulnerable to natural risks. This research contributes to advancing hydrological modeling practices in complex terrain.


Keywords: Seasonality, Rainfall-Runoff, Floods, Calibration, Monte Carlo simulation, Parameter Uncertainty, Hydrological Modeling, Snowmelt Dynamics, Natural Risks.

How to cite: Benkirane, M., Amazirh, A., Bouras, E. H., Chakir, A., and Khabba, S.: Comprehensive Analysis of Hydrological Dynamics and Uncertainties in the Moroccan High Atlas: A Focus on Seasonal Precipitation, Runoff, and Flood Events, EGU General Assembly 2024, Vienna, Austria, 14–19 Apr 2024, EGU24-17649, https://doi.org/10.5194/egusphere-egu24-17649, 2024.

The Mediterranean area is recognized as a hotspot for climate change challenges, with noticeable patterns of rising temperatures and dryness. Olive agroecosystems are particularly affected by the increasing aridity and global climatic changes. Despite being a symbol of the Mediterranean and traditionally grown using rainfed agricultural practices, olive growers have to adapt to cope with higher temperatures, drought, and more frequent severe weather incidents, necessitating their attention and adaptation (Fraga et al., 2020). Moreover, crop production in Morocco heavily relies on irrigation because rainfed cropping has limited productivity (Taheripour et al., 2020). The olive sector is of great importance in Morocco, and there is an urgent need to implement sustainable water management practices. This includes water-saving strategies such as regulated and sustained deficit irrigation (RDI and SDI) to sustain olive production and strengthen the sector's resilience to climate change and water scarcity. These strategies primarily differ in terms of their irrigation timing and the quantity of water applied (Ibba et al., 2023). This study aims to evaluate the effect of two deficit irrigation strategies on productive parameters of the Menara olive cultivar, to serve as a tool for operational irrigation water management and appraise the adaptive responses of this cultivar under conditions of induced drought stress. In pursuit of this aim, an experiment was carried out in an olive orchard over two consecutive years (2021 and 2022), comparing four treatments of regulated deficit irrigation (RDI): T1 (SP 100- NP 70% ETc), T2 (SP 100- NP 60% ETc), T3 (SP 80- NP 70% ETc), T4 (SP 80- NP 60% ETc) and two treatments of sustained deficit irrigation (SDI): T5 (70% ETc) and T6 (60% ETc), with fully irrigated trees T0 (100% ETc). The findings showed that controlled water stress, as applied through regulated deficit irrigation (RDI), did not exert a severe impact on the flowering traits and yield of the Menara olive cultivar. Notably, the RDI strategy, particularly under T4 treatment, allowed for the reduction of supplied water by 20% in sensitive periods (SP) flowering and from the beginning of oil synthesis to harvest and by 40% in the normal period (NP)during pit hardening, respectively, without compromising fruit yield. However, the SDI strategy, characterized by restricted water availability, which reduced total water application under T5 and T6 treatments by 30% and 40% throughout the entire season, led to a decline in the fruit yield by about 50% and resulted in the most significant drop in water productivity, ranging from 19% to 33% compared to the control T0. Furthermore, the findings underscored the adaptability of responses to water stress and elucidated the consequential impact of each irrigation strategy on the performance of Menara olive trees across successive years, particularly the importance of regulated deficit irrigation as a water management strategy and the need to consider its implication on flowering traits and crop yield over successive growing seasons to establish the enduring adaptability of this locally cultivated olive cultivar.

How to cite: Ibba, K., Er-Raki, S., Bouizgaren, A., and Hadria, R.: Sustainable Water Management for Menara Olive Cultivar: Unveiling the Potential of Regulated and Sustained Deficit Irrigation Strategies in Morocco, EGU General Assembly 2024, Vienna, Austria, 14–19 Apr 2024, EGU24-17808, https://doi.org/10.5194/egusphere-egu24-17808, 2024.

EGU24-17983 | ECS | Orals | HS2.1.5

Comparison of C-band radar and infrared thermal data for monitoring corn field in semi-arid area. 

Abdelhafid Elallaoui, Pierre-Louis Frison, Saïd Khabba, and Lionel Jarlan

In semi-arid Mediterranean regions, the scarcity and limitations of water resources pose major challenges. These invaluable resources are threatened by various factors such as climate change, population growth, urban expansion, and agricultural intensification. Specifically, agriculture, which consumes approximately 85% of the water in the semi-arid zone of the South Mediterranean region, directly contributes to the depletion of groundwater. To promote rational irrigation management, it becomes imperative to monitor the water status of crops. Remote sensing is a valuable technique allowing for monitoring crop fields in different parts of the electromagnetic spectrum giving complementary information about crop parameters. The main objective of this study is to assess the potential of radar and Infrared Thermal data for monitoring the water status of crops in semi-arid regions. In this context, a radar system was installed in Morocco, in the Chichaoua region, consisting of 6 C-band antennas mounted on a 20-meter tower. These antennas are directed towards a maize field. This system allowed for radar data acquisition in three different polarizations (VV, VH, HH) with a 15-minute time-step over the time period extending from September to December 2021. Additionally, the system is complemented by continuous acquisitions from a Thermal Infrared Radiometer (IRT) at 30-minute intervals. These data are further supplemented by in-situ measurements characterizing crop parameters (state of the cover, soil moisture, evapotranspiration and meteorological variables). The study initially focused on analyzing the diurnal cycle of radar temporal coherence. The results indicated that coherence was highly sensitive to wind-induced movements of scatterers, with minimal coherence when wind speed was highest in the late afternoon. Moreover, coherence was also responsive to vegetation activity, particularly its water content, as the morning coherence drop coincided with the onset of plant activity. Subsequently, the study examined the potential of the relative difference between surface vegetation temperature and air temperature to monitor the water status of crops. The results showed that during a period of imposed water stress, the amplitude of this difference increased. These results open perspectives for monitoring the water status of crops using radar and thermal observations with a high revisit frequency.

How to cite: Elallaoui, A., Frison, P.-L., Khabba, S., and Jarlan, L.: Comparison of C-band radar and infrared thermal data for monitoring corn field in semi-arid area., EGU General Assembly 2024, Vienna, Austria, 14–19 Apr 2024, EGU24-17983, https://doi.org/10.5194/egusphere-egu24-17983, 2024.

EGU24-18201 | ECS | Orals | HS2.1.5

Analyzing Tree Degradation in the Haouz Plain through Remote Sensing: Assessing the Impact of Drought and Spatial Extent 

Youness Ablila, Abdelhakim Amazirh, Saïd Khabba, El Houssaine Bouras, Mohamed hakim Kharrou, Salah Er-Raki, and Abdelghani Chehbouni

Trees characterized by persistent foliage, like olive trees, serve as indispensable assets in arid and semi-arid regions, exemplified by the Haouz plain in central Morocco. The decline in water resources for irrigation, attributed to climate change and excessive underground water extraction, has led to significant degradation of tree orchards in recent years. Employing remote sensing data, we conducted a spatial analysis of tree degradation from 2013 to 2022 using the supervised classification method. Subsequently, a drying speed index (DS) was computed based on the Normalized Difference Vegetation Index (NDVI) derived from Landsat-8 data, specifically focusing on the identified trees. This DS was then correlated with the Standardized Precipitation Index (SPIn) to elucidate the connection between tree degradation and drought, as indicated by precipitation deficit. The findings reveal a discernible declining trend in trees, with an average decrease in NDVI by 0.02 between 2019 and 2022 compared to the reference period (2013-2019). This decline has impacted an extensive area of 37,550 hectares. Furthermore, the outcomes derived from the analysis of SPI profiles depict a prolonged period of dryness, particularly extreme drought in the past four years, characterized by SPI values consistently below -2. Notably, a high correlation coefficient (R) of -0.87 and -0.88 was observed between DS and SPI9 and SPI12 respectively, emphasizing the strong linkage between drying speed and the duration and intensity of drought. These findings emphasize the reliability of NDVI as an effective tool for precise classification of tree land cover. Additionally, they underscore the significant influence of drought on the degradation of trees in the Haouz plain.

How to cite: Ablila, Y., Amazirh, A., Khabba, S., Bouras, E. H., Kharrou, M. H., Er-Raki, S., and Chehbouni, A.: Analyzing Tree Degradation in the Haouz Plain through Remote Sensing: Assessing the Impact of Drought and Spatial Extent, EGU General Assembly 2024, Vienna, Austria, 14–19 Apr 2024, EGU24-18201, https://doi.org/10.5194/egusphere-egu24-18201, 2024.

EGU24-18295 | ECS | Posters on site | HS2.1.5

The relevance of Rossby wave breaking for precipitation in the world’s arid regions 

Andries Jan De Vries, Moshe Armon, Klaus Klingmüller, Raphael Portmann, Matthias Röthlisberger, and Daniela I.V. Domeisen

Precipitation-related extremes in drylands expose more than a third of the world population living in these regions to drought and flooding. While weather systems generating precipitation in humid low- and high-latitude regions are widely studied, our understanding of the atmospheric processes governing precipitation formation in arid regions remains fragmented at best. Regional studies have suggested a key role of the extratropical forcing for precipitation in arid regions. Here we quantify the contribution of Rossby wave breaking for precipitation formation in arid regions worldwide. We combine potential vorticity streamers and cutoffs identified from ERA5 as indicators of Rossby wave breaking and use four different precipitation products based on satellite-based estimates, station data, and reanalysis. Rossby wave breaking is significantly associated with up to 80% of annual precipitation and up to 90% of daily precipitation extremes in arid regions equatorward and downstream of the midlatitude storm tracks. The relevance of wave breaking for precipitation increases with increasing land aridity. Contributions of wave breaking to precipitation dominate in the poleward and westward portions of subtropical arid regions during the cool season. In these regions, climate projections for the future suggest a strong precipitation decline, while projections of precipitation extremes are highly uncertain due to the influence of the atmospheric circulation. Thus, our findings emphasize the importance of Rossby wave breaking as an atmospheric driver of precipitation in arid regions with large implications for understanding projections and constraining uncertainties of future precipitation changes in arid regions that are disproportionally at risk of freshwater shortages and flood hazards.

How to cite: De Vries, A. J., Armon, M., Klingmüller, K., Portmann, R., Röthlisberger, M., and Domeisen, D. I. V.: The relevance of Rossby wave breaking for precipitation in the world’s arid regions, EGU General Assembly 2024, Vienna, Austria, 14–19 Apr 2024, EGU24-18295, https://doi.org/10.5194/egusphere-egu24-18295, 2024.

EGU24-19012 | Orals | HS2.1.5

Decoupling the Influence of Climate Change and Natural Variability on the Middle Eastern Shamal Wind  

Hamza Kunhu Bangalth, Jerry Raj, Udaya Bhaskar Gunturu, and Georgiy Stenchikov

The Middle Eastern Shamal, a prominent north-northwesterly wind, plays a crucial role in the Arabian Peninsula's climate and environment. Originating from the interaction between a semipermanent anticyclone over northern Saudi Arabia and a cyclone over southern Iran, it influences regional climate. The Shamal is essential in transporting dust and pollutants from the Tigris-Euphrates to the Persian Gulf, affecting air quality, health, and travel. Its potential as a renewable energy source also highlights its importance for the region's future energy strategies.

However, understanding the time series of the Shamal wind is a complex task, owing to the intertwined influences of natural climate variability and human-induced climate change. While climate change is a critical factor, natural variability driven by internal climate modes like the Atlantic Multidecadal Oscillation (AMO), Pacific Decadal Oscillation (PDO), and North Atlantic Oscillation (NAO) also significantly influences these winds. These oscillations, operating over multidecadal scales, alongside the overarching trend of climate change, form a complex web affecting the regional climate. 

This study addresses the challenge of decoupling the impacts of climate change and natural climate variability on the Shamal wind. Our analysis employs Empirical Mode Decomposition (EMD), a relatively new approach that allows us to decouple the influence of various internal climate modes from that of anthropogenic climate change. This method surpasses traditional techniques by avoiding assumptions of linearity and stationarity. The study utilizes ERA5 reanalysis data to analyze summer and winter Shamal winds.

Preliminary findings indicate that internal climate modes like the AMO are equally significant as climate change in influencing Shamal wind in the past. This insight is crucial for more accurate projections and predictions of future Shamal wind behavior, benefiting the Middle East's environmental management, health, and renewable energy sectors.

How to cite: Bangalth, H. K., Raj, J., Gunturu, U. B., and Stenchikov, G.: Decoupling the Influence of Climate Change and Natural Variability on the Middle Eastern Shamal Wind , EGU General Assembly 2024, Vienna, Austria, 14–19 Apr 2024, EGU24-19012, https://doi.org/10.5194/egusphere-egu24-19012, 2024.

EGU24-19172 | Orals | HS2.1.5

Assessing the possibilities of Sentinel products for qualifying and quantifying soil water status of agricultural systems in southern France  

Claude Doussan, Urcel Kalenga Tshingomba, Nicolas Baghdadi, Fabrice Flamain, Arnaud Chapelet, Guillaume Pouget, and Dominique Courault

Water management poses a pervasive challenge in southern France, exacerbated by increasing summer droughts linked to global warming. Water use during spring and summer increases and gets more variable in term of quantity used for crops. Agricultural water use is highly influenced by the diversity in irrigation practices and technics (sprinkler irrigation, drip irrigation, flooding, etc.) ; and can lead to tensions among water users. It is thus essential to estimate field water use at basin scale, as well as crop water status, in order to further optimize water delivered for irrigation. Advances in remote sensing, particularly with Sentinel 1 (S1) and 2 (S2) data, facilitated the development of soil moisture products (SMP) with improved spatial and temporal resolution to characterize soil water in agricultural plots. These SMP products are accessible through the Theia French public platform and suitable for main crops, with NDVI below 0.75 or surfaces with moderate roughness. These specifications can be met for a variety of crop conditions in the south of France. Yet, the validity of the SMP products under various agricultural plot conditions, considering slope, orientation, roughness, and soil moisture, remains to be assessed over extended time periods. From another point of view, such SMP products do not presently apply to orchards plots, which are however, an essential but overlooked component of water use in irrigation and deserve further examination with S1 and S2 data. The objective of our study is twofold: (i) to test SMP products for field crops in different settings and among years, (ii) to preliminary test if S1 data, combined to S2 data, may be linked to soil moisture in orchard plots. Results reveal for (i) that differences can appear between SMP products and soil moisture in various monitored plots, primarily due to variability within farming systems. Beyond a specific slope and vegetation threshold, the correlation does not improve significantly. For (ii), in orchards plots, using a time smoothing of data, S1 VV-retrodiffusion data and NDVI from S2 seem to correlate with soil moisture measurements, with an RMSE < 0.05 cm3/cm3 and enable detection of irrigation events. This study shows that S1 and S2 data are valuable in estimating soil moisture of agricultural plots, giving however some limits in their use, and gives some hope in their further use for orchards water management.

How to cite: Doussan, C., Kalenga Tshingomba, U., Baghdadi, N., Flamain, F., Chapelet, A., Pouget, G., and Courault, D.: Assessing the possibilities of Sentinel products for qualifying and quantifying soil water status of agricultural systems in southern France , EGU General Assembly 2024, Vienna, Austria, 14–19 Apr 2024, EGU24-19172, https://doi.org/10.5194/egusphere-egu24-19172, 2024.

EGU24-19511 | Posters on site | HS2.1.5

OurMED PRIMA-funded Project: Sustainable Water Storage and Distribution in the Mediterranean 

Seifeddine Jomaa, Amir Rouhani, Maria Schade, J. Jaime Gómez-Hernández, Antonio Moya Diez, Maroua Oueslati, Anis Guelmami, George P. Karatzas, Emmanouil A Varouchakis, Maria Giovanna Tanda, Pier Paolo Roggero, Salvatore Manfreda, Nashat Hamidan, Yousra Madani, Patrícia Lourenço, Slaheddine Khlifi, Irem Daloglu Cetinkaya, Michael Rode, and Nadim K Copty

The Mediterranean Region is a unique mosaic of different cultures and climates that shape its peoples, natural environment, and species diversity. However, rapid population growth, urbanisation and increased anthropogenic pressures are threatening water quantity, quality, and related ecosystem services. Known as a climate change hotspot, the Mediterranean region is increasingly experiencing intensifying droughts, diminished river flows, and drier soils making water management even more challenging. This situation calls for an urgent need for water management to shift from a mono-sectoral water management approach based on trade-offs, to more balanced multisectoral management that considers the requirement of all stakeholders. This means that sustainable water management requires ensuring that water is stored and shared fairly across all sectors at the basin scale.

The research project OurMED (https://www.ourmed.eu/) is part of the Partnership for Research and Innovation in the Mediterranean Area (PRIMA) Programme supported by the European Union’s Horizon 2020 Research and Innovation Programme under Grant Agreement No 2222. The project was launched in June 2023 and will continue for three years with a grant of 4.4 million euros to develop a holistic water storage and distribution approach tightly integrated into ecosystem services at the river basin scale.

OurMED builds on the multidisciplinary skills of 15 consortium Partners and comprises universities, NGOs, research centres and SMEs from ten countries with complementary expertise in hydrology, hydrogeology, agronomy, climate change, social sciences, remote sensing, digital twins, ecology, and environmental sciences, among others, making it a truly interdisciplinary project. OurMED includes eight distinct demo sites, representing diverse water-related ecosystem properties of the Mediterranean landscape. These include the catchment areas of Bode (Germany), Agia (Crete, Greece), Konya (Turkey), Mujib (Jordan), Medjerda (Tunisia), Sebou (Morocco), Arborea (Sardinia, Italy), and Júcar (Spain). The Mediterranean basin, as a whole, is considered as an additional regional demo site to ensure replicability and reproducibility of proposed solutions at larger scales. 

OurMED vision combines not only technologically-advanced monitoring, smart modelling and optimization capabilities, but also provides data fusion and integrated digital twin technologies to make optimized solutions readily available for decision making. OurMED concept and its implementation to the different demo sites will be presented and discussed.

How to cite: Jomaa, S., Rouhani, A., Schade, M., Gómez-Hernández, J. J., Moya Diez, A., Oueslati, M., Guelmami, A., Karatzas, G. P., Varouchakis, E. A., Tanda, M. G., Roggero, P. P., Manfreda, S., Hamidan, N., Madani, Y., Lourenço, P., Khlifi, S., Daloglu Cetinkaya, I., Rode, M., and Copty, N. K.: OurMED PRIMA-funded Project: Sustainable Water Storage and Distribution in the Mediterranean, EGU General Assembly 2024, Vienna, Austria, 14–19 Apr 2024, EGU24-19511, https://doi.org/10.5194/egusphere-egu24-19511, 2024.

EGU24-20067 | ECS | Orals | HS2.1.5

Impact Of Ocean Layer Thickness on The Simulation Of African Easterly Waves in High-Resolution Coupled General Circulation Model Simulations 

Jerry Raj, Elsa Mohino Harris, Maria Belen Rodriguez de Fonseca, and Teresa Losada Doval

African easterly waves (AEWs) play a crucial role in the high-frequency variability of West African Monsoon (WAM) precipitation. AEWs are linked to more than 40% of the total Mesoscale Convective Systems (MCSs) in the region and these MCSs contribute approximately 80% of the total annual rainfall over the Sahel. Moreover, around 60% of all Atlantic hurricanes, including 80% of major hurricanes, have their genesis associated with AEWs. The simulation of AEWs poses challenges for General Circulation Models (GCMs), for instance, coarse-resolution models in CMIP5 cannot simulate distinct northern and southern AEW tracks. Additionally, accurately simulating rainfall over West Africa proves to be a challenge for these models due to the involvement of multiscale processes and the influence of complex topography and coastlines. 

The present study investigates the impact of ocean layer thickness on the simulation of African easterly waves (AEWs) using a high-resolution coupled General Circulation Model (GCM). The study employs high-resolution global simulations conducted using the climate model ICON as part of the next Generation Earth System Modeling Systems (nextGEMS) project. Two experiments, each spanning 30 years with a horizontal resolution of 10 km, are conducted. These experiments vary in terms of the thickness of the layers in the upper 20m of the ocean. In one experiment, the upper 20m ocean layers have a thickness of 2m, whereas in the other, it is 10m. The representation of two types of AEWs with periods of 3-5 days and 6-9 days are analyzed in the simulations. There is a notable disparity in the representation of African easterly waves (AEWs) between these two experiments. The simulation with thicker ocean layers exhibits less intense wave activity over the Sahel and equatorial Atlantic for 3-5 day AEWs which is evident in the eddy kinetic energy field. This corresponds to diminished convection and negative precipitation anomalies for 3-5 day AEWs compared to the 2m upper ocean layer thickness simulation. In the case of 6-9 day AEWs, the simulation with thicker ocean layers exhibits intensification of wave activity over northern West Africa.

How to cite: Raj, J., Mohino Harris, E., Rodriguez de Fonseca, M. B., and Losada Doval, T.: Impact Of Ocean Layer Thickness on The Simulation Of African Easterly Waves in High-Resolution Coupled General Circulation Model Simulations, EGU General Assembly 2024, Vienna, Austria, 14–19 Apr 2024, EGU24-20067, https://doi.org/10.5194/egusphere-egu24-20067, 2024.

EGU24-20356 | ECS | Posters on site | HS2.1.5

Seasonal Water Turbidity Dynamics in Arid Central Asia: A Case Study of Lake Balkhash, Kazakhstan, Under Changing Environmental Conditions 

Kanchan Mishra, Kathryn E. Fitzsimmons, and Bharat Choudhary

Lake Balkhash, one of the largest inland lakes in Central Asia, plays a pivotal role in providing water and ecosystem services to approximately 3 million people. However, like many water bodies in dryland regions worldwide, Lake Balkhash's hydrology has been significantly affected by climate change and land cover and land-use shifts driven by population growth and water-intensive economic activities. To manage these vital water resources effectively, monitoring the health of water bodies is essential for effective water resource management, security, and environmental conservation. Turbidity, a water quality indicator, measures the water clarity and represents a broader environmental change, allowing us to assess the water body's health and the extent of anthropogenic impact on the entire catchment. It is a measure of water clarity and serves as a crucial indicator of water health, as it represents the primary mechanism for transporting pollutants, algae, and suspended particles.

The present study investigates the temporal and spatial variability of turbidity in Lake Balkhash. We utilize the normalized difference turbidity index (NDTI) with Landsat satellite data spanning from 1991 to 2022 to map turbidity. We consider various climatic and anthropogenic factors, including precipitation, temperature, wind speed and direction, and water levels in and around the lake.

Our findings reveal an overall declining turbidity trend over interannual and seasonal timescales. The results provide a significant negative correlation between turbidity, temperature, and water levels at both temporal scales. However, no straightforward relationship emerges between turbidity and precipitation or wind variables. Specifically, during spring and summer, turbidity exhibits a strong association with temperature and water levels, while in the fall season, water levels are more closely correlated with turbidity. These results underscore the substantial impact of rising temperatures and fluctuations in water levels on the turbidity dynamics of Lake Balkhash. These findings highlight that the warming climate and alterations in lake hydrology pose significant risks to water quality, indicating that monitoring water health alone may not suffice to mitigate the impacts of climate change and human activities.  

How to cite: Mishra, K., Fitzsimmons, K. E., and Choudhary, B.: Seasonal Water Turbidity Dynamics in Arid Central Asia: A Case Study of Lake Balkhash, Kazakhstan, Under Changing Environmental Conditions, EGU General Assembly 2024, Vienna, Austria, 14–19 Apr 2024, EGU24-20356, https://doi.org/10.5194/egusphere-egu24-20356, 2024.

EGU24-20398 | Posters on site | HS2.1.5

Analysis of operational droughts in an alpine Mediterranean basin using a conjunctive use model of surface and groundwater resources 

Juan-de-Dios Gómez-Gómez, Antonio Collados-Lara, David Pulido-Velázquez, Leticia Baena-Ruiz, Jose-David Hidalgo-Hidalgo, Víctor Cruz-Gallegos, Patricia Jimeno-Sáez, Javier Senent-Aparicio, Fernando Delgado-Ramos, and Francisco Rueda-Valdivia

Extreme events, and particularly, droughts are a main concern in Mediterranean basins that will be increased in the future due to climate change (CC), according to the forecasting for the region made by researchers. A novel integrated approach is proposed to analyze operational droughts and their propagation in future CC scenarios at a basin scale. This approach has been applied to the Alto Genil basin (Granada, Spain), an alpine Mediterranean basin with the singularity of having an important snow component in its precipitation regime. The Standardized Precipitation Index (SPI) methodology has been applied to the variable Demand Satisfaction Index (DSI) at a monthly scale to evaluate operational droughts. A conjunctive use model of surface and groundwater resources developed with the code Aquatool has been used to obtain historical and future DSI monthly series. It is an integrated management model that includes all water demands, water resources (surface, groundwater, and their interaction), regulation and distribution infrastructures in the Alto Genil system. The Vega de Granada aquifer is a key element of the water supply system such for agricultural needs as for guarantee the urban supply to the city of Granada. Groundwater flow in this important aquifer has been simulated with a distributed approach defined by an eigenvalue model to integrate it in the management model, and in order to obtain a more detailed analysis of its future evolution. The proposed methodology consists of the sequential application of the following steps: (1) generation of future scenarios for the period 2071-2100 to obtain series of precipitation (P) and temperature (T); (2) application of a chain of models: a rainfall-runoff model (Témez) coupled with a snowmelt model to obtain runoff (Q) series in subbasins of Alto Genil basin, a crop water requirement model (Cropwat) to get agricultural demand series, and an integrated management model (Aquatool) to get historical and future series of DSI; and (3) analysis of operational droughts comparing historical and future series of the Standardized Demand Satisfaction Index (SDSI), which is the application of the SPI methodology to the variable DSI. A cluster analysis of variables P and Q has been made in order to define homogeneous hydroclimatic areas by aggregation of subbasins. It will allow us to perform an analyses of the heterogeneity in  the propagation of droughts.

Aknowledments: This research has been partially supported by the projects: STAGES-IPCC (TED2021-130744B-C21), SIGLO-PRO (PID2021-128021OB-I00), from the Spanish Ministry of Science, Innovation and Universities, RISRYEARTH (Recovery funds), and “Programa Investigo” (NextGenerationEU).

How to cite: Gómez-Gómez, J.-D., Collados-Lara, A., Pulido-Velázquez, D., Baena-Ruiz, L., Hidalgo-Hidalgo, J.-D., Cruz-Gallegos, V., Jimeno-Sáez, P., Senent-Aparicio, J., Delgado-Ramos, F., and Rueda-Valdivia, F.: Analysis of operational droughts in an alpine Mediterranean basin using a conjunctive use model of surface and groundwater resources, EGU General Assembly 2024, Vienna, Austria, 14–19 Apr 2024, EGU24-20398, https://doi.org/10.5194/egusphere-egu24-20398, 2024.

EGU24-20616 | Orals | HS2.1.5

Integrating Multi-Sensor and Multi-Platform Technologies for Enhanced Assessment of Spectral Indices and Phenological Dynamics in a Seasonal Tropical Dry Forest 

Magna Moura, Rodolfo Nobrega, Anne Verhoef, Josicleda Galvíncio, Rodrigo Miranda, Bruna Alberton, Desiree Marques, Cloves Santos, Bruno Nascimento, Maria Maraiza Pereira, and Patricia Morellato

The Seasonal Tropical Dry Forest (STDF) known as Caatinga occupies approx. 10% of the Brazilian territory. Its vegetation exhibits rapid phenological responses to rainfall resulting in corresponding increases in gross primary productivity and biomass production. Determining the timing of the start and end of the growing season is very important to ecosystem studies and to precisely quantify the carbon balance. Satellite-derived vegetation indices have been widely used to capture the vegetation dynamics in response to fluctuating environmental conditions. However, the spatial and temporal resolution of these indices cannot capture fine vegetation features and phenology metrics in a highly biodiverse and heterogeneous environment such as the Caatinga. On the other hand, phenocameras have been successfully used for this particular purpose for tropical and dry ecosystems. Complementarily, proximal spectral response sensors (SRS) have been used to allow computation of vegetation indices as phenology proxies. Due to their ability to capture high spatial resolution imagery, Unmanned Aerial Systems (UAS) or drones, can deliver an excellent spatial and a very good temporal resolution for diverse detailed vegetation studies. In this context, the objective of this study was to verify whether multi-sensor and multi-platform technologies provide an enhanced assessment of spectral indices and phenological dynamics of the Caatinga. The field campaign occurred in a pristine area of caatinga vegetation, located at the Legal Reserve of Caatinga, Embrapa Semi-Arid, Petrolina, Brazil. Indices for detecting phenology dynamics were obtained using multi-spectral cameras installed on unmanned aerial vehicles (UAV), field spectral response sensors (SRS), phenocameras (digital RGB cameras) and MODIS satellite data (visible and near infrared) from 2020 to 2023. Environmental driving data were measured via instrumentation installed on a flux tower. Standard statistical measures, including correlation coefficients were employed to verify the relationship observed on Normalized Difference Vegetation Index (NDVI), Photochemical Reflectance Index (PRI), and Green Chromatic Coordinate (Gcc) determined by different sensors and platforms. We observed a substantial and fast increase in Gcc, NDVI and PRI immediately after rainfall events. The sensitivity of NDVI and PRI to changes in vegetation can vary depending on factors such as vegetation greenness, overall plant health, and stress responses according to the environmental conditions of the study area. Particularly during the dry season, indices derived from higher spatial resolution sensors consistently showed lower NDVI values compared to those obtained from proximal spectral response sensors (SRS) and drones. Our observations indicate that the representation of vegetation captured by satellites and drones aligns well with the data obtained from phenocamera and proximal SRS platforms. The combination of high temporal resolution provided by SRS and phenocameras resulted in improved and more reliable indices that will be indispensable for evaluating the response of Caatinga vegetation to current and future conditions.

Funding: This study was supported by the São Paulo Research Foundation-FAPESP (grants ##2015/50488-5, #2019/11835-2; #2021/10639-5; #2022/07735-5), the Coordination for the Improvement of Higher Education Personnel - CAPES (Finance Code 001), the National Council for Scientific and Technological Development - CNPq (306563/2022-3).

How to cite: Moura, M., Nobrega, R., Verhoef, A., Galvíncio, J., Miranda, R., Alberton, B., Marques, D., Santos, C., Nascimento, B., Pereira, M. M., and Morellato, P.: Integrating Multi-Sensor and Multi-Platform Technologies for Enhanced Assessment of Spectral Indices and Phenological Dynamics in a Seasonal Tropical Dry Forest, EGU General Assembly 2024, Vienna, Austria, 14–19 Apr 2024, EGU24-20616, https://doi.org/10.5194/egusphere-egu24-20616, 2024.

EGU24-20999 | ECS | Orals | HS2.1.5

Soil and rock water dynamics in a semiarid karst savanna undergoing woody plant encroachment

Pedro Leite, Bradford Wilcox, Daniella Rempe, and Logan Schmidt

EGU24-82 | ECS | Orals | HS7.5

Proposal for a new meteotsunami intensity index. 

Clare Lewis

Atmospherically generated coastal waves labelled as meteotsunami are known to cause destruction, injury and fatality due to their rapid onset and unexpected nature. These progressive shallow water waves with a period of 2 to 120 minutes tend to be initiated by sudden pressure changes (±1 mb over a few tens of minutes) and wind stress from moving atmospheric systems out on the open water. As these waves arrive at the shoreline they are amplified by localised resonances. Unlike other related coastal hazards such as tsunami, there exists no standardised means of quantifying this phenomenon which is crucial for understanding its impacts and to establish a shared language and framework for meteotsunami analysis and comparison.

In this study, we present a new 5-level Lewis Meteotsunami Intensity Index (LMTI) primarily trialled in the United Kingdom (UK) but designed for global applicability. A comprehensive dataset of meteotsunami events recorded in the UK were verified and applied to the index which yielded results that identified a predominant occurrence of Level 2 or moderate intensity meteotsunamis (69%), with distinct hotspots identified in Southwest England and Scotland. Further trial implementation and calibration of the LMTI in a global capacity revealed its adaptability to other meteotsunami prone regions facilitating the potential for further research into preparedness and hazard mitigation strategies.

How to cite: Lewis, C.: Proposal for a new meteotsunami intensity index., EGU General Assembly 2024, Vienna, Austria, 14–19 Apr 2024, EGU24-82, https://doi.org/10.5194/egusphere-egu24-82, 2024.

EGU24-611 | ECS | Posters virtual | HS7.5

Hydrological Analysis of Monsoon Rain Spells in the Indian Ganga Basin over the Last Century 

Amit Kumar Maurya, Somil Swarnkar, and Shivendra Prakash

The Indian Ganga Basin (IGB) is a highly prominent socioeconomic region in the Indian subcontinent. The IGB supports about 500 million individuals by providing sufficient freshwater for agro-industrial activities, mainly through the contribution of Indian Summer Monsoon (ISM) rainfall, which accounts for around 85% of the total rainfall received throughout the IGB. Any modifications in ISM patterns would substantially impact the availability of freshwater, and consequently, the socio-economic activities of the IGB region will be affected. This study aims to evaluate the historical changes in the monsoon rainfall characteristics from 1901 to 2019. Here, we conducted a detailed rainfall analysis in different sub-basins of the IGB where changes in monsoon rain spells are most noticeable and examined the hydrological extremes. We found that monsoon rain spell peaks have significantly increased across the major sub-basins of the IGB after 1960, implying the increased probability of flash flood hazards. At the same time, the monsoon rain spell has been depleted across the IGB after 1960, especially in the lower Indo-Gangetic plains. These results imply a rise in the occurrence of droughts. In addition, our interpretations also indicate a growing potential for combined hydrological extremes in the IGB. Further, the continuous rise in temperature and human-induced perturbations might exacerbate the existing extreme hydrological conditions. Thus, the findings of this study will be beneficial in implementing river basin management methods to assess the complex patterns of major hydrological catastrophes in the IGB.

How to cite: Maurya, A. K., Swarnkar, S., and Prakash, S.: Hydrological Analysis of Monsoon Rain Spells in the Indian Ganga Basin over the Last Century, EGU General Assembly 2024, Vienna, Austria, 14–19 Apr 2024, EGU24-611, https://doi.org/10.5194/egusphere-egu24-611, 2024.

EGU24-669 | ECS | Orals | HS7.5

Assessing Local Community Vulnerability to Landslides and Floods: A Household Survey Approach in North-Western Rwanda  

Clemence Idukunda, Caroline Michellier, Emmanuel Twarabamenye, Florence De Longueville, and Sabine Henry

North-Western Rwanda's hilly and mountainous topography, high elevation, frequent torrential rainfall, and high population density render it highly susceptible to landslides and floods. A comprehensive understanding of community vulnerability to these hazards is crucial for effective risk assessment and mitigation strategies. To address data scarcity in the region, this study is based on a household survey approach that incorporates hazard-specific variables to compare vulnerability across three hazard categories: landslides, floods, and a combination of both. The survey encompasses 904 households across 50 cells (local administrative units), purposively selected according to hazard susceptibility distribution. Principal Component Analysis (PCA) was applied to derive a contextualized Social Vulnerability Index (SoVI). Five principal components accounting for 73.2% of the variance were identified. The first component, contributing 23.4%, highlights the vulnerability associated with unplanned settlements and low income. The second component, representing 19.5% of the variance, emphasizes demographic and social factors. The third component (12.6% of the variance) points to the vulnerability of households solely reliant on agriculture for their income. The fourth component (9% variance) is associated with land ownership, with households lacking land assets experiencing lower vulnerability. The fifth component (8.7% variance) underlines the relevance of household structure variables, indicating the high vulnerability of single-person households. SoVI scores classified 19 cells in the very high or high vulnerability category, predominantly those prone to landslides. These highly vulnerable cells are concentrated in the Northern Province, emphasizing the need to prioritize interventions in this region, such as effective land use planning and livelihood improvement strategies. This study provides a comprehensive vulnerability assessment and valuable insights for prioritizing interventions. The inclusion of hazard-specific variables and a comparative vulnerability approach across areas susceptible to landslides, floods, and both hazard types enhances the specificity and applicability of the findings. These insights are invaluable for local policymakers and disaster prevention and management authorities, enabling them to develop context-specific strategies to improve community resilience and reduce vulnerability to natural hazards.

Keywords: Community Vulnerability, Landslides, Floods, Noth-Western Rwanda, Social Vulnerability Index

How to cite: Idukunda, C., Michellier, C., Twarabamenye, E., De Longueville, F., and Henry, S.: Assessing Local Community Vulnerability to Landslides and Floods: A Household Survey Approach in North-Western Rwanda , EGU General Assembly 2024, Vienna, Austria, 14–19 Apr 2024, EGU24-669, https://doi.org/10.5194/egusphere-egu24-669, 2024.

EGU24-677 | ECS | Orals | HS7.5 | Highlight

A new climate impact database using generative AI 

Ni Li, Wim Thiery, Jakob Zscheischler, Gabriele Messori, Liane Guillou, Joakim Nivre, Olof Görnerup, Seppe Lampe, Clare Flynn, Mariana Madruga de Brito, and Aglae Jezequel

Storms, heat waves, wildfires, floods, and other extreme weather climate-related disasters pose a significant threat to society and ecosystems, which in many cases is being aggravated by climate change. Understanding and quantifying the impacts of extreme weather climate events is thus a crucial scientific and societal challenge. Disaster databases are extremely useful for establishing the link between climate events and socio-economic impacts. However, publicly available data on impacts is generally scarce. Apart from existing open disaster databases such as EM-DAT, robust data on the impacts of climate extremes can also be found in textual documents, such as newspapers, reports and Wikipedia articles. Here we present a new climate impact database that has been built based on multiple public textual entries using a pipeline of data cleaning, key information extraction and validation. In particular, we constructed the database by using the state-of-the-art generative artificial intelligence language models GPT4, Llama2 and other advanced natural language processing techniques. We note that our dataset contains more records in the early time period of 1900-1960 and in specific areas such as than the benchmark database EM-DAT. Our research highlights the opportunities of natural language processing to collect data on climate impacts, which can complement existing open impact datasets to provide a more robust information on the impacts of weather and climate events.

How to cite: Li, N., Thiery, W., Zscheischler, J., Messori, G., Guillou, L., Nivre, J., Görnerup, O., Lampe, S., Flynn, C., Madruga de Brito, M., and Jezequel, A.: A new climate impact database using generative AI, EGU General Assembly 2024, Vienna, Austria, 14–19 Apr 2024, EGU24-677, https://doi.org/10.5194/egusphere-egu24-677, 2024.

Climate change, an increasing urban population, and poor urban planning have increased flood-risk and the accompanying solid waste challenge in many coastal urban areas in developing countries. These challenges are more pronounced in informal settlements because: (a) they are often built on environmentally fragile locations such as river banks and coastal shores with high exposure to floods, (b) high poverty levels among residents resulting in low adaptive capacity, and (c) marginalisation of these localities emanating from their non-recognition in the larger city framework. Against this background, flood-risk assessments and response initiatives in these areas have primarily been informed by scientific approaches such as geographical information systems, without adequate incorporation of other forms of knowledge. Using the case of the coastal city of Durban, South Africa, our project explores the benefits of combining perspectives from different knowledge systems in understanding flood-risk and the accompanying solid waste challenge in urban informal settlements, towards developing solutions that are based on contextual and experiential aspects. Methodological techniques used include interviews and workshops with key experts and with informal settlement residents, and extensive reviews of literature.  Emerging findings show that holders of scientific, practitioner, and local knowledge vis-à-vis flood risk and waste management are active in the selected case study informal settlement. They have, in isolated cases, collaborated particularly around a) generation and distribution of flood early warnings, b) river clean-up initiatives, and c) catchment rehabilitation projects, with clear benefits for flood resilience and solid waste management. We find that there is need for a clear framework for integrating knowledge systems towards flood resilience and solid waste management in these contexts and the project has developed a draft framework. Integrating knowledge systems will: i) ensure the participation of different actors in mapping flood risk thereby creating a sense of ownership and ensuring uptake of and support for solutions crafted to deal with flood risk and the solid waste challenge; and ii) open up opportunities for coordinated support from various actors for a range of decisions around flood risk response preparation, flood and waste infrastructural design and mitigation of waste-induced flood destruction of infrastructure.

How to cite: Johnson, K. and Nyamwanza, A.: Integrated knowledge systems towards flood resilience and sustainable solid waste management in South African urban informal settlements, EGU General Assembly 2024, Vienna, Austria, 14–19 Apr 2024, EGU24-867, https://doi.org/10.5194/egusphere-egu24-867, 2024.

EGU24-2163 | ECS | Posters on site | HS7.5

Climate risk-reduction potential of gridded precipitation data for agricultural index-based insurance development 

Sarvarbek Eltazarov, Ihtiyor Bobojonov, and Lena Kuhn

Index insurance has been introduced as an innovative and potential solution to mitigate several challenges caused by climate change in the agricultural sector. Despite the promising potential of index insurance, dissemination in developing countries is slow due to a lack of reliable weather data, which is essential for the design and operation of index insurance products. The increasing availability of model- and satellite-based data could ease the constraints of data access. However, their accuracy and suitability have to undergo a thorough assessment. Therefore, this study statistically and financially analyzes and compares the risk reduction potential of index insurance products designed employing various in-situ-, model- and satellite-based precipitation products (e.g., CMOPH, CPC, IMERG, GSMaP, MERRA, GLDAS, ERA5, PERSIANN, MSWEP, and MERRA2). This study employed county-level spring wheat yield data between 1982 and 2018 from 56 counties overall in Kazakhstan and Mongolia. The results showed that in the majority of cases in both countries, the hedging effectiveness of index insurance products designed based on IMERG is the highest. Moreover, among other data sources, the index insurance products designed using the PERSIANN, GLDAS and FLDAS showed higher risk reduction potential. Overall, this study highlights that satellite- and model-based precipitation products have higher accuracy and potential for index insurance design and operation than in-situ-based precipitation data.

How to cite: Eltazarov, S., Bobojonov, I., and Kuhn, L.: Climate risk-reduction potential of gridded precipitation data for agricultural index-based insurance development, EGU General Assembly 2024, Vienna, Austria, 14–19 Apr 2024, EGU24-2163, https://doi.org/10.5194/egusphere-egu24-2163, 2024.

A severe and complex, polygenetic flood event occurred in Muktinath area of Mustang, Nepal on the evening of August 13, 2023 causing significant damage to property and infra-structures worth approximately of USD 7.4 million at Kagbeni Village, which is nestled along both banks of Kagkhola, a major left bank tributary of the Kali Gandaki River. About 29 houses, 1 motorable bridge, 1 steel truss bridge and 3 temporary bridges were destroyed, while more than 25 cows and other livestock were killed. Fortunately, human lives were spared because the community was warned to move to safety before the mud and sludge hit the village. A study was conducted in order to know what had caused this unusual flash-flood in Mustang. Kagbeni (2810 m) lies in the north Himalayan, rain-shadow area and normally receives few rainfall (<300 mm/yr). However, for several years, the trend (confirmed by local residents) has been towards increased rainfall, leading to more landslides and floods. Although rainfall data from the nearest monitoring station, Jomsom (2720 m), shows that rainfall was high, there is not detailed information about the rainfall amount at Jhong (3600 m), and Muktinath  (3760 m), source area of Kagbeni flood. From the video taken there (Jhong, Muktinath) during this flash-flood event (hyper-concentrated flow), it can be concluded that it was a landslide lake outburst flood. However due to the difficult terrain and inaccessible path, it has not yet been possible to visit the source area of the landslide in detail. Heavy rainfall over a short period and flash-flood-like disasters are becoming a trend in the mountain regions in Nepal. Furthermore, this part of Mustang is fragile (Spiti shales), and heavy rainfalls have an immediate impact, since there is little soil to absorb the excess water. Former studies have also shown that temperature in Mustang is rising which is causing the monsoon air to move northward and upward. As a result, more rainfall is taking place in Trans-Himalayan areas like Mustang and Manang (North of Annapurna Himal, 8091 m). Therefore, it is believed that climate change and the rise in temperature could be the significant reasons for heavy rainfall that caused such a flash-flood in Kagbeni, Mustang. On the other hand, people are inviting disaster in Kagbeni by settling on the very low terraces or in flood-plains and encroaching on the bed of the local Kagkhola. Given the fragile geology of upstream area of Kagkhola, ongoing anthropogenic activities (agriculture and tourism) and the effect of climate change, the possibility of flash floods reoccurring in the future at Kagbeni remains high. Sadly, locals at Kagbeni have already started rebuilding houses damaged by the recent Kagbeni flood and continue to live in potentially threatened flood plains.   

How to cite: Fort, M., Gurung, N., Arnaud-Fassetta, G., and Bell, R.: Retrospect of the polygenetic Kagbeni flood event (August 13, 2023) in Mustang, Nepal. Are rapid hydromorphological processes relays and sediment cascades in the catchment well taken into account in the risk equation?, EGU General Assembly 2024, Vienna, Austria, 14–19 Apr 2024, EGU24-2563, https://doi.org/10.5194/egusphere-egu24-2563, 2024.

EGU24-3076 | ECS | Orals | HS7.5

Assessing Surface Drainage Efficiency in Urban Pluvial Flood Hazard and Risk Mitigation: A Case Study of Braunschweig City 

Shahin Khosh Bin Ghomash, Heiko Apel, Kai Schroeter, and Max Steinhausen

Due to rapid urbanization and the increase of extreme precipitation events driven by climate change, urban areas have experienced more frequent and severe pluvial floods in recent years. This trend is anticipated to continue in the future. One of the causes of flooding in these urban zones is the limited effectiveness or temporary reduction in surface drainage capacity, even when storm sewers adhere to technical standards. A notable instance was the June 2023 flooding in Braunschweig, situated in Lower Saxony, Germany, where the city received 60 liters per square meter of rainfall within a short time span, largely excessing sewer system capacity and leading to widespread inundation.

This research investigates the impact of implementing diverse strategies aimed at expanding urban drainage capacity to mitigate pluvial flood risk in Braunschweig. To accomplish this, a moderately detailed hydrodynamic model for the city was set up using the RIM2D hydrodynamic model, allowing for quick computational processing times which enabled the exploration of various measures through sensitivity analysis. The setup involved employing a high-resolution digital elevation model and various remote sensing data for land classification. The model incorporated high-resolution precipitation radar data from the 2023 event and additional precipitation scenarios of varying occurrence probabilities. Validation of the model against available event data and existing flood hazard maps specific to Braunschweig was conducted.

The validated model was then utilized to assess the effectiveness of different surface de-sealing scenarios within the city. These scenarios aim to enhance drainage capacity by means of increased infiltration to complement the existing sewer drainage system. The evaluation of these de-sealing scenarios focused on reducing surface inundation and anticipated damage, serving as a foundational aspect for conducting a cost-benefit analysis and detailed planning. This analysis can contribute to future-oriented urban pluvial flood risk management plans for the city.

How to cite: Khosh Bin Ghomash, S., Apel, H., Schroeter, K., and Steinhausen, M.: Assessing Surface Drainage Efficiency in Urban Pluvial Flood Hazard and Risk Mitigation: A Case Study of Braunschweig City, EGU General Assembly 2024, Vienna, Austria, 14–19 Apr 2024, EGU24-3076, https://doi.org/10.5194/egusphere-egu24-3076, 2024.

EGU24-3170 | ECS | Orals | HS7.5

Influences of moisture transport on changes in extreme precipitation in Central Plains Urban Agglomeration, China  

Yufan Chen, Shuyu Zhang, Deliang Chen, and Junguo Liu

In recent decades, the Central Plains Urban Agglomeration of China (CPUA) has faced recurring extreme precipitation events (EPEs), causing severe flood disasters, endangering residents, and inducing significant property losses. This study examines the spatiotemporal patterns of summer EPEs in the CPUA from 1961 to 2022. The Hybrid Single-Particle Lagrangian Integrated Trajectory model was used to trace the water vapor trajectories associated with these events and the atmospheric circulations linked to diverse moisture transports were identified. The findings reveal an overall increase in both the intensity and frequency of summer EPEs, particularly intensifying over urban areas while displaying more frequent yet weaker precipitation in mountainous regions. Moisture contributing to these events originates from sources including Eurasia, the northern and southern Western North Pacific, as well as the Bay of Bengal and South China Sea. Notably, contributions from Eurasia and the Northern Western North Pacific have increased, whereas those from the Bay of Bengal and the South China Sea have decreased. Events fueled by Western North Pacific moisture show intensified impacts on urban areas, driven by anomalous anticyclonic patterns and the formation of the Huang-Huai cyclone, inducing vigorous convective activity over the CPUA. The proliferation of the Western North Pacific Subtropical High facilitates warm air transport, converging with colder air from inland areas, resulting in extreme precipitation.

How to cite: Chen, Y., Zhang, S., Chen, D., and Liu, J.: Influences of moisture transport on changes in extreme precipitation in Central Plains Urban Agglomeration, China , EGU General Assembly 2024, Vienna, Austria, 14–19 Apr 2024, EGU24-3170, https://doi.org/10.5194/egusphere-egu24-3170, 2024.

EGU24-3602 | ECS | Posters on site | HS7.5

FLOODGAMA: the new INUNGAMA. Beyond a flood events database for Catalonia 

Montserrat Llasat-Botija, Maria Carmen Llasat, Dimitri Marinelli, Raül Marcos, Carlo Guzzon, and Albert Díaz

Floods represent a complex natural hazard, influenced not only by meteorological factors but also by geophysical aspects such as terrain topography, social factors such as the value of exposed assets, and cultural factors like risk awareness. For this reason, the study of these phenomena requires a holistic approach. This requires the correct organization of the information. In addition, given that the information comes from different sources, the traceability of the data must also be contrasted and preserved in order to guarantee its quality and robustness. Databases make it possible to conserve and document historical information, to analyze it and to support smart flood risk management.

With this objective in mind, in 2000 the GAMA team developed the INUNGAMA flood database, following the example of other natural hazards databases. This communication will present the new version of this database, FLOODGAMA, and the main results of its analysis. FLOODGAMA contains information on 456 flood events that affected Catalonia (NE of Spain), between 1900 and 2020, which have caused 1,253 casualties. The events are classified according to the impacts. It includes linked tables with information on event dates, descriptions, fatalities, economic damages, affected municipalities, recorded rainfall and recorded flow. Other tables contain historical marks, codifications and the geographical information of municipalities, counties, basins and rivers, as well as meteorological stations. Its structure has been simplified and standardized with Python and migrated to PostgreSQL (PostGIS) from an ACCESS format. The new database allows for more general and straightforward analysis, introduces GIS tool compatibility, and simplifies the addition of new data and new data sources. This last point has been one of the key points in this transformation as it will provide the database with the flexibility to respond to the challenges posed by the digital transformation that is currently taking place and as a tool for the improvement of adaptation.

The contribution shows the structure of this flood database and the results obtained after its analysis that allows the characterization of flood events in Catalonia.

This research has been done in the framework of the C3Riskmed project, Grant PID2020-113638RB-C22 funded by MCIN/AEI/10.13039/501100011033 and Flood2Now project, Grant PLEC2022-009403 funded by MCIN/AEI/10.13039/501100011033 and by the European Union Next Generation EU/PRTR.

How to cite: Llasat-Botija, M., Llasat, M. C., Marinelli, D., Marcos, R., Guzzon, C., and Díaz, A.: FLOODGAMA: the new INUNGAMA. Beyond a flood events database for Catalonia, EGU General Assembly 2024, Vienna, Austria, 14–19 Apr 2024, EGU24-3602, https://doi.org/10.5194/egusphere-egu24-3602, 2024.

EGU24-3951 | ECS | Orals | HS7.5

Multi-day precipitation extremes ranking and their association with atmospheric moisture fluxes over India 

Tomás Gaspar, Ricardo M. Trigo, Alexandre M. Ramos, Akash Singh Raghuvanshi, Ana Russo, Pedro M.M. Soares, Tiago Ferreira, and Ankit Agarwal

The Indian subcontinent is characterized by a pronounced summer monsoon season with substantial rainfall from June to September and a less intense autumn monsoon, albeit both posing major challenges to the densely populated regions through flash floods and landslides. During monsoons, different regions of India are affected by extreme precipitation events with distinct durations and triggered by several mechanisms. Here, considering 10 different regions of India characterized by different climatic regimes, we apply an objective ranking of extreme precipitation events, across various time scales, ranging from 1 to 10 days, making use of a high-resolution daily precipitation dataset covering the entire Indian territory from 1951 to 2022. The results confirm that the method accurately detects and ranks the most extreme precipitation events in each region, providing information on the daily evolution of the magnitude (and spatial extent affected) of high precipitation values in each region. Moreover, results show that top rank events can be associated with different types of storms affecting the four main coastal regions of India. In particular, some top rank events can be critically linked to long duration events (e.g., 10 days), which can be missed in ranks for shorter duration (e.g., 1-3 days) periods, thus stressing the need to employ multi-day precipitation extremes ranking. Finally, an in-depth analysis of the large-scale atmospheric circulation and moisture transport is presented for the top 10-day events affecting four coastal regions of India. Overall, we are confident that our findings are valuable in advancing disaster risk reduction strategies, optimizing water resource management practices, and formulating climate change adaptation strategies specifically tailored for the Indian subcontinent.


R.M.T., A.R., S.P. and A.T.M. thank Fundação para a Ciência e a Tecnologia (FCT) I.P./MCTES through national funds (PIDDAC) – UIDB/50019/2020 (https://doi.org/10.54499/UIDP/50019/2020) and LA/P/0068/2020 (https://doi.org/10.54499/LA/P/0068/2020). A.R. and R.M.T. thank also FCT (https://doi.org/10.54499/2022.09185.PTDC, http://doi.org/10.54499/JPIOCEANS/0001/2019, https://doi.org/10.54499/DRI/India/0098/2020). A.R. was supported by FCT through https://doi.org/10.54499/2022.01167.CEECIND/CP1722/CT0006.


How to cite: Gaspar, T., M. Trigo, R., M. Ramos, A., Singh Raghuvanshi, A., Russo, A., M.M. Soares, P., Ferreira, T., and Agarwal, A.: Multi-day precipitation extremes ranking and their association with atmospheric moisture fluxes over India, EGU General Assembly 2024, Vienna, Austria, 14–19 Apr 2024, EGU24-3951, https://doi.org/10.5194/egusphere-egu24-3951, 2024.

EGU24-5587 | ECS | Orals | HS7.5

Socio-Economic Vulnerability assessment and validation in Seoul, South Korea  

Chi Vuong Tai, Dongkyun Kim, Soohyun Kim, Yongchan Kim, Hyojeong Choi, and Jeonghun Lee

Vulnerability is regarded as a crucial element in disaster risk reduction, garnering increasing attention from researchers. However, these assessments typically conclude with the spatial representation and analysis of vulnerability index values, with very few attempts made on vulnerability validation. This study has employed Principal Component Analysis (PCA) algorithm for the entire 38 selected socio-economic features, resulting in 9 principal components (or factors) to estimate Socio-Economic Vulnerability Index (SEVI). The results reveal consistent vulnerability levels in over half of the dongs (administrative units), compared with SEVI estimated from a subjective weighting scheme based on expert experience. Meanwhile, the remaining dongs exhibit a change in only one level of vulnerability. SEVI values and ranks from PCA were subsequently internally validated through global uncertainty and sensitivity analyses using Monte Carlo method. The vulnerability scores of all input features were randomly generated based on their fitted probability distribution functions, serving as input parameters for 39,936 Monte Carlo simulations. The median statistic was employed to evaluate the vulnerability uncertainty based on both bias of estimated SEVI values and ranks in comparison with simulated data. The findings from this analysis revealed that medium-low and medium vulnerability levels tend to be underestimated, while medium-high and high levels primarily witness an overestimation tendency. The bias in SEVI ranks was further employed to assess the vulnerability uncertainty. In the sensitivity test, a tornado diagram was created to illustrate the explanation of each feature to the overall SEVI variability. The results indicate that the feature with highest explanation of SEVI variability is the number of families with only children and a mother, accounting for more than 5%. The methodology employed in this study is applicable to areas with limited social and economic data sources. Based on our findings, we suggest that the areas with low bias on SEVI values or ranks are reliable for developing disaster risk mitigation strategies, while other areas require further consideration. Additionally, the results from the sensitivity test provide valuable support for future research when selecting input features for socio-economic vulnerability assessment.

Acknowledgement:

This study was supported by: (1) The National Research Foundation of Korea (NRF) grant funded by the Korea government (MSIT) (No. NRF-2022R1A4A3032838) (50 % grant); (2) Korea Environment Industry & Technology Institute (KEITI) through R&D Program for Innovative Flood Protection Technologies against Climate Crisis Project, funded by Korea Ministry of Environment (MOE) (RS-2023-00218873) (50 % grant).

How to cite: Vuong Tai, C., Kim, D., Kim, S., Kim, Y., Choi, H., and Lee, J.: Socio-Economic Vulnerability assessment and validation in Seoul, South Korea , EGU General Assembly 2024, Vienna, Austria, 14–19 Apr 2024, EGU24-5587, https://doi.org/10.5194/egusphere-egu24-5587, 2024.

EGU24-5774 | Orals | HS7.5

myDewetra-VOLTALARM: a transboundary impact-based early warning system increasing resilience of Volta basin communities against hydrometeorological hazards 

Anna Mapelli, Andrea Libertino, Giulia Ercolani, Mirko D'Andrea, Nicola Testa, Matteo Darienzo, Simone Gabellani, Marco Massabò, Rafatou Fofana, Salifou Dene, Boukary Niampa, Maxime Teblekou, and Ramesh Tripathi and the Voltalarm member states national agencies

The Volta Basin, spanning six countries in West Africa, faces significant challenges from both floods and extreme precipitation. To address these challenges, the myDewetra-VOLTALARM system was developed as a collaborative transboundary early warning system (EWS) through the joint efforts of an international Consortium, composed by the Volta Basin Authority (VBA), the Global Water Partnership for West Africa (GWP-WA) and the World Meteorological Organization (WMO), and national institutions of the six riparian countries.  

myDewetra-VOLTALARM embraces an impact-based forecasting approach, focusing on the potential consequences of severe hydrological events on vulnerable communities. This is achieved through state-of-the-art hydro-meteorological modelling chain generating precipitation and discharge forecast with lead times of up to five days, coupled with impact assessment tools that translate these forecasts into actionable warnings based on real-time risk information for sectors like civil protection, agriculture and livelihoods, protected areas. By focusing on potential impacts,  myDewetra-VOLTALARM empowers stakeholders to make risk-informed decisions and implement timely mitigation actions, thereby reducing vulnerabilities and enhancing community resilience. The strength of myDewetra-VOLTALARM hinges on the collaboration, built-up through the implementation process, among the riparian countries, fostering data exchange and enabling a comprehensive understanding of hydrological dynamics across the entire basin. Harmonized risk assessments lead to consistent warning products and mitigation strategies, while the publication of the results on the open-source  myDewetra-VOLTALARM platform ensures transparency and accessibility for all stakeholders. 

A cornerstone of myDewetra-VOLTALARM's impact is the co-produced flood and heavy rainfall impact bulletin, issued jointly by national and regional authorities twice per week. This bulletin provides critical information, enriching and validating the model results with the expertise and local information/measurements of the national institutions, on which the Volta Basin Authority bases its advisories, tailored to specific locations and sectors. The Flood and Heavy Rainfall Impact Bulletin ensures a consistent flow of information at the basin scale and it integrates in the existing national procedures for early warning and civil protection, allowing all the stakeholders to stay informed and adapt their preparedness measures as the hydrometeorological situation evolves. 

myDewetra-VOLTALARM serves as a model for effective early warning systems in shared river basins. Its impact-based forecasting, transboundary cooperation, and co-produced Flood and Heavy Rainfall Impact Bulletin hold the potential to significantly reduce the impacts of floods and extreme precipitation, contributing to a more resilient and sustainable future for the Volta Basin communities.

How to cite: Mapelli, A., Libertino, A., Ercolani, G., D'Andrea, M., Testa, N., Darienzo, M., Gabellani, S., Massabò, M., Fofana, R., Dene, S., Niampa, B., Teblekou, M., and Tripathi, R. and the Voltalarm member states national agencies: myDewetra-VOLTALARM: a transboundary impact-based early warning system increasing resilience of Volta basin communities against hydrometeorological hazards, EGU General Assembly 2024, Vienna, Austria, 14–19 Apr 2024, EGU24-5774, https://doi.org/10.5194/egusphere-egu24-5774, 2024.

EGU24-6088 | ECS | Posters on site | HS7.5

Modelling and Prediction of Unprecedented Heavy Rainfall Event Over North India  

Rohtash Saini and Raju Attada

Widespread and multi-day heavy rainfall events, recorded during 08-09 July 2023 in northwest India, significantly impacted Himachal Pradesh, Punjab, and the Chandigarh region. These events resulted in devastating floods and extensive landslides, causing a substantial loss of lives and properties. Understanding such extreme weather phenomena is imperative for enhancing predictive capabilities and mitigating associated impacts. However, due to the complex topography of the Himalayas and limited observational data, poses challenges for investigating precipitation extremes. Against the background, in this study, we employ the Weather Research and Forecasting (WRF) model to investigate the atmospheric processes that led to unprecedented extreme precipitation. The innermost domain is configured with a horizontal grid spacing of 3 km, successfully reproduces the observed extreme rainfall. To assess the performance of different microphysics schemes in capturing key characteristics associated with heavy rainfall events, sensitivity experiments were conducted with five distinct schemes. Preliminary findings reveal that the Goddard microphysics scheme demonstrates good agreement with observations, closely followed by the Thompson scheme. Statistical analyses, including skill scores, further suggest that the Goddard microphysics scheme skillfully simulates the observed rainfall, displaying robust reflectivity values exceeding 35 dBZ in the core regions. The strong reflectivity indicates substantial hydrometeor concentrations, suggesting potential locations of deep convective activity associated with heavy rainfall. Detailed results of simulating the rainfall extremes over northwest India, along with feasible mechanisms influencing atmospheric conditions during extreme will be comprehensively discussed.

How to cite: Saini, R. and Attada, R.: Modelling and Prediction of Unprecedented Heavy Rainfall Event Over North India , EGU General Assembly 2024, Vienna, Austria, 14–19 Apr 2024, EGU24-6088, https://doi.org/10.5194/egusphere-egu24-6088, 2024.

EGU24-6148 | ECS | Posters on site | HS7.5

Functionality assessment of road network combining flood roadworthiness and graph topology 

Ke He, Maria Pregnolato, Neil Carhart, Jeffrey Neal, and Raffaele De Risi

In the realm of critical infrastructure, the road network plays an indispensable role in facilitating daily activities, communication, and economic interactions. However, it remains susceptible to the persistent challenge of flood hazards, leading to both structural and non-structural damages (e.g., physical collapse and service interruption). In normal flood disasters, physical collapse may not occur, but service interruptions often occur. Such disruptions manifest in the form of increased travel distances, prolong the travel times, and, in severe cases, complete travel impossibility. This has resulted in a reduction in transportation efficiency, leading to an increase in the social cost of transportation.

This study presents a novel approach that integrated flood hazard, transportation network topology, and vehicle vulnerability to evaluate the functionality of road network. A severity factor is defined to assess the accessibility of expected links (roads and bridges), considering different vehicle types such as cars and SUVs. Then, this study analyses the overall road network functionality loss under varying flood return periods by evaluating the severity of each network link based on the different types of vehicles. Identification of links with the lowest functionality allows for the assessment of the entire network’s performance using topology-based measures, including the average node degree, average clustering, average shortest path, and reachable areas (isochrones). This research employs the transportation network of Bristol, UK, as a case study to investigate the dynamic relationship between the network status and vehicle typology in the context of flooding events. Findings reveal a discernible correlation, wherein the resilience of the network in influenced by the specific characteristics of different vehicle types. Notably, SUVs emerge as inherently more resistant to flood-related disruptions compared to conventional cars.

The insights presented in this paper hold significant implications for the development of robust mitigation strategies geared towards bolstering the resilience of road networks and optimizing the rerouting of emergency response vehicles in flood-prone areas. By elucidating the interplay between vehicle characteristics, network functionality, and flood impacts, the research provides a foundation for informed decision-making in the formulation and implementation of effective preparedness measures. The outcomes of this study offer a strategic roadmap for authorities and policymakers, enabling them to proactively address the challenges posed by future flood events and enhance the overall adaptability and responsiveness of road networks in emergency situations.

How to cite: He, K., Pregnolato, M., Carhart, N., Neal, J., and De Risi, R.: Functionality assessment of road network combining flood roadworthiness and graph topology, EGU General Assembly 2024, Vienna, Austria, 14–19 Apr 2024, EGU24-6148, https://doi.org/10.5194/egusphere-egu24-6148, 2024.

EGU24-7026 | ECS | Orals | HS7.5

Characteristics of Disaster-causing Heavy Rainfall in Taipei City and Its Application 

Chi-June Jung, Radiant Rong-Guang Hsiu, Yu-Cheng Kao, Mon-Liang Chiang, Wen-Bin Hung, Jing-Ting Wang, and Ben Jong-Dao Jou

The most challenging weather phenomenon for disaster response in Taipei City is localized short-duration heavy rainfall. The capacity of each administrative district to withstand rainfall intensity varies, leading to incidents of flooding even when the rainfall falls short of the designed protection standard of 78.8 mm/h for drainage systems. To enhance disaster response, the Taipei City Fire Department conducts investigations and reports based on rainfall conditions. By integrating the intelligence and reporting system and raising the dispatching standard from 20 to 40 mm/h, the "Heavy Rainfall Response Process Improvement" project has successfully reduced response operation time and alleviated service burdens, advocating for adopting higher standards.

This study explores the correlation between intense rainfall and disaster occurrences, examining thunderstorm events that caused significant flooding in over three administrative districts. The study compares the earliest reported flooding time in each district with the corresponding rainfall, revealing that several districts experienced flooding with less than 60 mm/h of rainfall at the onset, indicating heightened vulnerability. Additionally, the study delves into the relationship between rainfall patterns and disaster potentials. When it accumulates 40 mm of rainfall within 30 minutes, there is a 63% chance of reaching 60 mm accumulation in the following 10 to 20 minutes. This analysis underscores the potential application of cumulative rainfall within the first 30 minutes for predicting subsequent rainfall trends and issuing disaster warnings.

How to cite: Jung, C.-J., Hsiu, R. R.-G., Kao, Y.-C., Chiang, M.-L., Hung, W.-B., Wang, J.-T., and Jou, B. J.-D.: Characteristics of Disaster-causing Heavy Rainfall in Taipei City and Its Application, EGU General Assembly 2024, Vienna, Austria, 14–19 Apr 2024, EGU24-7026, https://doi.org/10.5194/egusphere-egu24-7026, 2024.

EGU24-7347 | Posters on site | HS7.5

Impacts comparison by using different hydraulic models on the 2011 flood in Thailand 

Morgane Terrier and Mathis Joffrain

The 2011 flood event in Thailand was devastating both in terms of lives and economic losses. Following this event, the (re)insurance industry have deeply transformed its underwriting practices and used new modeling tools, both external and internal.

A loss is linked both to hazard and sites characteristics. As an insurer's exposure changes, losses for the same event can differ greatly from past observations. Therefore, hazard maps representing a past event can be used to estimate losses as of today.

Building an internal flood risk model requires to create a large set of spatial grids of flood depth. The water depth spatialisation, based on the water level of identified rivers, is a crucial part of the modeling and called the hydraulic modeling.

This poster will :

(i) the use of two hydraulic models to obtain a flood footprint: The software Super-Fast Inundation of CoastS (SFINCS) (Leijnse et al., 2021), a 2D open-source fast numerical model, and LISFLOOD-FP (Bates, 2004).

(ii) calculate insured losses on a fictive portfolio in Thailand using these two models with the same inputs.

(iii) describe and explain the discrepancies steming from (ii).

How to cite: Terrier, M. and Joffrain, M.: Impacts comparison by using different hydraulic models on the 2011 flood in Thailand, EGU General Assembly 2024, Vienna, Austria, 14–19 Apr 2024, EGU24-7347, https://doi.org/10.5194/egusphere-egu24-7347, 2024.

EGU24-7770 | Posters on site | HS7.5

Historical database for multi-hazard zonation and damage trend analysis in a Mediterranean study area (southern Italy) 

Olga Petrucci, Massimo Conforti, Giovanni Cosentini, and Graziella Emanuela Scarcella

The occurrence of extreme hydro-meteorological events is globally on the rise, due to the combined effects of climate change and increasing urban development in vulnerable areas. Each year, landslides, floods, urban flooding, storm surges, snow and thunderstorm events cause casualties, huge damage to urban areas, farmland, and communication infrastructures. This work presents the preliminary results of an historical research aiming to identify the series of geo-hydrological events which affected the municipality of Catanzaro (Calabria, South Italy), having an area of 112.7 km2 and a population density of 746.84 ab./km², throughout the latest two Centuries. The purpose is to implement a GIS-platform using the historical series of past events to realize density maps resulting is a zonation of municipal area which depict the vulnerability of municipal sectors per type of damaging phenomena and type of damaged elements, and their trends throughout the decades. We firstly extracted those events contained in the database named ASICal (Italian acronym of historically flooded areas), a catalogue collecting damaging geo-hydrological events occurred in Calabria in the latest centuries and maintained by CNR-IRPI researchers. Then, to improve and enrich our series, we performed an historical research throughout the documents of the State Archive of Catanzaro. As a total, we gathered data about around 270 events which occurred in the study area between 1830 to 2023, highlighting the strong territorial vulnerability of the selected area. Considering the average number of events per year as a proxy of events impact, we can observe as this value increases during the study period, moving from one event per year (in the period 1900 – 1950) to 3 events per year (in the period 1950 – 2023). To be uploaded in the GIS platform and mapped, the 270 events were split in around 1500 records, according to the kind of damaging phenomena (flood, landslide, urban flooding, storm surges, snow, thunderstorm) and the affected place. 44% of cases were widespread events, while the remaining 56% affected single sites. Urban flooding seems the most frequent damaging phenomena (68% of records), followed by landslides (21%), while the other phenomena show lower frequencies. As far as damaged elements, the most frequently affected were public and private buildings (64%) and road and railway network (26%), while people were affected in a few cases (5%). Data elaboration as multi-hazard maps, also crosschecked to either physical or anthropogenic data can be used to identify hazard-prone areas and to support the multi risk management in terms of monitoring, planning of remedial works, and realization/updating of civil protection plans, as far as in the realization of educational campaigns aiming to raise people awareness.

This work was funded by the Next Generation EU—Italian NRRP, Mission 4, Component 2, Investment 1.5, call for the creation and strengthening of ‘Innovation Ecosystems’, building ‘Territorial R&D Leaders’ (Directorial Decree n. 2021/3277)—project Tech4You—Technologies for climate change adaptation and quality of life improvement, n. ECS0000009. This work reflects only the authors' views and opinions, neither the Ministry for University and Research nor the European Commission can be considered responsible for them.

How to cite: Petrucci, O., Conforti, M., Cosentini, G., and Scarcella, G. E.: Historical database for multi-hazard zonation and damage trend analysis in a Mediterranean study area (southern Italy), EGU General Assembly 2024, Vienna, Austria, 14–19 Apr 2024, EGU24-7770, https://doi.org/10.5194/egusphere-egu24-7770, 2024.

EGU24-8205 | ECS | Posters on site | HS7.5

A Multi-Criteria Analysis procedure for the evaluation and classification of flood risk mitigation strategies 

Alice Gallazzi, Daniela Molinari, Francesco Ballio, Marina Credali, Immacolata Tolone, Simona Muratori, and Panagiotis Asaridis

The study aims to provide the Lombardy Region, the primary stakeholder in the project, with a procedure for evaluating and classifying structural flood risk mitigation measures. The primary objective is to assist the regional authority in identifying priority interventions for public funding. A step-by-step procedure has been developed to assess and rank all projects submitted to the Region, selecting priority projects based on technical considerations—evaluating feasibility, effectiveness, and sustainability of the proposed measures—and the preferences of policymakers. The assessment procedure's conceptual structure was tested using case studies, including both feasibility studies and executive projects, to determine the level of technical insights required at each planning phase of public works. The methodology relies on Multiple Criteria Analysis (MCA) techniques, enabling the simultaneous consideration of various, non-directly comparable criteria in a complex decision-making context. These criteria encompass technical features of proposed works, potential territorial constraints, and interferences in the intervention area (feasibility); the effectiveness of measures in reducing flood risk and associated costs; and the environmental and social co-benefits and disbenefits of each intervention (sustainability). Specific indicators, either ad hoc defined for the study or referenced from current regulations and guidelines at national and regional levels, are employed to evaluate the criteria. Stakeholder participation, particularly from the Region, River District Authorities, and Municipalities, is crucial throughout the process, especially in the final phase of aggregating (weighting) all criteria. This aggregation produces an overall performance score for each option, enabling the derivation of a regional ranking of flood risk mitigation strategies. The collaboration between academia and public institutions is highlighted as essential for enhancing the efficiency of disaster risk reduction policies.

How to cite: Gallazzi, A., Molinari, D., Ballio, F., Credali, M., Tolone, I., Muratori, S., and Asaridis, P.: A Multi-Criteria Analysis procedure for the evaluation and classification of flood risk mitigation strategies, EGU General Assembly 2024, Vienna, Austria, 14–19 Apr 2024, EGU24-8205, https://doi.org/10.5194/egusphere-egu24-8205, 2024.

Since the 1950s, global irrigated area has expanded dramatically, with complex effects on regional climate worldwide. The North China Plain (NCP) is among the most intensively irrigated regions in the world, but the effects of historical irrigation expansion on climate extremes over multi-decadal timescale are largely uncertain. Combining statistical methods with model simulations, we found that NCP experienced a decreasing trend of 0.2–0.25 ℃ decade−1 (p < 0.1) in daily maximum temperature (Tmax) during May-June of 1961–2000 along with irrigation expansion, which is distinct from other regions experiencing strong warming such as most of western China. The cooling effect on Tmax is 0.092 ℃ decade−1 (p < 0.01), relatively lower than that in California’s Central Valley but comparable to the trend in Northwest China and larger than the trend in Tibetan Plateau. The correlation coefficients between irrigation expansion and temperature change from 1960 to 2000 for Tmax and mean air temperature (Tmean) are –0.58 and –0.33 (p < 0.01), respectively, suggesting the ability of irrigation to alleviate regional warming and temperature extremes. Such effect varies over time, continuously strengthening from 1961 to 1980 because of intensive irrigation expansion, but then remaining relatively unchanged or weakening during 1980–2005 with moderate expansion. After 2005, the cooling effect is not detectable, which implies that it is completely canceled out by other forcings such as greenhouse gas warming, compensation of urban area expansion, small irrigation expansion rate and decline in irrigation water use. Despite that, irrigation is still able to reduce the number of extreme heat days after 1980. Compared with other factors, we found that irrigation expansion is the second most important contributor (27%) to the decrease in Tmax during the study period, after aerosol pollution (54%). This work emphasizes the ability of irrigation expansion to adapt agriculture to climate change over the past decades, and highlights the need for sustainable irrigation expansion in the future.

How to cite: Yuan, T., Tai, A. P. K., and Wu, J.: Irrigation expansion in North China Plain has historically decelerated regional warming and mitigated temperature extremes, EGU General Assembly 2024, Vienna, Austria, 14–19 Apr 2024, EGU24-8291, https://doi.org/10.5194/egusphere-egu24-8291, 2024.

The occurrence probability of rare floods is linked to the right-tail behavior of flood frequency distributions. Specifically, heavy-tailed behavior of flood distributions often signals significant hazards due to the unexpected extremeness of event magnitudes. However, conducting reliable analyses of flood tail heaviness across regions remains challenging due to the varying record lengths of available data.

In this study, instead of relying solely on statistical methods to evaluate flood tail behavior, we adopt a physical-based approach—hydrograph recession analysis—to quantify the nonlinearity of catchment hydrological responses. This method has shown its efficacy in identifying heavy-tailed flood behavior across analyses with different data lengths. Our analysis covers 575 river gauges, spanning drainage areas from 4 to 40,504 km2, across Atlantic-influenced European areas, Northwestern European areas, and the Continental United States. We categorize these regions based on the Köppen climate classification to explore the relationship between physiographic/climatic conditions and heavy-tailed flood behavior, and distinguish regional characteristics using the aridity index and potential evapotranspiration.

Our findings reveal a prevalence of heavy-tailed flood propensity in Atlantic-influenced European areas, prevalent nonheavy-tailed flood propensity in Northwestern European areas, and a mixed distribution with a balanced propensity in the Continental United States. Generally, drier catchments exhibit higher nonlinearity in hydrological responses, facilitating heavy-tailed floods, while catchments in which snow dynamics dominate the flood generation process tend to present linear responses. Excessively dry catchments, however, are less likely to exhibit heavy-tail floods due to insufficient moisture. Moreover, around one-third of catchments display varying tail behavior across seasons, underscoring the potential underestimation of flood tail heaviness in annual analyses. The seasonality of flood tail behavior—where instances of heavy-tailed flood behavior increase from spring to autumn but decrease in winter—is influenced by the seasonal variation of potential evapotranspiration.

Our study contributes to advancing the understanding of the impact of inherent physiographic and climatic features on regional and seasonal patterns of heavy-tailed flood behavior, providing valuable insights into the emergence of a considerable occurrence probability associated with very large magnitudes of rare floods.

How to cite: Wang, H.-J., Merz, R., and Basso, S.: Physiographic and Climatic Controls on Heavy-Tailed Flood Behavior: Insights from Catchment Nonlinear Responses, EGU General Assembly 2024, Vienna, Austria, 14–19 Apr 2024, EGU24-8389, https://doi.org/10.5194/egusphere-egu24-8389, 2024.

EGU24-8531 | Orals | HS7.5

Appraising and reducing riverine flood risk: a case study from Central Italy 

Francesco Dottori, Matteo Darienzo, Giacomo Fagugli, Simone Gabellani, Tatiana Ghizzoni, Daria Ottonelli, Flavio Pignone, and Eva Trasforini

On 15 September 2022 a catastrophic flood event hit the Misa river basin in Central Italy. The magnitude of the event (intensity of precipitation, water discharge, debris and sediment transport) and the subsequent impacts were far more severe and extended than previous flood events in the same area, thus calling for a radical change in current practices of flood risk management. In this framework, the present study aims at 1) providing a comprehensive assessment of flood risk for the Misa river basin, and 2) designing appropriate risk reduction measures at river basin scale. We reconstructed the September 2022 event by integrating in-field surveys, hydrological data, hydraulic models, observations of the event (e.g. flood extent maps) and historical data of past flood events, taking into account the incompleteness and uncertainty of both models and observations. Moreover, we modelled exposure and vulnerability of population and economic activities in the area, using detailed surveys of observed impacts to inform the model set-up. The outcomes of these activities allowed to review the risk analysis tools currently available in the Misa river basin, and to design updated risk scenarios for present and future climate conditions. Finally, the risk scenarios have been used to explore different alternatives for flood risk reduction, in agreement with local authorities and stakeholders. We evaluated a range of structural measures (strengthening of dike systems, detention areas, river diversions) and non-structural measures (land-use planning, relocation, flood-proofing measures), considering existing risk management plans and new analyses carried out in this study (e.g. cost effectiveness of measures).

How to cite: Dottori, F., Darienzo, M., Fagugli, G., Gabellani, S., Ghizzoni, T., Ottonelli, D., Pignone, F., and Trasforini, E.: Appraising and reducing riverine flood risk: a case study from Central Italy, EGU General Assembly 2024, Vienna, Austria, 14–19 Apr 2024, EGU24-8531, https://doi.org/10.5194/egusphere-egu24-8531, 2024.

EGU24-8564 | Orals | HS7.5

High-Resolution Dynamic Flood Susceptibility Mapping Across the Mediterranean Region 

Hamidreza Mosaffa and Luca Brocca

Effective disaster prevention necessitates the production of high-resolution flood susceptibility maps (FSM) that accurately identify potential flood-prone areas. Conventional FSMs, however, provide static representations that overlook the inherent dynamicity of flood susceptibility, which is influenced by temporal variations, precipitation intensities, and other factors. Additionally, traditional FSMs often lack the high-resolution climate data required for precise risk assessment. To address these limitations, we propose a novel dynamic FSM approach that incorporates temporal variations and high-resolution climate data.

Our approach employs the Random Forest machine learning algorithm, trained on a comprehensive dataset of flooded and non-flooded areas (Global Flood Database v1). The algorithm considers seven critical factors influencing flooding events: elevation, slope, land cover, proximity to rivers, drainage density, soil moisture, and precipitation. This approach enables the generation of high-resolution (1 km) dynamic FSMs for the Mediterranean region, under varying seasonal conditions, precipitation intensities, and post-drought scenarios.

To assess and compare the model's performance, we employed both training and testing datasets, conducting evaluations using various metrics. The study results demonstrate the superior performance of the Random Forest model, establishing its efficacy as a robust tool for mapping dynamic flood susceptibility. The accuracy and reliability of the results obtained through this approach offer crucial insights for mitigating flood-related risks and enhancing disaster management strategies. This study is an integral part of the Open-Earth-Monitor Cyberinfrastructure (OEMC) project. As our next step, we aim to expand the application of our dynamic flood susceptibility mapping methodology to cover the European region.

How to cite: Mosaffa, H. and Brocca, L.: High-Resolution Dynamic Flood Susceptibility Mapping Across the Mediterranean Region, EGU General Assembly 2024, Vienna, Austria, 14–19 Apr 2024, EGU24-8564, https://doi.org/10.5194/egusphere-egu24-8564, 2024.

Floods impact natural and human systems from multiple dimensions. The vulnerability to flood consequences is intricately linked to the hydrogeomorphic and socio-economic properties of the region. In a long run flood control infrastructure such as embankments evolve with the hydrogeomorphic and socio-economic properties and co produce the new set of vulnerabilities. Assessment of maladaptive contribution of flood control infrastructure is crucial in adaptive decision making and building resilience.The study analyzed flood vulnerability of the population residing inside the embankment area of the Kosi River basin from multidisciplinary parameters. The Kosi River embankment area covers around 890 Sq Km area and is home to nearly 0.8 million people who are facing a trifecta of issues, including regular flooding, scarcity of basic amenities, and loss of livelihood. The basin went through numerous flood-related research based on geomorphology, hydrology, and other physical factors; however, the flood impact assessment of embankments and its role within the socioeconomic dimension still needs to be explored. The present study unpacks flood vulnerability in 283 villages located within the Kosi embankment. Drawing upon thirteen attributes—comprising eight socio-economic and five hydro-geomorphic parameters—the analysis incorporates data from Sentinel-2, IMD, FMIS, the 2011 census report, and other pertinent survey reports. The study utilized analytical hierarchical process (AHP) to obtain relative priority order of parameters. Through the application of GIS analysis, we systematically formulated exhaustive vulnerability maps encapsulating socio-economic, hydrogeomorphic, and composite dimensions based on the weightage assigned to the selected parameters. The analysis highlights that nearly the entire population in the embankment region is susceptible to the effects of flooding, with ∼66% of the region having high and very high flood risk and ∼26% in areas with moderate risk. Furthermore, the outcomes reveal the maladaptive consequences of infrastructure solutions, manifesting as socio-economic disparities and exclusionary effects. The population living inside the embankment region exhibit notably impoverished socio-economic characteristics,including 32 % female literacy, approximately 90 houses constructed by  around 90 percent of houses are Kachha ( mud house), and highly rely on farm labor activities, which is highly lower than the region outside the embankment. Additionally, the outcomes bring to light the maladaptive consequences of infrastructure solutions, manifesting as socio-economic disparities and exclusionary effects. Residents within the embankment area exhibit notably impoverished socio-economic indicators, including a 32% female literacy rate, approximately 90% of houses are Katchha ( made from mud and straw), and economic dependency on agriculture labor activities, which is significantly lower than outside of the embankment. Moreover, the annual flood and longer periods of waterlogging cut off the population from other parts of the state. Lastly, the study discussed the source of vulnerability and adaptation options, which could be useful in developing comprehensive flood adaptation programs, including socioeconomic considerations.

How to cite: Devda, A. and Verma, V.: Assessing Flood Vulnerability and Maladaptive Effects Associated with Embankment-Based Flood Control Infrastructure : Hydrogeomorphic and Socioeconomic Analysis Kosi River Embankment Region, Bihar, India., EGU General Assembly 2024, Vienna, Austria, 14–19 Apr 2024, EGU24-8741, https://doi.org/10.5194/egusphere-egu24-8741, 2024.

EGU24-9209 | ECS | Posters on site | HS7.5

Spatial analysis of catastrophic flooding in the metropolitan area of Murcia over the last 100 years 

Ester García Fernández, Juan Francisco Albaladejo-Gómez, Andrina Gincheva, Salvador Gil-Guirado, and Alfredo Pérez-Morales

Floods represent the most diverse, destructive and frequent natural hazard worldwide and are one of the most significant causes of loss of economic and social assets. In recent years, an increase in the quantity and intensity of this phenomenon can be observed. The factors are manifold, but two stand out: increased hazards as a consequence of anthropogenic climate change and increased exposure and vulnerability of the population and its economic assets. One of the most conflictive areas of the planet are the Mediterranean regions, due to the combination of both factors. Among the hot spots, the Southeast of Spain stands out, with a situation aggravated by a semi-arid climate, but with a highly irregular and torrential rainfall distribution.

These factors are particularly problematic in urban areas, making it necessary to precisely locate the areas at risk in order to establish effective adaptation measures. For this reason, this paper compiles historical information on the main flood events from 1900 to the present in the metropolitan area of Murcia, the main urban area in southeast Spain. The information collected comes from newspaper sources. Subsequently, this information has been geolocated and analyzed with Geographic Information Systems. The results reveal that, in general terms, the damage is concentrated mainly in the areas near the Segura River. Additionally, and to a lesser extent, there is a significant concentration in its main tributary, the Guadalentín River. However, it should be noted that during recent flooding episodes, the areas affected are being modified, involving new urbanized areas, far from the main riverbeds and located in flood zones due to the passage of secondary watercourses such as wadis. Finally, it is worth noting that there has been an increase in the number of low-intensity damage points. However, on a positive note, it has been observed that higher intensity damage is decreasing.

How to cite: García Fernández, E., Albaladejo-Gómez, J. F., Gincheva, A., Gil-Guirado, S., and Pérez-Morales, A.: Spatial analysis of catastrophic flooding in the metropolitan area of Murcia over the last 100 years, EGU General Assembly 2024, Vienna, Austria, 14–19 Apr 2024, EGU24-9209, https://doi.org/10.5194/egusphere-egu24-9209, 2024.

EGU24-9257 | ECS | Orals | HS7.5

Multi-hazard assessment of long- and short-term extreme hydrometeorological events in southeastern South America 

M. Josefina Pierrestegui, Miguel A. Lovino, Gabriela V. Müller, and Omar V. Müller

Extreme hydrometeorological events (EHE) negatively affect ecosystems, human settlements, food production, water resources, and public health worldwide. In southeastern South America (SESA), the frequency and intensity of temperature and precipitation extremes have increased over recent decades. SESA is particularly vulnerable to EHE due to its high population rates and an economy heavily reliant on agricultural activities; therefore, advancing towards a climate-resilient development is a key goal for the region. This study presents a multi-hazard analysis of EHE and their changes over SESA.

Our study assesses the frequency, duration, and intensity of short- and long-term EHE for the 1961-1990 and 1991-2020 periods. ERA5 precipitation, soil moisture, and temperature data at multiple time scales (from daily to monthly) are used, with a spatial resolution of 0.25°×0.25° latitude-longitude grid. Long-term EHE are studied using nonparametric standardized indices—specifically, the Standardized Precipitation Index (SPI) and Standardized Soil Moisture Index (SSI)—at 3- and 18-month timescales to analyze agricultural and hydrological impacts. Short-term EHE are characterized by heavy precipitation, flash droughts, and heat waves events to analyze immediate impacts in urban areas and in agriculture. Individual hazard components are derived by multiplying the frequency, duration, and intensity of the identified events, followed by a rescaling to a 0-1 range using range normalization (with minimum and maximum values). The long-term and short-term EHE hazard indices are formulated by aggregating the rescaled individual hazard components and dividing by the total number of components. Changes in observed EHE hazard components are determined by comparing the EHE hazard indices for the 1991-2020 and 1961-1990 periods.

Our findings underscore significant precipitation excess hazard, mainly concentrated in agriculture-prone areas spanning central-eastern Argentina, Uruguay, and southern Brazil across both 3- and 18-month timescales. In contrast, precipitation deficit hazard predominantly manifests in the western regions of SESA. Regarding short-term EHE, the highest hazard magnitudes are observed in northeastern Argentina, southern Brazil, and southeastern Paraguay. Heat waves occur frequently in the region, with hazardous intensities over the northern part of SESA. Additionally, heavy precipitation events constitute a significant hazard component for urban and rural infrastructure primarily in northeastern Argentina. Flash droughts also affect agriculture-prone areas, particularly with high intensity in southern Brazil, northeastern Argentina, and Uruguay.

Our results reveal that the most significant changes are observed in short-term hazard indices in northeastern SESA. This region, which includes eastern Paraguay, northeastern Argentina, southern Brazil, and Uruguay, has experienced an increase in heat wave hazard, primarily due to a significant rise in the frequency of heat waves. Hazards associated with heavy precipitation and flash drought events have also increased, with a rise in their frequency and duration observed mainly over northeastern Argentina and southern Brazil. In contrast, long-term hazard indices exhibit non-uniform patterns of change. Our findings suggest that weather-related hazards have undergone changes over the last decades. We expect that these findings provide valuable insights to enhance SESA's hydroclimatic risk management systems by identifying areas susceptible to both short- and long-term hazards.

How to cite: Pierrestegui, M. J., Lovino, M. A., Müller, G. V., and Müller, O. V.: Multi-hazard assessment of long- and short-term extreme hydrometeorological events in southeastern South America, EGU General Assembly 2024, Vienna, Austria, 14–19 Apr 2024, EGU24-9257, https://doi.org/10.5194/egusphere-egu24-9257, 2024.

EGU24-9313 | ECS | Orals | HS7.5

The Effects of Geographic Risk Complementarity on Reducing Flood Insurance Costs 

Shibo Cui and Jianshi Zhao

Flood insurance is an important non-structural measure for flood risk management. However, a significant protection gap in flood insurance exists in many countries and the high cost of flood insurance is a primary reason. Reducing the flood insurance costs for both policyholders and insurance companies is crucial for the effective implementation of flood insurance. Here, we use portfolio theory to derive fundamental principles of reducing overall insurance cost including premiums and risk reserves through geographic risk complementarity. Furthermore, we propose a reasonable premiums distribution approach among different risk agents to analyze the effect of geographic risk complementarity on individual cost, based on the cooperative game theory. We applied our method in China, which has a large territory but lacks a national flood insurance program. We show there is a low correlation of flood losses across most provinces in China. Compared to the separate insurance in each province, national flood insurance can reduce total premiums by 14.5% and total risk reserves by 61.0%. The regions with highest proportion of premium reduction are the middle and lower Yellow River reaches, which have a lower flood risk correlation with the portfolios of other regions. In conclusion, the geographic complementarity in flood risk has a significant effect on reducing flood insurance cost and the degree of cost reduction depends on the flood risk correlation among different entities. We recommend that China should utilize the geographic risk complementarity to implement a national-level flood insurance program. The method proposed can also provide references for catastrophe insurances around the world.

How to cite: Cui, S. and Zhao, J.: The Effects of Geographic Risk Complementarity on Reducing Flood Insurance Costs, EGU General Assembly 2024, Vienna, Austria, 14–19 Apr 2024, EGU24-9313, https://doi.org/10.5194/egusphere-egu24-9313, 2024.

EGU24-10245 | ECS | Orals | HS7.5

A time-dependent non-asymptotic statistical analysis of extreme precipitation events 

Matteo Pesce, Eleonora Dallan, Francesco Marra, and Marco Borga

Time-dependent precipitation frequency analyses were often hampered by the availability of relatively short data records, which result in large uncertainty in the estimation of extremes. The recently developed non-asymptotic statistical methods, based on fitting ordinary events rather than extreme events only, represent a potential solution to the problem of data scarcity and are finding wide application in literature under assumptions of stationarity. Recent studies investigated the use of non-asymptotic methods under non-stationary conditions (e.g., Vidrio-Sahagún and He, 2022) and advocated their use over other methods for non-stationary frequency analysis of extreme precipitation. In this study we formalize a non-stationary time-dependent approach for the statistical analysis of multi-duration precipitation extremes using simplified metastatistical extreme value (SMEV) approach. The study focuses on a catchment in the Eastern Italian Alps, where trends in extreme precipitation where reported (Dallan et al., 2022) and which was impacted by the exceptional Vaia event in 2018. We provide an estimation of extreme return levels of precipitation in six stations in the neighborhood of the catchment and compare them with precipitation maxima observed during Vaia storm. The results show that using a non-stationary left-censored Weibull distribution, with both scale and shape parameters linearly dependent on time, allows to properly describe the observed trends of intense precipitation for different durations. Our results suggest that the probability of observing events like Vaia increased over the past decades, leading to the need for updating local adaptation measures.


References:

Dallan, E., Borga, M., Zaramella, M., & Marra, F. (2022). Enhanced summer convection explains observed trends in extreme subdaily precipitation in the eastern Italian Alps. Geophysical Research Letters49(5), e2021GL096727.

Vidrio-Sahagún, C. T., & He, J. (2022). Hydrological frequency analysis under nonstationarity using the Metastatistical approach and its simplified version. Advances in Water Resources166, 104244.

How to cite: Pesce, M., Dallan, E., Marra, F., and Borga, M.: A time-dependent non-asymptotic statistical analysis of extreme precipitation events, EGU General Assembly 2024, Vienna, Austria, 14–19 Apr 2024, EGU24-10245, https://doi.org/10.5194/egusphere-egu24-10245, 2024.

EGU24-10297 | ECS | Orals | HS7.5

Projected amplification of rainfall extremes due to warming-induced reduction of snow fraction: an assessment based on convection-permitting simulations 

Petr Vohnicky, Eleonora Dallan, Francesco Marra, Giorgia Fosser, Matteo Pesce, and Marco Borga

In mountainous regions, temperature determines the state of precipitation (liquid or solid) and in turn significantly affects runoff formation and flood generation. Projected temperature increase due to global warming may therefore affect the rainfall/precipitation ratio during heavy storms, hence intensifying the flood regime. This study aims to assess the projected variations in liquid/solid fraction of precipitation during heavy precipitation events in the upper Adige River, Italy (Eastern Italian Alps). The study utilizes simulations from an ensemble of convection-permitting climate models (CPM), which are suitable to the task given their ability to explicitly represent deep convection and to resolve the mountainous topography. The CPM data provided by the CORDEX-FPS Convection project at 1-hour temporal and remapped to 3 km spatial resolution, cover historical and far-future (2090-2099) time periods under the extreme climate change scenario (RCP8.5). Observational data from the densely instrumented river system are utilized for bias evaluation. Lastly, the Simplified Metastatistical Extreme Value (SMEV) approach, known for the reduced uncertainty compared to conventional approaches, is incorporated for frequency analysis. This method proves particularly useful for analyzing extremes from short time periods, such as those in CPM simulations. The projected changes in both sub-daily mean areal precipitation and liquid rainfall return levels are examined at various spatial scales based on the sub-basins total area. Our preliminary results underscore the significance of leveraging advanced statistical techniques and high-resolution climate models to address emerging challenges in hydrology and climate science. The climate-induced shifts in return period of liquid precipitation identified in this study are expected to have implications for both water resources management and adaptation measures.

How to cite: Vohnicky, P., Dallan, E., Marra, F., Fosser, G., Pesce, M., and Borga, M.: Projected amplification of rainfall extremes due to warming-induced reduction of snow fraction: an assessment based on convection-permitting simulations, EGU General Assembly 2024, Vienna, Austria, 14–19 Apr 2024, EGU24-10297, https://doi.org/10.5194/egusphere-egu24-10297, 2024.

EGU24-10877 | ECS | Posters on site | HS7.5

Exploring Diverse Perceptions of Multiple Risks among the Public in Rome 

Mara Lucantonio, Elena Ridolfi, Patrizia Cicini, Fabio Russo, and Francesco Napolitano

Risk is given by the combination of exposure, hazard, and vulnerability, and it is perceived by individuals in different ways. Some people may be unaware of the potential occurrence of a given hazard, while others may misjudge their level of exposure, vulnerability, or both. The knowledge of the population’s risk perception is a fundamental aspect for the analysis of potentially catastrophic phenomena and for the development of prevention policies to intervene and mitigate the expected damage. Questionnaires are widely used in social science research to acquire information about the attitudes, social characteristics, beliefs, and behaviors of participants. This information when combined through a mixed method can provide robust, comprehensive, and quantifiable results, adding a valuable perspective for the development of appropriate hazard mitigation and adaptation strategies. Here we present a case study that involves the analysis of a data set based on a questionnaire submitted to around 300 citizens of the city of Rome (Italy) in spring 2023. The proposed questionnaire investigates specific areas, which are: experience and knowledge of the phenomena, probability of occurrence perceived by the respondent, potential impact, and preparedness to deal with the phenomena.The use of questionnaires to study citizens’ perception of both natural and man-made hazards enables the acquisition of valuable information for authorities dealing with emergency management. The resulting dataset has the potential to improve the communication efficiency between authorities and citizens in risk situations, and provide relevant information for future studies relying on the knowledge of citizens’ risk perception.

How to cite: Lucantonio, M., Ridolfi, E., Cicini, P., Russo, F., and Napolitano, F.: Exploring Diverse Perceptions of Multiple Risks among the Public in Rome, EGU General Assembly 2024, Vienna, Austria, 14–19 Apr 2024, EGU24-10877, https://doi.org/10.5194/egusphere-egu24-10877, 2024.

EGU24-10950 | ECS | Posters on site | HS7.5

Temporal and spatial analysis of mortality associated with landslides on São Miguel Island (Portugal) from 1900 to 2020 

Rui Fagundes Silva, Rui Marques, and José Luís Zêzere

The São Miguel Island covers an area of 744.6 km² and has a total population of 133,390, distributed across six municipalities: Ponta Delgada, Ribeira Grande, Vila Franca do Campo, Povoação, Lagoa, and Nordeste. The island features two extinct volcanic systems and three active central volcanoes with calderas connected by two fissure volcanic systems. Two distinct seasons can be identified based on rainfall patterns: from October to March (wet season) and from April to September (dry season). Since the settlement of the island in the mid-15th century, there have been records of landslides, some with significant socio-economic impact. The analysis of the spatial distribution and temporal patterns of mortality associated to landslides was carried out using the NATHA (Natural Hazards in Azores) database for the period 1900–2020. Data collection involved the analysis of more than 55,500 newspaper specimens. A total of 236 landslides events were catalogued on São Miguel Island, which caused 82 fatalities. The municipality of Povoação accounted for 48 fatalities, approximately 59% of the total. Ponta Delgada reported 14 fatalities, Ribeira Grande eight, Vila Franca do Campo seven, Nordeste three, and Lagoa two. On São Miguel Island, an average of 0.7 fatalities per year were recorded, resulting in a landslide mortality rate of 0.35 (calculated as the ratio between deaths and total events). The events with the highest number of fatalities occurred on October 31, 1997 (29 fatalities) and on October 14, 1942 (7 fatalities). The annual mortality rate per decade reveals two distinct periods with higher values: 1930-1949 and 1990-1999. No fatalities were recorded from 1900 to 1929. The landslide mortality rate has a first increase in the 1930s and 1940s (≈0.1 fatalities/10,000 inhabitants). From 1950 to 1989, there was a decrease (≈0.02 fatalities/10,000 inhabitants), with a slight increase in the 1960s. The period from 1990 to 1999 has the highest mortality rate (≈0.26 fatalities/10,000 inhabitants). However, excluding the extreme event of October 31, 1997 from the analysis reveals that the 1990s had a mortality rate in line with the previous four decades (0.02 fatalities/10,000 inhabitants). Along the two first decades of the 21st century, the mortality rate increased again, maintaining a stable trend (≈0.05 fatalities/10,000 inhabitants). The data also indicates that males had a higher frequency of fatalities. The circumstances surrounding the incidents varied, with most fatalities occurring outdoors when individuals were on foot in rural areas. However, it is noteworthy that there were also fatalities inside houses in urban areas, emphasizing the diverse contexts in which these tragic events took place. This information provides valuable insights to temporal patterns and spatial distribution of landslide-induced fatalities on São Miguel Island.

How to cite: Silva, R. F., Marques, R., and Zêzere, J. L.: Temporal and spatial analysis of mortality associated with landslides on São Miguel Island (Portugal) from 1900 to 2020, EGU General Assembly 2024, Vienna, Austria, 14–19 Apr 2024, EGU24-10950, https://doi.org/10.5194/egusphere-egu24-10950, 2024.

EGU24-11090 | ECS | Orals | HS7.5

From indices to impacts: Understanding the dynamics of drought impacts through socio-economic clustering 

Rhoda Odongo, Hans De Moel, Marthe Wens, Natalia Limones, Dim Coumou, and Anne Van Loon

Over the past decade, the Horn of Africa (HoA) has been plagued by recurrent drought events that have had devastating impacts on the population. The frequency, duration and severity of these droughts are expected to increase in the wake of global warming, leading to higher losses and damages if the vulnerability of the population is not reduced. Monitoring and early warning systems for droughts are based on various drought hazard indicators. However, assessments of how these indicators are linked to impacts are rare. For adequate drought management, it is essential to understand and characterise the drivers of drought impacts, especially in the HoA, where most studies focus either on meteorological droughts, agricultural droughts or the propagation of droughts through the hydrological cycle, without considering the relationship between hazard and impact. Drought hazard indices alone cannot capture the vulnerability of the system. In this study, we identify meaningful indices for the occurrence of region- and sector-specific impacts. We assess the effectiveness of socio-economic clustering in categorising counties based on common characteristics and their correlation with historical drought impacts (malnutrition, milk production and trekking distances to water sources). Using Random Forest (RF) and Spearman correlation analyses, we examine the link between drought indices (Standardised Precipitation Index, Standardised Precipitation Evapotranspiration Index, Standardised Soil Moisture Index, Standardised Streamflow Index and Vegetation Condition Index) with different accumulation periods and the impact data. We find that clustering regions based on vulnerability proxies significantly improves the hazard-impact relationship, emphasising the importance of considering vulnerability factors in drought risk assessment. Our results indicate an impact-specific relationship that is strongly influenced by the vulnerability of the region. In particular, household and livestock distance to water is most strongly associated with medium- to long-term precipitation-based indices (2-10 months), while milk production can be associated with a variety of indices with different accumulation periods (5-24 months), and malnutrition is correlated with precipitation- and streamflow-based indices (5-24 months). Household and livestock distance to water is well modelled by clusters reflecting low access to improved sanitation and safe water sources, high poverty, aridity and gender disparities. Malnutrition was well modelled by clusters related to aridity, average precipitation, food consumption score, access to water sources, improved sanitation and poverty levels. The type of clustering used in modelling the impact of drought on milk production does not have a major impact on the performance of the models. We then apply this relationship to hindcast drought indices to obtain impact data on individual counties for periods when no impact monitoring was done yet. With that information we estimate the associated risk under specific climatic conditions. By recognising the drivers and vulnerability factors that influence the sensitivity of counties to drought, communities can better prepare and mitigate the impacts of drought.

How to cite: Odongo, R., De Moel, H., Wens, M., Limones, N., Coumou, D., and Van Loon, A.: From indices to impacts: Understanding the dynamics of drought impacts through socio-economic clustering, EGU General Assembly 2024, Vienna, Austria, 14–19 Apr 2024, EGU24-11090, https://doi.org/10.5194/egusphere-egu24-11090, 2024.

EGU24-11493 | ECS | Posters on site | HS7.5

Dry spell frequency and duration analysis using different spell definitions 

Pedro Henrique Lima Alencar and Eva Nora Paton

Dry spells, characterized by consecutive days with little to no precipitation, pose significant challenges, particularly in agriculture, and can impact various sectors including health when compounded by high temperatures, increased evaporation rates, or pollution. However, defining the thresholds for what constitutes a significant lack of precipitation or the number of consecutive days to define a notable dry spell remains ambiguous. In this study, we investigate the occurrence of different types of dry spells across Germany using twelve diverse definitions. These definitions encompass not only the conventional criteria of low/no precipitation but also consider associations with other extreme weather conditions occurring simultaneously (such as high temperatures, and potential evapotranspiration) or following the dry spell (like intense precipitation events). Leveraging continuous weather station data spanning the last 50 years, we employ the Mann-Kendall test to analyse seasonal and regional trends in the duration and frequency of these various dry spell events across Germany. Our findings reveal positive trends in both the frequency and duration of dry spells in Germany, notably prominent in the southern regions. These trends are observed in conventional low-precipitation dry spells and compound heat-dry events. Additionally, to facilitate event identification, we have consolidated these diverse dry spell definitions into an R-package called DryER (Dry spell Events in R).


How to cite: Lima Alencar, P. H. and Paton, E. N.: Dry spell frequency and duration analysis using different spell definitions, EGU General Assembly 2024, Vienna, Austria, 14–19 Apr 2024, EGU24-11493, https://doi.org/10.5194/egusphere-egu24-11493, 2024.

EGU24-11733 | ECS | Orals | HS7.5

Exploring vulnerability to flash floods in a water-scarce MENA city: Challenges and possible solutions  

Clara Hohmann, Christina Maus, Ahmad Awad, Dörte Ziegler, Hanna Leberke, Maram Al Naimat, Wafaa Abuhammour, and Katja Brinkmann

Jordan is one of the water scarcest regions worldwide, but regularly hit by severe flash floods caused by heavy rainfall events. Such events will likely intensify in future and increase flash flood damages, especially in rapidly developing urban areas. Therefore, flood vulnerability analysis and assessment are urgently needed to improve urban risk management and to protect the local population. To date, however, such analyses in Jordan, as in many other MENA regions, have been hampered by the lack of spatial and temporal high-resolution climate, economic and social data. Furthermore, conducted hydrological analyses have only considered physical parameters in assessing flash flood risk.

Our aim is to investigate the vulnerability in a data scarce urban region and find solutions to overcome the challenges by combining different disciplinary perspectives with local knowledge. Jordan’s capital, Amman was selected as study region, which is a prime example of a rapidly growing city in the MENA region.

To analyze and assess the vulnerability of people, infrastructure and ecosystem to flash flood events in a watershed of Amman, a mixed-method approach was applied within a transdisciplinary research project called CapTain Rain (Capture and retain heavy rainfall in Jordan). To gain insights into flash flood risks, we explore the vulnerability dimensions exposure and sensitivity from the hydrological, hydraulic and social perspectives, and the adaptive capacity of the local population. For the assessment of each vulnerability dimension, different physical, social and ecological indicators were used. Several indicators, such as damage potential, were adapted to local conditions based on focus group discussions with Jordanian stakeholders.

The vulnerability dimensions exposure, sensitivity and adaptive capacity were assessed for the current situation and several possible scenarios with changing future conditions in climate (intensity of rainfall) and land cover (urbanization trends). As one sensitivity indicator the damage potential was analyzed. The resulting damage potential map shows e.g. the locations of critical infrastructure, and also includes the word heritage sites, which were identified as vulnerable infrastructure of high importance by the Jordanian stakeholders. Regarding future scenarios our first hydrological and hydraulic modelling results show that a moderate climate change of 20% more intense rainfall has a stronger influence compared to land cover changes. Land cover changes with more sealed surfaces have little influence on the runoff caused by the low infiltration capacity of soils in the area according to the available data.

Through interdisciplinary collaboration and local stakeholder engagement, this work demonstrates a noteworthy strategy to addressing flash flood risks in situations where data is limited. The results of the integrated scenario analysis and vulnerability assessment serve as a decision-support tool for urban planning.

How to cite: Hohmann, C., Maus, C., Awad, A., Ziegler, D., Leberke, H., Al Naimat, M., Abuhammour, W., and Brinkmann, K.: Exploring vulnerability to flash floods in a water-scarce MENA city: Challenges and possible solutions , EGU General Assembly 2024, Vienna, Austria, 14–19 Apr 2024, EGU24-11733, https://doi.org/10.5194/egusphere-egu24-11733, 2024.

EGU24-14198 | ECS | Orals | HS7.5

Assessing the Influenced Zone of Debris Flow Using Numerical Simulation 

Kai-Lun Wei, Kuo-Wei Liao, Guan-Yu Lin, Poshuan Lin, and Tsungyu Hsieh

Taiwan is located at the boundary between the Philippine Sea Plate and the Eurasian Plate, characterized by steep terrain and high river gradients. Combined with frequent events such as typhoons leading to substantial rainfall, this has resulted in disasters like debris flows. Several available tools such as HEC-RAS two-dimensional hydraulic, SRH-2D, FLO-2D and FLOW-3D are used to analyze the area of flooding and the impact of debris flow in the watershed. The simulation results are compared with historical disaster data to validate the feasibility of model. Furthermore, the results are used to evaluate the suitability of current government-designated evacuation locations and routes.

Among several analysis tools, the debris flow modeling in HEC-RAS two-dimensional hydraulic is considered as the best platform to analyze debris risk. The results show the sections of evacuation routes on the left bank of the downstream area near the estuary pass through the debris flow impact area. However, there is no suitable evacuation facility in the vicinity. Therefore, during warning issuance, residents need to be cautious and evacuate promptly. On the other hand, collaboration with government authorities can be pursued to establish new shelters or activity centers nearby, serving as alternative evacuation sites.

How to cite: Wei, K.-L., Liao, K.-W., Lin, G.-Y., Lin, P., and Hsieh, T.: Assessing the Influenced Zone of Debris Flow Using Numerical Simulation, EGU General Assembly 2024, Vienna, Austria, 14–19 Apr 2024, EGU24-14198, https://doi.org/10.5194/egusphere-egu24-14198, 2024.

EGU24-14698 | Posters on site | HS7.5

Monthly flood frequency regionalization for comprehensive flood damage assessment to crops 

Anna Rita Scorzini, Charlie Dayane Paz Idarraga, and Daniela Molinari

Quantitative flood risk assessments rely on damage models, which relate information on flood hazard and vulnerability of exposed assets to estimate expected losses. Differently from other sectors, crop damage depends not only on typical hazards variables (including water depth, flow velocity, inundation duration, water salinity, yield of sediments and/or contaminants) but also on the month of flood occurrence. Indeed, plant vulnerability changes over the different phenological phases that are strictly related to the seasonality of crop production. Considering the time of occurrence of the flood would imply a shift from the traditional representation of inundation scenarios based on annual probability to monthly-based hazard estimations. When risk assessment is carried out at large spatial scale, a detailed understanding of seasonal flood patterns is then required for the different sub-catchments of the basins, including un-gauged ones. In this study we present a clustering approach to flood frequency regionalization applied to the Po River District in Northern Italy, within the risk assessment process required by the European Floods Directive. The  area is characterized by complex climatic and topographic conditions, highlighting the representativeness of the case study for the implementation of the proposed approach in other geographical contexts. Utilizing observed monthly flow data from over 100 gauging stations, the approach combines both physical and statistical criteria to identify homogeneous regions in terms of flood generation mechanisms and seasonality. The process enables the assignment of distinct monthly flood probabilities to all catchments within the district, thereby supporting a comprehensive flood risk assessment for the agricultural sector.

How to cite: Scorzini, A. R., Paz Idarraga, C. D., and Molinari, D.: Monthly flood frequency regionalization for comprehensive flood damage assessment to crops, EGU General Assembly 2024, Vienna, Austria, 14–19 Apr 2024, EGU24-14698, https://doi.org/10.5194/egusphere-egu24-14698, 2024.

The insurance sector plays a critical role in promoting disaster resilience and recovery by providing financial protection, speeding up rebuilding and recovery, and managing the financial impact of natural disasters. To fulfill this role, insurance companies must meet the capital requirements imposed by regulators. For example, the European Solvency II regulatory framework requires insurers to hold enough capital to withstand a natural catastrophe loss with a return period of 1 in 200 years. As the historical loss data are scarce and incomplete, the insurance sector uses stochastic catastrophe models (cat models) to assess the potential cost of rare but devastating events like floods.

A stochastic event set is a crucial element of cat models. It is a collection of possible disasters with their likelihood and severity. One method to generate stochastic flood events is to use numerical models of the atmosphere to generate realistic precipitation fields, and then apply rainfall-runoff models to estimate how much water will flow into rivers and streams from precipitation and snowmelt. By running many simulations with different inputs and parameters, stochastic flood models can provide a range of possible outcomes, including floods with spatial patterns and magnitude missing in historical data.

Output of such simulations are spatio-temporal hazard grids: precipitation grids for pluvial risk and river discharge grids for fluvial risk. These grids are large as the models typically run over large geographies (countries or continents) and simulate 10,000 years or more. This contribution will (i) provide overview of existing methods how to identify flood events in such huge discharge and precipitation datasets (i.e. peak-over threshold method), (ii) show their limitations for identifying flood events, and finally (iii) propose a new methodology designed to address specific needs of reinsurance industry such as the hours-clause condition, which specifies the time period within which losses from a single event must occur in order to be covered.

As many severe floods are composed from several sub-waves (for example 2002 floods in Czech Republic), proper event identification and separation is highly relevant topic as it influences the amount of reinsurance payouts after some types of flood events and thus capital available for rebuilding and recovery. 

How to cite: Kadlec, M.: Identification of flood events in large discharge datasets - reinsurance industry perspective, EGU General Assembly 2024, Vienna, Austria, 14–19 Apr 2024, EGU24-14743, https://doi.org/10.5194/egusphere-egu24-14743, 2024.

EGU24-14898 | Posters on site | HS7.5

The diverse impacts of extreme storms in the European South. The case of Storm Daniel (2023) in Greece. 

Michalis Diakakis, Spyridon Mavroulis, Christos Filis, Yiannis Bantekas, Marilia Gogou, Katerina-Nafsika Katsetsiadou, Maria Mavrouli, Vasilis Giannopoulos, Andromachi Sarantopoulou, Panagiotis Nastos, Emmanuel Vassilakis, Aliki Konsolaki, Evelina Kotsi, Sotiris Moraitis, Eleftheria Stamati, Athanasia Bakopoulou, Emmanuel Skourtsos, Panayotis Carydis, and Efthymios Lekkas

On September 4, 2023, Storm Daniel moved inland from the Ionian Sea, intensifying due to the warmth of the post-summer Mediterranean Sea, resulting in intense rainfall and thunderstorms over the Balkans. Central Greece was particularly affected, experiencing the highest daily rainfall totals recorded in the region.

The storm caused widespread devastation, especially in the Thessaly region, with significant impacts including intense erosion, mass movement phenomena triggered by rainfall, damages from strong winds, inundation, agricultural land damage, loss of life and injuries, impacts on residences and businesses, as well as a substantial toll on the environment and cultural sites.

This study focuses on Storm Daniel and its effects in Thessaly, Greece, by creating a database of distinct impact elements based on field surveys and public records. Through this archive, the study explores the range of its impacts, developing a systematic categorization to provide an in-depth understanding of the types and mechanisms of these impacts.

Examining extreme storms through post-flood surveys and emphasizing their impacts can enhance our comprehension of associated risks. This knowledge will facilitate more accurate predictions and strategic planning for such events, contributing to improved emergency management and recovery efforts. Anticipating the impacts becomes crucial, particularly in the context of the projected increase in the frequency of such events due to climate change, thereby strengthening our preparedness.

How to cite: Diakakis, M., Mavroulis, S., Filis, C., Bantekas, Y., Gogou, M., Katsetsiadou, K.-N., Mavrouli, M., Giannopoulos, V., Sarantopoulou, A., Nastos, P., Vassilakis, E., Konsolaki, A., Kotsi, E., Moraitis, S., Stamati, E., Bakopoulou, A., Skourtsos, E., Carydis, P., and Lekkas, E.: The diverse impacts of extreme storms in the European South. The case of Storm Daniel (2023) in Greece., EGU General Assembly 2024, Vienna, Austria, 14–19 Apr 2024, EGU24-14898, https://doi.org/10.5194/egusphere-egu24-14898, 2024.

EGU24-15286 | ECS | Posters on site | HS7.5

A 10-Year climatology of hail in France: towards an estimate of the hail hazard 

Maxime Trevisani

According to France Assureur (French insurance unions), 2022 hail damage in France is estimated at more than €6.5 billion, i.e. more than half of all climate-related damage in 2022, or 60% of all hail damage accumulated between 2013 and 2021. This record-breaking year is in line with the growing concern about hail in France among public and private stakeholders. Despite its increasing impact on society the hail hazard in France remains largely unknown or under investigated at the national level, with a single 20x20 km hail risk map produced up in 1998 by F. Vinet using economic data (insurance) and measurements (hailpad). Hail hazard is poorly studied in France due to the great difficulty of observing or modelling hailfall, which are highly localised in time and space. The emergence of social networks since the late 2000s has led to a proliferation of potential hail observers across France. These new data, combined with insurance data, make it possible to study hail at a level of resolution never seen before in France.

The main objectives of our study are therefore to update the geographical assessment of the hail hazard in France, while improving the granularity of the existing geographical hail assessment. To this end we studied the hail hazard in terms of frequency and maximum diameter at the municipal level (average 16 km²), using hail reports (Keraunos, European Sever Weather Database) and insurance data (Generali France, around 5% market share) over the period 2013-2022.

Our study thus provides a resolution 25 times finer than that of Vinet and reveals a southwest - northeast axis dividing France into two parts: the southern part is heavily affected by hail while the northern part is less affected. It also highlights 3 main geographical areas with the highest hail hazard. The Massif Central stands out as the main hail-prone area in France, with a notable maximum in its northern part. The Bordeaux-Paris axis comes second, with a local maximum in the southwest Atlantic coast. In third place comes the Provence-Alpes-Côte d'Azur region, particularly in the Pre-Alps and Pre-Atlantic massifs. There also seems to be a correlation between orography and areas of high hail hazard, particularly noticeable in the Massif Central and Pre-Alps regions, but this assumption needs to be further investigated.

How to cite: Trevisani, M.: A 10-Year climatology of hail in France: towards an estimate of the hail hazard, EGU General Assembly 2024, Vienna, Austria, 14–19 Apr 2024, EGU24-15286, https://doi.org/10.5194/egusphere-egu24-15286, 2024.

EGU24-15556 | Orals | HS7.5

Climate Stress Testing for Enhanced Understanding of the Flood Hazard and its Socioeconomic Impacts in Italy 

Francesca Perosa, Alastair Clarke, Punit Bhola, Caroline McMullan, Emma Lewington, and Bernhard Reinhardt

To contribute to a more resilient flood risk management in Italy, we employ the recently published Verisk Inland Flood Model for Italy to conduct climate stress testing. We focus on the sensitivity of modeled losses to precipitation and leverage the meteorological dataset obtained from the Climate Model Intercomparison Project Phase 6 (CMIP6) for identifying projected precipitation trends and analyzing the potential effects of climate change on inland flood losses in the future, exploring different Shared Socioeconomic Pathways (SSPs) and Representative Concentration Pathways (RCPs). The methodology involves analyzing correlations between annual or seasonal precipitation and the corresponding annual loss cost, which is defined as annual loss divided by the total insured value. By exploring these relationships, we seek to enhance our understanding of how precipitation patterns influence the financial implications of flood events in various Italian regions. Additionally, we use the 10,000-year stochastic catalog embedded in the Verisk Inland Flood Model to explore the impact of expected climate change-related changes in annual precipitation for each Italian region, addressing the climate change-based precipitation targets. This enables us to run the fully probabilistic Verisk Inland Flood model and to assess whether anticipated alterations in precipitation levels correspond to expected changes in Annual Average Loss (AAL). This approach allows us to dynamically adapt our flood risk model to varying climate scenarios, providing valuable insights for the (re)insurance industry, as well as academia and government agencies that are seeking to navigate the evolving landscape of flood-related risks.

How to cite: Perosa, F., Clarke, A., Bhola, P., McMullan, C., Lewington, E., and Reinhardt, B.: Climate Stress Testing for Enhanced Understanding of the Flood Hazard and its Socioeconomic Impacts in Italy, EGU General Assembly 2024, Vienna, Austria, 14–19 Apr 2024, EGU24-15556, https://doi.org/10.5194/egusphere-egu24-15556, 2024.

EGU24-15848 | Posters on site | HS7.5

The use of radar information for improving the knowledge about landslides and floods events: an application to Calabria region (Italy) 

Vincenzo Totaro, Simona de Sario, Francesco Chiaravalloti, and Olga Petrucci

Floods and landslides are common natural phenomena that threaten society and ecosystems causing significant losses in term of human lives and financial damages. An in-depth investigation about the past occurrences of these events is of paramount importance for providing advances in the knowledge of natural and anthropogenic factors responsible for their generation. Considering rainfall as one of the key drivers for triggering physical mechanisms responsible for the occurrences of floods and landslides, a proper description of its characteristics needs to contemplate the intrinsic spatial and temporal variability. Despite the importance of such elements, rainfall monitoring often relies on sparse rain gauges, which lead to uncertainty in the identification of real rainfall patterns, making difficult to link precipitation records with observed damages. Meteorological radar represents a relevant tool for detecting rainfall spatiotemporal variability and providing ancillary information about the evolution of the events.

Goal of the work is to develop a methodology that aims in reconcile records of landslides and floods events with the rainfall structures obtained by the joint use of data recorded by rain gauge network and radar data. The research has been carried out by moving from a consolidated catalogue of damaging events occurred in correspondence of floods and landslides in Calabria region (Italy) in 2019 and 2020. Rainfall was investigated integrating rain gauge data and maps of Surface Rainfall Intensity with resolution of 1x1 km2.

Exploiting the availability of an accurate spatiotemporal reconstruction of precipitation structures, our investigation allowed to improve the specific knowledge about dynamics responsible of selected floods and landslides events. Preliminary results are supportive of the use of the proposed approach for integrating different sources of information in the assessment of the real dynamics of damaging events and for enhancing the use of their joint scientific content in the framework of risk assessment and mitigation.

How to cite: Totaro, V., de Sario, S., Chiaravalloti, F., and Petrucci, O.: The use of radar information for improving the knowledge about landslides and floods events: an application to Calabria region (Italy), EGU General Assembly 2024, Vienna, Austria, 14–19 Apr 2024, EGU24-15848, https://doi.org/10.5194/egusphere-egu24-15848, 2024.

EGU24-17412 | Orals | HS7.5 | Highlight

It could have come worse –  an analysis of spatial counterfactual scenarios for the July 2021 flood in the Ahr Valley, Germany 

Sergiy Vorogushyn, Li Han, Heiko Apel, Viet Dung Nguyen, Björn Guse, Xiaoxiang Guan, Oldrich Rakovec, Husain Najafi, Luis Samaniego, and Bruno Merz

After a flood disaster, the question often arises: “What if the event had gone differently?” For example, what would be the effects of a flood if the path of a pressure system and thus the precipitation field had occurred taken a different trajectory? The analysis of such alternative scenarios of precipitation footprints (“counterfactuals”) is a valuable approach for flood risk management in addition to classical extreme value statistical analyses. It helps to think about and prepare for extremes that have not occurred in this way, but which appear quite plausible.

Here, we analyze the spatial alternative scenarios of the deadly July 2021 flood in the Ahr Valley, Germany. The hydrological model mHM is driven with precipitation fields systematically shifted in space. The resulting runoff is transformed into inundation and flood impact indicators using the high-resolution hydrodynamic model RIM2D.

The results show that even a slight shift of the precipitation field by 15-20 km, which does not seem implausible due to orographic conditions, causes an increase in peak flows at the Altenahr gauge of over 30% and at individual tributaries of up to 160%. Also, significantly larger flood volumes can be expected due to precipitation shifts. This results in markable differences in inundation depths in a number of areas along the Ahr river valley. The presented results should encourage critical thinking about precautionary measures and risk management plans for extreme and unprecedented events.

How to cite: Vorogushyn, S., Han, L., Apel, H., Nguyen, V. D., Guse, B., Guan, X., Rakovec, O., Najafi, H., Samaniego, L., and Merz, B.: It could have come worse –  an analysis of spatial counterfactual scenarios for the July 2021 flood in the Ahr Valley, Germany, EGU General Assembly 2024, Vienna, Austria, 14–19 Apr 2024, EGU24-17412, https://doi.org/10.5194/egusphere-egu24-17412, 2024.

EGU24-17516 | Posters on site | HS7.5

Spatial patterns and determinants of severe geomorphological changes due to the extreme flood event in the Ahr valley, western Germany in July 2021 

Fabian Weidt, Rainer Bell, Lothar Schrott, Alexander Brenning, Michael Dietze, Lisa Burghardt, and Joshua Groeßer

The extreme flood event of July 14/15, 2021 caused massive geomorphological changes along the Ahr river in western Germany. The processes include mass movement and bank erosion, channel displacement and widening and deposition of material at the floodplains, all of which contributed to extreme damage. With the aim of gaining a more comprehensive understanding of the factors controlling these processes, spatial patterns of geomorphological changes on a regional scale are analyzed. A differential terrain model (DoD), calculated from digital terrain models (DTM) collected before and after the event using airborne laser scanning (ALS), serves as the data basis. The course of the river is divided into 120 m wide and 100 m long segments. Analyzing the cumulated volumetric loss per segment, which represents the explained variable proxying spatial variability in flood power, is conducted by using a multiple linear regression model. The independent variables considered in this investigation include peak discharge, valley floor width and river curvature. Additionally, a time series model, incorporating ARIMA and GARCH components, is applied to unravel patterns and anomalies along the course of the river while accounting for the autocorrelative and heteroscedastic structure of data. Both the native data and the residuals of all model types are used to examine effects of bridge failure and subsequent outburst waves on volumetric loss. The analysis shows that the strongest geomorphological changes are associated with high peak discharge and a small valley floor width. River segments containing destroyed arch bridges show significantly higher volumetric loss values than segments with destroyed slab bridges, intact bridges or no bridge at all. Spatially limited amplification of volumetric loss to 200 m downstream of destroyed slab bridges suggests a more rapid decrease in outburst wave power for those type of bridges in contrast to arch bridges. These findings provide evidence that there are construction types more appropriate than traditional arch bridges to prevent local augmentation of flood power caused by outburst waves resulting from bridge clogging and failure.

How to cite: Weidt, F., Bell, R., Schrott, L., Brenning, A., Dietze, M., Burghardt, L., and Groeßer, J.: Spatial patterns and determinants of severe geomorphological changes due to the extreme flood event in the Ahr valley, western Germany in July 2021, EGU General Assembly 2024, Vienna, Austria, 14–19 Apr 2024, EGU24-17516, https://doi.org/10.5194/egusphere-egu24-17516, 2024.

EGU24-18244 | ECS | Orals | HS7.5

The effects of extreme rainfall trends on compound flood risk: A case study over Greater Boston 

Stergios Emmanouil, Andreas Langousis, Elizabeth Perry, Luke Madaus, Joshua Hacker, and Emmanouil N. Anagnostou

Climate adaptation strategies and vulnerability assessments over coastal areas require proper modeling of the interplay and nonstationary nature of the physical processes involved in compound flooding. As a result of the reported upward trajectories of rainfall intensity over the Contiguous United States, flood risk estimates are also expected to vary. However, given the systematic and random inconsistencies of traditional extreme rainfall estimation approaches and the increased uncertainty surrounding climate model projections, the effects of climate change on the estimation of flood risk from compound hazards remains an open question. In this effort we aim to: (a) combine the observed rainfall intensity trends from the past 40 years (i.e., from 1979 to 2020; see also Emmanouil et al., 2022) across various scales of temporal averaging, with storm surge and antecedent streamflow conditions, to estimate how flood inundation levels evolve, and (b) assess the effects of those trends on flood risk estimation within areas affected by compound hydrological events. In doing so, we use hydrodynamic simulations of reported flood occurrences over the Greater Boston area (MA, United States) for a period of 20 years (i.e., from 2000 to 2019), along with the parametric modeling scheme proposed by Emmanouil et al. (2023). The latter has been shown to properly weight and link the exceedance probabilities of the main flood-driving mechanisms to the return periods of the maximum inundation levels, thus providing a sufficient depiction of the conditions over the studied domain and allowing for estimation beyond the range covered by the available simulations. Assuming that the dependence structure of the driving mechanisms remains time-invariant, our findings aim to enhance the understanding of how flood risk from compound hazards has been affected by extreme rainfall trends induced by the changing climatic conditions and, therefore, support decision-making on the design and protection of critical infrastructure.

References

Emmanouil, S., Langousis, A., Nikolopoulos, E. I., & Anagnostou, E. N. (2022). The Spatiotemporal Evolution of Rainfall Extremes in a Changing Climate: A CONUS‐Wide Assessment Based on Multifractal Scaling Arguments. Earth’s Future, 10(3). https://doi.org/10.1029/2021ef002539

Emmanouil, S., Langousis, A., Perry, E., Madaus, L., Hacker, J., and Emmanouil, E.N. (2023) Decomposing the effects of compound mechanisms on flood risk estimation for urban environments: A case study over Greater Boston, UrbanRain23, 12th International Workshop on Precipitation in Urban Areas, Pontresina, Switzerland, 29 November – 2 December 2023.

How to cite: Emmanouil, S., Langousis, A., Perry, E., Madaus, L., Hacker, J., and Anagnostou, E. N.: The effects of extreme rainfall trends on compound flood risk: A case study over Greater Boston, EGU General Assembly 2024, Vienna, Austria, 14–19 Apr 2024, EGU24-18244, https://doi.org/10.5194/egusphere-egu24-18244, 2024.

EGU24-18357 | ECS | Posters on site | HS7.5

Unveiling the complexity of social vulnerability: An analysis of the Social Vulnerability Index in Sweden (SVIS) 

Konstantinos Karagiorgos, Lars Nyberg, Nikos Kavallaris, Jenni Koivisto, Tonje Grahn, Ruth Björkholm, Johanna Gustavsson, and Sven Fuchs

In recent decades, social vulnerability assessments have become a valuable tool for gaining a deeper understanding of the effects of natural hazards on societies. These assessments aim to quantify and map human characteristics that contribute to potential loss, enabling the development of capacities and capabilities to respond to the emerging threats. Assessment methods range from qualitative approaches to semi-quantitative, often spatially explicit, place-based approaches, many of them with empirical background in respective case studies around the world. Despite these efforts, it is still important to carefully examine the potential benefits and limitations of these assessments, particularly those that focus on mapping and place-based approaches, in order to fully understand their value.

The purpose of this study (Karagiorgos et al., 2023) was to systematically evaluate the Social Vulnerability Index in Sweden (SVIS) developed by Haas et al. (2022) using a sensitivity analysis approach. This evaluation focuses on the sensitivity around the impact of changing aggregation scale levels, the influence of different options in constructing the index, the weight/contribution of each factor to social vulnerability and the indicators set. The aim was to determine the influence of input factor variation on model response.

Concerning the influence of scale variations on assessment outcomes, the SVIS algorithm demonstrated robustness when employed across various scales. In contrast, the factor retention method utilized yielded considerable differences in the results. Likewise, the weights' effect exerted a noteworthy influence on the index formation. The consideration of different subsets of variables revealed a high impact in certain scenarios.

The sensitivity analysis conducted in the index construction outlined in this study, recommends that the development of indexes proceed cautiously, accompanied by expert guidance. This approach ensures that the portrayal of social vulnerability remains both reasonable and consistent. Furthermore, the existence of other dimensions of vulnerability, such as physical, economic, and institutional, suggests that the SVIS be integrated with these dimensions. This integration can offer a comprehensive perspective on vulnerability, helping to identify and comprehend the primary pillars for use in Disaster Risk Reduction (DRR). It also contributes to a deeper understanding of the connections between social vulnerability models and the outcomes of disasters.

Haas, J.; Karagiorgos, K.; Pettersson, A.; de Goër de Herve, M.; Gustavsson, J.; Koivisto, J.; Turesson, K. & L. Nyberg (2022): Social sårbarhet för klimatrelaterade hot. Delstudie 2: Generella och hotspecifika index för social sårbarhet i Sverige. Myndigheten för samhällsskydd och beredskap, (MSB) rapport nr 1978, Karlstad.

Karagiorgos, K.; Kavallaris, N.; Björnholm, R.; Koivisto, J. & S. Fuchs (2023): Evaluation of the Social Vulnerability Index (SVIS) in Sweden. Swedish Civil Contingencies Agency (MSB), MSB report nr 2185, Karlstad. 

How to cite: Karagiorgos, K., Nyberg, L., Kavallaris, N., Koivisto, J., Grahn, T., Björkholm, R., Gustavsson, J., and Fuchs, S.: Unveiling the complexity of social vulnerability: An analysis of the Social Vulnerability Index in Sweden (SVIS), EGU General Assembly 2024, Vienna, Austria, 14–19 Apr 2024, EGU24-18357, https://doi.org/10.5194/egusphere-egu24-18357, 2024.

EGU24-19140 | ECS | Posters virtual | HS7.5

Sensitivity analysis of agricultural and hydrological droughts to rainfall deficits across India 

Syed Bakhtawar Bilal and Vivek Gupta

Drought is a natural phenomenon characterized by an extended period of insufficient rainfall for a particular area. These deficit in rainfall leads to shortage of water reserves across surface and sub-surface storages. Variations in these shortages arise from diverse factors such as regional climatic variations, geographical features, and land-use patterns. The primary objective of this study is to assess the sensitivity of agricultural and hydrological systems to rainfall deficits across different climatic zones. We aim to quantify the degree of responsiveness of agricultural and hydrological droughts to varying precipitation deficiencies using various statistical and modeling techniques. By examining the diverse responses in different regions, this research seeks to enhance our understanding of precipitation shortages on drought dynamics.

How to cite: Bilal, S. B. and Gupta, V.: Sensitivity analysis of agricultural and hydrological droughts to rainfall deficits across India, EGU General Assembly 2024, Vienna, Austria, 14–19 Apr 2024, EGU24-19140, https://doi.org/10.5194/egusphere-egu24-19140, 2024.

EGU24-19393 | ECS | Orals | HS7.5

Impact of long-lasting flood water on agricultural productivity: a case study of the May 2023 Emilia Romagna floods 

Margherita Sarcinella, Jeremy S. Pal, and Jaroslav Mysiak

Heavy rainfall events occurred in the Emilia-Romagna region in Northern Italy as a result of two major storms on May 2nd and 17th that led to the overflow of 22 rivers and triggered over 250 landslides. This event claimed 15 lives, forced 10 thousand people to evacuate and caused over 400 road closures. Due to a prior long-lasting winter drought and poor land use management that hampered effective water drainage, floodwaters stagnated for over a month in some areas, exacerbating the crisis. Over 40% of regional agricultural land was flooded leading to irreversible crop damage, in some instances, entire harvest loss. The objective of this study is to build a consistent and replicable methodology to quantify the agricultural damages and economic loss resulting from stagnated floodwater over cropland using the Emilia Romagna floods as a case study. The study emphasises the use of remote sensing data as a tool to achieve accurate impact estimates. Sentinel-1 SAR imagery is used to derive 10-meter resolution flood extent and duration maps at a revisit time of 3 to 6 days. The maps are matched with crop data available for the region from the iColt database and damages are computed as a function of ponded water duration and crop type as well as resistance to oxygen deprivation. The data, comprised of crop type, growing season and sowing date, allow for the characterization of the growth state of each crop at the time of flooding, implicitly providing insights on the probability of plant survival. The use of satellite-derived vegetation indices as markers for post-disaster crop recovery, with a focus on identifying crop-specific recovery rates and patterns is highlighted. This study highlights the need for collaborative efforts with key regional entities and can provide factual-hazard-based agricultural loss estimates to local institutions. These findings can guide targeted adaptation strategies, improve the spatial accuracy of loss assessment, and improve our comprehension of the aftermath of prolonged floods on agricultural output.

How to cite: Sarcinella, M., Pal, J. S., and Mysiak, J.: Impact of long-lasting flood water on agricultural productivity: a case study of the May 2023 Emilia Romagna floods, EGU General Assembly 2024, Vienna, Austria, 14–19 Apr 2024, EGU24-19393, https://doi.org/10.5194/egusphere-egu24-19393, 2024.

EGU24-19552 | Posters on site | HS7.5 | Highlight

Unveiling global sub-daily precipitation extremes: Insights and development of the INTENSE Project  

Hayley Fowler, Amy Green, Elizabeth Lewis, David Pritchard, Stephen Blenkinsop, Luis Patino Velasquez, and Anna Whitford

Precipitation extremes result in flooding and droughts, causing substantial damages and loss of life. Understanding the variability of precipitation extremes with climate change is challenging, as we do no fully understand processes causing extreme precipitation under current climate variability. The INTENSE project focuses on understanding of the nature and drivers of global sub-daily precipitation extremes and change on societally relevant timescales. As part of this a Global sub-daily precipitation dataset has been collected, containing hourly rainfall data from approximately 25,000 rain gauges across over 200 territories, from a wide range of sources. This has been quality controlled using a rule-based open-source methodology, combining a number of checks against neighbouring gauges, known biases and errors, and thresholds based on the Expert Team on Climate Change Detection and Indices (ETCCDI) Climate Change Indices.  

A set of global hydroclimatic indices have been produced, characterising key aspects of shorter duration precipitation variability, including intensity, duration and frequency properties. An analysis of the indices, trends and corresponding climatology is carried out, providing information on various sub-daily precipitation characteristics (including extremes) across large parts of the world. These indices are publicly available for as many gauges as possible, alongside a gridded dataset that also incorporates indices calculated for additional restricted-access gauge records. To progress further with this work, updates to the dataset are required, with work ongoing to update resources for 2016 onwards, and attempts to automate the process where open-source datasets are available. Any collaborations, information, suggested contacts and relevant resources for developing the dataset are welcomed. 

How to cite: Fowler, H., Green, A., Lewis, E., Pritchard, D., Blenkinsop, S., Patino Velasquez, L., and Whitford, A.: Unveiling global sub-daily precipitation extremes: Insights and development of the INTENSE Project , EGU General Assembly 2024, Vienna, Austria, 14–19 Apr 2024, EGU24-19552, https://doi.org/10.5194/egusphere-egu24-19552, 2024.

Draught is one of the major climate related disaster that Italy has been fighting in the recent years .It is a complex multidimensional phenomenon that is dependent upon on a wide variety of parameters ranging from climatic to socioeconomic ones. In this study we are considering watershed area of lake Bolsena, which is one of the most important water resources in central Italy, to asses in drought vulnerability using Geographical Information System (GIS)  in combination with the Analytic Hierarchy Process (AHP). GIS is used for the spatial analysis of drought for Lake Bolsena watershed area for the year 2022 which was one of the worst draught affected year in the history for the country. Parameters such as Monthly rainfall, Land use/Landcover (LULC), elevation , soil type, Normalized difference vegetation index (NDVI), Normalized Difference turbidity Index (NDTI),Normalized differentiate chlorophyl index(NDCI), Normalized Difference Water Index (NDWI),Storm power index (SPI)  were chosen and considered for the study. AHP is used to calculate weightage factors of each criterion based on the pairwise comparison matrices. The thematic maps of all the parameters were analyzed and Drought Vulnerability Assessment (DVA) map was generated using GIS. The output DVA map will provide valuable information on drought severity in the area and vulnerability related to water availability.

How to cite: Mazumdar, T., Di Francesco, S., Giannone, F., and Santini, M.: Drought vulnerability assessment and mapping using Multi-Criteria decision making (MCDM) and application of Analytic Hierarchy process (AHP) for watershed area of Lake Bolsena of Central Italy, EGU General Assembly 2024, Vienna, Austria, 14–19 Apr 2024, EGU24-19949, https://doi.org/10.5194/egusphere-egu24-19949, 2024.

Rich in biodiversity, Tumaco is a focal point for REDD+ projects that aim to combat deforestation and promote sustainable land use. Cacao farming, vital to the local economy, offers an opportunity to reconcile livelihoods and conservation. However, challenges remain in reconciling cacao and forest conservation. This study explores the benefits of sustainable cacao practices, such as agroforestry, for economic development and environmental conservation. It also looks at the challenges farmers face and the implications for the success of REDD+. Perceptions of climate change profoundly influence farmers' perspectives and behaviours in the context of REDD+ initiatives, shaping the sustainability and effectiveness of such efforts. Therefore, fostering a robust understanding of climate change among local farmers is critical to improving the integration of sustainable cacao production into REDD+ frameworks. This research aims to provide insights for policy makers and project implementers to advance both conservation and development goals in the Tumaco region, by addressing potential synergies and trade-offs between cacao production and REDD+ initiatives. The farmers' lack of knowledge is particularly worrying, not only for the fight against climate change, but also because if the cacao farmers of Tumaco do not see the incentives of carbon credits as a sustainable source of income, they will be forced to return to illegal crops, and the socio-environmental development of these communities will be compromised.

How to cite: Quiroga, S., Hernanz, V., Suarez, C., and Aguiño, J. E.: Evaluating the merit of Carbon Credits: Is there a lack of effectiveness in transitioning from direct Payments for Ecosystem Services to REDD+ community-based incentives?, EGU General Assembly 2024, Vienna, Austria, 14–19 Apr 2024, EGU24-20767, https://doi.org/10.5194/egusphere-egu24-20767, 2024.

EGU24-20944 | ECS | Posters on site | HS7.5

Towards optimizing the operation of controlled flood detention basins 

Mara Ruf and Daniel Straub

Floods are one of the most hazardous natural phenomena worldwide and they are predicted to increase both in intensity and frequency due to climate change. This necessitates comprehensive flood risk mitigation measures that are planned and controlled from a regional as well as a strategic trans-regional perspective.

Controlled flood detention basins can be effective measures for dealing with extreme flood events [1]. By temporally storing water in the detention basin, the discharge in a river is reduced. If the water is removed from the river at the optimal time, this should reduce the peak water level at downstream locations and hence the flood risk.

However, the identification of the optimal operation of flood detention basins is a non-trivial as well as non-deterministic problem. Flood forecast uncertainty, dilatation of the wave along the river channel and the uncertainty in the breaching process turns the polder operation into a stochastic optimization problem with multiple possible optimization targets. Hence, this optimization belongs to the class of sequential decision problems under uncertainty. In this contribution, we utilize a developed dynamic-probabilistic flood risk model [2] to analyze and optimize different control strategies as well as the effect of uncertainties on the optimality of the detention basin operation. We consider the case of a single detention basin as well as that of multiple detention basins that are arranged in series.


[1] De Kork, J.-L.; Grossmann, M. (2009): Large-scale assessment of flood risk and the effects of mitigation measures along the Elbe River. Natural Hazards (2010) 52:143-166.

[2] Ruf, M., Hoffmann, A., Straub, D. (2023): Application of a decision sensitivity measure for the cost-benefit analysis of a flood polder at the Bavarian Danube. 14th International Conference on Applications of Statistics and Probability in Civil Engineering (ICASP 14). Dublin, Ireland.

How to cite: Ruf, M. and Straub, D.: Towards optimizing the operation of controlled flood detention basins, EGU General Assembly 2024, Vienna, Austria, 14–19 Apr 2024, EGU24-20944, https://doi.org/10.5194/egusphere-egu24-20944, 2024.

EGU24-20988 | ECS | Posters on site | HS7.5

Assessment of future climate risk and vulnerability of local communities in High Mountain Asia 

Anju Vijayan Nair, Rahim Dobariya, Deo Raj Gurung, and Efthymios Nikolopoulos

Higher altitude regions like High Mountain Asia (HMA) are particularly affected by future climate change where the increasing temperature coupled with inconsistent precipitation results in rapid glacier melting during summers and less regeneration of glaciers in winters affecting the livelihoods of billions of people. Access to information on future climate change and related hazards is essential to significantly reduce the impacts on socio-economic systems in HMA. In this study, we focus on identifying the areas in northwest HMA where climate extremes are projected to increase in magnitude and/or frequency. For this, statistically downscaled climate projections (at 5km resolution) derived from a 30-member ensemble of GFDL SPEAR CMIP6 are used to evaluate the projected trends in precipitation and temperature (for years 2015 to 2100) over Afghanistan, Tajikistan, and northern Pakistan under SSP2-4.5 and SSP5-8.5 scenarios. Analysis of changes in precipitation and temperature with respect to the historic climate (1990 to 2014) is done to evaluate the vulnerability to climate hazards including droughts and heatwaves. Analysis of the changes in future climate revealed a rapid increase in the occurrence of droughts and heatwaves towards the end of the century, affecting several communities in the region. Following the methodology developed by the Implementation Platform of the EU Mission on Adaptation to Climate Change (MIP4Adapt), the climate risk and vulnerability of local communities in the region is quantified. The results of this study provide critical information to stakeholders and the local communities to proactively prepare for the anticipated climate risks in the future and to adopt appropriate mitigation measures.

How to cite: Vijayan Nair, A., Dobariya, R., Gurung, D. R., and Nikolopoulos, E.: Assessment of future climate risk and vulnerability of local communities in High Mountain Asia, EGU General Assembly 2024, Vienna, Austria, 14–19 Apr 2024, EGU24-20988, https://doi.org/10.5194/egusphere-egu24-20988, 2024.

EGU24-21687 | Orals | HS7.5 | Highlight

Understanding the dynamics of multi-sector impacts of hydro-meteorological extremes: a methods overview 

Mariana Madruga de Brito, Jan Sodoge, Alexander Fekete, Michael Hagenlocher, Elco Koks, Christian Kuhlicke, Gabriele Messori, Marleen de Ruiter, Pia-Johanna Schweizer, and Philip J. Ward

Hydro-meteorological extremes, such as droughts and floods, often trigger a series of compound and cascading impacts due to interdependencies between coupled natural and social systems. However, studies typically only consider one impact and disaster event at a time, ignoring causal chains, feedback loops, and conditional dependencies between impacts. Analyses capturing these complex patterns across space and time are thus needed to inform effective adaptation planning. Here, we present a collection of methods that can be used for assessing the dynamics of the multi-sector compound and cascading impacts (CCI) of hydro-meteorological extremes. We discuss existing challenges, good practices, and potential ways forward. Rather than pursuing a single methodological approach, we advocate for methodological pluralism. We see complementary or even convergent roles for analyses based on quantitative (e.g. data-mining, systems modeling) and qualitative methods (e.g. mental models, qualitative storylines). The data-driven and knowledge-driven methods provided here can serve as a useful starting point for understanding the dynamics of both high-frequency CCI and low-likelihood but high-impact CCI.

How to cite: Madruga de Brito, M., Sodoge, J., Fekete, A., Hagenlocher, M., Koks, E., Kuhlicke, C., Messori, G., de Ruiter, M., Schweizer, P.-J., and Ward, P. J.: Understanding the dynamics of multi-sector impacts of hydro-meteorological extremes: a methods overview, EGU General Assembly 2024, Vienna, Austria, 14–19 Apr 2024, EGU24-21687, https://doi.org/10.5194/egusphere-egu24-21687, 2024.

EGU24-108 | Orals | NH1.2

Reconstructing Historical Flood Events: A Monte Carlo-Based Uncertainty Approach 

Ramtin Sabeti, Thomas R. Kjeldsen, and Ioanna Stamataki

Reconstructing historical flood events can offer critical insight into past hydrological responses to extreme weather, informing contemporary flood risk management and infrastructure design. This study employs reverse engineering, based on historical data such as recorded rainfall, flood marks, visual records, and eyewitness accounts to reconstruct a flood event. Historical data was collected by the team during a workshop with the local community. The approach involves hydrological (HEC-HMS) and hydraulic (HEC-RAS) models to simulate the flood event. The July 1968 UK storm, remarkable for record rainfall reaching 175 millimetres within 18 hours, caused extensive devastation in south-west England. This study focuses on reconstructing the 1968 flash flood on the River Chew, notably the peak hydrograph in the village of Pensford. A Monte Carlo simulation approach is used in conjunction with the HEC-HMS and HEC-RAS models to produce a range of potential input hydrographs with uncertainty input parameters (primarily event rainfall and Manning’s roughness) that match the historical evidence.  In particular, the Monte Carlo approach is implemented using a series of Python scripts enabling multiple HEC-RAS simulations to be conducted and the results synthesised in the form of an uncertainty analysis of key parameters such as peak flow. 

How to cite: Sabeti, R., R. Kjeldsen, T., and Stamataki, I.: Reconstructing Historical Flood Events: A Monte Carlo-Based Uncertainty Approach, EGU General Assembly 2024, Vienna, Austria, 14–19 Apr 2024, EGU24-108, https://doi.org/10.5194/egusphere-egu24-108, 2024.

EGU24-395 | ECS | Orals | NH1.2

Beyond Extreme Temperature: Spatiotemporal Analysis of Humid Heat Stress  

Jency Maria Sojan and Jayaraman Srinivasan

Extreme humid heat stress presents significant challenges to human health and productivity. Traditional heat action plans formulated to tackle dry heat stress are insufficient to address the complexities associated with humid heat stress. Furthermore, there is limited quantitative evidence on the evolving patterns of humid heat stress under changing climate. This study investigates the spatiotemporal trends of extreme heat stress across the Global South from 1964 to 2023, distinguishing between dry and humid heat, using high-resolution ERA5 reanalysis hourly data and the Heat Index (HI).

Notably, South Asia and the Middle East experience the highest frequency of extremely humid heat stress. Specific regions in peninsular South Asia have extremely humid heat stress hours from May to June due to persistent high humidity levels. In contrast, western regions of South Asia encounter extreme dry heat stress preceding the monsoon season, followed by a transition to humid heat stress immediately after the onset of the monsoon. The temporal analysis reveals a more rapid increase in the occurrence of extremely humid heat stress compared to that of dry heat stress from May to July over the past 60 years. This underscores the evolving nature of heat stress and the intensification of humid conditions compared to dry ones.

In conclusion, this study advocates for a shift from exclusively addressing dry stress to a comprehensive approach that accounts for the diverse impacts of humid heat stress, particularly on vulnerable populations. This understanding is critical for policymakers to formulate adaptive strategies tailored to the changing landscape of extreme heat stress. 

How to cite: Sojan, J. M. and Srinivasan, J.: Beyond Extreme Temperature: Spatiotemporal Analysis of Humid Heat Stress , EGU General Assembly 2024, Vienna, Austria, 14–19 Apr 2024, EGU24-395, https://doi.org/10.5194/egusphere-egu24-395, 2024.

EGU24-737 | ECS | Posters on site | NH1.2

A database for the outer sizes of tropical cyclones over the Middle Americas 

Adolfo Perez Estrada and Christian Domínguez Sarmiento

Tropical cyclones (TCs) pose a constant threat to populations residing within tropical and subtropical regions. The direct impacts of TCs, such as intense surface winds, storm surge, and heavy precipitation near the center, are well known. However, the indirect effects (e.g, disruption of the upper-level mean wind flow resulting in continental convection, and precipitation associated with cloud bands away from the cyclone's center), are often underestimated.

It is crucial to comprehensively characterize the size of TCs, taking into account both direct and indirect effects, as this new size definition  could improve early warning systems. While various studies employ different parameterizations to describe cyclone size, many of them overlook precipitation. To address this gap, the ROCLOUD technique was developed using  a Python-based algorithm. This algorithm utilizes information on the TC’s position, the extent of cloud bands, and the size of the wind field to define an outersize for TCs located over the oceanic basins in the Middle Americas. In addition to ROCLOUD, we also developed a technique that uses the spatial distribution of TC rainfall to define the outer TC size, named as RPB algorithm. This technique  utilizes a threshold of 2.5 mm in the precipitation satellite products for depicting TC rainfall. Our dual approach provides a comprehensive understanding of TC  sizes, considering the presence of rainfall that can lead to disasters.

Our database shows  external sizes and positions of TCs (recorded every 6 hours) over the North Atlantic (NA) and Eastern Pacific (EP) Oceans during the 2000-2020 period. We got 191 and 336 positions  from the NA and EP basins, respectively. Statistical analysis reveals the coverage of oceanic basins and highlights their differences. We conclude that ROCLOUD offers an operational approximation of the external size of TCs, especially in situations where storms pose a threat to continental regions. The study discusses the utility of both versions of ROCLOUD and RPB for  the Tropical Cyclone Early Warning System over Mexico (EWS-TC), shedding light on the impact of TC sizes that can lead to disasters.

How to cite: Perez Estrada, A. and Domínguez Sarmiento, C.: A database for the outer sizes of tropical cyclones over the Middle Americas, EGU General Assembly 2024, Vienna, Austria, 14–19 Apr 2024, EGU24-737, https://doi.org/10.5194/egusphere-egu24-737, 2024.

EGU24-1525 | ECS | Orals | NH1.2

Objective Identification of Tropical Cyclones with Severe Storm Surge Potential for the North-west Pacific 

Xiaoqi Zhang, Gregor C Leckebusch, and Kelvin S Ng

Storm surges caused by tropical cyclones can significantly impact on coastal areas in East Asia, including megacities e.g., in China. To inform effective adaptation and mitigation planning, a robust storm surge hazard assessment is essential. Unfortunately, the real frequency-intensity distribution of relevant storm-surge levels can only be estimated with large uncertainly based on limited historical observations.

This study demonstrates the successful development of a two-step, objective and automated identification and selection approach of storm-surge relevant TCs for large model data sets where no ground truth verification is possible. In our approach, we combine for the first time two established identification and tracking tools originally developed for extra-tropical cyclones and storms and apply these to identify tropical cyclones. In the first step, we adapted the widely used Murray & Simmonds (1991) University of Melbourne tracking scheme (MS-Track) to the specific conditions of TC tracking in the North-west Pacific. In the second step, we apply the windstorm tracking tool WiTRACK to TC-induced severe wind fields to provide and attach the potential storm-surge relevant information in addition to just the core track provided by the MS-Track.

By validating our results with ERA5 reanalysis data and IBTrACS, we show that our method is simple yet has a well comparable performance in detecting and assessing relevant TC events than more complex tracking approaches. Based on this performance this approach is well-designed and specifically intended to specific applications in CAT modelling approaches, e.g. for the creation of physically consistent event sets for storm surges.

How to cite: Zhang, X., Leckebusch, G. C., and Ng, K. S.: Objective Identification of Tropical Cyclones with Severe Storm Surge Potential for the North-west Pacific, EGU General Assembly 2024, Vienna, Austria, 14–19 Apr 2024, EGU24-1525, https://doi.org/10.5194/egusphere-egu24-1525, 2024.

The physical mechanisms underlying extreme precipitation events linked to atmospheric moisture transport (IVT-P) are investigated in this study. It investigates changes in synoptic-scale weather patterns over the Indian subcontinent and identifies regions where IVT influences extreme precipitation. The study discovers a strong relationship between daily IVT and precipitation over the core monsoon region and the complex terrains of the Western Ghats and Himalayas. Event Coincidence Analysis reveals that extreme IVT can be used to forecast extreme precipitation in these regions. The dynamic component of moisture transport has a strong influence on daily and extreme precipitation over complex terrains. In contrast, the thermodynamic component has an influence on precipitation over regions with an abundance of water vapor and weak horizontal winds. The study also identifies synoptic features and moisture transport ahead of IVT-P events and finds intense low-pressure anomalies, the transition from ridge to trough patterns, and intense 700 hPa relative humidity in the specified regions. Overall, the study provides insights into the physical mechanisms underlying IVT-linked extreme precipitation events.

How to cite: Raghuvanshi, A. S. and Agarwal, A.: Deciphering the connections between extreme precipitation events, atmospheric moisture transport, and associated synoptic features over India, EGU General Assembly 2024, Vienna, Austria, 14–19 Apr 2024, EGU24-1625, https://doi.org/10.5194/egusphere-egu24-1625, 2024.

EGU24-1631 | ECS | Orals | NH1.2

Shift of soil moisture-temperature coupling exacerbated 2022 compound hot-dry event in eastern China 

Yueyang Ni, Bo Qiu, Xin Miao, Lingfeng Li, Jiuyi Chen, Xiaohui Tian, Siwen Zhao, and Weidong Guo

Compound hot-dry events (CHDEs) are among the deadliest climate hazards and are occurring with increasing frequency under global warming. The Yangtze River Basin in China experienced a record-breaking CHDE in the summer of 2022, causing severe damage to human societies and ecosystems. Recent studies have emphasized the role of atmospheric circulation anomalies in driving this event. However, the contribution of land–atmosphere feedback to the development of this event remains unclear. Here, we investigated the impacts of soil moisture-temperature coupling on the development of this concurrent heatwave and drought. We showed that large amounts of surface net radiation were partitioned to sensible heat instead of latent heat as the soil moisture-temperature coupling pattern shifted from energy-limited to water-limited under low soil moisture conditions, forming positive land–atmosphere feedback and leading to unprecedented hot extremes in August. The spatial heterogeneity of hot extremes was also largely modulated by the land–atmosphere coupling strength. Furthermore, enhanced land–atmosphere feedback has played an important role in intensifying CHDEs in this traditional humid region. This study improves the understanding of the development of CHDEs from three aspects, including timing, intensity, and spatial distribution, and enables more effective early warning of CHDEs.

How to cite: Ni, Y., Qiu, B., Miao, X., Li, L., Chen, J., Tian, X., Zhao, S., and Guo, W.: Shift of soil moisture-temperature coupling exacerbated 2022 compound hot-dry event in eastern China, EGU General Assembly 2024, Vienna, Austria, 14–19 Apr 2024, EGU24-1631, https://doi.org/10.5194/egusphere-egu24-1631, 2024.

EGU24-2445 | ECS | Posters virtual | NH1.2

A method of dynamic diagnosis for regional drought degree 

Ruxin Zhao, Hongquan Sun, and Lisong Xing

In view of the difficulty in quantifying the severity of regional drought, this study proposes a method that can quantify and dynamically diagnose the severity of regional drought events, and consider the cumulative superposition effect of drought in the process of spatial and temporal development and evolution. Starting from the site drought index, the method firstly establishes a regional drought index to determine whether drought occurs in the study area in the same month; secondly, it constructs a two-dimensional Copula joint probability model by counting the cumulative duration and cumulative severity of droughts; and finally, it uses the percentile method to classify the joint probability of two-dimensional cumulative drought characteristics into four degree levels of regional drought: light, moderate, severe, and extreme. In the study, the SPEI drought index from 1961 to 2022 was used as the basic data, and the drought centers of China, such as North China Plain, Yangtze River Basin, and Yunnan Province, were selected as the case validation zones, and the results showed that this method can effectively identify the historical drought events in the study area and dynamically diagnose the development process of severe and extreme droughts therein. 

How to cite: Zhao, R., Sun, H., and Xing, L.: A method of dynamic diagnosis for regional drought degree, EGU General Assembly 2024, Vienna, Austria, 14–19 Apr 2024, EGU24-2445, https://doi.org/10.5194/egusphere-egu24-2445, 2024.

        Using multi-source global station and grid monitoring data, FY-2H satellite, and ERA5 reanalysis data, the life history and precipitation characteristics of tropical cyclone "Freddy" as well as the causes of heavy precipitation in southern Mozambique were analyzed. The results show that "Freddy" had a lifespan of 35.5 days which made it the longest lived tropical cyclone in the world, as well as the widest latitude-crossing TC in the southern hemisphere. The extreme long life cycle of "Freddy" was related to favorable large-scale circulation conditions. The strong and sustained subtropical high pressure system made "Freddy" moving westward over the Southern Indian Ocean stably, without the opportunity to combine with the mid latitude trough or cold air which may cause the path turning, intensity weakening, or transformation. After the generation of "Freddy", more than 70% of its life time was over the sea, and the surrounding SST was generally abnormally high, which provided favorable conditions for the development or maintenance of TC intensity. Especially, the SST within the Mozambique Strait remained above 28 ℃, providing excellent underlying conditions for the enhancement of TC intensity, allowing "Freddy" to develop and strengthen rapidly twice after experiencing intensity weakening caused by landfall. The combined influence of favorable circulation conditions and warm sea surface temperature led to the extreme long life of "Freddy".

        "Freddy" made three landfall, bringing sustained heavy precipitation and severe floods to countries in Southeastern Africa. Especially in the southern part of Mozambique, precipitation had characteristics such as long duration, concentrated areas, and large accumulated amount. After landing in Mozambique, "Freddy" was located in a saddle field, leading to weakened steering airflow. Combined with high-level divergence and sustained transportation of warm and humid air by low-level jet, the large-scale circulation system provided favorable background conditions for the slow movement and maintenance of tropical cyclone. The development of low-level convergence and vorticity bands in lower troposphere, as well as strong and sustained water vapor transport, led to the persistence of heavy rainfall in Mozambique. The invasion of cold air induced the formation of a pseudo equivalent potential temperature high-gradient zone in southern Mozambique, and the cold air in the middle layer enhanced atmospheric instability, which was conducive to the development of convection. The southern part of Mozambique was continuously affected by several mesoscale convective systems (MCSs), which not only improved precipitation efficiency but also prolonged the duration of precipitation. The evolution of MCSs had obvious diurnal variation characteristics, with its rapid development and maturity stages almost concentrating in the afternoon to the earlier evening of local time. The increase in low-level wind speed promoted the enhancement of both water vapor and energy, and under the above conditions, the convergence of tropical cyclone wind direction and wind speed triggered the generation of MCSs continuously.

How to cite: Yang, S.: Analysis on the Characteristics of Extreme Long Life Cycle Tropical Cyclone "Freddy" and the Causes of Heavy Rainfall, EGU General Assembly 2024, Vienna, Austria, 14–19 Apr 2024, EGU24-2724, https://doi.org/10.5194/egusphere-egu24-2724, 2024.

Extreme temperature changes from one day to another, either associated with warming or cooling, can have a significant impact on health, environment, and society. Previous studies have quantified that such day-to-day temperature (DTDT) variations and extremes are typically more pronounced in mid-and high latitudes compared to tropical zones. However, the underlying physical processes and the relationship between extreme events and large-scale atmospheric circulation remain poorly understood. Here, such processes are investigated for different locations around the globe based on Observation, ERA5 reanalysis data, and Lagrangian backward trajectory calculations. In the extratropics, extreme DTDT changes are generally associated with changes in air mass transport, in particular shifts from warm to cold air advection or vice versa, linked to regionally specific synoptic-scale circulation anomalies (ridge or through patterns). Lagrangian temperature changes in the advected air masses are due to adiabatic warming, which is dominant in the local winter season, and diabatic warming, most importantly in summer. In contrast, for extreme DTDT changes in the tropics, local processes are more important than changes in advection. For instance, the strongest DTDT decreases over central South America in December-February are linked to a transition from mostly cloud-free to cloudy conditions, indicating an important role of radiative heating. The mechanistic insights into extreme DTDT changes obtained in this study can be helpful for improving the prediction of such events and anticipating future changes in their occurrence frequency and intensity.


How to cite: Hamal, K.: Quantification of the Physical Process Leading to Extreme Day-to-Day Temperature Changes, EGU General Assembly 2024, Vienna, Austria, 14–19 Apr 2024, EGU24-3564, https://doi.org/10.5194/egusphere-egu24-3564, 2024.

EGU24-3613 | ECS | Orals | NH1.2

Assessing windstorm hazard emerging from multiple types of storms 

Nasrin Fathollahzadeh Attar, Francesco Marra, and Antonio Canale

In the context of global climate change, windstorms pose significant environmental, ecological, and socioeconomic challenges. Mountainous and forested regions of Europe, including the Veneto region in northern Italy, have been devastated by unprecedented events such as the storms in July 2023 and Vaia in October 2018, raising the question whether such events may occur more frequently in the future. The probability of observing such extremes in present-day climate can be quantified using cumulative distribution functions of annual maxima wind speeds, obtained from extreme value analysis methods. Once these are derived, however, is it near to impossible to project future changes in these distributions as extreme wind speeds are caused by storms driven by diverse synoptic conditions, the characteristics and occurrence frequency of which may change differently in response to climate change.

This study introduces a method to derive cumulative distribution functions of annual maximum wind speeds explicitly considering the intensity and occurrence frequency of multiple types of storms. Independent windstorms are separated and their maximum hourly wind speed is isolated. Storms are then organized into types based on their local wind direction using a clustering technique. We then use a multi-type Simplified Metastatistical Extreme Value distribution (SMEV) to estimate the cumulative distribution function of annual maximum wind speed for the location of interest. The study focuses on mountainous areas, seeking a simpler relation between typical wind directions and synoptic conditions.

A thorough leave-one-out evaluation with benchmark models, including the traditional Generalized Extreme Value distribution (GEV) and a single-type SMEV, is conducted on 22 mountain stations in the Veneto region (northern Italy). We show that, overall, the proposed multi-type method provides estimates of extreme return levels that are comparable with the ones of single-type SMEV and GEV. Our results demonstrate that it is possible to derive cumulative distribution functions of annual maximum wind speeds explicitly considering storms emerging from different marginal processes. This paves the way to the use of projections of large-scale atmospheric dynamics from climate models to improve our prediction of future extreme wind speeds.


Keywords: Windstorm; Extreme events; Wind direction classification; Multiple types; Simplified Metastatistical Extreme Value (SMEV); Mountainous areas.

How to cite: Fathollahzadeh Attar, N., Marra, F., and Canale, A.: Assessing windstorm hazard emerging from multiple types of storms, EGU General Assembly 2024, Vienna, Austria, 14–19 Apr 2024, EGU24-3613, https://doi.org/10.5194/egusphere-egu24-3613, 2024.

EGU24-3992 | Posters on site | NH1.2

Synoptic and Mesoscale Conditions of Deep Moist Convection during the Cold Season in Croatia 

Maja Telišman Prtenjak, Domagoj Dolički, Petra Mikuš Jurković, and Damjan Jelić

In this study, thunderstorm activity during the cold part of the year was analyzed based on Thunderstorm Intensity Index (TSII) data on a pre-defined grid with a resolution of 3 km x 3 km in Croatia. The study covered a five-year period from 2016 to 2020, focusing on the months from October to March. The goal of the research was to conduct a spatial and temporal analysis of thunderstorm activity and determine the synoptic and thermodynamic conditions under which it occurs. The analysis aimed to provide an overview of the fundamental characteristics, thereby improving the understanding of deep moist convection in the cold part of the year, which poses a significant challenge in operational forecasting due to its lower frequency and more difficult intensity assessment. The occurrence of surface frontal disturbances was detected based on surface and upper-level synoptic charts, and the flow regime at the 500 hPa level was determined. Thermodynamic and kinematic parameters were calculated from radiosonde profiles from stations in San Pietro Capofiume, Brindisi, Pratica di Mare, Zagreb, and Zadar, using the thundeR free software package.

        A total of 290 convective days were selected for analysis from the observed period. The results indicate that synoptic forcing plays a significantly greater role in the development of convection during the cold part of the year compared to the warm part, while the dominant upper-level flow regime is southwest. The obtained values of CAPE (Convective Available Potential Energy) in the cold part of the year are much lower than those in the warmer part, with a significant contribution from the considerably lower amount of solar surface heating. Additionally, most thunderstorms developed under conditions of strong vertical wind shear, indicating that the atmospheric environment conducive to winter thunderstorms is predominantly a High Shear-Low CAPE (HSLC) environment.

How to cite: Telišman Prtenjak, M., Dolički, D., Mikuš Jurković, P., and Jelić, D.: Synoptic and Mesoscale Conditions of Deep Moist Convection during the Cold Season in Croatia, EGU General Assembly 2024, Vienna, Austria, 14–19 Apr 2024, EGU24-3992, https://doi.org/10.5194/egusphere-egu24-3992, 2024.

EGU24-4050 | ECS | Posters on site | NH1.2

Compound dry and hot extreme events in the Mediterranean region 

André Correia Lourenço, Ana Russo, Virgílio A. Bento, and João Lucas Geirinhas

Over the last few decades, the frequency, duration, magnitude of heatwaves in Europe have increased considerably, with major natural and socioeconomic impacts (Basarin et al., 2020; K.P. Tripathy et al., 2022). In climate change scenarios, these events are expected to present an increasing trend (Zscheischler et al., 2018) due to variations in dynamic and thermodynamic mechanisms, triggering unusually longer and more intense periods of drought and causing a reduction in agricultural production and the supply of water reservoirs. The Mediterranean region is a climate change hotspot and therefore a region susceptible to the development and intensification of single or compound hot and dry events (Giorgio and Linello, 2008).

This work aims at studying single and compound heatwaves and droughts based on ERA5 and ERA5-Land databases for Southern Europe on a 0.25º x 0.25º and 0.1º x 0.1º spatial resolution, respectively.

The results show positive trends for the duration and intensity of heatwaves and droughts and, conversely, negative trends for soil moisture. Most of the study area shows statistically significant negative trends when aggregating spatially. On the other hand, the annual temperature means tends to migrate towards higher values and precipitation means show a small decrease. Furthermore, the relation between large scale climatic patterns such as the North Atlantic Oscillation (NAO) and compound drought and heatwaves are studied here.

It is expected that compound hot and dry events will have a positive trend in their frequency, duration and intensity, as a consequence of climatic phenomena, such as the synoptic systems, or even due to previous dry characteristics of the soil. Our findings highlight the intricate interplay between different mechanisms in the occurrence of extreme events in Mediterranean Europe, putting into evidence the need for better representation this interplay in climate models.

A.L., A.R., V.B. and J.G. have been supported by the Fundação para a Ciência e a Tecnologia (FCT) I.P./MCTES through national funds (PIDDAC, grant no. UIDB/50019/2020, https://doi.org/10.54499/UIDP/50019/2020, and LA/P/0068/2020, https://doi.org/10.54499/LA/P/0068/2020, to Instituto Dom Luiz; project DHEFEUS, https://doi.org/10.54499/2022.09185.PTDC). J.G. acknowledges Fundação para a Ciência e a Tecnologia (FCT) for the PhD Grant 2020.05198.BD.


References:

Basarin, Biljana, Tin Lukić, and Andreas Matzarakis. 2020. "Review of Biometeorology of Heatwaves and Warm Extremes in Europe" Atmosphere 11, no. 12: 1276. https://doi.org/10.3390/atmos11121276.

Giorgi, F., Lionello, P., 2008. Climate change projections for the Mediterranean region. Global Planet. Change 63 (2), 90–104.

Tripathy, K. P., & Mishra, A. K. (2023). How unusual is the 2022 European compound drought and heatwave event? Geophysical Research Letters, 50, e2023GL105453. https://doi.org/10.1029/2023GL105453.

Zscheischler, J., Westra, S., van den Hurk, B. J. J. M., Seneviratne, S. I., Ward, P. J., Pitman, A., et al. (2018). Future climate risk from compound events. Nat. Clim. Change 8, 469–477. doi: 10.1038/s41558-018-0156-3.

How to cite: Lourenço, A. C., Russo, A., Bento, V. A., and Geirinhas, J. L.: Compound dry and hot extreme events in the Mediterranean region, EGU General Assembly 2024, Vienna, Austria, 14–19 Apr 2024, EGU24-4050, https://doi.org/10.5194/egusphere-egu24-4050, 2024.

Rainfall return levels are guiding hazard protection, insurance models, infrastructure design, construction, and planning of cities. When deriving information about the frequency and intensity of extremes by fitting extreme value models to pointwise observations, the regionalization of these models is challenging. Rain gauges are distributed unevenly, where some regions suffer from data scarcity in space and time. To address this, topographical and/or climatological covariates are often used for the spatial interpolation. On the other hand, high-resolution climate simulations are available to provide spatial information on rainfall extremes. However, these simulations are still governed by model biases, where the bias adjustment of extremes at ungauged locations is also inducing uncertainty.   

In this study, we propose a combination of observations and a high-resolution convection-permitting climate model simulation in the framework of smooth spatial Generalized Extreme Value (GEV) models in order to estimate spatial rainfall return levels. We choose a study area over southern Germany with complex terrain, which is densely monitored with 1132 rain gauges providing more than 30-year daily rainfall observations. There, a 30-year simulation of the Weather and Forecasting Research (WRF) model is available at 1.5 km resolution driven by ERA5 reanalysis data. We combine observations and covariates from the WRF simulation in the spatial GEV and refer to this approach as sGEV-WRF.

We want to answer three research questions to assess the added value of the proposed framework:

  • Is it worth the effort? Does the sGEV-WRF improve the generation of rainfall return levels compared to the WRF alone?
  • Does the WRF simulation as covariate add value? Can the sGEV-WRF outperform a topography-only spatial GEV?
  • Does the dynamical downscaling at high resolution add value? Can sGEV-WRF outperform a spatial GEV based on observations and covariates from the coarser resolution ERA5?

By evaluating the percentage bias, mean absolute error, and root-mean-square error, we show that the combination of observations and WRF can improve the representation of 10-year and 100-year return levels of daily rainfall.

In addition, we aim to assess the performance of this framework under data-scarce conditions. Therefore, we devise an extensive cross-validation study. We select 5%, 10%, 20%, 50%, 80%, 90%, and 95% of all 1132 rain gauges to re-build the spatial GEV models with 1000 random folds each. We show that the performance is robust under these conditions, highlighting the potential for the application in data-scarce regions. Furthermore, in a non-stationary setup with climate model future projections, it can serve as a reliable tool to assess climate change effects on heavy rainfall.     

How to cite: Poschlod, B. and Koh, J.: Combining observations and a high-resolution climate model for the generation of spatial rainfall return levels, EGU General Assembly 2024, Vienna, Austria, 14–19 Apr 2024, EGU24-5310, https://doi.org/10.5194/egusphere-egu24-5310, 2024.

EGU24-5441 | ECS | Orals | NH1.2

Compounding drivers amplify the severity of river floods  

Shijie Jiang, Larisa Tarasova, Guo Yu, and Jakob Zscheischler

Estimating the risk of river flooding under global warming is challenging, mainly due to the compound nature of the various drivers, which is not yet fully understood. Our study aims to quantitatively unravel the complex dynamics of multiple factors that interact and influence river flooding. Using interpretable machine learning techniques, we analyzed thousands of global catchments to identify the role of compounding drivers in river flooding. Our results indicate that these compounding drivers have played a significant role in increasing the magnitude of river floods over the past four decades. In particular, the influence of the interaction effects between these drivers becomes more pronounced with increasing flood magnitude, and the degree is modulated by specific physioclimatic conditions. Importantly, traditional flood analysis will underestimate the magnitude of extreme floods due to insufficient consideration of the varying compounding effects in flood generation. Overall, our results emphasize the need to more carefully incorporate compounding factors to improve extreme flood estimates.

How to cite: Jiang, S., Tarasova, L., Yu, G., and Zscheischler, J.: Compounding drivers amplify the severity of river floods , EGU General Assembly 2024, Vienna, Austria, 14–19 Apr 2024, EGU24-5441, https://doi.org/10.5194/egusphere-egu24-5441, 2024.

EGU24-5446 | ECS | Posters on site | NH1.2

Enhancing flood forecasting and prevention: The multidisciplinary approach of Flood2Now project and its innovative solutions 

Carlo Guzzon, Raül Marcos, Maria Carmen Llasat, Montserrat Llasat-Botija, Dimitri Marinelli, Albert Diaz Guilera, Luis Mediero, Luis Garrote, Alicia Cabañas Ibañez, Javier Arbaizar Gonzalez, and Olga Varela

Spain and the Mediterranean coast are largely affected by flash floods, which are generated by intense, localized storms within smaller basins, typically less than 100 km2 (Gaume et al., 2016). Predicting these events remains challenging as they are frequently triggered by convective systems operating at scales below the resolution of conventional meteorological models. In Spain, floods are the country's primary recurring natural disaster, accounting for nearly 70% of the compensation amount issued by the Consorcio de Compensación de Seguros (CCS, 2011). 

In this hydrogeological risk context, the ultimate goal of the Flood2Now project is to support the population and mitigate the risk associated with this natural hazard, through the implementation of an automatic real-time warning system in two basins (Francolí and Arga) located in the north-east part of the Iberian peninsula. Multidisciplinarity plays a pivotal role in defining this system, integrating various disciplines and information sources, ranging from complex systems physics and hydrometeorological data to citizen science and socio-economic statistics.

Flood2Now embodies a collaborative effort between universities, companies, and social foundations, to explore the following technical aspects: (i) establishing a comprehensive digital database spanning four decades of flood occurrences; (ii) exploring complex systems methodologies to discern interrelationships among various factors influencing flood impacts; (iii) studying weather patterns associated with diverse flood events, accounting for their impact; (iv) implementing analogous methodologies to enhance flood risk forecasting; and (v) integrating this knowledge to enhance operational systems aiding flood-related decision-making.

This research extends its impact on society by implementing citizen science methodologies to gather supplementary data for flood risk management, enhancing early warning systems' precision, and raising community awareness of flood risks and climate change. Innovative approaches include integrating historical and citizen-collected data into decision-making, employing ensemble prediction systems, and implementing advanced hydrological modeling techniques for streamflow prediction and decision support.

This contribution shows the selected basins and case studies, the proposed applied hydrometeorological chain to forecast flash flood impacts, and the improvements that citizen science can provide, on the one hand, in obtaining flow data and the state of rivers, especially in ungauged basins, and, on the other, in increasing risk awareness.

This research has been done in the framework of the Flood2Now project, Grant PLEC2022-009403 funded by MCIN/AEI/10.13039/501100011033 and by the European UnionNextGenerationEU/PRTR. 


References:

Gaume, E., Llasat M.C., et al., 2016. Mediterranean extreme floods and flash floods. Into Hydro-meteorological extremes, chapter 3, The Mediterranean Region under Climate Change. A Scientific Update (coordinated byAllEnvi).133-144. ISBN : 978-2-7099-2219-7.

CCS, 2021, Estadística riesgos extraordinarios. Serie 1971-2020. Available at: https://www.consorseguros.es/web/documents/1018/4419/Estadistica_Riesgos_Extraordinarios_1971_2014/14ca6778-2081-4060-a86d-728d9a17c522


How to cite: Guzzon, C., Marcos, R., Llasat, M. C., Llasat-Botija, M., Marinelli, D., Diaz Guilera, A., Mediero, L., Garrote, L., Cabañas Ibañez, A., Arbaizar Gonzalez, J., and Varela, O.: Enhancing flood forecasting and prevention: The multidisciplinary approach of Flood2Now project and its innovative solutions, EGU General Assembly 2024, Vienna, Austria, 14–19 Apr 2024, EGU24-5446, https://doi.org/10.5194/egusphere-egu24-5446, 2024.

Hail is by far the greatest contributor worldwide to insured losses from severe convective storms on an annual basis. Individual outbreaks can cause losses well above EUR 1 bn. In Italy, severe convective storm losses have been dominating the market in the last 5-7 years, with a record of EUR 1.4 bn in 2019 prior to year 2023. On 18-25 July 2023 an unprecedented outbreak brought large hail and strong winds to Lombardy, Veneto, Friuli-Venezia Giulia, Piedmont and Emilia-Romagna, with affected cities including Parma, Turin, Milan and Venice. There were many reports of large hailstones, causing significant damage to property and motor vehicle. The European hail record was breached too. Twice. On 19 July, a hailstone measuring 16 cm in diameter was recorded in Carmignano di Brenta, and broke the previous largest hail record in Europe, which was held by a 15 cm stone found in Romania in 2016. Just five days later, a new record was set, when a 19 cm hailstone was found in the town of Azzano Decimo. This is very close to the all-time largest hail recorded of 20.3 cm, found in 2010 in South Dakota, US. Total loss estimates, of which hail was by far the largest contributor, exceeds EUR 3 bn, of which 70-80% in the property sector (residential and commercial buildings), and the remaining 20-30% in the motor vehicle sector. These were the largest hail events in Italy in recorded history, and the costliest cat event in the third quarter of 2023 for the global insurance market.

Following in the footsteps of the severe convective storm outbreak that impacted France in June 2022, these storms came after a record-hot air mass that languished over Southern Europe much of the week prior. Persistent meteorological conditions conducive to rotating supercell thunderstorms were observed for several consecutive days. These compounded with local conditions favorable for the development of severe hail over the Po Valley. In this study we present a reconstruction of these events based on event reports from European Severe Weather Database. We analyze the synoptic configurations and pre-convective environments that characterized them, with focus on those properties and features that are peculiar to severe hail-forming thunderstorms. We look at different formulations of CAPE and vertical wind shear, as well as composite parameters such as the Significant Hail Parameter and the Supercell Composite Parameter. We make use of Gallagher Re’s Severe Convective Storm Index to contextualize these events historically, and to discuss climate change trends over Northern Italy. Finally, we discuss the implications that such events and their expected frequency under climate change have on the (re)insurance market.

How to cite: Panosetti, D. and Tomassetti, U.: The July 2023 Northern Italy hailstorms from a climatological and (re)insurance market perspective, EGU General Assembly 2024, Vienna, Austria, 14–19 Apr 2024, EGU24-5962, https://doi.org/10.5194/egusphere-egu24-5962, 2024.

The consensus of climatic research indicates that the likelihoods of extreme precipitation events are going to change significantly, but specific trends depend on the type of dominant weather system, and regional landscape and climate details. Despite the effort of increasingly accurate and converging global circulation models, the uncertainties in the ensemble of CMIP6 models, and the often course spatial resolution make translation of climate models to actionable information of flood forecasts complex and uncertain. We carried out an analysis of a large ensemble of Global Circulation Models (GCMs) of the CMIP6 ensemble that were downscaled statistically as part of the NASA NEX-GDDP-CMIP6 dataset. The analysis looked at segmented windowed return period analysis using the method of l moments to fit general extreme value distributions to global climate models. With analysis of 1, 3 and 7 day duration, median, 15 and 85 percent quantiles, between 5 and 100 year return period, and global spatial coverage, the results show variations in how precipitation events of various return periods and durational are predicted to change in GCMs, and what the associated uncertainty is for various regions of the world. Intermediate analysis outputs show artifacts in yearly extreme precipitation due to the applied statistical downscaling, but relative factors to be used in precipitation scaling under climate change resolves these. Average increases in precipitation extremes of percent are observed globally (+5.1%), with many local outliers for the SSP585 scenario in 2050 (e.g. regions such as the Himalayan region (+23.4 percent median), the Sahel region(+21.6%) or South-Western Spain (-3.9%)). The other SSP scenarios change the global average factors to +3.75% and +4.32% for SPP245 and SSP370 Respectively. Very low variability in the changes is observed for return periods, indicating that the intensity probability curves shift uniformly in the model output. Precipitation events duration does more significantly alter the analysis outputs, and various areas show differences here that correlate with flash and fluvial flood susceptibility. Finally, we open-source the analysis code and link the output as a built-in dataset in the fastflood.org rapid flood simulation platform. Here, automatically derived extreme precipitation events from era5 datasets can be rescaled under climate change conditions by applying the scaling factors derived in this work.

How to cite: van den Bout, B.: Global changes in extreme precipitation linked with rapid flood simulation tools, EGU General Assembly 2024, Vienna, Austria, 14–19 Apr 2024, EGU24-7617, https://doi.org/10.5194/egusphere-egu24-7617, 2024.

EGU24-8116 | ECS | Posters on site | NH1.2

IMERG-E and IMERG-L: A Comprehensive Evaluation of the Medicane Daniel in Thessaly, Greece 

Evangelos Leivadiotis, Silvia Kohnová, and Aris Psilovikos

On 4 September 2023, the area of Thessaly (Greece) experienced a catastrophic flood as a result of the Daniel hurricane sequence. This severe phenomenon is characterized by extreme rainfall records ranging from 305 mm to 1096 mm between 4 and 7 September, causing severe damage to infrastructure, agriculture and buildings. Seventeen casaulties were recorded. The aim of the study is to complete the integrated multi-satellite harvesting of the Global Precipitation Measurement Mission (IMERG) using 10 precipitation stations distributed in the Thessaly region. Specifically, two precipitation products (IMERG-E and IMERG-L) were used to evaluate the early and late extreme precipitation events of IMERG version 7. In order to obtain the rainfall data needed for the research, a time period of 4 September 2023 (0000UTC) to 7 September 2023 (2330UTC) was chosen. This window corresponds to the approximate time at which Daniel's storm convective zone was on the area of interest. The National Meteorological Agency collected six of the ten precipitation stations and four of the Public Electricity Agency. The evaluation process was divided into two parts: the first part aimed at estimating the total rainfall of IMERG-E and IMERG-L, and the second part aimed at estimating the total daily rainfall of both products. Two statistical assessment indicators were used: the Pearson correlation coefficient and the root mean square error (RMSE) to quantitatively assess the performance of satellite precipitation products using rain-gauge data. Firstly, the correlation coefficient between IMERG-E, IMERG-L and total precipitation at IMERG-E, IMERG-L and IMERG-L is -0.03 and 0.27, respectively. Early products did not correlate with ground data, but later versions showed weak positive linear relationships. The RMSE values are 0.8 and 0.52, respectively. The daily analyses of IMERG-E showed moderate negative correlations on September 4 (-0.29), September 5 (-0.15), and September 7 (-0.25), and moderate positive correlations on September 6 (0.37). In terms of daily performance, the correlation coefficients suggest weak positive correlations (0.22 in 4 September, 0.13 in 5 September, 0.23 in 7 September), with the exception of -0.3 in 6 September. RMSE values remain low (0.31 on 4 September, 0.34 on 5 September, 0.20 on 7 September), except for 6, September, where values (0.95) indicate high levels of error. Overall, the late version is more efficient than the early version, but there are rooms for improvements when the IMERG final version will be available.

How to cite: Leivadiotis, E., Kohnová, S., and Psilovikos, A.: IMERG-E and IMERG-L: A Comprehensive Evaluation of the Medicane Daniel in Thessaly, Greece, EGU General Assembly 2024, Vienna, Austria, 14–19 Apr 2024, EGU24-8116, https://doi.org/10.5194/egusphere-egu24-8116, 2024.

EGU24-9412 | Orals | NH1.2

Extratropical intrusions and their role in tropical flood events: A South Pacific perspective 

Romain Pilon, Andries de Vries, and Daniela Domeisen

Extratropical Rossby waves are a potential source of instability for driving convective disturbances in the tropics. In the South Pacific, island nations are subject to flooding associated with such convective disturbances, yet these have not been conclusively linked to any large-scale processes. Using an object-based approach, this study specifically explores in particular how Rossby waves propagating into the tropics can contribute to the formation of extratropical-tropical cloud bands, which can cause flooding events. These cloud bands are associated with substantial precipitation events and serve as easily detectable proxies to identify when such intrusions occur. Building upon this foundation we use ERA5 reanalysis along with a detection analysis for tropical-extratropical cloud bands and potential vorticity streamers and cutoffs to establish a climatology of such intrusions and cloud bands. This allows us to demonstrate the statistical association of extratropical intrusions with intensified deep convection, in particular over the tropical central South Pacific. We find that these intrusions contribute significantly to the occurrence of floods in the Polynesian islands. In summary, this study allows us to connect the interaction between the extratropics and the tropics with flood events in the South Pacific.

How to cite: Pilon, R., de Vries, A., and Domeisen, D.: Extratropical intrusions and their role in tropical flood events: A South Pacific perspective, EGU General Assembly 2024, Vienna, Austria, 14–19 Apr 2024, EGU24-9412, https://doi.org/10.5194/egusphere-egu24-9412, 2024.

EGU24-10058 | ECS | Orals | NH1.2

Detection of past extreme precipitation events and connection to recorded impacts: a multi-data and multi-method assessment over the Central-Eastern Alps 

Katharina Enigl, Alice Crespi, Sebastian Lehner, Klaus Haslinger, and Massimiliano Pittore

Extreme hydro-meteorological events are increasingly observed in southern Europe and especially in the European Alps, where they threaten ecological and socio-economic systems. To detect such events and analyse the changes in their occurrence, a proper definition of an extreme event is needed. Statistically, we define extremes from the tails of the probability distributions. However, these events are not necessarily extreme in terms of impact, and impact-related thresholds may vary spatially and temporally, i.e., single absolute thresholds do not necessarily reflect the extremes at all locations, in all time periods and all seasons. Moreover, the availability of harmonized and consistent datasets is crucial for investigating extremes in a transnational context. In this study, we focus on the identification and characterisation of extreme hydro-meteorological events affecting a transboundary Alpine region between Austria and Italy from 2003 to 2021 based on different definitions of extreme events considering spatiotemporal aspects and multiple datasets. Daily accumulated precipitation is used as the main proxy parameter to describe the potential for severe consequences, as it as it is the most broadly available quantity across different datasets compared to e.g., sub-daily precipitation sums. Moreover, its role as a triggering factor for various hazards (e.g., landslides, debris flows, pluvial and fluvial floods) is widely recognised. We analyse three different statistical methods for the detection of extreme events: (i) the identification of the highest daily precipitation amounts on a regional scale, (ii) the detection of daily precipitation values of high intensity on a local scale and (iii) the identification of exceptional daily precipitation records not in absolute terms but with respect to average conditions associated to a specific period of the year. All detection algorithms are applied to four gridded precipitation datasets, including both observation and reanalysis products, with different technical specifications. Subsequently, identified events for each method-dataset combination are blended with existing records of gravitational mass movements and fluvial floods in the Austrian-Italian border region to analyse the suitability of each combination to detect actual occurred impacts. First results indicate that most detected precipitation extremes relate to actual observed impacts (e.g., 74% for regional scale identification with reanalysis data). However, different method-dataset combinations have different strengths and weaknesses, which reflect inherent characteristics of the dataset and/or of the statistical method employed. Furthermore, some combinations show lower performance in detecting impactful events, because the dataset and method applied conflict with each other (e.g., a coarse-resolution dataset not resolving local-scale features conflicts with a statistical method searching for locally high intensities). The findings could contribute to better inform civil protection authorities about risks related to extreme hydrometeorological events, possibly affected by climate change.

How to cite: Enigl, K., Crespi, A., Lehner, S., Haslinger, K., and Pittore, M.: Detection of past extreme precipitation events and connection to recorded impacts: a multi-data and multi-method assessment over the Central-Eastern Alps, EGU General Assembly 2024, Vienna, Austria, 14–19 Apr 2024, EGU24-10058, https://doi.org/10.5194/egusphere-egu24-10058, 2024.

EGU24-10451 | Posters on site | NH1.2

Influence of Design Storm Profiles on Flood Peak Discharge in a Small River Catchment 

Kazimierz Banasik, Leszek Hejduk, Adam Krajewski, Donald E. Woodward, Andrzej Wałęga, and Beniamin Więzik

Estimations of flood peak discharges of low probability of exceedance are required for designing and maintaining hydraulic and road structures (reservoirs, weirs, water intakes, bridges, culverts) as well as for flood protection, including assessment of the risk of flooding. Rainfall-runoff models are usually the only alternative for such estimations in case of small catchments, as there is a lack of sufficient, good quality historic data to be used for applying the traditional i.e. statistical methods. The aim of this study was to check responses of a small agro-forested, lowland catchment located in center of Poland to rainfall of assumed probability of exceedance and of three profiles of intensity (i.e. a/ constant intensity, b/ asymmetric one with highest intensity between 0.3 and 0.5 its duration, c/ symmetric one with single peaked intensity) and various storm duration.

A regional formula, developed by state hydrological service, on relationship of intensity-duration-frequency, applicable also for region of center of Poland, has been used to find rainfall depths of the events with probability of exceedance of 1% (return period of 100 years) and various duration (i.e. D = 6, 12, 18, 24, 30, 36, 42, 48, 60 and 72 h), as input data for runoff hydrograph simulation. As the catchment, which area is 82.4 km2, has long term monitoring history, the model parameters, as Curve Number of NRCS (Natural Resources Conservation Service), used for extracting the effective rainfall (direct runoff) from total rainfall depth and parameters of Nash model, used for transformation of effective rainfall into direct runoff hydrograph, were estimated from recorded rainfall-runoff events. Over 50-year-continuous discharge record allowed us to estimate the 100 year flood, by applying statistical method for the investigated catchment, as 25,6 m3/s which form a base for comparison of the results of application of the rainfall-runoff model.

Results of modelling of the of rainfall-runoff process indicate: a/ that critical rainfall duration (producing highest peak discharges) of the three storm profiles were between 24 and 60 hours, and b/ higher peak discharges at critical rainfall durations of the three storm profiles than one of statistical method. The differences (overestimates) were from 1.6% for the constant intensity to 30.0% for the symmetric single peaked intensity.

How to cite: Banasik, K., Hejduk, L., Krajewski, A., Woodward, D. E., Wałęga, A., and Więzik, B.: Influence of Design Storm Profiles on Flood Peak Discharge in a Small River Catchment, EGU General Assembly 2024, Vienna, Austria, 14–19 Apr 2024, EGU24-10451, https://doi.org/10.5194/egusphere-egu24-10451, 2024.

EGU24-10531 | Orals | NH1.2

Evaluating Standard Precipitation Index (SPI) using MIROC6 historicclimate simulations and ERA 5 reanalysis data as a tool to map theimpacts of climate change in rainfall regime in Brazil 

Gean Paulo Michel, Aimée Guida Barroso, Franciele Zanandrea, Márcio Vinicius Aguiar Soares, Gabriel Ferreira Subtil de Almeida, Marcio Cataldi, Priscila Esposte Coutinho, Lívia Sancho, and Vitor Luiz Galves

Rising global average temperatures, as a consequence of climate change, have worsened the occurrences of extreme weather events, causing disruptions in rainfall patterns around the world. In Brazil, such effects are already observed with the increase of heat waves, floods, droughts, and wildfires. The correlation between disruptions in precipitation patterns and fires is complex, nevertheless, the intensity, frequency, and duration of drought events have significant impacts on fuel flammability and fire behavior. Drought monitoring is particularly relevant in Brazil, where the vast majority of forest fires have an anthropogenic ignition and prolonged dry periods favor such fires to spread out of control. The Standardized Precipitation Index (SPI) is one of the most important tools used to evaluate precipitation variability, offering simple yet robust statistical information on the distribution, duration, and frequency of rainfalls and, consequently, droughts. The SPI uses precipitation as input data to standardize the deviation of cumulated rainfall from the mean of historical precipitation, detecting water deficit (negative values) or water surplus (positive values) for a given location. In doing so, this index allows direct spatial comparability between arid and humid regions. This is an advantageous characteristic when drought analysis is applied to a country with different regional rainfall regimes, such as Brazil. The applicability of SPI as a source of drought prediction was investigated by observing its performance with historical climate simulations of the 6th phase of the Model for Interdisciplinary Research on Climate (MIROC6) and the fifth generation ECMWF atmospheric reanalysis of the global climate, ERA5. The direct comparison of the SPI data, employing the climatology extending from 1980-2014 in Brazil, derived both from the climate simulation model and the reanalysis data - which combines observations and models – has provided valuable insights. Preliminary results show an overall consistency in the calculated indexes from both sources, which are in line with seasonal regional rainfall patterns in Brazil. On average, the SPI indexes recognize water deficits for the North-east, north of the South-east and central regions of Brazil. During the months of winter, both indexes detect droughts in these regions, with ERA-5 SPI index registering severe droughts in central Brazil. These results suggest that the SPI index calculated using the reanalysis data seems to register droughts with greater severity and longer duration, identifying more precisely periods with little to no rainfall, whilst the SPI derived from the MIROC6 simulation data, although able to acceptably identify and delimitate droughts, records less severity for the same period. These findings are important to recognize the MIROC6-derived SPI index as a valuable tool in drought prediction. However, they also highlight the necessity of acknowledging the limitations of the model regarding the severity of droughts. The understanding and prediction of precipitation anomalies is fundamental to coping with the impacts of climate change on water resources, agriculture, and biodiversity, guiding mitigation and adaptation strategies in Brazil.

How to cite: Michel, G. P., Guida Barroso, A., Zanandrea, F., Aguiar Soares, M. V., Ferreira Subtil de Almeida, G., Cataldi, M., Esposte Coutinho, P., Sancho, L., and Galves, V. L.: Evaluating Standard Precipitation Index (SPI) using MIROC6 historicclimate simulations and ERA 5 reanalysis data as a tool to map theimpacts of climate change in rainfall regime in Brazil, EGU General Assembly 2024, Vienna, Austria, 14–19 Apr 2024, EGU24-10531, https://doi.org/10.5194/egusphere-egu24-10531, 2024.

EGU24-10737 | ECS | Orals | NH1.2

Projecting Extreme Rainfall in Sicily: Integrating Simple Scaling and Hourly Projections into Depth-Duration-Frequency Analysis 

Gaetano Buonacera, David J. Peres, Nunziarita Palazzolo, and Antonino Cancelliere

In this present work, we propose a robust methodology for the derivation of future rainfall depth-duration-frequency curves (DDFs), utilizing hourly projections, the assumption of simple scaling of precipitation, and the application of the method of moments for parameter estimation in dimensionless precipitation height distributions. The methodology introduced herein involves the application of change factors derived from climate projections to precipitation averages across various durations (1, 3, 6, 12, and 24 hours) and to the dimensionless moments of the precipitation series. To implement this methodology, we leverage regional scale models (RCM) from the EURO-CORDEX initiative, characterized by hourly temporal resolution. The direct utilization of hourly projection data allows to bypass the necessity for temporal disaggregation techniques. Change factors are calculated through an analysis of annual maxima derived from both future and control series (1971-2000) generated via RCMs. We consider two distinct emission scenarios, namely RCP (Representative Concentration Pathways) 4.5 and 8.5, spanning three future periods: near future (2021-2050), middle future (2051-2070), and far future (2071-2100). Our methodology is applied to multiple rain gauges located across the Sicily region. The outcomes of our investigation underscore an upward trend in future DDFs, particularly pronounced in the RCP 4.5 scenario and during the far future period. This trend is attributed to an observed intensification in the variability of rainfall events. Depending on the specific geographic location, chosen emission scenario, and future time period, future Depth-Duration-Frequency (DDF) curves may correspond to return periods that more than double those observed in the control climate. The methodology, given the easy availability of the exploited data, can turn useful for updating hydrological design criteria for flood mitigation.  


How to cite: Buonacera, G., Peres, D. J., Palazzolo, N., and Cancelliere, A.: Projecting Extreme Rainfall in Sicily: Integrating Simple Scaling and Hourly Projections into Depth-Duration-Frequency Analysis, EGU General Assembly 2024, Vienna, Austria, 14–19 Apr 2024, EGU24-10737, https://doi.org/10.5194/egusphere-egu24-10737, 2024.

EGU24-10848 | ECS | Orals | NH1.2

Extreme precipitation – temperature scaling: disentangling causality and covariation 

Sarosh Alam Ghausi, Erwin Zehe, Subimal Ghosh, Yinglin Tian, and Axel Kleidon

Warmer temperatures are expected to cause more intense rainfall, primarily due to the rise in atmospheric moisture at the rate of 7%/K, as indicated by the Clausius-Clapeyron (CC) equation. To evaluate this effect, studies use a statistical approach known as precipitation-temperature scaling that involves fitting an exponential regression between observations of extreme rainfall events and local temperatures, resembling how saturation-vapor pressure scales with temperature. However, the estimated sensitivities (also called scaling rates), exhibit notable deviations from the CC scaling (7%/K). These rates remain mostly negative in the tropics as the rainfall extremes exhibit a general monotonic decrease with temperature and “hook-shape” structures in most parts of tropics and mid-latitudes.

Here we show that most of the variability in the observed scaling rates arises from the confounding radiative effect of clouds associated with rainfall events. Clouds substantially reduce the net radiative heating of the surface during the storms by up to 100 W/m2 in the tropics, leading to the cooling of surface temperatures by up to 8K. This cloud-induced cooling results in a covariation between precipitation and local temperature, inducing a two-way causality in the observed scaling rates. To isolate this cooling effect, we used a thermodynamically constrained surface energy balance model and force it with radiative fluxes under both "clear" and "cloudy" sky conditions. We then quantified the changes in surface temperatures due to clouds and remove it from temperature observations during rainy days. After removing this effect, we found positive scaling across the global land areas, closely aligning with CC rates of 7%/K. We demonstrate that cloud radiative effects alone can explain the observed negative and hook-shaped relationships found in precipitation-temperature scaling.

Our findings imply that projected intensification of rainfall extremes with temperature by climate models is consistent with observations after the cloud-cooling effect is corrected for. Our results emphasize on making a clear distinction between causality and covariation by explicitly separating the temperatures before the rainfall event that are shaped by less clouds from temperature during the rainfall event which include clouds. This adds a crucial effect to the debate of interpreting observed precipitation - temperature scaling rates. Furthermore, our methodology of removing cloud effects on temperatures can be extended to estimate climate sensitivities from observations beyond precipitation extremes.

How to cite: Ghausi, S. A., Zehe, E., Ghosh, S., Tian, Y., and Kleidon, A.: Extreme precipitation – temperature scaling: disentangling causality and covariation, EGU General Assembly 2024, Vienna, Austria, 14–19 Apr 2024, EGU24-10848, https://doi.org/10.5194/egusphere-egu24-10848, 2024.

EGU24-11716 | ECS | Posters on site | NH1.2

Tropical Cyclone Rainfall Asymmetries Inferred from GPM-IMERG: A Focus on Lesser Antilles 

Catherine Nabukulu, Janneke Ettema, Victor Jetten, and Bastian van den Bout

Abstract

This study utilizes GPM-IMERG satellite rainfall estimates to assess the asymmetric rainfall patterns in 27 tropical cyclones (TCs) across the Lesser Antilles region from 2000 to 2020. The aim is to evaluate whether there is a persistent relationship between precipitation and wind characteristics, which could support improved TC-related flood risk assessment for these islands. With a focus on hurricane and tropical storm categories, the 30-minute precipitation variability was assessed within a radius of 500 km from the TC’s eye during its path in the study area. In addition, TC’s forward speed and wind characteristics, like  TC’s category and the extent of 34-knot winds (R34), are included. The analysis reveals temporal trends, indicating increased TC rainfall events in the study area during the second decade. Correlations show positive relationships between rainfall total (RT), rainfall area (RA), and rainfall intensity at the 90th percentile (RI0.9), with RT and RI0.9 showing the strongest link in the majority of the observations. Contrary to conventional assumptions, this research challenges the idea that highest category TCs in the wind intensity always produce higher rainfall, as we see that higher-category hurricanes such as H4 (209-251km/hr) and H5 (>=252km/hr) were often associated with lower rainfall values in RT and RI0.9 compared to tropical storms (63 - 118 km/hr). Tropical storms, like higher-category hurricanes, can display large rainfall areas. In addition,  quadrant analysis of rainfall zones around the TC eye highlights that the NE and SE quadrants in TC have significantly more rainfall impact. However, it also reveals the danger posed by weaker quadrants in wind characteristics such as SW and NW, as they can exhibit high rainfall values in RA and RT. The study indicates complex, non-linear relationships between TC’s wind and precipitation characteristics in the Lesser Antilles region. Incorporating the rainfall variability observed in TC dynamics into early warning systems and risk assessment is essential for a more effective emergency response and mitigation planning.

General methodology

The satellite rainfall estimates were obtained within a defined buffer of a diameter of 500km around the TC eye while following the TC trajectory. The buffer was further dissected into quadrant spatial zones  (NE, SE, SW and NW) to provide a detailed perspective on rainfall distribution in different parts of the TC impact area. For each eye position, rainfall characteristics (RT, RA and  RI0.9) were computed for the whole buffer and later individual quadrant partitions. The computed rainfall characteristics were then investigated for potential correlation relationships with the TC wind intensity. In addition, quadrant rainfall patterns were analyzed for persistence throughout the TC duration.


How to cite: Nabukulu, C., Ettema, J., Jetten, V., and van den Bout, B.: Tropical Cyclone Rainfall Asymmetries Inferred from GPM-IMERG: A Focus on Lesser Antilles, EGU General Assembly 2024, Vienna, Austria, 14–19 Apr 2024, EGU24-11716, https://doi.org/10.5194/egusphere-egu24-11716, 2024.

EGU24-12191 | ECS | Posters on site | NH1.2

Prediction and predictability of drought events in the Spree region 

Clara Hauke, Uwe Ulbrich, and Henning Rust

The predictability of drought events in the Spree region is analyzed, aiming at developing hydrological extreme events forecast and warning systems and long-term solutions regarding sustainable, interdisciplinary and integrated water resources management in the project SpreeWasser:N.

Predictors acting as potential indicators of imminent drought risk are inferred from statistical analyses, modeling and literature. Connections between certain states of the atmosphere (large-scale weather patterns) and local drought events are drawn, focussing mainly on agriculture as a user group. Special attention is paid to the succession of certain weather patterns and their impact on precipitation.

A drought forecast based on k-nearest neighbor regression is being developed using an algorithm which automatically selects the meteorological variables and regions yielding the largest forecast skill as input predictor variables during a hindcast period. This machine learning approach supports the discovery of underlying physical links in atmospheric phenomena.

The analysis and software development is based on ECMWF ERA5 reanalysis data and the objective weather type classification by the German Weather Service (DWD), spanning the years 1980 to 2021.

How to cite: Hauke, C., Ulbrich, U., and Rust, H.: Prediction and predictability of drought events in the Spree region, EGU General Assembly 2024, Vienna, Austria, 14–19 Apr 2024, EGU24-12191, https://doi.org/10.5194/egusphere-egu24-12191, 2024.

Tornadoes represent major meteorological hazards, in terms of damages to buildings, vehicles and structures and casualties. Because of their small space scale (order of 1km or less), duration (order of 1000s), strongly nonlinear and chaotic dynamics, tornadoes cannot be reproduced in operational weather prediction and climate models. It is important to develop approaches overcoming this limitation and capable of delivering reliable early warnings by civil protection services and estimating whether frequency and strength of tornadoes will change because of anthropogenic climate change. Recently, a probabilistic approach has been developed that resulted in analytical expressions of the probability of tornadoes occurrence based on meteorological parameters that can be extracted from weather prediction and climate models, such as WMAX (updraft maximum parcel vertical velocity, linked to the Convective Available Potential Energy CAPE), WS700 (the wind shear in the lower troposphere), LCL (the lifting condensation level), SRH900 (low-level storm relative helicity). An example is the formula log10(P)=-6.6+WMAX/(3.1+5.2 · WMAX/WS700), which is meant to describe dependence of probability P of occurrence of a tornadoes  on the surrounding environmental conditions and to distinguish among conditions with low and high probability. In this study this and similar formulas are applied to hindcasting the probability of tornadoes using ERA5 data. The purpose is to assess the skill of the method for operational prediction and explore its validity for climate change studies.

The methodology supporting this formula is extensively described in Ingrosso, R., Lionello, P., Miglietta, M. M., and Salvadori, G.: Brief communication: Towards a universal formula for the probability of tornadoes, Nat. Hazards Earth Syst. Sci., 23, 2443–2448, https://doi.org/10.5194/nhess-23-2443-2023, 2023.

How to cite: Lionello, P. and Muhammadi, A.: Testing the skill of an analytical expression for the probability of occurrence of tornadoes, EGU General Assembly 2024, Vienna, Austria, 14–19 Apr 2024, EGU24-12741, https://doi.org/10.5194/egusphere-egu24-12741, 2024.

EGU24-15012 | ECS | Orals | NH1.2

Drought projections and associated uncertainties over the Arabian Peninsula from CMIP6 models 

Md Saquib Saharwardi, Hari Prasad Dasari, Waqar Ul Hassan, Harikishan Gandham, Raju Pathak, Karumuri Ashok, and Ibrahim Hoteit

Drought frequency and severity have increased over the water-stressed Arid regions. This research employs multiple CMIP6 global climate models (GCMs) for projecting droughts over the Arabian Peninsula (AP) until the end of the 21st century. We utilized the standardized precipitation index (SPI) and standardized precipitation evapotranspiration index (SPEI) to generate projected future statistics of droughts along with uncertainties assessment from inter-model spread, scenarios, timescale, and methods therein.

For this purpose, after a meticulous analysis, we first identify the most suitable GCMs for better representation of AP's drought spatiotemporal pattern over the historical period (1985-2014). Our results indicate an increase in potential evapotranspiration (PET), which dominates simulated drought statistics relative to the precipitation. The projected evolution of the SPEI, which is derived from both precipitation and PET, indicates droughts  consistently increasing from low to high emission scenarios, In contrast, the SPI, owing to relatively-weaker amplification of the precipitation shows a moderately increasing wetness, except for a few northern regions where both indices evolve in agreement The fidelity of the simulated precipitation by many models over the historical period is also relatively poor compared to the PET, which may also be potentially adding to the uncertainties. In general, the principal sources of uncertainty in drought projections evolve from the choices of index, followed by scenarios, and inter-model variability, whereas methods and timescale mostly impact the magnitude of the trend in drought statistics.  

How to cite: Saharwardi, M. S., Dasari, H. P., Hassan, W. U., Gandham, H., Pathak, R., Ashok, K., and Hoteit, I.: Drought projections and associated uncertainties over the Arabian Peninsula from CMIP6 models, EGU General Assembly 2024, Vienna, Austria, 14–19 Apr 2024, EGU24-15012, https://doi.org/10.5194/egusphere-egu24-15012, 2024.

EGU24-15295 | Orals | NH1.2

Creation of an automatic workflow for a National Flood assessment in Aotearoa New Zealand 

Alice Harang, Emily Lane, Cyprien Bosserelle, Rose Pearson, Celine Cattoën-Gilbert, Trevor Carey-Smith, Hisako Shiona, Sam Dean, Raghav Srinivasan, Graeme Smart, and Matt Wilkins

To manage current flood hazard and help develop climate change adaptation strategies, the government-funded project “Mā te haumaru ō ngā puna wai: Increasing flood resilience across Aotearoa” aims to better understand flood hazard and risk across all Aotearoa New Zealand, now and in the future. A crucial part of this project is the generation of nationally consistent flood maps across the whole country for the current climate and future climate projections.

First, the workflow requires as input the identification of independent floodplains. Each floodplain will be associated to its catchment and be considered a computational unit. For each domain, a design storm is generated for a given scenario (Annual Exceedance Probability, climate projection, antecedent conditions) or an historical storm is used for validation purposes. The runoff and flow routing of streams and rivers on the steep part of the catchment are simulated with the NIWA TopNET model (McMillan et al. 2016). Used uncalibrated, this hydrological model was modified to include a physically realistic soil conductivity and provide a consistent response between gauge and ungauged catchments. The model is spun up to an average base flow with consistent soil and ground water antecedent conditions. The design storm is then run through the model to provide realistic flow boundary conditions to the hydrodynamic model in the populated lower catchment. Before the inundation modelling, the spatial maps are generated, using the GeoFabrics suite (Pearson et al. 2023), across the lower catchment, based on the latest LiDAR data available and complementary databases such as OpenStreetMap for infrastructure. This process produces a hydrologically conditioned DEM (Digital Elevation Model), including waterways opening and a basic riverbed estimation, associated to a roughness length map. Finally, the flood is simulated using the hydrodynamic model BG_Flood (Bosserelle et al. 2022). The model is a GPU-enabled inundation model using a modern shock-capturing St Venant solver. The model uses a quadtree type mesh that is well suited for GPU computation and allows iterative refinement of the mesh. A first coarse resolution run is used to define the expected flood extent. This flood extent and external data such as stop bank locations, is then used to produce a refinement map defining areas where higher resolution is needed. The model is then run a second time using the variably refined mesh.

Figure 1: Scheme of the cascade of model used to develop consistent flood maps in Aotearoa New Zealand.

This workflow has been validated on several historic flood events including a fluvial flood in Westport, ANZ (56h duration, 60-year flood), a fluvial and pluvial flood in Waikanae, ANZ (12h duration, 80-year flood) and the floods in the Hawkes Bay and Tairāwhiti regions (ANZ) following the Tropical Cyclone Gabrielle in February 2023 (over 100-year flood in some areas).

This workflow is based on open-sources tools; it is modular and automated for continual improvement, to enable data update and to facilitate the creation of new scenarios.

How to cite: Harang, A., Lane, E., Bosserelle, C., Pearson, R., Cattoën-Gilbert, C., Carey-Smith, T., Shiona, H., Dean, S., Srinivasan, R., Smart, G., and Wilkins, M.: Creation of an automatic workflow for a National Flood assessment in Aotearoa New Zealand, EGU General Assembly 2024, Vienna, Austria, 14–19 Apr 2024, EGU24-15295, https://doi.org/10.5194/egusphere-egu24-15295, 2024.

EGU24-15755 | ECS | Orals | NH1.2

The September 2023 flood in Derna, Libya: an extreme weather event or man-made disaster? 

Elad Dente, Moshe Armon, and Yuval Shmilovitz

Storm Daniel, the deadliest recorded Mediterranean tropical-like (medicane) storm, led to severe floods in large parts of the eastern-central Mediterranean, including Greece and northern Libya. Extreme rainfall, reaching more than 400 mm day-1, triggered a flash flood in Wadi Derna (Libya)– an ephemeral river with a drainage area of 575 km2 that crosses the city of Derna at its outlet to the Mediterranean Sea. Historical measures to mitigate flood risks included dam construction in the Wadi Dernah basin since the 1970s. However, during Storm Daniel, at least two of the dams were breached, resulting in a devastating flood that inundated much of the city of Derna, with over 4,000 casualties, 8,000 missing persons, and the displacement of tens of thousands. The devastating event was the focus of media coverage for a long time, but questions regarding the role of dams and their collapse remain open, and are relevant for other dammed regions as well: How extreme was the storm? How extreme the flood would have been if the dams had not been breached? What would the outcomes of the flood look like if dams were not built in the first place?

To analyze the characteristics of the storm over Wadi Derna, the catchment’s hydrological response, and the impact of the flood on the city of Derna, we integrate various datasets and models. Satellite-based precipitation estimations (IMERG) were used to quantify spatiotemporal storm properties and the catchment-scale rainfall, which were fed into the KINEROS2 hydrological model to quantify surface runoff upstream of the collapsed dams. The modeled flood hydrograph is then fed into a 2D hydraulic model (HEC-RAS) to test three end-member scenarios: (a) dam filling, overflow, and collapse, (b) dam overflow but no collapse, and (c) no dams exist in the wadi. This combination of methods reveals that the peak discharge during the flood was ~1,400 m3 s-1, just below the expected maximum extreme flood for this region. In the dam-collapse scenario, the populated flooded area is 40% larger than the no-dam scenario. These results emphasize the anthropogenic influence of damming natural streams on flood impacts. Given the high variability of precipitation in arid and semi-arid areas and the projected increase in extreme precipitation intensity with climate change, the Wadi Derna flood should serve as a warning sign for other populated areas downstream of a man-made dam in similar environments.

How to cite: Dente, E., Armon, M., and Shmilovitz, Y.: The September 2023 flood in Derna, Libya: an extreme weather event or man-made disaster?, EGU General Assembly 2024, Vienna, Austria, 14–19 Apr 2024, EGU24-15755, https://doi.org/10.5194/egusphere-egu24-15755, 2024.

EGU24-16370 | ECS | Posters on site | NH1.2

Analysis of historical flood events in Denmark with information from digital news media 

Jonas Wied Pedersen, Peter Steen Mikkelsen, and Michael Brian Butts

Reliable information on historical flood events is critical for flood risk analysis, climate change adaptation, verification of forecast models, etc. Unfortunately, such information is often difficult to find, due to e.g. lack of monitoring equipment at the location of a flood. In Denmark, management of water has traditionally been the responsibility of local authorities, which means there is a limited national overview of historical events and their consequences. Previous studies have employed different strategies for compiling a flood event inventory, including mining information from (1) insurance data, (2) social media data, and (3) newspaper archives. The aim of this study is to exploit a comprehensive digital news media archive to compile an inventory of Danish flood events in the period 2007-2020 with information on the time and location of the event, to classify the type of flood, and note any available information on local consequences and damages.

We have gained access to the company Infomedia’s large digital media archive, which consists of digitized articles from news sources ranging from major national newspapers to small, local outlets. The archive contains more than 75 million news articles with the earliest articles dating back to 1990. The archive is searchable through calls to an API with a custom search language that combine user-specified keywords. A hydrologist has read all articles that match the keywords, noting all the relevant information.

1,118 distinct flooded locations where identified over the 14-year period of 2007-2020. Results show that there is large year-to-year variability in the different types of floods. Urban pluvial floods are experienced somewhere in Denmark every single year, while the number of both fluvial and storm surge floods are very low (or entirely missing) in some years. Urban pluvial floods occur throughout the year but are highly concentrated in the summer months with a mean date of occurrence in late July, while storm surges are observed only between September and March with a mean date in mid-December. Fluvial floods are the least concentrated type of floods and occur throughout the year with a slight overweight in winter months (mean date in early January). The spatial distribution of floods is uneven with four out the 10 municipalities that experience the highest number of floods being located in Eastern Jutland (Vejle, Horsens, Kolding, Aarhus) and another four located in the Northern half of Zealand (Copenhagen, Roskilde, Gribskov, Holbæk).

Storm surge events occur over large geographical areas and we therefore speculate that they are more likely to be reported in news media than urban pluvial floods, which are often local events due to the small-scale nature of convective rainfall cells. Ongoing work is trying to quantify these aspects and validate the individual flood events in the inventory using additional data sources.

How to cite: Pedersen, J. W., Mikkelsen, P. S., and Butts, M. B.: Analysis of historical flood events in Denmark with information from digital news media, EGU General Assembly 2024, Vienna, Austria, 14–19 Apr 2024, EGU24-16370, https://doi.org/10.5194/egusphere-egu24-16370, 2024.

EGU24-16614 | Posters on site | NH1.2

A 172-year Drought Atlas for Romania  

Mihai-Gabriel Cotos, Monica Ionita, Catalin-Constantin Roibu, Adrian-Bogdan Antonescu, Petru-Cosmin Vaideanu, and Viorica Nagavciuc

In this study, we have created a 172-year historic drought catalogue for Romania by applying both the Standardized Precipitation Index (SPI) and the Standardized Precipitation Evapotranspiration Index (SPEI) to 16 long-term meteorological records/stations, covering the period 1852 – 2023. The long-term meteorological records together with documentary sources (e.g., newspapers, meteorological archives) spanning the last 172 years, are used to analyze the spatio-temporal patterns of variability, trends, and potential drivers of drought conditions, thus contributing to a nuanced understanding of Romania's hydroclimatic conditions over time. The results based on the SPEI point to the fact that the southern and eastern parts of Romania are becoming drier due to an increase in the potential evapotranspiration and mean air temperature, especially after the 1990’s. By contrast, the SPI drought index does not reveal these changes in the drought variability, mainly due to the fact that the precipitation does not exhibit a significant change. Five major drought-rich periods, in terms of duration and severity, were identified at the country level from 1852–2023, based on SPEI: 1866 – 1867, 1918 – 1920, 1947 – 1948, 2000 – 2001, and 2019 – 2022, respectively. The most pronounced drought event occurred during 2019 – 2022, followed by the 1866 – 1867 event. When analyzing the SPI-based events, similar results are found over the period 1852 – 1980, but the drought event from 2019 – 2022 is not captured by the SPI index. The most pronounced drought event, based on SPI, is the 1866 – 1867 event, followed by the 1919 – 1920 event. Nevertheless, due to the influence of the Carpathian Mountains, there are also strong regional differences in the drought events and their magnitude, with the southern and eastern parts of Romania being more affected by long-lasting drought events compared to the north-western part. Highlighting the above, a Drought Atlas for Romania (1852 – 2023) was developed using long-term meteorological data, which can provide comprehensive information on drought occurrence, magnitude and impacts over a period that goes beyond the currently available products.

How to cite: Cotos, M.-G., Ionita, M., Roibu, C.-C., Antonescu, A.-B., Vaideanu, P.-C., and Nagavciuc, V.: A 172-year Drought Atlas for Romania , EGU General Assembly 2024, Vienna, Austria, 14–19 Apr 2024, EGU24-16614, https://doi.org/10.5194/egusphere-egu24-16614, 2024.

EGU24-17041 | ECS | Orals | NH1.2

Evaluation of the performance of hydrological model LISFLOOD using the ECMWF seasonal meteorological forecast at 1arcmin-1day spatiotemporal resolution over German catchments 

Edgar Fabian Espitia Espitia, Yanet Diaz Esteban, Fatemeh Heidari, Qing Lin, and Elena Xoplaki

Floods and their devastating effects on society and economy have increased dramatically in Germany, and Europe in recent years. At the end of 2023, rivers and streams across Germany burst their banks due to heavy rainfall, affecting property, transport and power supplies and necessitating rescue operations and evacuations to protect human lives. One measure to deal with flooding and safeguard lives and property is the implementation of early warning systems, such as the European Flood Awareness System (EFAS), which provides short-term hydrological forecasts in real time. However, preparedness is essential along the responders value chain and longer term forecasts are important to anticipate, take precautions, raise awareness and generally mitigate the effects of flooding. The objective of this study is to evaluate the performance of hydrological forecasting using the seasonal meteorological forecast at a spatio-temporal resolution of 1 arcmin and day over Germany including all transboundary catchments for the period from 1990 to 2020. The hydrological model used was LISFLOOD. In the first step, LISFLOOD was calibrated using the meteorological observations, the EMO 1arcmin dataset and the discharge data from the transnational hydrological portal for all federal states and neighboring countries. The characteristics of land use, land cover, soil, groundwater, and human activity referred to as surface fields for global environmental modelling, were provided by EFAS. The second step, downscaling of the seasonal (long-term) forecast meteorological forcing to 1arcmin, is performed using a Deep Residual Neural Network (DRNN), and a bilinear interpolation approach over the seasonal forecast information of atmospheric conditions up to seven months into the future provided by the European Center for Medium-Range Weather Forecasts (ECMWF), 25 ensemble members in total. In the third step, the discharge is simulated by feeding the LISFLOOD model with two meteorological forcing scenarios, the DRNN downscaled and the bilinear approach of the seasonal meteorological forecast, to finally compare the performance with the observed runoff using the modified Kling-Gupta efficiency criteria (KGE'). The calibrated and validated LISFLOOD parameters showed a good and acceptable performance in all catchments, KGE' between 0.6 and 0.9. The DRNN downscaling technique shows a promising result, providing a good agreement between downscaled and observed dataset. Finally, the hydrological performance, KGE', is expected to be improved by 0.05 to 1 in the hydrological stations with good and poor performance, respectively, by using the DRNN downscaled seasonal forecast.

How to cite: Espitia Espitia, E. F., Diaz Esteban, Y., Heidari, F., Lin, Q., and Xoplaki, E.: Evaluation of the performance of hydrological model LISFLOOD using the ECMWF seasonal meteorological forecast at 1arcmin-1day spatiotemporal resolution over German catchments, EGU General Assembly 2024, Vienna, Austria, 14–19 Apr 2024, EGU24-17041, https://doi.org/10.5194/egusphere-egu24-17041, 2024.

EGU24-18684 | ECS | Orals | NH1.2

Modeling Uncertainty of Copula-based Joint Return Period of Flood Events under Climate Change 

Ankita Manekar and Meenu Ramadas

Modeling the joint behavior of flood characteristics under climate change is necessary for understanding the potential changes in associated flood risk and hazards. In this study, we assessed the changes in flood duration, peak, and volume between historical and future periods through copula-based flood frequency analysis, employing the Soil and Water Assessment Tool (SWAT) hydrological model for modeling flood risk in a tropical watershed (Govindpur) lying in eastern India. Observed streamflow at the watershed outlet is obtained for the baseline period (1990-2014) for flood analysis. A suitable copula model is selected for bivariate flood frequency analysis while assuming copula parameters vary between baseline and future periods under climate change. In this study, high-resolution (12-km) climate reanalysis dataset from the Indian Monsoon Data Assimilation and Analysis (IMDAA) and future climate projections from general circulation models (BCC-CSM2-MR, MPI-ESM1-2-HR) after downscaling and bias correction, are used for simulating flood events using SWAT. The use of high-resolution climate data for hydrological modeling and flood frequency analysis is a novel aspect of the presented study. Uncertainty in the estimation of joint return periods of flood events under climate change due to climate model selection and assumption of stationarity is also quantified in this study for the near future (2041-2070) period under the shared socio-economic pathway (SSP585) scenario. Among the GCMs used, BCC-CSM2-MR performed relatively better in simulating baseline period streamflow in the study watershed. In this study, the Clayton copula is obtained as the most suitable based on its lowest Akaike information criterion (AIC) value, and joint return periods are then derived with the help of a conditional copula. It is found that flood events are projected to become more severe in the near future; the flood peak value increased by more than 90%, while the duration is projected to decrease. Flood volume may likely double in the future, as per our analysis, suggesting the need for mitigation and precautionary measures to reduce flood risk in the watershed. Based on the analysis, uncertainty in flood return period estimation under changed future climate is to be accounted for extreme event studies, and that can aid in managing and minimizing the flood-associated risks.

Keywords: Climate Change, Flood Frequency Analysis, Soil and Water Assessment Tool, Copula, General Circulation Model, Uncertainty Analysis

How to cite: Manekar, A. and Ramadas, M.: Modeling Uncertainty of Copula-based Joint Return Period of Flood Events under Climate Change, EGU General Assembly 2024, Vienna, Austria, 14–19 Apr 2024, EGU24-18684, https://doi.org/10.5194/egusphere-egu24-18684, 2024.

The flood events in Germany during the summer of 2021 have once again brought to the forefront the challenges in translating scientific knowledge into effective disaster risk management practices. This paper examines the critical gap between the scientific understanding of flood risks and the practical needs of those who manage these risks. We delve into the limitations of current scientific approaches, such as flood risk and hazard mapping, in fully addressing the complexities and nuances required for practical disaster risk management, especially in the face of uncertain climate change impacts. We examine the dynamics of how flood risk information, inclusive of uncertainties, is perceived and acted upon, highlighting the psychological factors influencing these processes. The paper discusses the challenges and opportunities in translating scientific risk assessments and forecasts into practical, actionable strategies for communities and stakeholders. By highlighting the disconnects and potential areas for improvement in the science-practice interface, this paper seeks to foster a more coherent and comprehensive approach to disaster risk management. Within the framework of the Safe Development Paradox, the importance of communicating uncertainties and evaluating their potential impacts on planning and emergency responses is discussed. This paper addresses uncertainties at multiple levels and for different stakeholders, highlighting the integration of uncertainty information as a vital step in preparing for surprises and ambiguities in the context of extreme meteorological and hydrological events induced by severe weather and climate change.

How to cite: Höllermann, B.: Navigating Uncertainty in Flood Risk Perception in the Context of Climate-Induced Extremes , EGU General Assembly 2024, Vienna, Austria, 14–19 Apr 2024, EGU24-18692, https://doi.org/10.5194/egusphere-egu24-18692, 2024.

EGU24-19701 | Orals | NH1.2

Counterfactual floods: What if the storm track would have taken a different path? 

Bruno Merz, Viet Dung Nguyen, Guse Björn, Li Han, Xiaoxiang Guan, Oldrich Rakovec, Luis Samaniego, Bodo Ahrens, and Sergiy Vorogushyn

When a flood disaster occurs, there is an opportunity for affected individuals and decision-makers to learn from the experience. However, this learning tends to be narrowly focused on the specific event, missing the chance to discuss and prepare for even more severe or different events. For instance, regions that have been spared from havoc might feel safe and underestimate the risk. We suggest spatial counterfactual floods to encourage society to engage in discussions about exceptional events and appropriate risk management strategies. We create a series of floods across Germany by spatially shifting the rainfall fields of the 10 most expensive floods, arguing that past storm tracks could have occurred several tens of kilometers away from their actual paths. The set of spatial counterfactual floods generated includes events that are more than twice as severe as the most devastating flood in Germany since 1950. Our approach obtains peak flows that exceed the current flood-of-record at more than 70% of the gauges (369 out of 516). Spatial counterfactuals are proposed as an easy-to-understand approach to overcome society's unwillingness to consider and prepare for exceptional floods, which are expected to occur more frequently in a warmer world.

How to cite: Merz, B., Nguyen, V. D., Björn, G., Han, L., Guan, X., Rakovec, O., Samaniego, L., Ahrens, B., and Vorogushyn, S.: Counterfactual floods: What if the storm track would have taken a different path?, EGU General Assembly 2024, Vienna, Austria, 14–19 Apr 2024, EGU24-19701, https://doi.org/10.5194/egusphere-egu24-19701, 2024.

EGU24-19897 | Orals | NH1.2

Long-Term Trends and Drivers of Hailstorms in Switzerland 

Lena Wilhelm, Olivia Martius, Katharina Schröer, and Cornelia Schwierz

Climate change affects the severity and frequency of extreme meteorological events, including hailstorms. In this regard, it is imperative to understand the factors driving the intra- and interannual variability of hailstorms. In Switzerland, this remains insufficiently understood. To address this knowledge gap, our study conducts a long-term analysis to identify potential drivers and precursors of Swiss hailstorm variability. Due to the lack of long-term data on Swiss hailstorms, we developed statistical models reconstructing hail days from 1959 to 2022, utilizing radar-based hail observations and environmental data from ERA-5. Our hailday time series shows a statistically significant positive trend in yearly hail days in both southern and northern Switzerland. This trend is mainly attributed to heightened atmospheric instability and moisture content evident in recent decades' ERA-5 data. Noteworthy natural variability is observed in both regions. To delve into the large-scale mechanisms influencing Swiss hail activity, our study uses composites to explore potential drivers and precursors. Those include soil moisture conditions, sea surface temperature anomalies, large-scale variability patterns (Piper and Kunz 2017), central European weather types (e.g., Rohrer et al. 2018), cold fronts (Schemm et al. 2015, 2016), and atmospheric blocks (e.g. Barras et al. 2021). 

How to cite: Wilhelm, L., Martius, O., Schröer, K., and Schwierz, C.: Long-Term Trends and Drivers of Hailstorms in Switzerland, EGU General Assembly 2024, Vienna, Austria, 14–19 Apr 2024, EGU24-19897, https://doi.org/10.5194/egusphere-egu24-19897, 2024.

EGU24-19970 | ECS | Posters on site | NH1.2

Freva for ClimXtreme: helping to systematize holistic analysis of extreme events 

Etor E. Lucio-Eceiza, Christopher Kadow, Martin Bergemann, Andrej Fast, and Thomas Ludwig

Climate change is responsible for more extreme weather situations with damaging consequences. Public interest projects such as ClimXtreme [1, 2] were conceived to improve our knowledge on extreme events, the role of climate change, and their impacts. Focusing on an integrated approach, ClimXtreme evaluates the physical processes behind the extremes, their statistical assessment and their societal impact. On its second phase ClimXtreme [3] aims to open up its findings to a wider stakeholder base of different kinds.

Frameworks such as Freva (Free Evaluation System Framework [4, 5]) offer an efficient solution to handle customisable evaluation systems of large research projects, institutes or universities in the Earth system community [6-8] via the HPC environment and in a centralised manner. Mainly written in Python, Freva offers:

  • Centralised access. Freva can be accessed via command line interface, web, and a Python module with similar functionality.
  • Standardised data search. Freva allows quick and intuitive integration and searching of multiple, centrally stored data sets.
  • Flexible analysis. Freva provides a common interface for user-defined data analysis routines to be plugged into the system, regardless of the programming language. These plugins are able to search from and integrate their own results back into Freva. This environment enables an ecosystem of plugins that promotes the exchange of results and ideas between researchers, and facilitates the portability to any other research project using a Freva instance.
  • Transparent and reproducible results. Every analysis run through Freva (including parameter configuration and plugin version information) is stored in a central database and can be viewed, shared, modified and re-run by anyone within the project. Freva optimises the use of computing and storage resources and paves the way for traceability in line with the FAIR data principles [9].

The Freva instance of ClimXtreme (XCES [7]), hosted at DKRZ, provides fast access to more than 10 million data files from models (e.g. CMIP, CORDEX), observations (e.g. ERA5, HYRAS, stations) and plugin outputs. The ClimXtreme community has actively contributed plugins to XCES, its biggest asset, with nearly 20 plugins of different disciplines available to all within the project.

We would like to show a practical application of the capabilities of XCES by using it to systematise the characterisation (e.g. return periods, severity, co-occurrence...) of several past extreme events extracted from the ClimXtreme Phase 1 catalogue. Such an application can be extended to create workflows focused, for example, on the rapid assessment of the analysis of currently occurring events, allowing a quicker response to stakeholders or the public in general.


References:

[1] https://www.fona.de/de/massnahmen/foerdermassnahmen/climxtreme.php

[2] https://www.climxtreme.net/index.php/en/

[3] https://www.fona.de/de/aktuelles/nachrichten/2023/231207_ClimXtreme_Phase_2_b.php

[4] http://doi.org/10.5334/jors.253

[5] https://github.com/FREVA-CLINT/freva-deployment

[6] freva.met.fu-berlin.de

[7] https://www.xces.dkrz.de/

[8] www-regiklim.dkrz.de

[9] https://www.go-fair.org/fair-principles/


How to cite: Lucio-Eceiza, E. E., Kadow, C., Bergemann, M., Fast, A., and Ludwig, T.: Freva for ClimXtreme: helping to systematize holistic analysis of extreme events, EGU General Assembly 2024, Vienna, Austria, 14–19 Apr 2024, EGU24-19970, https://doi.org/10.5194/egusphere-egu24-19970, 2024.

EGU24-20455 | Posters virtual | NH1.2

Investigating the effects of initial soil moisture and the uncertainty of Manning friction coefficient on flood hazard estimation and mapping. 

Athanasios Loukas, Anastasios Katsiolas, and George Papaioannou

Floods are among the most devastating water-related hazards and are primarily responsible for the loss of human life and destruction of the natural and man-made environment. This study addresses the estimation and mapping of flood hazard in small mountain watersheds with urban areas at the lowlands and the related uncertainty. Specifically, this research studies the flood hazard for the Metropolitan city of Volos in Central Greece, which is frequently affected by intense storms that cause flash floods. The above study area is crossed by three (3) streams.The methodology used in the study is divided into three stages. At first the 24-hour design storm hydrographs were constructed for the three sub-basins of the study area with using the mean IDF parameters and the relevant confidence limits. The Alternating Block Method was used for the design hyetographs for return periods, T = 50-year, T=100-year and T=1000-year (worst-case scenario). The second stage concerns the hydrological analysis using a rainfall-runoff model. Firstly, the net rainfall was estimated by using the U.S. Soil Conservation Service (SCS-CN) method for three (3) soil's Antecedent Moisture Conditions (AMC) for dry-average-wet conditions. Then, the net rainfall was transformed by using the Instantaneous Unit Clark hydrograph into discharge and the flood hydrographs for each return period were estimated. At the final stage, the flood hydrograph estimated for each watershed was routed through the hydrographic network using the HEC-RAS 2D hydraulic-hydrodynamic simulation (2D) model.  For the flow routing, Manning’s n was estimated for various cross sections by visual inspection and corresponding values reported in international reports. The “upper” and “lower” boundaries of Manning’s n were estimated as the -50% and +50% of the average Manning’s n values, respectively. In this simulation approach, flood hazard maps for three return periods, T=50, T=100 and T=1000 years considering three different soil moisture conditions and three different values of Manning’s n have been estimated. The values of Manning’s n in the flood plain were estimated by using land cover/land use data.  The flow routing with in the urban areas was simulated by the block rising method. In total twenty-seven (27) flood scenarios have been simulated for each watershed. The results were validated with the flooded areas during a specific historical flood event using the Critical Success Index (CSI) method and reports and photographs of the historical flood event. The results of hydrological analysis and hydraulic simulation were also compared with the results of the Greek Flood Hazard Management Plans.

How to cite: Loukas, A., Katsiolas, A., and Papaioannou, G.: Investigating the effects of initial soil moisture and the uncertainty of Manning friction coefficient on flood hazard estimation and mapping., EGU General Assembly 2024, Vienna, Austria, 14–19 Apr 2024, EGU24-20455, https://doi.org/10.5194/egusphere-egu24-20455, 2024.

EGU24-22160 | Posters on site | NH1.2

Novel approach to quantifying long-term rainfall distribution variation: the region of Europe 

Andrew Barnes and Ioanna Stamataki

Climate change is changing rainfall and flood regimes across the world with severe and widespread impacts on society. Rainfall extremes are intensifying in frequency and magnitude due to the effects of climate change, and thus in this research, we introduce a new, novel framework for understanding how rainfall distributions are changing through time, enabling more accurate flood risk analysis. The framework offers two approaches to comparing rainfall distributions, the first of these utilises a stagnant benchmark distribution and the second highlights a moving benchmark approach. When combined the framework enables the identification of significant sudden and gradual changes in the distributions without the need to fit statistical distributions to the data.

 The region of Europe is selected as the case study and analysed in the four UN regions of Europe: Northern Europe, Eastern Europe, Southern Europe, and Western Europe. Using daily precipitation data generated using the ERA5 Reanalysis hourly data from the ECMWF’s Copernicus data store, the case study is used to highlight the capability of both frameworks to capture different forms of rainfall distribution shift.

 Comparing the frameworks presented revealed similar long term changes in the rainfall variation. The stagnant comparison showed that rainfall distributions have intensified since 1940 with a clear increase across all four regions of Europe regarding the percentage of days with rainfall, averaging at 2.75% across Europe. The largest changes seen are in the last comparison period for Eastern Europe (1960-1975) at 3.07% and in the latest comparison period (2005-2020) for Northern Europe (2.64%). The moving comparison method unveiled the strongest changes between the periods 1940-1960 and 1960-1980 with an average of 2.09% of rainfall days being intensified across all Europe. The most considerable shifts in rainfall variability occurred in Eastern (2.39%) and Western Europe (2.72%) during the 1960-1980 period.

 By applying it over the European region, this paper demonstrated how this novel approach can be used to identify long-term rainfall variation in the 20th century. The suggested frameworks do not rely on fitting statistical distributions and thus enable both long and short term change identification, providing flood risk managers a new solution to understanding local, regional and global rainfall variability and quantification. The analysis of the changing dynamics of precipitation patterns and the increase of the intensity of precipitation events, offers considerable potential for further investigations in the mitigation strategies of a resilient future.

How to cite: Barnes, A. and Stamataki, I.: Novel approach to quantifying long-term rainfall distribution variation: the region of Europe, EGU General Assembly 2024, Vienna, Austria, 14–19 Apr 2024, EGU24-22160, https://doi.org/10.5194/egusphere-egu24-22160, 2024.

The intensification of extreme precipitation in a warming climate has been shown in observations and climate models to follow approximately theoretical Clausius-Clapeyron scaling. However, larger changes have been indicated in events of short-duration which frequently trigger flash floods or landslides, causing loss of life. Global analyses of continental-scale convection-permitting climate models (CPCMs) and new observational datasets will be presented that provide the state-of-the-art in understanding changes to extreme weather (rainfall, wind, hail, lightning) and their compounding effects with global warming. These analyses suggest that not only warming, but dynamical circulation changes, are important in the manifestation of change to some types of extreme weather, which must be addressed in the design of new CPCM ensembles. We use our projections to provide the first analyses of impacts on infrastructure systems using a new consequence forecasting framework and show the implications for adaptation. It will be argued that a shift in focus is needed towards examining extreme weather events in the context of their ‘ingredients’ through their evolution in time and space. Coupled with exploration of their causal pathways, sequencing, and compounding effects – ‘storylines’ –, this can be used to improve both early warning systems and projections of extreme weather events for climate adaptation.

How to cite: Fowler, H.: Rapidly intensifying extreme weather events in a warming world: how important are large-scale dynamics in generating extreme floods?, EGU General Assembly 2024, Vienna, Austria, 14–19 Apr 2024, EGU24-22472, https://doi.org/10.5194/egusphere-egu24-22472, 2024.

EGU24-502 | ECS | Posters on site | AS1.26

Synoptic-dynamical view of droughts in the southern Murray-Darling Basin of Australia 

Chenhui Jin, Michael Reeder, Ailie Gallant, Tess Parker, and Michael Sprenger

Australia is a country prone to drought and has experienced several severe droughts in its recent history. Most studies have linked large-scale modes of variability to Australian droughts, whereas few studies investigate droughts from the perspective of weather systems. In the current study, a wide range of weather systems (cyclones, anticyclones, fronts, warm conveyor belts, potential vorticity streamers, and cut-off lows) are investigated in association with heavy rainfall days that are important to meteorological drought in the southern Murray-Darling Basin. Two distinct phases (development and recovery) of drought are identified based on the standardised precipitation index.

This study shows that heavy rainfall days produce less rain during the development phase of drought in the southern Murray-Darling Basin, compared to the recovery phase. The rainfall reduction in the development phases is mainly due to a reduction in the frequency and intensity of rainfall associated with warm conveyor belts. On heavy rainfall days, warm conveyor belts are less frequent and weaker in their strength in the vicinity of the southern Murray-Darling Basin during drought development, whereas they are more frequent, intense, and persistent over this region during recovery from drought. Moreover, the spatiotemporal evolution of rainfall is consistent with the ascending branch of warm conveyor belts, supporting the importance of warm conveyor belts to rainfall.

Regarding the source of moisture on heavy rainfall, there is a notable decrease in moisture transport over the Coral Sea during the development of drought, whereas strong moisture divergence is identified in this region during the recovery phase.

How to cite: Jin, C., Reeder, M., Gallant, A., Parker, T., and Sprenger, M.: Synoptic-dynamical view of droughts in the southern Murray-Darling Basin of Australia, EGU General Assembly 2024, Vienna, Austria, 14–19 Apr 2024, EGU24-502, https://doi.org/10.5194/egusphere-egu24-502, 2024.

EGU24-526 | ECS | Orals | AS1.26 | Highlight

Elevation-dependent characteristics of widespread rainfall extremes along the Western Ghats 

Reji Mariya Joy Kooran, Ramesh Vellore, Hamza Varikoden, Gokul Tamilselvam, and Raghavan Krishnan

Deciphering the rainfall trends over the Western Ghats situated along the west coast of India has been the subject of several recent studies. However, less attention is rendered, particularly to understanding the spatial characteristics of atmospheric features associated with widespread and elevation-dependent extreme rainfall occurrences over this region and this study intends to provide some insights into this aspect. This study observes a rising trend in extreme rainfall events over the Western Ghats during the 1979–2020 period, consistent with earlier investigations. The extreme rainfall events on the windward side located below and above 500 m above sea level exhibit different background circulation signatures, such as mean wind speeds of low-level jets and moist static stability. The extreme rainfall events seen below [above] 500 m above sea level occur in the backdrop of mesoscale [large-scale] monsoon circulation. A Froude number analysis further elucidates the importance of Western Ghats foothill topography in complementing the development and spatial segregation of extreme rainfall occurrences.

How to cite: Kooran, R. M. J., Vellore, R., Varikoden, H., Tamilselvam, G., and Krishnan, R.: Elevation-dependent characteristics of widespread rainfall extremes along the Western Ghats, EGU General Assembly 2024, Vienna, Austria, 14–19 Apr 2024, EGU24-526, https://doi.org/10.5194/egusphere-egu24-526, 2024.

EGU24-1516 | Posters on site | AS1.26

Application of Forward and Backward Atmospheric Dispersion Models using Measurements 

Kyung-Suk Suh, Sora Kim, Kihyun Park, Byung-Il Min, Yoomi Choi, Jiyoon Kim, Min-Chae Kim, Hyeonjeong Kim, and Kyeong-Ok Kim

A Lagrangian atmospheric dispersion model has been developed to predict the behavior of pollutants released into the air 
from the unexpected accident of the industrial or nuclear power plants. The random walk method in Lagrangian model is adopted in the dispersion model for the estimation of the atmospheric concentration distribution of the released pollutants. The basic advantages of that method are the simplicity, flexibility and the ability to produce relatively accurate results. In three-dimensional space, a particle transport due to the advection and the turbulent diffusion. And the movement of the particle is represented by the sum of the movements due to the advection and the turbulence. 
In the model, the atmospheric dispersion is evaluated by the motion of fictitious particles consisting of a deterministic part due to the mean wind 
and a stochastic part related to the turbulent flow. Forward and backward atmospheric models based on Lagrangian approach were applied to estimate unknown source regions and release rates of pollutants released into the air from unexpected accidents. 
Simulated results were compared with the measurements of a field tracer experiment performed at the Yeonggwang nuclear power plant in Korea in May 1996. The release point was first determined by using the backward dispersion model, and a unit release approach was used to estimate the release rates of the tracer at the release point. Calculated forward dispersion patterns are well presented the transport patterns by westerly wind. 
The time-varying concentrations were also simulated at the sampling points. Although, measurements and simulations for time-varying concentrations generally agreed, some discrepancy appeared due to the insufficient measurements of wind data during the experiment.

How to cite: Suh, K.-S., Kim, S., Park, K., Min, B.-I., Choi, Y., Kim, J., Kim, M.-C., Kim, H., and Kim, K.-O.: Application of Forward and Backward Atmospheric Dispersion Models using Measurements, EGU General Assembly 2024, Vienna, Austria, 14–19 Apr 2024, EGU24-1516, https://doi.org/10.5194/egusphere-egu24-1516, 2024.

EGU24-1719 | Orals | AS1.26 | Highlight

Spatial-temporal variation of winter warm spells in Italy over the period 1993-2022  

Annalisa Di Bernardino, Anna Maria Iannarelli, Stefano Casadio, and Anna Maria Siani

Global warming and the associated climate change, unequivocally attributable to human activities and greenhouse gas emissions, will very likely intensify in the near future, resulting in the increased occurrence of extreme weather events, such as heatwaves. Summer heatwaves are widely studied to explore their thermodynamic precursors and their effects on health and natural ecosystems, while winter warm spells (WWS), defined by the Expert Team on Climate Change Detection and Indices (ETCCDI) as “a sequence of at least six consecutive days when the daily maximum air temperature exceeds the calendar day 90th percentile of the probability density distribution of the reference period", are still scarcely studied.

In this contribution, the temporal and spatial variability of WWS that occurred over the Italian Peninsula during the period 1993-2022 is investigated. The identification of WWS is carried out by examining the wintertime (December, January, February) maximum daily temperatures measured in eight Italian airport sites, belonging to different Köppen-Geiger climatological classes.

The WWS events involving the whole Italian territory or only northern/central/southern Italy are detected. It is interesting to note that although exceeding the 90th percentile of the daily maximum temperature is quite frequent, only one winter warm spell that affected the entire Italian territory is detected over the period 1993-2022. In the period under investigation, the synoptic conditions associated with WWS over Italy or a portion of the peninsula are, on average, characterised by anticyclonic systems centred on the western Mediterranean, responsible for persistent high-pressure conditions over Italy, subsidence and, therefore, exceptional warming.

Finally, the period length threshold used for the detection of WWS is reduced from six to three days. The outcomes suggest that, in orographically heterogeneous areas such as Italy, the definition of WWS provided by ETCCDI allows for capturing only synoptic scale events, losing information on moderate warm spells, which can have important implications on health and natural ecosystems. Therefore, for regional studies on complex terrain, it would be advisable to reduce the time threshold for the identification of WWS to three days.

This study is supported by the Boundary layer Air Quality-analysis Using Network of Instruments (BAQUNIN) project, funded by ESA, which allowed the establishment of one of the first observatories in the world to involve several passive and active ground-based instruments installed in multiple locations and managed by different research institutions. Moreover, this research is part of the activities envisaged in the “uRban hEat and pollution iSlands inTerAction in Rome and possible miTigation strategies” (RESTART) project, funded by the Italian Ministry for University and Research as a Project of National Interest (PRIN2022). RESTART aims to explore the urban heat island and the urban pollution island in Rome (Italy), providing a series of mitigation strategies, including tailored nature-based solutions, and ready-to-use guidelines for the improvement of well-being and liveability in urban environments.

How to cite: Di Bernardino, A., Iannarelli, A. M., Casadio, S., and Siani, A. M.: Spatial-temporal variation of winter warm spells in Italy over the period 1993-2022 , EGU General Assembly 2024, Vienna, Austria, 14–19 Apr 2024, EGU24-1719, https://doi.org/10.5194/egusphere-egu24-1719, 2024.

EGU24-1839 | ECS | Orals | AS1.26

Low pressure paths and their relation to the variability of extreme wind waves in the Southern Baltic 

Aleksandra Cupial and Witold Cieslikiewicz

Over the Baltic Sea, a semi-closed sea with a complex shoreline, direction of wind and its rapid changes within short time period can have significant influence on the resulting hydrodynamic processes. Highest air pressure gradient and therefore the strongest wind speeds over Baltic are usually the result of low pressure systems moving across the sea or in its vicinity. These events are strongly connected to a large scale atmospheric circulation in Northern Hemisphere and usually are generated over north-western Atlantic.

In this study we examine the meteorological conditions associated with high waves in the Gulf of Gdańsk (southern Baltic Sea). We selected 34 extreme storm events in five distinctly different locations within the area of interest based on the significant wave height (SWH) for years 1958–2001. The analysis of these events will be presented in a separate publication. Based on the 1-hour atmospheric pressure fields over north-eastern Europe, we traced the trajectories of low pressure centres for each storm event. These trajectories were subsequently classified based on their common characteristics and the impact they exert on the wind wave field in the region.

We identify and analyse four cyclone paths: two representing the most common trajectories (P1 and P2) associated with extreme wind wave conditions in the Gulf of Gdańsk, and two unique trajectories (P3 and P4) that occurred only once during the analysed period. Trajectories P3 and P4 are highly atypical for storm events in the area.

Path P1 is characterised by a low pressure centre moving from west to east across Scandinavia and through the Baltic, a pattern arising from zonal circulation that dominates the region. Storms generated by lows travelling along this path are among the most severe in the Gulf of Gdańsk, with SWH reaching nearly 9 m. Path P2 typically originates over the Norwegian Sea, following a NW-SE trajectory across the Baltic. This path has been infrequently considered in relation to wind waves in the southeastern Baltic, more commonly being associated to storm surges along the eastern Polish coast.

Path P3 features a low pressure system moving northward in the Atlantic, along the western coast of the Scandinavian Peninsula. During this particular storm (12–14 January 1984) the lowest SWH was recorded out of all 34 analysed events. The low pressure system following path P4 (9-12 April 1986) moved south of the Baltic Sea along the W-E trajectory. Its relative position to the Gulf of Gdańsk resulted in different wind directions compared to those in storms following path P1. At one of our selected analysis points, northeastern winds have the longest fetch. Therefore it is not surprising that this storm generated the highest significant wave height at this location for the entire study period.

This study utilised modelled wind wave and atmospheric data resulting from project HIPOCAS. The meteorological dataset was produced using the REMO atmospheric model (Jacob and Podzun 1997), based on NCEP reanalysis data. The wind wave dataset was created with the WAM wave model (Cieślikiewicz & Paplińska-Swerpel 2008).

How to cite: Cupial, A. and Cieslikiewicz, W.: Low pressure paths and their relation to the variability of extreme wind waves in the Southern Baltic, EGU General Assembly 2024, Vienna, Austria, 14–19 Apr 2024, EGU24-1839, https://doi.org/10.5194/egusphere-egu24-1839, 2024.

EGU24-2294 | Posters on site | AS1.26

Studying Western North Pacific High Activity in Relation to the East Asian Summer Monsoon Using GK-2A Data 

Jieun Wie, Jae-Young Byon, and Byung-Kwon Moon

The Western North Pacific High demonstrates a close association with the East Asian Summer Monsoon. By employing GK-2A satellite data, we categorized the Western North Pacific High into three types and analyzed how the distinctive features of each type correlated with East Asian Summer Monsoon. The analysis extended from June to August, encompassing the years 2020 through 2023. Additionally, we utilized ERA5, NCEP2, and ASOS data for the same period to compare and complement the findings derived from the satellite observations. By performing empirical orthogonal function (EOF) analysis on the cloud amount data obtained from GK-2A observations over East Asia, we identified three primary modes: the first, second, and third modes denoting unimodal patterns, tropical influences, and high-latitude influences, respectively. Notably, the second mode is correlated with the northward movement of the East Asian rain bands attributed to the westward expansion and intensification of the western subtropical high. Moreover, there is a discernible lag relationship, PC1 precedes PC2 and PC2 precedes PC3. Consistency between the results obtained from ERA5 and NCEP2 data is evident across all modes, except for EOF1. These findings collectively underscore the potential of this study to detect variations in the Western North Pacific High and their impact on the East Asian Summer Monsoon.

Acknowledgement: This research was supported by “The Technical Development on Weather Forecast Support and Convergence Service using Meteorological Satellites” of the NMSC/KMA (KMA2020-00121) and the National Research Foundation of Korea (NRF) grant funded by the Government of Korea (MSIT) (No. 2022R1A2C 1008858)

How to cite: Wie, J., Byon, J.-Y., and Moon, B.-K.: Studying Western North Pacific High Activity in Relation to the East Asian Summer Monsoon Using GK-2A Data, EGU General Assembly 2024, Vienna, Austria, 14–19 Apr 2024, EGU24-2294, https://doi.org/10.5194/egusphere-egu24-2294, 2024.

EGU24-2332 | ECS | Orals | AS1.26 | Highlight

Velocity inlet variation impact on flooding in underground spaces 

Walaa Elhamamy and Guangheng Ni

Underground space floods are a complex type of calamity mainly caused by increasing rainfall and temperature, along with urbanization and population growth necessitating the creation of underground spaces such as subway stations, underground parking lots, underground garages, etc. The causes above have contributed to the frequent and severe appearance of floods in underground spaces in recent decades. The situation is complicated, so further study and research are still needed.

This work applied numerical simulation using Fluent software to investigate, analyze, and compare the impact of altering the magnitude and type of inlet velocities on the underground space's flooding characteristics. Two types of velocities, fixed and transient velocities, were involved in the investigation.

How to cite: Elhamamy, W. and Ni, G.: Velocity inlet variation impact on flooding in underground spaces, EGU General Assembly 2024, Vienna, Austria, 14–19 Apr 2024, EGU24-2332, https://doi.org/10.5194/egusphere-egu24-2332, 2024.

EGU24-2348 | ECS | Orals | AS1.26

Why does extreme precipitation occur in the Philippines during El Niño winters? 

Wen-Jun Zhang and Renguang Wu

As an archipelagic nation, the Philippines is highly vulnerable to the adverse impacts of weather-related hazards, such as extreme precipitation events. Despite the typical dry conditions associated with the warm phase of the El Niño-Southern Oscillation (ENSO) in the tropical Pacific Ocean, extreme precipitation days still occur in the Philippines during boreal winters. This paradoxical occurrence of extreme precipitation days during the typically dry conditions associated with the warm phase of ENSO underscores the complexity of the processes leading to extreme precipitation in this region. It is important to comprehensively understand the mechanisms driving extreme precipitation in the Philippines. In this talk, we will present an analysis of boreal winter extreme precipitation over the Philippines and its associated circulation features from the synoptic scale to the sub-seasonal scale. It is found that tropical cyclones and depressions play a crucial role in resulting in extreme precipitation days in the Philippines during ENSO winters. The tracks of tropical cyclones and depressions show different characteristics in extreme precipitation days between El Niño and La Niña winters. The physical explanation will be provided for the above features based on observational analysis. A parallel analysis for weak precipitation days in the Philippines will be conducted to help understand the conditions for different precipitation events.

How to cite: Zhang, W.-J. and Wu, R.: Why does extreme precipitation occur in the Philippines during El Niño winters?, EGU General Assembly 2024, Vienna, Austria, 14–19 Apr 2024, EGU24-2348, https://doi.org/10.5194/egusphere-egu24-2348, 2024.

EGU24-2526 | ECS | Posters on site | AS1.26 | Highlight

Analyzing the Impact of Typhoon MINDULLE (2116) on South Korea's Extreme Temperatures Using WRF 

Semin Yun, Jieun Wie, Hak-Sung Kim, Jae-Hee Cho, and Byung-Kwon Moon

During October 2021, South Korea experienced an unprecedented heatwave, yet the factors behind it remained elusive. Simultaneously, Typhoon MINDULLE (2116), originating in the Northwest Pacific, approached the Korean Peninsula. The aim of this study was to analyze the influence of Typhoon MINDULLE on the extreme warming in October. Using the Weather Research and Forecasting (WRF) model, we conducted two experiments for comparison: one considering the presence of typhoon (TC) and the other eliminating typhoon (TC-removed). The results showed that temperatures on the Korean Peninsula in the first half of October were 1.35°C higher with TC than with TC-removed. Additionally, the typhoon contributed to enhanced moisture and stronger southerly winds. It intensified warm air advection, leading to the amplified temperatures experienced in South Korea. This study suggests that it is essential to consider typhoons as a significant factor when studying autumn heatwaves.

How to cite: Yun, S., Wie, J., Kim, H.-S., Cho, J.-H., and Moon, B.-K.: Analyzing the Impact of Typhoon MINDULLE (2116) on South Korea's Extreme Temperatures Using WRF, EGU General Assembly 2024, Vienna, Austria, 14–19 Apr 2024, EGU24-2526, https://doi.org/10.5194/egusphere-egu24-2526, 2024.

EGU24-2779 | ECS | Orals | AS1.26

Lagrangian characterization of heat waves: The perspective matters 

Amelie Mayer and Volkmar Wirth

Atmospheric heat waves pose a threat to natural ecosystems and society, which is projected to become more severe due to anthropogenic global warming. However, the mechanisms that determine the formation of heat waves are not yet sufficiently understood. In particular, there is still quite some debate about the relative contribution of three key processes: horizontal temperature transport, adiabatic heating due to subsidence, and diabatic heating. Here, we quantify these processes from a Lagrangian persepctive using a method that provides essential Lagrangian information about the atmospheric flow on an Eulerian grid. The method is based on the advection of passive tracer fields and includes a relaxation term. For each grid point at any time, the method allows us to decompose a temperature anomaly into the effect of horizontal transport across climatological temperature gradients, the combined effect of vertical transport across climatological temperature gradients and adiabatic heating, and the parcel-based diabatic heating. The tracer method thus provides a field-based view on the three processes under discussion. We analyse several recent heat wave episodes and quantify the contributions from horizontal transport, vertical transport, and diabatic heating. We then continue to analyse whether and to what extent these absolute fields are anomalous with respect to their corresponding climatologies. It turns out that the anomaly-based perspective leads to significant differences regarding the relative importance of the various processes compared to the perspective in terms of absolute fields. Our work complements previous studies based on trajectories, which generally considered significantly fewer air masses and did not take into account a climatological background. The results further our knowledge on important mechanisms and drivers of heat waves, which in turn may help to improve their forecasts.

How to cite: Mayer, A. and Wirth, V.: Lagrangian characterization of heat waves: The perspective matters, EGU General Assembly 2024, Vienna, Austria, 14–19 Apr 2024, EGU24-2779, https://doi.org/10.5194/egusphere-egu24-2779, 2024.

EGU24-2940 | ECS | Posters virtual | AS1.26 | Highlight

The linkage between autumn Barents-Kara sea ice and European cold winter extremes 

Di Cai, Gerrit Lohmann, Xianyao Chen, and Monica Ionita

While the Arctic's accelerated warming and sea ice decline have been associated with Eurasian cooling, debates persist between those attributing this to sea ice retreat and those to internal variability. Using the observational data to track month-to-month variabilities, we show that the variability of sea ice over the Barents-Kara Seas in autumn is related to extreme cold winters over much of the European continent. The winter temperature change in Europe is a direct response to a stationary Rossby wave generated by the lower troposphere diabatic heat anomaly as a result of sea ice loss over the Barents-Kara Seas in autumn, leading to a negative phase of North Atlantic Oscillation and more frequent episodes of the atmospheric blocking over Greenland and the North Atlantic. The negative phase of the North Atlantic Oscillation and enhanced blocking are closely related and mutually reinforcing, shaping the spatial distribution of cold anomalies over much of the European continent. Our results suggest a link between the unusual decrease in Barents-Kara Sea ice during autumn and the occurrence of intense European weather extremes in subsequent winter months. Delving deeper into this relationship on monthly time scales can enhance our predictive capabilities for midlatitude extreme events. 

How to cite: Cai, D., Lohmann, G., Chen, X., and Ionita, M.: The linkage between autumn Barents-Kara sea ice and European cold winter extremes, EGU General Assembly 2024, Vienna, Austria, 14–19 Apr 2024, EGU24-2940, https://doi.org/10.5194/egusphere-egu24-2940, 2024.

Midlatitude Europe stands out as a prominent heatwave hotspot, characterized by accelerated upward trends in both summer surface air temperature and heatwave days. Remarkably, these trends surpass the global land average by approximately 2.6 and 2.3 times since 1979. Through dynamic adjustments applied to reanalysis datasets, we found that one-third of these trends resulted from externally forced circulation changes, characterized by a zonal dipolar circulation exhibiting an anticyclonic pattern over Europe. These observed circulation changes are primarily induced by a Rossby wave response triggered by the warming of sea surface temperatures in the North Atlantic, resembling the Atlantic Multidecadal Variability pattern. The ensemble simulations from the sixth phase of the Coupled Model Intercomparison Project indicate that these sea surface temperatures are dominated by the greenhouse gases, with additional contributions from a reduction in aerosols. Additionally, the stronger air temperature response in midlatitude Europe to the reduced aerosols further amplify summer warming, contributing to the rapid increased frequency of heatwave days. These findings offer evidence of important anthropogenic forcing impacts on the rapid surge of heatwaves in Europe, with important implications for potential adaptation strategies and risk management.

How to cite: Yin, Z., Yang, S., and Dong, B.: Amplified Midlatitude European Heatwave Trends Linked to Anthropogenic Forced Atlantic Multidecadal Variability-like Warming and Decreased Aerosol Emissions       , EGU General Assembly 2024, Vienna, Austria, 14–19 Apr 2024, EGU24-3230, https://doi.org/10.5194/egusphere-egu24-3230, 2024.

EGU24-3304 | ECS | Posters on site | AS1.26

Understanding the 2022 heat wave mechanism in the Iberian Peninsula 

So-Hyun Nam, Jeong-Hun Kim, and Maeng-Ki Kim

Recently, the intensity and frequency of heat waves have been increasing worldwide. Especially in 2022, Europe was severely affected by unprecedented heat waves, resulting in about 3,000 deaths in Spain. In this study, we investigate the mechanisms of extreme heat waves in the Iberian Peninsula and examine the differences between the typical heat wave cases and heat waves in 2022. Results show that the Iberian heat waves of 2022 strongly developed during two periods (9−18 June and 8−18 July; P1 and P2, respectively). The typical heat wave cases exhibit wave patterns, but in 2022, a high-pressure anomaly developed over the North Atlantic, blocking the atmosphere and enhancing the heatwave in the Iberian Peninsula. In the P1 period, the lower troposphere in the Iberian Peninsula was moistened, resulting in a water vapor-driven heat dome. In contrast, during the P2 period, the dry atmosphere was heated, causing high temperatures. As a result, the longer-than-normal blocking events over the Iberian Peninsula led to a prolonged heat dome, causing the unprecedented Iberian heat wave.


Keywords: Heat waves, Europe, Iberian Peninsula, blocking, extreme events


Acknowledgment

This research was supported by the Specialized university program for confluence analysis of Weather and Climate Data of the Korea Meteorological Institut (KMI) funded by the Korean government (KMA) and the Korea Meteorological Administration Research and Development Program under Grant KMI (KMI2022-01311).

How to cite: Nam, S.-H., Kim, J.-H., and Kim, M.-K.: Understanding the 2022 heat wave mechanism in the Iberian Peninsula, EGU General Assembly 2024, Vienna, Austria, 14–19 Apr 2024, EGU24-3304, https://doi.org/10.5194/egusphere-egu24-3304, 2024.

EGU24-3763 | Posters on site | AS1.26

Regional frequency analysis of the maximum 5-day precipitation in Slovakia using L-moment approach 

Ladislav Markovič, Pavel Faško, and Oliver Bochníček

Understanding the patterns of extreme precipitation is crucial for effective water resource management, infrastructure design, and flood risk assessment. This study offers a comprehensive analysis of the maximum annual 5-day precipitation totals (Rx5d) in Slovakia using regional frequency analysis (RFA) to elucidate the probabilistic behavior of these events, essential for informed decision-making amid changing climate patterns. We analyzed 70 years (1951–2020) of precipitation data from 419 stations employing the L-moments approach for regional homogeneity testing and frequency analysis. The data were stratified into homogeneous regions using a multi-regression approach and distance matrices, facilitating the development of regional frequency curves. We employed L-moments ratio diagrams and Anderson-Darling goodness of fit tests for extreme-value distributions. Our methodology delineated 14 distinct regions, with the generalized logistic distribution identified as the most suitable approximation for Rx5d in 11 out of the 14 clusters. The study suggests that cluster analysis coupled with L-moments-based regional frequency analysis can effectively derive design rainfall estimates for Slovakia. The developed regional frequency curves are invaluable for estimating return periods of extreme 5-day precipitation events at any location within the study area, proving indispensable for effective flood risk management, infrastructure design, and climate adaptation planning.

How to cite: Markovič, L., Faško, P., and Bochníček, O.: Regional frequency analysis of the maximum 5-day precipitation in Slovakia using L-moment approach, EGU General Assembly 2024, Vienna, Austria, 14–19 Apr 2024, EGU24-3763, https://doi.org/10.5194/egusphere-egu24-3763, 2024.

Extreme precipitation from tropical cyclones (TCs) commonly results in fatalities and expensive property damage in both coastal locations and hundreds of miles inland. Recent studies have found a decreasing trend in TC inner core precipitation and an increasing trend in outer rainband precipitation using about 20 years of precipitation data from satellite products. Most modeling studies that have looked at the response of TC precipitation to climate change found either an increase in the inner core only or an increase in both the inner core and outer rainbands; however, the models were too coarse to resolve detailed TC precipitation structures. This work uses high-resolution Weather Research and Forecasting (WRF) simulations to explore how three-dimensional TC convective structures and precipitation respond to both idealized and more realistic warming scenarios. TCs in the idealized simulations show increasing precipitation in both the TC inner core and outer rainbands with warmer SST, in disagreement with the decrease in inner core precipitation over time in observations. This suggests that either these model simulations are too idealized to simulate the observed decrease in inner core precipitation or the models are missing a key physical process happening in real-world TCs. It also suggests that the disagreements between TC precipitation trends with warming in models and satellite observations are not caused by insufficient model resolution. Results from these idealized simulations will be compared to TCs in 20-year-long historical and future climate runs in regional WRF.

How to cite: Stansfield, A. and Rasmussen, K.: Investigating Changes in Tropical Cyclone Inner Core and Outer Rainband Precipitation in Models under Warming Scenarios, EGU General Assembly 2024, Vienna, Austria, 14–19 Apr 2024, EGU24-4194, https://doi.org/10.5194/egusphere-egu24-4194, 2024.

EGU24-5262 | ECS | Orals | AS1.26

Argentina Breaks Heat Records in the 2022/23 Warm Season: Influence of Synoptic Circulation, Local Feedbacks, and Climate Change 

Soledad Collazo, Solange Suli, Pablo Zaninelli, Ricardo García-Herrera, David Barriopedro, and José M. Garrido-Pérez

The summer of 2022/23 in Argentina marked an unprecedented period with 10 heat wave events (HWs), primarily affecting the central region. This study characterises the four most extensive HWs of that season through synoptic, thermodynamic, and attribution analyses.

Regarding the synoptic conditions, we find that mid-level anticyclonic anomalies were essential for the occurrence of these HWs. Although they exhibited different characteristics, the high-pressure system was quasi-stationary in three of them, while it was transient in the other one. This atmospheric pattern interacted with the South Atlantic Convergence Zone and the South American Low-Level Jet, and played a fundamental role in the amplification of the HWs, providing a warming of ~+2°C (compared to what would be obtained by a random circulation).

The terms of the thermodynamic equation reveal that diabatic processes were the main drivers of daily temperature changes in the analysed HW events. Horizontal advection also made an important (albeit secondary) contribution, particularly during a tropical air mass intrusion over central and northern Argentina.

Local feedbacks were also important for understanding the events. North-central Argentina is a region of strong land-atmosphere coupling, and all HWs were preceded by soil moisture deficits impinged by three consecutive La Niña years. Using the flow-analogue technique, we quantify that the contribution of dry soils to warming was ~1°C (with respect to that of wet soils), suggesting that soil moisture deficits caused an increase in sensible heat fluxes and amplification of warming.

Finally, we find that recent climate change has also exacerbated HW intensities by +0.5 to +1.2°C. Atmospheric circulation patterns similar to those observed during the events cause warmer conditions in the present than in the past, mostly due to temperature trends rather than changes in the intensity of weather systems.

Our analysis reveals that the exceptionally high temperatures were a result of various factors, including the rare occurrence of a three-year La Niña-induced drought. Recent studies suggest that consecutive La Niña events may become more common due to climate change. Northeastern Argentina would be particularly affected by this shift due to its large response to ENSO and land-atmosphere interaction. Additionally, ongoing temperature trends are expected to accelerate, contributing to the intensification of HWs. Consequently, it is expected that similar extreme summers become more frequent in the 21st century.

How to cite: Collazo, S., Suli, S., Zaninelli, P., García-Herrera, R., Barriopedro, D., and Garrido-Pérez, J. M.: Argentina Breaks Heat Records in the 2022/23 Warm Season: Influence of Synoptic Circulation, Local Feedbacks, and Climate Change, EGU General Assembly 2024, Vienna, Austria, 14–19 Apr 2024, EGU24-5262, https://doi.org/10.5194/egusphere-egu24-5262, 2024.

Sub-hourly heavy precipitation events (SHHPs) associated with regional low-pressure (RegL) systems represent a significant natural hazard, frequently causing significant losses over a wide range of natural systems and socioeconomic sectors in mainland Portugal, such as in agriculture (e.g., viticulture). This study provides a preliminary identification of the main dynamic and thermodynamic drivers of the SHHP events associated with RegL systems, also providing a systematised and comprehensive assessment of the atmospheric conditions that are at their genesis. This study uses observations from operational automated surface weather stations (WSs), maintained by the Portuguese Weather Service (Instituto Português do Mar e da Atmosfera, IPMA) for the period 2000–2022 (23 years), with a 10 min temporal resolution, with special emphasis on three weather stations that are representative of the different climatic regions of mainland Portugal. The southern region of Portugal exhibits higher precipitation variability, characterized by a greater occurrence of extreme events on fewer rainy days. The research establishes a connection between SHHPs and low-pressure systems situated to the west of the Iberian Peninsula. These systems display a cold core, especially pronounced at mid-levels, and a positive vorticity anomaly extending from the upper troposphere to lower levels. These conditions induce differential positive vorticity advection in the upper and middle levels (increasing with height), thereby favouring rising motion to the east of the low-pressure systems (over western Iberia). Additionally, these systems facilitate moisture advection over western Iberia at lower levels, highlighted by the positive anomalies of 2-m dew point temperatures and promote instability conditions, diagnosed by different instability indices (Convective available potential energy, Total-Totals index, and K-index). Lastly, the total column cloud ice water revealed higher values for the heavier precipitation events, relative to the values of total column cloud liquid water, suggesting that it may be a useful predictor of such events. The combination of analysed conditions, suggests that some of these SHHPs may be associated with cut-off lows, however, this hypothesis should be validated in a future study.

How to cite: Cruz, J., Belo-Pereira, M., Fonseca, A., and Santos, J.: Analysis of dynamic and thermodynamic drivers linked to heavy sub-hourly precipitation events associated with regional low-pressure systems in mainland Portugal, EGU General Assembly 2024, Vienna, Austria, 14–19 Apr 2024, EGU24-6104, https://doi.org/10.5194/egusphere-egu24-6104, 2024.

Recent studies have shown an increase in frequency and intensity of heavy rainfall (Hev_Ran) events in the Korean Peninsula, located along the eastern coast of the Asian continent, due to global warming. Additionally, several studies have shown that the atmospheric environment and MCS(Mesoscale Convective Systems) causing Hev_Ran in East Asia differs from those in North America and Europe. Therefore, this study aims to reevaluate the possibility of detecting MCS causing Hev_Ran in Korea using 8 instability indices (Inst_Ind) (CAPE, KI, LI, SSI, SRH, SWEAT, TTI, and TPW) derived from rawinsonde data provided by the KMA(Korea Meteorological Administration). Considering the regional, seasonal, and temporal variations of Hev_Ran events in Korea, this study also conducts a detailed investigation on the detection capability of each instability index and optimize thresholds. For the recent ten years (2013~2022) during the rainy season (May~Sep), hourly accumulated precipitation data from the KMA and upper-air observation data from 8 rawinsonde stations in Korea were used for this purpose. While AWS measures precipitation every minute, rawinsonde observes the upper atmosphere twice (00 and 12UTC) or four times (00, 06, 12, and 18UTC) a day depending on the station. Thus, this study defines the collocated data as those AWS data within -2h~+2h temporally and 100km spatially based on Rawinsonde observations. Comparing the Inst_Ind during climate average (Cli_Ave) and Hev_Ran, significant differences were noted for KI, SWEAT, and TPW, with more than 20% differences between Cli_Ave and Hev_Ran for exceeding 30mm/h. However, CAPE, LI, SSI, SRH, and TTI did not show significant differences between Cli_Ave and Hev_Ran. POD and FAR were used to reevaluate the Hev_Ran detection level of the Inst_Ind, and the Hev_Ran detection level of the Inst_Ind was evaluated for various Hev_Ran intensity (30, 40, and 50 mm/h). Thresholds for Inst_Ind were used from the marginally instability levels suggested by KMA or the NOAA. The analysis has indicated usefulness in detecting Hev_Ran using SSI, KI, and TPW showing high POD(0.92~0.98) and FAR(0.91~0.99). However, detection levels using CAPE, LI, SWEAT, SRH were less effective regardless of Hev_Ran intensity, showing low POD (0.32~0.48) and high FAR (0.90~0.98). It was noted that while POD increases with higher Hev_Ran intensity, FAR also increases simultaneously.

This presentation will further detail the optimization of thresholds for Inst_Ind and provide a more detailed presentation of the detection capability of Hev_Ran systems and MCS, segmented by station and time.

This work was funded by the Korea Meteorological Administration Research and Development Program under Grant (RS-2023-00239653)

How to cite: Kim, M. and Suh, M.: Evaluation of the Potential for Detecting MCS Causing Heavy Rainfall in the Korean Peninsula Based on Rawinsonde Data-Derived Instability Indices, EGU General Assembly 2024, Vienna, Austria, 14–19 Apr 2024, EGU24-7082, https://doi.org/10.5194/egusphere-egu24-7082, 2024.

Extreme rainfall events (ERF) and their associated regimes are among the major catastrophes that have a worldwide impact including India which result in large-scale flooding and immense socio-economic loss. During the southwest monsoon season, these extremes are becoming a frequent norm in the hilly and mountainous regions of the country such as Assam which received one of the most historical ERFs during June 14-17, 2022. The present study investigates the ERF implementing the Weather Research and Forecasting (WRF) model using two different land use and land cover data sets (i.e. ISRO and USGS) and three different sets of physical parameterization schemes (i.e. planetary boundary layer, cumulus, and microphysics) with a lead time up to 96 hours. Further ahead, the performance of rainfall in bias-corrected ensembles (BCE) along with a suite of model ensembles is rigorously quantified up to the district level in terms of its intensity, and distribution. Results suggest that among all the ensembles (E1-E10), USGS (E6 - E10) has underestimated rainfall (140-260 mm/day) compared to ISRO (150-280 mm/day), including the heavy rainfall (HR), very heavy rainfall (VHR), and extremely heavy rainfall (EHR) categories over the upper Assam division (UAD) and lower Assam division (LAD) of Assam throughout the 96 hours. Afterward, rigorous statistical analysis in terms of frequency distribution, Taylor diagram, and benchmark skill scores is carried out to elucidate the model biases for all the ensembles. Throughout the 96 forecast hour, BCE E5(E10) is noted with the distinct realistic(underestimated) representation of model rainfall bias over all the subdivisions of Assam. The findings of the present study encapsulate the critical role of the ensembles of physical parameterization schemes, along with proper LULC, and the BCE approach is required to overcome challenges to improve the skills of ERF, particularly over complex terrains of Indian subcontinent such as Assam.

How to cite: Vishwakarma, V. and Pattnaik, S.: Role of Land Use Land Cover and Skilful Prediction of Rainfall Using Bias Corrected Ensemble during Extreme Rainfall Event, EGU General Assembly 2024, Vienna, Austria, 14–19 Apr 2024, EGU24-7096, https://doi.org/10.5194/egusphere-egu24-7096, 2024.

EGU24-7662 | ECS | Posters on site | AS1.26

How to select the right parametric model for daily precipitation ? Impact of distribution tails on goodness-of-fit test 

Philippe Ear, Elena Di Bernardino, Thomas Laloë, Magali Troin, and Adrien Lambert

Modeling the distribution of precipitation data is required in many applications regarding water resource management and planning, such as flood and drought events. A critical step in statistical modeling is to find probability distributions that correctly describe the occurrences and intensities of precipitation. The statistical modeling of daily precipitation via parametric distribution is often done using the Gamma, Pearson Type 3, and Weibull distributions. However, these statistical models used for precipitation have many drawbacks. As these models are either light or heavy-tailed, they are not suited for applications in large areas with varying tail characteristics. Over the last few years, multiple models of probability distributions of precipitation in compliance with extreme value theory on both ends of the spectrum have been developed, such as the Extended Generalized Pareto Distributions (EGPD). In particular, the EGPD family allows for an adaptable distribution that can model both low and extreme precipitations while dealing with the flexibility of modeling light and heavy tails. When it comes to testing the goodness-of-fit of parametric distributions, the Kolmogorov-Smirnov test is often referred to. However, this test fails to detect divergence in the tails of distributions, making it unfit for discriminating between distributions that must be well fitted to extreme precipitation events. A fast and efficient test called the exact Berk-Jones statistical test (also referred to as the Calibrated Kolmogorov-Smirnov test) is investigated. This test allows for theoretically better power for diverging extreme tails. In this study, the exact Berk-Jones statistical test is compared to the classical Kolmogorov-Smirnov test on multiple parametric distributions, including the EGPD, on a 38-year high-resolution grid dataset of daily precipitation over France.

How to cite: Ear, P., Di Bernardino, E., Laloë, T., Troin, M., and Lambert, A.: How to select the right parametric model for daily precipitation ? Impact of distribution tails on goodness-of-fit test, EGU General Assembly 2024, Vienna, Austria, 14–19 Apr 2024, EGU24-7662, https://doi.org/10.5194/egusphere-egu24-7662, 2024.

EGU24-7708 | ECS | Orals | AS1.26 | Highlight

Identifying most extreme heatwaves in Latvia based on a skewed temperature distribution. 

Maksims Pogumirskis and Tija Sīle

Heatwaves are periods of extremely high temperature. They are one of the most hazardous extreme meteorological events for the developed countries. Droughts caused by heatwaves can lead to crop failures. Human mortality due to cardiovascular diseases and drowning significantly increases during heatwaves. High temperatures can lead to infrastructure damage. Electrical grid overload might occur due to high air conditioning use. Railroad tracks expand due to heat, which can lead to irreversible damage. Overall, the longer and more intense is a heatwave, the more impact it has on society. Identifying historical heat extremes and evaluating their return period is important to better prepare for similar events in the future.

In this work historical air temperature observation data in Latvia since 1966 was used to develop a statistical model. The model was used to evaluate yearly cycle of probability distribution of temperature related meteorological variables. Temperature related variables chosen in this work were mean temperature, highest and lowest maximum temperature, highest and lowest minimum temperature. Daily temperature is autocorrelated in time, which makes calculation of return periods of heatwaves different from calculations of return periods of just daily mean temperature. Therefore, distributions of these temperature variables were calculated for periods with length ranging between 1 and 30 days.

Usually, probability distribution functions of meteorological variables are calculated based on the reference period assuming normal distribution. The model used in this study considered downsides of such approach. First, during the summer distribution of daily mean temperature in Latvia is skewed towards high temperatures, therefore normal distribution is not suitable as the probability function. Therefore, in this work skewed Student-t distribution was used for temperature. Second, due to climate change temperature has increased. Therefore, it is more likely that heatwaves are identified in the recent years. To solve this problem, a trend was added to the mean of the probability distribution.

Based on the statistical model most extreme heat events between May and September in Latvia were identified. For the specific event return period is highly dependent on the analysed temperature variable. For example, during July 2021 heatwave record for the highest nighttime temperature was broken (record was broken once again on 6th of August 2023). Such high lowest daily temperature on 21st June has a return period of 4300 years. However, daily mean temperature reached on 21st June 2021 has return period of 186 years and daily maximum temperature has return period of only 41 years.

The most intensive heatwave events were chosen for further analysis to investigate mechanisms that have caused them. Trajectories of air parcels that bring warm air into the region were identified using Lagrangian tracing backwards in time. Air temperature, potential temperature and humidity of air parcels was traced along the trajectories to identify the mechanisms behind the extreme heat. Modelling of the events was performed using WRF to establish issues that arise when forecasting such events.

How to cite: Pogumirskis, M. and Sīle, T.: Identifying most extreme heatwaves in Latvia based on a skewed temperature distribution., EGU General Assembly 2024, Vienna, Austria, 14–19 Apr 2024, EGU24-7708, https://doi.org/10.5194/egusphere-egu24-7708, 2024.

EGU24-8999 | ECS | Orals | AS1.26

Looking under the Lid: Understanding the Influence of Atmospheric Deserts on Heat Wave and Thunderstorm Formation 

Fiona Fix, Georg Mayr, Isabell Stucke, and Achim Zeileis

We introduce the concept of atmospheric deserts, air masses that originated as hot and dry boundary layers in semi-arid or desert source regions. When they are advected to regions with moister and cooler boundary layers, they can cap the local boundary layers, eliminate cloudiness, and lead to the buildup of heat underneath. Heat waves can occur when atmospheric deserts are present over a target region for several days. Thunderstorm formation can be suppressed where the capping lid is strong, but where it is punctured, thunderstorms can erupt violently.

We illustrate this new concept with a case study from mid-June 2022 when an atmospheric desert was advected from its source region in North Africa towards Europe. With the Lagrangian analysis tool (LAGRANTO), approximately 200 million trajectories are traced, tracking the path of the air mass and the development of its properties as it  progresses towards and across Europe over the course of 5 days. By the end of the study period the atmospheric desert extends from the Atlantic to Eastern Europe and as far north as Sweden. k-means-clustering identifies four typical pathways that the trajectories follow. Most of the atmospheric desert air is modified along the way, with exception of one pathway for which air remains well mixed and forms an elevated mixed layer.

Thunderstorms erupted along a line parallel to the northwestern edge along the surface temperature front, but were mainly absent in the core region of the atmospheric desert. A heat wave affected large parts of Europe, from the Iberian Peninsula to Central Europe. Temperatures set new records, for example in some parts of Eastern Germany. Potential temperatures in some locations even became as high as the ones of the overlying atmospheric desert air.

How to cite: Fix, F., Mayr, G., Stucke, I., and Zeileis, A.: Looking under the Lid: Understanding the Influence of Atmospheric Deserts on Heat Wave and Thunderstorm Formation, EGU General Assembly 2024, Vienna, Austria, 14–19 Apr 2024, EGU24-8999, https://doi.org/10.5194/egusphere-egu24-8999, 2024.

EGU24-10903 | ECS | Posters on site | AS1.26

Lagrangian analysis of tracked anticyclonic structures in reanalysis data  

Michael Thomas and Stephan Pfahl

Since heatwaves are among the most impactful natural hazards, a better understanding of the atmospheric processes that drive near-surface temperature extremes may help to mitigate the future outcomes of such events in a warming climate. One common ingredient for mid-latitude summer heatwaves are blocking anticyclones, quasi-stationary and persistent high pressure areas, whose stable and mostly cloud-free conditions can favor the buildup of heat. A strong link between blocking anticyclones and heatwaves has been demonstrated in previous studies, but the physical processes leading to both the near surface temperature extremes and the blocking conditions are still debated. Consequently, the question arises as to what distinguishes blocking high-pressure systems from non-blocking ones and why some lead to near-surface temperature extremes while others do not.
To address this question, a threshold-based tracking algorithm is applied to mid-tropospheric geopotential height anomalies within a 40 year period in ERA5 reanalysis data. The tracking itself is restricted to the extended summer period (MJJAS) and the Northern Hemisphere and the resulting spatio-temporal structures are labeled and classified based on their overlap with regions over Europe marked as (un)affected by blocking or heatwaves. Thus, differences between anticyclones characterized by either atmospheric blocking or temperature extremes or neither / both of them can be subsequently explored.
With the help of Lagrangian backwards trajectories, a detailed view of the origin of near surface air masses within and in the proximity tracked anticyclones is obtained along their path and lifetime. Using a recently published temperature anomaly decomposition method, the physical processes leading to heatwaves (advection, diabatic and adiabatic heating) are explored and and compared to air masses in tracked anticyclones not associated with heatwaves.

How to cite: Thomas, M. and Pfahl, S.: Lagrangian analysis of tracked anticyclonic structures in reanalysis data , EGU General Assembly 2024, Vienna, Austria, 14–19 Apr 2024, EGU24-10903, https://doi.org/10.5194/egusphere-egu24-10903, 2024.

EGU24-12169 | ECS | Orals | AS1.26 | Highlight

Evaluation of WRF Simulations of Snow Storm and Polar Low Over Western Black Sea 

Sinan Sahinoglu and Sevinc Asilhan Sirdas

Snowstorms are the dangerous weather event that effect daily life. In 24th January 2022 Istanbul is affected by a major snow storm, this storm caused financial loses and suspended the both public transportations and flights. For now this phenomena is similar to Polar Lows. Polar Lows are mesoscale phenomena that can produce gust force wind speed, their horizontal scale is 200 to 1000 km, lifetime of Polar Lows last hours to daily scale and they form and intensify in the presence of upper level trough, air-sea or sea-ice temperature difference, potential vorticity anomalies. In this study snowstorm occurred in Western Black Sea will be analyzed using Numerical Weather Prediction model called Weather Research and Forecasting Model and what kind of environment the low developed will be discussed. The upper level cut-off cyclone reached -44 °C in 24 January 2022 which creates a favorable environment for polar low formation and intensifies over the relatively warmer sea. WRF results suggested that wind speed and sea surface temperature minus T500 satisfied the determined criterion for polar lows with 20 m/s and 50 °C respectively. Diabatic processes are another mechanism that enhances the polar lows and, in this study, it is seen they were both equally contributing the polar low and cross sectional analysis showed the warm-core structure and deep moist convection in 24 January 2022 12UTC. However, questions still remaining such as baroclinic instability, condensational heating and other mechanisms that may contribute polar low intensification needs to be investigated comprehensively. From our results the polar low did not intensify because it is not remained over the relatively warm sea long time like the Arctic region and Japan Sea. From our knowledge this is the first study of polar low in Black Sea and it requires more investigation and sensitivity experiments like changing the model parameterization, increasing sea surface temperature etc. to understand polar low structure further more.

How to cite: Sahinoglu, S. and Asilhan Sirdas, S.: Evaluation of WRF Simulations of Snow Storm and Polar Low Over Western Black Sea, EGU General Assembly 2024, Vienna, Austria, 14–19 Apr 2024, EGU24-12169, https://doi.org/10.5194/egusphere-egu24-12169, 2024.

EGU24-12954 | ECS | Posters on site | AS1.26

Extreme Precipitation Events in the Northeast Brazil during the winters of 2022 and 2023 

Matheus Lyra, Dirceu Herdies, Helber Gomes, Maria Cristina Silva, Fabrício Silva, Heliofábio Gomes, Mário Quadro, José Mantovani Jr, William Coelho, Leonardo Calvetti, Silvio Nilo Figueroa, Éder Vendrasco, Jyant Pendharkar, and Pedro Fernandes Neto

This study aims to evaluate the synoptic conditions responsible for two extreme precipitation events development that occurred in the same region on the east coast of Northeast Brazil (NEB) in two different years, on July 1, 2022 (185 mm/24h), and July 7, 2023 (213 mm/24h). These events are becoming increasingly frequent in all regions of Brazil, especially in areas with high population density, associated with significant material and human losses, emphasizing the significance of a deeper comprehension of these events. ERA5 global reanalysis data have been used for synoptic and vertical structure evaluation as a first analysis step. Infrared GOES-16 satellite images have been used to monitor the cloudiness development. Pluviometric stations were used to document accumulated precipitation caused by these events. The following step will consist of conducting very high-resolution simulations using the Model for Prediction Across Scales (MPAS) to assess its ability to represent the circulation patterns associated with the analyzed extreme precipitation events. Both analyzed cases occurred along the eastern coast of the NEB, specifically over the Alagoas state, and were triggered by the same synoptic-scale system, the Easterly Wave Disturbances (EWDs). The trough axis penetrating the study area was observed on both examined dates, with a very characteristic relative vorticity of this tropical disturbance. Despite satellite images in the IR channel indicating lower cloud top temperatures in the first case, thermodynamic diagram data showed a greater vertical development of cloudiness in the second case. Distinct situations were observed when analyzing moisture transport convergence fields. In the first event, moisture convergence intensified over 12 hours, while in the second event, moisture convergence over Alagoas was evident throughout the entire day. This variation can be attributed to the intensification of the subtropical anticyclone during the extreme precipitation event in July 2023, which intensified moisture transport in the region. In general, moisture convergence resulted from the high flow of moisture prevailing over the region combined with upward movements caused by the trough present at low levels, which combined with local factors in the region such as topography, contributed to the increase in rainfall over the study area in both analyzed cases.

How to cite: Lyra, M., Herdies, D., Gomes, H., Silva, M. C., Silva, F., Gomes, H., Quadro, M., Mantovani Jr, J., Coelho, W., Calvetti, L., Figueroa, S. N., Vendrasco, É., Pendharkar, J., and Neto, P. F.: Extreme Precipitation Events in the Northeast Brazil during the winters of 2022 and 2023, EGU General Assembly 2024, Vienna, Austria, 14–19 Apr 2024, EGU24-12954, https://doi.org/10.5194/egusphere-egu24-12954, 2024.

Advection of the cold arctic airmass represents a major cause of severe wind cases in East Slovakia. It is caused by cold and dry airmass separated by orographic barrier, descending, and rapidly flowing on its leeward side. Local open and narrowing topography of the East Slovakia further increase the windspeed in Kosice basin and Zemplin area. Different characteristics of the windspeed and wind gusts were observed when categorizing the situations for cold maritime and continental origin of the airmass. The most representative case studies for each category were analysed using numerical weather prediction model, field observations and reported wind damage. Maritime airmass tends to be defined in deeper vertical profile and its advection is often accompanied by stronger wind gusts, of which some may also by partly convective considering the unstable vertical profile in the later stage of the advection within the cold sector of the low. The continental airmass is shallower and topped by strong stable layer and tends to produce higher sustained wind speed during the advection. Considering the right height of the stable layer in relation to the orographic barrier a downslope catabatic winds were observed on the leeward side of the orography.

How to cite: Fedor, T.: Severe wind induced by orographic effects during cold airmass advection over Carpathian Mountains, EGU General Assembly 2024, Vienna, Austria, 14–19 Apr 2024, EGU24-13033, https://doi.org/10.5194/egusphere-egu24-13033, 2024.

EGU24-13721 | Posters on site | AS1.26 | Highlight

Classification of Heavy Rainfall Types and Detailed Characteristics Analysis in the Korean Peninsula Using Surface Observation Data. 

Myoung-Seok Suh, Ha-Yeong Yu, Ji-su Park, Yu-jeong Song, and Chansoo Kim

The Korean Peninsula (KP), located on the eastern side of the East Asian continent, has experienced significant spatiotemporal variability in precipitation due to the influences of both the continent and the ocean, as well as its complex topography. The meteorological agency continuously adds AWS and ASOS stations each year to comprehensively understand the spatiotemporal variability in precipitation distribution. Recent research indicates that the frequency and intensity of concentrated heavy rainfall (Hev_Ran) events in the KP have been changing due to the impact of global warming. In this study, we utilized AWS and ASOS observational rainfall data from the past decade (2013-2022) to classify the types of Hev_Ran occurrences on the KP and analyze their detailed characteristics. After a simple quality control process to address missing and abnormal data, approximately 400 stations were selected from the monsoon (May-September), ensuring a missing rate of 15% or less for each month. The selected 400 stations were then investigated for the frequency of exceeding the Korea Meteorological Administration concentrated Hev_Ran rainfall warning and alert criteria on a monthly basis. The constructed dataset includes a total of 30 variables, considering time (3sets: 1/3/12 hours), rainfall intensity and frequency (2sets), and monsoon months (5sets: 5-6/7/8/9). These variables were normalized using the Robust transformation based on their deviation from the median. Additionally, due to the very low frequencies of exceeding alert criteria at most locations, the analysis was performed for the entire summer season rather than on a monthly basis, and for warnings, the frequencies in May and June were combined due to the lower occurrence. Furthermore, considering the influence of input variables on clustering results, the variable group with the highest Explained Cluster Variance (ECV) was selected for adjustment, resulting in a reduction to five input variables. Three commonly used clustering methods K-Means, Self Organizing Map, and Hierarchical Clustering were employed. The number of clusters was determined as six through ECV analysis. After clustering with these three methods, the results were compared, and since there was little difference between the clusters, the K-Means clustering result with the highest ECV was presented as the central outcome. Cluster-1, characterized by overall lower rainfall frequency, peaks in August, and is mainly located inland, excluding the around Seoul areas. Cluster-2 corresponds to the western of the inland region with higher rainfall frequencies in July-August. Cluster-3 covered the eastern and southern coastal areas, including parts of Jeju, experiencing increasing rainfall frequencies from May/June to September.  Cluster-4, located inland, demonstrates concentrated Hev_Ran, especially in August. In the southern coastal areas and some parts of Jeju, there is a moderate and relatively similar frequency of Hev_Ran occurrences on a monthly basis, with a peak observed in July (Cluster-5). Finally, Cluster-6, encompassing Jeju and Geoje, consistently displays high rainfall frequencies, especially in August and September, recording the highest number of Hev_Ran warnings. The presentation will focus on detailed characteristics, including daily variations, of concentrated Hev_Ran occurrences for each cluster.

How to cite: Suh, M.-S., Yu, H.-Y., Park, J., Song, Y., and Kim, C.: Classification of Heavy Rainfall Types and Detailed Characteristics Analysis in the Korean Peninsula Using Surface Observation Data., EGU General Assembly 2024, Vienna, Austria, 14–19 Apr 2024, EGU24-13721, https://doi.org/10.5194/egusphere-egu24-13721, 2024.

EGU24-14265 | ECS | Orals | AS1.26 | Highlight

Projected changes in Compound Extremes under low to high emission SSPs Scenarios 

Pawan Kumar Chaubey and Raju Attada

The compound extremes of rainfall and temperature increase globally under the warming climate. Over the past few decades, the frequency and intensity of compound extremes, such as extreme rainfall events and heat waves, have increased across various climatic zones in India. This study aims to analyze the changes in these compound extremes at specific thresholds (percentiles) from CMIP6-based Multi-Model Ensemble (MME). We further examine the future changes in extremes in different time frames, i.e., near (2015-2040), mid (2041-2070), and far (2071-2099) future at annual and seasonal time scales. The projected extremity under the new Shared Socioeconomic Pathways (SSPs) showed an increasing trend in consecutive dry (wet) stages over an increase in northern (central) parts of India. Intense and frequent heat waves are mainly concentrated over the north-central region under the low to high-emission scenarios. Also, India's northern, central, and western regions may experience more extremity under high-emission (SSP5-8.5) scenarios that highlight the importance of developing long-term adaptation and mitigation strategies aimed at reducing climate vulnerability.

How to cite: Chaubey, P. K. and Attada, R.: Projected changes in Compound Extremes under low to high emission SSPs Scenarios, EGU General Assembly 2024, Vienna, Austria, 14–19 Apr 2024, EGU24-14265, https://doi.org/10.5194/egusphere-egu24-14265, 2024.

EGU24-14652 | ECS | Orals | AS1.26

Clouds as the Primary Driver of Recent Prolonged Summer Heat Waves in South Korea 

Minjeong Cho, Ha-Rim Kim, and Yong-Sang Choi

Recent prolonged heat waves in South Korea have raised questions about the key factors influencing their duration. This study investigates the potential physical drivers affecting the duration of Korean summer heat waves over 50 years (1973–2022), categorizing two types of events: short-term (5–7 days) and long-term (≥16 days) events. Using JRA-55 reanalysis data, we examine the distinct characteristics of both event types in relation to components contributing to the surface energy budget. Additional attention is given to the role of soil moisture and clouds in interacting with these components. The primary cause of both heat wave events is an increase in net shortwave radiation flux, attributed to anticyclonic circulation over South Korea, resulting in decreased clouds. Nonetheless, notable differences emerge: the short-term event exhibits a rapid recovery in all-altitude clouds, while the long-term event displays a slower recovery in low-level clouds. Continuously fewer low-level clouds allow much more incoming solar radiation, mainly contributing to the prolonged heat waves. This is linked to a dry atmosphere and weak atmospheric instability, which inhibits the development of lower-level clouds. Moreover, long-term events also exhibit a sudden increase in clouds at 100–200 hPa, intensifying the trapping effect on outgoing longwave radiation in the atmosphere, and subsequently leading to surface warming. This study enhances a comprehensive understanding of the mechanisms behind prolonged summer heat waves in South Korea, providing valuable insights into the complex interplay of atmospheric components.

How to cite: Cho, M., Kim, H.-R., and Choi, Y.-S.: Clouds as the Primary Driver of Recent Prolonged Summer Heat Waves in South Korea, EGU General Assembly 2024, Vienna, Austria, 14–19 Apr 2024, EGU24-14652, https://doi.org/10.5194/egusphere-egu24-14652, 2024.

A Heat-wave-Intensity-Duration-Frequency (HWIDF) curve is employed to establish the relationship between the intensity, duration, and frequency of heat wave incidents. This approach offers a more comprehensive understanding of heat waves by considering their intensity, duration, and frequency. The HWIDF curves for India's six climate zones, namely, The Arid zone, Semiarid zone, Montane, Humid subtropical zone, Tropical wet, and Tropical wet & dry zone, are considered for the study. These curves are used to evaluate the probability of encountering heat waves with varying levels of intensity and duration. They also help measure changes in heat wave intensities for different return periods in relation to the evolving climate. Subsequently, the MRI-ESM2-0 models were employed to assess the disparities in HWIDF (Heat Wave Intensity-Duration-Frequency) by comparing scenarios with and without human emissions. This analysis aimed to determine the specific impact of human activities on heat waves. The analysis shows that heat waves in arid zones, lasting from one to ten days, with maximum and average intensities of 44.32℃ and 36.56 ℃ or less, occur with a frequency of once every two years (probability=0.5). These heat waves have higher intensities compared to other zones. On the other hand, montane zones experience lower intensities compared to other zones. Our findings indicate that heat wave intensity poses a greater danger under historical conditions when compared to natural conditions, particularly over a span of five and ten consecutive days. The likelihood of experiencing severe heat waves in the Humid Subtropical and Montane zones is more or less compared to other zones. Hence, our study indicates that the rising probability of severe heat waves, in terms of their severity and duration, could be attributed to anthropogenic warming.

How to cite: Kumar, P. and Chakraborty, A.: To develop a statistical model for the analysis of heat wave intensity duration frequency curve for major climatic zones of India, EGU General Assembly 2024, Vienna, Austria, 14–19 Apr 2024, EGU24-14782, https://doi.org/10.5194/egusphere-egu24-14782, 2024.

The Hanjiang River basin (HJB), a representative monsoon-influenced basin in China, is alternately influenced by the southwest monsoon and southeast monsoon throughout the year. However, the variation characteristics of extreme precipitation in the basin, the specific relationship between extreme precipitation and monsoons, and the relative contribution of different monsoons, remains unclear in the HJB. Using multiple datasets, this study analysed the variability of various extreme precipitation types in the HJB during 1985–2020, investigated their relationships with different monsoon indicators and assessed the contribution of natural factors on the extreme precipitation variance. The results reveal a nonsignificant increasing trend in rainstorms within the basin, the severe convective rainstorm days accounted for a high proportion of the total rainstorm days, and the spatiotemporal characteristics of different rainstorm types are different. The rainstorm indicators are significantly correlated with the monsoon within the HJB and are positively correlated with the SWM, particularly its intensity. The SEM exhibits a weak correlation with rainstorms and has limited explanation for the variance in rainstorms. The intensity of SWM within the HJB shows a significant positive correlation with all rainstorm indicators. It is also detected as the most important indicator for explaining the interannual variation in rainstorms, explaining 41.97% and 39.45% of the variance in daily rainstorm frequency and totals, which comprises more than half of the total explanatory portion. The explanation of circulation factors for the variance in daily rainstorms is higher than that for severe convective rainstorms. In addition to monsoons, the Pacific Decadal Oscillation and the Southern Oscillation Index also have a great contribution to the rainstorm variability in the HJB.

How to cite: Jing, Y. and Shi, P.: Change characteristics and influencing factors of extreme precipitation events in Hanjiang River Basin, China, EGU General Assembly 2024, Vienna, Austria, 14–19 Apr 2024, EGU24-17718, https://doi.org/10.5194/egusphere-egu24-17718, 2024.

EGU24-18245 | ECS | Orals | AS1.26 | Highlight

Investigating the impact of European heat waves on the lower atmosphere 

Till Fohrmann, Petra Friederichs, and Andreas Hense

Motivated by heat wave’s impacts on human health and the economy, research on this type of extreme event generally focuses on near surface variables. In this study, we broaden the view by looking at the effects on the vertical structure of the atmospheric boundary layer. Previous research by Miralles et al. (2014) reports extreme boundary layer heights during the severe heat waves of 2003 and 2010 and suggests a correlation between mean potential temperature in the lower atmosphere and the boundary layer height. We investigate whether these findings are common to European heat waves in general with the aim of getting insights into their formation and persistence. To get a comprehensive analysis, we compare summer time vertical profiles taken from reanalysis, namely CERRA and COSMO-REA6, as well as German radio sonde observations between 2014 and 2018. We follow the method of Szemkus et al. (in press) to extract extremal spatial patterns of two meter temperature from the reanalyses. This information is used to define heat waves. Furthermore, the atmospheric boundary layer heights in all three data sources are estimated either by the well established Bulk-Richardson-Number based method or a self-developed machine learning approach. We then compare empirical distributions of boundary layer heights during heat waves and normal conditions on a domain wide scale and grid point wise to account for regional differences. Additionally, we also extract extremal spatial patterns from the height data using the aforementioned method to compare them to the patterns found for temperature. The results of our work could possibly be used to improve the discriminability of different severity levels of heat waves or to formulate a heat wave measure that is not based solely on surface variables.

How to cite: Fohrmann, T., Friederichs, P., and Hense, A.: Investigating the impact of European heat waves on the lower atmosphere, EGU General Assembly 2024, Vienna, Austria, 14–19 Apr 2024, EGU24-18245, https://doi.org/10.5194/egusphere-egu24-18245, 2024.

EGU24-19037 | ECS | Posters on site | AS1.26

Compound precipitation and wind extremes in the Eastern Italian Alps: a comparison of observations and reanalyses  

Elena Maines, Alice Crespi, Stefan Steger, and Marc Zebisch

In recent decades, the Alpine regions have experienced several heavy precipitation events, occasionally accompanied by high wind speeds, causing forest damage and triggering various natural hazards including landslides. These events showed that the interplay of multiple meteorological extremes occurring simultaneously or within a short period of time can lead to more profound ecological and socio-economic consequences than single extremes and overstrain the risk management capacity of affected areas. However, also due to data limitation, few studies addressed compound extremes, especially of precipitation and wind, in the Alpine regions on spatial scales meaningful for the impact and risk analyses. More attention has still been dedicated to single processes or to large-scale evaluations. A better understanding of current likelihood and characteristics of compound extremes on a regional and local level, as well as of skills and limitations of datasets and methods used for their detection, can contribute to improve the assessment of related risks in both current and future climate.

This study evaluates a variety of methods and datasets for the detection and characterization of compound wind and precipitation extremes in Trentino – South Tyrol region (Eastern Italian Alps) over recent decades. Starting from daily time series of precipitation and maximum wind speed, compound extremes were identified as the concurrent threshold exceedance, based on either percentiles or anomaly levels. The assessment was based on observations collected by nine stations of the regional weather network and two reanalysis datasets, i.e., the Copernicus Regional Reanalysis for Europe (CERRA, 5.5 km) and the high-resolution dynamical downscaling of ERA5 reanalysis for Italy (VHR_REA-IT, 2.2 km). Due to the generally limited availability of local observations, reanalyses were investigated as potential alternatives to observations for the analysis of compound extremes. Different combinations of thresholds, temporal and spatial lags were first tested in order to maximize the detection of events while maintaining the overall accuracy. 

Spatial patterns, seasonality, magnitude and frequency of compound events identified by observations and reanalyses over the common period 1993-2021 will be presented and compared to highlight main differences, advantages and limitations of each dataset. Preliminary results suggest that VHR_REA-IT outperforms CERRA in identifying extreme precipitation events, based on comparison with observed values at station level. However, both datasets underestimate local wind speed posing challenges for a robust identification and description of compound precipitation and wind extremes. Despite this limitation, the most intense event of the analysed period, the storm Vaia (October 2018), was detected by both reanalyses with a spatial pattern aligning with observations.  

The research leading to these results has received funding from Interreg Alpine Space Program 2021-27 under the project number ASP0100101, “How to adapt to changing weather eXtremes and associated compound and cascading RISKs in the context of Climate Change” (X-RISK-CC). 

How to cite: Maines, E., Crespi, A., Steger, S., and Zebisch, M.: Compound precipitation and wind extremes in the Eastern Italian Alps: a comparison of observations and reanalyses , EGU General Assembly 2024, Vienna, Austria, 14–19 Apr 2024, EGU24-19037, https://doi.org/10.5194/egusphere-egu24-19037, 2024.

EGU24-19150 | Orals | AS1.26

Unraveling the genesis of von Kármán vortices behind storm supercell by numerical simulations 

Carlo Cintolesi, Marcello Grenzi, Silvana Di Sabatino, and Federico Pocù

The impact of severe atmospheric events on human society and activities is becoming a primary issue, considering that the actual trend of climate change is expected to increase the frequency and intensity of such events. Despite exceptional advancements that have been done in the Numerical Weather Prediction field in the last decades, there is still a lack of knowledge on features of atmospheric phenomena at the lower and less energetic scales. The present contribution focuses on the genesis mechanism and evolution of periodic secondary vortices, of the von Karman wake type, that arise downwind of thunderstorm supercells. These structures develop at intermediate altitudes, are often less energetic and have a shorter lifetime than the principal supercell. Therefore, they are hardly captured by meteorological observations, but they can play an important role in transporting kinematic and thermal qualities, also anticipating the impact of the supercell itself. 

To address this topic, a real case has been studied and numerically reproduced: the thunderstorm supercell generated on 5th September 2015 over the Gulf of Naples (Italy), which was of exceptional intensity for the Mediterranean area. The analysis of multi-platform data (including data from ERA5, ground and space-borne radar, and local measurements) enabled the identification of the secondary vortices of interest and to derive the geometric, thermal and kinematic characteristics of the system. A simplified model of the supercell was then designed and used to set up a Large-Eddy Simulation, based on computational fluid dynamics techniques, to directly solve the physics of most large and energetic scales of motion. 

The numerical experiment reproduced the fundamental structure of the supercell and its well-known features, including interactions with the tropopause (e.g. overshooting top, anvil, hydraulic jump, gravity waves). The wake of secondary vortices downwind of the main body of the supercell was reproduced and analysed, and the mechanism of generation of these turbulent structures was described.  

To the best of the authors' knowledge, this is the first contribution integrating direct observations and Large-Eddy Simulation numerical simulations to analyse secondary vortex trails behind storm supercells. 

How to cite: Cintolesi, C., Grenzi, M., Di Sabatino, S., and Pocù, F.: Unraveling the genesis of von Kármán vortices behind storm supercell by numerical simulations, EGU General Assembly 2024, Vienna, Austria, 14–19 Apr 2024, EGU24-19150, https://doi.org/10.5194/egusphere-egu24-19150, 2024.

EGU24-1193 | ECS | Posters on site | CL2.3

Climate drivers of meteorological droughts in north-western Europe (1836-2022) 

Emile Neimry, Hugues Goosse, and Mathieu Jonard

Droughts have garnered global attention due to their adverse effects on crops, ecosystems, and society. Despite their frequent occurrence in north-western Europe, the causes of these droughts remain poorly understood. This study investigates the historical climate drivers of meteorological droughts in the region. The identification of drought events since 1836 is conducted using the Standardized Precipitation Evapotranspiration Index at a 3-month scale, based on reanalysis datasets (ERA5 and 20CRv3). Subsequently, by employing clustering methods, we categorize the diverse atmospheric conditions leading to droughts into discernible patterns. Our next objective is to assess the long-term variability and trends within these patterns. This research provides a long-term regional analysis of meteorological drought drivers, contributing to a deeper understanding of regional climate changes over the past two centuries.

How to cite: Neimry, E., Goosse, H., and Jonard, M.: Climate drivers of meteorological droughts in north-western Europe (1836-2022), EGU General Assembly 2024, Vienna, Austria, 14–19 Apr 2024, EGU24-1193, https://doi.org/10.5194/egusphere-egu24-1193, 2024.

EGU24-1722 | ECS | Orals | CL2.3

Revealing a systematic bias in percentile-based temperature extremes 

Lukas Brunner and Aiko Voigt

Worsening temperature extremes are among the most severe impacts of human-induced climate change. To quantify such extremes and their changes various methods have been applied over the years. One frequently used approach is to define extremes relative to the local temperature distribution as exceedances of a given percentile threshold. 

For hot extremes, the Expert Team on Climate Change Detection and Indices (ETCCDI) defines TX90p relative to the 90th percentile of maximum temperature on each calendar day in the 30-year period 1961-1990. To increase the number of samples available for the percentile calculation a 5-day running window is recommended leading to a total of 30x5=150 samples for each calendar day. However, this still limited number of samples can lead to internal variability being mixed into the percentile and cause a strongly varying extreme threshold, which is undesirable. Therefore, many studies do not follow the ETCCDI recommendation and use longer seasonal windows of 15- or even 31-days to increase the number of samples available for the percentile calculation. 

We show that the use of such long seasonal windows introduces a systematic bias that leads to a striking underestimation of the expected extreme frequency. This expected exceedance frequency is 10% for the 90th percentile when evaluating the extreme frequency in the same period as the threshold is calculated (in-base). For ERA5 the 1961-1990 average, global average temperature extreme frequency is only 9% – a relative bias of -10%. In individual regions and seasons, the bias can be considerably larger, exceeding -75%. 

We develop a simple bias correction and use it to show that the bias generally decreases in a warming climate in CMIP6. It, therefore, also affects estimates of future temperature and related heatwave changes. The decrease of the bias can lead to an overestimation of changes in the heatwave frequency by as much as 30%. Based on these results, we strongly warn against the use of long seasonal windows without correction when calculating extreme frequencies and their changes.

How to cite: Brunner, L. and Voigt, A.: Revealing a systematic bias in percentile-based temperature extremes, EGU General Assembly 2024, Vienna, Austria, 14–19 Apr 2024, EGU24-1722, https://doi.org/10.5194/egusphere-egu24-1722, 2024.

EGU24-1791 | Orals | CL2.3 | Highlight

Storylines of high-impact climate events 

Theodore Shepherd

High-impact climate events are generally expected to be exacerbated by climate change. For heatwaves, heavy precipitation, and evaporatively-driven drought, the IPCC AR6 made very strong general statements about changes in hazard. But as soon as one attempts to attribute high-impact climate events, the particular details of those events (which are inevitably compound events) and of the human-managed environment take centre stage. Because real-world events are not independent and identically distributed, one cannot reliably apply a general statement to a particular event. This basic aspect of statistical inference, widely recognized in other fields, seems not well appreciated within the climate science community. Physical climate storylines (physically-based unfoldings of past climate or weather events, or of plausible future events or pathways) offer a way to respect the complexity of high-impact climate events and the multiple causal factors involved, of which climate change will only be one. Indeed, identifying the non-climatic factors that affect vulnerability and exposure is essential for good decision-making around climate adaptation. In this talk I will describe the rationale behind the use of storylines for high-impact climate events from the broader perspective of attribution, and explain how conditional attribution allows probability and risk to enter in a physically interpretable and meaningful way.

How to cite: Shepherd, T.: Storylines of high-impact climate events, EGU General Assembly 2024, Vienna, Austria, 14–19 Apr 2024, EGU24-1791, https://doi.org/10.5194/egusphere-egu24-1791, 2024.

EGU24-2132 | ECS | Posters on site | CL2.3

A Regional Perspective of Storyline Simulations of the Recent European Summer Heatwaves 

Tatiana Klimiuk, Patrick Ludwig, Antonio Sánchez Benítez, Helge Goessling, Peter Braesicke, and Joaquim G. Pinto

Heatwaves are a major natural hazard affecting Europe, and their maximum temperatures are projected to increase strongly with climate change. In recent years, the event-based storyline approach has proven its applicability for climate change attribution studies. Constraining the large-scale dynamics to that of the recent past serves to separate the thermodynamic effects of increasing greenhouse gas concentrations from the largely uncertain dynamic changes. Within the SCENIC project, the storylines are produced with the spectrally nudged global coupled AWI-CM1 model (90 km horizontal resolution). They are downscaled with ICON-CLM to the Euro-Cordex (12 km) and subsequently to the central European domain (3 km). Using this model chain, we captured the series of European summer heat waves and droughts of 2018-2022. We placed them into the pre-industrial climate and three environments corresponding to +2, +3, and +4 K warmer worlds. We quantified the warming rate per degree of global warming (which sometimes exceeds 2.5 over larger areas) and assessed the role of soil-atmosphere feedback in contributing to these rates. More specifically, for several European heatwaves, we explored the connection of the evaporative regime of a region affected by a heatwave to the region's response to global warming during this event. Taking advantage of the high signal-to-noise ratio of event-based storylines, we add one more dimension - the global warming level - to the scope of land-atmosphere feedback studies.

How to cite: Klimiuk, T., Ludwig, P., Sánchez Benítez, A., Goessling, H., Braesicke, P., and G. Pinto, J.: A Regional Perspective of Storyline Simulations of the Recent European Summer Heatwaves, EGU General Assembly 2024, Vienna, Austria, 14–19 Apr 2024, EGU24-2132, https://doi.org/10.5194/egusphere-egu24-2132, 2024.

EGU24-2258 | ECS | Posters on site | CL2.3

Storyline approach for the analysis of the 2012 drought in Serbia and possible future similar events 

Milica Tosic, Vladimir Djurdjevic, Ivana Tosic, and Irida Lazic

In 2012, Serbia experienced one of its warmest and driest years on record. The summer of 2012 marked the highest temperatures recorded since meteorological measurements began in Serbia, in relation to the reference period from 1991 to 2020. Throughout the summer, the entire country faced severe drought conditions persisting until the end of November. Serbia's agriculture is very vulnerable to drought - an estimated annual economic loss is approximately 2 billion euros due to extreme 2012 drought. Recent studies emphasize the value of the storyline approach in offering a comprehensive and manageable framework for evaluating environmental, societal and economic risks associated with climate change. Considering the potential for more intense climate events resulting from climate change, we decided to apply the storyline approach, to determine what future events similar to drought 2012 might look like and how they are influenced by different climate change scenarios. We constructed drought metrics based on precipitation deficit, following the method proposed by van der Wiel et al. [1], and with the use of the EOBS dataset. Analyzing future scenarios involved creating a meteorological analogue to the 2012 drought, using single model large ensemble historical and future scenario simulations from CMIP6 database - the MPI-M Earth System Model version 1.2, for different SSP scenarios. This analysis offers insights into different storylines, aiding the assessment of climate risks and the potential impacts of hypothetical drought scenarios.

The summer of 2012 was extraordinarily warm, and, as previous studies show significant changes in temperature extremes during the summer season in Serbia, we included analyses of temperature anomalies during the summer. Additionally, to create more comprehensive storylines, our study involves analyzing large-scale atmospheric patterns. Our results show an increase in drought severity in a warmer future, offering an enhanced understanding of how extreme events like the 2012 drought (or more severe) are changing measurably due to climate change, and provide examples of potential impacts, in order to raise public awareness about the potential consequences of future climate change in Serbia.

[1] van der Wiel, K., Lenderink, G. and de Vries, H., 2021. Physical storylines of future European drought events like 2018 based on ensemble climate modelling. Weather and Climate Extremes33, p.100350.

How to cite: Tosic, M., Djurdjevic, V., Tosic, I., and Lazic, I.: Storyline approach for the analysis of the 2012 drought in Serbia and possible future similar events, EGU General Assembly 2024, Vienna, Austria, 14–19 Apr 2024, EGU24-2258, https://doi.org/10.5194/egusphere-egu24-2258, 2024.

EGU24-2286 | ECS | Posters on site | CL2.3

Extreme rainfall in Northern China in September 2021 tied to air–sea multi‐factors 

Yue Sun, Jianping Li, Hao Wang, Ruize Li, and Xinxin Tang

The September rainfall over Northern China (NC) in 2021 was the heaviest since 1961 and had unprecedented socioeconomic impacts. Holding the hypothesis that the drivers of extreme climate events usually contain extreme factors, we firstly propose the Ranking Attribution Method (RAM) to find the possible air–sea multi-factors responsible for this rainfall event. Via the atmospheric bridges of zonal-vertical circulation and Rossby wave energy propagation, the remote factors of warm sea surface temperature anomalies (SSTA) over the tropical Atlantic, cold SSTA over the tropical Pacific, Southern Annular Mode-like pattern in the Southern Hemisphere and North Pacific Oscillation-like pattern in the Northern Hemisphere jointly strengthened the Maritime Continent (MC) convection and Indian monsoon (IM). Through meridional-vertical circulation, the intensified MC convection enhanced the subtropical high over southern China and induced ascending motion over NC. The local factor of extreme air acceleration in the east Asian upper-level jet entrance region further anchored the location of the southwest-northeast rain belt. The strengthened IM and subtropical high over southern China induced considerable moisture transport to the rain belt via two moisture channels. The combined effect of these extreme dynamic and moisture conditions formed this unprecedented rainfall event. This study suggests that the RAM can effectively reveal the factors that contributed to this extreme rainfall event, which could provide a new pathway for a better understanding of extreme climate events.

How to cite: Sun, Y., Li, J., Wang, H., Li, R., and Tang, X.: Extreme rainfall in Northern China in September 2021 tied to air–sea multi‐factors, EGU General Assembly 2024, Vienna, Austria, 14–19 Apr 2024, EGU24-2286, https://doi.org/10.5194/egusphere-egu24-2286, 2024.

EGU24-2365 | ECS | Orals | CL2.3

Sub-seasonal UK winter precipitation intensifies in-line with expected temperature scaling 

James Carruthers, Selma Guerreiro, Hayley Fowler, and Daniel Bannister

Interannual to multi-decadal variability in large-scale dynamics such as atmospheric and oceanic circulation results in significant noise and temporary trends in regional climate. Attempting to understand longer term trends as a result of anthropogenic climate change requires disentangling internal variability and climate change signals. One of these climate signals is the Clausius-Clapeyron (CC) scaling in precipitation resulting from temperature increases. In this work, we characterise and constrain variability in sub-seasonal winter rainfall in the UK resulting from synoptic scale-conditions. The UK experiences periods of sustained precipitation in some winters which result in widespread flooding due to extreme accumulation, such as the winter of 2013/2014. Using categorised sea-level pressure fields and gridded precipitation between 1900-2020, we simulate ‘expected’ precipitation resulting from North Atlantic synoptic conditions. We find a rising trend since the 1980s in observed monthly accumulation which is not reflected in the simulated precipitation timeseries, indicating that recent wet winters in the UK have been wetter than expected given the synoptic conditions. The rising trend in the residual (observed - simulated) mean monthly precipitation is in line with expected CC scaling rate of ~6-7% per degree warming according to changes in UK annual mean temperature. However, the residual in extreme monthly precipitation has scaled at approximately twice that rate. To better understand differences in changes for average and extreme precipitation accumulation, we explore the influence of dynamical feedbacks which may increase precipitation at higher intensities. We find that residual precipitation is influenced by the persistence of synoptic conditions and exhibits remote teleconnections to sea surface temperature and atmospheric conditions in the tropics and sub-tropics. This work highlights the importance of considering variability in large-scale dynamics when identifying climate change signals and sheds light on influences on sub-seasonal to seasonal winter precipitation in the UK.ences on sub-seasonal to seasonal winter precipitation in the UK.

How to cite: Carruthers, J., Guerreiro, S., Fowler, H., and Bannister, D.: Sub-seasonal UK winter precipitation intensifies in-line with expected temperature scaling, EGU General Assembly 2024, Vienna, Austria, 14–19 Apr 2024, EGU24-2365, https://doi.org/10.5194/egusphere-egu24-2365, 2024.

EGU24-2574 | Orals | CL2.3

Statistically impossible temperatures. 

Michael Wehner, Mark Risser, Likun Zhang, and William Boos

The 2021 heatwave in the Pacific Northwest of the United States and Canada was unusual in many regards. In particular, not only was the event deemed impossible prior to the human interference in the climate system, standard out-of-sample non-stationary generalized extreme value (GEV) analyses revealed it to be statistically impossible in 2021 as many observed temperatures were above the upper bound of the upper bound of fitted GEV distributions. Obviously, as the event actually occurred, these statistical models are not fit for the purpose of estimating the influence of climate change on the event’s probability.

By expanding the number of physical covariates beyond just greenhouse gas concentrations and by incorporating spatial statistical techniques in a Bayesian hierarchal framework, we are able to construct a statistical model where observed temperatures during this heatwave were not “impossible” and thus estimate the change in their probabilities leading to Granger-type causal inference attribution statements.

We further extend this statistical framework to all quality daily GHCN station measurements and find that while many physically plausible outlier temperatures are impossible in the simple non-stationary GEV framework, they can be explained using our more complicated non-stationary Bayesian spatial statistical model embedded in a deep learning machinery.


How to cite: Wehner, M., Risser, M., Zhang, L., and Boos, W.: Statistically impossible temperatures., EGU General Assembly 2024, Vienna, Austria, 14–19 Apr 2024, EGU24-2574, https://doi.org/10.5194/egusphere-egu24-2574, 2024.

EGU24-3153 | ECS | Posters on site | CL2.3

A systematic bias in future heatwave diagnostics throughout the seasonal cycle 

Maximilian Meindl, Lukas Brunner, and Aiko Voigt

Human-induced climate change is leading to a warming Earth, resulting in more frequent and intense temperature extremes. Daily temperature extremes can be defined following various approaches, with relative percentile-based thresholds being a common method. Here we explore spatio-temporal heatwaves across the seasonal cycle derived from daily temperature extremes, emphasizing the critical role of the extreme threshold chosen in their definition.

To investigate the sensitivity of heatwave characteristics to the extreme threshold definition, we focus on the approach utilizing a so-called moving threshold. This method involves a 31-day running window to increase the sample size for percentile calculations as well as an additional 31-year running window to account for the impact of global warming. We recognize that introducing a seasonal running window may introduce biases in threshold exceedances. To address this issue, Brunner and Voigt (2023) proposed a simple bias correction method, involving the removal of the mean seasonal cycle before percentile threshold calculation, which we also use here to explore effects on downstream impact metrics. 

We focus on the 99th percentile as threshold and show the potential for a significant bias in the extreme frequency, exceeding 50% in certain regions according to 5 selected CMIP6 models. Our findings further reveal that without bias correction this also leads to a substantial underestimation of derived heatwave properties, in particular area, duration, and magnitude. For the ACCESS-CM2 model, the difference in heatwave area can reach up to 40%, when comparing bias-corrected and not bias-corrected results for the 100 biggest events in the period 1960-1990.

Our results contribute to a better understanding of the implications of using a seasonally running window on heatwave characteristics, providing valuable insights for future climate projections. We emphasize the importance of adopting appropriate methods and bias correction techniques to enhance the accuracy of temperature extreme assessments in the context of ongoing climate change.


References:

Brunner and Voigt (2023): Revealing a systematic bias in percentile-based temperature extremes. EGU General Assembly 2024. EGU24-1722

How to cite: Meindl, M., Brunner, L., and Voigt, A.: A systematic bias in future heatwave diagnostics throughout the seasonal cycle, EGU General Assembly 2024, Vienna, Austria, 14–19 Apr 2024, EGU24-3153, https://doi.org/10.5194/egusphere-egu24-3153, 2024.

EGU24-3174 | Orals | CL2.3

Storylines of East Asian cold extremes in 2020/2021 under different warming climate 

Wenqin Zhuo, Antonio Sánchez-Benítez, Helge Goessling, Marylou Athanase, and Thomas Yung

Whether cold-air outbreak over mid-latitude in a warmer climate would become more or less extreme is a subject of debate, particularly due to uncertainty links between Arctic amplification and these cold extremes, which complicated by the atmosphere internal variability.  Here we employ an event-based storyline approach, which fixed the atmospheric circulation to the observed  through spectral nudging, to quantify thermodynamic effect on extreme cold events during the winter of 2020/2021 in East Asia under different warming scenarios. Notably, we detect the strongest warming, up to +10K, over Eastern Siberia in the +4K-warmer climate, which is related to warmer cold air mass originating from unfrozen sea ice over Siberia region. In contrast, in the southern China, due to the observed and expected increasing aerosol concentration, peaking by the mid-21st century and altering the radiative balances, a mild cooling is present from pre-industrial to present-day climates. The cooling in this region is likely to persist in +2K-warmer scenario but was not observed when up to the +4K warmer climate. Correspondingly, no prominent temperature variation is observed in the middle East Asia, with the warming extent largely mirroring the overall climate background.

How to cite: Zhuo, W., Sánchez-Benítez, A., Goessling, H., Athanase, M., and Yung, T.: Storylines of East Asian cold extremes in 2020/2021 under different warming climate, EGU General Assembly 2024, Vienna, Austria, 14–19 Apr 2024, EGU24-3174, https://doi.org/10.5194/egusphere-egu24-3174, 2024.

A “once-in-a-millennium” super rainstorm battered Zhengzhou, central China, from 07/17/2021 to 07/22/2021 (named “7.20” Zhengzhou super rainstorm). It killed 398 people and caused billions of dollars in damage. ​A pressing question, however, is whether rainstorms of this intensity can be effectively documented by geological archives to understand better their historical variabilities beyond the scope of meteorological data. Here, four land snail shells (Cathaica fasciola) were collected from Zhengzhou in 2021, and weekly to daily resolved snail shell δ18O records from June to September of 2021 were obtained by gas-source mass spectrometry (GSMS) and secondary ion mass spectrometry (SIMS). The daily resolved records show a dramatic negative shift between 06/18/2021 and 09/18/2021, which has been attributed to is related to the “7.20” Zhengzhou super rainstorm. Moreover, the measured amplitude of the shell δ18O shift caused by the “7.20” Zhengzhou super rainstorm is consistent with the theoretical value estimated from the flux balance model and local instrumental data within the error range. Our results suggest that the ultra-high resolution δ18O of land snail shells have the potential to reconstruct local synoptic scale super rainstorm events quantitatively. And the proposed “best practice” of current work indicated that fossil snail shells in sedimentary strata can be valuable material for investigating the historical variability of local super rainstorms under different climate background conditions.

How to cite: Wang, G., Dong, J., and Yan, H.: Quantitative reconstruction of a single super rainstorm using daily resolved δ18O of land snail shell, EGU General Assembly 2024, Vienna, Austria, 14–19 Apr 2024, EGU24-4973, https://doi.org/10.5194/egusphere-egu24-4973, 2024.

EGU24-6659 | Orals | CL2.3

Empirical storylines of climate change using clustering analysis 

Xavier Levine and Priscilla Mooney

Storylines are intended to provide concrete realizations of the climate response to global warming, to help anticipate the possible impacts of climate change on society and nature. Recent studies on climate change storylines have used a multivariate linear regression (MLR) framework to determine those climate realizations, for specific variables, regions and seasons (called target variables); this is achieved by leveraging known climatic interactions across a large number of model projections, which are represented by the covariability of the target variable with pre-determined climate indices (called predictor indices). Yet, a systematic methodology for selecting the best set of predictor indices for a specific target variable is lacking, with the set of predictors usually being chosen according to our current understanding of the most important climatic interactions. Furthermore, the storylines that emerge from it are tailored to explain changes in one specific variable, region and season (the target variable), and thus are unable to be generally applicable to a range of target variables.

Even if the MLR framework succeeds in generating an array of representative climate outcomes for specific cases, we hypothesize that alternative methodologies can be used to generate likely climate outcomes from model simulations while alleviating some of the limitations of the MLR framework. Here, we propose to use clustering analysis to provide possible climate realizations from model projections. Clustering ensures a comprehensive and efficient decomposition of the spread in climate projections found across model simulations, without the need of predefining predictors (both an advantage and inconvenience), but also can be applied to more than one target variable at a time. 

We present findings from various empirical clustering methods, using the three main categories of algorithm (e.g. distribution-, density-, and centroid-based) to produce our so-called empirical storylines. We focus on the Arctic region during the boreal summer season, comparing storylines obtained from each clustering method with findings from a set of “classic” storylines obtained using the MLR framework. We discuss the implications of our results for improving our understanding of the spread in climate projections, and conclude on the existence of a most likely cluster (storyline) by relating our climate change clusters with clusters for the present-day climate. 

How to cite: Levine, X. and Mooney, P.: Empirical storylines of climate change using clustering analysis, EGU General Assembly 2024, Vienna, Austria, 14–19 Apr 2024, EGU24-6659, https://doi.org/10.5194/egusphere-egu24-6659, 2024.

EGU24-6945 | ECS | Orals | CL2.3

Not as Rare as Expected: Assessing Singapore’s Unprecedented Droughts in a Changing Climate 

Xiao Peng, Biao Long, and Xiaogang He

There has been growing evidence suggesting a rising frequency and/or intensity of droughts in tropical regions in a warming climate. Singapore, a water-scarce city heavily reliant on water imports, faces heightened vulnerability to extreme drought episodes. Preparing for unprecedented droughts is thus pivotal for this tropical island city to safeguard a sustainable and resilient water supply. However, the accuracy of quantifying the probability and severity of unprecedented droughts, such as those with a 1000-year return period, is hindered by observations (e.g., in situ measurements, satellite data, etc.) with limited data length, typically spanning only about 50 years. Physics-based regional climate models offer a distinct advantage in simulating extreme droughts beyond historically available data. Yet, naïve Monte Carlo simulations for rare events becomes computationally infeasible at high spatiotemporal resolutions, a scale most relevant in urban drought risk mitigation. In this study, building upon the Giardina-Kurchan-Lecomte-Tailleur algorithm, we develop a computationally efficient framework to simulate Singapore’s unprecedented drought events. Our framework couples the Weather Research and Forecasting (WRF) model with a sequential importance sampling procedure, incorporating the ‘Darwinian pressure’ to favor trajectories conducive to extreme drought conditions. With just slightly over 100 trajectories, we can efficiently simulate very rare drought events (e.g., 1-in-10000-years and rarer) while maintaining their physical plausibility. The WRF model also enables detailed spatiotemporal dynamics of unprecedented droughts, allowing direct estimation of potential compounding extremes, such as concurrent droughts and heatwaves. Moreover, we quantify changes in the likelihood of plausible yet unprecedented droughts under various future climate change scenarios, such as Shared Socioeconomic Pathway 5-8.5 (SSP585), in comparison to the present climate. Our results reveal a robust increase in the chance of unprecedented droughts, emphasizing the importance of developing resilient water strategies for Singapore to prepare for such events in the near future.

How to cite: Peng, X., Long, B., and He, X.: Not as Rare as Expected: Assessing Singapore’s Unprecedented Droughts in a Changing Climate, EGU General Assembly 2024, Vienna, Austria, 14–19 Apr 2024, EGU24-6945, https://doi.org/10.5194/egusphere-egu24-6945, 2024.

EGU24-7744 | ECS | Orals | CL2.3 | Highlight

Storylines for heat-mortality extremes 

Samuel Lüthi, Erich Fischer, and Ana Vicedo-Cabrera

Recent heat extremes reached records far out of the observational temperature range. These extremes challenged the risk view of climate scientists on what could be physically possible within the current climate conditions. However, it is precisely such unprecedented events that pose a large risk to underprepared societies. To better anticipate and prepare for such potential extreme events, the climate risk community started producing storylines which are designed to draw potential and plausible worst-case scenarios without aiming to quantify their probability of occurrence.

The recent development of the ensemble boosting method allows investigating physically plausible extreme heatwaves by re-initializing a climate model with random round-off perturbed atmospheric initial conditions shortly before the onset of a great heat anomaly. This allows for creating storylines whilst ensuring physical consistency. However, so far these storylines were only used to estimate the pure physical climate extreme without the additional quantification of impacts on society.

In this study, we therefore aim to produce several storylines for potential worst-case heat-mortality scenarios. For that, we aim to combine ensemble boosted climate model output with methods from environmental epidemiology to quantify heat-mortality. Concretely, we model the empirical relationship between daily mean temperature and daily mortality counts by using quasi-Poisson regression time series analyses with distributed lag nonlinear models, which is a well-established approach in climate change epidemiology. We then combine these empirical temperature-mortality relationships with the bias-corrected extreme storylines that we developed by ensemble boosting a fully-coupled free-running climate model (CESM2).

The findings of this study have significant implications for societies, particularly in the context of public health policy development, to effectively respond to unprecedented but anticipatable heat extremes.

How to cite: Lüthi, S., Fischer, E., and Vicedo-Cabrera, A.: Storylines for heat-mortality extremes, EGU General Assembly 2024, Vienna, Austria, 14–19 Apr 2024, EGU24-7744, https://doi.org/10.5194/egusphere-egu24-7744, 2024.

EGU24-8388 | ECS | Orals | CL2.3

The Future of Hot-Dry Events in the World’s Breadbasket Regions 

Victoria Dietz, Johanna Baehr, and Leonard Borchert

We use a 50-member large ensemble of the CMIP6 version of the MPI-ESM1.2-LR model to examine the future of hot-dry compound events at 1.5 and 2°C of global warming. By targeting the largest maize production areas (breadbasket regions) and their corresponding growing seasons, we tailor our analysis to food production, indicating potential future threats to global food security. Our results suggest a notable shift in the extremes associated with maize harvest failure in the breadbaskets between 1.5 and 2°C of global warming, highlighting the value of mitigating climate change and the future need to adapt to climate challenges in the agricultural sector.

Our analysis shows a significant increase in the likelihood of these extremes during maize growing seasons across almost all examined regions and variables. In particular, the occurrence probability of heat events and hot-dry compounds at least doubles in most regions when the world warms from 1.5 to 2°C. Locally, cumulated heat excess increases everywhere, while the spatial extent of heat consistently expands across all regions in contrast to the relatively stable pattern we find for precipitation as we transition from one level of global warming to another. We additionally explore spatial compounding, where multiple breadbasket regions experience simultaneous extremes in the same growing season, exacerbating global food security challenges. Scenarios that were virtually impossible in the past, such as hot-dry events affecting at least three regions simultaneously, take on non-zero probabilities in a world that is 1.5 or 2°C warmer. The probabilities of simultaneous heat and hot-dry compounds in a 2°C warmer world significantly exceed those in a 1.5°C warmer world, to the extent that there is little to no overlap between the corresponding ensemble spreads.

How to cite: Dietz, V., Baehr, J., and Borchert, L.: The Future of Hot-Dry Events in the World’s Breadbasket Regions, EGU General Assembly 2024, Vienna, Austria, 14–19 Apr 2024, EGU24-8388, https://doi.org/10.5194/egusphere-egu24-8388, 2024.

In 2015, Limin Jiao et al. used concentric circles and inverse S function curves to analyze the construction land density of 28 major cities in China and successfully divided the internal structure of urban areas. Based on this, this study takes  Beijing-Tianjin-Hebei core area (Beijing, Tianjin and Langfang) and  Shanghai metropolitan area (Yangtze River Delta region) as the research objects, analyze the changes in construction land structure and urban heat island effect from 2001 to 2020.
It is feasible to use the Anselin local Moran I tool of Arcgis to analyze urban centers based on population density (Yingcheng Lia; Xingjian Liu, 2018). We established a fishing net analysis, and the grid with HH significant clustering (high population density surrounded by those of similar high densities) can be regarded as the center of the city. Then, concentric circles with a diameter of 1KM are established based on these center points, and the proportion of construction land in each circle is extracted. And use the inverse S function (Formula 1) to fit the extraction results.
 (1)
The determination coefficient R2 of all fitting results is greater than 0.98, and the results are highly reliable. Then the fitted function is differentiated twice. The two extreme points correspond to the concentric radius of the inner city and the suburbs (R1, R2, and R1<R2) respectively. We found that the radius of the central city and peripheral urban areas of both metropolitan areas has expanded over the past 20 years, with Shanghai's peripheral cities expanding at a faster rate. In addition, the urban radius of Beijing-Tianjin-Hebei is about twice that of Shanghai.
In this study, the urban heat island effect is represented by the difference in surface temperature between suburban areas and Inner City. The results show that the urban heat island effect in the two regions has shown an increasing trend over 

How to cite: Zhang, X., Roca Cladera, J., and Arellano Ramos, B.: Research on urban heat island effect based on concentric circle division of urban structure - Take the Beijing-Tianjin-Hebei and Shanghai metropolitan areas as examples, EGU General Assembly 2024, Vienna, Austria, 14–19 Apr 2024, EGU24-9680, https://doi.org/10.5194/egusphere-egu24-9680, 2024.

EGU24-9911 | ECS | Posters on site | CL2.3

Attribution of European Heatwaves to Global Warming Using Spectrally Nudged Storylines 

Dalena Leon, Frauke Feser, and Linda Van Garderen

This study employs Spectrally Nudged Storylines to attribute heatwaves to anthropogenic global warming. Utilizing high-resolution global (ECHAM) and regional (CCLM) climate models, we aim to discern the influence of anthropogenic climate change on the characteristics of European heatwaves observed in the last decade. Differently to the statistical approach that uses large ensembles/datasets to study large amount of similar events and attribute their occurrence to climate change, the storylines simulate a specific extreme event under different thermodynamical conditions by constraining the large scale dynamics of the system. Thus, directly attributing the change in characteristics of the extreme event to the changes in the thermodynamics, based on the prescribed sea surface temperature and greenhouse gases emission levels. In such way, three storylines are built: a Factual storyline that resembles the climate state as we know it, a Counter Factual storyline that is fixed to the past century representing a world without climate change, and a Plus 2°C storyline that shows how these extreme events change in a world where the global mean temperature is 2°C higher than in pre-industrial times. By the use of these three storylines, we can tell to what extent global warming has provoked heatwaves to be as extreme in a world as we know it, and what can we expect them to be in a warmer future climate.

How to cite: Leon, D., Feser, F., and Van Garderen, L.: Attribution of European Heatwaves to Global Warming Using Spectrally Nudged Storylines, EGU General Assembly 2024, Vienna, Austria, 14–19 Apr 2024, EGU24-9911, https://doi.org/10.5194/egusphere-egu24-9911, 2024.

EGU24-10006 | ECS | Orals | CL2.3

Impacts of regional grid refinement on climate extremes over the Arctic in storyline-based earth system model simulations. 

René R. Wijngaard, Willem Jan van de Berg, Adam R. Herrington, and Xavier Levine

Over the last few decades, the Arctic region has warmed up at a greater rate than elsewhere at the globe, partly resulting from the on-going loss of sea ice and snow over land. It is projected that the amplified warming of the surface will continue in the future, most likely altering the magnitude and frequency of temperature extremes, such as heat waves and cold spells. In addition, the intensity and frequency of extreme precipitation and droughts are projected to change, which may pose serious threats for the human infrastructure and livelihoods. To assess (future) climate extremes, Earth System Models (ESMs) with (regionally) refined resolution could be helpful, particularly in mountainous regions.

In this study, we use the variable-resolution Community Earth System Model version 2.2 (VR-CESM) to evaluate and assess present-day and future climate extremes, such as heat waves and heavy precipitation, over the Arctic. Applying a globally uniform 1-degree grid and a VR grid with regional grid refinements to 28 km over the Arctic and Antarctica, we run present-day (2005–2014) and future (2090–2099) simulations with interactive atmosphere and land surface models, and prescribed sea ice and surface temperatures. The simulations follow two storylines of Arctic climate change that represent a combination of strong/weak polar Arctic amplification and strong/weak SST warming in the Barents-Kara seas. We evaluate the ability of the VR grid to simulate climatic extremes by comparison with gridded outputs of the globally uniform 1-degree grid and the ERA5 reanalysis and assess future climate extremes by focussing on temperature and precipitation extremes. The initial outcomes generally show that for some temperature/precipitation extremes indices the VR grid performs better than the globally uniform 1-degree grid, while for other indices the globally uniform 1-degree grid performs better. Future projections suggest that warm temperature extremes will generally increase both in magnitude and frequency, whereas cold temperature extremes will decrease in magnitude, especially over regions dominated by large sea ice loss. Further, precipitation is projected to increase in intensity and volume. The outcomes of this study may contribute to an improved understanding on future climate extremes and its implications.

How to cite: Wijngaard, R. R., van de Berg, W. J., Herrington, A. R., and Levine, X.: Impacts of regional grid refinement on climate extremes over the Arctic in storyline-based earth system model simulations., EGU General Assembly 2024, Vienna, Austria, 14–19 Apr 2024, EGU24-10006, https://doi.org/10.5194/egusphere-egu24-10006, 2024.

It is well established that internal variability arising spontaneously from the chaotic nature of the climate system can amplify or obscure anthropogenically-forced signals, especially at near-term and at regional scale in the extratropics. In this talk, we focus on Northern Europe (NEU) winter climate changes over the 2020-2040 period and propose a set of internal variability storylines (IVS) to tackle related uncertainties. IVS are built from the combined evolution of the North Atlantic Oscillation (NAO) and the Atlantic Meridional Overturning Circulation (AMOC) diagnosed as drivers of variability for temperature over NEU.

We first show, based on a large ensemble of historical-scenario simulations from CNRM-CM6-1, that, depending on the near-term [AMOC-NAO] doublet evolution, anthropogenically-forced changes can be either considerably amplified with much warmer-wetter mean conditions, almost doubled, or considerably masked with marginal warming and unchanged mean precipitation with respect to present day. We then provide evidence for the robustness of our results by using large-ensembles from several models which ultimately allows assessing the full range of uncertainties for near-term climate change.

We finally use the 2010 severe winter case as an illustrative example of the added-value in expressing climate change knowledge in a conditional form through IVS to plan at best climate-related risks and local adaptation strategies at near term. Reframing the uncertain climate outcomes into the physical science space through IVS grapples the complexity of regional situations; it is also informative to more efficiently communicate towards the general public as well as for climate literacy in general.

How to cite: Cassou, C., Line, A., and Msadek, R.: Assessment of climate change at near-term (2020-2040) over Northern Europe through internal variability storylines, EGU General Assembly 2024, Vienna, Austria, 14–19 Apr 2024, EGU24-11961, https://doi.org/10.5194/egusphere-egu24-11961, 2024.

EGU24-11971 | Posters on site | CL2.3

Insights and Reflections: The 'Exploring Unprecedented Extremes' Workshop 

Dominique Paquin, Dominic Matte, Jens H. Christensen, Martin Drew, and Alexandrine Bisaillon

Due to the various regions and contexts around the world with distinct climatic characteristics, climate hazards vary significantly in their nature, frequency, and impact, causing property damage, population distress, communication failures, environmental damage, and economic losses. Unfortunately, 2023 showcased extreme weather and climate events that have surpassed previous records. These include heatwaves, floods, wildfires, tornadoes. The occurrence of these extreme events poses a challenge to our comprehension of future climates, primarily due to their divergence from our conventional thought patterns or their status as out-of-sample scenarios. With ongoing climate warming, the potential for more severe events in the future is a concern. Insufficient preparation may result in breakdowns within specific sectors or even societal collapse. Effective preparation involves multiple factors, with the initial challenge lying in forming expectations - a task complicated by events that fall outside our usual anticipations, such as out-of-sample occurrences. 


In the face of those climate challenges, understanding and mitigating the impacts of unprecedented climate extremes has become a critical area of focus. To shed light on this challenge, a workshop titled "Exploring Unprecedented Extremes" was convened in November 2023. This event brought together experts from diverse fields to deliberate on innovative approaches to climate change adaptation and mitigation. Emphasizing co-creation and interdisciplinary collaboration, the workshop addressed key themes such as the integration of various sectors into climate change strategies, the complexities of decision-making under uncertainty, and the crucial role of transdisciplinary research in comprehensively understanding and effectively responding to climate extremes. This poster focuses on the key takeaways and strategic reflections that emerged following the workshop, capturing the essence of our collaborative discourse on climate challenges.

How to cite: Paquin, D., Matte, D., Christensen, J. H., Drew, M., and Bisaillon, A.: Insights and Reflections: The 'Exploring Unprecedented Extremes' Workshop, EGU General Assembly 2024, Vienna, Austria, 14–19 Apr 2024, EGU24-11971, https://doi.org/10.5194/egusphere-egu24-11971, 2024.

EGU24-12519 | ECS | Orals | CL2.3

Storyline simulations suggest a northward expansion of European droughts in warmer climates. 

Antonio Sánchez Benítez, Monica Ionita, Marylou Athanase, Thomas Jung, Qiyun Ma, and Helge Goessling

Climate change is causing an increase in the frequency, intensity and persistence of heatwaves and droughts, as seen, for example, in Central Europe in recent years. These changes are expected to be even more severe in the future. Two factors contribute to these changes in extreme events: dynamic changes – changes in the likelihood of weather patterns  – and thermodynamic changes. While the former are uncertain in future climate projections, the latter are characterized by a high signal-to-noise ratio, as there is a robust and ubiquitous rise in land-surface temperatures.

To better understand and analyze both contributions, we employ the so-called "event-based storyline approach", which involves nudging our global CMIP6 coupled climate model (AWI-CM1) towards the observed large-scale free-troposphere winds using various climate background conditions and initial states. This enables us to simulate the same weather conditions, including jet streams and blockings, in different climates: preindustrial, present, and in 2 °C, 3 °C, and 4 ºC warmer worlds. This methodology provides an efficient way of making the consequences of climate change more understandable to experts and non-experts, as extreme events that are fresh in people's memory are simulated in different climates with moderate computational resources.

Our simulations successfully reproduce recent hot and dry extreme events, like the 2019 or 2022 European heatwaves and the record-breaking 2022 drought. Our experiments reveal an intensification of these extremes from preindustrial to present climates (attribution), mainly in southern Europe, with no major changes in Central and Northern Europe. However, we project that this exacerbation will expand northward in future warmer climates, leading to even more severe drought in Central Europe and the Mediterranean by the end of the century. Taking advantage of our methodology we explore the physical mechanisms helping to exacerbate these events in future warmer climates.

How to cite: Sánchez Benítez, A., Ionita, M., Athanase, M., Jung, T., Ma, Q., and Goessling, H.: Storyline simulations suggest a northward expansion of European droughts in warmer climates., EGU General Assembly 2024, Vienna, Austria, 14–19 Apr 2024, EGU24-12519, https://doi.org/10.5194/egusphere-egu24-12519, 2024.

EGU24-12974 | ECS | Orals | CL2.3

On the key role of anthropogenic warming in triggering extreme convective events: the case of the destructive Mediterranean derecho in 2022 

Juan Jesús González-Alemán, Damian Insua-Costa, Eric Bazile, Sergi González-Herrero, Mario Marcello Miglietta, Pieter Groenemeijer, and Markus G. Donat

A derecho is a widespread, long-lived, straight-line windstorm that is associated with a fast-moving group of severe thunderstorms known as a mesoscale convective system.

During 18 August 2022, a highly intense and organized convective storm, classified as a derecho, developed over the western Mediterranean Sea affecting Corsica, northern Italy and Austria, with wind gusts up to 62 m/s and giant hail (~11 cm). There were 12 fatalities and 106 people injured. This event received much attention in the media for its extraordinary impact and the rareness over the Mediterranean Sea. The derecho developed over an extreme marine heatwave that persisted during the whole summer. Therefore, the hypothesis of a relationship between the extreme atmospheric event and the extreme marine heatwave rapidly arose, and thus, a possible link with anthropogenic climate change.

This convective event can be considered as extreme from the affected locations point of view (in terms of winds) but also is between one of the most powerful derechos ever recorded in the USA and Europe. Also, the event developed over an extreme marine heatwave that was mainly affecting the western Mediterranean Sea during summer 2022.

Here, by performing model simulations with both the NCAR Model for Prediction Across Scales and the Météo-France nonhydrostatic operational AROME model and using an storyline approach, we find a relationship between the marine heatwave, the actual anthropogenic climate change conditions, and the development of this extremely rare and severe convective event. We also find a future worrying increase in intensity, size and duration of such an event with future climate change conditions.

How to cite: González-Alemán, J. J., Insua-Costa, D., Bazile, E., González-Herrero, S., Miglietta, M. M., Groenemeijer, P., and Donat, M. G.: On the key role of anthropogenic warming in triggering extreme convective events: the case of the destructive Mediterranean derecho in 2022, EGU General Assembly 2024, Vienna, Austria, 14–19 Apr 2024, EGU24-12974, https://doi.org/10.5194/egusphere-egu24-12974, 2024.

EGU24-15314 | ECS | Orals | CL2.3

Investigating typical patterns for co-occurring heatwaves 

Vera Melinda Galfi

The typicality of extreme weather and climate events denotes their property to exhibit similarities in spatial patterns, temporal evolution, and underlying physical processes, with this resemblance intensifying as events become more extreme. Recent findings highlight that highly intense heatwaves, defined as prolonged local temperature anomalies, are consistently associated with specific large-scale circulation patterns. This suggests that there is a typical way to realise very extreme local temperature anomalies. Here, I will explore typical ways for the emergence of extremely intense hemispheric anomalies, characterized by notably large zonal variations in air temperature or geopotential height. This investigation aims to shed light on preferred atmospheric configurations leading to the simultaneous occurrence of heatwaves on a hemispheric scale.

How to cite: Galfi, V. M.: Investigating typical patterns for co-occurring heatwaves, EGU General Assembly 2024, Vienna, Austria, 14–19 Apr 2024, EGU24-15314, https://doi.org/10.5194/egusphere-egu24-15314, 2024.

EGU24-15334 | Orals | CL2.3

Changes in land-atmosphere coupling may amplify increases in very rare temperature extremes 

Douglas Maraun, Reinhard Schiemann, Albert Osso, and Martin Jury

Extreme heat events are becoming more severe. Attribution studies have demonstrated the effect of anthropogenic climate change on recent devastating events, including the heat waves in Canada in 2021, Northern India in 2022 and the Western Mediterranean in 2023. Such impactful events are very rare with return periods of 100 years and more even in present climate. Their rareness is in stark contrast to the typically considered return periods ranging from less than a year to maybe 20 years. This choice might often be inevitable because of practical limitations, mainly the length of observational and climate model records. But generalising from such analyses to extreme events in general tacitly assumes that very rare events respond to climate change in a similar way as the analysed moderate extreme events. Several studies investigating land-atmosphere feedbacks and atmospheric circulation changes indicate, however, that this assumtion may not be justified.

Here we use three single model initial condition large ensembles (SMILES) to assess differences between projected changes in moderate heat extremes (represented by 2-year return values of the hottest day in a year) and very rare extreme events (represented by corresponding 200-year return values). We analyse changes from 1990-2014 to 2075-2099 according to the SSP5-8.5 scenario.

We find large regions where projected changes in very extreme events are markedly different - both stronger or weaker - to those in moderate extreme events. Model uncertainty about these differences is very high though: all considered SMILES suggest that such regions exist, but they do not agree on the locations.  The underlying mechanisms, however, are robust across models: in regions of increasing soil moisture temperature coupling strength, changes in very rare events can be almost twice as high as those in moderate extremes. Vice versa, in regions of decreasing coupling strength, changes may be much weaker. These changes can to a large extent be traced back to changes in precipitation patterns, highlighting the role of atmospheric circulation changes.  

The corresponding patterns emerge already over shorter time horizons and are thus relevant for mid-century projections, low emission scenarios and event attribution studies. Robust inference about these differences is impossible based on individual model simulations, but requires the sample size of SMILES.  Not accounting for these changes could lead to a dramatic misrepresentation of future climate risks from heat events. Our findings therefore confirm the importance of studies specifically targeting very extreme events.

How to cite: Maraun, D., Schiemann, R., Osso, A., and Jury, M.: Changes in land-atmosphere coupling may amplify increases in very rare temperature extremes, EGU General Assembly 2024, Vienna, Austria, 14–19 Apr 2024, EGU24-15334, https://doi.org/10.5194/egusphere-egu24-15334, 2024.

EGU24-15505 | ECS | Posters on site | CL2.3

Evaluating the simulation of extreme events with the land surface model CLM5.0 over Europe for 2018-2022: comparison with in situ and remotely sensed data 

Arpita Bose, Christian Poppe Terán, Bibi Naz, Visakh Sivaprasad, Stefan Kollet, and Harrie-Jan Hendricks Franssen

Climate change is expected to amplify the frequency and intensity of extreme events in the future. Recently there was a series of summers with heat waves and droughts over central Europe from 2018 to 2022, but also severe flooding in 2021. These events had substantial effects on agriculture, water resources, and human lives. To monitor and assess the impacts of extreme events, in situ and remote sensing data for soil moisture, evapotranspiration and carbon fluxes are important. In this study we evaluate simulation results by the Community Land Model (CLM, version 5.0) over the EUROCORDEX domain for past extreme events between 2018 and 2022 and analyze to which degree the model is able to reproduce low soil moisture levels, and changes in evapotranspiration, leaf area index and carbon fluxes in the areas most affected by the extreme event, on the basis of a comparison with in situ (e.g., ICOS) and remotely sensed (e.g., SMAP, MODIS) data. Additionally, we will compare CLM5.0 results to other land surface models, such as ERA5-Land, GLDAS, GLEAM. Our model setup over EUROCORDEX is driven by atmospheric forcings from the ERA5 reanalysis. The soil texture information is obtained from FAO at 10 km resolution and the land use data is from LULC from NCAR mapped to plant/crop functional types. It was found that CLM5.0 overestimates soil moisture and exhibits a wet bias compared to SMAP during heat waves. In addition, the comparison of measured evapotranspiration with CLM5.0 shows that drought stress response is underestimated by the model. A systematic underestimation or overestimation of the impact of past extreme events on the land surface would point to model limitations which is important to resolve to gain confidence in the simulation of future extreme events under conditions of climate change.

How to cite: Bose, A., Poppe Terán, C., Naz, B., Sivaprasad, V., Kollet, S., and Hendricks Franssen, H.-J.: Evaluating the simulation of extreme events with the land surface model CLM5.0 over Europe for 2018-2022: comparison with in situ and remotely sensed data, EGU General Assembly 2024, Vienna, Austria, 14–19 Apr 2024, EGU24-15505, https://doi.org/10.5194/egusphere-egu24-15505, 2024.

EGU24-16575 | ECS | Posters on site | CL2.3

Enhanced surface temperature over India during 1980–2020 and future projections: causal links of the drivers and trends 

Rahul Kumar, Jayanarayanan Kuttippurath, Gopalakrishna Pillai Gopikrishnan, Pankaj Kumar, and Hamza Varikoden

The Earth’s surface temperatures have increased significantly since the beginning of industrialisation. The substantial emissions of greenhouse gases have played a role in global warming and the ongoing climate change, with projections indicating continued trends. This study explores the long-term surface temperature trends in India from 1980 to 2020, utilizing surface, satellite, and reanalysis data. Causal discovery is employed to assess the impact of geophysical drivers on temperature changes. Southern India exhibits the highest mean surface temperatures, while the Himalayas experience the lowest, aligning with solar radiation patterns. The causal discovery analysis identifies the varying influence of atmospheric processes, aerosols, and specific humidity on surface temperature. Positive temperature trends are observed during the pre-monsoon (0.1–0.3 °C dec−1) and post-monsoon (0.2–0.4 °C dec−1) seasons in northwest, northeast, and north-central India. Northeast India demonstrates substantial annual (0.22 ± 0.14 °C dec−1) and monsoon (0.24 ± 0.08 °C dec−1) warming. Post-monsoon trends are positive across India, with the western Himalaya (0.2–0.5 °C dec−1) and northeast India (0.1–0.4 °C dec−1) experiencing the highest values. Projections based on the Coupled Model Intercomparison Project 6 (CMIP6) indicate potential temperature increases of 1.1–5.1 °C by 2100 under the Shared Socioeconomic Pathways (SSP5)–8.5 scenario. The escalating temperature trend in India raises concerns, emphasizing the necessity for adaptation and mitigation measures to counteract the adverse impacts of accelerated warming and regional climate change.

How to cite: Kumar, R., Kuttippurath, J., Gopikrishnan, G. P., Kumar, P., and Varikoden, H.: Enhanced surface temperature over India during 1980–2020 and future projections: causal links of the drivers and trends, EGU General Assembly 2024, Vienna, Austria, 14–19 Apr 2024, EGU24-16575, https://doi.org/10.5194/egusphere-egu24-16575, 2024.

EGU24-17486 | ECS | Orals | CL2.3

Hydro-economic assessment of biophysical drought impacts on agriculture 

Mansi Nagpal, Jasmin Heilemann, Bernd Klauer, Erik Gawel, and Christian Klassert

As climate changes globally and locally, the risk of temperature anomalies, heat waves and droughts have significantly increased. Studies have demonstrated that droughts exert adverse biophysical effects on crop production, posing an unprecedented threat to harvests and resulting in substantial economic losses in Europe. Assessing these biophysical drought impacts on agriculture is crucial for developing effective strategies for drought preparedness, mitigation, and adaptation. This paper contributes to this effort by presenting a framework to estimate economic costs associated with droughts that specifically captures the biophysical impact of climate change on crop output.

Existing analyses for drought damages in agriculture are developed for a specific drought event and primarily focus on the reduction in farmer’s income or crop yields in drought events. In these assessments, the biophysical impacts of droughts are not isolated and evaluated from their effects on other economic variables such as output prices, resulting in inaccurate damages. Additionally, lack of single universal definition of drought adds complexity to estimating the costs of droughts. This paper is aimed to contribute by focusing on agricultural droughts, which occurs when variability in soil moisture affects plant growth and development. We simulate this biophysical effect of drought on crop yields by applying a statistical crop yield model to data on soil moisture, temperature and perception. This approach helps isolate the direct impact of drought on agriculture from other changes in aggregate economic production (e.g. business conditions, commodity prices) and farmer management decisions (e.g. intermediate input use). The simulated biophysical yield effects are then quantified into monetary terms to estimate economic damages of droughts. We further look into the relationship of the economic damages and the intensity of droughts to determine drought thresholds that lead to increased economic losses.

The results provide bottom-up estimates of the economic damages of drought induced water deficiency in agriculture across Germany for the years 2016-2020. The spatio-temporal patterns of drought impacts can be useful for drought policy planning at local and national level. The economic costs estimation framework could be valuable in estimating farmer compensations and loss and damage of droughts. The results of the study can provide reliable estimates of the costs of climate-change-related extreme weather events, which may help inform macroeconomic and integrated impact assessment models of economic losses (and gains).

How to cite: Nagpal, M., Heilemann, J., Klauer, B., Gawel, E., and Klassert, C.: Hydro-economic assessment of biophysical drought impacts on agriculture, EGU General Assembly 2024, Vienna, Austria, 14–19 Apr 2024, EGU24-17486, https://doi.org/10.5194/egusphere-egu24-17486, 2024.

EGU24-17759 | Orals | CL2.3 | Highlight

A daily ensemble of Past and Future Weather for rapid attribution and future perspectives 

Hylke de Vries, Geert Lenderink, Erik van Meijgaard, Bert van Ulft, and Wim de Rooy

Europe faced many extreme events in the year 2023; storms, heatwaves, intense precipitation, widespread flooding, to mention a few. Long-standing records were broken, and re-broken again. The events invariably received a lot of attention by the media and triggered many questions from journalists, eager to report about them. These questions are typically about the frequency or ‘extremeness’ of the event, whether or how already occurred climate change has impacted this frequency, and what the future perspectives are: Would a similar event in future or past climate have (had) a larger or smaller impact? 

It is a challenge for scientists to answer such (attribution) questions rapidly, i.e., before or on the day of the event, or in the immediate aftermath. Weather attribution teams like WWA (World Weather Attribution) now apply standardised procedures based on combining observations and climate modelling, to produce such analyses within weeks.

Here we discuss an approach that may augment the set of already existing tools and frameworks for rapid attribution analysis. The approach is based on regional downscaling in combination with pseudo global warming (PGW). Each day a small downscaled ensemble is created using as initial and boundary conditions the ECMWF analysis and forecasts. In addition to this ‘present-day’ ensemble, also a ‘past’ and ‘future’ ensemble are created using PGW. Due to the synchronicity of the time-evolution of the past, current and future ensembles, the signal-to-noise ratio is high, allowing an immediate estimate of how (thermodynamic) changes could have contributed to the event, and how a similar event in a future climate could look. Inherent limitation of PGW is that it cannot, or only in a limited way, address the frequency-change aspect. 

We illustrate the PGW-ensemble with a number of events that occurred during 2023 such as storm Hans (August), the December snowfall, and the unprecedented yearly rainfall amount in the Netherlands.

How to cite: de Vries, H., Lenderink, G., van Meijgaard, E., van Ulft, B., and de Rooy, W.: A daily ensemble of Past and Future Weather for rapid attribution and future perspectives, EGU General Assembly 2024, Vienna, Austria, 14–19 Apr 2024, EGU24-17759, https://doi.org/10.5194/egusphere-egu24-17759, 2024.

EGU24-17826 | ECS | Orals | CL2.3

Where and when will the next precipitation record be broken?  

Iris de Vries, Erich Fischer, Sebastian Sippel, and Reto Knutti

Not only will climate change lead to more intense extreme precipitation, it will also lead to more frequent record-breaking daily rainfall. Given the tendency of society to design critical infrastructure and emergency plans based on (statistics derived from) historical observations, an increasing occurrence of record-breaking events – events that are more intense than ever recorded – poses a high risk for loss and damage. 

A major challenge in the projection of very extreme events is their inherent rarity. This problem is even more prominent for record events: by definition these events are not present in sample data because they have not yet occurred. An additional difficulty, which is particularly challenging for precipitation, is the high internal variability in and local character of very rare extremes. This implies that, by chance, an observed data sample of finite size might contain few extremes, whereas the true probability and intensity of extremes given by the (unknown) underlying distribution is much higher. In practice, this can lead to “surprise extremes”. 

With the help of extreme value theory, we approach this problem from two angles, using multi-model CMIP6 data and two different ground-station based observational datasets. Firstly we assess, for all observed land grid cells, where the last observed precipitation record is “extraordinarily long ago” given the theoretical record breaking rate prescribed by historical and future climate according to the CMIP6 models. Secondly, we assess where the last observed record value is “extraordinarily low in intensity” given the historical and future modelled distribution of extreme precipitation. Combining these two approaches, we highlight regions on earth where the probability of record precipitation events in the near future is high.

We find that grid points where the last observed precipitation record is extraordinarily long ago are ubiquitous and scattered globally. When combining this with the observed record intensity, the number of grid points that stand out for their high near-term record probability decreases drastically. We find a somewhat higher density of high-probability grid points in Australia and southern South America, but the pattern is not very clear. Nonetheless, every world region contains a number of grid points where the current observed record is both extraordinarily long ago and low in intensity, and where the near-term probability of a new precipitation record is thus high.

How to cite: de Vries, I., Fischer, E., Sippel, S., and Knutti, R.: Where and when will the next precipitation record be broken? , EGU General Assembly 2024, Vienna, Austria, 14–19 Apr 2024, EGU24-17826, https://doi.org/10.5194/egusphere-egu24-17826, 2024.

EGU24-17905 | Posters on site | CL2.3

Climate projections over the Eastern Mediterranean Black Sea region using a pseudo global warming (PGW) approach.  

Patrick Ludwig, Soner C. Bagcaci, Ismail Yücel, M. Tugrul Yilmaz, and Omer L. Sen

This study presents high-resolution (4 km) simulations of the Weather Research and Forecasting (WRF) model using the pseudo-global-warming (PGW) approach. The aim is to investigate seasonal climatic changes in the Eastern Mediterranean Black Sea (EMBS) region between the periods of 2071-2100 and 1985-2014. The climate change signals retrieved from the CMIP6 GCMs under the highest emission scenario (SSP5-8.5) were added to ERA5 data to account for future climate perturbation. During the baseline period  (1995-2014), the dynamically downscaled ERA5 (not perturbed) and ground observations yielded daily near-surface temperature reach correlations of around 0.98 and daily precipitation correlations ranging from 0.60 to 0.76. The WRF simulations for the future climate accurately represent the low-level anticyclonic circulation over the EMBS caused by anomalous ridge development over southern Italy in winter (DJF) and the decrease in vertical pressure velocity and resulting low-level circulation due to heat-low development over the Eastern Mediterranean in summer (JJA) as represented by the GCMs. Likewise, the wetting and drying patterns in the regional WRF simulations match those in the GCM ensemble over the subregions of the EMBS in winter. However, abnormal precipitation increases occur in the WRF simulations over the Caucasus and nearby regions, which is a new insight as this pattern does not exist in the GCM ensemble. This abnormality is likely caused by the higher-than-expected sea-surface temperature (SST) of the Caspian Sea and considering high-resolution simulations over the complex topography of that region.

How to cite: Ludwig, P., Bagcaci, S. C., Yücel, I., Yilmaz, M. T., and Sen, O. L.: Climate projections over the Eastern Mediterranean Black Sea region using a pseudo global warming (PGW) approach. , EGU General Assembly 2024, Vienna, Austria, 14–19 Apr 2024, EGU24-17905, https://doi.org/10.5194/egusphere-egu24-17905, 2024.

EGU24-18632 | ECS | Posters on site | CL2.3

A climatological look on the intersection of synoptic conditions and extreme weather-induced potential impact events in the cross-border region of Austria and Italy 

Sebastian Lehner, Katharina Enigl, Alice Crespi, Massimiliano Pittore, and Klaus Haslinger
Extreme weather events and associated natural hazards pose a significant global threat to all levels of society. It is scientific consensus that climate change contributes to an increasing frequency and intensity of these events. One of the key challenges for decision-makers in the field of civil protection is to deal with the changing landscape of weather-induced impact events, that are driven by climate change. Hence, assessing the current and changing conditions across spatiotemporal scales for extreme weather events under a changing climate is essential.

This study explores the potential of utilizing weather circulation type classification through its correlation with observed weather-induced extreme events and their potential impacts on the local-scale. Thereby, high-impact weather types can be determined as a relevant background field, serving as a measure about the potential of severe weather hazards. We employ ERA5 reanalysis data as baseline meteorological input data to derive long-term and robust time series of weather types from mean sea level pressure that are relevant for the cross-border region of Austria and Italy. The classification scheme 'Gross-Wetter-Typen' (GWT) with 18 classes was used to assign each day a prevailing weather type class. The overlap between derived classes is further investigated by means of unsupervised clustering techniques, to evaluate clusters of groups across all GWT classes. Additional meteorological fields (e.g. equivalent potential temperature, geopotential height, precipitable water, ...) are validated on top of the GWT classes for further characterisation of extreme weather events. Days exhibiting extreme weather-induced potential impact events are derived via percentile methods applied to precipitation data from observational gridded datasets (Enigl et al., 2024, EGU24-10058). Finally, we extend our analysis with an evaluation of potential changes by applying found relationships to state-of-the-art climate model data from the Coupled Model Intercomparison Project 6 (CMIP6) to investigate the changing landscape of potential weather extremes.

Our findings indicate that a specific subset of large-scale weather circulation patterns acts as a crucial precursor to high-impact weather extremes. Furthermore, considering the climate change scenario SSP3-7.0, the frequency and associated precipitation totals linked to these weather patterns exhibit an increase. This suggests a potential rise in both the frequency and intensity of extreme weather events and their corresponding impacts if emissions continue to increase.

How to cite: Lehner, S., Enigl, K., Crespi, A., Pittore, M., and Haslinger, K.: A climatological look on the intersection of synoptic conditions and extreme weather-induced potential impact events in the cross-border region of Austria and Italy, EGU General Assembly 2024, Vienna, Austria, 14–19 Apr 2024, EGU24-18632, https://doi.org/10.5194/egusphere-egu24-18632, 2024.

EGU24-19572 | ECS | Posters on site | CL2.3

Heatwaves and compound extremes under atmospheric blocking 

Magdalena Mittermeier, Laura Suarez-Gutierrez, Yixuan Guo, and Erich Fischer

In early September 2023, Europe was under the influence of a pronounced atmospheric block in the shape of the Greek letter “omega”. Such an omega-blocking is characterized by a persistent anticyclone in the center flanked by two low pressure systems to the south in the west and east. The omega-block interrupts the mean westerly flow and leads to prolonged persistent conditions lasting for at least five days. The core of the omega-blocking in September 2023 was located over Central Europe and Southern Scandinavia, which experienced a heatwave in the first week of September 2023. On the other hand, the regions positioned at the eastern flanks of the omega-blocking (Greece, Bulgaria, Libya) were hit by heavy precipitation resulting in major floods.

While omega-blocking situations can result in severe spatially compounding extremes, there is still a research gap on current and future dynamics of (omega) blocking. Current generations of climate models underestimate blocking frequencies – especially over Europe. This makes it difficult to derive robust statistics about blocking related compound extremes under current and future climate, because the observational record only offers a limited number of event examples and atmospheric blocking underlies a high natural climate variability.

We employ the novel method of ensemble boosting to explicitly boost blocking situations in the Community Earth System Model 2 (CESM2) large ensemble. With this model re-initialization method initial conditions 10 to 30 days before the event are slightly perturbed, which results in hundreds of coherent physical event trajectories (event storylines). This allows to study following research questions: Is the CESM2 model capable of reproducing an omega blocking event with spatially compounding extremes in the magnitude of the September 2023 event? Could the September 2023 event have been even more devastating by chance? Have we experienced anything close to the most intense compound omega-blocking event possible under current climatic conditions? In our poster, we present our research concept as well as preliminary results.

How to cite: Mittermeier, M., Suarez-Gutierrez, L., Guo, Y., and Fischer, E.: Heatwaves and compound extremes under atmospheric blocking, EGU General Assembly 2024, Vienna, Austria, 14–19 Apr 2024, EGU24-19572, https://doi.org/10.5194/egusphere-egu24-19572, 2024.

EGU24-19808 | Posters on site | CL2.3 | Highlight

Unveiling and communicating climate change by near-real-time attribution and projection of the current weather based on nudged storyline simulations 

Helge Goessling, Marylou Athanase, Antonio Sánchez-Benítez, Eva Monfort, and Thomas Jung

Attribution and projection of climate change by event-based storylines has recently been established as a powerful tool that complements the well-established probabilistic approach. Event-based storylines which nudge the observed atmospheric winds in climate models have been particularly helpful in isolating the thermodynamic component of climate change. The approach is characterised by a high signal-to-noise ratio because differences due to internal variability are effectively removed by imposing (via nudging) the same large-scale atmospheric circulation in different climates. Nudging-based storylines make it possible to unveil the “climate change signal of the day” for the actually observed weather, be it an extreme or an every-day event, which comes with a great potential for climate change communication. Here we take the approach one step further and present our efforts to provide nudging-based climate storylines in near-real-time. This includes not only the automated extension of storyline simulations on a daily basis, but also the dissemination via an online tool that allows both scientific and non-scientific users to explore the “climate change signal of the day” for a number of relevant variables in useful and intuitive ways. While the omission of possible dynamical changes and the reliance on a single model need to be communicated as clear limitations, we envisage that tools like our prototype may become an important piece of the future dissemination portfolio of climate change information.

How to cite: Goessling, H., Athanase, M., Sánchez-Benítez, A., Monfort, E., and Jung, T.: Unveiling and communicating climate change by near-real-time attribution and projection of the current weather based on nudged storyline simulations, EGU General Assembly 2024, Vienna, Austria, 14–19 Apr 2024, EGU24-19808, https://doi.org/10.5194/egusphere-egu24-19808, 2024.

EGU24-1509 | ECS | Orals | AS1.29 | Highlight

Future volcanic eruptions delay stratospheric ozone recovery 

Man Mei Chim, Thomas J. Aubry, Nathan Luke Abraham, and Anja Schmidt

At present, volcanic sulfate aerosols can lead to stratospheric ozone loss under the presence of anthropogenic chlorofluorocarbons (CFCs). Recent satellite measurements showed that the 2015 Calbuco eruption, a small-magnitude eruption in Chile with 0.4 Tg of stratospheric sulfur injection, caused large-scale stratospheric ozone depletion during October 2015 in the Antarctic. According to the World Meteorological Organization, atmospheric CFC levels have declined since the 1980s, and the Antarctic ozone hole is expected to be healed by around mid-century. In the absence of CFCs, future volcanic eruptions producing stratospheric volcanic sulfate aerosol are expected to increase stratospheric ozone column concentrations. However, it remains uncertain whether future volcanic eruptions will lead to an earlier or a delayed recovery in stratospheric ozone back to 1980s levels.

To investigate how future volcanic eruptions affect stratospheric ozone recovery, we generated stochastic future eruption scenarios based on an array of bipolar ice cores, satellite measurements and geological records. We then selected the low-end, median and high-end future stochastic scenarios to perform simulations from 2015 to 2100 using a plume-aerosol-chemistry-climate modelling framework, UKESM-VPLUME with interactive volcanic aerosols. Our model results show that future volcanic eruptions can delay the recovery of the global stratospheric ozone column, as opposed to a previous modelling study that suggested future eruptions will lead to an earlier recovery of the global stratospheric ozone column. In addition, our stochastic scenarios show that future eruptions can potentially delay the recovery of Antarctic total ozone column by 2 to 3 years, depending on the timing, magnitude and latitude of the eruptions. Our results offer insights into the role of future volcanic eruptions in affecting global and polar stratospheric ozone recovery. We also highlight the importance of incorporating interactive volcanic sulfate aerosols in future modelling studies to assess the impact of volcanic eruptions on stratospheric ozone.

How to cite: Chim, M. M., Aubry, T. J., Abraham, N. L., and Schmidt, A.: Future volcanic eruptions delay stratospheric ozone recovery, EGU General Assembly 2024, Vienna, Austria, 14–19 Apr 2024, EGU24-1509, https://doi.org/10.5194/egusphere-egu24-1509, 2024.

EGU24-2032 | Posters on site | AS1.29

QBO-composite mean meridional circulation: ERA5 and MIPAS tracer-derived residual velocities  

Tobias Kerzenmacher, Udo Grabowski, Thomas von Clarmann, and Gabriele Stiller
This study focuses on analyzing the Quasi-Biennial Oscillation (QBO)-composite mean meridional circulation during the Michelson Interferometer for Passive Atmospheric Sounding (MIPAS) measurement period 2002 to 2012, using both ERA5 reanalysis and MIPAS tracer-derived velocities. The investigation employs the approach described in the S-RIP report: We have  deseasonalized QBO-W onsets at 20 hPa and have compared zonal-mean vertical and meridional velocities extracted from MIPAS tracer measurements with reanalysis data from ERA5.
 
To infer the effective transport velocities and mixing coefficients of the 2-D atmosphere, we employ a direct inversion technique utilizing tracer measurements from MIPAS (Clarmann and Grabowski 2016). This method involves the integration of the continuity equation over time and determines those vertical and meridional mean velocities that best reproduce the measured trace gas distributions. The advantage of the method is that it does not involve a dynamic model; instead it provides independent observation-based information on the mean meridional circulation.
 
This inversion method is applied to MIPAS monthly zonal mean tracer measurements of the years 2002 to 2012.  This study reveals QBO patterns in tracer-retrieved velocities within the mean circulation. Observed structures compare favourably with S-RIP reanalysis results. Quantitative comparisons reveal differences that have the potential to pinpoint certain processes that might not be adequately represented in the models or deficiencies in the tracer-based inversion of the continuity equation.
 
These results underscore the utility of MIPAS tracer measurements for enhancing the understanding and modeling of mean-meridional circulation in Earth's atmosphere.
 
Reference
von Clarmann, T. and Grabowski, U.: Direct inversion of circulation and mixing from tracer measurements – Part 1: Method, Atmos. Chem. Phys., 16, 14563–14584,  https://doi.org/10.5194/acp-16-14563-2016, 2016.

How to cite: Kerzenmacher, T., Grabowski, U., von Clarmann, T., and Stiller, G.: QBO-composite mean meridional circulation: ERA5 and MIPAS tracer-derived residual velocities , EGU General Assembly 2024, Vienna, Austria, 14–19 Apr 2024, EGU24-2032, https://doi.org/10.5194/egusphere-egu24-2032, 2024.

EGU24-2752 | Posters on site | AS1.29 | Highlight

Warmer Antarctic summers in the last two decades linked to earlier stratospheric final warming occurrences 

Hyesun Choi, Hataek Kwon, Seong-Joong Kim, and Baek-Min Kim

We proposed a link between the interannual and decadal variability in Antarctic surface climate during the austral summertime (December-January) and the timing of stratospheric final warming (SFW) occurrences. This connection is based on 44 years of reanalysis data and in-situ observation spanning from 1979 to 2023. Positive surface pressure anomalies over Antarctica, associated with an earlier occurrence of SFW, develop through stratosphere-troposphere downward coupling, which leads to a warmer surface in Antarctica, except for  the Antarctic Peninsula where a cooler surface is observed. On the contrary, the surface pressure and temperature anomalies associated with the later occurrence of SFW exhibit almost opposite or weaker behaviors. Congruence analyses support that a trend towards earlier SFW occurrences can explain the pause of the cooling trend or a slight reversal into the warming trend of the interior Antarctic surface through strengthening anti-cyclonic surface circulation since the 2000s. The resulting surface temperature responses can leave imprints on sea-ice concentration trends in the high-latitude Southern Hemisphere, displaying the dipole anomalies with an increase and a decrease of sea ice over the Antarctic Peninsula and northern Ross Sea, respectively.

How to cite: Choi, H., Kwon, H., Kim, S.-J., and Kim, B.-M.: Warmer Antarctic summers in the last two decades linked to earlier stratospheric final warming occurrences, EGU General Assembly 2024, Vienna, Austria, 14–19 Apr 2024, EGU24-2752, https://doi.org/10.5194/egusphere-egu24-2752, 2024.

Sudden Stratospheric Warming (SSW) is an important source of subseasonal-toseasonal predictability due to its significant and long-lasting impacts on surface climate. However, the mechanism of its downward coupling has not yet been fully elucidated. In this study, we investigate the downward coupling mechanism of SSW in terms of mass redistribution. Out of the 65-year dataset of the Japanese 55-year Reanalysis (JRA-55), 40 SSW events are identified. Their composite shows a significant increase of tropospheric geopotential and pressure anomalies over the Arctic (60-90°N) after the onset with a prominent surface amplification. The decomposition of tropospheric anomalies into surface pressure and air temperature components reveals that the downward coupling mainly results from surface pressure change. It is further found that surface pressure change during the SSW onset is primarily caused by the poleward mass flux near the tropopause, which is mainly driven by momentum flux change in the upper troposphere. This momentum flux change is consistent with the poleward propagation of wave, and it is may associated with the warm temperature anomalies during the SSW. These findings provide a new insight on SSW downward coupling and surface amplification.

How to cite: Son, S.-W. and Hong, D.-C.: Downward coupling mechanism of Sudden Stratospheric Warming: A Mass Flux Perspective, EGU General Assembly 2024, Vienna, Austria, 14–19 Apr 2024, EGU24-3026, https://doi.org/10.5194/egusphere-egu24-3026, 2024.

Using observation and reanalysis data, we investigated the effect of the sea surface temperature anomalies associated with ENSO Modoki from September to October on interannual variations in Antarctic stratospheric ozone from October to November. It was found that the planetary wave anomalies generated by ENSO Modoki in the tropical troposphere propagate to the southern mid- and then high-latitude stratosphere. The planetary wave anomalies have a profound impact on the polar vortex, subsequently affecting the interannual variations in Antarctic stratospheric ozone. Further analysis revealed that the responses of the polar vortex and ozone to ENSO Modoki are mainly modulated by the wave-1 and wave-3 components, and the effect of wave-2 is opposite and offset by those of wave-1 and wave-3. The contribution of the residual waves (after removing waves 1, 2 and 3, and the remaining waves) are relatively small. Furthermore, we evaluated the performance of CMIP6 models in simulating the impacts of ENSO Modoki on the southern stratospheric polar vortex and ozone. We selected seven models, that include stratospheric processes and stratospheric chemical ozone. We found that all of them can capable of distinguishing between eastern Pacific ENSO and ENSO Modoki events. However, only GISS-E2-1-G and MPI-ESM-1-2-HAM can simulate the patterns of ozone, circulation and temperature in the Southern Hemisphere in a manner that closely resembles the reanalysis results. Further analysis indicated that these two models can better simulate the propagation of planetary wave activities in the troposphere forced by ENSO Modoki, whereas the other models produce significantly different results to those obtained from observations.

How to cite: Niu, Y.: ENSO Modoki impacts on the Interannual Variations of Spring Antarctic Stratospheric Ozone, EGU General Assembly 2024, Vienna, Austria, 14–19 Apr 2024, EGU24-3124, https://doi.org/10.5194/egusphere-egu24-3124, 2024.

The intricate interplay between atmospheric composition changes and climate dynamics is garnering increasing attention due to its implications for weather and climate prediction. In this talk, I leverage advanced modeling techniques and new observational climate data records to provide examples of chemistry-climate coupling on timescales ranging from subseasonal-to-seasonal weather to long-term climate trends. These examples include the impact of dynamical processes and abrupt events such as sudden stratospheric warmings and the Hunga-Tonga eruption on atmospheric composition anomalies and their feedbacks on meteorological and climate phenomena, as well as the impacts of stratospheric ozone depletion and recovery on climate radiative forcing and atmosphere-ocean dynamics. The findings underscore the important feedback loops between atmospheric composition and climate dynamics via radiative processes, emphasizing the need for a realistic representation of composition anomalies in weather forecast systems and climate models.

How to cite: Hegglin, M. I.: Emerging importance of chemistry-climate coupling on weather to climate timescales, EGU General Assembly 2024, Vienna, Austria, 14–19 Apr 2024, EGU24-3155, https://doi.org/10.5194/egusphere-egu24-3155, 2024.

EGU24-4273 | ECS | Orals | AS1.29

Defining Arctic Stratospheric Polar Vortex Intensification Events 

Jinlong Huang and Peter Hitchcock

 Using the ERA5 reanalysis data, we identify seven easily calculable indices of the strength of theArctic stratospheric vortex: zonal winds at 10 hPa and temperature or height anomalies at 10 , 50, and 100 hPa.We then compare the climatological statistics and meteorological properties of strong and weak events basedon these indices. We particularly consider the sensitivity of the event statistics to the choice of thresholds, theuse of these indices in capturing stratosphere–troposphere coupling, and meteorological conditions relevant tochemical ozone depletion. The frequency, seasonal distribution, and interdecadal variability of strong eventsis more sensitive to threshold or index choice compared to weak events. Composites of polar-cap geopotentialheight anomalies are found to differ significantly based on the choice of index. In particular, height-basedevents reveal a strong and immediate barotropic response near the central date due to surface pressurefluctuations, making it more difficult to regard central dates of height-based events as purely stratosphericin origin. We further characterize the relationship of all indices to conditions relevant to chemical ozonedepletion, finding that temperature-based indices in the lower stratosphere perform best. Finally, we presentfour dynamical benchmarks used to assess and compare the representation of strong events in climate models.Our results highlight the challenges in determining the optimal definition for strong events and emphasizethe implications of different choices, providing valuable insights for guiding future studies in defining strong events. 

How to cite: Huang, J. and Hitchcock, P.: Defining Arctic Stratospheric Polar Vortex Intensification Events, EGU General Assembly 2024, Vienna, Austria, 14–19 Apr 2024, EGU24-4273, https://doi.org/10.5194/egusphere-egu24-4273, 2024.

EGU24-4343 | ECS | Orals | AS1.29

Exploring the role of tropospheric stationary waves for the North Pacific response to SSWs 

Rachel Wai-Ying Wu, Hilla Afargan-Gerstman, and Daniela I.V. Domeisen

Stratospheric variability can have a significant impact on surface weather extremes in winter, in particular during stratospheric extreme events, so-called sudden stratospheric warming (SSW) events. The stratospheric downward impact has been shown to be communicated by both planetary-scale and synoptic-scale waves, but their relative roles and interactions are not fully understood. Since there is a strong average response to stratospheric forcing over the North Atlantic but a weak response over the North Pacific, studies of SSW downward impact generally focus on the North Atlantic, where the synoptic eddy-feedback plays a strong role. We here examine the relative roles of planetary-scale waves for the North Pacific after SSW events. By examining the case-by-case response over the North Pacific following SSW onset using ERA5 reanalysis, we identify differences between events in terms of their interactions between the wave anomalies induced by the stratosphere and the tropospheric stationary waves. Specifically, the destructive and constructive interference of zonal wavenumber-1 anomalies plays a dominant role in contributing to different responses over the North Pacific, which are associated with an equatorward and a poleward jet shift, respectively. We suggest that SSW events can exhibit opposite responses over the North Pacific, potentially explaining the generally weak response observed in this region when averaging across all SSW events.

How to cite: Wu, R. W.-Y., Afargan-Gerstman, H., and Domeisen, D. I. V.: Exploring the role of tropospheric stationary waves for the North Pacific response to SSWs, EGU General Assembly 2024, Vienna, Austria, 14–19 Apr 2024, EGU24-4343, https://doi.org/10.5194/egusphere-egu24-4343, 2024.

EGU24-4617 | Posters on site | AS1.29

Antarctic tropopause by ozonesonde profiles from the Polar Atmospheric Chemistry at the Tropopause PACT database 

Gennadi Milinevsky, Oksana Ivaniha, Andrew Klekociuk, Ruixian Yu, Oleksandr Evtushevsky, Asen Grytsai, and Yu Shi

Stratosphere–troposphere exchange can be considered globally within the framework of the atmosphere's general circulation as the transfer of air masses through the tropopause with ascending (descending) flows in the tropics (extratropical latitudes). The report aims to study the features and behavior of thermal and chemical tropopause to determine the troposphere-stratosphere interaction in the ozone hole in the Antarctic region. To calculate the height of the polar tropopause based on vertical temperature profiles (thermal tropopause), ozone profiles (ozone tropopause), and water vapor ("water" tropopause), we used the Polar Atmospheric Chemistry at the Tropopause (PACT) database that provides high-resolution measurements from polar ozonesondes flown from selected Antarctic sites. The vertical resolution of the raw ozonesonde measurements is typically 10 meters, which allows us to determine the tropopause height with high accuracy. We calculated the monthly mean ozone and thermal tropopause height variations from the PACT data. Seasonal thermal tropopause and ozone tropopause height monthly changes at the selected Antarctic stations were examined. We developed an algorithm for determining the tropopause height based on vertical profiles of water vapor, studied the relative position of the three tropopauses by altitude, and revealed the anticorrelation of the water and thermal tropopauses. The analysis shows that during the ozone hole formation period in August–September, the vertical stability of the upper troposphere and lower stratosphere is disturbed, and the ozone tropopause can drop below the thermal one, which can create conditions for the spread of stratospheric air into the troposphere and cause conditions for the stratosphere–troposphere exchange.

This work was partly supported by the projects of the Australian Antarctic Division and by the International Center of Future Science, Jilin University, under Grant No G2023129024.

How to cite: Milinevsky, G., Ivaniha, O., Klekociuk, A., Yu, R., Evtushevsky, O., Grytsai, A., and Shi, Y.: Antarctic tropopause by ozonesonde profiles from the Polar Atmospheric Chemistry at the Tropopause PACT database, EGU General Assembly 2024, Vienna, Austria, 14–19 Apr 2024, EGU24-4617, https://doi.org/10.5194/egusphere-egu24-4617, 2024.

EGU24-5022 | Posters on site | AS1.29

Antarctic total ozone longitude–latitude dependence on sudden stratospheric warmings 

Asen Grytsai, Ruixian Yu, Alina Burmay, Gennadi Milinevsky, Oleksandr Evtushevsky, Andrew Klekociuk, Oleksandr Poluden, Xiaolong Wang, Yu Shi, and Oksana Ivaniha

We use Multi-Sensor Reanalysis and ground-based total ozone content (TOC) data to study total ozone variations in Antarctica near the dates of sudden stratospheric warmings (SSW). Three events were analyzed, including the warmings in 1988, 2002 (major warming), and 2019. All of them occurred in September, during the period of ozone hole development. Total ozone over stations with different latitudes and longitudes was considered to understand the properties of its variations in different parts of the stratospheric polar vortex and over the surrounding area. The 1979–2022 TOC climatology was obtained from the Multi-Sensor Reanalysis data. The multi-year mean shows a main total ozone minimum in September–October with values lower than 200 Dobson Units (DU) in the Atlantic longitudinal sector (Rothera, Faraday/Vernadsky). The annual TOC maximum of 280–300 DU occurs at the Antarctic stations, mainly in December. The exception is Dumont-d’Urville, located in the zonal maximum region and characterized by higher ozone levels of about 340 DU, which are reached in October–November. Composite analysis is carried out to study the interrelation between SSW events and total ozone variations. We considered a time range covering 60 days before and 60 days after an SSW. Of course, three events do not allow proper statistical material, but some tendencies can be traced. Preliminarily, there is a TOC increase by ~100 DU at Amundsen-Scott (located at the South Pole) near the SSW date. The corresponding increase in the Atlantic longitudinal sector (Rothera, Faraday/Vernadsky, and even mid-latitude Ushuaia station) occurred several days later. It is noticed that after several weeks, TOC values in the Atlantic sector become lower than climatological ones, which a partial recovery of the polar vortex can cause. In the opposite Australian longitudinal sector, TOC values are maintained over the climatological level by tens of DU at least 30–40 days before the SSW. Consequently, the SSW events seem to be prepared by stratospheric processes connected with the intensification of the TOC zonal maximum.

This work was partly supported by the projects of the Australian Antarctic Division and by the International Center of Future Science, Jilin University, under Grant No G2023129024.

How to cite: Grytsai, A., Yu, R., Burmay, A., Milinevsky, G., Evtushevsky, O., Klekociuk, A., Poluden, O., Wang, X., Shi, Y., and Ivaniha, O.: Antarctic total ozone longitude–latitude dependence on sudden stratospheric warmings, EGU General Assembly 2024, Vienna, Austria, 14–19 Apr 2024, EGU24-5022, https://doi.org/10.5194/egusphere-egu24-5022, 2024.

This study presents the very first attempt to directly simulate a full cycle of the quasi-biennial oscillation (QBO) in a global storm-resolving model (GSRM) that explicitly resolves deep convection and gravity waves instead of parameterizing them. Using the ICOsahedral Nonhydrostatic (ICON) model with a horizontal and vertical resolution of about 5 km and 400 m, respectively, we show that a GSRM in the convective gray zone is in principle capable of simulating the basic dynamics that lead to a QBO-like oscillation of the zonal wind in the tropical stratosphere. ICON shows overall good fidelity in simulating the downward propagation of QBO jets in the upper tropical stratosphere, which happens also for the right reasons. In the lower stratosphere, however, ICON does not simulate the downward propagation of the QBO jets to the tropopause, predominantly due to a pronounced lack of planetary-scale wave forcing. As a consequence, the QBO jets degrade with increasing simulation time and lose strength substantially. We show that the lack of planetary-scale wave forcing in the lower stratosphere is caused by a lack of planetary-scale wave momentum fluxes entering the stratosphere, which are about 20%–40% too weak. We attribute this lack of planetary-scale wave momentum flux to a substantial underestimation of the spatio-temporal variability of tropical deep convection in general and convectively coupled equatorial waves in the tropical troposphere in particular. While conventional general circulation models can compensate for a lack in resolved wave forcing by tuning the parameterized gravity wave forcing, GSRMs no longer have this tuning screw, making their QBO more susceptible to being influenced by tropospheric mean state biases. We thus conclude that simulating a realistic spatio-temporal variability of tropical convection is currently the main roadblock towards simulating a reasonable QBO in GSRMs.

How to cite: Franke, H. and Giorgetta, M.: Towards a direct simulation of a full cycle of the quasi-biennial oscillation in a global storm-resolving model, EGU General Assembly 2024, Vienna, Austria, 14–19 Apr 2024, EGU24-5302, https://doi.org/10.5194/egusphere-egu24-5302, 2024.

EGU24-6682 | Posters on site | AS1.29

Moist bias in the Pacific upper troposphere and lower stratosphere (UTLS) in climate models affects regional circulation patterns 

Felix Ploeger, Thomas Birner, Edward Charlesworth, Paul Konopka, and Rolf Müller

Water vapour in the UTLS is a key radiative agent and a crucial factor in the Earth's climate system. Here, we investigate a common regional moist bias in the Pacific UTLS during northern summer in state-of-the-art climate models. We demonstrate, through a combination of climate model experiments and satellite observations that the Pacific moist bias amplifies local longwave cooling which ultimately impacts regional circulation systems in the UTLS. Related impacts involve a strengthening of isentropic potential vorticity gradients, strengthened westerlies in the Pacific westerly duct region, and a zonally displaced anticyclonic monsoon circulation. Furthermore, we show that the regional Pacific moist bias can be significantly reduced by applying a Lagrangian, less diffusive transport scheme and that such a model improvement could be important for improving the simulation of regional circulation systems, in particular in the Asian monsoon and Pacific region.


How to cite: Ploeger, F., Birner, T., Charlesworth, E., Konopka, P., and Müller, R.: Moist bias in the Pacific upper troposphere and lower stratosphere (UTLS) in climate models affects regional circulation patterns, EGU General Assembly 2024, Vienna, Austria, 14–19 Apr 2024, EGU24-6682, https://doi.org/10.5194/egusphere-egu24-6682, 2024.

A modulation has been identified of the tropical Madden-Julian oscillation (MJO) by the stratospheric quasi-biennial oscillation (QBO) such that the MJO in boreal winter is ~ 40% stronger and persists ~10 days longer during the easterly QBO phase (QBOE) than during the westerly phase.  A proposed mechanism is reductions of tropical lower stratospheric static stability during QBOE caused by (1) the QBO induced meridional circulation; and (2) QBO influences on extratropical wave forcing of the stratospheric residual meridional circulation during early winter.  Here, long-term variability of the QBO-MJO connection and associated variability of near-tropopause tropical static stability and extratropical wave forcing are investigated using European Center reanalysis data for the 1959-2021 period.  During the most reliable (post-satellite) part of the record beginning in 1979, a strengthening of the QBO-MJO modulation has occurred during a time when tropical static stability in the lowermost stratosphere and uppermost troposphere has been decreasing and extratropical wave forcing in early winter has been increasing.  A high inverse correlation (R = -0.87) is obtained during this period between early winter wave forcing anomalies and wintertime tropical lower stratospheric static stability.  Regression relationships are used to show that positive trends in early winter wave forcing during this period have likely contributed to decreases in tropical static stability, favoring a stronger QBO-MJO connection.  As shown in previous work, increased sea level pressure anomalies over northern Eurasia produced by Arctic sea ice loss may have been a significant source of the observed positive trends in early winter wave forcing.

How to cite: Hood, L. and Hoopes, C. A.: Arctic Sea Ice Loss, Long-Term Trends in Extratropical Wave Forcing, and the Observed Strengthening of the QBO-MJO Connection, EGU General Assembly 2024, Vienna, Austria, 14–19 Apr 2024, EGU24-6801, https://doi.org/10.5194/egusphere-egu24-6801, 2024.

EGU24-6876 | Orals | AS1.29 | Highlight

The Influence of Stratospheric Hydration from the Hunga Eruption on Chemical Processing in the Stratospheric Winter Polar Vortices 

Michelle Santee, Gloria Manney, Alyn Lambert, Luis Millan, Nathaniel Livesey, Michael Pitts, Lucien Froidevaux, and William Read

The January 2022 eruption of the undersea Hunga volcano injected an unprecedented amount of water vapor directly into the stratosphere. In this talk, we will use measurements of gas-phase constituents from Aura MLS (Microwave Limb Sounder) and polar stratospheric clouds (PSCs) from CALIOP (Cloud-Aerosol Lidar with Orthogonal Polarization) on CALIPSO (Cloud-Aerosol Lidar and Infrared Pathfinder Satellite Observations) together with meteorological reanalyses to investigate how the extraordinary stratospheric hydration and accompanying anomalies in stratospheric temperature and circulation from Hunga affected chemical processing and ozone destruction in the polar lower stratosphere. We will focus on the Antarctic ozone hole season of 2023, when the excess moisture led to unusually early and vertically extensive PSC activity and heterogeneous chlorine activation (i.e., depleted HCl and enhanced ClO) in early winter. Although unmatched in the satellite record, the early-winter upper-level chlorine activation was insufficient to induce substantial ozone loss. Chlorine activation, denitrification, and dehydration processes saturated in midwinter, with trace gas evolution essentially following the climatological mean thereafter. Thus, despite the exceptional early-winter conditions, cumulative ozone losses in the 2023 austral spring were mostly unremarkable because stratospheric chemical processing saturated, as typically happens in the Antarctic. We will also discuss the 2022 Antarctic winter, when the Hunga plume was effectively excluded from the southern polar region by the strong transport barrier at the edge of the vortex. As a result, Hunga had little effect on either the vortex itself or the chemical processing and ozone loss that took place within it during the 2022 Antarctic winter/spring. Finally, we will touch briefly on the influence of Hunga on the 2023/2024 Arctic winter that will have just concluded.

How to cite: Santee, M., Manney, G., Lambert, A., Millan, L., Livesey, N., Pitts, M., Froidevaux, L., and Read, W.: The Influence of Stratospheric Hydration from the Hunga Eruption on Chemical Processing in the Stratospheric Winter Polar Vortices, EGU General Assembly 2024, Vienna, Austria, 14–19 Apr 2024, EGU24-6876, https://doi.org/10.5194/egusphere-egu24-6876, 2024.

EGU24-7337 | Orals | AS1.29

Peculiarities and trends in the vertical ozone distribution 1973 - 2023 at Faraday/Vernadsky Antarctic station 

Yulia Andrienko, Asen Grytsai, Gennadi Milinevsky, Jonathan Shanklin, Yu Shi, Ruixian Yu, and Oleksandr Poluden

We processed vertical ozone distribution measurements from the Faraday/Vernadsky station made by the Umkehr method for the 1973–2023 period. Ozone profiles in this unique series of ozone observations since 1973 cover pre-ozone hole times and the ozone hole period. Umkehr data from about 1200 Dobson spectrophotometer observations was processed using the UMK92 ozone profile retrieval algorithm. The Faraday/Vernadsky station is located at the edge of the ozone hole area; therefore, the total ozone column values over the station can change rapidly. This feature is seen clearly in Umkehr profiles measured during the same day in the morning and evening. In the pre-ozone hole period 1973–1983, the ozone partial column in ozone profiles maximum varies from 134 DU/layer to 56 DU/layer with the altitude of the profile maximum at 14–18 km. Profiles in ozone hole conditions usually have two maxima. The altitude area of significant depletion in ozone partial column values between these maxima located in the usual highest ozone concentration height. The values in altitudes at expected ozone maximum drop to 14–26 DU/layer. The 50-year trend in ozone profiles in the atmosphere above Faraday/Vernadsky station from pre-ozone hole times till 2023 is described and discussed.

How to cite: Andrienko, Y., Grytsai, A., Milinevsky, G., Shanklin, J., Shi, Y., Yu, R., and Poluden, O.: Peculiarities and trends in the vertical ozone distribution 1973 - 2023 at Faraday/Vernadsky Antarctic station, EGU General Assembly 2024, Vienna, Austria, 14–19 Apr 2024, EGU24-7337, https://doi.org/10.5194/egusphere-egu24-7337, 2024.

EGU24-7531 | Orals | AS1.29

Cloud climatologies from reanalysis datasets – an intercomparison 

Axel Lauer, Lisa Bock, and Birgit Hassler

Through their significant impact on the short- and longwave radiation and their pivotal role in the hydrological cycle, clouds and their response to climate change are a key component in present-day and future climate. As part of the SPARC Reanalysis Intercomparison Project (S-RIP) phase 2, we analyze cloud climatologies from twelve reanalysis datasets including, for instance, ERA5, MERRA2 and JRA-55. The study focuses on parameters that are available from most reanalysis datasets such as cloud fraction, cloud liquid and ice water content as well as cloud radiative effects on monthly to multi-year time scales. Geographical distributions, variability and statistical properties of the cloud parameters from the reanalyses for specific cloud regimes and regions are compared and put into context with satellite observations. First results show that more recent reanalysis products are in closer agreement with the satellite data and that in contrast to multi-model means of models participating in the Coupled Model Intercomparison Project (CMIP), multi-reanalysis means do not outperform individual reanalyses. For a consistent processing of all reanalysis and satellite datasets, the Earth System Model Evaluation Tool (ESMValTool) is applied. ESMValTool is a community developed open-source software tool that provides common operations such regridding data onto the same grid, masking of missing values, area extraction, and basic statistics such as seasonal means, annual means, area means, etc. which facilitates analysis and a fair intercomparison of the datasets. For comparison with satellite data, multiple products for each parameter are used to estimate observational uncertainties.

How to cite: Lauer, A., Bock, L., and Hassler, B.: Cloud climatologies from reanalysis datasets – an intercomparison, EGU General Assembly 2024, Vienna, Austria, 14–19 Apr 2024, EGU24-7531, https://doi.org/10.5194/egusphere-egu24-7531, 2024.

EGU24-8035 | Orals | AS1.29

Multi-decadal variability controls short-termstratospheric water vapor trends 

Mengchu Tao, Paul Konopka, Jonathon S. Wright, Yi Liu, Jianchun Bian, Sean M. Davis, Yue Jia, and Felix Ploeger

Stratospheric water vapor increases are expected in response to greenhouse gas-forced climate warming, and these changes act as a positive feedback to surface climate. Previous efforts at inferring trends from the 3–4 decade-long observational stratospheric water vapor record have yielded conflicting results. Here we show that a robust multi-decadal variation of water vapor concentrations exists in most parts of the stratosphere based on satellite observations and atmospheric model simulations, which clearly divides the past 40 years into two wet decades (1986–1997; 2010–2020) and one dry decade (1998–2009). This multidecadal variation, especially pronounced in the lower to middle stratosphere and in the northern hemisphere, is associated with decadal temperature anomalies (±0.2 K) at the cold point tropopause and a hemispheric asymmetry in changes of the Brewer-Dobson circulation modulating methane oxidation. Multi-decadal variability must be taken into account when evaluating stratospheric water vapor trends over recent decades.

How to cite: Tao, M., Konopka, P., Wright, J. S., Liu, Y., Bian, J., Davis, S. M., Jia, Y., and Ploeger, F.: Multi-decadal variability controls short-termstratospheric water vapor trends, EGU General Assembly 2024, Vienna, Austria, 14–19 Apr 2024, EGU24-8035, https://doi.org/10.5194/egusphere-egu24-8035, 2024.

EGU24-8591 | ECS | Posters on site | AS1.29

Statistical Characteristics of the Long-Term Variations in Major Sudden Stratospheric Warming Events  

Yuli Zhang, You Yi, Xiaoyu Ren, and Yi Liu

 We investigate the statistical characteristics and the long-term variations of major sudden stratospheric warming (SSW) events in the Northern Hemisphere. We find that the strength and duration of major SSW events have increased from 1958 to 2019 and that this is due to the strengthening of the winter planetary wave activity. We find that the frequency of displacement and split SSW events differs between early, middle, and late winter. Early and middle winter are dominated by displacement and split SSW events, respectively, but the frequency of the two types of events is almost equal in late winter. This is due to the differences in the relative strength of wavenumber-1 and wavenumber-2 planetary wave activity in the three winter periods. As a result of the increase in upward planetary wave activity and the decrease in westerly winds around the polar vortex in middle winter, a shift in the timing of SSW events toward middle winter is detected. In addition, we revealed the influence of the downward propagation of different types of SSW events on the surface temperature anomaly. There were surface cold centers in Russia and northern China after the middle split SSW events; by contrast, there were more cold events in North America after the middle split SSW events. 

How to cite: Zhang, Y., Yi, Y., Ren, X., and Liu, Y.: Statistical Characteristics of the Long-Term Variations in Major Sudden Stratospheric Warming Events , EGU General Assembly 2024, Vienna, Austria, 14–19 Apr 2024, EGU24-8591, https://doi.org/10.5194/egusphere-egu24-8591, 2024.

EGU24-8621 | Orals | AS1.29

Extratropical teleconnections in an ensemble of models nudged towards the observed equatorial QBO 

Martin Andrews, Neal Butchart, James Anstey, Ewa Bednarz, Dillon Elsbury, Vinay Kumar, Froila Palmeiro, Natasha Trencham, Zhaoyang Chai, Qi Tang, Jinbo Xie, Pu Lin, Francois Lott, Shingo Watanabe, Aleena Jaison, Jeff Knight, Hiroaki Naoe, and Kohei Yoshida

The Quasi-Biennial Oscillation (QBO) is the leading natural model of interannual variability of the zonal mean wind in the equatorial stratosphere, consisting of alternating regions of easterly and westerly zonal wind that descend through the equatorial stratosphere with a mean period of approximately 28 months. Its dominant influence on the dynamical structure of the equatorial stratosphere raises the prospect of teleconnections to the extratropical atmosphere. For example, the QBO has been linked to variability in the Northern Hemisphere winter stratospheric polar vortex, the timing and frequency of sudden stratospheric warmings, the phase of the North Atlantic Oscillation, and the modulation of tropospheric mid-latitude waves in the Pacific region. However, the reproduction of these extratropical teleconnections in free-running models relies upon on a quantitatively realistic internally-generated QBO, and the ability of the model dynamics to respond to this QBO. To isolate the dynamical response, a new experiment protocol, defined by the Atmospheric Processes and their Role in Climate (APARC) Quasi-Biennial Oscillation initiative (QBOi), describes how the observed equatorial stratospheric zonal winds can be imposed in model experiments. This allows the dynamical response across different models with similar and realistic QBOs to be analysed. Using a multi-model ensemble generated by QBOi modelling centres, we present an assessment of the extratropical teleconnections in comparison with observations.

How to cite: Andrews, M., Butchart, N., Anstey, J., Bednarz, E., Elsbury, D., Kumar, V., Palmeiro, F., Trencham, N., Chai, Z., Tang, Q., Xie, J., Lin, P., Lott, F., Watanabe, S., Jaison, A., Knight, J., Naoe, H., and Yoshida, K.: Extratropical teleconnections in an ensemble of models nudged towards the observed equatorial QBO, EGU General Assembly 2024, Vienna, Austria, 14–19 Apr 2024, EGU24-8621, https://doi.org/10.5194/egusphere-egu24-8621, 2024.

EGU24-8884 | ECS | Orals | AS1.29 | Highlight

The Role of the Stratosphere in Driving Uncertainties in the Southern Hemisphere Future Climate 

Julia Mindlin, Carolina S. Vera, Theodore G. Shepherd, and Marisol Osman

The strength and latitudinal position of the extratropical eddy-driven jet (EDJ) in the Southern Hemisphere (SH) winter and summer is naturally forced by the conditions of the tropical oceans and by the variability of the SH stratospheric polar vortex (SPV). Uncertainty in the responses of these remote drivers (RDs) of extratropical circulation to anthropogenic forcing leads to uncertainty in the future strength and latitude of the EDJ. In turn, these changes in tropospheric circulation can lead to changes at the regional scale. During this century, the combined effect of ozone recovery and the increase in greenhouse gases (GHGs) will influence the SPV. Therefore, understanding the ‘tug-of-war’ between these two anthropogenic forcings is crucial to understand future projections. Moreover, the influences of the stratosphere will be combined with the influences of forced changes in the tropics. This complex interplay between RDs and the magnitude of each RD’s response to anthropogenic forcings differs among Global Climate Models (GCMs), which leads to different responses of the EDJ and regional climate. In this work we analyze an ensemble of CMIP6 models to study the role of forced responses in the SPV in driving changes in climate projections, and how the influence of the stratospheric changes combines with the influence of the changes in a small set of tropical RDs. In particular, we find that a strengthening of the SPV leads to a strengthening and small poleward shift of the EDJ in winter, and that a delay in the SPV breakdown date leads to a strong poleward shift of the EDJ in summer. The evolution of the summer circulation response in CMIP6 models during the twenty-first century can be explained from the combined effect of ozone recovery and GHG increase. At the regional scale, in winter, a strengthening of the SPV leads to drying in Southeastern South America and wetting in Tierra del Fuego, in the south of South America, while in summer, a SPV breakdown delay leads to wetting in the west coast of all three large extratropical continental sectors and the coasts of Antarctica. Finally, we develop storylines of future circulation and precipitation changes in both summer and winter which help understand the relative role of the SPV among other dynamical drivers of change in the SH. 

How to cite: Mindlin, J., Vera, C. S., Shepherd, T. G., and Osman, M.: The Role of the Stratosphere in Driving Uncertainties in the Southern Hemisphere Future Climate, EGU General Assembly 2024, Vienna, Austria, 14–19 Apr 2024, EGU24-8884, https://doi.org/10.5194/egusphere-egu24-8884, 2024.

EGU24-8901 | Posters on site | AS1.29

Station versus reanalysis-based proxies for the Quasi-Biennial Oscillation (QBO): How do they differ – and does it matter? 

Peter Braesicke, Benjamin Ertl, and Tobias Kerzenmacher

The Quasi-Biennial Oscillation (QBO) has long been recognized as an important factor shaping hemispheric large-scale dynamics, in particular serving as a sort of switch for polar vortex dynamics in the Northern Hemisphere (NH). When calculating (extratropical) correlations or composites for different phases of the QBO some subjective choices have to be made, including “Which timeseries should be used?” or “How to define the phasing?”.

Here, we will examine - from a historical perspective - the differences between a traditional station based QBO timeseries (specifically, the “Singapore” zonal wind timeseries provided by the Free University of Berlin and currently continued at the Karlsruhe Institute of Technology) in contrast to reanalysis based timeseries (specifically, zonal mean zonal wind timeseries from ERA5, and near station profiles from ERA5 corresponding to the station’s location).

We explore the climatological properties of the QBO, including composites and phase transitions. Additionally, we examine how the choice of QBO proxy relates to and influences the perception and interpretation of the Holton-Tan relationship, which describes the potential link between the phases of the QBO and the strength of the stratospheric polar vortex – in particular during NH winter.

Data and tools are accessible via the ATMOHub at https://www.atmohub.kit.edu/.

How to cite: Braesicke, P., Ertl, B., and Kerzenmacher, T.: Station versus reanalysis-based proxies for the Quasi-Biennial Oscillation (QBO): How do they differ – and does it matter?, EGU General Assembly 2024, Vienna, Austria, 14–19 Apr 2024, EGU24-8901, https://doi.org/10.5194/egusphere-egu24-8901, 2024.

EGU24-9249 | ECS | Orals | AS1.29 | Highlight

Impact of the 2022 Hunga Tonga Volcano on Global Middle Atmosphere Water Vapour and Climate Implications 

Alistair Bell, Gunter Stober, Klemens Hocke, and Axel Murk

The 2022 Hunga Tonga–Hunga Haʻapai volcano eruption was a major global event, injecting a significant volume of water vapour into the stratosphere and contributing to an estimated 10% increase in global stratospheric water vapour. Due to the fact that water vapour is the most powerful greenhouse gas not directly controlled by anthropogenic activities, this has implications on the radiative heating at the surface and thus surface temperatures.

Due to the elevated location of the water vapour anomaly, obtaining measurements of the mixing ratio of the anomaly is challenging. Employing two microwave radiometers, operated by the Institute of Applied Physics (IAP) in Bern, Switzerland, profiles of water vapour mixing ratio are presented at two locations: Switzerland and Svalbard. Analysis of data from these points, dating back to 2010, reveals the anomaly's characteristics and its influence on surface radiative heating.

Our findings are contextualized with additional data from satellite observations, in-situ instruments, and other ground-based microwave radiometers. This comprehensive approach allows us to explore the wider implications of the Hunga Tonga eruption on the climate, particularly in relation to 2023, a year noted as the hottest on record.

How to cite: Bell, A., Stober, G., Hocke, K., and Murk, A.: Impact of the 2022 Hunga Tonga Volcano on Global Middle Atmosphere Water Vapour and Climate Implications, EGU General Assembly 2024, Vienna, Austria, 14–19 Apr 2024, EGU24-9249, https://doi.org/10.5194/egusphere-egu24-9249, 2024.

EGU24-10246 | Posters on site | AS1.29

Rapid chlorine deactivation at very low ozone concentrations in the Antarctic stratosphere 

Jens-Uwe Grooß, Rolf Müller, and Ralph Lehmann

The intensive catalytic chemical ozone loss cycles involving inorganic chlorine compounds are known to cause the ozone hole, that regularly forms in the Antarctic polar vortex each winter and spring.  One key point of the explanation of the ozone hole are heterogeneous reactions on the surface of Polar Stratospheric Cloud (PSC) particles, which are present in the polar stratosphere owing to the very low stratospheric temperatures.

Ozone mixing ratios can reach values of a few ppbv which is below detection limit of ozone sonde observations.  Under these extreme conditions, fast chlorine deactivation into the reservoir HCl does occur even though polar stratospheric clouds are still present, that are normally causing chlorine activation.

In this study we revisit this issue and investigate the occurring chlorine chemistry in more detail.  The explanation of the chemical mechanism of the fast net HCl formation is based on the automatic determination of reaction pathways by the Pathway Analysis Program (PAP) (Lehmann, 2004).

The simulations of chemical composition are performed by the model CLaMS in box model mode along an ensemble of about 600 trajectories in the Antarctic spring 2018.  The simulated rapid complete chlorine deactivation into HCl in the presence of PSCs is in line with satellite  observations by the Microwave Limb Sounder (MLS).


Reference
Lehmann, R.: An algorithm for the determination of all significant pathways in chemical reaction systems, J. Atmos. Chem. 47, 45-78 (2004).

How to cite: Grooß, J.-U., Müller, R., and Lehmann, R.: Rapid chlorine deactivation at very low ozone concentrations in the Antarctic stratosphere, EGU General Assembly 2024, Vienna, Austria, 14–19 Apr 2024, EGU24-10246, https://doi.org/10.5194/egusphere-egu24-10246, 2024.

EGU24-12185 | Posters on site | AS1.29

Effects of two typical gravity wave processes on stratospheric ozone over the Tibetan Plateau based on radiosonde data 

Shujie Chang, Haotian He, Xiangdong Zheng, Lingfeng Wan, and Jundong Wang

This study analyzes the formation process and propagation characteristics of two typical gravity wave events that occurred over the Tibetan Plateau, based on the radiosonde data from Naqu Station on August 4, 2011 at 7:00-12:00UTC and August 13, 2011 at 8:00-12:00 UTC, as well as the global climate fifth-generation atmospheric reanalysis dataset (ERA5) provided by the European Centre for Medium-Range Weather Forecasts (ECMWF). The effects of the two gravity wave events on ozone are also analyzed. The results show that two gravity wave processes were broken in the tropopause and upper stratosphere respectively. The gravity wave event on August 4 captured the signal well at 400 hPa, showing a northwest-southeast structure and gradually tilting eastward. The signal decayed between 7:00-9:00 UTC, and the gravity wave completely broke and released energy near 150 hPa at 10:00 UTC. The ozone significantly decreased in the region of 200-50 hPa due to ozone exchange between the upper troposphere and lower stratosphere (UTLS). The results on August 13 showed that the gravity wave propagated from the middle stratosphere to the upper stratosphere, exhibiting a northeast-southwest structure and gradually tilting eastward. The signal weakened from the middle stratosphere at 8:00 UTC, and it broke and released energy near 7 hPa at 10:00 UTC. The ozone concentration increased in the region of 20-3 hPa. Both gravity wave events resulted in a decrease in ozone at the tropopause (200-150 hPa) and upper stratosphere (20-3 hPa), mainly due to the mixing of the upper and lower atmospheric layers caused by the gravity wave breaking, leading to ozone exchange.

How to cite: Chang, S., He, H., Zheng, X., Wan, L., and Wang, J.: Effects of two typical gravity wave processes on stratospheric ozone over the Tibetan Plateau based on radiosonde data, EGU General Assembly 2024, Vienna, Austria, 14–19 Apr 2024, EGU24-12185, https://doi.org/10.5194/egusphere-egu24-12185, 2024.

EGU24-13273 | Posters on site | AS1.29

Spatial Distribution of Mixing and Transport in the Northern Middle Atmosphere 

Jezabel Curbelo and Carlos R. Mechoso

We apply a novel approach to studying eddy mixing and transport in the northern middle atmosphere during winter (December-January-February), based on the concept of Lagrangian diffusivity – a measure of how quickly air parcels mix together. Unlike traditional diagnostics that rely on longitudinal or contour-based averages, Lagrangian diffusivity provides a detailed three-dimensional view of the mixing process. Our formulation of Lagrangian diffusivity requires the calculation of parcel trajectories, performed on isentropic surfaces using ERA5 reanalysis data. Additionally, we have applied several diagnostic techniques to contextualize our results on Lagrangian diffusivity within the broader framework of the stratospheric polar vortex and quasi-geostrophic wave properties. Specifically, we investigate the influence of quasi-geostrophic motions on the stratospheric polar vortex using wave activity flux and local wave activity. Furthermore, we employ a Lagrangian descriptor, a tool based on parcel trajectory length, to locate the boundary of the stratospheric polar vortex (SPV).

The results reveal pronounced zonal asymmetries in Lagrangian diffusivity and wave activity flux. Mixing is highest at mid-latitudes around the prime meridian and at locations within the SPV. Local wave activity is elevated at high latitudes and upstream of the climatological vortex boundary opening, highlighting the role of quasi-geostrophic waves in the southward displacement of mid-latitude westerlies.

How to cite: Curbelo, J. and Mechoso, C. R.: Spatial Distribution of Mixing and Transport in the Northern Middle Atmosphere, EGU General Assembly 2024, Vienna, Austria, 14–19 Apr 2024, EGU24-13273, https://doi.org/10.5194/egusphere-egu24-13273, 2024.

EGU24-13281 | Orals | AS1.29

Quantifying the role of the stratosphere in upward wave propagation during stratospheric polar vortex disturbances: an SNAPSI Working Group 4 analysis 

Blanca Ayarzagüena, Amy H. Butler, Chaim Garfinkel, Peter Hitchcock, Hilla Afargan-Gerstman, Thomas Birner, Natalia Calvo, Álvaro de la Cámara, Nahuel Gómez, Martin Jucker, Gebrand Koren, Zachary Lawrence, Gloria Manney, Wuhan Ning, Marisol Osman, Philip Rupp, Masakazu Taguchi, Wolfgang Wicker, and Zheng Wu and the SNAPSI WG4

Sudden stratospheric warmings (SSWs) are the most dramatic wintertime stratospheric phenomena. They are preceded by a sustained wave dissipation in the stratosphere that leads to the deceleration of the polar vortex. The signal from SSWs then typically propagates downward reaching the troposphere and inducing a negative phase of the Annular Mode that may persist several weeks up to two months. Incorporating then stratospheric information in subseasonal to seasonal (S2S) forecast systems has been shown to improve the skill of S2S predictions for surface climate. However, on average, present S2S forecast systems can only predict SSWs around two weeks before the onset of the event. A suggested strategy to increase their predictability is to improve the representation of triggering mechanisms of SSWs. However, while there is a consensus on the relevance of the wave activity for that, the origin of the rapid enhancement of stratospheric wave activity prior to SSWs is not sufficiently understood.

The aim of this study is two-fold: to assess the ability of forecast systems to reproduce the stratospheric wave amplification during SSWs and to quantify the role of the stratosphere in this enhanced upward wave propagation. To do so, we analyze the triggering mechanisms of three different SSWs, the boreal SSWs of 2018 and 2019 and the austral minor SSW of 2019, by means of SNAPSI (Stratospheric Nudging And Predictable Surface Impacts) sets of forecast ensembles. These ensembles include free-evolving atmospheric runs and nudged simulations where the zonally-symmetric stratospheric state is nudged to either observations of a certain SSW or a climatological state. Our results show that models struggle to predict the SSW of 2018, as they are not able to capture the strong enhancement of wavenumber-2 wave activity around one week before the event. In contrast, most ensemble members of all models are able to simulate both SSWs of 2019, but with some common issues such as an early timing for the NH event and a weaker deceleration of the vortex in the case of the SH SSW. In the three cases, capturing both the tropospheric precursors and the interactions of waves with the stratospheric flow are revealed to be crucial for the occurrence of the phenomena. However, the relative role of each contribution is different depending on the individual event. This is a contribution of the Working Group 4 of the SNAPSI initiative.

How to cite: Ayarzagüena, B., Butler, A. H., Garfinkel, C., Hitchcock, P., Afargan-Gerstman, H., Birner, T., Calvo, N., de la Cámara, Á., Gómez, N., Jucker, M., Koren, G., Lawrence, Z., Manney, G., Ning, W., Osman, M., Rupp, P., Taguchi, M., Wicker, W., and Wu, Z. and the SNAPSI WG4: Quantifying the role of the stratosphere in upward wave propagation during stratospheric polar vortex disturbances: an SNAPSI Working Group 4 analysis, EGU General Assembly 2024, Vienna, Austria, 14–19 Apr 2024, EGU24-13281, https://doi.org/10.5194/egusphere-egu24-13281, 2024.

EGU24-13753 | ECS | Orals | AS1.29 | Highlight

The NOAA Balloon Baseline Stratospheric Aerosol Profiles (B2SAP) – In situ insight on the stratospheric aerosol layer  

Alexandre Baron, Elizabeth Asher, Katie Smith, and Troy Thornberry and the B2SAP extended Team

Stratospheric aerosols play a crucial role in the climate system, but uncertainties persist in understanding the chemical, dynamical, and microphysical processes governing their distribution and variability. The chemical and radiative impacts of stratospheric aerosols hinge on particle size distribution. However, models exhibit significant variations in how they parameterize aerosol microphysical processes and simulate size distributions, leading to divergent predictions of the time evolution of radiative impacts from stratospheric aerosol perturbation events. To refine models for assessing the effects of potential climate intervention strategies, systematic measurements are crucial. In pursuit of this understanding, the Baseline Balloon Stratospheric Aerosol Profiles (B2SAP) project utilizes compact, lightweight payloads carried by meteorological balloons. These payloads measure aerosol number density and size distributions, along with water vapor, ozone, and meteorological data from the surface to the middle stratosphere. The long-term goal of the B2SAP project is to generate climatologies of aerosol number and size distributions up to the middle stratosphere at latitudinally distributed measurement sites. Since March 2019, B2SAP payloads have been launched from Boulder, CO, USA (40°N) once to twice per month and four to six times per year from Lauder, NZ (45°S). Starting in 2022, two tropical sites were added to this evanescent network with quarterly launches: Hilo, HI, USA (20°N) and Reunion Island, FR (20°S). These measurements provide a new record of in situ observations allowing to characterize the natural stratospheric aerosol burden, its variability, and responses to perturbations, providing essential data for refining models and aiding in the validation of satellite-based estimates. In this context, we will present a subset of this growing database, emphasizing the discussion on the stratospheric aerosol layers in the North hemisphere and South hemisphere (SH) mid-latitudes. Perturbations recorded in the SH after the Australian New Year super pyroCb outbreak in 2020 will also be investigated.

How to cite: Baron, A., Asher, E., Smith, K., and Thornberry, T. and the B2SAP extended Team: The NOAA Balloon Baseline Stratospheric Aerosol Profiles (B2SAP) – In situ insight on the stratospheric aerosol layer , EGU General Assembly 2024, Vienna, Austria, 14–19 Apr 2024, EGU24-13753, https://doi.org/10.5194/egusphere-egu24-13753, 2024.

EGU24-13938 | Posters on site | AS1.29 | Highlight

New evidence for CH4 enhancement at upper troposphere associated with Asian summer monsoon 

Zhaonan Cai, Mengchu Tao, Sihong Zhu, Yi Liu, Liang Feng, Shuangxi Fang, You Yi, and Jianchun Bian

The Asian Summer Monsoon (ASM) region is key region transporting air to the upper troposphere, significantly influencing the distribution and concentration of trace gases, including methane (CH₄), an important greenhouse gas. We investigate the seasonal enhancement of CH₄ in the upper troposphere over the ASM region, utilizing retrievals from the Atmospheric Infrared Sounder (AIRS), model simulations and in-situ measurements. Both AIRS data and model simulation reveal a substantial seasonal increase in CH₄ concentrations of up to 3%, aligning with the active monsoon period. Notably, the spatial distribution of the methane plume demonstrates a southwestward shift in the AIRS retrievals, in contrast to the model simulations which predict a broader enhancement, including a significant increase to the east. A cross-comparison with in-situ measurements, including AirCore measurements over Tibetan Plateau and airline sampling across the Asian summer monsoon anticyclone (ASMA), favors the enhancement represented by model simulation. Remarkable CH4 enhancement over west Pacific is also evidenced by in-situ data and simulation as dynamical extension of ASMA. Our findings underscore the necessity for cautious interpretation of satellite-derived methane distributions and highlights the critical role of in-situ data in anchoring the assimilation of CH4.

How to cite: Cai, Z., Tao, M., Zhu, S., Liu, Y., Feng, L., Fang, S., Yi, Y., and Bian, J.: New evidence for CH4 enhancement at upper troposphere associated with Asian summer monsoon, EGU General Assembly 2024, Vienna, Austria, 14–19 Apr 2024, EGU24-13938, https://doi.org/10.5194/egusphere-egu24-13938, 2024.

Although stratospheric ozone loss occurs every year in Antarctica, Arctic ozone loss occurs only when stratospheric temperature gets low. Recently, substantial ozone loss occurred in Arctic in 1997, 2011, and 2020. Especially, the magnitude of Arctic ozone losses in 2011 and 2020 was comparable to that of in Antarctica. Satellite CALIPSO was launched in 2006, and is still in operation and measuring global cloud properties using two-wavelength lidars. It measures distribution and characteristics of polar stratospheric clouds (PSC) over both polar regions. In this study, we analyzed characteristics of Arctic PSCs in 2011 and 2020, and their effects on polar ozone loss. Figure 1 (not shown in this abstract) shows distribution and types of Arctic PSCs along a CALIPSO satellite track on 4 January 2011 over downstream of Greenland. The appearance of wave-ice-type PSC due to mountain-induce lee wave can be seen.

In this analysis, distribution and types of Arctic PSC was analyzed for the altitudes of 20, 17.5, and 15 km for each CALIPSO orbit (15 orbits per day in maximum) from January to March in 2011 and 2020. Local temperature and HNO3 amount by Aura/MLS were also analyzed to see the PSC formation condition and the magnitude of denitrification. As a result, there were no major differences between the appearance of PSCs in January and February. However, stratospheric temperature was low in 2020 compared with 2011 in March, and appearance of PSC was greater in 2020. Ozone depletion started to occur in March when sunlight was available over the Arctic, and record-high ozone depletion was observed in 2020. The reason of this low temperature in 2020 could be attributed to the unusually strong polar vortex over the Arctic in this year.

How to cite: Nakajima, H., Ogawa, M., Kita, K., and Pitts, M. C.: Relationship between appearance of polar stratospheric clouds and ozone destruction over Northern polar region in 2011 and 2020 based on CALIPSO observations, EGU General Assembly 2024, Vienna, Austria, 14–19 Apr 2024, EGU24-15811, https://doi.org/10.5194/egusphere-egu24-15811, 2024.

EGU24-15844 | ECS | Posters on site | AS1.29

Scale selection of mixed Rossby-gravity waves through wave-mean flow interactions 

Sándor István Mahó, Nedjeljka Žagar, and Sergiy Vasylkevych

Mixed Rossby-gravity (MRG) waves contribute significantly to tropical variability in the upper troposphere and the stratosphere. Studies based on reanalysis data suggest that the scale of MRG waves in the two regions is different, with the troposphere dominated by synoptic-scale MRG waves, while the MRG waves in the stratosphere have planetary scales. Using the recently discovered excitation mechanism of the MRG waves by wave-mean flow interactions, we investigate whether this mechanism can explain the different scale selection in the troposphere and the stratosphere.

We carry out high-accuracy numerical simulations with a spherical shallow water model (TIGAR) that includes the MRG wave as a subset of prognostic variables. This framework allows to identify wave-mean flow interactions as the main driver of MRG scale selection in comparison with excitation driven by external forcing and wave-wave interactions. Simulations with idealized background zonal wind field and profiles derived from ERA5 reanalysis from 1 and 200 hPa show that the jet position is a decisive factor for the MRG scale selection. Particularly, when the jet is located closer to the equator, as in boreal winter in the troposphere, synoptic-scale MRG waves are excited. In the case of jets embedded well in extratropics (40-50°), such as in the upper stratosphere, wave-mean flow interactions generate MRG waves with planetary scales. These results explain the MRG scale selection in the upper troposphere and the stratosphere by a single mechanism and highlight the importance of representing accurately wave-mean flow interactions in climate models.

How to cite: Mahó, S. I., Žagar, N., and Vasylkevych, S.: Scale selection of mixed Rossby-gravity waves through wave-mean flow interactions, EGU General Assembly 2024, Vienna, Austria, 14–19 Apr 2024, EGU24-15844, https://doi.org/10.5194/egusphere-egu24-15844, 2024.

EGU24-15870 | Posters on site | AS1.29 | Highlight

Coupling between severe weather events and the middle atmosphere, potentially affecting even the ionospheric heights 

Kateřina Potužníková, Michal Kozubek, Petra Koucká Knížová, and Jaroslav Chum

Our study analyses the coupling between the troposphere, stratosphere and ionosphere during severe weather events of the last two years. We selected several situations with a rapid cold front transition associated with a strong jet stream visible at 300 hPa. We also selected several summer situations associated with organised convection on the sub-synoptic horizontal scale in the tropical air mass. It is known that the frequency and extremity of thunderstorms will continue to increase significantly according to climate model projections for Central and Eastern Europe. We study the winds in the stratosphere during the selected situations and their possible influence on the ionosphere.

To analyse the tropospheric situation, we use data from standard weather station measurements, vertical radiometric sounding data, and surface and upper level weather charts provided by the GFS and ICON models. For detailed analyses of the ionospheric plasma response, we use data from the European ionospheric vertical sounding observatories and an array of Doppler sounders.

How to cite: Potužníková, K., Kozubek, M., Koucká Knížová, P., and Chum, J.: Coupling between severe weather events and the middle atmosphere, potentially affecting even the ionospheric heights, EGU General Assembly 2024, Vienna, Austria, 14–19 Apr 2024, EGU24-15870, https://doi.org/10.5194/egusphere-egu24-15870, 2024.

EGU24-16480 | Posters on site | AS1.29

Improving the in situ observation-based long-term record of stratospheric age of air  

Johannes Laube, Elliot Atlas, Kyriaki Blazaki, Huilin Chen, Andreas Engel, Pauli Heikkinen, Rigel Kivi, Elinor Tuffnell, Thomas Wagenhäuser, and Christian Rolf

Stratospheric mean age of air is an important metric and much-used proxy for the speed of the residual overturning circulation in the stratosphere. Much effort has been put into better constraining observation-based estimates of age of air over the past two decades. Yet substantial uncertainties remain for some aspects such as the long-term evolution, especially at higher altitudes that are hard to reach for most in situ-measurement platforms.

We here present a newly derived age of air data set, which is based on high precision measurements of inert trace gases that were derived from a) AirCore samples from multiple weather balloon-based deployments since 2017 (updated from Laube et al., 2020), and also b) recently collected as well as archived reanalysed air samples from high altitude aircraft and large balloon campaigns between 1976 and 2017. Utilised trace gases include SF6, C2F6, C3F8, CHF3 (HFC-23), and C2HF5 (HFC-125), all of which have been proven to be suitable as age tracers (Leedham Elvidge et al., 2018). We evaluate the uncertainties connected to the trace gas measurements as well as the derivation of the mean age of air, and compare our estimates to published data sets such as the one from Engel et al. (2017).


References

Engel, et al., Atmos. Chem. Phys., 2017, https://doi.org/10.5194/acp-17-6825-2017.

Laube et al., Atmos. Chem. Phys., 2020, https://doi.org/10.5194/acp-20-9771-2020.

Leedham Elvidge et al., Atmos. Chem. Phys., 2018, https://doi.org/10.5194/acp-18-3369-2018.

How to cite: Laube, J., Atlas, E., Blazaki, K., Chen, H., Engel, A., Heikkinen, P., Kivi, R., Tuffnell, E., Wagenhäuser, T., and Rolf, C.: Improving the in situ observation-based long-term record of stratospheric age of air , EGU General Assembly 2024, Vienna, Austria, 14–19 Apr 2024, EGU24-16480, https://doi.org/10.5194/egusphere-egu24-16480, 2024.

EGU24-18226 | Posters on site | AS1.29

Reconciling long-term stratospheric circulation changes from ERA5 and CCMI2 

Mohamadou A. Diallo, Roland Eichinger, Fernando Iglesias-Suarez, Aleš Kuchař, and Michaela I. Hegglin

Climate models predict a global acceleration of the stratospheric Brewer-Dobson circulation (BDC) induced by rising greenhouse gas (GHG) levels. However, this predicted strengthening of the BDC has not yet been compared with long-term observations, due to the scarcity of long-term observation records. 

The recent release of ERA5 long-term reanalysis data covering the period from 1950 to the present day offers new opportunities to assess the robustness of the projected BDC acceleration. These observation-based data make it possible to assess the ability of models to capture the impact of natural variability such as the Quasi- Biennial Oscillation (QBO), the El Nino Southern Oscillation (ENSO), the solar cycle, stratospheric volcanic aerosols and the Pacific Decadal Oscillation (PDO), on circulation changes and their interaction.

In this presentation, I will review our knowledge of the dynamical mechanisms explaining changes in the BDC over the period 1960-2018 using ERA5 and CCMI-2. I will then highlight the impact of climate variability modes (e.i. QBO, ENSO, Solar, volcanoes and PDO) and their interaction on the BDC. Finally, I will discuss the robustness and main reasons for differences between modern reanalyses and climate models in the BDC changes.

How to cite: Diallo, M. A., Eichinger, R., Iglesias-Suarez, F., Kuchař, A., and Hegglin, M. I.: Reconciling long-term stratospheric circulation changes from ERA5 and CCMI2, EGU General Assembly 2024, Vienna, Austria, 14–19 Apr 2024, EGU24-18226, https://doi.org/10.5194/egusphere-egu24-18226, 2024.

EGU24-19343 | Orals | AS1.29 | Highlight

Summary of S(A)-RIP Phase 1 and Plans for Phase 2: Chemical Reanalyses & Air Quality, Tropospheric Circulation, Extreme Events, and More 

Jonathon Wright, Gloria L. Manney, Mastomo Fujiwara, Krzysztof Wargan, Sean Davis, Mohamadou Diallo, Felix Ploeger, K. Emma Knowland, and Brad Weir

Reanalysis datasets are widely used to understand atmospheric processes; however, different reanalyses may give very different results for the same diagnostics. The Atmospheric Processes And their Role in Climate (APARC; formerly SPARC) Reanalysis Intercomparison Project, or S(soon to be A)-RIP (https://s-rip.github.io/), is a coordinated activity to compare key diagnostics among atmospheric reanalyses, identify differences among reanalyses and their underlying causes, provide guidance on appropriate usage of reanalyses in scientific studies, and contribute to future improvements in the reanalysis products via collaborations with reanalysis centers and data users. S-RIP Phase 1 (completed in early 2022) focused primarily on the upper troposphere and above and processes linking these regions to the troposphere and surface. We are broadening our efforts in Phase 2 (S-RIP2), with new directions including studies of the tropospheric circulation, extreme weather events, and their links to the stratosphere, along with evaluation of chemical reanalyses, both those with a stratosphere / upper troposphere focus and those that focus on air quality applications. This presentation will provide a summary of Phase 1 results and discussion of future directions for S-RIP2, emphasizing applications to composition and chemistry studies and capacity building for Early Career Scientists. 

How to cite: Wright, J., Manney, G. L., Fujiwara, M., Wargan, K., Davis, S., Diallo, M., Ploeger, F., Knowland, K. E., and Weir, B.: Summary of S(A)-RIP Phase 1 and Plans for Phase 2: Chemical Reanalyses & Air Quality, Tropospheric Circulation, Extreme Events, and More, EGU General Assembly 2024, Vienna, Austria, 14–19 Apr 2024, EGU24-19343, https://doi.org/10.5194/egusphere-egu24-19343, 2024.

EGU24-20008 | ECS | Orals | AS1.29

Modulation of El Niño by the Quasi-Biennial Oscillation 

Mario Rodrigo, Javier García-Serrano, and Ileana Bladé

The Quasi-Biennial Oscillation (QBO) of equatorial zonal winds is the leading mode of lower-stratospheric variability. Numerous studies have explored its connection with the troposphere, including its sensitivity to tropical convection and the El Niño-Southern Oscillation (ENSO). In particular, the upward ENSO impact on the QBO is known: observational evidence suggests that during El Niño the QBO propagates faster (shorter period). However, the potential downward QBO influence on ENSO has not been thoroughly assessed and needs better understanding. Here, we focus on the strongest ENSO events, dubbed super El Niños, characterized by extreme sea surface temperature (SST) anomalies in the eastern Pacific. Super El Niños are exceptional due to self-limiting ENSO dynamics in the tropical Pacific and seasonal SST cooling during summer and autumn, which prevents strong eastern Pacific SST warming and convective anomalies from developing. Their existence requires one or more factors external to the tropical Pacific to aid the Bjerknes feedback in building an El Niño event. In both observations and models (EC-EARTH), super El Niño events seem to require the westerly QBO phase to coincide with a growing El Niño, i.e. in boreal summer and fall. We thus propose a novel element that contributes to the generation of extreme El Niño events that involve the QBO and its modulation of the Walker circulation. While an El Niño event typically leads to a weaker Walker circulation, the weakening becomes more pronounced if the QBO is in its westerly phase. Consequently, the low-level trade wind anomalies over the equatorial Pacific are intensified, which reinforces the Bjerknes feedback and enhances the warm anomalies over the cold tongue region. Our results suggest that the QBO state could be considered to improve El Niño predictions, especially for extreme events.

How to cite: Rodrigo, M., García-Serrano, J., and Bladé, I.: Modulation of El Niño by the Quasi-Biennial Oscillation, EGU General Assembly 2024, Vienna, Austria, 14–19 Apr 2024, EGU24-20008, https://doi.org/10.5194/egusphere-egu24-20008, 2024.

EGU24-633 | ECS | Posters on site | AS1.30

Gravity waves and shear in the lower stratosphere: idealized experiments of baroclinic life cycles 

Madhuri Umbarkar and Daniel Kunkel

Mixing plays a crucial role on redistributing radiation-actively trace species in the lower stratosphere. In particular, it is potentially the dominant effect for the formation of the extra-tropical transition layer (ExTL). However, various dynamical features can lead to mixing and the role of the small scale dynamics is not yet clear. In the extra-tropics, stratosphere troposphere exchange (STE) occurs frequently during baroclinic life cycles, e.g., in the vicinity of tropopause folds, cut-off lows, or stratospheric streamers. However, how the gravity waves (GWs) contributes to STE and mixing in the lower stratosphere is a research area with many open questions. A series of baroclinic life cycle experiments with the ICOsahedral Non-hydrostatic (ICON) general circulation model have been performed in order to study the impact of gravity waves on the transport and mixing between the upper troposphere and lower stratosphere (UTLS). Dry adiabatic experiments with varying horizontal and vertical resolution allowed to study the GW occurrence in relation to the model grid spacing. Moreover, the effect of varying initial conditions on the emergence of gravity waves is studied. We present analysis of the occurrence of GW in the various life cycles, their dependence on the model grid spacing and the initial conditions. Moreover, we present an analysis on the vertical shear of the horizontal wind associated with gravity waves and the potential for turbulence occurrence as a prerequisite for mixing. The focus of our analysis is the lowermost stratosphere and the effect of gravity wave induced mixing on the formation of the ExTL.

How to cite: Umbarkar, M. and Kunkel, D.: Gravity waves and shear in the lower stratosphere: idealized experiments of baroclinic life cycles, EGU General Assembly 2024, Vienna, Austria, 14–19 Apr 2024, EGU24-633, https://doi.org/10.5194/egusphere-egu24-633, 2024.

EGU24-1519 | Posters on site | AS1.30

Stratospheric and upper tropospheric measurements of long-lived tracers and photochemically active species of the nitrogen, chlorine, and bromine families with GLORIA-B 

Gerald Wetzel, Sören Johansson, Felix Friedl-Vallon, Michael Höpfner, Valéry Catoire, Andreas Engel, Thomas Gulde, Patrick Jacquet, Oliver Kirner, Anne Kleinert, Erik Kretschmer, Johannes Laube, Guido Maucher, Tom Neubert, Hans Nordmeyer, Christof Piesch, Peter Preusse, Tanja Schuck, Jörn Ungermann, and Wolfgang Woiwode

The Gimballed Limb Observer for Radiance Imaging of the Atmosphere (GLORIA) is a limb-imaging Fourier-Transform spectrometer (iFTS) providing mid-infrared spectra with high spectral sampling (0.0625 cm-1 in the wavelength range 780-1400 cm-1). GLORIA, a demonstrator for the Changing-Atmosphere Infra-Red Tomography Explorer (CAIRT, one of the remaining two candidates for the ESA Earth Explorer 11 mission) was deployed on the Russian M55 Geophysica and is still being deployed on HALO, the German high-altitude research aircraft. In order to enhance the vertical range of GLORIA to observations in the middle stratosphere albeit still reaching down to the middle troposphere, the instrument was adapted to measurements from stratospheric balloon platforms. GLORIA-B performed its first flight from Kiruna (northern Sweden) in August 2021 and its second flight from Timmins (Ontario/Canada) in August 2022 in the framework of the EU Research Infrastructure HEMERA.

The objectives of GLORIA-B observations for these campaigns have been its technical qualification and the provision of a first imaging hyperspectral limb-emission dataset from 5 to 36 km altitude. Further, scientific objectives, which are, amongst many others, the diurnal evolution of photochemically active species belonging to the nitrogen (e.g. N2O5, NO2), chlorine (e.g. ClONO2), and bromine (BrONO2) families are discussed.

In this contribution we demonstrate the performance of GLORIA-B with regard to level-2 data of the flight in August 2021, consisting of retrieved altitude profiles of a variety of trace gases. We will show examples of selected results together with uncertainty estimations, altitude resolution as well as long-lived tracer comparisons to accompanying in-situ datasets. In addition, diurnal variations of photochemically active gases are compared to simulations of the chemistry climate model EMAC. Calculations largely reproduce the temporal variations of the species observed by GLORIA-B.

How to cite: Wetzel, G., Johansson, S., Friedl-Vallon, F., Höpfner, M., Catoire, V., Engel, A., Gulde, T., Jacquet, P., Kirner, O., Kleinert, A., Kretschmer, E., Laube, J., Maucher, G., Neubert, T., Nordmeyer, H., Piesch, C., Preusse, P., Schuck, T., Ungermann, J., and Woiwode, W.: Stratospheric and upper tropospheric measurements of long-lived tracers and photochemically active species of the nitrogen, chlorine, and bromine families with GLORIA-B, EGU General Assembly 2024, Vienna, Austria, 14–19 Apr 2024, EGU24-1519, https://doi.org/10.5194/egusphere-egu24-1519, 2024.

EGU24-2061 | ECS | Posters on site | AS1.30

Modelling the Impact of Ammonia Emissions on New Particle Formation in the Asian Monsoon Upper Troposphere 

Christos Xenofontos, Matthias Kohl, Andrea Pozzer, Jos Lelieveld, and Theodoros Christoudias

Ammonia emissions in south-east Asia are a significant contributor to air pollution. This pollution, through convective transport by the Asian monsoon anticyclone, can initiate new particle formation events in the upper troposphere and the development of the Asian Tropopause Aerosol Layer (ATAL). Despite the acknowledged influence of ammonia emissions and particulate ammonium on upper tropospheric air pollution and cloud formation, a comprehensive understanding of the ATAL remains limited. A substantial knowledge gap persists regarding its origin, maintenance, chemical composition, and the climatic implications of these factors. We use the EMAC chemistry-climate model to study the influence of ammonia emissions on nucleation mechanisms contributing to the development of the ATAL. Through the integration of observational data with model simulations and the application of parameterisations from the CERN CLOUD experiment, we investigate the conditions sustaining the ATAL and explore its climatic implications. The findings suggest that ammonia emissions enhance nucleation rates in the ATAL, resulting in up to 70% increases in cloud condensation nuclei (CCN) concentrations. A diurnal cycle analysis reveals that these new particle formation mechanisms mostly occur during daylight after convection events uplifting precursor gases. Our findings enhance the understanding of the impact of anthropogenic emissions on CCN formation processes and their implications for climate in the regions characterised by high ammonia emissions.

How to cite: Xenofontos, C., Kohl, M., Pozzer, A., Lelieveld, J., and Christoudias, T.: Modelling the Impact of Ammonia Emissions on New Particle Formation in the Asian Monsoon Upper Troposphere, EGU General Assembly 2024, Vienna, Austria, 14–19 Apr 2024, EGU24-2061, https://doi.org/10.5194/egusphere-egu24-2061, 2024.

EGU24-2556 | Orals | AS1.30 | Highlight

The Impact of Very-Short-Lived Chlorocarbons on Stratospheric Chlorine and Ozone Abundance During 2011-2022 

Qing Liang, Paul Newman, Eric Fleming, and Leslie Lait

Stratospheric ozone is catalytically destroyed by chlorine released from ozone-depleting substances (ODS), e.g., chlorofluorocarbons, and halogenated very-short-lived substances (VSLS). In addition to chlorine contributions from continued emissions of Montreal Protocol-regulated long-lived ODSs (from existing banks, production, consumption, and feedstocks), recent research has highlighted concern over rapidly growing emissions of dichloromethane (CH2Cl2) - a chlorinated VSLS (Cl-VSLS). Large emissions come from Asia have developed because of fast economic growth. In this study, we have conducted model simulations with geographically resolved surface emissions of the two most abundant Cl-VSLS, CH2Cl2 and CHCl3, with the NASA GEOS Chemistry Climate Model (GEOSCCM). The simulations cover the 2011-2022 period to understand the transport pathway of Asian Cl-VSLS emissions to the stratosphere and to quantify the contribution of Asian emissions to the stratospheric chlorine budget w.r.t. the global estimate during the 2010s. With global emissions of about 1300 Gg/yr in 2020-2022, our results suggest Cl-VSLS adds about 120 ppt Cl to stratospheric chlorine.  The Asian Summer Monsoon plays a dominant role in the troposphere-to-stratosphere transport of Cl-VSLS and is twice as efficient for delivering CH2Cl2 to the stratosphere than the tropics. About 200 ppt of VSLS-Cl gets into the stratosphere during summer 2022 within Asian Summer Monsoon Anticyclone. GEOSCCM simulation results suggest that the overall impact of Cl-VSLS on stratospheric ozone is < 2 DU (0.7%) globally. Interestingly, 2019 features an anomalously large ozone perturbation due to Cl-VSLS. While global ozone changes little, total column ozone decreases by 10 DU in the Antarctic but increases by 15 DU in the Arctic. 

How to cite: Liang, Q., Newman, P., Fleming, E., and Lait, L.: The Impact of Very-Short-Lived Chlorocarbons on Stratospheric Chlorine and Ozone Abundance During 2011-2022, EGU General Assembly 2024, Vienna, Austria, 14–19 Apr 2024, EGU24-2556, https://doi.org/10.5194/egusphere-egu24-2556, 2024.

EGU24-2808 | ECS | Orals | AS1.30

A method proposal for spatially-resolved Age of Air from satellitedata 

Florian Voet, Felix Ploeger, Johannes Laube, Peter Preusse, Paul Konopka, Jens-Uwe Grooß, Jörn Ungermann, Björn-Martin Sinnhuber, Michael Höpfner, Bernd Funke, and Michaela I. Hegglin

The stratospheric overturning meridional circulation is an important element in the global climate system and observationally-based estimates of its strength and changes are important for model validation and process understanding. But such observational constraints are prone to significant uncertainties related to the low circulation velocities and uncertainties in available trace gas measurements. Here, we propose a method to calculate mean age of air, as a measure for the stratospheric circulation, from mixing ratios of multiple measurable trace gas species, like trichlorofluoromethane (CFC-11), dichlorodifluoromethane (CFC-12), chlorodifluoromethane (HCFC-22), methane (CH4), nitrous oxide (N2O) and sulfur hexafluoride (SF6 ). The method is based on the correlations of these trace gases with mean age. The involved methodological error includes uncertainties due to atmospheric variability and non-compactness of the correlation, and additional instrument uncertainties as would be inherent for e.g. satellite instruments. The age calculation method is evaluated, globally and seasonally, in a model environment and compared against the true model mean age. We show that the tracer-age correlations are, in general, sufficiently compact in the age range between about 1 and 4 to 5 years, depending on the given species. Combination of the six chosen species reduces the resulting uncertainty of the derived mean age to below 0.3 years throughout most regions in the lower stratosphere. Even smaller scale, seasonal features in the global age distribution can be reliably diagnosed from the multi tracer-based mean age. Hence, the proposed mean age calculation method shows promise to reduce the error in mean age estimates from satellite trace gas observations.

How to cite: Voet, F., Ploeger, F., Laube, J., Preusse, P., Konopka, P., Grooß, J.-U., Ungermann, J., Sinnhuber, B.-M., Höpfner, M., Funke, B., and Hegglin, M. I.: A method proposal for spatially-resolved Age of Air from satellitedata, EGU General Assembly 2024, Vienna, Austria, 14–19 Apr 2024, EGU24-2808, https://doi.org/10.5194/egusphere-egu24-2808, 2024.

EGU24-3980 | ECS | Posters on site | AS1.30

Modelling the changes in the upper tropospheric composition due to convective transport 

Adrienne Jeske, Linda Smoydzin, Peter Hoor, and Holger Tost

Atmospheric moist convection has a considerable influence on the composition of the upper troposphere. Besides the strong effects on the atmospheric moisture budget, the high vertical velocities associated with deep convection lead to a redistribution of air masses, with especially large effects on the concentration of tracers with short atmospheric lifetimes. Even though the importance of convective transport is long known, this process remains a major source of uncertainty.

To diagnose the efficacy of convective tracer transport, we have developed a new modelling tool for simulations in global circulation models that rely on convection parameterisations, namely the convective exchange matrix. The exchange matrix basically links fractional contributions of inflow and outflow between any model level when convection is simulated for a given column. We apply this new tool in the chemistry climate model EMAC (ECHAM5 MESSy Atmospheric Chemistry) in order to characterise the transport of individual convective events. Beyond that, we present long-term statistics on vertical tracer transport into the upper troposphere to highlight the contribution of air masses originated at different heights to the upper tropospheric composition. This also includes the analysis of the regional and global distribution of convective outflow heights of the simulated convective clouds. Finally, we outline a potential application as a support tool for the analysis of upper troposphere aircraft observations in convectively active regions to backtrace the origin of the air masses and their overall contribution to the measured concentrations.

How to cite: Jeske, A., Smoydzin, L., Hoor, P., and Tost, H.: Modelling the changes in the upper tropospheric composition due to convective transport, EGU General Assembly 2024, Vienna, Austria, 14–19 Apr 2024, EGU24-3980, https://doi.org/10.5194/egusphere-egu24-3980, 2024.

EGU24-4573 | ECS | Orals | AS1.30 | Highlight

Contrasting stratospheric chlorine processes on volcanic and wildfire aerosols 

Peidong Wang, Susan Solomon, and Douglas Kinnison

Combining satellite data from HALOE (The Halogen Occultation Experiment, available from 1991-2005) and ACE-FTS (Atmospheric Chemistry Experiment - Fourier Transform Spectrometer, available from 2004-present), we quantified the stratospheric chlorine processes after the 2020 Australian wildfire and major volcanic eruptions (1991 Pinatubo, 2015 Calbuco, and 2022 Tonga). The 2020 Australian wildfire was the largest wildfire since the satellite era. This wildfire released of the order of 1 Tg of aerosols into the stratosphere, comparable to small-scale volcanic eruptions. Despite this rather small amount of stratospheric aerosol loading, its impact on the stratospheric chlorine reservoirs (HCl and ClONO2) was enormous. In contrast to volcanic eruptions, most of the aerosols from wildfires are organics, which could lead to different chemical processes from inorganic sulfates. We use these observations to demonstrate that wildfire aerosols uptake HCl much more efficiently than volcanic aerosols, especially at temperatures warmer than 200 K. Furthermore, while the 1991 Pinatubo eruption injected an order of magnitude more aerosol into the stratosphere than the 2020 Australian wildfire, we show that the two events led to a similar amount of HCl decrease in the mid-latitude and polar region. Most of the decrease in HCl after the 2020 Australian wildfire was balanced by an increase in ClONO2; whereas calculated ClONO2 remained unchanged after the 1991 Pinatubo eruption (indicated by model simulations). With current climate change projections, we are expected to have more frequent wildfires in the future, and this more efficient HCl loss pathway poses new threats to the recovery of the stratospheric ozone layer.

How to cite: Wang, P., Solomon, S., and Kinnison, D.: Contrasting stratospheric chlorine processes on volcanic and wildfire aerosols, EGU General Assembly 2024, Vienna, Austria, 14–19 Apr 2024, EGU24-4573, https://doi.org/10.5194/egusphere-egu24-4573, 2024.

EGU24-5076 | ECS | Posters on site | AS1.30

The influence of extratropical cross-tropopause mixing on the correlation between ozone and sulfate aerosol in the lowermost stratosphere 

Philipp Joppe, Johannes Schneider, Katharina Kaiser, Horst Fischer, Peter Hoor, Daniel Kunkel, Hans-Christoph Lachnitt, Andreas Marsing, Lenard Röder, Hans Schlager, Laura Tomsche, Christiane Voigt, Andreas Zahn, and Stephan Borrmann

The composition of the upper troposphere/lower stratosphere region (UTLS) is influenced by long-range or regional transport in the troposphere and stratosphere, vertical transport within convective systems and warm conveyor belts, rapid turbulent mixing, as well as photochemical production or loss of species. This results in the formation of the extratropical transition layer, which has been defined by the vertical structure of CO profiles and studied by now mostly by means of trace gas correlations. Here, we extend the analysis to aerosol particles and derive the ozone to sulfate aerosol correlation in Central Europe from aircraft in-situ measurements during the CAFE-EU/BLUESKY mission in May and June 2020. During the campaign two research aircraft, i.e., DLR-HALO (High Altitude and Long Range Research Aircraft) and DLR-Falcon, were deployed covering an altitude range from the planetary boundary layer up to 14 km altitude and thus probing the UTLS during the COVID-19 period with significant reduced anthropogenic emissions. We operated a compact time-of-flight aerosol mass spectrometer (C-ToF-AMS) to measure the chemical composition of non-refractory aerosol particles in the size range from about 40 to 800 nm. In addition to the C-ToF-AMS data, we use trace gas measurements from both HALO and DLR-Falcon.

In our study, we find a correlation between the ozone mixing ratio (O3) and the sulfate mass concentration in the lower stratosphere, between 10 and 14 km for all flights. The correlation is not constant with time but exhibits some variability over the two-week period of the campaign exceeding the background sulfate to ozone correlation. Especially during one flight, we observed enhanced mixing ratios of sulfate aerosol in the lowermost stratosphere, where the analysis of trace gases, such as CO, SO2, H2O, O3 and HNO3 show tropospheric influence during this time. Also, back trajectories indicate, that no recent mixing with tropospheric air occurred within the last 10 days. In addition, we analyzed satellite SO2 retrievals from TROPOMI for volcanic plumes and eruptions. These satellite observations show enhanced volcanic activities in April 2020 on Kamchatka, Russia, with at least one explosive eruption of the Sheveluch volcano reaching the tropopause region and some minor eruptions of different volcanoes into the free troposphere. From these findings, we conclude that gas-to-particle conversion of volcanic SO2 leads to the observed enhanced sulfate aerosol mixing ratios.

How to cite: Joppe, P., Schneider, J., Kaiser, K., Fischer, H., Hoor, P., Kunkel, D., Lachnitt, H.-C., Marsing, A., Röder, L., Schlager, H., Tomsche, L., Voigt, C., Zahn, A., and Borrmann, S.: The influence of extratropical cross-tropopause mixing on the correlation between ozone and sulfate aerosol in the lowermost stratosphere, EGU General Assembly 2024, Vienna, Austria, 14–19 Apr 2024, EGU24-5076, https://doi.org/10.5194/egusphere-egu24-5076, 2024.

EGU24-5686 | Orals | AS1.30 | Highlight

Stratospheric impact of the anomalous 2023 Canadian wildfires 

Sergey Khaykin, Sophie Godin-Beekmann, Slimane Bekki, Florent Tence, Mehdi Meziane, Beatrice Josse, Sophie Pelletier, Qiaoyun Hu, Philippe Goloub, and Alexandra Laeng

The frequency of extreme wildfires has increased as a response to the regional and global warming trends and there is an emerging realization of their impact on climate through emissions of smoke aerosols into the stratosphere. The 2023 wildfire season in Canada was unprecedented in terms of its duration, burned area and cumulative fire power, rendering it the most destructive ever recorded.

 Here we use various satellite observations (TROPOMI, OMPS-LP, OMPS-NM, MLS, CALIPSO, SAGE III) to quantify the stratospheric emissions of smoke aerosols and carbon monoxide by the 2023 Canadian wildfires and to characterize the long-range transport of smoke plumes in the stratosphere. Using multiwavelength lidar observations in Northern France, we show systematically distinct microphysical properties of UTLS smoke aerosols compared to their free-tropospheric counterparts.

The analysis of satellite data reveals multiple episodes of smoke intrusions into the stratosphere through pyroconvection (PyroCb) and synoptic-scale processes (warm conveyor belt, WCB). Model simulations using MOCAGE chemistry-transport model, which included emission data from GFAS (Global Fire Assimilation System) are shown to accurately capture the synoptic-scale uplift of smoke into the UTLS and reproduce the spatial evolution of the aerosol plumes.

We show that the multiple episodes of wildfire-driven stratospheric intrusions during Boreal Summer 2023 through PyroCb and WCB mechanisms are altogether responsible for the record-high and persistent season-wide smoke pollution at the commercial aircraft cruising altitudes and the lowermost stratosphere.

How to cite: Khaykin, S., Godin-Beekmann, S., Bekki, S., Tence, F., Meziane, M., Josse, B., Pelletier, S., Hu, Q., Goloub, P., and Laeng, A.: Stratospheric impact of the anomalous 2023 Canadian wildfires, EGU General Assembly 2024, Vienna, Austria, 14–19 Apr 2024, EGU24-5686, https://doi.org/10.5194/egusphere-egu24-5686, 2024.

EGU24-6209 | Orals | AS1.30 | Highlight

Chemical perturbations from Asian summer monsoon in the extratropical UTLS during PHILEAS 

Peter Hoor, Martin Riese, Christian Rolf, Baerbel Vogel, Felix Ploeger, Stephan Borrmann, Andreas Engel, Michael Höpfner, Mira Pöhlker, Rolf Müller, Michael Volk, Jörn Ungermann, Franziska Köllner, Helmut Ziereis, Laura Tomsche, Sören Johansson, Valentin Lauther, Tanja Schuck, and Johannes Schneider and the PHILEAS TEAM

The Asian monsoon anticyclone (AMA) during northern summer is a major contributor to the transport of tropospheric air masses, rich in water vapour, aerosol precursors and surface emissions , into the UTLS. During previous HALO missions TACTS/ESMVal and WISE a significant impact of the monsoon export on the background composition of the lowermost stratosphere (LMS) could be observed. Recent observations during the research missions StratoClim and ACCLIP show evidence for a strong contribution of ammonium nitrate by the AMA to the UTLS aerosol budget and the Asian Tropopause Aerosol Layer (ATAL), likely relevant for cirrus cloud formation. These missions revealed that the northern central Pacific is a key region for the transition of air masses originating from the AMA and emissions from East Asia and China to cross the tropopause. Particularly, over the northern Pacific dynamical and diabatic forcings lead to a subsequent erosion of these eddies and to mixing into the background lower stratosphere.

We will present first results from the PHILEAS mission, which took place between August and October 2023 over Anchorage/Alaska and Europe. We found strong perturbations of the gas phase and chemical composition in the UTLS region. These perturbations can be linked to the Asian monsoon and east Asian pollution sources as well as to Canadian wild fires, which occurred prior and during the measurements.

Based on selected cases we will present clear evidence for cross tropopause transport and mixing of pollution from East Asian pollution and the AMA over the eastern Mediterranean as well as over the northern Pacific. We will show that these sources affected the aerosol as well as the gas phase composition of the lowermost stratosphere.

How to cite: Hoor, P., Riese, M., Rolf, C., Vogel, B., Ploeger, F., Borrmann, S., Engel, A., Höpfner, M., Pöhlker, M., Müller, R., Volk, M., Ungermann, J., Köllner, F., Ziereis, H., Tomsche, L., Johansson, S., Lauther, V., Schuck, T., and Schneider, J. and the PHILEAS TEAM: Chemical perturbations from Asian summer monsoon in the extratropical UTLS during PHILEAS, EGU General Assembly 2024, Vienna, Austria, 14–19 Apr 2024, EGU24-6209, https://doi.org/10.5194/egusphere-egu24-6209, 2024.

EGU24-6463 | Orals | AS1.30

Evaluating the importance of nitrate aerosol in the upper troposphere and lower stratosphere during the Asian summer monsoon season 

Yunqian Zhu, Pengfei Yu, Charles Bardeen, Xinyue Wang, Stephan Borrmann, Michael Höpfner, Terry Deshler, Jianchun Bian, Zhixuan Bai, Robert Portmann, Karen Rosenlof, Corinna Kloss, Simon Clegg, Anthony Wexler, Laura Pan, Warren Smith, and Owen Toon

The Asian Summer Monsoon (ASM), as well as tropical convection, transport aerosols and their precursors from the boundary layer to the upper troposphere and lower stratosphere (UTLS). We utilize the Community Aerosol and Radiation Model for Atmospheres (CARMA) coupled with the Community Earth System Model (CESM) to simulate all major tropospheric aerosols including sulfate, organics, ammonium, nitrate, sea salt, and dust. We evaluate the model during the ASM season by comparing the simulated aerosol microphysical properties, such as particle compositions, size distribution, and particle volume with MIPAS satellite and in-situ data from three field campaigns. We find nitrate, organics, and sulfate contribute significantly to the UTLS optical properties between 0-45˚N, 0-180˚E. The major source of nitrate is the ammonium nitrate formed locally and nitric acid condensation near the cold tropopause. Including nitrate in the model doubles the surface area density between 0-45˚N, 0-180˚E, which alter the chlorine partitioning at the UTLS region.

How to cite: Zhu, Y., Yu, P., Bardeen, C., Wang, X., Borrmann, S., Höpfner, M., Deshler, T., Bian, J., Bai, Z., Portmann, R., Rosenlof, K., Kloss, C., Clegg, S., Wexler, A., Pan, L., Smith, W., and Toon, O.: Evaluating the importance of nitrate aerosol in the upper troposphere and lower stratosphere during the Asian summer monsoon season, EGU General Assembly 2024, Vienna, Austria, 14–19 Apr 2024, EGU24-6463, https://doi.org/10.5194/egusphere-egu24-6463, 2024.

EGU24-6647 | Orals | AS1.30

Quasi-horizontal transport of Asian summer monsoon air during the PHILEAS campaign in summer and autumn 2023 

Martin Riese, Peter Hoor, Christian Rolf, and Daniel Kunkel and the PHILEAS Team Representatives

The Asian summer monsoon provides a strong link between the near-surface pollution and the global atmosphere by connecting local sources at the surface with the large-scale circulation. It affects both the composition of the deep stratosphere and of the extratropical lowermost stratosphere (LMS). To evaluate the associated global effects on climate, a detailed understanding of the associated pathways is essential. The extratropical upper troposphere / lower stratosphere (UT/LS) is mainly influenced by quasi-horizontal export of polluted and moist air from the upper-level Asian Monsoon anticyclone (AMA), which is facilitated by regular eddy shedding events. Currently, there is a lack of observations in the northern hemisphere transition area at middle and high latitudes where the dissolution and filamentation of the shed eddies and subsequent mixing into the lower stratosphere takes place.

The recent HALO campaign PHILEAS (Probing high latitude export of air from the Asian summer monsoon) aimed to fill this important gap by dedicated aircraft observations from Anchorage/Alaska and Oberpfaffenhofen/Germany in summer and autumn 2023. Our presentation puts the PHILEAS campaign in a climatological context. We compare the special meteorological situation as well as model simulations of tracers of air mass origin and transit time distributions in the monsoon season 2023 (e.g. South Asia) with the respective long-year average (2000 to 2020). We analyse recurrent meteorological situations that favour the transport of AMA air to high latitudes and quantify the composition of these air masses exported from the AMA with air from different surface source regions and the related transport time scales. Based on this analysis we investigate whether the Asian summer monsoon anticyclone in 2023 and its impact on the northern extra-tropical lower stratosphere represents typical climatological conditions or stands out. Selected results from the aircraft measurements during the PHILEAS campaign are presented and discussed in light of particular meteorological situations.

How to cite: Riese, M., Hoor, P., Rolf, C., and Kunkel, D. and the PHILEAS Team Representatives: Quasi-horizontal transport of Asian summer monsoon air during the PHILEAS campaign in summer and autumn 2023, EGU General Assembly 2024, Vienna, Austria, 14–19 Apr 2024, EGU24-6647, https://doi.org/10.5194/egusphere-egu24-6647, 2024.

EGU24-7205 | Posters on site | AS1.30

Aerosol perturbation in the UTLS region over the Tibetan Plateau 

Dan Li, Jianchun Bian, and Zhixuan Bai

The Asian tropopause aerosol layer (ATAL) was thicker than other regions at the same latitude due to the strong confinement effect of the Asian summer monsoon anticyclone. The size distribution of the particles remains unknown and requires further investigation. Aerosol profiles were measured by balloon-borne sensors (Cobald, POPS) launched from Lhasa (29.66 °N, 91.14 °E), Golmud (36.48 °N, 94.93 °E), and Kunming (25.01 °N, 102.65 °E) China, from 2019 to 2022 over the Tibetan Plateau at the part of the SWOP (Sounding Water vapor, Ozone, and Particle) campaign. The measurements combined with backward trajectories show that the volcano Raikoke (48°N, 153°E) in June 2019 and the dust storm in March 2021 over the Taklamakan desert have significantly impacted on the aerosol layer in the upper troposphere and lower stratosphere (UTLS). The backscatter ratio at wavelength 455 nm of the volcanic plume and dust storm was higher than the ATAL. The particle number density in the volcanic plume is 30 cm-3, higher than the ATAL and dust storm (10 cm-3) in the lower stratosphere, with particle diameters centered around 0.42-3.4 μm. In contrast, the dust storm has a high density of up to 100 cm-3 in the upper troposphere with particle diameters less than 0.42 μm.

How to cite: Li, D., Bian, J., and Bai, Z.: Aerosol perturbation in the UTLS region over the Tibetan Plateau, EGU General Assembly 2024, Vienna, Austria, 14–19 Apr 2024, EGU24-7205, https://doi.org/10.5194/egusphere-egu24-7205, 2024.

EGU24-7752 | ECS | Posters on site | AS1.30 | Highlight

Water vapor variability in the extratropical UTLS from combined passenger and reasearch aircraft measurements 

Patrick Konjari, Christian Rolf, Martina Krämer, Susanne Rohs, Yun Li, Harald Bönisch, Andreas Zahn, and Andreas Petzold

Water vapor (H2O) is a key trace gas in the upper troposphere (UT) and lowermost stratosphere (LMS) because it plays a crucial role in the Earth’s climate. However, accurate knowledge of the amount of H2O in this region is still insufficient due to the difficulty and lack of in-situ and space-borne measurements. This study presents a new methodology to compile H2O climatologies for the LMS from simple, extensive measurements aboard passenger aircraft between 1994 and now within the IAGOS infrastructure covering in the extratropical UT/LMS.

To this end, a statistical comparison of mean H2O in sampling bins of air relative to the tropopause is performed between a dataset from ≈60.000 flights applying the IAGOS-MOZAIC and -CORE simple sensor and a dataset of only ≈500 flights using the more sophisticated IAGOS-CARIBIC instrument. We find good agreement in the UT, but a systematic positive bias in the simple measurements in the LMS. To account for this bias, mean water vapor values of the simple sensor are adjusted to the sophisticated observations based on a new statistical approach. After applying this new method, the LMS water vapor measurements are in good agreement. The extensive H2O dataset from the simple IAGOS sensor can now be used to produce highly resolved water vapor climatologies for the climatically sensitive LMS region. With the adjusted IAGOS H2O data, water vapor transport processes and (de-)hydration of air masses in the extratropical UT/LMS are analysed through backward trajectories and microphysical CLaMS-ICE simulations.

How to cite: Konjari, P., Rolf, C., Krämer, M., Rohs, S., Li, Y., Bönisch, H., Zahn, A., and Petzold, A.: Water vapor variability in the extratropical UTLS from combined passenger and reasearch aircraft measurements, EGU General Assembly 2024, Vienna, Austria, 14–19 Apr 2024, EGU24-7752, https://doi.org/10.5194/egusphere-egu24-7752, 2024.

EGU24-7994 | ECS | Posters on site | AS1.30

Altitude-resolved measurements of water vapor from ground to space: the Swiss H2O-Hub  

Simone Brunamonti, Yann Poltera, Frank Wienhold, Gonzague Romanens, Giovanni Martucci, Alistair Bell, Adrianos Filinis, Renaud Matthey, Axel Murk, Alexander Haefele, Thomas Peter, Lukas Emmenegger, Béla Tuzson, and Gunter Stober

The abundance of water vapor (H2O) in the upper troposphere-lower stratosphere (UTLS) plays a critical role for the Earth's radiative balance. Yet, accurate measurements of H2O in the UTLS are still very demanding, and lack sufficient spatial and temporal coverage. Therefore, frequent and long-term measurements with high precision and vertical resolution, as provided by balloon-borne instruments, are required. Furthermore, large discrepancies were often found between different measuring techniques, both in the field and in laboratory settings, indicating the difficulty of reliable H2O measurements at the low concentrations of the UTLS.

Within the GCOS-funded Swiss H2O-Hub project, we aim to address this challenge by continuously optimizing and validating the performances of two novel balloon-borne hygrometers, while exploiting their complementarity and vertical overlap with remote sensing techniques. Particularly, the balloon-borne laser spectrometer for UTLS water research ("ALBATROSS") [1,2], based on mid-IR laser absorption spectroscopy, and the Peltier-cooled frostpoint hygrometer (PCFH) [3], based on the chilled-mirror principle, are operated jointly with remote sensing measurements by the Raman lidar for meteorological observations (RALMO) [4] and the middle atmospheric water vapor radiometer (MIAWARA) [5]. The altitude coverages of RALMO (troposphere) and MIAWARA (stratosphere and mesosphere) offer two valuable overlap regions for the UTLS measurements by ALBATROSS and PCFH, while all together this set of instruments provides the unique possibility to monitor the altitude-resolved H2O profile from ground to space.

Here we report on the results of the first measurement campaign of the project, conducted in summer 2023 at the MeteoSwiss Observatory Payerne. This included in total 7 balloon soundings with PCFH and ALBATROSS, along with simultaneous retrievals by RALMO and MIAWARA. All balloon-borne payloads were accompanied by a Vaisala RS41 radiosonde and a cryogenic frostpoint hygrometer (CFH) instrument as a reference. The data show very good agreement between the different techniques in the upper troposphere, and some limitations in the lower stratosphere. This is a promising result in the context of the ongoing reconception of the CFH method owing to its use of fluoroform (HFC-23) as cooling agent, which must be phased out due to its high global warming potential. Additionally, the MIAWARA measurements revealed the signature of the Hunga Tonga-Hunga Ha'apai volcanic eruption on H2O in the upper stratosphere and mesosphere.

Further measurement campaigns, planned for the upcoming years, will allow to refine the performances of all instruments under UTLS conditions, as well as to continue monitoring the interannual variability and trends in upper air H2O over Switzerland.

[1] Graf et al., Atmos. Meas. Tech., 14, 1365–1378, 2021.

[2] Brunamonti et al., Atmos. Meas. Tech., 16, 4391–4407, 2023.

[3] Jorge, Diss. ETH No. 26352, 2019.

[4] Dinoev et al., Atmos. Meas. Tech., 6, 1329–1346, 2013.

[5] Straub et al., Atmos. Meas. Tech., 3, 1271–1285, 2010.

How to cite: Brunamonti, S., Poltera, Y., Wienhold, F., Romanens, G., Martucci, G., Bell, A., Filinis, A., Matthey, R., Murk, A., Haefele, A., Peter, T., Emmenegger, L., Tuzson, B., and Stober, G.: Altitude-resolved measurements of water vapor from ground to space: the Swiss H2O-Hub , EGU General Assembly 2024, Vienna, Austria, 14–19 Apr 2024, EGU24-7994, https://doi.org/10.5194/egusphere-egu24-7994, 2024.

EGU24-8095 | ECS | Orals | AS1.30

Impact of fire smoke vortices on stratospheric ozone chemistry: case of the Australian fires in 2019-2020 

Loïc Vieille, Fabrice Jégou, and Gwenaël Berthet

The 2019-2020 Australian wildfires marked a significant event characterized by an unprecedented injection of biomass burning products into the stratosphere. This study focuses on the unique atmospheric phenomena that occurred during these fires, i.e. the formation of vortex-like structures in the stratosphere which had profound effects on stratospheric chemistry.

The wildfires triggered severe pyrocumulonimbus thunderstorms which propelled combustion products into the upper troposphere and lower stratosphere. These emissions could self-organize into a high vorticity anticyclonic structure, a phenomenon observed by Khaykin et al. (2020). This vortex effectively confined the mixture of gases and aerosols from biomass combustion products in the stratosphere for an extended period, leading to specific chemical reactions and interactions.

This study mainly utilizes data from the Microwave Limb Sounder (MLS) and the Atmospheric Chemistry Experiment Fourier Transformer Spectrometer (ACE-FTS) to investigate the behaviour of ozone-depleting species and the impact of biomass burning products within this most striking vortex structure. The data reveal a significant increase in water vapour and biomass burning products, such as CO, CH₃Cl, CH₃CN, and HCN. Concurrently, there were marked depletions in key stratospheric chemicals like the HNO₃, ClONO₂ and HCl reservoirs with an increase of the ClO radical as an indicator of chlorine activation over the lifetime of the vortex i.e. until 3 months starting in early January 2020.

The core objective of this study is to elucidate the specific reactivity of inorganic atmospheric species inside this smoke vortex which led to the formation of a localized ozone hole.  More investigations would be necessary to highlight the role of organic compounds on the observed ozone depletion.

The frequency of these dynamic structures is currently not well established in a context of global warming and may follow the increasing frequency and intensity of forest fires. As a result, smoke vortices could become a recurrent and important disturbance of the stratospheric chemistry in the future.

How to cite: Vieille, L., Jégou, F., and Berthet, G.: Impact of fire smoke vortices on stratospheric ozone chemistry: case of the Australian fires in 2019-2020, EGU General Assembly 2024, Vienna, Austria, 14–19 Apr 2024, EGU24-8095, https://doi.org/10.5194/egusphere-egu24-8095, 2024.

EGU24-8648 | Posters on site | AS1.30

Aerosol Transport from the Asian Summer Monsoon into the Arctic Lower Stratosphere 

Ines Tritscher, Sandra Graßl, Christoph Ritter, and Bärbel Vogel

The Asian summer monsoon is linked to deep convection over the Indian subcontinent and to an anticyclonic flow that extends from the upper troposphere into the lower stratosphere region. This allows both gas-phase aerosol precursors and aerosol particles from surface sources to reach the stratosphere. The horizontal transport out of the Asian monsoon anticyclone towards the extratropical lower stratosphere of the Northern Hemisphere is the focus of this study.

We present an annual record of Lidar observations at AWIPEV in Ny-Ålesund. The data record is free from obvious layers like polar stratospheric clouds, volcanic eruptions or forest fires. Nevertheless, the lower stratosphere reveals an annual cycle with lower backscatter values in winter and spring and higher backscatter values in summer and autumn. The Lidar measurements have been linked to backward trajectory calculations and simulations of artificial surface origin tracers with the three-dimensional Chemical Lagrangian Model of the Stratosphere (CLaMS). The simulations show that air masses observed above Ny-Ålesund have been transported from surface sources in Asia into the Arctic lower stratosphere. Thus, the increased backscatter values during summer and autumn can be explained by transport of aerosol particles from the Asian summer monsoon into the Arctic lower stratosphere.

How to cite: Tritscher, I., Graßl, S., Ritter, C., and Vogel, B.: Aerosol Transport from the Asian Summer Monsoon into the Arctic Lower Stratosphere, EGU General Assembly 2024, Vienna, Austria, 14–19 Apr 2024, EGU24-8648, https://doi.org/10.5194/egusphere-egu24-8648, 2024.

EGU24-9179 | ECS | Posters on site | AS1.30

Post-eruption tropical water vapour transport: Pinatubo and Hunga Tonga-Hunga Ha’apai 

Xin Zhou, Wenhui Zhang, Graham Mann, Wuhu Feng, Sandip Dhomse, and Martyn Chipperfield

The June 1991 Pinatubo and January 2022 Hunga Tonga-Hunga Ha’apai (HTHH) are the two most explosive tropical volcanic eruptions in 30 years. The two, one with high sulfur dioxide (SO2) emission and the other high water vapour (H2O) emission, provide two different paradigm cases to understand the post-eruption tropical transport. Here we use the VolMIP short-term climate-response experiments with the UK Earth System Model (UKESM1) to explore the post-eruption tropical H2O transport after a high-SO2 case.

Aerosol-absorptive heating causes peak SWV increases of 17% (~1 ppmv) and 10% (0.5 ppmv) at 100 hPa and 50 hPa, at ~18 months and ~23 months post-eruption, respectively. The main SWV increase occurs only after the descending aerosol heating reaches the tropopause, suggesting a key role for aerosol microphysical processes (sedimentation rate). This increase is strongly modulated by ENSO variability. With a consistent biased Quai-Biannual Oscillation (QBO) towards the westerly phase, tropical upwelling under different ENSO conditions strongly mediates this effect.

We will also discuss the observed tropical H2O entry after HTHH eruption. With a triple-dip La Niña background and the strong H2O-induced cooling in the lower stratosphere, the tropical H2O transport through 2022/23 is dominated by the volcanic forcing and the sea surface temperature. An up-to-date observation from satellite data is used for analysing this unique HTHH volcanic forcing, while future modelling is needed for a tangible impact.

How to cite: Zhou, X., Zhang, W., Mann, G., Feng, W., Dhomse, S., and Chipperfield, M.: Post-eruption tropical water vapour transport: Pinatubo and Hunga Tonga-Hunga Ha’apai, EGU General Assembly 2024, Vienna, Austria, 14–19 Apr 2024, EGU24-9179, https://doi.org/10.5194/egusphere-egu24-9179, 2024.

EGU24-9406 | ECS | Posters on site | AS1.30

Transport of ammonium nitrate and organic aerosol into the extratropical stratosphere associated with the Asian monsoon outflow 

Fatih Ekinci, Franziska Köllner, Oliver Eppers, Oliver Appel, Philipp Brauner, Antonis Dragoneas, Sergej Molleker, Valentin Lauther, C. Michael Volk, Peter Hoor, Johannes Schneider, and Stephan Borrmann

The Asian Monsoon Anticyclone (AMA) is of global importance because of its role in transporting pollutants over long distances through dynamic processes such as eddy shedding. Its impact extends beyond the Asian region to Europe and North America. To study the composition of the extratropical Upper Troposphere and Lower Stratosphere (UTLS) under the influence of the export of AMA air masses, airborne measurements were conducted on board the research aircraft HALO from Anchorage (Alaska) in August/September 2023.
Our instrument ERICA (ERC Instrument for the Chemical composition of Aerosols) was a part of this mission, with the objective to analyze the chemical composition of particles in the outflow region of the AMA. ERICA combines the aerosol mass spectrometer ERICA-AMS, which is designed for bulk measurements of aerosol particles, and the single-particle mass spectrometer ERICA-LAMS.
The objective of our study was to determine whether aerosol particles are transported from the AMA into the extratropical UTLS region. Measurements of methane and dichloromethane were employed to identify air masses originating from the AMA. To distinguish between the tropospheric and stratospheric air masses, ozone and nitrous oxide were utilized. Our results demonstrate that UTLS air masses exhibit elevated concentrations of ammonium, nitrate and organic matter based on ERICA-AMS data, along with enhanced methane and dichloromethane mixing ratios. These results are consistent with previous high-altitude measurements in the center of the AMA, showing the presence of enhanced ammonium nitrate and organic particle concentrations (Appel et al., 2022). These findings lead to the conclusion that particles from the AMA were transported from the center of the AMA into the extratropical UTLS region. Initial data analysis suggests a quasi-horizontal isentropic transport of these particles from subtropical to extratropical regions.

How to cite: Ekinci, F., Köllner, F., Eppers, O., Appel, O., Brauner, P., Dragoneas, A., Molleker, S., Lauther, V., Volk, C. M., Hoor, P., Schneider, J., and Borrmann, S.: Transport of ammonium nitrate and organic aerosol into the extratropical stratosphere associated with the Asian monsoon outflow, EGU General Assembly 2024, Vienna, Austria, 14–19 Apr 2024, EGU24-9406, https://doi.org/10.5194/egusphere-egu24-9406, 2024.

EGU24-9585 | ECS | Posters on site | AS1.30

Ammonium nitrate and biomass burning pollution in the UTLS: First results from GLORIA airborne measurements of Asian Monsoon outflow during the PHILEAS campaign 2023 

Sören Johansson, Gerald Wetzel, Michael Höpfner, Peter Braesicke, Felix Friedl-Vallon, Norbert Glatthor, Anne Kleinert, Tom Neubert, Peter Preusse, Martin Riese, Björn-Martin Sinnhuber, Jörn Ungermann, and Stefan Versick and the the GLORIA team

We present trace gas and aerosol measurements obtained by the airborne infrared imaging limb sounder GLORIA (Gimballed Limb Observer for Radiance Imaging of the Atmosphere) that has been operated onboard HALO (High Altitude and Long Range Research Aircraft) during the PHILEAS campaign (Probing High Latitude Export of air from the Asian Summer Monsoon ; August-September 2023). We measured outflow from the Asian Monsoon above the North Pacific, and the Mediterranean, as well as pollution plumes from biomass burning events in North America. In this contribution, we present retrieval results of ammonia (NH3), solid ammonium nitrate and other pollution trace gases (e.g. PAN) as two-dimensional distributions with high vertical resolution, derived from GLORIA observations in the UTLS (Upper Troposphere Lower Stratosphere).

Our GLORIA observations reveal considerable abundances of solid ammonium nitrate, which is connected to the Asian Monsoon, in the lower stratosphere outside the Asian Monsoon Anticyclone. Measurements from a previous airborne campaign within the Asian Monsoon (StratoClim 2017) showed large enhancements of NH3 (precursor of ammonium nitrate), and solid ammonium nitrate in the Asian Monsoon upper troposphere.

Further, GLORIA measured UTLS air masses heavily influenced by biomass burning during PHILEAS. Due to the ability of GLORIA to measure pollution trace gases with different atmospheric life times, we are able to estimate the age of individual plumes, based on their chemical composition. As an example, we show measurements from a PHILEAS flight, influenced by aged and fresh pollution.

In a first analysis, we compare our measurements with atmospheric models to examine air mass origins. In particular, we use artificial tracers calculated by the ICON-ART (ICOsahedral Nonhydrostatic - Aerosol and Reactive Trace gases), one of the models that was also used in forecast configuration for flight planning.

How to cite: Johansson, S., Wetzel, G., Höpfner, M., Braesicke, P., Friedl-Vallon, F., Glatthor, N., Kleinert, A., Neubert, T., Preusse, P., Riese, M., Sinnhuber, B.-M., Ungermann, J., and Versick, S. and the the GLORIA team: Ammonium nitrate and biomass burning pollution in the UTLS: First results from GLORIA airborne measurements of Asian Monsoon outflow during the PHILEAS campaign 2023, EGU General Assembly 2024, Vienna, Austria, 14–19 Apr 2024, EGU24-9585, https://doi.org/10.5194/egusphere-egu24-9585, 2024.

EGU24-9974 | ECS | Posters on site | AS1.30 | Highlight

Injection of water vapor into the stratosphere in a convective system above Europe – a measurement perspective 

Laura Tomsche, Elena de la Torre Castro, Rebecca Dischl, Valerian Hahn, Theresa Harlaß, Tina Jurkat-Witschas, Stefan Kaufmann, Konstantin Krüger, Andreas Marsing, Johanna Mayer, Florian Obersteiner, Anke Roiger, Martin Wirth, Andreas Zahn, Martin Zöger, and Christiane Voigt

Convective processes play a critical role in the atmosphere’s energy balance. In high updraft regimes, turbulent and diabatic processes redistribute moisture, heat, and aerosols, which lead to cloud formation affecting the radiation budget of the atmosphere.

During the HALO airborne CIRRUS-HL mission in summer 2021, the outflow of a convective system over Northern Italy was probed at different altitudes. The system had an overshooting top accompanied by lightning and icing conditions. A suit of in-situ (aerosol, cloud probes, trace gases) and remote sensing (Lidar) instruments deployed on the research aircraft HALO combined with satellite observations  provided the opportunity to investigate the system from different perspectives.

The in-situ H2O -O3 correlation revealed unexpected insights in the extra-tropical tropopause transition layer (exTL), characterized by enhanced water vapor  and ice crystal number in the exTL. The convective system penetrated into the exTL with O3 up to 450ppb. In contrast, the CO -O3 correlation shows minor influence, indicating that this convection event was little impacted by large scale mixing processes.

The potential temperature around the upper cloud edge ranged from 330K to 350K. At higher potential temperatures (377-392K) no H2O enhancements were observed. Nevertheless, the irreversible injection of water vapor could lead to transport of moisture into the lower stratosphere in the following hours and days downwind of the system.

Within the upper cloud part and in the vicinity of the cloud, water vapor and ice crystals are enhanced in comparison to the undisturbed surrounding, as visible in the Lidar curtain. Both, water vapor and ice crystals influence the hydration and dehydration of the exTL. While larger ice crystals sediment, smaller ice crystals may sublimate and contributing to a locally enhanced water vapor budget. Our measurements show, that strong convective systems can act as a potential moisture source of the lowermost stratosphere.  

How to cite: Tomsche, L., de la Torre Castro, E., Dischl, R., Hahn, V., Harlaß, T., Jurkat-Witschas, T., Kaufmann, S., Krüger, K., Marsing, A., Mayer, J., Obersteiner, F., Roiger, A., Wirth, M., Zahn, A., Zöger, M., and Voigt, C.: Injection of water vapor into the stratosphere in a convective system above Europe – a measurement perspective, EGU General Assembly 2024, Vienna, Austria, 14–19 Apr 2024, EGU24-9974, https://doi.org/10.5194/egusphere-egu24-9974, 2024.

EGU24-10103 | ECS | Posters on site | AS1.30

Exploring the Slow Large-scale updraft Pathway into the Stratosphere over the Tropical Western Pacific 

Xiaoyu Sun, Mathias Palm, and Justus Notholt

There are two major pathways for the air in the tropical tropopause Layer (TTL) transport into the stratosphere: overshooting convection and slow large-scale updrafts. Here we present further evidence of the latter pathway, the large-scale slow upwelling over the Tropical Western Pacific (TWP) region. The TWP region is known for its coldest tropopause, considered to be the region where water vapour is freeze-dried to a minimum value based on saturated vapour pressure before it eventually enters the stratosphere through a slow ascent. During this process, persistent subvisible cirrus clouds (SVC) with an optical thickness of less than 0.3 are formed in the region and the presence of SVC is taken as an indication of transport into the stratosphere. An important consequence of the slow upwelling pathway over the TWP region is the vertical transport of trace constituents. This pathway will cause the trace gases to transport into the stratosphere and therefore affect the composition of the stratospheric air (Müller et al., 2023; Rex et al., 2014).  

Motivated by this, we used ground-based COMpact Cloud-Aerosol Lidar (COMCAL) observations in Koror, Palau (7.34°N, 134.47°E, in the heart of the Pacific warm pool) and combined trajectory model simulations by Hybrid Single-Particle Lagrangian Integrated Trajectory (HYSPLIT) to study the transport pathway, with a special focus on this slow large-scale updrafts over this key region. 

We present measurements of cirrus clouds by the gound-based COMCAL Lidar from 2018 to 2022. The annual cycle shows that cloud layer height peaks with the highest Cold Point Tropopause (CPT) in NH winter and reaches its minimum with the lowest CPT in NH summer.  Compared with similar cirrus cloud measurements obtained in other tropical sites, our measurements reveal that cirrus clouds detected over TWP are the coldest and highest. The prevalence of the coldest cirrus cloud layer detected over Palau corresponds to the cold trap, a region of exceptionally cold air, in UTLS over the TWP region. In order to build the relationship between the transport path in the UTLS region and measurements, we conducted trajectory analysis by HYSPLIT model simulations based on cirrus cloud layer measurements. Our measurements and analysis of trajectories reveal that only in winter with high supersaturation at the altitude where the SVCs are detected, the air masses are further dehydrated and slowly ascend into the stratosphere. This sheds light on the pathway of slow ascend of the tropospheric air entering into the stratosphere during the NH winter over the TWP region.

Reference:

K. Müller, I. Wohltmann, P. von der Gathen, and M. Rex, “Air mass transport to the tropical west pacific troposphere inferred from ozone and relative humidity balloon observations above palau,” EGUsphere, vol. 2023, pp. 1–37, 2023.
M. Rex, I. Wohltmann, T. Ridder, R. Lehmann, K. Rosenlof, P. Wennberg, D. Weisenstein, J. Notholt, K. Krüger, V. Mohr, and S. Tegtmeier, “A tropical west pacific oh minimum and implications for stratospheric composition,” Atmos. Chem. Phys., vol. 14, no. 9, pp. 4827–4841, 2014. 

How to cite: Sun, X., Palm, M., and Notholt, J.: Exploring the Slow Large-scale updraft Pathway into the Stratosphere over the Tropical Western Pacific, EGU General Assembly 2024, Vienna, Austria, 14–19 Apr 2024, EGU24-10103, https://doi.org/10.5194/egusphere-egu24-10103, 2024.

EGU24-10991 | ECS | Orals | AS1.30

Variability and trends in the PV-gradient dynamical tropopause 

Anna Katharina Turhal, Felix Plöger, Jan Clemens, Thomas Birner, Franziska Weyland, Paul Konopka, and Peter Hoor

The dynamical tropopause as a transport barrier between the tropical upper troposphere and extratropical lowermost stratosphere is characterized by steep gradients in potential vorticity (PV) along an isentropic surface. Hence, the latitudinal separation between the dynamical tropopause in the Northern and Southern hemispheres can be used as a metric of upper tropospheric width for assessing climate change impacts. Here, we calculate the PV gradient-based dynamical tropopause from different meteorological reanalyses (ERA5, ERA-Interim, JRA-55, MERRA-2) and investigate its climatology, variability and long-term trends. Our results show a large seasonal cycle in the dynamical tropopause, with larger PV values and a poleward movement in summer. The climatological tropopause PV values are substantially different between different reanalyses, but the tropopause latitude is similar. Significant inter-annual variability in the dynamical tropopause latitude is related to El Niño Southern Oscillation (ENSO), is much weaker for the Quasi-Biennial Oscillation (QBO), and is robustly represented in reanalyses. In particular, El Niño causes equatorward shifts of the dynamical tropopause, hence a decrease of upper tropospheric width. Long-term trends in the dynamical tropopause exhibit a distinct vertical structure with poleward shifts below 340 K potential temperature, equatorward shifts between 340 K to 370 K and poleward shifts between 370 K to 380 K, implying an expansion of tropospheric width at lower levels, narrowing at upper levels and expansion near the tropical tropopause. Therefore, the dynamical tropopause as a metric for tropospheric width at a given level appears consistent with a widening of the tropics found from other metrics at lower levels, and furthermore shows a concurrent narrowing of the tropical upper troposphere. 

How to cite: Turhal, A. K., Plöger, F., Clemens, J., Birner, T., Weyland, F., Konopka, P., and Hoor, P.: Variability and trends in the PV-gradient dynamical tropopause, EGU General Assembly 2024, Vienna, Austria, 14–19 Apr 2024, EGU24-10991, https://doi.org/10.5194/egusphere-egu24-10991, 2024.

EGU24-11395 | Orals | AS1.30 | Highlight

Radiative effects of UTLS aerosols in climate simulations 

Holger Tost, Ryan Vella, and Peter Hoor

The UTLS (upper troposphere lower stratosphere) is known for its strong susceptibility of changes of the radiative impact of their constituents, with effects relevant also for near surface temperatures. To assess the effects of particulate radiative effects, we have developed a new calculation scheme for the optical properties of internally and externally mixed aerosol compounds both in the shortwave (visible and near-infrared) and the longwave spectrum, differentiating between scattering and absorbing contributions. The scheme is easily extendable to consider specific compounds, e.g., including volcanic ash or differentiating between organics from anthropogenic sources versus biogenic SOA.
This scheme has been implemented into the chemistry climate model EMAC to investigate the effects of aerosol radiative impacts in the UTLS on the troposphere. This study shows corresponding results, including an assessment of how the refractive indices of the individual compounds have an overall impact on the global radiative effects.

How to cite: Tost, H., Vella, R., and Hoor, P.: Radiative effects of UTLS aerosols in climate simulations, EGU General Assembly 2024, Vienna, Austria, 14–19 Apr 2024, EGU24-11395, https://doi.org/10.5194/egusphere-egu24-11395, 2024.

EGU24-13104 | Orals | AS1.30 | Highlight

Detecting multi-decadal changes in the Brewer-Dobson circulation from in situ trace gas measurements and idealized modeling 

Eric Ray, Fred Moore, Brad Hall, Eric Hintsa, Geoff Dutton, and Hella Garny

We utilize in situ stratospheric measurements of trace gases from two recent high altitude aircraft campaigns, DCOTTS and SABRE, to compare mean ages and long-lived trace gas relationships in the NH stratosphere to those from ER-2 campaigns in the 1990s.  The ER-2 campaign data from three decades ago have been a primary reference for in situ-based estimates of mean age in the lower stratosphere from 16-22 km altitude, but very few measurements have been made in this region since then.  We use an updated technique to consistently calculate mean ages from simultaneous in situ measurements of SF6, CO2, N2O and CH4, allowing us to compare mean ages and their relationship with N2O between the 1990s and 2020s.  The mesospheric loss of SF6 and subsequent old age biases are largely accounted for based on newly developed theory and modeling work.  We then use the idealized tropical leaky pipe model to explore stratospheric circulation and mixing changes that are consistent with the observations.

How to cite: Ray, E., Moore, F., Hall, B., Hintsa, E., Dutton, G., and Garny, H.: Detecting multi-decadal changes in the Brewer-Dobson circulation from in situ trace gas measurements and idealized modeling, EGU General Assembly 2024, Vienna, Austria, 14–19 Apr 2024, EGU24-13104, https://doi.org/10.5194/egusphere-egu24-13104, 2024.

EGU24-13410 | ECS | Posters on site | AS1.30

In-situ Observations Over Tropical Cyclone Hinnamnor Show Large-Amplitude Gravity Wave Disturbances That Are Underestimated in Reanalysis 

Carly KleinStern, Benjamin Clouser, Thaopaul Bui, Jonathan Dean-day, and Elisabeth Moyer

Tropical cyclones (TCs) induce gravity waves which radiate outwards and upwards in concentric rings from the core, or spiral formations. These waves deposit momentum at higher altitudes and create temperature fluctuations that can control local cirrus formation. The induced cold temperature fluctuation from the cold phase of the gravity wave can induce relative humidities above the threshold needed for condensate formation. However, TC-induced gravity waves are mainly known from simulations and satellite observations, which are unable to fully capture the fine scale structure of the perturbations. An overflight of TC Hinnamnor during the 2022 ACCLIP campaign provides new, high resolution data. We find a gravity wave amplitude of 4.7 K (centerline to peak) above the TC at 87 mb (~17.6 km). ERA5 reanalysis underestimates the amplitude of the TC-induced gravity waves: amplitudes in ERA5 at 70 mb are more than three times smaller (1.3 K), and the frequency is two times larger, than in-situ measurements. The in-situ-measured amplitude over Hinnamnor is large but not unprecedented for stratospheric gravity waves. We show that in ERA5, TCs regularly produce gravity waves, albeit their amplitudes are underestimated, and that TC Hinnamnor has temperature variations representative of other TCs. Underestimates of gravity wave amplitude can result in an underestimate of cirrus formation in the cold phase of the wave under appropriate conditions.

How to cite: KleinStern, C., Clouser, B., Bui, T., Dean-day, J., and Moyer, E.: In-situ Observations Over Tropical Cyclone Hinnamnor Show Large-Amplitude Gravity Wave Disturbances That Are Underestimated in Reanalysis, EGU General Assembly 2024, Vienna, Austria, 14–19 Apr 2024, EGU24-13410, https://doi.org/10.5194/egusphere-egu24-13410, 2024.

EGU24-14118 | ECS | Posters on site | AS1.30

An update on the perturbations in stratospheric composition and climate following the Hunga Tonga-Hunga Ha'apai volcanic eruption 

Xinyue Wang, William Randel, Wandi Yu, Yunqian Zhu, and Jun Zhang

The Hunga Tonga-Hunga Ha'apai (HTHH) volcanic eruption on January 15th 2022 injected unprecedented amounts of H2O as well as modest amounts of aerosol precursor sulfur dioxide into the stratosphere. Satellite observations have shown strong stratospheric cooling and circulation changes throughout 2022. Large ozone reduction in the Southern Hemisphere wintertime midlatitudes and springtime Antarctic ozone losses are also observed. In addition, a chemistry-climate model (WACCM) can track the evolving HTHH plumes and capture observed responses to the volcanic eruption till the end of 2023. We will present a comprehensive update regarding the perturbations in stratospheric composition and their effects on large-scale circulation since the HTHH eruption. We will also examine the longer-term evolution of HTHH H2O burden and will quantify the contributions of polar dehydration, stratosphere-troposphere exchange of mass, and chemical process.

How to cite: Wang, X., Randel, W., Yu, W., Zhu, Y., and Zhang, J.: An update on the perturbations in stratospheric composition and climate following the Hunga Tonga-Hunga Ha'apai volcanic eruption, EGU General Assembly 2024, Vienna, Austria, 14–19 Apr 2024, EGU24-14118, https://doi.org/10.5194/egusphere-egu24-14118, 2024.

EGU24-14460 | ECS | Orals | AS1.30

Age of air from ACE-FTS measurements of sulfur hexafluoride 

Laura Saunders, Kaley Walker, Gabriele Stiller, Thomas von Clarmann, Florian Haenel, Hella Garny, Eric Ray, David Plummer, Harald Bönisch, Andreas Engel, Johannes Laube, and Patrick Sheese

The Brewer-Dobson Circulation (BDC) is one of the main determinants of trace gas distributions in the atmosphere. Climate models predict that atmospheric warming will cause the BDC to accelerate, modifying where greenhouse gases are most active and impacting the radiative properties of the atmosphere, resulting in a feedback effect. This acceleration is difficult to verify with observations because the speed of the BDC cannot be measured directly. However, changes in stratospheric transport can be identified using the stratospheric age of air, defined as the time since an air parcel entered the stratosphere from the troposphere. A decrease in age of air at higher latitudes would suggest a reduction in transit times, signifying an acceleration of the BDC. Age of air can be calculated using long-lived “clock tracers” such as sulfur hexafluoride (SF6), an industrial gas that is produced in the troposphere, has a negligible seasonal cycle, and has no stratospheric sinks. Due to its small concentrations, measurements have been historically limited, but detecting changes in age of air derived from SF6 requires a long-term, and ideally consistent (i.e., measured by the same instrument), time series. The Atmospheric Chemistry Experiment Fourier Transform Spectrometer (ACE-FTS) provides the longest available vertically-resolved record of SF6, spanning 2004 to the present. This study presents a new age of air product derived from the ACE-FTS SF6 dataset using an updated version of the method used for the Michelson Interferometer for Passive Atmospheric Sounding (MIPAS) SF6 dataset, which spans the 2002-2012 period. In this presentation, the method for age of air calculation will be presented along with comparisons with other age of air profile datasets derived from MIPAS and balloon measurements. The long-term trend in age of air will be estimated using this new product with the goal of corroborating the predictions made by climate models.

How to cite: Saunders, L., Walker, K., Stiller, G., von Clarmann, T., Haenel, F., Garny, H., Ray, E., Plummer, D., Bönisch, H., Engel, A., Laube, J., and Sheese, P.: Age of air from ACE-FTS measurements of sulfur hexafluoride, EGU General Assembly 2024, Vienna, Austria, 14–19 Apr 2024, EGU24-14460, https://doi.org/10.5194/egusphere-egu24-14460, 2024.

EGU24-14999 | ECS | Posters on site | AS1.30

Turbulence in the tropical stratosphere, Kelvin waves, and the quasi-biennial oscillation 

Rachel Atlas, Aurélien Podglajen, and Richard Wilson

Turbulence in the tropical stratosphere affects the vertical transport of aerosols and gases, with implications for global atmospheric chemistry and the radiative budget of the Earth. However, it is unresolved in global models of the atmosphere, and turbulence parameterizations have not been evaluated within this region. Observational estimates of vertical mixing, including turbulent mixing, in the tropical stratosphere vary widely. We use two decades of high vertical resolution (10 m) radiosonde data from three near-equatorial sites in the tropical West Pacific to quantify the occurrence of stratospheric turbulent layers of at least 200 m thickness, and investigate its temporal and spatial variability, using subcritical Richardson number as a proxy for turbulence. Our estimates of upper tropospheric and lower stratospheric turbulence frequency agree well with published estimates from aircraft data in the same region. We find that stratospheric turbulence typically occurs within downward propagating Kelvin waves, and is most common (3.3% occurrence) right before the quasi biennial oscillation (QBO) phase switches from negative to positive, which coincides with a maximum in Kelvin wave activity. It is least common (0.3% occurrence) during the negative phase of the QBO. Thus, the frequency of tropical stratospheric turbulence varies over a factor of ten depending on the phase of the QBO.

How to cite: Atlas, R., Podglajen, A., and Wilson, R.: Turbulence in the tropical stratosphere, Kelvin waves, and the quasi-biennial oscillation, EGU General Assembly 2024, Vienna, Austria, 14–19 Apr 2024, EGU24-14999, https://doi.org/10.5194/egusphere-egu24-14999, 2024.

EGU24-15443 | ECS | Orals | AS1.30

Short-term variability and uncertainties of trace gases in the boreal summer UTLS from AirCore measurements during the OSTRICH campaign 

Johannes Degen, Bianca Baier, Kyriaki Blazaki, Huilin Chen, Andreas Engel, Pauli Heikkinen, Juha Karhu, Rigel Kivi, Markus Leuenberger, Katharina Meixner, Peter Nyfeler, Colm Sweeney, Steven van Heuven, Alessandro Zanchetta, and Johannes Laube

Trace gas patterns in the upper troposphere and lower stratosphere (UTLS) can provide valuable insights into the mechanisms and the interplay of processes controlling the distribution of these species. We use vertical greenhouse gas profiles derived from measurements with the balloon-based AirCore technique to obtain detailed information on the distribution of carbon dioxide (CO2), carbon monoxide (CO) and methane (CH4) in and around the polar UTLS region during the boreal summer. The analysis is based on new data from the ATMO-ACCESS campaign called OSTRICH (Observations of Stratospheric TRace gases Influencing Climate using High-altitude platforms), which took place in the summer of 2023 in Sodankylä, Finland. More than 30 vertical profile measurements over a ten-day period allow for study of short-term changes in composition, with the balloons covering an altitude range from the ground to >30 km. In addition, the results of the comparison between the six participating international AirCore groups (Universities of Groningen (The Netherlands), Bern (Switzerland), Frankfurt (Germany), Finnish Meteorological Institute, Forschungszentrum Jülich (Germany) and the National Oceanic and Atmospheric Administration (NOAA, US)) enable an evaluation of the measurements themselves. Due to the simultaneous sampling with different AirCores during each flight these results contribute to the assessment of AirCore data quality in general and the determination of uncertainties. Moreover, future technical improvements and adaptations in processing algorithms can be derived from this intercomparison. The measurements mostly agree quite well, confirming the quality of vertical trace gas distributions derived from the AirCore technique. It is however an essential task to pinpoint the reasons behind the deviations that were observed in some cases. Next to these differences within one flight we discuss the variability in the profiles between individual flights. Only at altitudes above the 80 hPa level do expected and remaining similar behaviours of CO2 and CH4 mole fractions appear. The measurements in lower parts of the atmosphere show large deviations from day-to-day during the campaign phase. These clear (short term) variations in trace gas composition show that a single vertical profile in many different layers of the atmosphere, such as the UTLS, is not necessarily representative. Balloon-borne sensors with higher spatial and temporal resolution can therefore help to better constrain trace gas variability across various altitude ranges.

How to cite: Degen, J., Baier, B., Blazaki, K., Chen, H., Engel, A., Heikkinen, P., Karhu, J., Kivi, R., Leuenberger, M., Meixner, K., Nyfeler, P., Sweeney, C., van Heuven, S., Zanchetta, A., and Laube, J.: Short-term variability and uncertainties of trace gases in the boreal summer UTLS from AirCore measurements during the OSTRICH campaign, EGU General Assembly 2024, Vienna, Austria, 14–19 Apr 2024, EGU24-15443, https://doi.org/10.5194/egusphere-egu24-15443, 2024.

EGU24-16002 | ECS | Posters on site | AS1.30

Microphysical Modeling of Water Isotopic Composition in the Asian Summer Monsoon 

Benjamin Clouser, Carly KleinStern, Clare Singer, Laszlo Sarkozy, Sergey Khaykin, Alexey Lykov, Silvia Viciani, Giovanni Bianchini, Francesco D'Amato, Cameron Homeyer, Bernard Legras, Frank Wienhold, and Elisabeth Moyer

The summertime Asian Monsoon (AM) is the single most important contributor to water vapor in the UTLS and overworld stratosphere. Much of that water comes from sublimating ice, but the life cycle of the condensate lofted by overshooting convection is not well understood. We report here on insights into that life cycle derived from the first in-situ measurements of water vapor isotopic composition over the Asian Monsoon. The Chicago Water Isotope Spectrometer (ChiWIS) flew on high-altitude aircraft in the monsoon center during the StratoClim (2017) campaign out of Nepal, and in monsoon outflow during ACCLIP (2022) out of South Korea. Both campaigns sampled a broad range of convective and post-convective conditions, letting us trace how convective ice sublimates, reforms, and leaves behind characteristic isotopic signatures. We use isotopic models, along with TRACZILLA backtrajectories and convective interactions derived from cloud-top products, to follow the evolving isotopic composition along flight paths in both campaigns. Results support the wide diversity of isotopic enhancement seen in both campaigns and show how temperature cycles downstream of convective events modify environmental isotopic compositions.

How to cite: Clouser, B., KleinStern, C., Singer, C., Sarkozy, L., Khaykin, S., Lykov, A., Viciani, S., Bianchini, G., D'Amato, F., Homeyer, C., Legras, B., Wienhold, F., and Moyer, E.: Microphysical Modeling of Water Isotopic Composition in the Asian Summer Monsoon, EGU General Assembly 2024, Vienna, Austria, 14–19 Apr 2024, EGU24-16002, https://doi.org/10.5194/egusphere-egu24-16002, 2024.

EGU24-16047 | ECS | Posters on site | AS1.30

Trace gas balloon borne in situ measurements in the Southern Hemisphere 

Kyriaki Blazaki, Christian Rolf, Johannes Laube, Felix Ploeger, Florian Voet, Markus Geldenhuys, Thumeka Mkololo, Casper Labuschagne, and Pieter Labuschagne

The Southern Hemisphere has long been underrepresented in high altitude in situ trace gas measurements. This leads to significant uncertainties in understanding and predicting their effects on stratospheric chemistry and circulation. In a pioneering effort, a balloon campaign took place in Beaufort West (32.3540 ˚S, 22.5833˚E) in early 2023, the first of its kind in South Africa. Two different sensor packages were launched during six balloon flights and reached altitudes up to 33 km. These balloon flights provided unique measurements of key atmospheric constituents, including water vapor, ozone, CO2, CH4, CO, SF6, and various ozone depleting substances.

Here, we present an overview of these findings, along with a comparison with similar data from the Northern Hemisphere, and with data from the Chemical Lagrangian Model of the Stratosphere (CLaMS). A first notable result revealed the sampling of tropical air masses with unusually low water vapor mixing ratios [2.1 ppmv] around the upper troposphere and lower stratosphere (UTLS) region. A follow-up campaign is planned for 2024 to further enrich the dataset and enhance insights into stratosphere-troposphere exchange dynamics.

How to cite: Blazaki, K., Rolf, C., Laube, J., Ploeger, F., Voet, F., Geldenhuys, M., Mkololo, T., Labuschagne, C., and Labuschagne, P.: Trace gas balloon borne in situ measurements in the Southern Hemisphere, EGU General Assembly 2024, Vienna, Austria, 14–19 Apr 2024, EGU24-16047, https://doi.org/10.5194/egusphere-egu24-16047, 2024.

EGU24-16776 | ECS | Posters on site | AS1.30

Observational data synthesis (TPChange Central Project Z01) 

Hans-Christoph Lachnitt, Felix Plöger, Daniel Kunkel, and Peter Hoor and the Campaign PI’s

The UTLS (upper troposphere and lower stratosphere) is a region relevant for weather and climate forecasts as well as for chemical aspects in the troposphere and stratosphere. For these reasons many observations have been conducted in recent years. Comparing data of different measurement campaigns is sometimes a bit difficult, especially for the supporting model data. Often, different model types or grid widths are used or one variable is missing or calculated with different methods.

The main goal of this work is to create a dataset of multiple measurement campaigns with consistent meteorological parameters and supporting analysis.

In a first step, we use ERA5 (European Centre for Medium-Range Weather Forecasts (ECMWF) Reanalysis v5) data with a horizontal grid width of 1° and a time resolution of 6 hours as well as CLaMS (Chemical Lagrangian Model of the Stratosphere) data. In a second step, we also use ERA5 data with a time resolution of 1 hour and a horizontal grid width of 0.3°.The dataset contains several native and derived meteorological (e.g., potential vorticity, equivalent latitude) variables and tropopause diagnostics (e.g., height of laps rate and several dynamical tropopauses) from ERA5. To include information on transport and time scales artificial regional tracers (e.g., O3, CO) and age spectrum variables (e.g., E90 tracer, mean age) from CLaMS are used. The interpolation is carried out for multiple campaigns i.e., for several airborne and balloon campaigns on different platforms.

To introduce the dataset, we also present a few possible application examples in relation to the distribution of trace gases and other species. Furthermore, we present comparisons of different model data and measurement data.

How to cite: Lachnitt, H.-C., Plöger, F., Kunkel, D., and Hoor, P. and the Campaign PI’s: Observational data synthesis (TPChange Central Project Z01), EGU General Assembly 2024, Vienna, Austria, 14–19 Apr 2024, EGU24-16776, https://doi.org/10.5194/egusphere-egu24-16776, 2024.

Stratospheric water vapor (SWV) plays an important role in Earth's climate. For example, variations in SWV levels can feedback onto global temperatures and climate patterns. However, projections of future changes in SWV still pose a difficult challenge for global climate models, mainly due to their dependence on a variety of highly uncertain factors ranging from chemical reactions to changes in the tropospheric and stratospheric circulation (Charlesworth et al. 2023).

Diverse factors lead to significant variations in SWV projections among CMIP6 climate models (Keeble et al., 2021). To tackle this issue, we aim to narrow down and comprehend model uncertainty in SWV projections by employing advanced, explainable machine learning (XML) frameworks. We build on recent work by Nowack et al. (2023) who used a linear XML approach to infer historical relationships between atmospheric temperature patterns and tropical lower SWV. Across CMIP models, they demonstrated that these relationships also hold under strong greenhouse gas forcing scenarios, opening up a direct link between present-day observations and future projections.

However, Nowack et al.'s work highlighted the challenge of interpreting the patterns learned by the statistical model. In this presentation, our goal is to decode these patterns, relating them to key physical mechanisms. Additionally, we aim to validate the reliability of prominent features from observations by testing equivalent patterns in selected climate models over longer timescales. To achieve this, we'll utilize advanced non-linear XML techniques like SHAP values combined with regression-tree methods to estimate feature importance.

The outcomes stress the importance of local temperature patterns near the targeted level in estimating SWV. Additionally, the impact of a two-month lag stands out comparing to one- and zero-month lags. Although CMIP dataset training period aligned with observations seems consistent, it varies across models. A longer training period results in a more stable and robust training pattern.

References:

Charlesworth, E., Plöger, F., Birner, T. et al. Stratospheric water vapor affecting atmospheric circulation. Nat Commun 14, 3925 (2023). https://doi.org/10.1038/s41467-023-39559-2

Keeble, J., Hassler, B., et al. Evaluating stratospheric ozone and water vapour changes in CMIP6 models from 1850 to 2100. Atmospheric Chemistry and Physics, 21(6), 5015-5061 (2021). https://doi.org/10.5194/acp-21-5015-2021

Nowack, P., Ceppi, P., Davis, S.M. et al. Response of stratospheric water vapour to warming constrained by satellite observations. Nat. Geosci. 16, 577–583 (2023). https://doi.org/10.1038/s41561-023-01183-6

How to cite: Amiramjadi, M. and Nowack, P.: Observational constraints on uncertainties in stratospheric water vapour projections: how to open the black-box with explainable machine learning, EGU General Assembly 2024, Vienna, Austria, 14–19 Apr 2024, EGU24-17783, https://doi.org/10.5194/egusphere-egu24-17783, 2024.

EGU24-17928 | Orals | AS1.30

Impact of the Asian Monsoon Anticyclone on Extratropical Lower Stratospheric Water Vapor Distribution observed during the PHILEAS aircraft campaign 

Christian Rolf, Peter Hoor, Linda Ort, Franziska Weyland, Andreas Zahn, and Martin Riese
The Asian monsoon anticyclone (AMA) stands as a critical player in regional climatic dynamics, wielding profound influence on atmospheric circulation patterns. Despite its well-documented impact on surface weather systems, an intriguing and less-explored dimension of its influence lies in the extratropical lower stratosphere. Especially, water vapor, a climatically significant component, plays a pivotal role in shaping the Earth's radiative balance and, consequently, its climate. Water vapor in the lower stratosphere acts as a key driver of radiative processes, influencing temperature profiles and atmospheric energy distribution.

This study focus on recent measurements from the recent HALO research aircraft campaign PHILEAS in fall 2023, incorporating data on water vapor, methane, and ozone concentrations in the extratropical lower stratosphere. By combining the observational data with meteorological data from ECWMF, we aim to unravel the intricate interactions between the Asian monsoon anticyclone and the distribution of these key atmospheric constituents. The integration of water vapor, methane as AMA tracer, and ozone measurements as stratospheric tracer allows us to discern the specific contributions of the Asian monsoon anticyclone to the composition and dynamics of the extratropical lower stratosphere and the change of the water vapor distribution over the campaign time frame.

How to cite: Rolf, C., Hoor, P., Ort, L., Weyland, F., Zahn, A., and Riese, M.: Impact of the Asian Monsoon Anticyclone on Extratropical Lower Stratospheric Water Vapor Distribution observed during the PHILEAS aircraft campaign, EGU General Assembly 2024, Vienna, Austria, 14–19 Apr 2024, EGU24-17928, https://doi.org/10.5194/egusphere-egu24-17928, 2024.

EGU24-18549 | ECS | Orals | AS1.30

Understanding recent trends in lower stratospheric ozone: an update with CCMI-2022 models 

Samuel Benito-Barca, Marta Abalos, Natalia Calvo, Hella Garny, and Thomas Birner

Lower stratospheric ozone between 60S and 60N has continued to decline since 1998, despite the reduction of ozone-depleting substances as a consequence of the Montreal Protocol. Previous studies have shown that Chemistry Climate Models are not able to reproduce these negative trends in mid-latitudes, although the reason for this discrepancy between models and observations remains unknown.

In this study, we re-examine recent trends in lower stratospheric ozone using the new simulations from the Chemistry Climate Model Initiative 2022 (CCMI-2022). Historical simulations with observed sea surface temperatures (SSTs) and nudged QBO (ref-D1), and fully-coupled atmosphere-ocean simulations (ref-D2) are available covering the period up to 2018, which allows a better analysis of the role of natural variability in recent ozone trends compared to previous studies.

CCMI-2022 models show a slight improvement in the representation of lower stratospheric ozone trends in mid-latitudes compared to previous studies that used CCMI-1 and CCMVal models. The observational trend now lies inside the 90% confidence interval of the models’ trend distribution. However, the majority of the models are still not able to reproduce the pattern of negative trends in the tropics extending into mid-latitudes. Intermodel differences dominate the spread in the trends, while natural variability from SSTs and QBO are not decisive in explaining the negative mid-latitude trends.  The role of the different ozone transport representations in models, in particular the mixing between the tropics and mid-latitudes, is also explored.

How to cite: Benito-Barca, S., Abalos, M., Calvo, N., Garny, H., and Birner, T.: Understanding recent trends in lower stratospheric ozone: an update with CCMI-2022 models, EGU General Assembly 2024, Vienna, Austria, 14–19 Apr 2024, EGU24-18549, https://doi.org/10.5194/egusphere-egu24-18549, 2024.

EGU24-19550 | Orals | AS1.30 | Highlight

Stratospheric ozone-climate interactions in idealized DECK experiments from CMIP6 

Gabriel Chiodo, Jingyu Wang, Timofei Sukhodolov, William Ball, Mohamadou Diallo, Birgit Hassler, James Keeble, Peer Nowack, and Clara Orbe

Rising greenhouse gases (GHG) and decreasing anthropogenic ozone-depleting substances (ODS) are the main drivers of stratospheric climate evolution in the 21st century. However, our understanding of the coupling between stratospheric composition, radiation and dynamics is still a subject to many uncertainties, partly because of the simplified representation of ozone in many current climate models. In our work, we study stratospheric ozone-climate interactions using idealized CMIP6 DECK experiments (pre-industrial control, abrupt quadrupling of CO2, and 1 % yr−1 CO2 increase). This set up provides longer time-series and stronger GHG forcing than in the historical period. The 6th phase of CMIP has a larger number of participating models with interactive chemistry (“CHEM”) to be contrasted against the models where it is prescribed (“NOCHEM”) than in previous generations of CMIP models. Our findings show that CMIP6 models broadly exhibit a similar ozone response to CO2 with increased ozone in the upper stratosphere (US), driven mostly by rapid adjustments (chemistry), and slow transport-driven decrease in the tropical lower stratosphere (LS), and increase in the extratropical LS. The total column ozone response is small in the tropics and positive at high latitudes, with large inter-model discrepancy, possibly arising from model biases in polar vortex dynamics. We also quantify, for the first time, the radiative and dynamical impacts of ozone and quantify their inter-model uncertainty, by means of radiative transfer calculations and careful comparison of chem vs nochem models. First, we find that CHEM models are colder than NOCHEM models in the UTLS region, consistent with the ozone changes in these regions. Second, we find that the large-scale circulation response is systematically different in CHEM and NOCHEM. Lastly, climate sensitivity tends to be lower in CHEM than NOCHEM models, although the uncertainty across models is large and processes that are not tied to ozone cannot be ruled out. Taken together, our work demonstrates that ozone changes can potentially modulate the modeled response to elevated CO2 levels, stressing the importance of interactive chemistry in the future generation of models, in order to correctly simulate the coupling between chemistry, radiative and dynamical processes under climate change.

How to cite: Chiodo, G., Wang, J., Sukhodolov, T., Ball, W., Diallo, M., Hassler, B., Keeble, J., Nowack, P., and Orbe, C.: Stratospheric ozone-climate interactions in idealized DECK experiments from CMIP6, EGU General Assembly 2024, Vienna, Austria, 14–19 Apr 2024, EGU24-19550, https://doi.org/10.5194/egusphere-egu24-19550, 2024.

EGU24-20321 | ECS | Posters on site | AS1.30 | Highlight

Diagnosing the dynamical and chemical stratospheric tropical width using model and observational data 

Oksana Ivaniha, Marta Abalos, Natalia Calvo, Kasturi S. Shah, Sean Davis, and Gabriele Stiller

Transport in the stratosphere is characterized by upwelling in the tropics and downwelling in the extratropics, and these regions are separated by the so-called turnaround latitudes. In the winter hemisphere, a region of intense wave breaking (the ‘surf zone’) separates the tropics from the polar vortex. In the summer hemisphere, easterly winds do not allow for penetration of planetary waves into the middle and upper stratosphere.

Observational evidence of this global transport circulation comes from the shape of long-lived tracer contours. While the overturning circulation tends to steepen latitudinal gradients of tracers, large-scale stirring by wave breaking leads to quasi-horizontal mixing and thus flattens the gradients. The observed shape of tracer contours results from the combined effects of the two transport processes, and is therefore not trivially related to the turnaround latitudes or mixing diagnostics.

In this study we compare several tracer-based and dynamical-based diagnostics of the tropical width computed both from a CESM1-WACCM model simulation and from satellite observations  and reanalysis data. We find notable differences between the dynamical and tracer metrics particularly in the seasonality, with good correspondence only in the equinox seasons. We also examine the interannual variability and long-term trends.

How to cite: Ivaniha, O., Abalos, M., Calvo, N., S. Shah, K., Davis, S., and Stiller, G.: Diagnosing the dynamical and chemical stratospheric tropical width using model and observational data, EGU General Assembly 2024, Vienna, Austria, 14–19 Apr 2024, EGU24-20321, https://doi.org/10.5194/egusphere-egu24-20321, 2024.

EGU24-20402 | ECS | Orals | AS1.30

Impact of Asian pollution on the UTLS derived from in situ observations of a wide range of trace gases during the HALO PHILEAS mission in autumn 2023 

Valentin Lauther, Johannes Strobel, Ronja van Luijt, Lars Zlotos, Andrea Rau, Peter Hoor, Bärbel Vogel, and C. Michael Volk

Due to fast industrial growth and a high population density East Asia has become one of the most polluted regions on Earth. In combination with the world’s largest convective system, the Asian summer monsoon (ASM), East Asia now is the most significant source region of pollutants entering the upper troposphere and lower stratosphere (UTLS). Thus, understanding their transport pathways and the corresponding time scales of their transport and mixing into the UTLS as well as their impact on the UTLS’s sensitive chemical composition is of crucial importance for precise climate predictions but is not yet fully achieved.

To tackle these questions we use in situ measurements of our multi tracer instrument HAGAR-V (High Altitude Gas Analyzer – 5 channel version) during the German research aircraft HALO mission PHILEAS in August/September 2023. Flights from Germany and from Alaska targeted plumes and filaments of ASM air masses in the UTLS above the Mediterranean, the North Pacific, Alaska and Canada. HAGAR-V measured a suite of 30 trace gases including very short-lived NMHCs (e.g. Benzene, C2H2, C4H10), halogenated VOC (e.g. CH2Cl2, CHCl3, C2Cl4, CH2Br2), as well as longer-lived halocarbons (e.g. CH3Cl, CH3Br, CCl4, Halons, HCFCs, and HFCs) every 120 s using in-flight gas chromatography and mass spectrometry. Further long-lived species, including the age-of-air tracer SF6, were measured every 40 s (F12, SF6) and every 80 s (F11, F113, H1211) using electron capture detection.

Tracer-tracer relations of species with different source regions and/or atmospheric lifetimes provide insight on sampled air mass origin, mixing, and transport times from the source region to the location of measurement. As shown by Lauther et al. (ACP, 2022) CH2Cl2 is an ideal anthropogenic tracer to identify air masses originating from the ASM region. In the UTLS we find increases of CH2Cl2 by up to 500 % compared to tropospheric background correlating well with other species like SF6, HCFC22, CHCl3, C2Cl4, C2H2, Benzene, and C2H5Cl. The latter three species have tropospheric lifetimes of days to weeks implying that such correlations suggest fast transport from the ASM region to the UTLS. Furthermore, up to 1 ppt enhancement of SF6 in air masses originating from the ASM region suggest a significant ASM-induced negative bias in mean age of air derived from SF6.

Tracer-tracer relations of ASM-enhanced short-lived tracers (e.g. CH2Cl2, CHCl3) with long-lived tracers (e.g. F12, N2O) indicate isentropic mixing of polluted air masses into the stratospheric background. In addition, species with more diverse source regions like CH3Br (rural anthropogenic, biomass burning and oceanic), CHCl3 (industrial, soil, and oceanic), CH2Br2 (mainly oceanic), or C2H2 (anthropogenic combustion and biomass burning) yield several different correlation slopes against CH2Cl2. These relations provide an empirical tool that, along with simulated surface origin tracers of the CLaMS (Chemical Lagrangian Model of the Stratosphere) model, further helps to distinguish the origin of the sampled air masses.

How to cite: Lauther, V., Strobel, J., van Luijt, R., Zlotos, L., Rau, A., Hoor, P., Vogel, B., and Volk, C. M.: Impact of Asian pollution on the UTLS derived from in situ observations of a wide range of trace gases during the HALO PHILEAS mission in autumn 2023, EGU General Assembly 2024, Vienna, Austria, 14–19 Apr 2024, EGU24-20402, https://doi.org/10.5194/egusphere-egu24-20402, 2024.

EGU24-110 | Orals | AS1.31

Observed structure of an internal tide beam over the Mid-Atlantic Ridge 

Clément Vic and Bruno Ferron

Internal tides are key players in ocean dynamics above mid-ocean ridges. The generation and propagation of internal tides over the Mid-Atlantic Ridge (MAR) have been studied through theoretical and numerical models, as well as through moored, that is, one-dimensional, observations. Yet, observations remain sparse and often restricted to the vertical direction. Here we report on the first two-dimensional in situ observation of an internal tide beam sampled by a shipboard acoustic Doppler current profiler through a vertical section over the MAR. The beam is generated by the interaction of the barotropic tidal current with a supercritical abyssal hill that sits in the rift valley of the MAR. A vertical mode decomposition is carried out to characterize the spatio-temporal variability of the beam. Although the modal content of the velocity field is dominated by modes 1 to 3, higher modes display localized and not persistent bursts of energy. The use of an analytical theory for linear internal waves allows us to rationalize the observed velocity field and interpret it as the superposition of modal waves generated on the hill and propagating in the same direction. The observed beam is qualitatively reconstructed as the superposition of waves of modes 2 to 6. The velocity field was sampled seven times across the same section and displayed qualitatively different patterns, unveiling the complexity of the dynamics above the MAR. A ray tracing of modal waves shows that the refraction by mesoscale currents could explain the observed variability of the tidal beam.

How to cite: Vic, C. and Ferron, B.: Observed structure of an internal tide beam over the Mid-Atlantic Ridge, EGU General Assembly 2024, Vienna, Austria, 14–19 Apr 2024, EGU24-110, https://doi.org/10.5194/egusphere-egu24-110, 2024.

EGU24-687 | ECS | Posters on site | AS1.31

3D modelling of internal tide generation 

Cécile Le Dizes, Matthieu Mercier, Nicolas Grisouard, and Olivier Thual

Internal tides, generated by the interaction of tidal flows with underwater topographies, play a pivotal role in ocean dynamics. They significantly contribute to energy transport in the oceans and can lead to deep-ocean mixing, influencing large-scale ocean circulation and ecosystems through nutrient transport. Their accurate representation in large-scale numerical models is essential to improve our understanding of oceanic processes and assess their impact on climate scenarios. However, implementing internal tide generation is challenging due to the variety of spatial and temporal scales involved. It cannot be tackled by estimations from observations and/or numerically expensive regional models alone. In this context, analytical methods offer insights to accurately describe the internal tide wavefield, enabling more precise parameterizations in global ocean models. Existing analytical approaches are based on specific (limiting) assumptions, often considering two-dimensional situations or weak amplitude topographies.

Here, we present a boundary element method to compute the internal tide radiated for a prescribed barotropic tidal flow over any arbitrary localized three-dimensional topography. This method, based on a Green's functions approach, assumes linear Boussinesq generation for harmonic tidal forcing (hence with a weak-amplitude excursion) and uses vertical mode decomposition to express the wave velocity field and the energy flux of the internal waves radiated in all directions. The properties of the internal tide generated by an axisymmetric Gaussian topography for constant stratification are discussed in detail. Results for the sub-critical regime (internal wave slopes larger than the topography) are consistent with the Weak Topography Approximation in the limit of small seamounts and when the influence of the Coriolis frequency is negligible. A specific discussion is made regarding the influence of the Coriolis frequency on the direction of emission for the internal tide radiated by axisymmetric seamounts. An important result is that the direction where the internal tide flux is maximum is controlled by the relative importance of the Coriolis frequency with respect to the tidal frequency, the orientation of the tidal flow, and the geometrical properties of the topography. Interestingly, for topographies elongated in one specific direction, the role of the Coriolis effect becomes negligible; the orientation of the tidal forcing and the one associated with the topography alone control the angular dependency of the energy flux radiated.

Our work is a first approach to realistic analytical modeling of internal tide generation. It emphasizes the importance of considering the 3D effects for this problem.

How to cite: Le Dizes, C., Mercier, M., Grisouard, N., and Thual, O.: 3D modelling of internal tide generation, EGU General Assembly 2024, Vienna, Austria, 14–19 Apr 2024, EGU24-687, https://doi.org/10.5194/egusphere-egu24-687, 2024.

EGU24-1666 | ECS | Posters on site | AS1.31

Internal wave topography interactions in the presence of a steady surface current 

Saranraj Gururaj and Anirban Guha

Wave--topography interaction is one of the primary mechanisms through which internal wave energy cascades to small length scales in the oceans. At small length scales, internal waves become unstable and break down, leading to turbulent diffusion and mixing. Precise diffusivity parametrisations are crucial for modeling ocean flows accurately. We study the interactions of a mode-1 internal wave with an isolated topography in the presence of a steady, stable surface current. For various amplitudes of the surface current, we investigate scattering caused by Gaussian shaped topographies by independently varying height and slope. In the presence of a surface current, a mode-1 wave that propagates in the direction of the current (denoted by M1W) has different properties compared to a mode-1 wave that propagates against the current (denoted by M1C), and we focus on both M1W and M1C. For all the heights considered, for both M1W and M1C, the current does not have a singular effect: it can reduce or increase scattering depending on the slope of the topography. Scattering due to large amplitude topographies (even with a small slope) can be quite different in the presence of a surface current. However, scattering caused by small amplitude topographies does not change significantly even in the presence of strong surface currents. Topographies with very high slopes (commonly known as supercritical topographies) scatter M1C more compared to M1W. Finally, we provide a brief analysis of the generation of superharmonic waves due to wave--topography interactions that occur in the presence of a surface current.

How to cite: Gururaj, S. and Guha, A.: Internal wave topography interactions in the presence of a steady surface current, EGU General Assembly 2024, Vienna, Austria, 14–19 Apr 2024, EGU24-1666, https://doi.org/10.5194/egusphere-egu24-1666, 2024.

EGU24-1700 | ECS | Posters on site | AS1.31

Generation and paths of internal waves on a tropical continental shelf 

Arian Dialectaquiz, Marcelo Dottori, and Piero Mazzini

Through wavelet analysis of temperature and current data, and remote imaging via Synthetic Aperture Radar and True Color, internal waves were identified in the South Brazil Bight (SBB). These waves have predominant semi-diurnal tidal frequencies as well frequencies associated with cold fronts.

Through baroclinic energy flows and coarse graining kinetic energy budget calculated from results of the Regional Ocean Modeling System (ROMS), the energy cascade associated with this internal phenomenon was quantified, as well the contribution of topography in the generation of internal waves due to the instability of the internal tide.

The internal energy paths on the shelf were discretized with the correlation of sub - and supratidal energy flows with the Barotropic - Baroclinic conversion, thus identifying energy conversion hotspots by topography, and the spatial variability in the generation and propagation of internal waves.

The results indicate that while a supercritical regime of baroclinic tide generation prevails in the SBB, from the barotropic tide, with propagation towards the open sea, some regions on the continental shelf are close to a critical regime. In these areas, the lateral distance for the internal tide excursion is less than 5 km, which promotes shearing, local instability dissipation, and the generation of nonlinear internal waves. Simultaneously, in regions with a supercritical regime, subtidal frequency phenomena act as a force for internal waves towards the coast.

How to cite: Dialectaquiz, A., Dottori, M., and Mazzini, P.: Generation and paths of internal waves on a tropical continental shelf, EGU General Assembly 2024, Vienna, Austria, 14–19 Apr 2024, EGU24-1700, https://doi.org/10.5194/egusphere-egu24-1700, 2024.

This talk will present our recent published study of Li et al. (2023, QJ). With the development of advanced data assimilation and computing techniques, many modern global reanalysis datasets aim to resolve the atmospheric mesoscale spectrum. However, large uncertainties remain with respect to the representation of mesoscale motions in these reanalysis datasets, for which a clear understanding is lacking. The aforementioned challenges have served as a strong motivation to reveal and quantify their mesoscale differences. This study presents the first comprehensive global intercomparison of the tropospheric and stratospheric mesoscale kinetic energy and its spectra over two selected periods of summer and winter events among six leading high-resolution atmospheric reanalysis products: European Centre for Medium-Range Weather Forecasts (ECMWF) Reanalysis v5 (ERA5), China Meteorological Administration Reanalysis (CRA), Modern-Era Retrospective Analysis for Research and Applications version 2 (MERRA2), National Centers for Environmental Prediction's Climate Forecast System version 2 (CFSv2), Japanese 55-year Reanalysis (JRA-55), and ECMWF Reanalysis-Interim (ERA-I). A state-of-the-art global operational model is adopted as a supplementary reference. Although all reanalysis datasets can reproduce broad distribution characteristics that are grossly consistent with the 9 km model, there are substantial discrepancies among them in magnitudes. The ability to capture mesoscale signals is closely linked to their resolutions, but it is also impacted by other factors, including, but not limited to, the selected types of energy, seasons, altitudes, latitudes, model diffusions, parametrization schemes, moist condition, assimilation methods, and observation inputs. Moreover, all datasets illustrate conclusive behaviors for the prevalence of the rotational component in the troposphere, whereas only very few products fail to exhibit the dominance of the divergent component in the stratosphere. Overall, stratospheric ERA5 and CFSv2 outperform the other reanalysis datasets, and only these two can reproduce the feature of the canonical kinetic energy spectrum with a distinct shift from a steeper slope (approximately −3) at lower wave numbers to a shallower slope (approximately −5/3) at higher wave numbers. In addition, the relative disparities among datasets increase dramatically with height, and they are more pronounced in the divergent component. It is also found that the correlations among these datasets are much weaker in the Tropics.

Reference:

Li, Z., J. Wei, X. Bao, and Y. Q. Sun, 2023: Intercomparison of tropospheric and stratospheric mesoscale kinetic energy resolved by the high-resolution global reanalysis datasets. Quarterly Journal of the Royal Meteorological Society, 149(757), 3738–3764, https://doi.org/10.1002/qj.4605.

How to cite: Li, Z., Wei, J., Bao, X., and Sun, Y. Q.: Intercomparison of Tropospheric and Stratospheric Mesoscale Kinetic Energy Resolved by the High-Resolution Global Reanalysis Datasets, EGU General Assembly 2024, Vienna, Austria, 14–19 Apr 2024, EGU24-1826, https://doi.org/10.5194/egusphere-egu24-1826, 2024.

EGU24-2227 | ECS | Posters on site | AS1.31

Observations of near-inertial internal wave amplification and enhanced mixing after surface reflection 

Kun Liu, Xu Chen, Peng Zhan, and Hui Wang

The overreflection process of near-inertial internal waves (NIWs) has been theoretically predicted for several decades; however, to the best of our knowledge, this phenomenon has never been comprehensively investigated in real ocean scenarios. Based on the buoy observations collected several days after the passage of Typhoon Lekima in the Yellow Sea, a NIW surface overreflection event is clearly captured. The observed NIWs undergo nearly total reflection meridionally but are amplified zonally after reflection by approximately 20% in amplitude and 56% in vertically integrated horizontal kinetic energy. Ray tracing analysis indicates that the NIW was generated in the wake of Typhoon Lekima in the area north of the Shandong Peninsula and may propagated to the buoy station as coastal-trapped internal Kelvin waves. A simulation using a slab mixed layer model suggests that local wind work was insufficient to generate the amplified NIWs. The temporal evolution of near-inertial energy also implies that the intensified near-inertial waves cannot be attributed to the spontaneous generation resulting from unbalanced flows or the parametric subharmonic instability of M2 internal tides during the reflection period. We found a high temporal correlation between the zonal NIW enhancement and the duration of a meridional lens-type shear flow after reflection, which is consistent with the Stern’s overreflection theory (Stern, 1977) that perpendicular background shear flow can feed energy to the incident NIWs. This indicates that the enhanced NIW may be stimulated by the near-surface reflection and the rotation effect plays a crucial role in the NIWs overreflection process in the real ocean. Furthermore, enhanced instability are found between the ocean surface and the upper thermocline after reflection. This study provides observational evidence that the background field could inject energy into the near-inertial band through NIW overreflection process, and may shed some light on understanding upper ocean mixing caused by NIW reflection.

How to cite: Liu, K., Chen, X., Zhan, P., and Wang, H.: Observations of near-inertial internal wave amplification and enhanced mixing after surface reflection, EGU General Assembly 2024, Vienna, Austria, 14–19 Apr 2024, EGU24-2227, https://doi.org/10.5194/egusphere-egu24-2227, 2024.

EGU24-2472 | Orals | AS1.31

Comparison between non orographic gravity wave drag parameterizations used in QBOi models and Strateole2 constant level balloons                  

Raj Rani, François Lott, Charles McLandress, Aurélien Podglagen, Andrew Bushell, Martina Bramberger, Hyun-Kyu Lee, M. Joan Alexander, James Anstey, Hye-Yeong Chun, Albert Hertzog, Bernard Legras, Elisa Manzini, Scott Osprey, Riwal Plougonven, John Scinocca, Javier Serrano, Federico Serva, Tim Stockdale, and Stefan Versick and the Strateole 2 and QBOi contributors

Gravity Waves (GWs) parameterizations from 14 General Circulation Models (GCMs) participating to the Quasi-Biennial Oscillation initiative (QBOi) are directly compared to Strateole-2 balloon observations made in the lower tropical stratosphere from November 2019 to February 2020 (phase 1) and from October 2021 and January 2022 (phase 2). The parameterizations span the 3 leading edge techniques used in GCMs to represent subgrid scale non-orographic GWs, the two globally spectral techniques developed by Hines (1997) and Warner and McIntyre (1999) respectively and the "multiwaves" approaches following Lindzen (1981). The input meteorological fields necessary to run the parameterizations offline are extracted from the ERA5 reanalysis and correspond to the instantaneous meteorological conditions found underneath the balloons.  In general, the amplitudes are in fair agreement between measurements of the momentum fluxes due to waves with periods less than 1 hr and the parameterizations. The correlation of the daily values between the observations and the results of the parameterization can be around 0.4, which is statistically significant elevated considering that we analyse around 1200 days of data and quite good considering that the parameterizations have not been tuned: the schemes used are just the standard ones that help producing a Quasi-Biennial Oscillation (QBO) in the corresponding model. These correlations nevertheless vary considerably between schemes and depend little on their formulation (globally spectral versus multiwaves for instance). We therefore attribute this agreement to dynamical filtering, which all schemes take good care of, whereas only a few relate gravity waves to their sources. Except for one parameterization, significant correlations are mostly found for eastward propagating waves, which may be due to the fact that during both Strateole 2 phases the QBO phase is easterly at the altitude of the balloon flights. On the other hand, statistical properties, like pdf of momentum fluxes seem better represented in spectral schemes with constant sources than in schemes ("spectral" or "multiwaves") that relate GWs to their convective sources.

How to cite: Rani, R., Lott, F., McLandress, C., Podglagen, A., Bushell, A., Bramberger, M., Lee, H.-K., Alexander, M. J., Anstey, J., Chun, H.-Y., Hertzog, A., Legras, B., Manzini, E., Osprey, S., Plougonven, R., Scinocca, J., Serrano, J., Serva, F., Stockdale, T., and Versick, S. and the Strateole 2 and QBOi contributors: Comparison between non orographic gravity wave drag parameterizations used in QBOi models and Strateole2 constant level balloons                 , EGU General Assembly 2024, Vienna, Austria, 14–19 Apr 2024, EGU24-2472, https://doi.org/10.5194/egusphere-egu24-2472, 2024.

EGU24-3251 | ECS | Posters on site | AS1.31

A constrained spectral approximation of subgrid-scale orography on unstructured grids 

Ray Chew, Stamen Dolaptchiev, Maja-Sophie Wedel, and Ulrich Achatz

The representation of subgrid-scale orography is a challenge in the physical parameterisation of orographic gravity-wave sources in weather forecasting. A significant hurdle is encoding as much physical information with as simple a spectral representation as possible on unstructured geodesic grids with non-quadrilateral grid cells, such as the one used in the German Weather Service's Icosahedral Nonhydrostatic Model. Other issues include scale awareness, i.e., the orographic representation has to change according to the grid cell size. This work introduces a novel spectral analysis method approximating a scale-aware spectrum of subgrid-scale orography on unstructured geodesic grids. The dimension of the physical orographic data is reduced by more than two orders of magnitude in its spectral representation. Simultaneously, the power of the approximated spectrum is close to the physical value. The method is based on well-known least-squares spectral analyses. However, it is robust to the choice of the free parameters, and tuning the algorithm is generally unnecessary. Numerical experiments involving an idealised setup show that this novel spectral analysis performs significantly better than a straightforward least-squares spectral analysis in representing the physical energy of a spectrum. Studies involving real-world topographic data are conducted, and competitive error scores within 10% error relative to the maximum physical quantity of interest were achieved across different grid sizes and background wind speeds. The deterministic behaviour of the method is investigated along with its principal capabilities and potential biases, and it is shown that the error scores can be iteratively improved if an optimisation target is known.

How to cite: Chew, R., Dolaptchiev, S., Wedel, M.-S., and Achatz, U.: A constrained spectral approximation of subgrid-scale orography on unstructured grids, EGU General Assembly 2024, Vienna, Austria, 14–19 Apr 2024, EGU24-3251, https://doi.org/10.5194/egusphere-egu24-3251, 2024.

EGU24-3904 | Posters on site | AS1.31

Generation of secondary gravity waves in idealized UA-ICON simulations 

Christoph Zülicke, Mozhgan Amiramjadi, and Sebastian Borchert

Gravity waves are an important driver of the circulation in the mesosphere / lower thermosphere and connect it to the atmospheric layers below. This vertical coupling is realized in multiple steps – primary waves rise, break and initiate secondary waves, which further rise. We study this process for stationary mountain waves in idealized simulations with the upper-atmosphere extension of the ICON model. The setup is for constant wind and stratification up to 120 km, where a sponge layer begins. In a series of simulations with various winds and mountain sizes, we follow the evolution of mountain waves including their breaking. Particular focus is on the diagnosis of wave-mean flow interaction and the associated generation of secondary gravity waves. In the vertical wavenumber spectra we find three peaks of them, all associated with lower frequency and longer horizontal wavelengths than the primary mountain wave. The parameters of primary and secondary waves are closely correlated, which adds to the understanding of multi-step vertical coupling.

How to cite: Zülicke, C., Amiramjadi, M., and Borchert, S.: Generation of secondary gravity waves in idealized UA-ICON simulations, EGU General Assembly 2024, Vienna, Austria, 14–19 Apr 2024, EGU24-3904, https://doi.org/10.5194/egusphere-egu24-3904, 2024.

The quasi-biennial oscillation (QBO) is the dominant mode of atmospheric variability in the tropical stratosphere. It has effects on the weather and climate in the tropics and the extratropics. The QBO is a wave-driven circulation pattern of alternating easterly and westerly winds that propagate downward with time. Climate models have problems in simulating a realistic QBO because of problems in simulating the QBO wave driving in a realistic way. Both mesoscale gravity waves and global-scale tropical waves contribute to the wave driving of the QBO, but the relative contribution of the different wave types is not well known.
For the period 2018 until mid 2023 we estimate the QBO driving by gravity waves from the residual in the TEM momentum budget for three modern reanalyses (ERA5, MERRA2, and JRA55) and compare absolute values of the QBO gravity wave driving with estimates derived from temperature observations of the SABER satellite instrument. Qualitatively, good agreement is found, but MERRA2 gravity wave driving seems to be too strong in the upper stratosphere. Further, we derive the QBO eastward driving by global-scale Kelvin waves for the reanalyses and from SABER observations. The QBO eastward driving by Kelvin waves is similarly strong as the gravity wave eastward driving, and again good agreement is found between SABER and the reanalyses. In the reanalyses below 30km the total westward driving of the QBO by global-scale waves, however, seems to be weaker than the estimated gravity wave driving.

How to cite: Ern, M.: Driving of the QBO by gravity waves and global-scale waves: a comparison between satellite data and reanalyses, EGU General Assembly 2024, Vienna, Austria, 14–19 Apr 2024, EGU24-3929, https://doi.org/10.5194/egusphere-egu24-3929, 2024.

EGU24-5181 | ECS | Posters on site | AS1.31

Comparison between the gravity wave stress parameterized in a climate model and simulated by the high-resolution non-hydrostatic global model ICON 

Iman Toghraei, François Lott, Laura Köhler, Claudia Stephan, and Joan Alexander

We compare the parameterization schemes that represent gravity waves in the Atmospheric Component of the IPSL Climate Model (LMDZ6A) and the high-resolution ICOsahedral Nonhydrostatic Weather and Climate Model (ICON). Our focus lies in assessing the capabilities of the gravity wave drag schemes to predict zonal momentum fluxes derived from ICON. The parameterization is run offline using ICON meteorological fields coarse grained to a healpix grid with size representative of an ESM grid (around 100km x 100km). We then examine the temporal mean, horizontal mean, and zonal mean gravity wave stresses predicted by the parameterizations and compare them to the zonal momentum fluxes associated with the ICON subgrid scale fields (e.g. the motions that are filtered out during the coarse-graining). The investigation reveals that in the stratosphere, the parameterizations have some skill at predicting zonal momentum fluxes of ICON, and this without prior tuning. More specifically, the parameterized gravity wave stresses due to mountains, convection and fronts align reasonably well with the zonal momentum fluxes from ICON in the stratosphere, each scheme consistently playing a dominant role where it should (frontal waves dominating in the midlatitude storm tracks, convective waves in the tropics, and mountain waves over orography). This permits physical interpretations of the origin of the gravity waves predicted by ICON, but raises challenges when extending this comparison to the troposphere. There, the agreement between the parameterized stress and the ICON subgrid scale stress is much weaker, which is likely attributable to the fact that in the troposphere subgrid scale forced motions like convective cells produce stresses much larger than the gravity wave stresses.

How to cite: Toghraei, I., Lott, F., Köhler, L., Stephan, C., and Alexander, J.: Comparison between the gravity wave stress parameterized in a climate model and simulated by the high-resolution non-hydrostatic global model ICON, EGU General Assembly 2024, Vienna, Austria, 14–19 Apr 2024, EGU24-5181, https://doi.org/10.5194/egusphere-egu24-5181, 2024.

EGU24-7411 | ECS | Posters on site | AS1.31

Impact of small-scale gravity waves on tracer transport 

Irmgard Knop, Stamen Dolaptchiev, and Ulrich Achatz

The zonal-mean transport of tracers on a large scale, such as ozone and water vapor, is predominantly governed by the Brewer-Dobson circulation. However, this transport undergoes modifications influenced by small-scale gravity waves (GW) and turbulence resulting from GW breaking. As these dynamics are not completely resolved in weather and climate models, they necessitate parameterization. Given the significant impact of tracers on the Earth's energy budget and surface climate, understanding their transport variations is crucial for accurate atmospheric modeling. Presently, existing GW parameterization schemes neither account for the direct effects of GW tracer transport nor the enhanced tracer mixing due to GW breaking, but only for the indirect effect by driving the mean meridional circulation. Therefore, it becomes imperative to ascertain how and to what extent these small-scale phenomena modify the large-scale transport of tracers. To address this, we employ wave-resolving simulations, specifically investigating the impact of a three-dimensional wavepacket on tracer distribution using a pseudo-incompressible flow solver. Additionally, we extend a GW parameterization scheme, a Lagrangian ray tracer, to incorporate GW-induced tracer transport. Our research demonstrates the non-negligible direct impact of GW on tracer transport. Furthermore, we possibly discuss the influence of turbulent diffusive mixing on tracers. Our aim is to provide a comprehensive understanding of the intricate processes shaping large-scale tracer transport in the atmosphere.

How to cite: Knop, I., Dolaptchiev, S., and Achatz, U.: Impact of small-scale gravity waves on tracer transport, EGU General Assembly 2024, Vienna, Austria, 14–19 Apr 2024, EGU24-7411, https://doi.org/10.5194/egusphere-egu24-7411, 2024.

EGU24-7578 | ECS | Orals | AS1.31

Internal tide generation from linear theory: Supercritical slopes, directionality, and ocean mixing implications 

Friederike Pollmann, Jonas Nycander, Gaspard Geoffroy, Carsten Eden, and Dirk Olbers

The main forcing of the ocean’s internal gravity wave field is the interaction of the barotropic tide with the rough seafloor. This process is inherently anisotropic: the orientation of the topographic obstacles and the direction of the tidal currents determine the amount and direction of the generated internal wave of tidal frequency, the internal tide. Available global estimates of the internal tide generation, however, do not take this directionality into account. We present estimates of the global M2-tide generation into the first 10 vertical normal modes using a new method based on linear theory that resolves both magnitude and direction. Linear theory breaks down once the slope of the topographic obstacle exceeds that of the generated tidal beam. We discuss the role of such supercritical slopes at continental shelves and in the open ocean. Finally, we will use the anisotropic M2-tide generation as forcing of the internal wave model IDEMIX, the backbone of an energetically consistent parameterization of wave-induced turbulent mixing for ocean general circulation models. Both wave energy levels and turbulent kinetic energy dissipation differ substantially compared to the reference scenario with the previously used isotropic tidal forcing. This underlines the importance of resolving the directionality of the internal tide generation in parameterizations of wave-induced turbulent mixing.

How to cite: Pollmann, F., Nycander, J., Geoffroy, G., Eden, C., and Olbers, D.: Internal tide generation from linear theory: Supercritical slopes, directionality, and ocean mixing implications, EGU General Assembly 2024, Vienna, Austria, 14–19 Apr 2024, EGU24-7578, https://doi.org/10.5194/egusphere-egu24-7578, 2024.

EGU24-8235 | ECS | Orals | AS1.31

Observations of internal wave generation in Madeira island  

Jesus Reis, Juan Gomiz-Pascual, Álvaro Peliz, Rui Caldeira, and Miguel Bruno

There is a considerable number of coastal regions where the interaction of barotropic tidal currents with the stratified water column over seamounts or sill topographies generates large amplitude internal waves. An example of this is the internal bores generated around the main sill of the Strait of Gibraltar. It is known that the vertical mixing induced by these phenomena induces a relevant biological response in both the generation place and remote areas. The present work analyses the generation of this kind of internal waves in the northern half of the submarine ridge between Madeira and the Desertas Islands (Portugal). Here, the interaction of a rather intense barotropic tidal current with the stratified water column and the abrupt ridge topography leads to the creation of hydraulic jumps that evolve into internal bores and solitons, which radiate outwards from the sill. These bores can be formed at both sides of the sill (eastern and western sides) in synchrony with the barotropic flow direction. The hydraulic jump that gives rise to the internal waves is generated after supercritical conditions are established over the sill (internal Froude number, Fr >1). While supercritical conditions prevail, the internal bore stands trapped on the downstream side of the sill. With the weakening of the barotropic current, the supercritical conditions are lost (Fr <1), and the internal bore and subsequent solitons are released from the sill. Internal bores formed on the western side of the sill have greater amplitudes than those formed on the eastern side, and it seems to be related to the different orientations of the barotropic current concerning the longitudinal axis of the sill depending on the flow being eastward or westward. A smaller hydraulic jump is also formed during the eastward phase of the barotropic tidal current. This study is the first to document the internal wave activity in the SE of Madeira Island. It combines data from satellite images, in-situ campaigns, and moored instruments to allow the observation of the hydraulic conditions before, during, and after the generation events. Estimates of the vertical mixing using Richardson number and energy fluxes calculations helped identify internal wave events.

How to cite: Reis, J., Gomiz-Pascual, J., Peliz, Á., Caldeira, R., and Bruno, M.: Observations of internal wave generation in Madeira island , EGU General Assembly 2024, Vienna, Austria, 14–19 Apr 2024, EGU24-8235, https://doi.org/10.5194/egusphere-egu24-8235, 2024.

EGU24-8354 | ECS | Posters on site | AS1.31

Parameterized orographic gravity wave drag controls extratropical stratospheric dynamics in CMIP6 models. 

Petr Šácha and Dominika Hájková

Orographic gravity waves (OGWs) are an important mechanism for coupling of the free atmosphere with the surface, mediating the momentum and energy transport and influencing the dynamics and circulation especially in the stratosphere and above. Current global climate models are not able to resolve a large part of the OGW spectrum and hence, OGW effects have to be parameterized in the models. Typically, the only parameterized effect is the OGW induced drag. Despite producing the same quantity as an output and relying on similar assumptions (e.g. instantaneous vertical propagation), the individual OGW parameterization schemes differ in many aspects such as handling of the orography, the inclusion of non-linear effects near the surface and the tuning of the emergent free parameters.

This presentation introduces a recently published study by the authors, reviewing 7 different parameterizations used in 9 different CMIP6 models and reporting on pronounced intermodel differences in the vertical distribution and magnitude of the parameterized OGW drag that are partly tuning-dependent. Finally, we demonstrate how the OGW drag differences project to the intermodel differences in the stratospheric dynamics, documenting the crucial importance of the lower- stratospheric OGW drag that controls the resolved wave propagation from the troposphere to the stratosphere in both winter hemispheres.

How to cite: Šácha, P. and Hájková, D.: Parameterized orographic gravity wave drag controls extratropical stratospheric dynamics in CMIP6 models., EGU General Assembly 2024, Vienna, Austria, 14–19 Apr 2024, EGU24-8354, https://doi.org/10.5194/egusphere-egu24-8354, 2024.

EGU24-9667 | ECS | Posters on site | AS1.31

Validation of an orographic source in a Lagrangian gravity wave parameterization 

Felix Jochum, Ulrich Achatz, Ray Chew, and François Lott
Many operational gravity wave parameterizations rely on the single column and steady state approximations, thus neglecting horizontal propagation and transience. Recent studies indicate that these assumptions can lead to faulty predictions, motivating the development of more complex models. MS-GWaM, a Lagrangian gravity wave parameterization that has been in development for about a decade, is one such model that is based on a multi-scale WKB theory allowing for both transience and horizontal propagation. So far, it has been validated mainly for non-orographic gravity waves, however, a simple orographic source has already been implemented in a test version of the model, which is coupled to a pseudo-incompressible flow solver (PincFlow). The present study investigates that source in an idealized setting. For this purpose, the model is adjusted to PincFlow's recently implemented terrain-following coordinate system. In addition, the orographic source is supplemented with a blocked flow drag and a wave amplitude reduction that accounts for blocked layer formation. These are derived from background flow tendencies and gravity wave momentum fluxes in highly idealized, wave-resolving simulations. The model is then tested against the latter, using both the transient configuration and a newly implemented steady state mode. The comparison shows that allowing for transience results in a more accurate forcing of the resolved mean flow, especially when the orographic source is changing in time.

How to cite: Jochum, F., Achatz, U., Chew, R., and Lott, F.: Validation of an orographic source in a Lagrangian gravity wave parameterization, EGU General Assembly 2024, Vienna, Austria, 14–19 Apr 2024, EGU24-9667, https://doi.org/10.5194/egusphere-egu24-9667, 2024.

EGU24-9725 | Posters on site | AS1.31 | Highlight

High-resolution nested UA-ICON simulation compared to mesospheric observations of the NASA VortEx campaign at ALOMAR 

Markus Kunze, Tarique Siddiqui, Christoph Zülicke, Claudia Stolle, Claudia Stephan, Irina Strelnikova, Gerd Baumgarten, Robin Wing, Michael Gerding, and Sebastian Borchert

We carry out high-resolution nested simulations over Andøya (ALOMAR) with UA-ICON to compare and interpret observational data in the mesosphere collected during the NASA VortEx sounding rocket campaign in March 2023.

We apply UA-ICON with 250 levels and a model top at 150 km at a global horizontal resolution of R2B7 (~20 km) with subsequent one-way nesting with nests at R2B8 (~10 km), R2B9 (~5 km), R2B10 (~2.5 km) and R2B11 (~1.25 km) horizontal resolution. For the global domain, the dynamic situation during the campaign is specified (specified dynamics, SD) by nudging to ECMWF operational analyses up to an altitude of 50 km. At the 1.25 km resolution, UA-ICON resolves a substantial fraction of the GW spectrum. Therefore, GW parameterizations are turned off at this resolution to isolate the effects of resolved GWs.

The Rayleigh-Mie-Raman (RMR) lidars, operated by IAP in Kühlungsborn, Germany, and at ALOMAR on Andøya, Norway, support the VortEx campaign through observations of temperatures and winds up to about 80 km by providing detailed information about GW activity including vertical wavelengths.

We present first comparison results between the high-resolution nested UA-ICON simulation and the RMR observations for the VortEx campaign in March 2023.

The emphasis is on estimating the vertical energy spectra of resolved gravity waves for the different grid refinements, compared to vertical energy spectra from the lidar observations.

How to cite: Kunze, M., Siddiqui, T., Zülicke, C., Stolle, C., Stephan, C., Strelnikova, I., Baumgarten, G., Wing, R., Gerding, M., and Borchert, S.: High-resolution nested UA-ICON simulation compared to mesospheric observations of the NASA VortEx campaign at ALOMAR, EGU General Assembly 2024, Vienna, Austria, 14–19 Apr 2024, EGU24-9725, https://doi.org/10.5194/egusphere-egu24-9725, 2024.

EGU24-10077 | Posters on site | AS1.31

Parameterized internal wave mixing in three ocean general circulation models 

Nils Brüggemann, Martin Losch, Patrick Scholz, Friederike Pollmann, Sergey Danilov, Oliver Gutjahr, Johann Jungclaus, Nikolay Koldunov, Peter Korn, Dirk Olbers, and Carsten Eden

We evaluate the parameterization IDEMIX for vertical mixing by breaking internal gravity waves in three different non-eddy resolving ocean models, namely ICON-O, FESOM and MITgcm. 
To assess the impact of the new closure, we prescribe three different products for wave forcing by tidal flow over topography that encompass the current uncertainty of this process. 
We compare these sensitivity simulations with a reference simulation without IDEMIX of each model and analyze the model-independent effects on the ocean circulation and mixing.
In particular, we observe a stronger mixing work once IDEMIX is used which better agrees with observations.
Coherent model responses to the stronger mixing work from IDEMIX are a deepening of thermocline depth, a warming of the upper-ocean thermocline water masses and an increased strength of the upper Atlantic overturning cell.

How to cite: Brüggemann, N., Losch, M., Scholz, P., Pollmann, F., Danilov, S., Gutjahr, O., Jungclaus, J., Koldunov, N., Korn, P., Olbers, D., and Eden, C.: Parameterized internal wave mixing in three ocean general circulation models, EGU General Assembly 2024, Vienna, Austria, 14–19 Apr 2024, EGU24-10077, https://doi.org/10.5194/egusphere-egu24-10077, 2024.

EGU24-11094 | ECS | Posters on site | AS1.31

Interaction of cirrus clouds and gravity waves: towards a coupled representation in coarse resolution model 

Alena Kosareva, Stamen Dolaptchiev, Ulrich Achatz, and Peter Spichtinger

Cirrus clouds have a notable influence on radiation and, consequently, the energy balance. Therefore detailed understanding of ice physics processes is one of the keys to improving climate representation. Major drivers of the physical processes in ice clouds such as nucleation, freezing, sedimentation etc. are mostly triggered by local dynamical causes. The variability in vertical velocity, along with temperature and pressure fluctuations induced by gravity waves (GW), significantly impacts the formation and life cycle of cirrus clouds. However, conventional climate models and Numerical Weather Prediction (NWP) systems typically limit ice formation mechanisms to turbulent forcing.

This study is focused on the interaction between ice clouds and gravity waves, aiming to enhance the representation of these processes within coarse-grid model. Building upon a double-moment scheme for ice particles, a prototype parameterisation for the nucleation process induced by gravity waves was previously proposed in [1] and has been implemented in the ICON model for numerical verification and assessment. The current approach is targeting a comprehensive coupled description of ice physics and gravity wave interaction.

Information on subgrid-scale dynamical fields impacting cirrus formation is retrieved from Multi-Scale Gravity Wave Model (MS-GWaM) [2-5]. This gravity-wave parameterisation relies on WKB-theory and employs a raytracing-based technique. It allows for the consideration of transient wave dynamics and horizontal wave propagation. The chosen approach for joined description seeks to refine the physical representation of cirrus formation associated with both convectively generated gravity waves and gravity waves generated by sources other than orography and convection.

Preliminary results, incorporating an artificial periodic forcing term, demonstrate a good agreement of ice physics parameterisation with results from an explicitly integrated double-moment scheme, where processes such as nucleation are resolved in time. Ongoing efforts involve further coupling with the MS-GWaM parameterisation, with the goal of achieving a more physically accurate representation of ice formation zones. Additionally, an analysis of time-averaged characteristic quantities is planned for a comprehensive understanding of the system.

References

[1] S. I. Dolaptchiev, P. Spichtinger, M. Baumgartner, and U. Achatz. Interactions between gravity waves and cirrus clouds: Asymptotic modeling of wave-induced ice nucleation. Journal of the Atmospheric Sciences, 80(12):2861 – 2879, 2023.

[2] G. Bölöni, Y.-H. Kim, S. Borchert, and U. Achatz. Toward transient subgrid-scale gravity wave representation in atmospheric models. Part I: Propagation model including nondissipative wave–mean-flow interactions. Journal of the Atmospheric Sciences, 78(4):1317–1338, 2021.

[3] Y.-H. Kim, G. Bölöni, S. Borchert, H.-Y. Chun, and U. Achatz. Toward transient subgrid-scale gravity wave representation in atmospheric models. Part II: Wave intermittency simulated with convective sources. Journal of the Atmospheric Sciences, 78(4):1339–1357, 2021.

[4] U. Achatz, Y.-H. Kim, and G. S. Voelker. Multi-scale dynamics of the interaction between waves and mean flows: From nonlinear WKB theory to gravity-wave parameterizations in weather and climate models. Journal of Mathematical Physics, 64(11), 2023.

[5] Y.-H. Kim, G. S. Voelker, G. Bölöni, G. Zängl, and Ulrich Achatz. Crucial role of obliquely propagating gravity waves in the quasi-biennial oscillation dynamics. EGUsphere, 2023:1–18, 2023.

How to cite: Kosareva, A., Dolaptchiev, S., Achatz, U., and Spichtinger, P.: Interaction of cirrus clouds and gravity waves: towards a coupled representation in coarse resolution model, EGU General Assembly 2024, Vienna, Austria, 14–19 Apr 2024, EGU24-11094, https://doi.org/10.5194/egusphere-egu24-11094, 2024.

EGU24-12622 | ECS | Orals | AS1.31

The Role of Inertia-Gravity Waves in the Mesoscale Energy Transfers from Global Storm-Resolving Simulations 

Yanmichel A. Morfa Avalos and Claudia C. Stephan

This study investigates the spectral energy budget of the atmosphere using storm-resolving simulations from two state-of-the-art global circulation models. We examine different hypotheses to explain the mesoscale κ-5/3 spectrum of horizontal kinetic energy (HKE). These hypotheses include the direct forcing due to inertia-gravity waves (IGWs), a downscale cascade mediated by weakly interacting IGWs, or interactions between waves and the mean flow. The resolved mesoscale energy fluxes within the upper troposphere and the lower stratosphere reveal different dynamics between the two layers. The lower stratosphere is mainly energized by direct forcing due to vertically propagating IGWs, with a negligible HKE cascade. The primary contribution to the mesoscale energy spectrum in the troposphere is from spectral transfers across scales, while the direct forcing due to IGWs is limited. However, the normal mode decomposition of the circulation into linear Rossby waves and IGWs suggests that their interactions dominate the downscale cascade at mesoscales. This result aligns with the hypotheses that explain the downscale cascade based on resonant triad interactions between vortical and gravity-wave modes. Furthermore, it is shown that wave-wave interactions do not contribute to the resolved energy transfers, challenging the hypothesis that the downscale cascade is due to weakly nonlinearly interacting IGWs.

How to cite: Morfa Avalos, Y. A. and Stephan, C. C.: The Role of Inertia-Gravity Waves in the Mesoscale Energy Transfers from Global Storm-Resolving Simulations, EGU General Assembly 2024, Vienna, Austria, 14–19 Apr 2024, EGU24-12622, https://doi.org/10.5194/egusphere-egu24-12622, 2024.

Internal waves propagate on the ocean stratification and carry energy and momentum through the ocean interior. The two most significant sources of these waves in the ocean are surface winds and oscillatory tidal flow across topography. We propose a hybrid of these two mechanisms, in which wind induced oscillations of sea surface and isopycnal heights are rapidly communicated to the seafloor via hydrostatic pressure. In the presence of topography, the resulting oscillatory bottom velocity may then generate internal waves in a similar manner to the barotropic tide. We investigate this mechanism in an idealised numerical isopycnal model of a storm passing over a mid ocean ridge, and perform several perturbation experiments in which ocean and wind properties are varied. Bottom-generated internal waves are identified propagating away from the ridge in the wake of the storm. Estimates of the total wave energy suggest that in the right circumstances these waves could be a significant source of internal wave energy, with a local wind work to wave energy conversion rate of up to 50% of the corresponding conversion to surface generated near-inertial waves in our domain. Our results suggest a need for further investigation in less idealised scenarios to more precisely quantity this novel mechanism of deep ocean wave generation, and how it may affect abyssal mixing. 

How to cite: Barnes, A.: Topographically-generated near-internal waves as a response to winds over the ocean surface, EGU General Assembly 2024, Vienna, Austria, 14–19 Apr 2024, EGU24-13389, https://doi.org/10.5194/egusphere-egu24-13389, 2024.

In this talk, we pursue the investigation of the relation between the large-scale flows and observed gravity wave momentum fluxes (GWMFs), starting from parameterizations and machine learning as two alternatives for predicting the gravity wave momentum fluxes in the lowermost tropical stratosphere. We investigate how much aggregation methods may allow to further improve on both alternatives, and what complementarity there may be between them. Observed gravity wave momentum fluxes are obtained from superpressure balloons during the Strateole 2 mission. The parameterizations come from the different climate models involved in the QBOi project, that have been compared to balloon measurements in Lott et al. (2023). The other predicted features are three tree-based ensemble machine learning algorithms, trained on part of the Strateole 2 dataset.  Three groups of aggregations are performed: aggregation among machine learning models, aggregation among parametrizations, and the aggregation between parametrizations and machine learning models. For the methodology, three aggregation methods are employed; two methods treat predictions from different models (parametrizations or machine learning) as features or information to be aggregated, while the remaining one uses both, inputs and predictions provided by those models.

The outcomes indicate that, despite struggling to estimate GWMFs individually, the collective information from various parametrizations proves valuable, particularly when combined with the large-scale flow variables. Additionally, the performance of the aggregation methods is sensitive to the choice of balloons. When the description of large-scale flows aligns well with the target GWMFs (balloon 2 and 8), all aggregation methods perform just as well as machine learning or the best-case scenario of parametrizations. Interestingly, there are also a few cases where machine learning and parametrizations perform poorly (correlation less than 0.2), yet their predictions, combined with large-scale information, can significantly elevate their performances more than 2 times (correlation larger than 0.5) in the aggregation methods (balloon 5). This suggests that existing parameterizations and machine learning approaches trained on observations have a complementarity that remains to be exploited. The present study was entirely offline, with no issue about the costs of computation. For practical applications, further investigation will be required to narrow down on the specific elements of parameterizations that are most informative.

How to cite: Has, S.: Aggregations of parametrizations and machine learning for gravity wave momentum flux reconstruction, EGU General Assembly 2024, Vienna, Austria, 14–19 Apr 2024, EGU24-17446, https://doi.org/10.5194/egusphere-egu24-17446, 2024.

EGU24-17716 | ECS | Posters on site | AS1.31

The diurnal cycle of gravity waves in GNSS-RO data 

Emily Lear, Corwin Wright, and Neil Hindley

Gravity wave sources such as convection are known to have a diurnal cycle, so it is expected that gravity waves should also follow a diurnal cycle. However, although this cycle can be simulated in models and observed in ground based data at fixed locations, it is difficult to observe in global satellite observations, due to their low time resolution, particularly since most gravity wave resolving instruments have sun-synchronous orbits and therefore always observe the same local solar time. In this study, GNSS radio occultation (GNSS-RO) data are used to investigate whether a diurnal cycle in gravity wave amplitudes can be seen in the stratosphere using these observations. Radio occultation uses GNSS signals received by a satellite that measures the bending angles and phase delay, due to these signals passing through the atmosphere. These measurements are randomly distributed in local solar time and have the high vertical resolution required to accurately resolve gravity waves. Specifically, in this work, GNSS-RO dry temperature data are used from multiple satellite missions, including COSMIC 1 and 2, Metop-A, -B and -C, and CHAMP. Wave amplitudes are found using the 1D S-Transform and the amplitudes are then binned in local solar time and averaged for each month, using all available data from the years 2001-2023. Consistent with theoretical observations, a diurnal cycle in gravity wave activity can be seen in the results and comparisons to convection data sets suggest this is strongly linked to convection. These results are also compared to wind data, which will affect the generation and filtering of the waves.

How to cite: Lear, E., Wright, C., and Hindley, N.: The diurnal cycle of gravity waves in GNSS-RO data, EGU General Assembly 2024, Vienna, Austria, 14–19 Apr 2024, EGU24-17716, https://doi.org/10.5194/egusphere-egu24-17716, 2024.

EGU24-18359 | ECS | Posters on site | AS1.31 | Highlight

MATS satellite mission - observing gravity waves in the MLT region with tomographic limb imaging 

Lukas Krasauskas, Jörg Gumbel, Linda Megner, Ole Martin Christensen, Nickolay Ivchenko, Björn Linder, and Donal Murtagh

MATS (Mesospheric airglow/Aerosol Tomography and Spectroscopy) is as Swedish satellite launched in November 2022. It observes O2 A-band airglow in near-infrared and UV light scattered from noctilucent clouds (NLCs) in limb imaging geometry and provides global 3-D temperature and NLC data products. These data sets can be used to characterise individual gravity waves (GWs) by determining their amplitudes, wavelengths and propagation directions (i.e. determining the 3-D wave vector for each wave). This enables determination of GW momentum fluxes in the MLT region, as well as detailed studies on GW spectra, propagation and interactions with the mean flow. MATS data, in combination with some GW modelling, can also be used to study GW sources and dissipation.

This presentation will provide an overview of the MATS mission and the 3-D data products with the focus on GW observations. We will include examples of data along with some initial GW analysis, instrument sensitivity estimates and data quality evaluation.

How to cite: Krasauskas, L., Gumbel, J., Megner, L., Christensen, O. M., Ivchenko, N., Linder, B., and Murtagh, D.: MATS satellite mission - observing gravity waves in the MLT region with tomographic limb imaging, EGU General Assembly 2024, Vienna, Austria, 14–19 Apr 2024, EGU24-18359, https://doi.org/10.5194/egusphere-egu24-18359, 2024.

EGU24-18795 | ECS | Orals | AS1.31

The effect of transient lateral internal gravity wave propagation on the resolved atmosphere in ICON/MS-GWaM 

Georg Sebastian Voelker, Young-Ha Kim, Gergely Bölöni, Günther Zängl, and Ulrich Achatz

Internal gravity waves are commonly parametrized in both weather and climate models to capture their important impacts on the large-scale resolved flow. To reduce the model complexity and increase the performance, these parametrizations typically neglect both the horizontal wave propagation, assuming a horizontally homogeneous local flow (columnar approximation), and the time dependence of the gravity wave dynamics (steady-state approximation). However, a number of studies have shown that these assumptions do not hold in general and might lead to systematic biases in the simulated atmosphere.

The recently introduced Multi-Scale Gravity Wave Model (MS-GWaM), implemented into the ICOsahedral Non-hydrostatic model (ICON), aims to relax the above-mentioned simplifications. In particular, the model simulates gravity waves with Lagrangian ray tracing methods while being coupled to the mean flow and allowing for a transient, three-dimensional propagation. In the current implementation, the model replaces the non-orographic wave drag parametrization.

We find that the 3-dimensional propagation and refraction of gravity waves and the correspondingly modified momentum/energy transport pathways have a significant impact on the middle atmosphere. For instance, the wave refraction around the Antarctic winter jet leads to the often observed convergence near the jet edges. Moreover, the horizontal propagation introduces wave drag at latitudes around 60°S and altitudes around 40 km – a region where it is typically missing in atmospheric models. The probability density functions of wave momentum fluxes exhibit the commonly observed long tails (i.e., wave intermittency) which cannot be reproduced with steady-state parameterizations. Additionally, the intermittent wave field's horizontal distribution displays significantly altered patterns. As an important consequence, the structure of the Quasi-biennial Oscillation (QBO) is significantly improved.

Recent efforts have focused on enhancing the model's efficiency, transforming it into a modular configuration, improving its general usability, and adapting it to work with the most recent version of ICON. By implementing these modifications, we aim to increase the accessibility of MS-GWaM to the community and thus establish a robust contribution to the ICON ecosystem.

How to cite: Voelker, G. S., Kim, Y.-H., Bölöni, G., Zängl, G., and Achatz, U.: The effect of transient lateral internal gravity wave propagation on the resolved atmosphere in ICON/MS-GWaM, EGU General Assembly 2024, Vienna, Austria, 14–19 Apr 2024, EGU24-18795, https://doi.org/10.5194/egusphere-egu24-18795, 2024.

EGU24-20640 | ECS | Posters on site | AS1.31

The Stratospheric Gravity Wave Field and Momentum Fluxes Produced by Isolated Supercells 

Luke Rosamond, David Nolan, Yi Dai, and Chris Heale

Alongside topographic forcing, deep moist convection makes a significant contribution to the global budget of upward momentum transport by gravity waves. Long-lived thunderstorms with rotating updrafts, known as supercells, produce strong and highly variable vertical motions over several hours. This study uses an idealized modeling framework in WRF to simulate supercells and their associated gravity waves up to 60 km altitude for multiple different wind profiles and convective modes. In contrast to many previous studies, the supercell is brought to an end and the simulations continue until most of the wave energy has dissipated. Thus, upward momentum transport can be computed over the entire life cycle of the storm and its associated waves, providing a more complete picture of the total impact of the event. The shapes of the wind profiles in the upper troposphere and lower stratosphere are found to strongly control the total momentum and energy transported into the upper stratosphere, so varying the stratospheric wind profile illuminates the behavior of the gravity waves in the stratosphere, particularly their vertical propagation. We also investigate the extent to which different modes of supercell structure, such as high-precipitation, low-precipitation, and classic supercells, lead to different intensities and spectra of the resulting gravity waves. In addition, the WRF model diabatic heating and vertical motions will be used as forcing conditions for stratospheric models such as MAGIC and CGCAM for the purposes of 1) comparison to WRF results between 20 and 60 km, and 2) so that wave propagation, momentum transport, wave breaking, and momentum deposition can be evaluated to altitudes above 80 km.

How to cite: Rosamond, L., Nolan, D., Dai, Y., and Heale, C.: The Stratospheric Gravity Wave Field and Momentum Fluxes Produced by Isolated Supercells, EGU General Assembly 2024, Vienna, Austria, 14–19 Apr 2024, EGU24-20640, https://doi.org/10.5194/egusphere-egu24-20640, 2024.

EGU24-20995 | Posters on site | AS1.31

Gravity Wave Lateral Propagation Prominence in the Extratropical Stratosphere 

Aman Gupta, Aditi Sheshadri, and M. Joan Alexander

Internal gravity waves (GWs) exhibit both vertical and horizontal (lateral) propagation in the atmosphere, influenced by the background shear of the flow that supports them. GW model parameterizations, however, represent them in climate models assuming strict vertical propagation. This modeling assumption can have implications for modeled large-scale stratospheric circulation and variability. We use ERA5 reanalysis to produce the climatological distribution of resolved GW momentum fluxes and forcing in the stratosphere, and their composite evolution around prominent modes of extratropical stratospheric variability like sudden stratospheric warmings (SSWs) and springtime final warmings (FWs). The climatology reveals that lateral propagation leads to the formation of a belt of rich GW activity in the upper winter stratosphere, which is otherwise localized over orographic hotspots in the lower stratosphere. The resolved forcing due to lateral GW propagation is found to be roughly the same order of magnitude as resolved forcing due to vertical fluxes, underlining the importance of lateral propagation for future GW parameterizations. Strikingly different GW forcing profiles before vs. after SSWs and FWs, highlighting the strong two-way connection between GWs and the stratospheric mean flow.

How to cite: Gupta, A., Sheshadri, A., and Alexander, M. J.: Gravity Wave Lateral Propagation Prominence in the Extratropical Stratosphere, EGU General Assembly 2024, Vienna, Austria, 14–19 Apr 2024, EGU24-20995, https://doi.org/10.5194/egusphere-egu24-20995, 2024.

EGU24-21740 | Orals | AS1.31

How realistic are resolved gravity waves in ERA5 reanalysis compared to satellite observations? 

Neil Hindley, M. Joan Alexander, Martina Bramberger, Manfred Ern, Lars Hoffmann, Laura Holt, Riwal Plougonven, Inna Polichtchouk, Claudia Stephan, Annelize van Niekerk, and Corwin Wright

Modern numerical modelling simulations of the Earth's atmosphere have developed over the recent decades to ever finer spatial resolutions, allowing for a greater portion the atmospheric gravity wave (GW) spectrum to be resolved. Specialised global simulations with kilometre-scale resolutions have been performed offline that can resolve very large portions of the GW spectrum in the lower stratosphere and, as such, the balance between resolved and parameterised (unresolved) GW forcing in today's numerical simulations of the middle atmosphere is shifting. However, these kilometre-scale simulations are still too computationally costly to perform routinely and can quickly deviate from their initial conditions, which makes validating the resolved gravity waves in these simulations with satellite observations challenging. For this reason, a growing number of studies are using resolved GWs in lower-resolution stratospheric reanalyses as proxies for GWs in the real atmosphere, due to the apparent reliability, long timescale, global coverage and real-date data assimilation of these reanalysis products. However, these resolved GWs in reanalyses have not been widely tested or compared to satellite observations of GWs to assess their realism. One reason why such a comparison has been so challenging is due to the different ranges of GW wavelengths to which any given model or observational instrument is sensitive due to its grid spacing or sampling and resolution limits, an effect known as the observational filter. Therefore, any like-for-like assessment of resolved GWs in reanalysis using satellite observations must be able to sample the model using the exact sampling and resolution of the instrument. Here we use 3-D satellite observations from AIRS/Aqua to evaluate the realism of resolved stratospheric gravity waves in ERA5 reanalysis produced by the European Centre for Medium Range Weather Forecasts (ECMWF). We carefully apply the sampling and resolution limits of AIRS to the model using a full 3-D weighting function for each measurement footprint to create synthetic measurements of the ERA5 stratosphere as if were viewed by AIRS. We then follow identical processing steps to detrend, regrid and spectrally analyse both the real and synthetic measurements to recover localised GW amplitudes, wavelengths and directional momentum fluxes between 25 and 45 km altitude. We investigate the global momentum budget of GWs in reanalysis compared to observations and compare the seasonality and spectral properties of GWs over known stratospheric hot spots. Our preliminary results suggest that AIRS measurements exhibit more frequent large-amplitude wave events at larger horizontal wavelengths (greater than 150km) and larger net momentum fluxes overall than equivalent ERA5 measurements. Our satellite-sampling approach is applicable to any GW-resolving model, and sets out a potential roadmap towards more direct validation and comparison of resolved mesoscale dynamics in numerical models that could help to guide developments in the coming era of high-spatial resolution atmospheric modelling.

How to cite: Hindley, N., Alexander, M. J., Bramberger, M., Ern, M., Hoffmann, L., Holt, L., Plougonven, R., Polichtchouk, I., Stephan, C., van Niekerk, A., and Wright, C.: How realistic are resolved gravity waves in ERA5 reanalysis compared to satellite observations?, EGU General Assembly 2024, Vienna, Austria, 14–19 Apr 2024, EGU24-21740, https://doi.org/10.5194/egusphere-egu24-21740, 2024.

EGU24-279 | ECS | Orals | AS1.32

Role of Arctic Warming on Extreme Cold Weather Conditions in North India 

Athira k s and Raju Attada

Cold waves are characterized by a sharp drop in air temperatures that lasts for a few days, impacting various sectors of society, including human health, agriculture, and transportation. In India, the northern parts of the country witness the majority of cold wave events during boreal winter seasons starting from November to February. In this study, we identify the extreme cold wave events over north India during the period 1951-2020 and investigate their occurrence with rapid Arctic warming through the Quasi Resonant Amplification (QRA) fingerprint. Our findings reveal that a warm Arctic, double zonal jet formation, and amplification of (baroclinic) wave numbers 6 to 7 were observed during extreme cold waves of north India. The upper tropospheric double jet acts as waveguides, trapping the 6-7 wavenumbers, leading to the amplification of Rossby waves, resulting in the persistence of extreme cold wave conditions. Moreover, the sea ice retreat over the Barents-Kara Sea observed during the extreme cold wave events induced by the Arctic warming weakens the equator-to-pole temperature gradient. This leads to the meandering of the jetstream, and promotes the formation of atmospheric blocks. Consequently, an Omega block emerges over the Ural region leading to the advection of cold air from higher latitudes to the northern parts of the country. Hence our study concludes that the Arctic warming which is confirmed through the QRA fingerprint results in highly persistent and anomalous winter weather conditions in north India.


Key words: Extreme cold wave, Quasi Resonant Amplification, Atmospheric blocking, Arctic warming


How to cite: k s, A. and Attada, R.: Role of Arctic Warming on Extreme Cold Weather Conditions in North India, EGU General Assembly 2024, Vienna, Austria, 14–19 Apr 2024, EGU24-279, https://doi.org/10.5194/egusphere-egu24-279, 2024.

EGU24-1967 | Posters on site | AS1.32

Resolving weather fronts increases the large-scale circulation response to Gulf Stream SST anomalies in variable-resolution CESM2 simulations 

Robert Jnglin Wills, Adam Herrington, Isla Simpson, and David Battisti

Canonical understanding based on general circulation models (GCMs) is that the atmospheric circulation response to midlatitude sea-surface temperature (SST) anomalies is weak compared to the larger influence of tropical SST anomalies. However, the horizontal resolution of modern GCMs, ranging from roughly 300 km to 25 km, is too coarse to fully resolve mesoscale atmospheric processes such as weather fronts. Here, we investigate the large-scale atmospheric circulation response to idealized Gulf Stream SST anomalies in Community Atmosphere Model (CAM6) simulations with 14-km regional grid refinement over the North Atlantic, and compare it to the response in simulations with 28-km regional refinement and uniform 111-km resolution. The highest resolution simulations show a large positive response of the wintertime North Atlantic Oscillation (NAO) to positive SST anomalies in the Gulf Stream, a 0.8-standard-deviation anomaly in the seasonal-mean NAO for 2°C SST anomalies. The lower-resolution simulations show a weaker response with a different spatial structure. The enhanced large-scale circulation response results from an increase in resolved vertical motions with resolution and an associated increase in the influence of SST anomalies on transient-eddy heat and momentum fluxes in the free troposphere. In response to positive SST anomalies, these processes lead to a stronger North Atlantic jet that varies less in latitude, as is characteristic of positive NAO anomalies. Our results suggest that the atmosphere responds differently to midlatitude SST anomalies in higher-resolution models and that regional refinement in key regions offers a potential pathway to improve multi-year regional climate predictions based on midlatitude SSTs.

How to cite: Jnglin Wills, R., Herrington, A., Simpson, I., and Battisti, D.: Resolving weather fronts increases the large-scale circulation response to Gulf Stream SST anomalies in variable-resolution CESM2 simulations, EGU General Assembly 2024, Vienna, Austria, 14–19 Apr 2024, EGU24-1967, https://doi.org/10.5194/egusphere-egu24-1967, 2024.

In recent decades, a more prominent negative phase of summer NAO has been observed (Hanna et al. 2015). While evident in observations, this signal does not emerge in model projections of future climate. Therefore, the attribution of the observed trend to internal variability or to anthropogenic forcing is a topic of growing debate. Improved understanding of the recent NAO shift is urgent, given its several impacts on the climate system, such as temperature extremes at high latitudes and a pronounced acceleration of Greenland ice melting.
 
In this work, we try to achieve a better understanding of the concurrent causes of the observed trend by analyzing Greenland atmospheric blocking, a synoptic phenomenon that strongly anticorrelates with NAO. We choose to focus our analysis on blocking events resulting from the cyclonic breaking of Rossby waves in the Northern Atlantic. For these purposes, we develop an original Lagrangian tracking algorithm for atmospheric blocking detection based on the geopotential height gradient reversal (Davini et al. 2012), which allows us to compute the blocking events number, area, persistence and average displacement.
 
Results confirm how the occurence of Greenland atmospheric blocking is increasing. The frequency trend is attributed to an increased number of blocking events in summer, rather than an increased persistence, suggesting a change in the triggering mechanism. In addition, a diminuished number of blocking events in spring emerges, together with a decreased spring blocking persistence. Moreover, we apply a zonal-blocked flow decomposition to investigate to what extent the emergent mean summer geopotential height anomaly can be attributed to blocking or to mean state differences. The decomposition highlights how the anomaly is strong even in the days not interested by atmospheric blocking and how the increased frequency is rather acting as a positive feedback mechanism of the negative NAO phase.

How to cite: Filippucci, M. and Bordoni, S.: Recent Greenland warming in early summer and its link to atmospheric blocking trends in the Northern Atlantic sector, EGU General Assembly 2024, Vienna, Austria, 14–19 Apr 2024, EGU24-2474, https://doi.org/10.5194/egusphere-egu24-2474, 2024.

EGU24-2521 | ECS | Posters on site | AS1.32

Straight-moving tropical cyclones over the western North Pacific trigger the wave trains over the North Pacific during winter 

Shuaiqiong Ma, Bo Pang, Riyu Lu, and Xingyan Zhou

This study investigates the large-scale circulation anomalies induced by straight-moving tropical cyclones (TCs) over the western North Pacific (WNP) during winter. Corresponding to the straight-moving TCs, a quasi-stationary wave train is excited as alternative geopotential height anomalies in the upper troposphere stretching from East Asia to the North Pacific. Specifically, the anomalous anticyclones are initially formed over East Asia to the north of TCs and then lead to the subsequent anomalies in the downstream areas. Further analysis reveals that the upper-level anticyclonic anomalies are excited by negative Rossby wave sources, which are mainly attributed to the poleward vorticity advection by anomalous divergence relevant to TCs. In addition, the diagnosis indicates that the generation of wave source is caused by the product of the TC-induced divergent flows and the prominent meridional vorticity gradient in association with East Asian upper-tropospheric westerly jet. The above processes differ from the recurving TCs in summer and autumn, which undergo extratropical transition when they move northward into the mid latitude. These findings imply that the tropical disturbances over the WNP, such as straight-moving TCs, can remotely affect weather over the extratropics, and thus have implications for improving the weather forecast over the extratropics through improving tropical disturbance forecast. 

How to cite: Ma, S., Pang, B., Lu, R., and Zhou, X.: Straight-moving tropical cyclones over the western North Pacific trigger the wave trains over the North Pacific during winter, EGU General Assembly 2024, Vienna, Austria, 14–19 Apr 2024, EGU24-2521, https://doi.org/10.5194/egusphere-egu24-2521, 2024.

EGU24-3243 | Orals | AS1.32

Moving beyond the mean to understand circulation extremes under climate change 

Tiffany Shaw, Osamu Miyawaki, and Hsing-Hung Chou

Much has been learned about the response of the mean circulation under climate change. In particular, the subtropical jet will accelerate, the eddy-driven jet will shift poleward, storminess in the Southern Hemisphere will increase whereas storminess in the Northern Hemisphere will be impacted by a tug of war between different factors. However, very little is known about how circulation extremes will respond to climate change beyond blocking. This is in stark contrast to our understanding of the response of extreme temperatures, which follow the mean via an additive increase, and the response of extreme precipitation, which increase faster than the mean because of a multiplicative increase connected to the non-linear Clausius-Clapeyron relation. Here as a starting point, we investigate changes in upper-level circulation extremes defined using a daily distribution. We show fast upper-level jet stream (zonal) winds get faster under climate change. We also show extreme jet stream meandering or waviness (meridional wind) increases under climate change. These responses are geostrophic, robust across a climate model hierarchy (CMIP/AMIP/AQUA), and not connected to sea ice loss. The increase in upper-level circulation extremes is shown via moist thermal wind to be related to a multiplicative response connected to the non-linear Clausius-Clapeyron relation. Thus, upper-level circulation extremes exhibit a multiplicative increase similar to precipitation extremes. The results can be used to explain projected changes in commercial flight times, record-breaking winds, clear-air turbulence and a potential increase in severe weather occurrence under climate change.

How to cite: Shaw, T., Miyawaki, O., and Chou, H.-H.: Moving beyond the mean to understand circulation extremes under climate change, EGU General Assembly 2024, Vienna, Austria, 14–19 Apr 2024, EGU24-3243, https://doi.org/10.5194/egusphere-egu24-3243, 2024.

EGU24-3439 | ECS | Orals | AS1.32

Complementary approaches to characterize the jet stream dynamics in summer and link them to extreme weather in Europe 

Hugo Banderier, Alexandre Tuel, Tim Woollings, and Olivia Romppainen-Martius

Recent studies have highlighted the link between upper-level jet dynamics, especially the persistence of certain configurations, and extreme summer weather in Europe. The weaker and more variable nature of the jets in summer makes it difficult to apply the tools developed to study them in winter, at least not without modifications. Here, in order to further investigate this link, we present two complementary approaches to characterize the jet dynamics in summer in the North Atlantic sector.

First, we apply a jet axis detection and tracking algorithm to ERA5 reanalysis data to extract individual jets and classify them in the canonical categories of polar and subtropical jets. Then, we compute a wide range of jet indices on each jet to provide easily interpretable scalar time series representing upper-tropospheric dynamics.

Second, we apply the self-organizing map (SOM) clustering algorithm to the same data to create a distance-preserving, discrete, 2D phase space. The dynamics can then be described by the time series of visited SOM nodes, in which a long stay in a given node relates to a persistent state and a rapid transition between nodes that are far apart relates to a sudden dramatic shift in the configuration of upper-level flow.

We first compare these two approaches to each other to assess their consistency, and then use them to relate the jet dynamics to a known driver of variability, Rossby wave breaking. Finally, we present preliminary results linking persistent jet dynamics to extreme heat events in Europe.

How to cite: Banderier, H., Tuel, A., Woollings, T., and Romppainen-Martius, O.: Complementary approaches to characterize the jet stream dynamics in summer and link them to extreme weather in Europe, EGU General Assembly 2024, Vienna, Austria, 14–19 Apr 2024, EGU24-3439, https://doi.org/10.5194/egusphere-egu24-3439, 2024.

EGU24-3478 | Posters on site | AS1.32

Variations in tropospheric ozone driven by Rossby Wave Breaking events over the Indian subcontinent through Remote Sensing Retrievals 

Biyo Thomas, Ravi Kumar Kunchala, Bhupendra Bahadur Singh, and Niranjan Kumar Kondapalli

Rossby wave breaking (RWB) is a significant pathway for intrusion of stratospheric ozone into the troposphere. These events increase tropospheric ozone, which influences the greenhouse effect, atmospheric chemistry, and local ecosystems. As RWBs frequently affect the Indian subcontinent, a comprehensive study is required to understand the impact of RWB-induced ozone variations in the troposphere over the study region. To identify the RWB events, we used a contour searching algorithm and analyzed them for the period from 2004 to 2021 for Indian domain. Furthermore, we analyzed the anomalous ozone variability during the detected RWB event days using the CAMS global reanalysis (EAC4) and two independent satellite data sets, the Microwave Limb Sounder (MLS) and the Atmospheric Infrared Sounder (AIRS). Additionally, we utilized ground-based observations from the CPCB to examine the influence of RWB on the changes in surface ozone. The results of our study suggest that the CAMS reanalysis agrees well with the two independent satellite products, which provide a comprehensive understanding of ozone variability from various datasets. The upper-level potential vorticity anomaly allows ozone evolution to begin a few days before the strongest breaking time and intensify on the strongest day. Moreover, RWB enables the vertical intrusion of ozone down to 750 hPa, with variations observed from one case to another. Intrusion strength yields diverse tropospheric column increments (e.g., 190.5 ppbv at 100-150 hPa). Surface ozone response (850 hPa) to RWB correlates with intrusion intensity, resulting in 10-19 ppbv ozone anomalies. This could arise from the augmented tropospheric column ozone due to turbulent mixing. These findings deepen our understanding of RWB–related ozone variability and its impact on surface levels.

How to cite: Thomas, B., Kunchala, R. K., Singh, B. B., and Kondapalli, N. K.: Variations in tropospheric ozone driven by Rossby Wave Breaking events over the Indian subcontinent through Remote Sensing Retrievals, EGU General Assembly 2024, Vienna, Austria, 14–19 Apr 2024, EGU24-3478, https://doi.org/10.5194/egusphere-egu24-3478, 2024.

EGU24-3591 | ECS | Orals | AS1.32

Exploring uncertainty of trends in the lower-tropospheric North Pacific Jet 

Tom Keel, Chris Brierley, Thomas Frame, and Tamsin Edwards

The underlying dynamics responsible for the climatological position of jet streams are complex. In a warming world, there is mounting evidence from modelling and observational studies that amplified upper‐level tropical warming will have a poleward impact on the latitude of the tropospheric jet streams, which will continue across this century. However, existing research has also created confusion over these exact movements/trends, and as such they remain without consensus at any scale nor in any region. Here, we argue that this is in part due to the wide variety of statistics that have been used to define ‘jet latitude’ – one such method of quantifying the jet position, from which to calculate climatological shifts.

In this talk, trends associated with the latitude of the lower tropospheric jet streams are examined over the North Pacific using seven unique jet latitude statistics, four modern climate reanalysis products and CMIP6 historical simulations and future projections. Using these, we assess the relative importance of various associated uncertainties arising from choice of data, scenario, or statistic. The results show that the winter North Pacific Jet is moving polewards within both the reanalysis and climate models. The climatological trend of the North Pacific jet is found to vary by season in the reanalysis, and is most robust to choice of statistic and reanalysis dataset in winter. Finally, a poleward end-of-century shift of the jet position is shown that is robust to choice of statistic and model for autumn.

How to cite: Keel, T., Brierley, C., Frame, T., and Edwards, T.: Exploring uncertainty of trends in the lower-tropospheric North Pacific Jet, EGU General Assembly 2024, Vienna, Austria, 14–19 Apr 2024, EGU24-3591, https://doi.org/10.5194/egusphere-egu24-3591, 2024.

EGU24-3781 | ECS | Posters on site | AS1.32

Investigating Stratospheric Wave Reflection Events and their Implications for Northern Hemisphere Circulation 

Michael Schutte and Gabriele Messori

Stratospheric wave reflection events involve the upward propagation of planetary waves, which are subsequently reflected downward by the stratospheric polar vortex. This unique phenomenon establishes a crucial connection of large-scale atmospheric dynamics between the troposphere and stratosphere. In this study, wave reflection events are defined via increased poleward eddy heat flux over the Northwest Pacific and increased equatorward eddy heat flux over Canada. While previous research has pointed out a link between these events and an abrupt temperature decrease across North America, the dynamical mechanisms remain less clear. In order to advance the comprehension of the large-scale atmospheric dynamics during stratospheric wave reflection events, meridional eddy heat flux, Rossby wave activity and geopotential height are studied. Around the end of stratospheric wave reflection events an oscillation in meridional eddy heat flux towards opposite values is present over the Northwest Pacific and Canada in the upper troposphere and stratosphere. A westward-propagating ridge, associated with a positive anomaly of geopotential height, and development of a trough downstream can explain this oscillation. East of the ridge, colder air than usual is advected southwards in the lower troposphere over North America. This results in different anomalies of meridional eddy heat flux closer to the surface compared to the upper troposphere. The large-scale circulation anomalies align vertically from the lower troposphere up to the stratosphere and mirror the shift from a Pacific Trough to an Alaskan Ridge. Furthermore, stratospheric wave reflection events exert a far-reaching influence on atmospheric circulation across the mid-latitude and polar Northern Hemisphere. One example is the occurrence of windy extremes over Europe together with changes in mid-latitude jet stream position and strength over the Atlantic at the same time as the temperature decreases to below average values over North America.

How to cite: Schutte, M. and Messori, G.: Investigating Stratospheric Wave Reflection Events and their Implications for Northern Hemisphere Circulation, EGU General Assembly 2024, Vienna, Austria, 14–19 Apr 2024, EGU24-3781, https://doi.org/10.5194/egusphere-egu24-3781, 2024.

EGU24-4019 | ECS | Orals | AS1.32

Midlatitude heatwave variability modulated by a shifting storm track 

Wolfgang Wicker, Emmanuele Russo, and Daniela Domeisen

Both the circulation response to climate change as well as internal atmospheric variability are marked by a meridional displacement of the extratropical storm track. It remains to be quantified how such changes in the storm track modulate the occurrence of heatwaves. We combine a composite analysis of reanalysis data with idealized model experiments to investigate the response in heatwave frequency to variations in the storm track latitude in two different datasets. In the idealized model, a forced poleward storm track shift leads to an increase in upper-tropospheric Rossby wave phase speed, and vice versa, which in turn reduces and increases heatwave frequency and duration across the mid-latitudes. A similar relationship between storm track latitude, Rossby wave phase speed, and heatwave duration is found for internal variability in reanalysis data. However, in reanalysis, a reduction in phase speed does not necessarily lead to an increased heatwave frequency due to geographically phase-locked wave trains induced by zonal asymmetries. These results shed new light on the dynamical drivers for heat extremes.

How to cite: Wicker, W., Russo, E., and Domeisen, D.: Midlatitude heatwave variability modulated by a shifting storm track, EGU General Assembly 2024, Vienna, Austria, 14–19 Apr 2024, EGU24-4019, https://doi.org/10.5194/egusphere-egu24-4019, 2024.

EGU24-5206 | ECS | Posters on site | AS1.32

Disentangling wave-like atmospheric trends in the northern hemisphere midlatitudes 

Chiem van Straaten, Tamara Happé, Fabio D'Andrea, and Dim Coumou

Summertime trend analysis reveals that regions in the NH midlatitudes experience a marked set of changes in surface temperature, sea level pressure, and upper-atmosphere streamfunction. Among these changes are deeper Atlantic lows, extreme Western European temperatures, and stronger highs over Western Russia. As these regional signatures tend to lie outside the range of CMIP6 model simulations they might constitute a joined dynamic response that is missed by the models. Here, we examine to what degree the regional signatures cohere as one increasingly prevalent circumglobal wave, or to what degree they reflect distinct regional processes. For this we use both ERA-5 reanalysis data and a selection of CMIP6 climate model simulations. In the process, we try to better understand the mismatch between observations and climate models.

How to cite: van Straaten, C., Happé, T., D'Andrea, F., and Coumou, D.: Disentangling wave-like atmospheric trends in the northern hemisphere midlatitudes, EGU General Assembly 2024, Vienna, Austria, 14–19 Apr 2024, EGU24-5206, https://doi.org/10.5194/egusphere-egu24-5206, 2024.

EGU24-8358 | ECS | Orals | AS1.32

The relationship between atmospheric blocking and Arctic-midlatitude thermal gradient 

Marco Cadau, Gabriele Messori, Marco Gaetani, Giorgia Fosser, Simona Bordoni, Roberto Buizza, and Gianmaria Sannino

Atmospheric blocking is known to be one of the most important drivers of large-scale atmospheric variability at mid-high latitudes. Blocking events consist of a disruption and/or deceleration of the mean westerly circumpolar flow, and are generally associated with large-scale high-pressure patterns, which may be connected with the occurrence of climate extremes, such as heat waves and cold spells. Atmospheric dynamics in the Arctic region may be very important in shaping the spatial and temporal patterns of blocking at mid-high latitudes in the Northern Hemisphere, and consequently the occurrence of associated climate extremes. In particular, the difference between Arctic and mid-latitude temperatures is tightly associated with the Ural blocking (UB) activity. A causation relationship has been identified, with the UB triggering Arctic warming and Eurasian cold spells, and in turn leading to a weaker Arctic-midlatitudes thermal gradient (AMG). 
The objective of this study is to investigate the physical mechanisms underlying the AMG-UB relationship. In particular, the circulation patterns associated with the nonlinear part of the UB-Arctic interannual relationship are analysed in winter (December-to-February) from 1940 to 2023. To this aim, atmospheric variables are extracted from the ERA5 reanalysis datasets.

Results show that when high UB activity and strong AMG are observed, atmospheric blocking develops also over multiple areas relevant for milder and more humid air transport from mid latitudes into the Arctic region. Conversely, when low UB activity and weak AMG – hence associated with Arctic warmer than average – are observed, UB moves northwards, over Barents-Kara seas, and remote areas in the mid-latitudes and the subtropics, such as northwestern Africa and northwestern Atlantic Ocean, are teleconnected with the Arctic region.

By highlighting the complex nature of the atmospheric blocking modulation of the AMG, these findings are relevant to the comprehension of the leading factors of Arctic Amplification, and to the understanding of the role of atmospheric blocking in determining winter cold spells and extreme temperature events over mid-latitude regions.

How to cite: Cadau, M., Messori, G., Gaetani, M., Fosser, G., Bordoni, S., Buizza, R., and Sannino, G.: The relationship between atmospheric blocking and Arctic-midlatitude thermal gradient, EGU General Assembly 2024, Vienna, Austria, 14–19 Apr 2024, EGU24-8358, https://doi.org/10.5194/egusphere-egu24-8358, 2024.

EGU24-9806 | Posters on site | AS1.32

CMIP6 models overestimate the North Atlantic eddy-driven jet persistence  

Albert Ossó and Florian Ennemoser

Persistent fluctuations in the latitudinal position of the North Atlantic jet stream are associated with extreme weather anomalies, particularly over Europe. Therefore, it is crucial to understand how the jet stream persistence might change in response to increased greenhouse gases to deliver useful regional climate projections. This study examines the persistence of the North Atlantic jet stream latitudinal fluctuations in CMIP6 and ERA5. We found that CMIP6 models consistently overestimate the persistence compared to ERA5 during the historical period. This discrepancy appears linked to too weak transient eddies over the NATL in CMIP6 models.

By the end of the XXI century, CMIP6 models forced with the SSP585 scenario project a reduction of the jet fluctuations persistence of about 10% during the summer season. The evidence suggests this reduction is linked to a slower NATL jet during the summer months.        

How to cite: Ossó, A. and Ennemoser, F.: CMIP6 models overestimate the North Atlantic eddy-driven jet persistence , EGU General Assembly 2024, Vienna, Austria, 14–19 Apr 2024, EGU24-9806, https://doi.org/10.5194/egusphere-egu24-9806, 2024.

The subtropical jet is characterized by a strong vertical shear and is usually located far equatorward of the maximum surface westerlies. In some cases, strong westerlies develop below the subtropical jet, indicating that momentum flux convergence by baroclinic eddies contributes to the jet driving. In this work we examine this variability of the subtropical jet in light of baroclinic instability theory. According to linear baroclinic instability theory, the vertical scale of eddy fluxes decreases toward the equator, making the eddies effectively stable at low latitudes. This stabilizing effect enables the subtropical jet to be maintained by angular momentum advection from the tropics, without the development of baroclinic eddies and surface westerlies below the jet. The dimensionless Charney number is used as an indication for the degree of baroclinic stability at low latitudes. This number incorporates the stabilizing effect at low latitudes, in contrast with the commonly used measure for baroclinicity – the Eady growth rate. It is found that the Charney number performs better than the Eady growth rate in estimating the lowest latitude of baroclinic growth and explaining subtropical jet variability. 

How to cite: Lachmy, O. and Peles, O.: Baroclinic stability at low latitudes: Explaining subtropical jet variability in observations, EGU General Assembly 2024, Vienna, Austria, 14–19 Apr 2024, EGU24-9823, https://doi.org/10.5194/egusphere-egu24-9823, 2024.

Second harmonic generation (SHG) is widely used in nonlinear optics and radio science in various systems.  SHG broadens spectral variability and cascades energy across distinct spatial-temporal scales. Numerical simulations of SHGs of Rossby wave normal modes date back decades. In this study, we report an SHG event of a Rossby wave observed in the  atmosphere. Analyzing meteor-radar wind observations over the European and Asian sectors during the sudden stratosphere warming in winter 2018–2019, we identify two transient waves with periods of 16 and 8 days. Temporal evolution, frequency and wavenumber relations, as well as phase couplings revealed by bicoherence and bispectral analyses, confirm that the 16-day signature is an atmospheric manifestation of a Rossby wave normal mode, and its SHG generates the 8-day signature. Our findings validate the theoretically expected Rossby wave nonlinearity.

The current work was publised and featured by Nature Communications at https://doi.org/10.1038/s41467-022-35142-3

How to cite: He, M. and Forbes, J. M.: Atmospheric Rossby wave second harmonic generation observed in the 2018–2019 sudden stratosphere warming event, EGU General Assembly 2024, Vienna, Austria, 14–19 Apr 2024, EGU24-10011, https://doi.org/10.5194/egusphere-egu24-10011, 2024.

EGU24-10165 | ECS | Orals | AS1.32

Rossby wave packets driving concurrent and non-concurrent heatwaves in the Northern and Southern Hemisphere mid-latitudes 

Maria Pyrina, Wolfgang Wicker, Andries Jan de Vries, Georgios Fragkoulidis, and Daniela I.V. Domeisen

Heatwaves that occur simultaneously over several regions, termed concurrent heatwaves, pose compounding threats to society and the environment. Amplified quasi-stationary circumglobal Rossby wave patterns (CGWPs) and high-amplitude transient non-circumglobal Rossby Wave Packets (RWPs) have been proposed as two possible explanations for the occurrence of heatwaves. The relation of these mechanisms for heatwaves has been investigated over different timescales, but their relevance for concurrent and non-concurrent heatwaves remains unexplored. In the present study we focus on daily time scales and investigate the relevance of the global CGWP amplitude and of the local RWP amplitude for the occurrence of concurrent and non-concurrent heatwaves over the Northern Hemisphere (NH) and Southern Hemisphere (SH) mid-latitudes. To distinguish between concurrent and non-concurrent heatwaves we apply a k-means clustering algorithm on all heatwaves detected in ERA5 reanalysis data within the 1959–2021 period. We identify 42 spatial clusters of heatwaves in the NH and 53 in the SH. In all identified clusters, mid-latitude heatwaves typically occur at the leading edge of RWPs where Rossby wave breaking takes place in the form of ridge building or block formation. No specific zonal wavenumber is more frequently related to the concurrent or to the non-concurrent heatwave category. However, for high global CGWP amplitudes concurrent heatwaves occur more often in the NH when the dominant zonal wavenumber is k = 7, and non-concurrent heatwaves occur more often in the SH for k = 5. The mid-latitude regions exhibiting increased heatwave probabilities under the influence of either global or local high wave amplitude, include western North America, central Europe, Black Sea, Tibet, the southwest coast of Australia, as well as the southern Indian and Atlantic Oceans. Over those regions, the local high amplitude RWPs increase heatwave probabilities by a factor ranging from 4 to 7, whereas the maximum factor for high global CGWP amplitude is 2. These results emphasize the importance of the daily RWP amplitude and the weak association of the global CGWP amplitude to heatwave occurrence over the NH and SH mid-latitudes. This research for the first time investigates the underlying atmospheric dynamical processes that contribute to the development of concurrent and non-concurrent heat extremes, a crucial step towards improving our understanding and ability to predict heatwave variability at weather and longer time scales.

How to cite: Pyrina, M., Wicker, W., de Vries, A. J., Fragkoulidis, G., and Domeisen, D. I. V.: Rossby wave packets driving concurrent and non-concurrent heatwaves in the Northern and Southern Hemisphere mid-latitudes, EGU General Assembly 2024, Vienna, Austria, 14–19 Apr 2024, EGU24-10165, https://doi.org/10.5194/egusphere-egu24-10165, 2024.

The position and intensity of storm tracks undergo significant changes in response to temporal and spatial variations in atmospheric forcing. Comprehending these changes from the viewpoint of individual cyclones and anticyclones is crucial both from a physical perspective, as they are the main drivers of energy and moisture, and because they are a leading cause of severe weather in the midlatitudes. This study delves into the impact of the jet characteristics on individual cyclones and anticyclones, focusing on their maximum strength and growth time. By utilizing tracks of cyclones and anticyclones spanning over 80 years of ERA5 reanalysis data, we identify unique temporal and spatial variations in maximum strength and growth time. These variations are then clarified through a detailed examination of how these properties respond to the characteristics of the jet. 
 
The study reveals that the vertical shear of the jet increases the maximum strength at low and medium regimes and decreases it for intense shear values, potentially playing a significant role in phenomena characterized by extreme shear, such as the midwinter minimum. Breaking down the storm maximum strength into the responses due to growth time and Lagrangian growth rate (effective average growth rate of the individual storms) indicates that while the Lagrangian growth rate is linear with vertical shear, as expected by linear theory, the saturation of maximum strength results from a decrease in growth time with vertical shear. The horizontal shear of the jet, which is less widely studied, was found to reduce the growth time of cyclones and anticyclones significantly. Additionally, horizontal shear has a smaller effect on the Lagrangian growth rate, with cyclones on the poleward side of the jet growing faster and anticyclones on the equatorward side growing faster. These findings provide insights into predicting how changes in jet characteristics in past and future climates influence midlatitude weather through the effect on cyclone and anticyclone activity.

How to cite: Hadas, O. and Kaspi, Y.: The Response of Synoptic-Scale Weather to Jet Stream Characteristics: a Lagrangian perspective., EGU General Assembly 2024, Vienna, Austria, 14–19 Apr 2024, EGU24-10685, https://doi.org/10.5194/egusphere-egu24-10685, 2024.

EGU24-10982 | ECS | Orals | AS1.32

Are we missing future extreme events by ignoring less persistent blocking? 

Prasad Shelke, Stefan Jendersie, and Nicholas Golledge

Extreme weather events are often linked to atmospheric blocking. While a comprehensive theory of blocking is yet to be developed, the onset mechanism of these systems poses a major challenge. As a result, the representation of blocking in climate models is inadequate and consistently underestimated. Although successive improvements in the blocking representation are evident in climate models, they still underestimate the blocking frequency in the Northern Hemisphere (NH).

In this study, we observed an improvement in the representation of blocking in the Community Earth System Model Large Ensemble 2 (LENS2) during winter and a notable deficiency during summer. When compared with observations, the winter blocking bias (-4% to +2%) was found to be substantially reduced, while the summer blocking exhibited a significant bias (-12% to +12%) compared to previous studies. Under the SSP370 scenario, LENS2 suggests an overall decline in winter blocking (11%) and an increase in summer blocking (12%) by the year 2100 in the NH.

The underlying reason for the underestimation of blocking in climate models is often associated with the mean jet state and stationary waves. However, the lack of an onset theory causes challenges in identifying blocking systems. There is also a missing explanation of why temporal persistence is considered specifically as 5 days. Thus, we define less persistent blocking (LPB) as a blocking regime that satisfies the flow reversal criterion and persists for less than 5 days. We found a significant presence of the frequency of LPB (~15% to 25% maximum) in the NH in both models and observations. It means that we were ignoring the presence of these blocking systems, which may have a role in driving extreme events and can potentially emerge as stronger and more persistent blocking systems in the future.

Interestingly, the hotspot of LPB includes drought-prone regions such as the western coast of the United States and well-known blocking centers such as the Euro-Atlantic and Pacific regions. This leads us to propose a new potential avenue for studying the precursors of LPB dissipation, which will provide insights into the longstanding problem of the blocking onset mechanism.

How to cite: Shelke, P., Jendersie, S., and Golledge, N.: Are we missing future extreme events by ignoring less persistent blocking?, EGU General Assembly 2024, Vienna, Austria, 14–19 Apr 2024, EGU24-10982, https://doi.org/10.5194/egusphere-egu24-10982, 2024.

EGU24-11401 | ECS | Posters on site | AS1.32

Inconsistencies of signatures of Eurasian heat waves in the large-scale Rossby waves in CMIP models 

Iana Strigunova, Richard Blender, Frank Lunkeit, and Nedjeljka Žagar

This study identifies discrepancies in signatures of the Eurasian heat waves (EHWs) in the reanalyses and climate models. The scale-dependent analysis considers the global Rossby wave spectrum for the extended boreal summer using daily values of the Rossby wave mechanical energy. We filter Rossby waves using a multivariate, 3D projection of the horizontal velocity and geopotential fields onto a set of orthogonal normal-mode functions. Our previous study has found that Rossby wave energy follows a χ2-distribution with skewness related to the number of degrees of freedom. During EHWs, the skewness of the normalised energy anomaly distributions increases with a corresponding decrease in the number of active degrees of freedom, implying fewer modes involved. Fewer modes indicate a blocking structure that is identified as an increase in the Rossby wave amplitude in the middle troposphere during EHWs.
Here, we compare the spatial structure and energy distributions of the troposphere-barotropic Rossby waves in the subset of CMIP5 models with findings from reanalyses. The increase in planetary Rossby wave amplitudes is first identified for the present-day climate. Significant differences among the models are found regarding the change in the skewness of the Rossby wave energy distribution and hence the number of active degrees of freedom during EHWs. The results highlight inconsistencies in simulating the day-to-day variability of planetary Rossby waves during EHWs in the CMIP models despite the overall agreement in the mean circulation and EHW metrics based on surface data reported in previous studies. The results of this study have potential implications for the interpretation of projected changes in Rossby waves and EHWs in future CMIP climate simulations. 

How to cite: Strigunova, I., Blender, R., Lunkeit, F., and Žagar, N.: Inconsistencies of signatures of Eurasian heat waves in the large-scale Rossby waves in CMIP models, EGU General Assembly 2024, Vienna, Austria, 14–19 Apr 2024, EGU24-11401, https://doi.org/10.5194/egusphere-egu24-11401, 2024.

EGU24-11628 | ECS | Posters on site | AS1.32

Influence of diabatic heating on the maintenance of the midlatitude jet 

Ian White, Orli Lachmy, and Nili Harnik

Diabatic heating due to latent heat release in the storm tracks plays an important but poorly understood role in the maintenance of the zonal-mean midlatitude circulation. To examine how the midlatitude circulation is maintained in the presence of diabatic heating on either side of the jet, a dry model is used to apply mid-tropospheric perturbations to the radiative equilibrium temperature profile to which the model is relaxed, constituting an intermediate step between an externally-imposed diabatic heating and a setup that allows for full diabatic feedbacks. By applying transient switch-on perturbations at various latitudes, the mechanisms by which an equilibrated state is reached are examined. In all cases, the equilibrated circulation exhibits a dynamically-stable structure where the eddies maintain a region of concentrated baroclinicity, latitudinally shifted away from the region of the heating perturbation. However, the initial response is generally very different. When the heating is poleward of the jet, there is an initial thermal-wind adjustment to the heating and weakened eddy heat fluxes, followed later by weakened eddy momentum fluxes aloft that maintain an equilibrated equatorward shift of the jet. Conversely, when the heating is equatorward of the jet, the evolution is more complex with an initial strengthening of the eddy heat fluxes and a weakening of the Hadley cell to balance the heating, in addition to a thermal-wind adjustment that immediately modifies the critical latitudes and thus, the eddy momentum fluxes. These momentum-flux changes encourage a poleward propagation of the anomalies from the subtropics to midlatitudes over 40 days, where they straddle the jet and ultimately yield an equilibrated poleward jet shift. When the heating is at the jet core, the circulation simply weakens rather than exhibiting any latitudinal shift. These mechanisms of self-concentration of the baroclinicity are discussed and compared with previously proposed mechanisms of jet self-maintenance.

How to cite: White, I., Lachmy, O., and Harnik, N.: Influence of diabatic heating on the maintenance of the midlatitude jet, EGU General Assembly 2024, Vienna, Austria, 14–19 Apr 2024, EGU24-11628, https://doi.org/10.5194/egusphere-egu24-11628, 2024.

EGU24-13173 | ECS | Posters on site | AS1.32

A Warming Climate's Wandering Jet: Investigating Jet Stream Waviness with Hemispheric and Regional Lenses 

Mehmet Sedat Gözlet, Joakim Kjellsson, and Mojib Latif

In the context of a warming Arctic, the behavior of jet streams, as they increasingly meander, is becoming more intricate and variable. In this study, we analyzed approximately 50 models, in total, from the CMIP6 project and ERA5 reanalysis to quantify jet stream waviness and its response to climate change. We found varying trends and spatiotemporally dependent significance levels in jet stream meandering, particularly in the Northern Hemisphere, linked to rising CO2 levels and natural climatic variability.

Building on this foundation, our research delved into the complex patterns of jet stream meandering. We analyzed The Diagnostic Evaluation and Characterization of Klima (DECK) experiments within the CMIP6 framework—AMIP, piControl, and a scenario with a 1% per year CO2 concentration increase—including 21, 18, and 13 models, respectively. These specific datasets and models provided a robust foundation for unraveling the climatic factors affecting the jet stream's trajectory and variations. Spanning from 1979 to 2014, our analysis uses daily geopotential height readings to quantify jet stream waviness and assess the impact of climate change.

The analysis centers on normalizing arc lengths to measure jet stream waviness using the meandering index (M-Index). Additionally, the study investigates median and minimum waviness in Eurasia, the North Atlantic, North America, and the North Pacific to explore regional effects. These insights reveal significant seasonal variations and trends in jet stream behavior, crucial for understanding the impact of climate change on atmospheric dynamics.

In conclusion, this study aligns with the IPCC AR6, thoroughly investigating the complex nature of jet stream meandering and illuminating the roles of CO2 and natural variability. By adhering to the diverse metrics outlined by the IPCC, our research methodically quantifies jet stream trends with the help of M-Index calculations. This thorough exploration dissects the complex interplay between global warming and atmospheric behavior, demonstrating the depth and analytical rigor that is characteristic of climate research aligned with IPCC standards.

How to cite: Gözlet, M. S., Kjellsson, J., and Latif, M.: A Warming Climate's Wandering Jet: Investigating Jet Stream Waviness with Hemispheric and Regional Lenses, EGU General Assembly 2024, Vienna, Austria, 14–19 Apr 2024, EGU24-13173, https://doi.org/10.5194/egusphere-egu24-13173, 2024.

EGU24-13842 | ECS | Orals | AS1.32

Diagnosing flavors of tropospheric Rossby wave breaking and their associated dynamical and sensible weather features  

Grant LaChat, Kevin A. Bowley, and Melissa Gervais

Rossby wave breaking (RWB) can be manifested by the irreversible overturning of isentropes on constant potential vorticity (PV) surfaces. RWB events can lead to tropospheric impacts ranging from changes in intensity and position of the jet stream to extremes in precipitation resulting in significant societal impacts. Traditionally, RWB events are categorized as anticyclonic (AWB) or cyclonic (CWB) and can be identified using the orientation of streamers of high potential temperature (θ) and low θ air on a potential vorticity surface. Self-organizing maps (SOM), a machine learning method, was used to cluster RWB events into archetypal patterns, or “flavors”, for each RWB event type (i.e., AWB and CWB). This allowed for an examination of differences in RWB event flavors, and their associated tropospheric impacts, using the European Centre for Medium Range Weather Forecasts Reanalysis v5 (ERA5) dataset. AWB and CWB flavors capture variations in the θ minima/maxima of each streamer and the localized meridional θ gradient (∇θ) flanking the streamers. Variations in the magnitude and position of ∇θ between flavors correspond to a diversity of jet structures leading to differences in vertical motion patterns and troposphere-deep circulations. A subset of flavors of AWB (CWB) events are associated with the development of strong surface high (low) pressure systems and the generation of extreme poleward moisture transport. For CWB, many events occurred in similar geographical regions, but the precipitation and moisture patterns were vastly different between flavors. 

Given these impacts and their importance for regional climates, it is important to also understand how RWB events, and their associated sensible weather features, are represented in climate models. Therefore, AWB and CWB events were identified from overturning isentropes on the dynamic tropopause (DT) in the Community Earth System Large Ensemble v2 (CESM-LENS2) climate model output during December, January, and February (DJF) 1980-2014 (i.e., historical period). RWB flavors are identified in the LENS2 for comparison to the ERA5 dataset for the same time period. Composites of tropospheric dynamic and thermodynamic fields were calculated for each RWB flavor in the LENS2 which allows for an evaluation of the impact of AWB and CWB structure on sensible weather extremes. First, the frequency of occurrence of each RWB flavor between datasets was found. Second, differences in the sensible weather features associated with each flavor were quantified. This process-orientated climate model evaluation of the LENS2 as compared to the ERA5 can provide insight into the source of model errors in the LENS2 climate model.

How to cite: LaChat, G., Bowley, K. A., and Gervais, M.: Diagnosing flavors of tropospheric Rossby wave breaking and their associated dynamical and sensible weather features , EGU General Assembly 2024, Vienna, Austria, 14–19 Apr 2024, EGU24-13842, https://doi.org/10.5194/egusphere-egu24-13842, 2024.

EGU24-14165 | ECS | Orals | AS1.32

Tracking the jets as Lagrangian objects 

Louis Rivoire and Jezabel Curbelo

Various algorithms developed to track the synoptic evolution of the subtropical jets have proved useful in diagnosing variability and trends. However, consensus about trends remains low, and issues in jet detection persist. Notably, algorithms:

  • Frequently employ a variety of climatological parameters, making them unsuitable for long-trend analyses;
  • Rely on instantaneous meteorological fields (or Eulerian-averaged fields), thereby overlooking the temporal coherence of jet features. This results in the inability to systematically separate the true axis of the jets from underlying waves, affecting the characterization of variability known to affect the mean position of the jets —and long-term trends.

To address these limitations, we define the jets as Lagrangian Coherent Structures; persistent features that resist synoptic variability and thereby shape the atmospheric circulation. Using this Lagrangian definition, a new algorithm named JetLag is developed and applied to the ERA5 reanalysis. JetLag employs 2 parameters –a time scale and a spatial scale, both set by the Rossby wave dispersion relation– and is virtually insensitive to changes in those parameters, within physical bounds. Compared to wind-based methods, we show that JetLag:

  • Locates jet features with better temporal coherence;
  • Has enhanced capabilities for detecting weak and highly variable jets;
  • Produces a different seasonal cycle of mean jet position;
  • Produces different decadal to multi-decadal variability, with implications for trend detection.

We also present a new jet axis dataset for use by the community.

How to cite: Rivoire, L. and Curbelo, J.: Tracking the jets as Lagrangian objects, EGU General Assembly 2024, Vienna, Austria, 14–19 Apr 2024, EGU24-14165, https://doi.org/10.5194/egusphere-egu24-14165, 2024.

EGU24-14610 | Posters on site | AS1.32

Diagnostics of Northern Hemisphere blocking as simulated by Korean Integrated Model (KIM) 

Keon-Hee Cho and Eun-Hee Lee

Blocking is one of the important meteorological phenomena that triggers severe weather in mid-latitudes. The blocking is considered a significant challenge in model predictions, and various studies have been conducted to enhance model predictability of blocking. For these reasons, this study aims to diagnose blocking using the KIM, discuss errors caused by blocking, and utilize it for further analysis. The method used to detect blocking involved the reversal method, considering conditions lasting for more than 5 days. We classified blocking into two types based on the direction of Rossby-Wave Breaking (RWB) during the sustained period. It was found that the classified blocking exhibits different impacts and areas of mid-latitude severe weathers. The distinction for the impacted areas of blocking based on the RWB enabled the definition of the influenced area for the classified blocking. Using this approach, we diagnosed patterns of errors observed in various experiments through the KIM.

How to cite: Cho, K.-H. and Lee, E.-H.: Diagnostics of Northern Hemisphere blocking as simulated by Korean Integrated Model (KIM), EGU General Assembly 2024, Vienna, Austria, 14–19 Apr 2024, EGU24-14610, https://doi.org/10.5194/egusphere-egu24-14610, 2024.

EGU24-14709 | ECS | Orals | AS1.32

The Role of the Meridional Rossby wave for Extreme Heatwaves Over East Asia 

El Noh and Joowan Kim

The North Pacific High is a dominant circulation system that governs the weather in the East Asian region during the summer, and its western boundary serves as a waveguide for the propagation of Rossby waves from the equatorial to mid-latitudes. The deep convection over the equatorial western Pacific usually creates Rossby waves that propagate northward along this waveguide. This meridional Rossby wave, known as the Pacific-Japan (PJ) pattern, is the dominant teleconnection pattern in the vicinity of East Asia, and it often accompanies Heatwaves.

In this study, the circulation and thermodynamic characteristics of the PJ pattern were investigated based on a daily timescale to better understand their relationship with the likelihood of heatwaves in East Asia. According to thermodynamic budget calculations, horizontal heat advection crossing the climatological flow pattern is the key factor for the observed surface air warming. The circulation pattern associated with a PJ pattern largely explains the enhanced warm advection. The overall findings of this study provide valuable insights into the development mechanisms of heatwaves on an intraseasonal timescale.

How to cite: Noh, E. and Kim, J.: The Role of the Meridional Rossby wave for Extreme Heatwaves Over East Asia, EGU General Assembly 2024, Vienna, Austria, 14–19 Apr 2024, EGU24-14709, https://doi.org/10.5194/egusphere-egu24-14709, 2024.

Summertime atmospheric teleconnection patterns over Eurasia have a significant influence on regional weather and climate. Despite extensive studies on the subtropical patterns, the high-latitude counterpart has received relatively less attention. This study proposes physical mechanisms for the formation and maintenance of the dominant high-latitude teleconnection pattern. The formation of the pattern is associated with variability in synoptic-scale eddy activity due to the meridional gradient of sea surface temperature anomalies in the vicinity of the Gulf Stream, causing a meridional shift of the central axis of storm track at the exit of Atlantic jet. The resultant convergence of transient vorticity fluxes to the west of the British Isles induces low-frequency cyclonic circulation anomalies and continued propagation of Rossby waves downstream along northern Eurasia. Once these circulation anomalies are formed, the subsequent latent heat-related diabatic anomalies over the northern Eurasian landmass act as another source of Rossby waves to maintain the teleconnection pattern. Regional temperature and precipitation variability is closely linked to the wave pattern along a route through northern Eurasia, and even precipitation over the East Asian summer monsoon region is influenced by the teleconnection pattern.

How to cite: Kim, J. and Seo, K.-H.: Physical mechanisms for the summertime high-latitude atmospheric teleconnection patterns and the related Eurasian and East Asian climates, EGU General Assembly 2024, Vienna, Austria, 14–19 Apr 2024, EGU24-16134, https://doi.org/10.5194/egusphere-egu24-16134, 2024.

EGU24-17046 | Posters on site | AS1.32

Dependence of quasi-stationary Rossby waves on the background zonal flow 

Thomas Frame, Dominic Jones, John Methven, and Paul Berrisford

Near stationarity of large-scale Rossby waves can be associated with extreme seasons e.g. high seasonal rainfall or persistent hot or cold weather. Here we investigate the dependence of quasi-stationary waves on the structure the background zonal flow. Idealised experiments are performed using a global primitive equation model with a weak relaxation to a baroclinically unstable background zonal mean state in which the latitude and strength of the jet can controlled. This unstable background state generates sustained wave activity through repeated baroclinic lifecycles.

To link the structure of the jet the evolution of Rossby waves, modes of variability are extracted using the Empirical Normal Mode (ENM) technique. This technique extracts the dominant modes of variability which like dynamical modes are orthogonal with respect to a psuedo-momentum (wave activity) norm.  Due to the choice of norm these modes possess an intrinsic linear phase-speed determined by their structure in the same way it would be for dynamical modes. It is found that despite the non-linearity of the simulations the flow is dominated by a few ENMs whose depend systematically on the background state jet latitude and strength in a manner which can be well understood through the dynamics of modes. It is suggested that seasons with anomalously persistent mid-latitude Rossby wave activity may be related to the interannual variability in the background state zonal flow.

How to cite: Frame, T., Jones, D., Methven, J., and Berrisford, P.: Dependence of quasi-stationary Rossby waves on the background zonal flow, EGU General Assembly 2024, Vienna, Austria, 14–19 Apr 2024, EGU24-17046, https://doi.org/10.5194/egusphere-egu24-17046, 2024.

EGU24-17739 | ECS | Orals | AS1.32

Quantifying the relation betwen jet meandering and extreme events 

Erez Aviv and Yohai Kaspi

The Eddy-driven jet meandering has been hypothesized to increase due to climate change. This meandering frequently induces slow-moving patterns of low and high pressure anomalies, potentially causing extreme weather events such as droughts, flooding, heat waves and cold spells. However, the quantitative link between the jet’s meandering and storms development is still lacking, as well as a conclusive mechanism for the effect of climate change on the jet’s meandering. In this study, we first separate the physical components in the atmospheric complex system using an idealized global circulation model. We outline the connection between the decreasing equator-to-pole temperature gradient due to Arctic amplification and the meandering of the jet. As the meridional temperature gradient decreases, the eddy-driven jet slows and its meridional layout widens. By Lagrangian tracking cyclones and anticyclones, we link the jet meandering to the formation of cyclones and anticyclones. Looking at more realistic simulations, using CMIP6 data and applying a similar analysis we find analogous linkage between the meandering of the jet and storm genesis under the SSP585 scenario. We will present both our new methodology and results connecting jet meandering and extreme events.

How to cite: Aviv, E. and Kaspi, Y.: Quantifying the relation betwen jet meandering and extreme events, EGU General Assembly 2024, Vienna, Austria, 14–19 Apr 2024, EGU24-17739, https://doi.org/10.5194/egusphere-egu24-17739, 2024.

EGU24-17801 | ECS | Orals | AS1.32

Sources of biases in blocking representation in climate models 

Pragallva Barpanda and Camille Li

Despite decades of research, climate models have failed to produce a consistent picture about regional variations in atmosphere blocking. The lack of sufficient model outputs has impeded the progress in unraveling the sources of biases in the model simulations. To address this issue, we perform a systematic analysis of blocking events, from two state-of-the-art climate models  with high temporal and spatial resolution — Community Earth System Model, Large Ensemble Community Project 2 (CESM LENS2) and the Norwegian Earth System Model medium resolution (NorESM2-MM) —alongside an idealised simulation featuring regionally varying CO2 forcings. A benchmark dataset of blocking events is created using the finite-amplitude local wave activity metric since it captures the growth and decay of high-amplitude Rossby waves while conserving wave activity density up to higher accuracy.  We also perform a detailed analysis of the wave activity budget to quantify the dominant physical processes that lead to biases in historical runs and processes that shift blocking patterns in warming scenario model runs.

How to cite: Barpanda, P. and Li, C.: Sources of biases in blocking representation in climate models, EGU General Assembly 2024, Vienna, Austria, 14–19 Apr 2024, EGU24-17801, https://doi.org/10.5194/egusphere-egu24-17801, 2024.

EGU24-18176 | Orals | AS1.32

Predictability of midlatitude Rossby wave packets  

Michael Riemer, Isabelle Prestel-Kupferer, Sören Schmidt, and Franziska Teubler

Rossby Wave Packets (RWPs) are linked to extreme weather events and exert a strong influence on the predictability of weather systems in the midlatitudes. Considering the whole wave packet, in the sense of the packet envelope, RWPs can be viewed as entities that describe variability of the atmosphere beyond the synoptic scale. We here examine the predictability of RWPs as such entities. As a verification metric we used the so-called Displacement and Amplitude Score (DAS) applied to the envelope field of the midlatitude flow. The DAS is based on a field deforming method and, as one of its major advantages, avoids the “double-penalty” verification problem without the need to identify single RWP objects. We assess RWP predictability using a 19-year period of NOAA GEFSV12 ensemble reforecasts for RWPs that have been previously tracked in reanalysis data.

Forecast errors defined by this metric asymptote towards saturation but do not completely reach saturation within the 10 days lead time available to this study. Corresponding error growth rates maximize during the medium range, in contrast to common error-growth models, in which growth rates are a maximum initially and monotonically decrease with lead time. We hypothesize that this difference relates to the lead-time dependence of error-growth mechanism. Variations in RWP predictability are dominated by the stage of the RWP life cycle, with higher predictability found for the propagation stage than the onset and decay stages. In addition, RWP predictability exhibits a seasonal cycle, with higher predictability in winter than in summer. Controlling for seasonality and the stage of the life cycle, we find i) that high-amplitude RWPs exhibit higher predictability than low-amplitude RWPs for medium-range forecasts and ii) that there is a general pattern of higher predictability over Eurasia than over the ocean basins, with some more detailed variations according to different lead times and life- cycle stages. Finally, predictability of the propagating stage is higher if forecasts are initialized after RWP onset than if initialized before onset. RWP onset thus acts as a partial predictability barrier to the subsequent propagation stage.

How to cite: Riemer, M., Prestel-Kupferer, I., Schmidt, S., and Teubler, F.: Predictability of midlatitude Rossby wave packets , EGU General Assembly 2024, Vienna, Austria, 14–19 Apr 2024, EGU24-18176, https://doi.org/10.5194/egusphere-egu24-18176, 2024.

EGU24-18545 | ECS | Posters on site | AS1.32

Increased quasi-resonant amplification and persistent summer weather extremes in multimodel climate projections with high emissions and aerosol forcing 

Sullyandro Oliveira Guimarães, Michael E. Mann, Stefan Rahmstorf, Stefan Petri, Byron A. Steinman, Daniel J. Brouillette, Shannon Christiansen, and Xueke Li

High-amplitude quasi-stationary atmospheric Rossby waves with zonal wave numbers 6-8 associated with the phenomenon of quasi-resonant amplification (QRA) have been linked to persistent summer extreme weather events in the Northern Hemisphere. QRA is not well-resolved in current generation climate models, however, necessitating an alternative approach to assessing their behavior. Using a previously-developed fingerprint-based semi-empirical approach, we project future occurrence of QRA events based on a QRA index derived from the zonally averaged surface temperature field, comparing results from CMIP5 and CMIP6 (Coupled Model Intercomparison Project). There is a general agreement among models, with most simulations projecting substantial increase in QRA index. Larger increases are found among CMIP6-SSP5-8.5 (42 models, 46 realizations), with 85% of models displaying a positive trend, as compared with 60% of CMIP5-RCP8.5 (33 models, 75 realizations), with a reduced spread among SSP5-8.5 models. CMIP6-SSP3-7.0 (25 models, 28 realizations) simulations display qualitatively similar behavior to SSP5-8.5, indicating a substantial increase in QRA events under business-as-usual emissions scenarios, and the results hold regardless of the increase in climate sensitivity in CMIP6. Also, the aerosol forcing plays a substantial role in CMIP5 and CMIP6 models; a reduction in aerosol loading reduces Arctic amplification, and mitigates potential increases in QRA-related persistent extreme weather events. Our analysis suggests that anthropogenic warming will likely lead to an even more substantial increase in QRA events (and associated summer weather extremes) than indicated by past analyses.

How to cite: Oliveira Guimarães, S., E. Mann, M., Rahmstorf, S., Petri, S., A. Steinman, B., J. Brouillette, D., Christiansen, S., and Li, X.: Increased quasi-resonant amplification and persistent summer weather extremes in multimodel climate projections with high emissions and aerosol forcing, EGU General Assembly 2024, Vienna, Austria, 14–19 Apr 2024, EGU24-18545, https://doi.org/10.5194/egusphere-egu24-18545, 2024.

EGU24-3150 | ECS | Orals | AS1.33

The Multi-Channel Maximum-Likelihood (MCML) method: towards a cost-effective multisource estimation algorithm 

Benjamin Poste, Karim Abed-Meraim, Maurice Charbit, Alexis Le Pichon, Constantino Listowski, François Roueff, and Julien Vergoz

We present an improvement of the Multi-Channel Maximum-Likelihood (MCML) method [1]. This approach is based on the likelihood function derived from a multi-sensor stochastic model expressed in different frequency channels. Using the likelihood function, we determine, for the detection problem, the Generalized Likelihood Ratio (GLR) with a p-value threshold to discriminate signal of interest and noise. For the estimation of the slowness vector, we determine the Maximum Likelihood Estimation (MLE). Comparisons with synthetic and real datasets show that MCML, when implemented in the time-frequency domain, outperforms state-of-the-art detection algorithms in terms of detection probability and false alarm rate in poor signal-to-noise ratio scenarios. Mathematical extension of MCML is implemented in order to detect overlapping coherent signals in the same time frequency domain. This extension is based on the spectral matrix content. Taking into account the last detected source, the array response in the spectral matrix is iteratively subtracted to estimate a subsequent source of weaker energy. We show that the implemented approach allows detecting overlapping signals in the same time frequency window under various scenarios with varying signal-to-noise ratio (SNR), frequency bands and array geometry. Compared with the original method based on multiple maxima selection on the monosource likelihood function, the new approach yields improved wave parameter estimates. Results are illustrated by synthetics and real data recorded by stations part of the International Monitoring System (IMS).


[1] B. Poste et al. (2022), The Multi-Channel Maximum-Likelihood (MCML) method: a new approach for infrasound detection and wave parameter estimation, Geophysical Journal International, https://doi.org/10.1093/gji/ggac377

How to cite: Poste, B., Abed-Meraim, K., Charbit, M., Le Pichon, A., Listowski, C., Roueff, F., and Vergoz, J.: The Multi-Channel Maximum-Likelihood (MCML) method: towards a cost-effective multisource estimation algorithm, EGU General Assembly 2024, Vienna, Austria, 14–19 Apr 2024, EGU24-3150, https://doi.org/10.5194/egusphere-egu24-3150, 2024.

EGU24-3345 | Posters on site | AS1.33 | Highlight

Characterisation and localisation of lightning and explosions by a flotilla of stratospheric balloons 

Thomas Farges, Sara Albert, Daniel Bowman, Gael Burgos, Olaf Gainville, Pierre Sochala, and Alexis Le Pichon

On 3 August 2021, Sandia launched a flotilla of four Heliotrope solar hot air balloons (Bowman et al., 2020) from Belen regional airport in New Mexico (USA) to coincide with the launch of the Boeing Starliner rocket. Three balloons were equipped with two Gem microphones (Anderson et al., 2018) spaced vertically from 30 to 100 m apart, depending on the balloon. The fourth balloon had two infraBSU microbarometers mounted in opposite polarity in order to suppress local interference. These Heliotrope balloons allow level flights between 15 and 25 km altitude for several hours from sunrise to sunset. The rocket launch was cancelled after the balloons were launched, but eight chemical explosions of between 45 and 135 kg TNT equivalent and a thunderstorm took place near the balloons in the first few hours of cruise. After characterizing the measurements of explosions on balloons and two ground seismic stations, we evaluate the performance of a Bayesian method for locating explosions, taking into account local meteorology and whether or not seismic measurements were included. Using acoustic measurements under balloon conditions alone, we highlight the importance of network geometry and propagation between the explosion and the sensors in the localization error. We then characterize the lightning that occurred in a single thunderstorm cell located between 10 and 40 km from three of the four balloons. Several lightning flashes are clearly identified (using the method proposed by Farges and Blanc (2010) for ground thunder measurements and Lamb et al. (2018) for first stratospheric balloon measurements of lightning) and located in 3D with the method validated from explosion measurements. These 3D locations are compared with the 3D thunder model defined by Lacroix et al. (2010) and with the 3D distribution of thunder sound power described by Bestard et al. (2023). Finally, as the storm lasted approximately 45 minutes, continuous thunder emissions occurred. We calculated the cross-correlation time between measurements made under one of the balloons at 30 m apart during this period. We can see a change in the relative arrival delay as the balloon moves away from the storm cell, which does not move over this period. This suggests propagation through the AtmoSOFAR channel as defined by Albert et al (2023).

SNL is managed and operated by NTESS under DOE NNSA contract DE-NA0003525.


How to cite: Farges, T., Albert, S., Bowman, D., Burgos, G., Gainville, O., Sochala, P., and Le Pichon, A.: Characterisation and localisation of lightning and explosions by a flotilla of stratospheric balloons, EGU General Assembly 2024, Vienna, Austria, 14–19 Apr 2024, EGU24-3345, https://doi.org/10.5194/egusphere-egu24-3345, 2024.

EGU24-5622 | Posters on site | AS1.33

Infrasound from lightning measured in northern Romania 

Daniela Ghica and Bogdan Antonescu

During thunderstorms in northern Romania, numerous infrasonic signals are emitted due to the process of lightning and thunder. Association between infrasound detections into 0.5 to 7 Hz frequency band and lightning flashes detected by the Arrival Time Difference lightning network (ATDnet) managed by the Met Office within 50 km from the BURARI infrasound station is systematically investigated. Statistical results are presented based on infrasound and lightning observations during summer months (June to August) from 2020 to 2022.

Assuming direct wave propagation path, infrasound detections can be successfully correlated with ATDnet lightning detections up to distances of 50 km from the infrasound array. Long-duration trains of frequent sharp spikes in the amplitude observed into infrasound recordings during thunderstorms are associated with lightning discharges. Acoustic signatures of lightning activity show short-lived disturbances with dominant frequency of approx. 3 Hz and amplitudes ranging from 0.01 up to about 0.5 Pa. In order to associate BURARI measurements with ATDnet detections, a relationship between infrasound time-of-arrival and time of discharge signals is applied. A maximum deviation of 10o between observed infrasound back-azimuth and back-azimuth of ATDnet detections is allowed.

For several cases (days with the largest number of lightnings), detection conditions of infrasound from lightning are detailed, and some characteristics are analyzed (e.g., amplitude, frequency, trace velocity and spectrograms in the frequency range from 0.5 to 10 Hz). Correlations with synoptic charts, regional lightning activity maps and electric field measurements could be performed.

How to cite: Ghica, D. and Antonescu, B.: Infrasound from lightning measured in northern Romania, EGU General Assembly 2024, Vienna, Austria, 14–19 Apr 2024, EGU24-5622, https://doi.org/10.5194/egusphere-egu24-5622, 2024.

EGU24-6063 | ECS | Posters on site | AS1.33

Using an oceanic acoustic noise model to evaluate simulated atmospheric states 

Pierre Letournel, Constantino Listowski, Marc Bocquet, Alexis Le Pichon, and Alban Farchi

Due to the lack of observations, Numerical Weather Prediction (NWP) models are poorly constrained in the Middle Atmosphere (MA ~10-90km) and thus significantly biased [1]. Infrasounds of oceanic origin (microbaroms) propagate across thousands of kilometers and integrate information on the MA dynamical state and particularly on winds. Thus, we investigate how to assess the performance of NWP models in the MA through simulations and global and continuous observations of microbaroms. 

Infrasound observations are processed using an adaptation of the MCML [2] algorithm to obtain the azimuthal distribution of microbarom amplitudes at the International Monitoring System Norwegian infrasound station I37NO. These observations are compared to simulations where modelled distribution account for the antenna response relative to MCML processing.

Simulations of microbaroms arrival are carried for the year 2021 by combining a microbarom source model [3] and two propagation methods: a semi-empirical law using a single atmospheric profile and Parabolic Equation (PE) range-dependent propagation simulation accounting for the 3D atmosphere. Yearly comparisons through an optimal transport metric using atmospheric specification from different atmospheric models highlight the limitations of the semi-empirical law for a NWP model performance evaluation.

Atmospheric models are thus assessed building on the PE propagation simulations and first conclusions on models relative performances are derived over specific periods of interest, including a sudden stratospheric warming. While the current work focuses on the evaluation of NWP models, it will also allow to define a method relying on microbarom observations to improve these models through Data Assimilation.


[1] Le Pichon, A., Assink, J. D., Heinrich, P., Blanc, E., Charlton-Perez, A., Lee, C. F., Keckhut, P., Hauchecorne, A., Rüfenacht, R., Kämpfer, N., et al. (2015), Comparison of co-located independent ground-based middle atmospheric wind and temperature measurements with numerical weather prediction models, J. Geophys. Res. Atmos., 120, 8318–8331, doi:10.1002/2015JD023273.

[2] B Poste, M Charbit, A Le Pichon, C Listowski, F Roueff, J Vergoz, The multichannel maximum-likelihood (MCML) method: a new approach for infrasound detection and wave parameter estimation, Geophysical Journal International, Volume 232, Issue 2, February 2023, Pag-es 1099–1112, https://doi.org/10.1093/gji/ggac377

[3] De Carlo, M., Accensi, M., Ardhuin, F., and Le Pichon, A.: ARROW (AtmospheRic InfRasound by Ocean Waves): a new real-time product for global ambient noise monitoring., EGU General Assembly 2022, Vienna, Austria, 23–27 May 2022, EGU22-7564, https://doi.org/10.5194/egusphere-egu22-7564, 2022.

How to cite: Letournel, P., Listowski, C., Bocquet, M., Le Pichon, A., and Farchi, A.: Using an oceanic acoustic noise model to evaluate simulated atmospheric states, EGU General Assembly 2024, Vienna, Austria, 14–19 Apr 2024, EGU24-6063, https://doi.org/10.5194/egusphere-egu24-6063, 2024.

EGU24-7566 | ECS | Posters on site | AS1.33

Characterizing the 2022 South Atlantic fireball using infrasound recordings of the International Monitoring System 

Patrick Hupe, Julien Vergoz, Christoph Pilger, and Alexis Le Pichon

On 7 February 2022, around 20:00 UTC, a large meteoroid entered the Earth’s atmosphere around 500 km off the coast of Namibia and South Africa. NASA’s Center for Near Earth Object Studies (CNEOS) lists the event as a fireball with an impact energy of 7 kt of TNT equivalent. This energy estimate is about 60 times lower than for the 2013 Chelyabinsk fireball (440 kt, CNEOS), which was broadly covered in the media. Infrasound measurements can be an independent information source for fireball events. Their infrasonic signatures originate from either the hypersonic trajectory, which emits ablational waves, or the explosive fragmentation, which emits a ballistic shock wave. Relations such as ReVelle’s law can even be used for energy release estimates based on infrasound detection parameters such as the dominant period of the signal. The analysis of infrasound data from the International Monitoring System (IMS) for the Comprehensive Nuclear-Test-Ban Treaty (CTBT) revealed that the Chelyabinsk fireball was the strongest event ever recorded by the IMS infrasound network at that time, when 20 out of 42 existing stations detected it. The second-strongest event of this type in the IMS era was the Bering Sea bolide that occurred on 18 December 2018 (49 kt, CNEOS), with a comparable portion of infrasound stations detecting it (25 out of 51, according to Pilger et al. 2019, doi: 10.3390/atmos11010083).

For the 2022 South Atlantic fireball, we have found signatures at 20 infrasound stations of the IMS, too, out of 53 stations certified nowadays. We further characterize the event using the infrasound observations, model the infrasound propagation between the elevated source and the arrays, and assess the detection capability to explain the large number of detecting stations. We also use the IMS data for estimating an energy release, and revisit previous strong events such as Chelyabinsk using state-of-the-art array processing methods and enhanced configurations. These comprise the Multi-Channel Maximum-Likelihood (MCML) method or the one-third-octave band configuration within the Progressive Multi-Channel Correlation (PMCC) method, respectively.

How to cite: Hupe, P., Vergoz, J., Pilger, C., and Le Pichon, A.: Characterizing the 2022 South Atlantic fireball using infrasound recordings of the International Monitoring System, EGU General Assembly 2024, Vienna, Austria, 14–19 Apr 2024, EGU24-7566, https://doi.org/10.5194/egusphere-egu24-7566, 2024.

Inferring a model of the wind, pressure, velocity in the atmosphere is an inverse problem, for which the state of the art methods use the travel times of acoustic waves.
We aim to solve such an inverse problem by adding more information and using a full waveform (in this case pressure variation) as infrasound observation.
In particular, we place our study in the context of an inversion of infrasound due to an explosion (or quake) in a domain, without gravity, without attenuation but with the wind as a non isotropic parameter. The addition of wind is important because wind can have an significant impact on the waveform (like the wave guide). 
To this end, we adapted the adjoint method developed in seismology to a fluid in movement : sensitivity kernels have been computed in the case of acoustics waves in the presence of wind (linearised Navier-Stokes equations).
The sensitivity kernels play the role of a gradient in an optimization framework that recovers the variation of atmospheric parameters (density, wind, pressure, speed).
Sensitivity kernels have been studied on simple and more realistic cases in 1d and 2d.
We validated the sensitivity kernels acquired by the adjoint method by comparing them with those obtained by auto-differentiation. Discontinuities near the source and receivers are observed in the sensitivity kernels. We studied the influence of source frequency on the kernels and on these discontinuities.
These encouraging results on sensitivity kernels led us to test initial synthetic inversion in 1d and 2d.
We proposed an analysis of the efficiency of the inversion depending on the choice of parametrization, conjugate gradient method and regularization term.

How to cite: Gerier, S., Martin, R., and Garcia, R.: Development of a full waveform inversion method for acoustic waves in the presence of wind: application to synthetic and realistic cases , EGU General Assembly 2024, Vienna, Austria, 14–19 Apr 2024, EGU24-7749, https://doi.org/10.5194/egusphere-egu24-7749, 2024.

EGU24-7854 | ECS | Posters on site | AS1.33 | Highlight

Simulating infrasound waveguides in the middle atmosphere with ICON and UA-ICON: comparison with the IFS and ground-based remote sensing 

Samuel Kristoffersen, Constantino Listowski, Robin Wing, Gerd Baumgarten, Sergey Khaykin, Alain Hauchecorne, Julien Vergoz, and Alexis Le Pichon

Infrasound signals are used to monitor various anthropogenic (explosions, wind farms etc.) and natural (earthquakes, volcanoes etc.) sources. In particular, infrasound is included as one of the four verification technologies used by the International Monitoring System (IMS) by the Comprehensive Test-Ban Treaty Organisation (CTBTO). To determine accurate source locations and estimate source energy, an accurate model of wind and temperature from the surface up to the lower thermosphere is necessary. Operational NWP products are necessary for routine infrasound monitoring activities. However, the use of a sponge layer above ~30 km, to insure stable NWP models, leads to biases in the middle atmosphere (MA), where the relevant infrasound waveguides for long-range propagation are found. For UA-ICON, the sponge layer is set much higher in the thermosphere. Therefore, the UA-ICON, which provides modelled atmospheric parameters up to 150 km (110 km sponge layer height), is relevant in this context. 
First, to assess ICON and IFS operational analysis products, comparisons to lidar observations are made. The main differences between both products were analysed with respect to winds and temperatures in the MA, and hence with respect to the infrasound guide prediction. Second, UA-ICON simulations were performed and the outputs were compared to ICON and IFS fields to demonstrate the increased wave activity above ~30 km with UA-ICON. The added value of UA-ICON with respect to ICON and IFS products for infrasound propagation simulations is discussed. The comparisons between the remote sensing instrumental results and the models will be presented, as well as comparisons between modelled and measured infrasound propagation. 

How to cite: Kristoffersen, S., Listowski, C., Wing, R., Baumgarten, G., Khaykin, S., Hauchecorne, A., Vergoz, J., and Le Pichon, A.: Simulating infrasound waveguides in the middle atmosphere with ICON and UA-ICON: comparison with the IFS and ground-based remote sensing, EGU General Assembly 2024, Vienna, Austria, 14–19 Apr 2024, EGU24-7854, https://doi.org/10.5194/egusphere-egu24-7854, 2024.

EGU24-8096 | ECS | Orals | AS1.33

OH airglow SWIR observations: high temporal resolution acquisition for ionospheric seismology proof of concept 

Pierre-Yves Froissart, Philippe Lognonné, Pierre Simoneau, and Kiwamu Nishida

Nightglow radiation is a very good marker of high-altitude dynamics. After a first detection of a tsunami signature by a camera in the O+ emission (red airglow at 250km) in 2011, only a few other tsunami detections have been recorded and none have been observed in OH SWIR emission, which is the brightest of all the nightglow emissions and the only compatible for shorter periods signals, such as seismic waves. On the other hand, these acoustic waves associated with earthquakes are systematically detected by other ionospheric instruments (GPS, radar), they have never been directly observed by an airglow camera.  Can they be also detected by airglow?

We present here our strategy for such proof of concept. If achieved, it will provide unique access to seismic waves propagation where ground instruments are not available:  oceans, which cover more than 70% of the Earth's surface, but also to provide the harsh planetary environment of Venus, where airglow also exists and where it is not possible to send spacecraft to the ground.

The recent development of SWIR cameras and the first detection of infrasound in OH radiation in 2020 opened the way for these detections. To better understand the continuous dynamics of the OH layer, we have deployed a first camera at La Réunion island in May 2023. Another one will be installed on the Japanese island of Oshima in February-March 2024 to try to detect the signature of a seismic event if one occurs during the course of this scientific study. The presentation details our methodology for observing the airglow OH perturbations, from the instrument specifications to the first results of almost one year-acquisition at la Réunion and the expected events that we will observe from Japan.

How to cite: Froissart, P.-Y., Lognonné, P., Simoneau, P., and Nishida, K.: OH airglow SWIR observations: high temporal resolution acquisition for ionospheric seismology proof of concept, EGU General Assembly 2024, Vienna, Austria, 14–19 Apr 2024, EGU24-8096, https://doi.org/10.5194/egusphere-egu24-8096, 2024.

EGU24-8267 | ECS | Posters on site | AS1.33

Categorisation of infrasound signals originated from thunderstorms using the Central and Eastern European Infrasound Network 

Marcell Pásztor, Tereza Šindelářová, Daniela Ghica, Bogdan Antonescu, Ulrike Mitterbauer, Alexander Liashchuk, Tamás Bozóki, and István Bondár

The Central and Eastern European Infrasound Network (CEEIN) has been operating since 2019 in a collaboration of Hungarian, Czech, Romanian, Austrian, and Ukrainian research institutes. The study aims to extend the process of categorisation of infrasound signals that has been previously applied to the Hungarian infrasound array (PSZI) to the other CEEIN stations. The method of associating infrasound signals with thunderstorms relies on correlating the detections both spatially and temporally to lighting data from the Worldwide Lightning Location Network (WWLLN), which is considered ground truth. As a result, over 30,000 infrasound detections were categorized as thunderstorm-originated in the period between 2019 and 2023. Based on the results, we analyse the capabilities of the CEEIN to detect thunderstorms.

How to cite: Pásztor, M., Šindelářová, T., Ghica, D., Antonescu, B., Mitterbauer, U., Liashchuk, A., Bozóki, T., and Bondár, I.: Categorisation of infrasound signals originated from thunderstorms using the Central and Eastern European Infrasound Network, EGU General Assembly 2024, Vienna, Austria, 14–19 Apr 2024, EGU24-8267, https://doi.org/10.5194/egusphere-egu24-8267, 2024.

EGU24-8572 | ECS | Orals | AS1.33 | Highlight

Probing the Martian atmospheric boundary layer using impact-generated seismo-acoustic signals 

Marouchka Froment, Zongbo Xu, Philippe Lognonné, Carene Larmat, Raphael F Garcia, Mélanie Drilleau, Brent G Delbridge, Aymeric Spiga, Taichi Kawamura, and Eric Beucler

In-situ measurements of atmospheric variables are key to the validation and improvement of current models of the Martian climate, particularly of the planetary boundary layer. This highly dynamical region, whose thickness and altitude vary, is governed by unique thermodynamical, physical and chemical exchanges between the troposphere and surface. However, only sparse data is available in this location, as information is collected mostly by a few surface probes and during occasional spacecraft descent and landing. 

Recently, the seismometers of the InSight lander recorded short low-frequency, dispersed waveforms on six occasions. These signals were shown to be impact-generated guided infrasound waves. They were excited by the atmospheric entry and surface impact of bolides, and propagated  in a low-altitude atmospheric waveguide. The location of their source, i.e., the impact crater, is well characterized by orbital imaging and the origin time by joint seismic and acoustic analysis. The deformation of the ground by the propagating infrasound wave allowed their detection by InSight seismometers.

Using analytical modeling, we show that the signal group velocity depends on the vertical profile of the effective sound speed in the Martian boundary layer. These impact-generated signals provide a unique opportunity to probe the atmosphere at these low altitudes. Here, we conduct a Bayesian inversion of effective sound speed up to  ~2000 m altitude using the group velocity measured for events S0981c, S0986c and S1034a. We compare these results with estimates of effective sound speed profiles provided by the Mars Climate Database based on global circulation models. We show that the differences between inverted and modeled profiles can be attributed to a local variation in wind in the impact → station direction, with amplitude smaller than 2 m/s, and that the infrasound data generally validates the Mars Climate Database results for each date and location.

How to cite: Froment, M., Xu, Z., Lognonné, P., Larmat, C., Garcia, R. F., Drilleau, M., Delbridge, B. G., Spiga, A., Kawamura, T., and Beucler, E.: Probing the Martian atmospheric boundary layer using impact-generated seismo-acoustic signals, EGU General Assembly 2024, Vienna, Austria, 14–19 Apr 2024, EGU24-8572, https://doi.org/10.5194/egusphere-egu24-8572, 2024.

EGU24-8768 | Posters on site | AS1.33

Variability of middle atmospheric polar ozone and its effects on Arctic mesospheric tides 

Guochun Shi, Hanli Liu, Witali Krochin, Masaki Tsutsumi, Njål Gulbrandsen, and Gunter Stober
We perform continuous ozone measurements above Ny-Ålesund, Svalbard (79 N, 12 E) with ground-based microwave radiometers GROMOS-C to explore the short-term and interannual variability of ozone in the polar middle atmosphere covering from 2015 to 2023. GROMOS-C measurements exhibit good agreement with MERRA-2 reanalysis and Aura-MLS satellite data. This work focuses on understanding the influence of highly altered dynamics of sudden stratospheric warming events on ozone variations in the Arctic middle atmosphere and investigating the potential role of ozone in connection to mesospheric tides reported for such events. We extract the mesospheric semi-diurnal tides (SDT) and diurnal tides (DT) from the zonal and meridional winds recorded by nearby meteor radars located at Svalbard (79N, 12E) and Tromsoe (69N,18.5E), and Sodankyla (67N, 26E) in the Arctic regions. Furthermore, these tidal observations are compared with simulations by the specified dynamics–whole atmosphere community climate model with ionosphere/thermosphere extension (SD-WACCM-X). Utilizing the middle atmospheric ozone observations by GROMOS-C and MLS, we investigate the impact of ozone variability attributed to sudden stratospheric warming events on tides in the Mesosphere and Lower Thermosphere (MLT). Our findings suggest a possible connection between alterations in middle atmospheric ozone and the underlying circulation, which subsequently influences tidal propagation up to the mesosphere. This indicates that, in conjunction with radiative forcing, these dynamics may play a significant role in driving mesospheric tides.


How to cite: Shi, G., Liu, H., Krochin, W., Tsutsumi, M., Gulbrandsen, N., and Stober, G.: Variability of middle atmospheric polar ozone and its effects on Arctic mesospheric tides, EGU General Assembly 2024, Vienna, Austria, 14–19 Apr 2024, EGU24-8768, https://doi.org/10.5194/egusphere-egu24-8768, 2024.

EGU24-8908 | Orals | AS1.33

3-dimensional winds and impacts of the typhoon observed in the MLT region using the Chinese multistatic meteor radar network 

Jie Zeng, Gunter Stober, Wen Yi, Xianghui Xue, and Xiankang Dou

We present the first continuous observations of the three-dimensional winds in the mesosphere and lower thermosphere (MLT) of the northern hemisphere midlatitudes using the composite data from the first multistatic meteor radar network in China. Our continuous observations started in 2022. In the summer of 2023, typhoon Doksuri passed through China and resulted in intense rainfalls. To reveal the impact of the typhoon on the MLT region, we focus on the variability in the three-dimensional wind fields. The horizontal winds are retrieved using an improved Volume Velocity Processing (VVP) with coordinate transformation and non-linear constraints to minimize errors, and the vertical winds are retrieved from the horizontal divergence with magnitudes of less than 1m/s. We found that on the day when the typhoon passed through our meteor radar network, the horizontal winds strengthened southwest and contained small-scale waves, and the vertical winds showed no significant change.

How to cite: Zeng, J., Stober, G., Yi, W., Xue, X., and Dou, X.: 3-dimensional winds and impacts of the typhoon observed in the MLT region using the Chinese multistatic meteor radar network, EGU General Assembly 2024, Vienna, Austria, 14–19 Apr 2024, EGU24-8908, https://doi.org/10.5194/egusphere-egu24-8908, 2024.

EGU24-9840 | ECS | Orals | AS1.33 | Highlight

Gravity wave model validation using nightglow emission observations for lower ionosphere disturbance modelling 

Ewen Jaffré, Christophe Bellisario, Philippe Keckhut, Pierre-Yves Froissart, Samuel Trémoulu, Fabrice Chane-Ming, Pierre Simoneau, Alain Hauchecorne, and Stéphane Saillant

Lower ionosphere is the theater of interactions between the ionized atmosphere and homogeneous atmosphere. Some phenomena such as gravity and acoustic waves which originate from the homogeneous atmosphere also impact the ionosphere and are suspected to be the source of sporadic disturbances in the E-region. Our goal is to correlate these disturbances to acoustic and gravity waves through modelling and ionosphere sounding. We first present the first steps towards this goal, a bi-dimensionnal, inviscid and compressible acoustic-gravity wave model coupled to a nightglow emission model (NEMO).  Then subsequent cross-comparisons with acoustic and gravity waves seen in the OH nightglow emission layer using an infrared sensor and MRA (Multi-Resolution Analysis) are discussed. These comparisons will help to improve the model’s rendering of wave impacts on their transportation medium, before extending the model’s range to ionospheric heights and properties.

How to cite: Jaffré, E., Bellisario, C., Keckhut, P., Froissart, P.-Y., Trémoulu, S., Chane-Ming, F., Simoneau, P., Hauchecorne, A., and Saillant, S.: Gravity wave model validation using nightglow emission observations for lower ionosphere disturbance modelling, EGU General Assembly 2024, Vienna, Austria, 14–19 Apr 2024, EGU24-9840, https://doi.org/10.5194/egusphere-egu24-9840, 2024.

EGU24-10208 | Posters on site | AS1.33

Availability of nightglow ground observations for atmospheric dynamics monitoring 

Christophe Bellisario, Pierre Simoneau, Sophie Derelle, Ewen Jaffré, Pierre-Yves Froissart, Philippe Keckhut, Alain Hauchecorne, Samuel Tremoulu, and Fabrice Chane-Ming

The infrared emission lines observed between 80 and 100 km known as nightglow allow the investigation of dynamic phenomena such as gravity waves with adapted cameras. In particular, the OH nightglow emission peaking at 87 km can be observed with short wave infrared InGaAs cameras and most of studies use these observations to investigate dynamics at this height. In this study, we briefly describe the methodology to assess the availability of nightglow observations at ground level depending on the spectral bands and the local atmospheric conditions. The impact of clouds on the spectral radiance propagation is estimated by the use of radiative transfer models. Sensitivity tests are completed on clouds characteristics, such as vertical width or the type of clouds. In addition, we integrate directional fluxes on the celestial dome to assess the level of radiance available at the ground level for night vision imaging. Statistical temporal comparisons are performed using available observations campaigns at Observatory of Haute-Provence (OHP) and at Maïdo Observatory.

How to cite: Bellisario, C., Simoneau, P., Derelle, S., Jaffré, E., Froissart, P.-Y., Keckhut, P., Hauchecorne, A., Tremoulu, S., and Chane-Ming, F.: Availability of nightglow ground observations for atmospheric dynamics monitoring, EGU General Assembly 2024, Vienna, Austria, 14–19 Apr 2024, EGU24-10208, https://doi.org/10.5194/egusphere-egu24-10208, 2024.

EGU24-12783 | Posters on site | AS1.33

Exploring the feasibility of detecting seismically-generated infrasound waves on Venus using balloon platforms 

Sven Peter Näsholm, Quentin Brissaud, Celine Marie Solberg, and Marouchka Froment

Seismic waves are a primary source of information for our understanding of Earth's internal structure and they provide important constraints on subsurface seismic-velocity properties. However, traditional inversion methods cannot be implemented in regions of limited seismic-station coverage, in particular on Venus due to its harsh surface conditions but also in remote Earth regions. This lack of seismic data greatly limits our understanding of Venus’ origin and evolution and Earth’s subsurface. A window of opportunity is offered by the mechanical coupling between the ground and its atmosphere, which enables the seismic energy to be transmitted into the atmosphere as low-frequency acoustic waves carrying information about the seismic source and the subsurface properties. While infrasound is traditionally recorded at ground-based stations, which suffers from the same in-situ deployment limitations as seismic stations, recent studies have demonstrated that balloon platforms can be used to monitor seismic activity from the atmosphere at a low operational cost. Balloon-borne seismology is a new dynamic field and this might be the only viable approach to investigate Venus’ interior. However, inversion methods for balloon-borne infrasound data are not well developed and the coupling between seismic and acoustic waves in realistic media is not fully understood. In this contribution, we will explore the feasibility of detecting seismically-generated infrasound waves on Venus and assess their potential for subsurface velocity inversions through full-waveform numerical simulations.

How to cite: Näsholm, S. P., Brissaud, Q., Solberg, C. M., and Froment, M.: Exploring the feasibility of detecting seismically-generated infrasound waves on Venus using balloon platforms, EGU General Assembly 2024, Vienna, Austria, 14–19 Apr 2024, EGU24-12783, https://doi.org/10.5194/egusphere-egu24-12783, 2024.

EGU24-15128 | Posters on site | AS1.33

Studying the global propagation of gravity waves generated by the Hunga Tonga-Hunga Ha‘apai volcanic eruption from meteor radar observations and the High-Altitude General Mechanistic Circulation Model 

Gunter Stober, Sharon Vadas, Erich Becker, Alan Liu, Alexandre Kozlovsky, and Diego Janches and the HTHH Meteor radar and HIAMCM GW analysis team:

The Hunga Tonga-Hunga Ha‘apai (HTHH) volcanic eruption on 15th January 2022 was an unprecedented event and a unique opportunity to investigate volcanic-caused gravity waves (GW) and their global propagation. In this study, we have combined all the available meteor radar observations and data analysis to identify the HTHH GW in the observations. Our results are compared to model-based wind perturbations from HIAMCM of secondary waves that are forced by the GW model MESORAC using GOES-17 observations. Furthermore, we leverage the GW polarization relations to identify different wave features in the observations and perturbation runs with HIAMCM. There is a remarkable agreement in the observed phase speeds for the eastward and westward GW propagation between the observations and HIAMCM wind perturbations indicating that the mesospheric HTHH GW are explainable by secondary waves generated by breaking of the primary GWs from the eruption. We also shed some light on the importance of the quasi-2-day wave on the HTHH GW propagation.

How to cite: Stober, G., Vadas, S., Becker, E., Liu, A., Kozlovsky, A., and Janches, D. and the HTHH Meteor radar and HIAMCM GW analysis team:: Studying the global propagation of gravity waves generated by the Hunga Tonga-Hunga Ha‘apai volcanic eruption from meteor radar observations and the High-Altitude General Mechanistic Circulation Model, EGU General Assembly 2024, Vienna, Austria, 14–19 Apr 2024, EGU24-15128, https://doi.org/10.5194/egusphere-egu24-15128, 2024.

EGU24-16177 | Orals | AS1.33

Infrasound signals generated by production blasts in a nearby quarry 

Ulrike Mitterbauer, Ewald Brückl, Peter Carniel, and Stefan Mertl

The mobile Infrasound Array ISCO of the Austrian National Data Center at GeoSphere Austria is a part of the Central and Eastern European Infrasound Network (CEEIN). It was installed early 2021 at the Trafelberg, with the premises of the Conrad Observatory in Lower Austria. In 2022 and 2023 a multitude of signals caused by production blasts of a quarry in a distance of 16 km to the array were detected at the station ISCO. Approximately 20 signals were selected, analyzed and compared not only with the data of the seismic station CONA at the Conrad Observatory but also with the recordings of the Macro Seismic Sensor Network, a local low cost sensor network. Blasting parameters were provided by the operator. In addition, video recordings for the blast process and photogrammetric surveys of the blasted rock mass are available for selected events. This data provides information about the source mechanism for the recorded infrasound signals. Analysis of waveform showed that envelopes of the investigated signals are bell-shaped. Values of peak-to-peak amplitudes range between 0.16 and 0.38 Pascal, the half widths of the envelopes vary from 1 to 3 seconds and the frequency range covers 0.25 to 6.35 Hertz. Products of the peak-to-peak amplitudes and half widths show a significant correlation (R2 = 0.6) with the total explosive charge of the blasts.

Data assessment indicates that the change of rock volume caused by the explosion generates the infrasound signal. The videos of the blasting process show an initial expansion of the blasted rock mass, followed by the deposition in front of the blasting area. We interpret the primary increase of volume and the subsequent compaction during the deposition as the source mechanism of the infrasound signal. Numerical modelling of the volume changes during the overall blasting process allows for the calculation of the infrasound source and Green’s functions.

How to cite: Mitterbauer, U., Brückl, E., Carniel, P., and Mertl, S.: Infrasound signals generated by production blasts in a nearby quarry, EGU General Assembly 2024, Vienna, Austria, 14–19 Apr 2024, EGU24-16177, https://doi.org/10.5194/egusphere-egu24-16177, 2024.

EGU24-16288 | ECS | Orals | AS1.33 | Highlight

Impact of Sudden Stratospheric Warmings on the Neutral Density, Temperature and Wind in the MLT region 

Wen Yi, Baozhu Zhou, Xianghui Xue, Jie Zeng, Guozhu Li, Njal Gulbrandsen, and Masaki Tsutsumi

In this study, the neutral density and horizontal wind observed by the four meteor radars, as well as the temperature measured by the Microwave Limb Sounder (MLS) onboard the Aura satellite are used to examine the response of neutral density, wind, and temperature in the MLT region to the stratospheric sudden warmings (SSWs) during 2005 to 2021 in the Northern Hemisphere. The four meteor radars include the Svalbard (78.3°N, 16°E) and Tromsø (69.6°N, 19.2°E) meteor radars at high latitudes and the Mohe (53.5°N, 122.3°E) and Beijing (40.3°N, 116.2°E) meteor radars at middle latitudes.

The superposed epoch analysis results indicate that 1) the neutral density over Svalbard and Tromsø at high latitude increased at the beginning of SSWs and decreased after the zonal mean stratospheric temperature reached the maximum. However, the neutral density over Mohe at midlatitudes decreased in neutral density at the beginning of SSW and increase after the zonal mean stratospheric temperature reached the maximum. 2) The zonal wind at high latitudes show a westward enhancement at the beginning of SSWs and then shows an eastward enhancement after the stratospheric temperature reaches maximum. However, the zonal wind at midlatitudes shows an opposite variation to at high latitudes, with an eastward enhancement at the onset and changing to westward enhancements after the stratospheric temperature maximum. The meridional winds at high and midlatitudes show a southward enhancement after the onset of SSW and then show a northward enhancement after the stratospheric temperature maximum. 3) In general, the temperature in the MLT region decreased throughout SSWs. However, as the latitudes decrease, the temperature cooling appears to lag a few days to the higher latitudes, and the degree of cooling will decrease relatively.

How to cite: Yi, W., Zhou, B., Xue, X., Zeng, J., Li, G., Gulbrandsen, N., and Tsutsumi, M.: Impact of Sudden Stratospheric Warmings on the Neutral Density, Temperature and Wind in the MLT region, EGU General Assembly 2024, Vienna, Austria, 14–19 Apr 2024, EGU24-16288, https://doi.org/10.5194/egusphere-egu24-16288, 2024.

EGU24-17591 | ECS | Posters virtual | AS1.33

Unraveling Gravity Wave Coupling from Surface to Stratosphere above La Réunion's Maïdo Observatory (21°S, 55.5°E) from Doppler and Rayleigh lidar observations 

Samuel Trémoulu, Fabrice Chane Ming, Sergey Khaykin, Mathieu Ratynski, Alain Hauchecorne, Philippe Keckhut, and Christophe Bellisario

The study investigates the vertical wave coupling from the Earth's surface to the middle atmosphere over the Maïdo Observatory at La Réunion (21°S, 55.5°E). Wind velocity and temperature profiles from the ground-based instruments, including the LiWind Doppler Rayleigh-Mie and Li1200 Rayleigh Lidars, in conjunction with other observations (radiosoundings, COSMIC-2 radio-occultation, SABER) and ERA5 reanalysis, are analyzed to characterize gravity waves (GW) and their vertical propagation during the period from November 20th to November 24th, 2023. Notably, a tropospheric subtropical westerly jet manifested above La Réunion during this period and jet instabilities contributed to enhance GW activity in the troposphere. Wavelet methods are employed for denoising purposes and for highlighting multiscale GW from raw wind and temperature profiles. In particular, our analysis reveals the existence of a GW with a 5-km vertical wavelength and approximately a 24-hour period, propagating upward from lower troposphere to the middle atmosphere above La Réunion’s Maïdo Observatory. Among others, the horizontal distribution of this structure surrounding La Réunion is examined using COSMIC-2 radio-occultation and SABER data. In addition, the ERA5 analysis also provides supporting evidence of such structures and GW filtering in the stratosphere.

How to cite: Trémoulu, S., Chane Ming, F., Khaykin, S., Ratynski, M., Hauchecorne, A., Keckhut, P., and Bellisario, C.: Unraveling Gravity Wave Coupling from Surface to Stratosphere above La Réunion's Maïdo Observatory (21°S, 55.5°E) from Doppler and Rayleigh lidar observations, EGU General Assembly 2024, Vienna, Austria, 14–19 Apr 2024, EGU24-17591, https://doi.org/10.5194/egusphere-egu24-17591, 2024.

EGU24-17819 | ECS | Orals | AS1.33

Long range monitoring of explosive volcanoes with IMS infrasound arrays: testing the VIS 

Duccio Gheri, Giacomo Belli, Emanuele Marchetti, Vincent Boulenger, Alexis Le Pichon, Patrick Hupe, Peter Näsholm, and Pierrick Mialle

Detecting and promptly reporting ongoing volcanic eruptions is crucial in supporting Volcanic Ash Advisory Centers (VAACs) in their mission to inform about ash clouds that may endanger aviation. Nevertheless, many active volcanoes lack local monitoring systems. Long-range infrasound monitoring, which holds the potential to detect and notify volcanic explosive events, could offer valuable insights. Numerous studies have already emphasized the utility of long-range infrasound data for this purpose, which led to the proposal of several monitoring approaches. 
The Volcanic Information System (VIS), developed in the framework of the FP7 and H2020 ARISE projects, is one of the most recent approaches for reporting ongoing eruptive events in near real-time based on process data from a single infrasound array. However, uncertainties still persist regarding its effectiveness and reliability. VIS is based on the Infrasound Parameter, IP, a detection algorithm originally developed for local monitoring and later adapted to long-range volcanic infrasound observations.
In this study, we investigate the efficiency of VIS considering 10 years (2010-2019) of data provided by 16 infrasound arrays of the International Monitoring System (IMS) established and provisionally operated by the Comprehensive Nuclear-Test-Ban Treaty Organization (CTBTO). These 16 arrays are located in the most active volcanic regions of the world, encompassing multiple eruptions that range in energy from mild explosions to eruption classified with a VEI (Volcanic Explosivity Index) ≥ 4. To evaluate the reliability of the VIS algorithm and estimate the rate of false alerts (false positives), we compared the notifications provided for the entire period of analysis with reports from the Global Volcanism Program (GVP). 
Our results show that VIS is well designed for long-lasting (> few minutes), large (VEI >3) eruptions, such as Sub-Plinian/Plinian events or highly sustained Vulcanian/Strombolian explosions, while it typically misses single transient events. In terms of ranges, its reliability is strongly azimuth-dependent, with the best results at IMS range (up to 2000 km) achieved under favourable propagation conditions while limited to shorter distances (~1000 km) otherwise. Despite that improvements are possible by azimuthal deflation with the computational of 3D ray-tracing, unresolved ambiguity often remains due to the short angular distances between volcanoes with respect to the array. This issue can be solved by considering volcanic sectors rather than single edifices. In this context, we show that the VIS reliability significantly increases and might provide critical information to the VAACs, automatically and in near real-time, to trigger an independent analysis of ongoing volcanic eruptions.
This study was financially supported by the National Recovery and Resilience Plan, Mission 4 Component 2 - Investment 1.4 - NATIONAL CENTER FOR HPC, BIG DATA AND QUANTUM COMPUTING - funded by the European Union - NextGenerationEU - CUPB83C22002830001.

How to cite: Gheri, D., Belli, G., Marchetti, E., Boulenger, V., Le Pichon, A., Hupe, P., Näsholm, P., and Mialle, P.: Long range monitoring of explosive volcanoes with IMS infrasound arrays: testing the VIS, EGU General Assembly 2024, Vienna, Austria, 14–19 Apr 2024, EGU24-17819, https://doi.org/10.5194/egusphere-egu24-17819, 2024.

EGU24-18155 | ECS | Posters on site | AS1.33 | Highlight

Recent Enhancements of the Volcanic Information System (VIS): An Infrasound-Based Long-Range Volcanic Eruption Notification System 

Rodrigo De Negri, Vincent Boulenger, Duccio Gheri, Patrick Hupe, Philippe Labazuy, Alexis Le Pichon, Emanuele Marchetti, Peter Näsholm, Pierrick Mialle, and Philippe Héreil

Volcanic explosive eruptions produce large amounts of low-frequency (<20 Hz) acoustic waves, called infrasound. Notably, infrasound waves experience minimal attenuation in the atmosphere and can propagate over hundreds to thousands of kilometers, being a valuable resource for remote monitoring of volcanic hazards. This is a core reason why the Comprehensive Nuclear-Test-Ban Treaty Organization (CTBTO) has been tasked with installing and operating the International Monitoring System (IMS) infrasound network, with 53 (of 60 planned) infrasound stations continuously recording to detect any nuclear explosion on Earth.

A software prototype for long-range volcanic eruption notification called VIS (Volcanic Information System) was developed within the Atmospheric dynamics Research InfraStructure in Europe (ARISE) project (FP7, H2020), in collaboration with the Toulouse Volcanic Ash Advisory Centre (VAAC). The VIS main goal is to detect volcanic eruptions at regional to global distances (15-250 km; >250 km) with sustained ash-columns and provide early warnings to mitigate the risk that eruptions pose to civil aviation. Additionally, it can reconstruct the chronology of eruptions, and provide volcanic source constraints (acoustic intensity, gas flow, etc.). The system is designed to integrate the IMS and national infrasound stations to gather all available infrasound detections in the area of interest. The detections rely on the Progressive Multi-Channel Correlation (PMCC) method, which separates coherent infrasound waves (detections) from noise. The VIS is based on the Infrasound Parameter (IP) criterion to establish when an eruption is in course, accounting for atmospheric propagation effects, detection persistency, and amplitude. An operational VIS demonstrator will be deployed on servers of the Observatoire de Physique du Globe de Clermont-Ferrand (OPGC, CNRS-INSU and University Clermont Auvergne) to monitor Mt. Etna and Stromboli in real-time using data from the Amiata infrasound array (AMT) operated by the University of Florence. The data products of the VIS demonstrator will be available through an application programming interface (API) hosted at OPGC, where also an archived catalogue of European volcano eruptions and the real-time data products for AMT will be hosted.

As part of the European Geo-INQUIRE project (HORIZON-INFRA-2021-SERV-01), the VIS will be integrated into the Thematic Core Service Volcano Observation (TCS-VO) of the European Plate Observing System (EPOS). Future developments will include integration into web services such as the HOTVOLC web-GIS interface (OPGC, CNRS-INSU) or the EPOS Data Portal.

How to cite: De Negri, R., Boulenger, V., Gheri, D., Hupe, P., Labazuy, P., Le Pichon, A., Marchetti, E., Näsholm, P., Mialle, P., and Héreil, P.: Recent Enhancements of the Volcanic Information System (VIS): An Infrasound-Based Long-Range Volcanic Eruption Notification System, EGU General Assembly 2024, Vienna, Austria, 14–19 Apr 2024, EGU24-18155, https://doi.org/10.5194/egusphere-egu24-18155, 2024.

EGU24-20574 | ECS | Posters on site | AS1.33

Deep learning methods for modeling infrasound transmission loss in the middle atmosphere 

Alice Janela Cameijo, Alexis Le Pichon, and Quentin Brissaud

Accurate modeling of infrasound transmission losses (TLs) is essential to assess the detection thresholds of the global International Monitoring System (IMS) infrasound network, quantify their spatial and temporal variations, and refine interpretations of signals generated by events of interest. Among the existing tools, the method based on parabolic equations resolution (PEs) enables TLs to be modeled finely, but its computational cost does not currently allow exploration of a large parameter space for real-time prediction, making it inapplicable for operational monitoring applications in the framework of the Comprehensive Test Ban Treaty (CTBT).

To reduce computation times, Brissaud et al. (2022) explored the potential of convolutional neural networks (CNNs) trained on a large set of regionally simulated wavefields (>1000 km distance from the source) to predict TLs with an error of 5 dB compared to PE simulations with negligible computation times ( 0.05 s). However, this new method shows both larger errors in upwind conditions, especially at low frequencies, and causal issues with winds at large distances from the source affecting ground TLs close to the source.

To reduce prediction errors, we introduce a new Deep Learning method, seeking to predict TLs from globally simulated effective sound velocity fields (>4000 km distance), based on a Convolutional Recurrent Neural Network (CRNN) capable of accounting the sequentiality of the propagation phenomenon. This tool can be used to compute global detectability maps of infrasound events in an operational context.

How to cite: Janela Cameijo, A., Le Pichon, A., and Brissaud, Q.: Deep learning methods for modeling infrasound transmission loss in the middle atmosphere, EGU General Assembly 2024, Vienna, Austria, 14–19 Apr 2024, EGU24-20574, https://doi.org/10.5194/egusphere-egu24-20574, 2024.

EGU24-20771 | Posters virtual | AS1.33

Infrasound as a tool for detection and characterization of bolides 

Elizabeth Silber

Very bright meteors, also known as fireballs and bolides, are produced when extraterrestrial objects larger than approximately 10 cm in diameter enter dense regions of the Earth’s atmosphere. Besides the luminous phenomenon, bolides also generate shock waves, which decay to low frequency acoustic waves or infrasound. Depending on initial conditions, atmospheric propagation paths, and the mode of shock production, infrasound emanating from a bolide can be detected by microbarometers hundreds and even thousands of kilometers away. Unlike other sensing modalities that might have geographic (e.g., inaccessible regions), time-of-day (e.g., optical) or other limitations, infrasound can be utilized continuously (day and night) on a global scale. Hence, infrasound can be leveraged towards detection and localization of bolides, as well as estimating their explosive yield. Bolide infrasound detections date back to the early 20th century. On June 30, 1908, an extraterrestrial object exploded over Tunguska, Siberia, generating low frequency acoustic waves that mark the first known instrumentally observed bolide infrasound. During the mid-20th century, ten large bolides were detected by infrasound stations meant for explosion monitoring. Since the mid-1990s, many more events have been detected via infrasound. However, characterization of bolides through infrasound is not without its challenges, mainly because no two bolide events are alike. Systematic studies and data fusion can be leveraged towards efforts to better constrain some key parameters.  

SNL is managed and operated by NTESS under DOE NNSA contract DE-NA0003525.

How to cite: Silber, E.: Infrasound as a tool for detection and characterization of bolides, EGU General Assembly 2024, Vienna, Austria, 14–19 Apr 2024, EGU24-20771, https://doi.org/10.5194/egusphere-egu24-20771, 2024.

EGU24-175 | ECS | Orals | CL2.4

Why do oceanic nonlinearities play a weak role in Extreme El Niño events? 

Fangyu Liu, Jérôme Vialard, Alexey V. Fedorov, Christian Éthé, Renaud Person, and Matthieu Lengaigne

Extreme El Niño events exhibit outsized impacts worldwide and considerably enhance the El Niño Southern Oscillation (ENSO) warm/cold phase asymmetries. While many mechanisms were proposed, no consensus has been reached and the relative role of atmospheric and oceanic processes remains to be illustrated. Here we quantitatively assess the contribution of oceanic nonlinearities through a state-of-the-art oceanic general circulation model, which realistically simulates extreme El Niño related characteristics and the oceanic nonlinear processes responsible for ENSO skewness. An effective way is developed to isolate sea surface temperature (SST) nonlinear response based on paired experiments forced with opposite wind stress anomalies. We demonstrate that the overall oceanic nonlinearities play a marginal role on extreme El Niño amplitude, which largely arises from the compensation between positive contributors from tropical instability waves (TIWs) and nonlinear dynamic heating (NDH) and negative contributors from subsurface processes and air-sea fluxes. The physical processes keep robust when using the other mixing scheme or mixed layer option for the heat budget. Our findings quantitively reveal the subtle contribution of oceanic nonlinearities, yielding strong evidence for the paramount role of atmospheric nonlinearities in shaping extreme El Niño events.

How to cite: Liu, F., Vialard, J., V. Fedorov, A., Éthé, C., Person, R., and Lengaigne, M.: Why do oceanic nonlinearities play a weak role in Extreme El Niño events?, EGU General Assembly 2024, Vienna, Austria, 14–19 Apr 2024, EGU24-175, https://doi.org/10.5194/egusphere-egu24-175, 2024.

EGU24-626 | ECS | Posters on site | CL2.4

Dynamical evolution of ENSO in a warming background: A review of recent trends & future projections 

Sreevathsa Golla, Joël Hirschi, Jennifer Mecking, Adam Blaker, Stephen Kelly, and Robert Marsh

The wide-spread implications of El Niño–Southern Oscillation (ENSO) on global and regional climate necessitates a better understanding of how the underlying interannual dynamics have changed over recent years. Year-to-year changes in ENSO impact terrestrial and marine habitats, water availability, food security and social stability (Santoso et al., 2017). With abundant evidence of a warming climate, it is imperative to understand how a large-scale climatic oscillation such as ENSO is evolving and influencing changes in large-scale atmospheric circulation patterns (Alizadeh et al., 2022; Cai et al., 2021). Furthermore, quantifying the influence of the ocean on changes in this climatic pattern is an interesting and important question to answer. Evaluating the ability of models to appropriately represent the underlying physics and dynamical changes impacting the spatiotemporal extent and the intensity of ENSO is crucial to understanding ocean-climate teleconnections and changes in climatic extremes. In this study, we review and evaluate the representation of ENSO in several high-resolution CMIP6 and HighResMIP models and forced ocean-only simulations focusing on the ability of current state-of-the-art models to represent central equatorial pacific warming and cooling. This evaluation involves looking at the development and propagation of warm temperature anomalies on surface and sub-surface levels in the equatorial Pacific and understanding the differences in simulating surface heat budget and exchange with the overlying atmosphere and the deeper ocean. Surface and sub-surface (up to 200m depth) temperature anomalies in the Niño 3.4 region were calculated from modelled data and were then compared with anomalies from observational and reanalysis temperature datasets (like EN4, ORAS5). We find good agreement in the timing and vertical structure of surface/sub-surface temperature anomalies in the forced model simulations, particularly during strong ENSO years. Moreover, the genesis of sub-surface anomalies and their further propagation to the surface was well simulated in the forced simulations. The vertical coherence of temperature anomalies was relatively more pronounced in forced ocean-only simulations than in coupled high-resolution model runs. Furthermore, we comment on the shortcomings and suggest potential improvements that can be made in the models that could improve the model’s ability to capture ENSO strength and variability.

How to cite: Golla, S., Hirschi, J., Mecking, J., Blaker, A., Kelly, S., and Marsh, R.: Dynamical evolution of ENSO in a warming background: A review of recent trends & future projections, EGU General Assembly 2024, Vienna, Austria, 14–19 Apr 2024, EGU24-626, https://doi.org/10.5194/egusphere-egu24-626, 2024.

EGU24-696 | ECS | Orals | CL2.4

Tropical SST Impacts on the Subtropical Atmospheric Circulation and Regional Precipitation 

Weiteng Qiu, Mat Collins, Adam Scaife, and Agus Santoso

The tropical Pacific Ocean hosts the Earth’s most prominent year-to-year climate fluctuation, the El Niño-Southern Oscillation (ENSO), which exerts strong impacts on remote regions of the globe through atmospheric teleconnection. In this study, we use reanalysis data and Coupled Model Intercomparison Project Phase 6 (CMIP6) historical simulations to investigate the relationship between tropical and subtropical atmospheric circulation, and the tropical SST patterns and regional precipitation.   

We find dynamical relationships between subtropical high intensity, the Hadley and Ferrel Circulation intensity, and the Eady Growth Rate from the reanalysis. A poleward shift of the maximum in Eady Growth Rate is associated with a strengthening of the descending branches of the Ferrel and Hadley Cells, with subtropical troposphere adiabatic warming and an increased intensity and poleward movement of the subtropical highs. Shifts in the poleward Eady Growth Rate are dominated by changes in vertical wind shear which, in turn, are in thermal wind balance with variations and trends in temperature. The mechanism for the intensification of the subtropical highs involves feedbacks from high-frequency transient eddies. Strong North Pacific and South Pacific Subtropical highs are associated with La-Niña conditions. We also show that the mechanisms for interannual variations are similar to those for trends in the highs.

We further analysed the performance of the coupled models in reproducing the trends (1979-2014) of the tropical zonal wind and regional precipitation. The CMIP6 historical simulations do not capture the intensification of trade winds within the Niño 4 region, and they also fail to reproduce the statistically significant precipitation trends over the Southern North America and the Amazon. However, a linear adjustment, based on ENSO teleconnections, can be applied to the coupled models to make the precipitation trends much closer to observations. The relationship between SST patterns and precipitation trends are confirmed by looking at atmosphere-only simulations. This study provides further evidence of the importance of reconciling observed and modelled SST patterns in the tropical Pacific.

How to cite: Qiu, W., Collins, M., Scaife, A., and Santoso, A.: Tropical SST Impacts on the Subtropical Atmospheric Circulation and Regional Precipitation, EGU General Assembly 2024, Vienna, Austria, 14–19 Apr 2024, EGU24-696, https://doi.org/10.5194/egusphere-egu24-696, 2024.

EGU24-1547 | ECS | Orals | CL2.4

Variable-resolution global atmospheric models are sensitive to driving SST in ENSO/IOD-Australian rainfall teleconnections 

Ying Lung Liu, Lisa Alexander, Jason Evans, and Marcus Thatcher

We have investigated the sensitivity of a global climate model to driving sea surface temperatures (SST) in simulating Australian rainfall characteristics, including the El Niño-Southern Oscillation (ENSO)- and Indian Ocean Dipole (IOD)-related rainfall variability. We employed the Conformal Cubic Atmospheric Model (CCAM), a global atmospheric model characterized by variable resolution, CCAM was forced by two SST datasets with different spatiotemporal resolutions: the 0.25° daily Optimum Interpolation Sea Surface Temperature (CCAM_OISST) version 2.1 and the 2° monthly Extended Reconstruction SSTs Version 5 (CCAM_ERSST5). A benchmarking framework was employed to appraise model performance, revealing strong agreement between the simulations and the Australian Gridded Climate Data (AGCD) in climatological rainfall spatial patterns, seasonality, and annual trends. It is noted that both simulations tend to overestimate rainfall amount, with CCAM_OISST exhibiting a larger bias.

Moreover, CCAM's performance in capturing ENSO and IOD correlations with rainfall was assessed during Austral spring (SON) using a novel hit rate metric. The findings underscore that only CCAM_OISST effectively reproduces observed SON ENSO- and IOD-rainfall correlations, achieving hit rates of 86.6% and 87.5%, respectively, in contrast to 52.7% and 41.8% for CCAM_ERSST5. Noteworthy disparities in sea surface temperatures were observed along the Australian coastline between OISST and ERSST5 (the so-called “Coastal Effect”). These disparities may be attributed to spatial interpolation errors arising from the differences in resolution between the model and driving SST. An additional experiment within CCAM, masking OISST with ERSST within a 5° proximity to the Australian continent, underscores the pronounced impact of the “Coastal Effect” on IOD-Australian rainfall simulations. Conversely, its influence on ENSO-Australian rainfall was constrained. Therefore, realistic local SSTs are important if model simulations are to reproduce realistic IOD-rainfall responses over Australia. Additionally, even though an SST product with a longer time span is preferred in simulating IOD-related variability, circumspection is warranted in the analysis of the impact of IOD on Australian rainfall when utilizing climate model output with a substantial discrepancy in spatial resolutions between the model and the driving SST. After showing CCAM’s ability to simulate ENSO- and IOD-rainfall, our future research will involve pacemaker experiments to isolate remaining climate modes and investigate their independent impact on Australian rainfall.

How to cite: Liu, Y. L., Alexander, L., Evans, J., and Thatcher, M.: Variable-resolution global atmospheric models are sensitive to driving SST in ENSO/IOD-Australian rainfall teleconnections, EGU General Assembly 2024, Vienna, Austria, 14–19 Apr 2024, EGU24-1547, https://doi.org/10.5194/egusphere-egu24-1547, 2024.

EGU24-1749 | ECS | Orals | CL2.4

Seasonality of Feedback Mechanisms Involved in Pacific Coastal Niño Events 

Daniel Rudloff, Sebastian Wahl, and Joke Lübbecke

The 2017 Pacific Coastal Niño Event was the strongest of its type. It caused torrential rainfall and devastating flooding in Peru and Ecuador and thus rapidly caught the attention of the scientific community. Multiple studies have been conducted focusing on the causes and consequences of this event. While the strong connection between SST anomalies and local rainfall, especially during boreal spring, is well established, the causes of the extreme warming are still a subject of discussion. In this study, we focus on the seasonality of the effectiveness of mechanisms and feedbacks involved in coastal Niño Events, utilising reanalysis products and historical model simulations from the Flexible Ocean and Climate Infrastructure (FOCI).

The 2017 event stands out due to its strength and timing as it occurred earlier in the year than most other events. We find that the atmospheric conditions during this time of year are very different due to the presence of atmospheric convection which modulates the SST-cloud feedback. Further, the event coincided with the season of strongest wind-driven upwelling. This combination enables a different forcing of a short but strong event. Additional model sensitivity experiments are performed for a better understanding of underlying mechanisms. We show how the same local wind stress forcing acts differently in different seasons, with its strongest impact during the months of strongest entrainment. Events forced by local heat fluxes and wind stress forcing only do not show any subsurface warming, which is found to be the main reason for their rapid decay. Even though the atmospheric response to a coastal warming varies seasonally, without any subsurface forcing, e.g., the events cannot be sustained through atmospheric feedbacks.

How to cite: Rudloff, D., Wahl, S., and Lübbecke, J.: Seasonality of Feedback Mechanisms Involved in Pacific Coastal Niño Events, EGU General Assembly 2024, Vienna, Austria, 14–19 Apr 2024, EGU24-1749, https://doi.org/10.5194/egusphere-egu24-1749, 2024.

EGU24-2133 | Orals | CL2.4

The El Niño Southern Oscillation (ENSO) recharge oscillator conceptual model : past achievements, future prospects. 

Jérôme Vialard and the CLIVAR ENSO conceptual model Working Group

The Recharge Oscillator (RO) is a simple mathematical model of the El Niño Southern Oscillation (ENSO). It is based on two ordinary differential equations that describe the evolution of eastern Pacific sea surface temperature and western Pacific oceanic heat content. These equations are based on physical principles that operate in nature: (i) the air-sea interaction loop known as the Bjerknes feedback, (ii) a delayed negative feedback arising from the slow oceanic response to near-equatorial winds, (iii) state-dependent stochastic forcing from intraseasonal wind variations known as Westerly Wind Events, and (iv) nonlinearities such as those related to deep atmospheric convection and oceanic advection. These elements can be combined in different levels of RO complexity. The RO reproduces the ENSO key properties in observations and climate models: its amplitude, dominant timescale, seasonality, warm/cold phases asymmetries, and the seasonal predictability decrease known as the “spring barrier”. We then discuss the RO in view of timely research questions. First, the RO can be extended to account for pattern ENSO diversity (with events that either peak in the central or eastern Pacific). Second, the core RO hypothesis that ENSO is governed by tropical Pacific dynamics is discussed under the perspective of research suggesting an influence from other basins. Finally, we discuss the RO relevance for studying ENSO response to climate change, and underline that accounting for diversity and better linking the RO parameters to the long term mean state are important research avenues. We end by proposing a list of ten important RO-based research problems.

How to cite: Vialard, J. and the CLIVAR ENSO conceptual model Working Group: The El Niño Southern Oscillation (ENSO) recharge oscillator conceptual model : past achievements, future prospects., EGU General Assembly 2024, Vienna, Austria, 14–19 Apr 2024, EGU24-2133, https://doi.org/10.5194/egusphere-egu24-2133, 2024.

EGU24-2166 | Orals | CL2.4

Mechanisms of Tropical Pacific Decadal Variability 

Antonietta Capotondi and the CLIVAR Tropical Pacific Decadal Variability Working Group

Naturally-occurring variability in the Tropical Pacific at timescales in the 7-70 years range, defined here as Tropical Pacific Decadal Variability (TPDV), modulates ENSO characteristics and its global impacts, and is linked to the rate of change of the globally-averaged surface temperature. Thus, understanding TPDV is integral to robustly separate the forced climate response from internally-generated climate variability and thereby produce reliable projections of the tropical Pacific and global climate. Several oceanic mechanisms have been proposed to explain TPDV, including off-equatorial Rossby wave activity, propagation of spiciness anomalies from the subtropical to the tropical regions, and changes in the strength of the shallow upper-ocean overturning circulations, known as “Subtropical Cells”. However, uncertainties remain on the relative importance of these oceanic mechanisms. Another critical source of uncertainty concerns the nature and origin of the atmospheric forcing of those oceanic processes. Anomalous wind forcing could arise as a response to tropical Pacific sea surface temperature (SST) anomalies, be induced by Pacific extra-tropical influences or result from tropical basin interactions. This presentation critically reviews the nature and relative importance of the oceanic and atmospheric processes driving TPDV. Although uncertain, the tropical oceanic adjustment through Rossby wave activity is likely a dominant source of variability at decadal timescales. A deeper understanding of the origin of TPDV-related winds is a key priority for future research.

How to cite: Capotondi, A. and the CLIVAR Tropical Pacific Decadal Variability Working Group: Mechanisms of Tropical Pacific Decadal Variability, EGU General Assembly 2024, Vienna, Austria, 14–19 Apr 2024, EGU24-2166, https://doi.org/10.5194/egusphere-egu24-2166, 2024.

EGU24-2466 | ECS | Posters on site | CL2.4

Asymmetric Influences of ENSO Phases on the Predictability of North Pacific Sea Surface Temperature 

Zhaolu Hou, Jianping Li, and Yina Diao

The North Pacific sea surface temperature (SST) exerts profound climatic influence. El Niño-Southern Oscillation (ENSO) significantly impacts North Pacific SST, yet the influence from ENSO’s distinct phases on SST predictability remains unclear. Overcoming model limitations, this study assesses SST predictability under diverse ENSO phases using reanalysis. Quantifying predictability limits (PL), results unveil asymmetry: El Niño PL at 5.5 months, La Niña at 8.4 months, and Neutral at 5.9 months. This asymmetry mirrors contemporary multimodal prediction skills. Error growth dynamics reveal La Niña's robust signal strength with slow error growth rate, contrasting El Niño's weaker signal and faster error growth. Neutral exhibits intermediate signal strength and elevated error growth. Physically, predictability signal strength aligns with SST variability, whereas error growth rate correlates with atmospheric-ocean heating anomalies. La Niña, inducing positive heating anomalies, minimizes atmospheric noise impact, resulting in lower error growth. The results are beneficial for improving North Pacific SST predictions.

How to cite: Hou, Z., Li, J., and Diao, Y.: Asymmetric Influences of ENSO Phases on the Predictability of North Pacific Sea Surface Temperature, EGU General Assembly 2024, Vienna, Austria, 14–19 Apr 2024, EGU24-2466, https://doi.org/10.5194/egusphere-egu24-2466, 2024.

EGU24-2993 | Posters on site | CL2.4

El Niño Southern Oscillation and Tropical Basin Interaction in Idealized Worlds 

Dietmar Dommenget and David Hutchinson

In this study we discuss a set of fully coupled general circulation model simulations with idealised geometries of the tropical ocean basins and land with a focus on important characteristics of El Niño Southern Oscillation (ENSO) type of variability and tropical basin interaction. In a series of 15 simulations we first vary the zonal width of a single tropical ocean basin from 50o to 360o, while the rest of the tropical zone is set as land. Further we discuss different simplified configurations of two or three tropical ocean basins. The results show remarkable changes in ENSO characteristics as function of basin width and due to the interaction with other basins that challenge our current understanding of ENSO dynamics. A single basin ENSO has an optimal basin width of about 150o at which ENSO preferred period is the longest, the wind stress feedback is the strongest and variability is stronger than in all other basin widths, expect for the 350o basin. Tropical basin interactions substantially affect ENSO strength, periodicity, feedbacks, non-linearity, spatial scale and pattern. In experiments with two or three identical ocean basins we find highly synchronized ENSO modes that are identical between basins and far more energetic and oscillatory then the single basin modes. The results suggest that tropical basin interaction is an essential part of ENSO. The framework of these experiments can help to better understand the atmospheric dynamics of ENSO and should help to formulate an ENSO theory that incorporates tropical basin interactions as a core element.

How to cite: Dommenget, D. and Hutchinson, D.: El Niño Southern Oscillation and Tropical Basin Interaction in Idealized Worlds, EGU General Assembly 2024, Vienna, Austria, 14–19 Apr 2024, EGU24-2993, https://doi.org/10.5194/egusphere-egu24-2993, 2024.

This study investigates the delayed influence of the Indian Ocean dipole (IOD),  isolated and combined with ENSO, on the early winter North Atlantic-European (NAE) circulation.  Results reveal that a positive IOD induces a strong response in the NAE region during December, leading to a positive North Atlantic Oscillation (NAO)-like pattern. This circulation response also induces a north-south precipitation dipole and a positive temperature anomaly over Europe. The underlying physical mechanism involves a rainfall dipole response to the IOD in the Indian Ocean, persisting into early winter, which triggers a perturbation in the zonal wind within the subtropical South Asian jet (SAJET) region. This initiates a wave-train that propagates northeastward into the North Atlantic. Additionally, a positive IOD enhances transient eddy activity in the European region. Transient eddy forcing provides strong positive feedback to the NAO-like anomaly. While the ECMWF-SEAS5 seasonal hindcast system reproduces the sign of the response, its magnitude is considerably weaker. The possible reasons for this weak response are investigated. The model can reproduce the delayed rainfall dipole response to the IOD, however, the structure of the response shows some differences with the re-analysis. The zonal wind perturbation in ECMWF-SEAS5 in the SAJET region is only about half of the re-analysis magnitude. Moreover, the wave propagation into the stratosphere, as estimated by the 100h𝑃𝑎 eddy heat fluxes, plays a minor role in the re-analysis and the model.

How to cite: Kucharski, F., Raganato, A., and Abid, M. A.: The combined  impact of Indian Ocean dipole and ENSO on the North Atlantic-European circulation during early boreal winter in re-analysis and in the ECMWF-SEAS5 hindcast , EGU General Assembly 2024, Vienna, Austria, 14–19 Apr 2024, EGU24-3110, https://doi.org/10.5194/egusphere-egu24-3110, 2024.

EGU24-3728 | Orals | CL2.4 | Highlight

Super El Niño: A product of three-ocean interactions  

Chunzai Wang, Jiazhen Wang, and Hanjie Fan

El Niño, the largest climate phenomenon on Earth, profoundly influences global climate, weather, ecosystems, and human societies. Super (or extreme) El Niño, in particular, has a significant impact on climate and extreme weather events, but its formation mechanism remains unknown. This presentation utilizes observations, climate model outputs, and coupled model experiments to demonstrate that interactions among the tropical Pacific, Indian, and Atlantic Oceans contribute to the development of super El Niño. The early onset of El Niño imparts sufficient strength in the summer and fall to trigger the Atlantic Niña and Indian Ocean dipole. Subsequently, the Atlantic Niña and Indian Ocean dipole alternately generate additional westerly wind anomalies over the equatorial western-central Pacific, reinforcing El Niño through the Bjerknes feedback and leading to the emergence of super El Niño. This novel mechanism is termed the Indo-Atlantic booster. The findings emphasize super El Niño as a product of three interactions, suggesting that incorporating both the Indian and Atlantic Oceans and their teleconnections with the Pacific will significantly enhance predictions of super El Niño and climate.

How to cite: Wang, C., Wang, J., and Fan, H.: Super El Niño: A product of three-ocean interactions , EGU General Assembly 2024, Vienna, Austria, 14–19 Apr 2024, EGU24-3728, https://doi.org/10.5194/egusphere-egu24-3728, 2024.

The El Niño-Southern Oscillation (ENSO) is one of the most significant integrated interannual oscillations with coupled atmosphere-ocean processes in the tropical Pacific. Most coupled climate models are weak in depicting ENSO asymmetry over equatorial Pacific subsurface. And it is still unclear how the stand-alone ocean model contributes to this bias. In this study, we found that most ocean models from the Ocean Model Intercomparison Project (OMIP), driven by JRA55, underestimate the asymmetry of ENSO in the equatorial western Pacific subsurface. We investigated the primary factors contributing to this bias using composite analysis and diagnostics, and found that the weaker responses in upwelling and stronger responses in downwelling to westerly and easterly wind stress anomalies in the models are mainly responsible for the bias. Furthermore, the underestimation of zonal current variability over western Pacific subsurface, influenced by the gradient of mean state of sea surface height along the equatorial Pacific, leads to an opposite relationship between asymmetry and the zonal component of nonlinear dynamic heating in the western Pacific subsurface comparing to that in the eastern Pacific subsurface. Our study emphasizes the importance of accurately modeling ocean currents to capture the characteristics of ENSO nonlinearity and highlights the significance of nonlinear dynamic responses to external forcing.

How to cite: Li, J. and Yu, Y.: Underestimated ENSO Asymmetry and Zonal Currents over the Equatorial Western Pacific in OMIP2 experiments , EGU General Assembly 2024, Vienna, Austria, 14–19 Apr 2024, EGU24-4811, https://doi.org/10.5194/egusphere-egu24-4811, 2024.

EGU24-4820 | ECS | Posters on site | CL2.4

Synchronous Decadal Climate Variability in the Tropical Central Pacific and Tropical South Atlantic 

Chao Liu, Soon-Il An, Soong-Ki Kim, Malte Stuecker, Wenjun Zhang, Fei-Fei Jin, Jae-Heung Park, Leishan Jiang, Aoyun Xue, Xin Geng, Hyo-Jin Park, Young-Min Yang, and Jong-Seong Kug

The El Niño-Southern Oscillation (ENSO), the strongest interannual climate signal, has a large influence on remote sea surface temperature (SST) anomalies in all three basins. However, a missing map piece in the widespread ENSO teleconnection is the Equatorial Atlantic, where the ENSO footprint on local SST is less clear. Here, using reanalysis data and partially coupled pacemaker experiments, we show that the tropical Pacific SST anomalies, manifested as a Central Pacific (CP) ENSO-like structure, synchronize the tropical South Atlantic (40°W-10°E, 15°S-0°) SST anomalies over the last seven decades, but on a quasi-decadal (8-16 year) timescale. Such a decadal connection is most evident during the boreal spring-summer season, when the CP ENSO-like decadal SST anomalies induce a cooling of the South Atlantic SSTs through atmospheric teleconnections involving both Southern Hemisphere extratropical Rossby waves and equatorial Kelvin waves. The resulting subtropical South Atlantic low-level anticyclonic circulation and easterlies at its northern flank cause local ocean-atmosphere feedback and strengthen the Pacific-to-Atlantic teleconnections. In contrast, the concurrent tropospheric temperature teleconnection is less destructive to the above Atlantic SST response due to the weaker and more west decadal Pacific SST anomalies compared to the interannual ENSO counterpart. Pacific-driven coupled simulations reproduce key observational features fairly well, while parallel Atlantic-driven simulations show little forcing into the Pacific. Our results show that the tropical Central Pacific is an important source of decadal predictability for the tropical South Atlantic SST and the surrounding climate.

How to cite: Liu, C., An, S.-I., Kim, S.-K., Stuecker, M., Zhang, W., Jin, F.-F., Park, J.-H., Jiang, L., Xue, A., Geng, X., Park, H.-J., Yang, Y.-M., and Kug, J.-S.: Synchronous Decadal Climate Variability in the Tropical Central Pacific and Tropical South Atlantic, EGU General Assembly 2024, Vienna, Austria, 14–19 Apr 2024, EGU24-4820, https://doi.org/10.5194/egusphere-egu24-4820, 2024.

EGU24-5122 | Orals | CL2.4

The mechanism of multi-year La Niña events and their impact on spring precipitation over southern China 

Licheng Feng, Guangliang Li, and Ronghua Zhang

By diagnosing and analyzing the frequent occurrence of multi-year La Niña events in recent years, this study reveals the process and mechanism of the Southeast Pacific subsurface cold water triggering multi-year La Niña events. Revealing for the first time the propagation channels and physical processes of multi-year La Niña events triggered by subsurface cold water. In late spring and early summer, the anomalous eastward wind strengthens in the central equatorial Pacific, while abnormal wind stress divergence occurs in the eastern Pacific, which strengthens and spreads westward over time. The weak negative sea surface temperature anomaly in the eastern equatorial Pacific is accompanied by upwelling, providing a source of cold water for the surface. As the season progresses, the weakened equatorial undercurrent and the enhanced southern equatorial current cause cold water to spread westward and accumulate in the central Pacific, thereby extending upwards to expose the sea surface. The exposed cold water causes a cooling of the sea surface and triggers local sea atmosphere interactions, leading to abnormal development of sea atmosphere and ultimately forming a multi-year La Niña events. Composite analyses were performed in this study to reveal the differences in spring precipitation over southern China during multiyear La Niña events from 1901-2015. It was found that there is significantly below normal precipitation in the first boreal spring, but above normal in the second year. The differences in spring precipitation over southern China are correlative to the changes in anomalous atmospheric circulations over the northwest Pacific, which can in turn be attributed to different anomalous sea surface temperatures (SSTs) over the tropical Pacific. During multiyear La Niña events, anomalous SSTs were stronger in the first spring than those in the second spring. As a result, the intensity of abnormal cyclones (WNPC) in the western North Pacific Ocean (WNP) in the first year is stronger, which is more likely to reduce moisture transport, leading to prolonged precipitation deficits over southern China. In contrast, the tropical SST signal is too weak to induce appreciable changes in the WNPC and precipitation over South China in the second year. The difference in SST signals in two consecutive springs leads to different spatial patterns of precipitation in southern China by causing different WNPC.

How to cite: Feng, L., Li, G., and Zhang, R.: The mechanism of multi-year La Niña events and their impact on spring precipitation over southern China, EGU General Assembly 2024, Vienna, Austria, 14–19 Apr 2024, EGU24-5122, https://doi.org/10.5194/egusphere-egu24-5122, 2024.

Understanding external drivers of the El-Nino Southern Oscillation (ENSO) is essential for predicting its future evolution. Orbital precession has been identified as a driver of ENSO variability through both proxy records and climate model simulations, yet the exact mechanics remain unclear. This orbital cycle moderates the seasonal timing of insolation relative to Earth's revolution around the Sun, thereby adjusting the magnitude of the seasonal cycle experienced by each hemisphere. Here, we analyze output from a suite of simulations in NCAR CESM 2.1.1 designed to analyze ENSO under different precessional extremes that significantly modify the meridional temperature gradients and the cold tongue seasonal cycle in the Pacific ocean. Variations in orbital precession have a strong impact on the magnitude, periodicity, and spatial expression of tropical Pacific variability. We find a critical role for both the North and South Pacific Meridional Modes (NPMM and SPMM) in explaining changes in ENSO and decadal variability by propagating subtropical anomalies to the equatorial Pacific along with a shift in the meridional structure of equatorial winds. As an example, when the perihelion of orbit occurs during boreal winter creating a dampened (strengthened) seasonal cycle in the Northern (Southern) Hemisphere, the SPMM becomes significantly more active while the NPMM weakens. This precessional state experiences a shift toward amplified decadal variability and a greater prevalence of Eastern El Nino events in comparison with the other orbital configurations tested. Understanding the precessional control of tropical variability via subtropical pathways may help explain developments that have occurred in the past, as well as future changes which may be observed due to shifts in meridional temperature gradients.

How to cite: Persch, C. and Sanchez, S.: A Critical Role for Meridional Modes in Determining the Equatorial Pacific Response to Orbital Precession, EGU General Assembly 2024, Vienna, Austria, 14–19 Apr 2024, EGU24-6660, https://doi.org/10.5194/egusphere-egu24-6660, 2024.

The winter sea surface temperature (SST) anomalies in the Kuroshio and adjacent regions (KAR), which greatly influence the East Asian–North Pacific–North American climate, are closely related to El Niño–Southern Oscillation (ENSO). This SST relationship between the KAR and the equatorial eastern-central Pacific is widely assumed to be symmetric between El Niño and La Niña. Compared to previous studies indicating the significant and strong KAR warming during El Niño winters, this study indicates weakly negative KAR SST anomalies in the composite analysis for all La Niña events. Positive winter KAR SST anomalies unexpectedly appear in approximately half of La Niña events, which counteract negative SST anomalies in the rest of La Niña events. Further analysis suggests that the impact of La Niña on KAR SST anomalies is modulated by the East Asian winter monsoon (EAWM) during early winter. The weaker-than-normal EAWM offsets the anomalous northeasterly winds in the KAR induced by La Niña and then reinforces the KAR warming through warm oceanic advection. As for strong EAWM, it enhances the northeasterly winds to the west of an anomalous Philippine Sea cyclone associated with La Niña, leading to KAR cooling with more latent heat flux loss from the ocean and anomalous cold oceanic advection. Additionally, when the EAWM is independent of ENSO and is associated with the western Pacific pattern, it also can exhibit a pronounced influence on the KAR SST anomalies via the major processes of surface latent flux and horizontal heat advection in the ocean, accompanied by a change in Kuroshio transport.

How to cite: Chen, S., Chen, J., Wang, X., and Xiao, Z.: Varying Relationship between La Nin a and SST Anomalies in the Kuroshio and Adjacent Regions during Boreal Winter: Role of the East Asian Winter Monsoon, EGU General Assembly 2024, Vienna, Austria, 14–19 Apr 2024, EGU24-7307, https://doi.org/10.5194/egusphere-egu24-7307, 2024.

EGU24-7849 | ECS | Orals | CL2.4

On the decadal changes of Atlantic-Pacific interactions and the effects of external forcing 

Soufiane Karmouche, Evgenia Galytska, Gerald A. Meehl, Jakob Runge, Katja Weigel, and Veronika Eyring

We show the results of a study investigating the predominant role of external forcing in steering Atlantic and Pacific ocean variability during the latter half of the 20th (and early 21st) century. By employing the PCMCI+ causal discovery method, we analyze reanalysis data, pacemaker simulations, and a CMIP6 pre-industrial control run. The results reveal a gradual (multi)decadal change in the interactions between major modes of Atlantic and Pacific interannual climate variability from 1950 to 2014. A sliding window analysis identifies a diminishing El Niño-Southern Oscillation (ENSO) effect on the adjacent Atlantic basin through the tropical route, coinciding with the North Atlantic trending toward and maintaining an anomalously warm state after the mid-1980s. In reanalysis, this is accompanied by the prevalence of an extra-tropical pathway connecting ENSO to the tropical Atlantic. Meanwhile, causal networks from reanalysis and pacemaker simulations indicate that increased external forcing might have contributed to strengthening ENSO’s opposite sign response to tropical Atlantic variability during the 1990s and early 21st century, where warming tropical Atlantic sea surface temperatures induced La Niña-like easterly winds in the equatorial Pacific. The analysis of the pre-industrial control run underscores that modes of natural climate variability in the Atlantic and Pacific influence each other also without anthropogenic forcing. Modulation of these interactions by the long-term states of both basins is observed. This work demonstrates the potential of causal discovery for a deeper understanding of mechanisms driving changes in regional and global climate variability.


Karmouche, S., Galytska, E., Meehl, G.A., Runge, J.,Weigel, K.,& Eyring,V. (2023b, in review). Changing effects of external forcing on Atlantic-Pacific interactions. EGUsphere, 2023, 1–36. https://doi.org/10.5194/egusphere-2023-1861

How to cite: Karmouche, S., Galytska, E., Meehl, G. A., Runge, J., Weigel, K., and Eyring, V.: On the decadal changes of Atlantic-Pacific interactions and the effects of external forcing, EGU General Assembly 2024, Vienna, Austria, 14–19 Apr 2024, EGU24-7849, https://doi.org/10.5194/egusphere-egu24-7849, 2024.

Processes leading to the onset and development of an El Niño event in the tropical Pacific remain elusive. Observed data and Ocean General Circulation Model (OGCM) simulations are used to reveal a well-defined pattern of sea surface temperature (SST) perturbations along the mean North Equatorial Countercurrent (NECC) pathways in association with the onset and evolution of some El Niño events. The OGCM-based sensitivity experiments are conducted to illustrate how a warm SST anomaly (SSTA) on the equator can result from a thermal forcing that is prescribed north of 10°N, similar to observed SST anomalies in December 1988. Within approximately one year, the imposed SST anomaly north of 10°N tends to be transported to the dateline region on the equator by the mean ocean circulation in the western Pacific (the low-latitude western boundary current (LLWBC) and the NECC). In due course, an upper-layer ocean warming is generated off the equator at 6-10°N and then on the equator, which acts to induce a westerly wind anomaly response; a simple statistical atmospheric wind stress model is then used to depict an expected westerly wind response. These resultant SST and surface wind perturbations can couple together over the western tropical Pacific, forming air-sea interactions and setting up a stage for El Niño onset. As such, this pathway mechanism can reasonably well explain the appearance of a warm SST anomaly on the equator in the dateline region and the corresponding development of westerly wind anomalies over the western Pacific in association with El Niño onset.


How to cite: Gao, C. and Zhang, R.: A Mechanism from Pathway Perspective for the Generation of a Warm SST Anomaly in the Western Equatorial Pacific, EGU General Assembly 2024, Vienna, Austria, 14–19 Apr 2024, EGU24-8442, https://doi.org/10.5194/egusphere-egu24-8442, 2024.

EGU24-8581 | ECS | Posters on site | CL2.4 | Highlight

Increased predictability of extreme El Niño from decadal interbasin interaction 

Xuan Ma, Rizhou Liang, Xiaosong Chen, Fei Xie, Jinqing Zuo, Cheng Sun, and Ruiqiang Ding

Predicting extreme El Niño–Southern Oscillation (ENSO) events remains a formidable task. Utilizing eigen microstates (EMs) of complex systems, we elucidate the interplay of two key sea surface temperature (SST) anomaly modes, the newly identified North Atlantic–west Pacific Mode (NAPAM) and discovered Victoria Mode (VM). Our findings demonstrate that a cold NAPAM phase coupled with a positive VM phase markedly elevates the probability of extreme El Niño events; NAPAM's decadal variability serves as a key modulator of extreme El Niño events' frequency. Our empirical model, capitalizing on these modes, achieves robust forecasts with a 6–8 month lead time and boasts a 0.73 correlation with the observed ENSO index in hindcasts. Notably, the model precisely forecasts the intensity of four landmark extreme El Niño episodes: 1982/1983, 1987/1988, 1997/1998, and 2015/2016. Our findings offer promising avenues for refining ENSO predictive frameworks and deepen our understanding of the key climatic drivers.

How to cite: Ma, X., Liang, R., Chen, X., Xie, F., Zuo, J., Sun, C., and Ding, R.: Increased predictability of extreme El Niño from decadal interbasin interaction, EGU General Assembly 2024, Vienna, Austria, 14–19 Apr 2024, EGU24-8581, https://doi.org/10.5194/egusphere-egu24-8581, 2024.

EGU24-9096 | ECS | Orals | CL2.4 | Highlight

Effects of Niño1+2 and Niño3.4 ENSO Events over Euro-Mediterranean Climate Variability  

Ece Yavuzsoy-Keven, Yasemin Ezber, and Omer Lutfi Sen

El Niño Southern Oscillation (ENSO) is a climate phenomenon that affects the atmospheric circulation of the Northern Hemisphere and causes short-term variability in temperature and precipitation patterns. ENSO impacts over the Euro-Mediterranean (EM) region are commonly defined by using Niño3.4 and Niño3 indices. However, some recent studies indicate that the ENSO event represented by both Niño1+2 and Niño3.4 indices (shared ENSO) is more effective over EM region climate.

In this study, we examine the response of the EM climate to ENSO events detected by Niño1+2 and Niño3.4 regions. NCEP/NCAR Reanalysis surface air temperature, precipitation, 500 hPa geopotential height, 850 hPa wind, and 300 hPa zonal wind datasets and SST-based ENSO indices from ERSSTv4 were used in the analysis for boreal winters between 1950 and 2019. For composite analysis, we separated ENSO events as El Niño and La Niña according to those observed in Niño1+2, Niño3.4, and both regions. We also tried to understand if there is any relation between ENSO and teleconnection patterns such as NAO, East Atlantic (EA), Trough Displacement Index for the Mediterranean Trough (TDI_MedT), and East Atlantic/Western Russia (EAWR) by using the cross-correlation analysis. Additionally, investigate the winter (December, January, February, DJF) ENSO’s possible lagged impacts on the teleconnection patterns in the subsequent seasons, spring (March-April-May, MAM), summer (June-July-August, JJA), and autumn (September-October-November, SON).

The major finding of this study is that the shared ENSO event is more effective over the EM climate than the ENSO events detected only by Niño1+2 or Niño3.4 indices. Further, it is also important for the predictability of the EM climate. In the shared El Niño event, the Middle East and much of North Africa tend to become colder than climatology while Europe becomes warmer. The anticyclonic wind anomaly over western Europe causes drier air in southern Europe and wetter air in northern Europe. The shared El Niño event also modulates the westerly flows at the upper troposphere. The westerly flow accelerates over high latitudes while decelerates over European mid-latitudes, causing northern Europe to be wetter and the Mediterranean Basin to be drier. The cross-correlation analysis including all SST-based ENSO indices and teleconnection indices that the EA index has a significant correlation with the Niño1+2 index across all seasons.

How to cite: Yavuzsoy-Keven, E., Ezber, Y., and Sen, O. L.: Effects of Niño1+2 and Niño3.4 ENSO Events over Euro-Mediterranean Climate Variability , EGU General Assembly 2024, Vienna, Austria, 14–19 Apr 2024, EGU24-9096, https://doi.org/10.5194/egusphere-egu24-9096, 2024.

EGU24-9334 | ECS | Orals | CL2.4

Characterizing Nonlinearities in ENSO Dynamics Using Hybrid Machine Learning Models 

Jakob Schlör, Jannik Thuemmel, Antonietta Capotondi, Matthew Newman, and Bedartha Goswami

Event-to-event differences of the El Niño Southern Oscillation (ENSO) result in different patterns of extreme climate conditions globally, which requires ENSO forecasts that accurately predict both the likelihood and the type of an event. One question regarding predictable ENSO dynamics is the extent to which they may be captured by multivariate linear dynamics and, relatedly, whether predictable nonlinearities must be accounted for or may be treated stochastically.

In this study, we combine Recurrent Neural Networks with the Linear Inverse Model (LIM) to assess the role of predictable nonlinearities and non-Markovianity in the evolution of tropical Pacific sea surface temperature anomalies. We observe that modeling nonlinearities significantly enhances the forecast accuracy, particularly in the western tropical Pacific within a 9 to 18-month lag time. Our results indicate that the asymmetry of warm and cold events is the main source of the nonlinearity. Moreover, we demonstrate that the predictability of the Hybrid-model can be reliably inferred from the theoretical skill of the LIM whereas a similar assessment is not possible in pure deep learning models.

How to cite: Schlör, J., Thuemmel, J., Capotondi, A., Newman, M., and Goswami, B.: Characterizing Nonlinearities in ENSO Dynamics Using Hybrid Machine Learning Models, EGU General Assembly 2024, Vienna, Austria, 14–19 Apr 2024, EGU24-9334, https://doi.org/10.5194/egusphere-egu24-9334, 2024.

The interannual variability of boreal summer sea surface temperature (SST) in the tropical Atlantic displays two dominant modes, the Atlantic zonal mode highlighting SST variations in the equatorial–southern tropical Atlantic (ESTA) region and the northern tropical Atlantic (NTA) mode focusing on SST fluctuations in the NTA region except in the Gulf of Guinea. Observational evidence indicates that both the boreal summer ESTA and NTA warming are accompanied by a pair of anomalous low-level anticyclones over the western tropical Pacific, and the NTA-related anticyclone is more obvious than the ESTA-related one. Both atmosphere-only and partially coupled experiments conducted with the Community Earth System Model version 1.2 support the observed NTA–Pacific teleconnection. In contrast, the ESTA-induced atmospheric circulation response is negligible over the tropical Pacific in the atmosphere-only experiments, and although the response becomes stronger in the partially coupled experiments, obvious differences still exist between the simulations and observation. The ESTA-induced atmospheric circulation response features an anomalous low-level cyclone over the western tropical Pacific in the partially coupled experiments, opposite to its observed counterpart. It is found that the ESTA warming coincides with significantly La Ni ñ a–like SST anomalies in the central–eastern equatorial Pacific,the influence of which on the tropical atmospheric circulation is opposite to that of the ESTA warming, and therefore contributes to difference between the ESTA-related simulations and observation. Moreover, the cold climatological mean SST in the ESTA region is unfavorable to enhancing the ESTA–Pacific teleconnection during boreal summer

How to cite: Ren, H.: The Impact of Tropical Atlantic SST Variability on the Tropical Atmosphere duringBoreal Summer, EGU General Assembly 2024, Vienna, Austria, 14–19 Apr 2024, EGU24-9772, https://doi.org/10.5194/egusphere-egu24-9772, 2024.

EGU24-10200 | ECS | Orals | CL2.4 | Highlight

Roles of Tropical-Pacific Interannual–Interdecadal Variability in Forming the Super Long La Niña Events 

Run Wang, Hong-Li Ren, and Minghong Liu

The super long La Niña phenomenon, which has an extremely long duration, like the recent 2020–2023 La Niña event, is less concerned than the super El Niño. In this study, we identify five super long La Niña events after 1950 and investigate roles of the 2–3-year quasi-biennial (QB) and 3–7-year low-frequency (LF) ocean–atmosphere coupled processes of El Niño–Southern Oscillation (ENSO), and the interdecadal background in forming the basin-scale prolonged negative sea surface temperature anomalies (SSTAs) during these events. We group the five events into the thermocline-driven type (the 1983–1986 and 1998–2002 events) and the wind-driven type (the 1954–1957, 1973–1976, and 2020–2023 events). The former inherited a sufficiently discharged state of equatorial upper-ocean heat content from the preceding super El Niño and dominated by the thermocline feedback, leading to a LF oceanic dynamical adjustment to support the maintenance of negative ENSO SSTAs. The latter were promoted by the relatively more important zonal advective feedback and Ekman pumping feedback and deeply affected by a strongly negative equatorial zonal wind stress background state that sourced from the strong negative phase of the Interdecadal Pacific Oscillation. Besides, the QB ENSO variability with casual contributions during these events is less important. Results show that both the LF ENSO variability and the interdecadal Pacific background could assist to the genesis of such elongated La Niñas.

How to cite: Wang, R., Ren, H.-L., and Liu, M.: Roles of Tropical-Pacific Interannual–Interdecadal Variability in Forming the Super Long La Niña Events, EGU General Assembly 2024, Vienna, Austria, 14–19 Apr 2024, EGU24-10200, https://doi.org/10.5194/egusphere-egu24-10200, 2024.

EGU24-11374 | ECS | Orals | CL2.4 | Highlight

The El Niño response to tropical volcanic eruptions and geoengineering  

Clarissa Kroll and Robert Jnglin Wills

Following tropical volcanic eruptions and in response to geoengineering efforts in climate models, the occurrence of El Niño is notably enhanced. However, the precise mechanisms leading to the preference of the El Niño state remain a subject of ongoing debate. In this study, we explore the El Niño response within the context of stratospheric aerosol injection experiments using the Community Earth System Model version 1, with the Whole Atmosphere Community Climate Model atmospheric component (CESM1 WACCM). Our investigation is centered around the Stratospheric Aerosol Geoengineering Large Ensemble Dataset encompassing three distinct scenarios: a simulation of the RCP8.5 scenario as baseline climate change scenario, a geoengineering scenario, in which surface temperature increases are completely compensated and a scenario focusing solely on the stratospheric heating derived from the geoengineering approach. Our analysis reveals that the El Niño response is primarily linked to the heating in the tropical tropopause layer and lower stratosphere, and notably, it occurs independently of tropospheric cooling effects. We explain the increased occurrence of El Niño after volcanic eruptions and simulated geoengineering interventions by a slow down of the tropical atmospheric circulation, which is caused by increases in gross moist stability due to aerosol heating in tropical tropopause layer.

How to cite: Kroll, C. and Jnglin Wills, R.: The El Niño response to tropical volcanic eruptions and geoengineering , EGU General Assembly 2024, Vienna, Austria, 14–19 Apr 2024, EGU24-11374, https://doi.org/10.5194/egusphere-egu24-11374, 2024.

EGU24-11643 | ECS | Orals | CL2.4

Dynamical systems analysis of the "El Niño Southern Oscillation" phenomenon  

Julia Mindlin, Gabriel B Mindlin, and Pedro di Nezio

Since the 1980s, when the World Meteorological Organization launched the TOGA (Tropical Ocean-Global Atmosphere Program) program, great advances have been made in understanding ENSO by studying a hierarchy of models (Dijkstra, 2005). At the most complex end of this hierarchy are the Global Climate Models (GCMs), with which simulations of the entire climate system are performed, while at the most elementary end are the simple dynamical models that involve the minimum number of modes necessary to generate the phenomenon and therefore represent the dominant physical processes. Conceptually, two different ways of understanding the irregular oscillations of ENSO are still valid: it could be either a self-sustained oscillator of a chaotic nature or a stable mode excited by atmospheric noise. 

In this work, we use methods from complex systems to revisit the ideas regarding two plausible dynamics of ENSO. We ask if the dynamics can be better represented as a self-sustained oscillator of a chaotic nature or a stable mode excited by noise. For this, we analyzed the sea surface temperatures (SSTs), one of the output variables of the simulations generated with GCMs, the most complex simulations available from the extended system. This temperature field averaged in a particular region of the eastern equatorial Pacific (Niño 3.4) gives rise to a temporal signal widely used for ENSO monitoring and as a proxy for the study of the oscillation. In order to analyze the dynamics of the system, we reconstruct the phase space from an embedding of the temporal signal. We find that three modes are enough to recover the ENSO dynamics of the extended system, in principle of infinite dimension. Our conceptual model is based on the existence of a self-sustaining oscillation with a critical slowing down in phase space; that is, the system traverses a region of phase oscillation with a critical slowing down in phase space; that is, the system traverses a region of phase space more slowly, and includes a periodic forcing that gives rise to chaotic behavior for certain values of the parameters. We validate the model with a topological and statistical analysis of the periodic orbits in the system and, in addition, we show that the complexity of the signal is better represented as a self-sustained oscillator of a chaotic nature than as a stable mode excited by noise (Wang, 2018).

Dijkstra, HA, Nonlinear Physical Oceanography, volume 28. Springer, 2nd revised edition, 2005.

Wang C., A review of ENSO theories, National Science Review, Volume 5, Issue 6, November 2018, Pages 813–825

How to cite: Mindlin, J., Mindlin, G. B., and di Nezio, P.: Dynamical systems analysis of the "El Niño Southern Oscillation" phenomenon , EGU General Assembly 2024, Vienna, Austria, 14–19 Apr 2024, EGU24-11643, https://doi.org/10.5194/egusphere-egu24-11643, 2024.

EGU24-12873 | ECS | Orals | CL2.4

The Dynamics and Propagation of Westerly Wind Bursts 

Inko Bovenzi, Minmin Fu, and Eli Tziperman

Westerly wind bursts (WWBs), a westerly anomaly in equatorial winds in the Pacific, occur before every major El Niño event, yet major aspects of their mechanism are still not fully understood. Proposed mechanisms include cyclones approaching the equator, eastern-propagating convective heating, and wind-induced surface heat exchange, which amplifies WWBs near their peaks (Fu and Tziperman, 2019). To better understand WWB dynamics, we study their composite momentum budget using reanalysis and examine the role of convective heating and other factors. We find that many WWBs are not directly explained by nearby tropical cyclones or convective precipitation. We study their momentum budget before, during, and after the peak of the event, finding different balances at each stage. A comparison of the deduced balance to that in atmospheric general circulation climate models should add confidence in their ability to simulate this important factor in El Niño's development.

How to cite: Bovenzi, I., Fu, M., and Tziperman, E.: The Dynamics and Propagation of Westerly Wind Bursts, EGU General Assembly 2024, Vienna, Austria, 14–19 Apr 2024, EGU24-12873, https://doi.org/10.5194/egusphere-egu24-12873, 2024.

EGU24-12936 | Orals | CL2.4

A Regime View of ENSO Flavors Through Clustering in CMIP6 Models 

Pradeebane Vaittinada Ayar, David Battisti, Camille Li, Martin King, Mathieu Vrac, and Jerry Tjiputra

El Niño-Southern Oscillation (ENSO) flavors in the tropical Pacific are studied from a regime perspective. Five recurring spatial patterns or regimes characterizing the diversity of ENSO are established using a clustering approach applied to the HadISST sea surface temperature (SST) anomalies. Compared to previous studies, our approach gives a monthly characterization of the diversity of the warm and cold phases of ENSO established from observations but commonly applied to models and observations. Two warm (eastern and central El Niño), two cold (basin wide and central La Niña) and a neutral reference regimes are found. Simulated SST anomalies by the models from the latest Coupled Model Intercomparison Project Phase 6 are then matched to these reference regimes. This allows for a consistent assessment of the skill of the models in reproducing the reference regimes over the historical period and the change in these regimes under the high-warming Shared Socio-economic Pathway (SSP5.8.5) scenario. Results over the historical period show that models simulate well the reference regimes with some discrepancies. Models simulate more intense and spatially extended ENSO patterns and have issues in capturing the correct regime seasonality, persistence, and transition between regimes. Some models also have difficulty simulating the frequency of regimes, the eastern El Niño regime in particular. In the future, both El Niño and central La Niña regimes are expected to be more frequent accompanied with a less frequent neutral regime. The central Pacific El Niño and La Niña regimes are projected to increase in amplitude and variability. 
Reference:
Vaittinada Ayar, P.Battisti, D. S.Li, C.King, M.Vrac, M., & Tjiputra, J. (2023). A regime view of ENSO flavors through clustering in CMIP6 modelsEarth's Future11, e2022EF003460. https://doi.org/10.1029/2022EF003460

How to cite: Vaittinada Ayar, P., Battisti, D., Li, C., King, M., Vrac, M., and Tjiputra, J.: A Regime View of ENSO Flavors Through Clustering in CMIP6 Models, EGU General Assembly 2024, Vienna, Austria, 14–19 Apr 2024, EGU24-12936, https://doi.org/10.5194/egusphere-egu24-12936, 2024.

In recent decades, a growing body of research has highlighted the intricate interplay between the El Niño-Southern Oscillation (ENSO) and various climatic patterns across multiple ocean basins. Several studies have highlighted the significance of the South Atlantic Subtropical Dipole (SASD) and its association with ENSO.

This investigation examines the interaction between SASD and ENSO, focusing on the critical role of the South Pacific High in these dynamics. Our study proposes that the onset of the South American Monsoon (SAM) plays a crucial role in this connection, challenging the traditional perception of land's passive role in tropical interbasin interactions.

We identified two eastern Pacific and two central Pacific ENSO precursors from SAM onset period using ERA5 reanalysis data along with 1200-year CESM2 PI run. Applying partial linear regressions revealed the following patterns: initially, warm Southwestern Tropical Atlantic (SWTA) and basin-wide low pressure in the equatorial and subequatorial Atlantic, evolving into cold Southeastern Tropical Pacific (boreal spring); then, negative South Pacific Oscillation (SPO) during the following boreal summer, culminating in La Niña conditions between 12 and 15 months later (SON and DJF of the following year).

We hypothesize that anomalous upper-level divergent monsoonal circulation acts as a bridge connecting the two ocean basins. Ekman dynamics arguably transfers and amplify atmospheric signals from the SAM and SPO to the equatorial Pacific Ocean.

Random Forest and Support Vector Machines for regression analysis yielded results consistent with those from the linear model; superior skill was noted in La Niña prediction compared to under-predicted El Niño events.

Moving forward, we intend to construct causal networks to disentangle the complex interplays described herein while ensuring independence from other known teleconnections; alternatively, we plan to design appropriate numerical experiments using coupled GCMs.

This study's preliminary results present exciting opportunities to enhance early ENSO prediction by considering the impact of the South American Monsoon on aligning the variability of the tropical South Atlantic and South Pacific oceans.

How to cite: Bellacanzone, F. and Bordoni, S.: Enhancing early ENSO prediction: how the South American Monsoon onset connects the South Atlantic Subtropical Dipole and the South Pacific Oscillation, EGU General Assembly 2024, Vienna, Austria, 14–19 Apr 2024, EGU24-13140, https://doi.org/10.5194/egusphere-egu24-13140, 2024.

EGU24-13513 | ECS | Posters on site | CL2.4 | Highlight

Impact of summer-persistent ENSO events on the global climate and the occurrence of extreme weather events 

Anna Schultze, Zhengyao Lu, Qiong Zhang, Minjie Zheng, and Thomas Pugh

El Niño Southern Oscillation (ENSO), the most prominent climate variability in the tropical Pacific Ocean, significantly influences global climate and weather patterns, impacting ecosystems and societies worldwide. Our study focuses on the underexplored aspect of summer-persistent ENSO events, their global climatic impacts, and their role in triggering extreme weather occurrence.

ENSO events follow a distinct cycle, with El Niños more tightly bound to this cycle, while some La Niñas tend to fall below the ENSO threshold during the summer and then re-intensify in the following winter, resulting in multi-year La Niña events. However, there have been cases of slower ENSO decay, where sea surface temperature anomalies (SSTA) exceeding the ENSO threshold values into the northern-hemisphere summer, have been observed. The 2018/2019 El Niño, persisting until July, is a recent example, linked to significant events like the severe Australian bushfires in 2020 and the longest heatwave in history in the North Pacific in 2019. The El Niño was followed by a triple-dip La Niña, linked to extreme weather events in Africa, Australia and the United States. This highlights the importance of understanding the summer-persistent ENSO events.

Our study is structured based on three aims: identifying past summer-persistent ENSO events, assessing their impacts on global temperature and precipitation patterns, and examining their linkage to extreme weather events. Utilizing the Oceanic Niño Index calculated from the extended reconstructed sea surface temperature (ERSSTv5), we categorised ENSO events into conventional, summer-persistent, and multi-year summer-persistent types. The latter two were defined by events in which the Oceanic Niño Index exceeded the ENSO threshold until June for one or two consecutives summer seasons, respectively. We identified 12 summer-persistent ENSO events since 1940, separated into four summer-persistent El Niños, five summer-persistent La Niñas, and three multi-year summer-persistent La Niñas. Analyzing ERA5 reanalysis composites of 2-m temperature and precipitation, we compared the climatic impacts of these ENSO variants across winter and summer. This study advances our understanding of the climatic consequences of summer-persistent ENSO events, providing insights crucial for developing mitigation strategies for their impacts on global climate and extreme weather occurrences.

How to cite: Schultze, A., Lu, Z., Zhang, Q., Zheng, M., and Pugh, T.: Impact of summer-persistent ENSO events on the global climate and the occurrence of extreme weather events, EGU General Assembly 2024, Vienna, Austria, 14–19 Apr 2024, EGU24-13513, https://doi.org/10.5194/egusphere-egu24-13513, 2024.

The El Niño Southern Oscillation (ENSO) dominates tropical climate variability. While it is defined by alterations in sea surface temperatures in the eastern and central tropical Pacific, ENSO influences temperature and precipitation patterns across the globe through a network of atmospheric and oceanic teleconnections. Whether ENSO is controlled or responds to external climate factors has long remained elusive, in large part due to the lack of paleoclimate evidence of tropical variability during different climate states. Here we utilize the geochemical signatures of planktic foraminifera to reconstruct eastern and central tropical variability during the last glacial maximum (LGM), some 20-25,000 years ago. Climate conditions during the LGM were very different, featuring atmospheric CO2 concentrations, global temperatures, and sea level all substantially lower than today. However, precessional forcing, thought to be a potential control on ENSO expression, was similar to modern orbital configuration. Our reconstruction spans the central and eastern tropical Pacific during this key time frame and assesses how the patterns of variability - or ENSO ‘flavors’ - may have changed. We compare our spatial reconstructions of variability to changes in the equatorial Pacific thermocline and test hypotheses of thermocline control of ENSO. We explore the evolution of the eastern and central Pacific thermocline, and how their relationship may be an additional factor in influencing ENSO expression. Our results provide key insights into the evolution and history of tropical variability under differing background climate states, providing context for modern ENSO behavior and prediction.

How to cite: Rustic, G., Rosenheim, E., Slotter, J., and Hill, K.: Reconstructing Tropical Pacific Variability During the Last Glacial Maximum Using Individual Foraminifera: An Investigation of ENSO Flavors , EGU General Assembly 2024, Vienna, Austria, 14–19 Apr 2024, EGU24-13790, https://doi.org/10.5194/egusphere-egu24-13790, 2024.

EGU24-13992 | ECS | Orals | CL2.4

Oceans outside the tropical Pacific influence ENSO when ENSO predictability is poor 

Jemma Jeffree, Nicola Maher, Dillon Amaya, and Dietmar Dommenget

Various studies demonstrate that the El Niño Southern Oscillation is influenced by each of the Atlantic Ocean, Indian Ocean, extra-tropical Pacific Ocean and Southern Ocean. However, there is no cohesive picture of the relative importance of different ocean basins. Furthermore, even when considering only one basin, there is disagreement over the strength of it's influence on ENSO. Differences between previous studies likely arise from differences in their design. Untangling interbasin influences is non-trivial, due to  the need to distinguish between correlation and causation. Investigating these interbasin interactions is additionally complicated by model bias, and computational expense limiting the breadth of model studies.

We investigate the interbasin influences on ENSO from a new angle. We use analogue forecasting instead of initialised ensemble forecasting: we select analogues similar to some target state from a long model run (e.g. pre-industrial control or single model initial-condition large ensemble), rather than initialising from that target state. The analogue forecasts, made by following the selected analogues through time in the model run, have been previously evaluated to show similar skill to an initialised forecast. These forecasts are much faster than traditional initialised forecasts, allowing us to explore multiple models, lead times and initialisation months. We explore whether these analogue forecasts are improved by considering information from regions outside the tropical Pacific, and then infer how these regions contribute to ENSO evolution.

When ENSO forecasts are skilful, before the Spring Predictability Barrier, outside influences have little impact on ENSO forecast skill. When ENSO forecasts cross the Spring Predictability Barrier and are poor, then considering information from outside the Tropical Pacific Ocean improves forecasts. We conclude that when ENSO is in a growth phase it dominates the climate system, but in a decay phase ENSO is influenced by regions outside the tropical Pacific. This behaviour is consistent across at least two global coupled climate models, despite large variability in the way these models represent ENSO's seasonal evolution. We intend to expand this investigation to more models, and to compare the impacts of verifying forecasts against observational or model data.

How to cite: Jeffree, J., Maher, N., Amaya, D., and Dommenget, D.: Oceans outside the tropical Pacific influence ENSO when ENSO predictability is poor, EGU General Assembly 2024, Vienna, Austria, 14–19 Apr 2024, EGU24-13992, https://doi.org/10.5194/egusphere-egu24-13992, 2024.

EGU24-15294 | ECS | Orals | CL2.4

Towards a better understanding of ENSO diversity: a paleoclimate perspective 

Isma Abdelkader Di Carlo, Pascale Braconnot, Matthieu Carré, Mary Elliot, and Olivier Marti

El Niño-Southern Oscillation (ENSO) events are hard to put in one category because they differ in intensity, spatial pattern, and temporal evolution. Studies have characterized events into two main categories: central Pacific (CP) and eastern Pacific (EP) events. The indicators used to compute EP and CP events are varied, from area-averaged regions to Empirical Orthogonal Function (EOF) analysis. In the recent climatic period, they all show similar results. However, future projections show differing results when using two different methods of computing EP and CP events. Since the observational period is too short, we use paleoclimate reconstructions, which provide unique and quantitative measures of past climate changes over long time scales. We will first synthesize previous studies and discuss how they have used paleoclimate modeling and/or data to provide clues into how ENSO diversity may have been shaped in past climates. Our results indicate that many apparent inconsistencies in future projection studies are due to misleading use of ENSO diversity indicators and that investigating ENSO diversity with a climate change perspective requires assessing both changes in the climate mean state (annual mean and seasonality) and changes in variability. 

How to cite: Abdelkader Di Carlo, I., Braconnot, P., Carré, M., Elliot, M., and Marti, O.: Towards a better understanding of ENSO diversity: a paleoclimate perspective, EGU General Assembly 2024, Vienna, Austria, 14–19 Apr 2024, EGU24-15294, https://doi.org/10.5194/egusphere-egu24-15294, 2024.

EGU24-17071 | ECS | Posters on site | CL2.4

Present and future of Extreme El Niño teleconnections over North America in CMIP6 models 

Margot Beniche, Jérôme Vialard, and Matthieu Lengaigne

Previous studies did suggest a diversity of the ENSO teleconnection pattern, with an eastward shifted pattern for El Niño relative to La Niña or for “eastern Pacific” (EP) relative to “central Pacific” (CP) El Niño events. Recently, Beniche et al. (in revision) demonstrated that extreme El Niño events (i.e. the strongest EP events, such as those in 1982/83, 1997/98, and 2015/16) were the only events leading to a clear eastward shift of the winter ENSO teleconnection pattern over North America. This specific teleconnection is also associated with reproducible wet (warm) anomalies over the western USA coast (northern USA and Canada). They did however demonstrate it based on the limited observational dataset, and a single AMIP CNRM-CM6.1 ensemble.

The current study aims at evaluating the robustness of these results using the broader AMIP6 and CMIP6 datasets. The specificity of the Extreme El Niño North American winter teleconnection pattern, and its inter-event and inter-member reproducibility, are robust across 23 historical AMIP ensembles (1979-2014). These events are associated with 73% chances of warm conditions over the Northern USA and Canada and 68% chances of wet conditions over the Western US coast across the AMIP ensemble. The stronger reproducibility of the extreme El Niño teleconnections can be explained by a more favourable Signal to Noise (SNR) ratio (mainly due to stronger signal).

We further evaluate the realism of these teleconnections patterns in presence of the systematic biases that are present in CMIP6. We only select CMIP6 models that reproduce Extreme El Niño events based on the precipitation-index of Cai et al. (2014). In agreement with previous studies using CMIP5 (e.g. Bayr et al., 2019), we find that models with stronger cold climatological SST bias are unable to simulate extreme Niño3 rainfall anomaly events. CMIP6 models that reproduce extreme El Niño tropical rainfall reasonably also reproduce the specific extreme El Niño 500 hPa geopotential height and surface temperature winter teleconnection pattern over North America. They however do not reproduce well the specific wet anomalies over the west American coast associated with those events, casting doubt on the CMIP6 ability to project precipitation changes over this region. We end by discussing the relevance of these results for understanding projected changes in ENSO teleconnections over North America in the context of different Shared Socioeconomic Pathways (SSPs) scenarii.

How to cite: Beniche, M., Vialard, J., and Lengaigne, M.: Present and future of Extreme El Niño teleconnections over North America in CMIP6 models, EGU General Assembly 2024, Vienna, Austria, 14–19 Apr 2024, EGU24-17071, https://doi.org/10.5194/egusphere-egu24-17071, 2024.

EGU24-17210 | ECS | Posters on site | CL2.4 | Highlight

Crying wolf with the 2023 El Niño: a predicted event that failed to materialize? 

Sandro Carniel, Gian Luca Eusebi Borzelli, Aniello Russo, and Cosimo Enrico Carniel

The El Niño–Southern Oscillation (ENSO) is a phenomenon that involves the redistribution of heat in the tropical Pacific Ocean, resulting in irregular oscillations in the sea surface temperature (SST) between warm (El Niño) and cold (La Niña) phases, and impacting the global planetary climate. In July 2023 the World Meteorological Organization, formally responsible to declare the onset of El Niño, officially announced its onset to the media, urging governments to prepare for potential high impacts on health, ecosystems and economies. However, the analysis of long-term meteorological and oceanographic data updated to the end of 2023 shows that while the eastern Pacific was warmer than normal in the second half of the year, the overall configuration of the tropical Pacific climate system did not indicate a strong El Niño event. Our findings show that the 2023-24 El Niño event, initially predicted to be at least moderate and possibly strong, turned out to be weak and, de facto, the year closed confirming it as a weaker than expected event. Based on historical records, we hypothesize that the state of the Pacific climate system at the end of 2023, following the unusual 2023-24 El Niño, may lead to the development of a strong or very strong El Niño by mid-2024.

How to cite: Carniel, S., Eusebi Borzelli, G. L., Russo, A., and Carniel, C. E.: Crying wolf with the 2023 El Niño: a predicted event that failed to materialize?, EGU General Assembly 2024, Vienna, Austria, 14–19 Apr 2024, EGU24-17210, https://doi.org/10.5194/egusphere-egu24-17210, 2024.

EGU24-20761 | ECS | Orals | CL2.4

Visualizing the transition from LaNiño to ElNiño from NASA's model outputs 

Atousa Saberi and Gregory Shirah

The ENSO affects global weather. We used NASA GEOS Subseasonal to Seasonal (S2S) Coupled ocean-atmosphere model, NASA MERRA‐2 reanalysis, along with NOAA Niño3.4 SST anomaly index time series to visualize the transition from  LaNiño 2021 to ElNiño 2023. The visualization is a comprehensive model explainer showing changes in the top 300 meters of the Pacifc Ocean (such as thermocline flattening, movements of the temperature anomalies) coupled with the Walker Circulation and the continous coupled interaction between the ocean and the atmosphere. It's the first effort in visualizing the Walker Circulation and the moving convective branch across the Pacific without schematic plots but rather with climate model outputs.  We will also cover the effect of the two phases of ENSO on the global weather pattern. This visualization will be narrated and released to the public in the future.

How to cite: Saberi, A. and Shirah, G.: Visualizing the transition from LaNiño to ElNiño from NASA's model outputs, EGU General Assembly 2024, Vienna, Austria, 14–19 Apr 2024, EGU24-20761, https://doi.org/10.5194/egusphere-egu24-20761, 2024.

EGU24-21415 | Posters on site | CL2.4

How closely related are the Interdecadal Pacific Oscillation and El Niño-Southern Oscillation? 

Tim Cowan, Hanna Heidemann, Scott B. Power, and Benjamin J. Henley

Sea surface temperature (SST) patterns in the Pacific Ocean cause climate variability in many parts of the world. This is due to the El Niño-Southern Oscillation (ENSO) on interannual timescales and the Interdecadal Pacific Oscillation (IPO) acting on decadal to interdecadal timescales, modifying ENSO teleconnections. However, how both ENSO, ENSO diversity and the IPO interact with each other still requires further clarification. In this study, we use observations of Pacific Ocean SSTs from 1920 to 2022 to explore the statistical relationships between decadal ENSO variability and the IPO. More specifically, we show how ENSO event characteristics of both central and eastern Pacific El Niño, as well as all La Niña events varies between their occurrence in warm (positive), compared to cool (negative) phases of the IPO. We further show that up to 60% of the variability in the IPO Tripole Index can be reconstructed by using simple ENSO metrics such as the relative frequency of El Niño and La Niña events. While statistically a clear relationship between ENSO and the IPO exists, some of the IPO’s key features, especially North Pacific SSTs, cannot be explained by decadal ENSO variability.  

How to cite: Cowan, T., Heidemann, H., Power, S. B., and Henley, B. J.: How closely related are the Interdecadal Pacific Oscillation and El Niño-Southern Oscillation?, EGU General Assembly 2024, Vienna, Austria, 14–19 Apr 2024, EGU24-21415, https://doi.org/10.5194/egusphere-egu24-21415, 2024.

Monsoon rainfall and year-to-year variability play an important role in Africa’s energy, agriculture, and other societal sectors. Within the African continent, east African countries are affected much by higher degrees of variability in seasonal monsoon precipitation. Two large-scale climate drivers, the Indian Ocean Dipole (IOD) and El Niño Southern Oscillation (ENSO) are studied in this regard. A strong connection starting from a season ahead is identified for early austral summer (Oct-Nov-Dec, OND) monsoonal rain in eastern Africa.  This has been examined using various data sources, detrending data beforehand, analysing either recent or earlier time periods - covering two decades each, and using the analyses of regression. Results of compositing also suggested a strong significant anomaly in OND rain covering that region of east Africa (named here as region A:18˚S-12˚N, 25˚E-52˚E).  When IOD and ENSO are both negative in July-August-September(JAS) there is a significant deficit in OND rainfall, while an excess rain when both are positive. The Walker circulation plays a key role via altering descending and ascending branches in two circumstances. Based on this analysis, it is possible to deliver an estimation of cumulative rain in terms of median value, range and distribution, one season in advance, at a point location or average over a region. Results are further verified for recent two years of 2022 and 2023, where drivers were of same sign, either both negative (2022) or positive (2023). Classifications based on two drivers, starting from JAS, are not only modulating cumulative rain but also influencing onset dates; excess (deficit) rain and early (late) onset are associated with positive (negative) phases of both drivers. Interestingly, regions of east Africa, south of that box region show a complete reverse pattern in OND and that pattern continues till Dec-Jan-Feb. In terms of mechanisms, apart from Walker circulation, ocean also plays a key part.      

            Some results of compositing are confirmed for longer records (1940-2021) too and further classification of drivers, based on a threshold value (+0.4) is tested. In the recent year 2023, as both drivers were strongly positive in JAS, more analyses in such cases are presented.  We note, if either of the drivers is weak positive and lies in the range of 0 to +.04, the signal in region A weakens substantially on the eastern side of the box. The strongest weakening happens when both the drivers are of low magnitude in JAS (i.e.,  between 0 to +0.4). Rainfall (OND) variability of region A, at intra-decadal, decadal and multi-decadal scales are studied by applying the method of centered moving averages of 5-year, 11-year and 21-year respectively. A decreasing trend is noted in all situations and major peak/trough years are identified. For multi-decadal analyses, a shift at around 1958 is identified when the trend of OND rain is reversed and switched from increasing to decreasing. Our results have implications for future planning in optimizing energy and agricultural outputs and the livelihood of millions of east Africans will be impacted.   

How to cite: Roy, I. and Troccoli, A.: Important drivers of October to December rainfall season in eastern Africa and relevant mechanisms, EGU General Assembly 2024, Vienna, Austria, 14–19 Apr 2024, EGU24-21764, https://doi.org/10.5194/egusphere-egu24-21764, 2024.

EGU24-1999 | ECS | Posters on site | AS1.35

Elevation-dependent warming in the Alps estimated from MAR simulations over 1961-2100 

Ian Castellanos, Martin Ménégoz, Juliette Blanchet, and Julien Beaumet

Regional imprints of global warming have to be investigated to predict the impact of climate change on a local scale and inform mitigation and adaptation policies. The rate of warming as a function of elevation in mountainous regions is yet to be fully characterized and understood. This study aims to identify elevation-dependent warming features in the Alps as well as its physical drivers, using MAR (Modèle Atmosphérique Régional) simulations with a 7kmx7km resolution over 1961-2100, under different climate scenarios. Different seasonal patterns have been found, most notably a maximum of warming at intermediate elevation (~1500m to 1800m) in Spring related to earlier snow melting in future projections. This maximum of warming moves towards higher elevations over the XXIst century. Elevation-dependent warming is found to be different in the free-atmosphere and along the slopes of the mountains, highlighting the major impact of surface processes, such as changes in albedo, in the drivers of climate change in the Alps.

How to cite: Castellanos, I., Ménégoz, M., Blanchet, J., and Beaumet, J.: Elevation-dependent warming in the Alps estimated from MAR simulations over 1961-2100, EGU General Assembly 2024, Vienna, Austria, 14–19 Apr 2024, EGU24-1999, https://doi.org/10.5194/egusphere-egu24-1999, 2024.

EGU24-2067 | Orals | AS1.35

Extreme rainfall characteristics and its simulations in the Yarlung Tsangbo Grand Canyon, China 

Xuelong Chen, Dianbin Cao, Qiang Zhang, Xin Xu, and Yaoming Ma

The Yarlung Tsangbo Grand Canyon (YGC), one of the world’s deepest canyons, is located in the southeastern Tibetan Plateau (SETP). The YGC exhibits the highest frequency of convective activity in China. Due to frequent rainstorms in the wet season, natural disasters such as landslides and debris flows frequently occur, and often block traffic corridors. Thus, understanding the relationship between water vapor changes, convective cloud activity, and extreme rainfall events in the YGC is critical. A comprehensive observation network for water vapor variations, cloud activity, local circulation, and land-air interactions in the YGC was installed to help us to determine the relationship between the water vapor transport and heavy precipitation in the YGC and the physical process that determines the precipitation intensity, especially for cases of strong precipitation.

More than three years data collected from a rain gauge network, disclose that the spatial pattern of rainfall distribution. There are two regions (500 m and 2500 m AMSL) with high precipitation in the YGC. Diurnal cycles showed some variations among sites, but a clear floor was visible around afternoon and peak values exhibited in the early morning. The monthly precipitation in the YGC region shows two peaks in April and July. Vertical convection and vapor transport are important for extreme rainfall in this region.

We analyzed 35 years observation data of daily precipitation to objectively classify the weather systems responsible for the SETP heavy precipitation. Hierarchical clustering method divided the atmospheric circulation of the regional heavy precipitation into two representative patterns: the Tibetan Plateau vortex type (TPVT, accounting for 56.6% of the heavy precipitation events) and the mid-latitude trough type (MLTT,43.4%). The comprehensive analysis of the two patterns shows a clear connection between the heavy precipitation and positive vorticity anomaly, moisture convergence and the southeastward shift of the westerly jet core. Specifically, TPVT heavy precipitation events are caused by potential vorticity dry-to-wet processes during its eastward movement, while MLTT events are associated with the intrusion of deeply extratropical trough-ridge circulations into the SETP.

We used the Weather Research and Forecasting (WRF) model to simulate the water vapor flux during extreme rainfall events. The general shortcoming of the WRF precipitation simulation nudged with the European Centre for Medium-Range Weather Forecasts’ reanalysis dataset version 5 (ERA5), is that it cannot capture strong rainfall period. We tested many WRF parameterization schemes at a 1 km grid resolution. It was found that when an optimized combination of parameterization schemes in WRF can better capture the variations in the wind and water vapor concentration in the YGC channel, the model produced the best simulation results for extreme rainfall in the YGC.

These analyses have help us understanding the impacts of YGC valley on the water vapor transport and extreme rainfall outbreak mechanism.

How to cite: Chen, X., Cao, D., Zhang, Q., Xu, X., and Ma, Y.: Extreme rainfall characteristics and its simulations in the Yarlung Tsangbo Grand Canyon, China, EGU General Assembly 2024, Vienna, Austria, 14–19 Apr 2024, EGU24-2067, https://doi.org/10.5194/egusphere-egu24-2067, 2024.

The Tibetan Plateau (TP) directly heats the middle tropospheric atmosphere, and accurate simulation of its surface temperature is of great concern for improving climatic prediction and projection capabilities, but climate models always exhibit a cold bias. Based on the Coupled Model Intercomparison Project Phase 6 (CMIP6) models and in-situ observations during 1981-2014, this study elucidates the impact of the snow overestimation on the temperature simulation over the TP in CMIP6 from the perspective of local radiation processes and atmospheric circulation. On the one hand, more snow in the CMIP6 models not only directly cools the surface more, but also makes the surface receive less shortwave radiation due to the higher surface albedo, and thus has lower ground surface temperature (GST), and the more snow/albedo-low temperature process is particularly evident in the westerly region due to more uncertainty at high elevations. This process contributes 87% to the annual GST cold bias. Lower GST corresponds to less latent heat transfer and thereby lower surface air temperature (SAT). In addition, the more snow in the CMIP6 models leads to the weaker the South Asian summer monsoon and the westerlies, and brings less warm and moist air (less integrated water vapor flux), as well as less clear-sky downward longwave radiation (less water vapor amount and lower tropospheric air temperature) to the TP (contributing 58% to the annual GST cold bias). These processes will result in less both precipitation and surface latent heat loss, which offsets a 35% annual GST cold bias. Besides, the physical mechanism of snow on GST and SAT differs with season over the westerly and monsoon regions of the TP. The research highlights the importance of topography and snow parameterization schemes for optimizing CMIP6 models.

How to cite: Wu, F. and You, Q.: Understanding of CMIP6 surface temperature cold bias over the westerly and monsoon regions of the Tibetan Plateau, EGU General Assembly 2024, Vienna, Austria, 14–19 Apr 2024, EGU24-2463, https://doi.org/10.5194/egusphere-egu24-2463, 2024.

EGU24-3382 | ECS | Posters on site | AS1.35

An ensemble of meteorological stations for estimating daily air temperature time series at Jungfraujoch since 1864 

Marco Bongio, Carlo De Michele, and Riccardo Scotti

Air temperature is a pivotal factor influencing numerous chemical, physical, and biological processes. However, there is a notable scarcity of long-term data, especially at high elevations, exceeding 2000 m a.s.l. This study focuses on reconstructing the daily maximum, mean, and minimum temperatures at Jungfraujoch (3571 m a.s.l.) since 1864. The approach involves daily data from 10 meteorological stations within the ECA&D (6) and Meteo Swiss (4) databases. All selected stations are situated above 2000 m a.s.l. (in the range 2140-3109 m a.s.l.), providing uninterrupted observations spanning at least from 1961 to 2022. The methodology includes these steps: 1) for each meteorological station, in the calibration period 1980-1999, it was modeled the daily temperature at Jungfraujoch as the sum of the temperature at the selected station plus a deterministic and a stochastic component; the deterministic component is the product of the temperature lapse rate (TLR) and the elevation difference between the reference and selected station, and the stochastic component is a “noise” which comes from the statistical distribution of the residuals. The seasonality requires parameters with monthly variability which are different considering minimum, mean and maximum temperature. The calibration phase consists in the estimation of TLR and the statistical distribution of residuals (among Normal, GEV, Stable and Tlocscale distributions). The evaluation of model performances was based on the calculation of Pearson correlation coefficients (ρP) and Root mean squared errors (RMSE) within the two validation periods (1961-1979 and 2000-2022). High correlation coefficients (greater than 0.9 in both calibration and validation periods) and low values of RMSE (from 1.56°C to 3.32 °C in the calibration period and from 1.56°C to 3.42°C in the validation) confirm the model’s accuracy. The same high performances were found before (1961-1979) and after (2000-2022) the calibration period, for every meteorological stations. 2) Then the 10 simulated time series at Jungfraujoch were sorted according to the lowest values of the RMSE, and the first three was mediated to define an “ensemble” daily temperature time series, which was able to obtain these performances: (ρP=0.96,0.98,0.97; RMSE=1.97,1.46,1.68 °C respectively for max, mean and min temperature). The study was then extended from the year 1864. Comparing the results with the existing literature we highlighted: i) high performances without the need of modeling the observed trend due to the climate change (subjected to high uncertainty in the future), ii) very parsimonious model without the need of any other variables (relative humidity, cloud cover, wind velocity, weather patterns); iii) the importance of selecting high stations elevations (above 2000 m a.s.l.) rather than considering closer stations but subjected to the thermal inversion phenomena; iv) maximum temperature is affected by higher errors, especially from 2000-2022 which is probably due to the higher increasing of the summer and winter temperatures at high elevation accordingly to an elevation warming dependence; v) This method could be easily extended in many regions of the world and these results could be used to make a back ward analysis of many environmental processes (glacio-hydrological and permafrost), within the Jungfrau-Aletsch UNESCO World Heritage Site. 

How to cite: Bongio, M., De Michele, C., and Scotti, R.: An ensemble of meteorological stations for estimating daily air temperature time series at Jungfraujoch since 1864, EGU General Assembly 2024, Vienna, Austria, 14–19 Apr 2024, EGU24-3382, https://doi.org/10.5194/egusphere-egu24-3382, 2024.

EGU24-5260 | ECS | Posters on site | AS1.35

The frequency of summer light rain projections in typical terrain over eastern China constrained by surface wind speed 

Xuechen Dong, Daoyi Gong, and Cuicui Shi

The variation of near surface wind speed is a key dynamic parameter in the orographic effect of precipitation over eastern China. In this study, we used the latest high-resolution outputs from six GCMs in CMIP6-HighResMIP to evaluate the performance of high-resolution models in simulating the orographic precipitation characteristics of typical mountainous areas in summer over eastern China. Combined with observational results, the orographic precipitation under warming scenarios was projected and constrained. The results indicated that during the contemporary climate reference period (1979-2009), although the relationship between model-simulated near surface wind speed and the orographic light rain frequency was consistently stable, the sensitivity of the orographic light rain frequency to surface wind variability was generally underestimated, with a deviation approximately 24.1% lower than the observational values. Comparison of model-simulated wind speed with observational records showed that the negative bias of the sensitivity value was mainly contributed by the overestimated wind speed in models. Based on observed near-surface wind speed to constrain and correct the orographic light rain frequency, the constrained estimates revealed a 36.1% reduction in orographic light rain frequency under a 1.5°C warming scenario, which is 8.6 times greater than the original predictions (4.2%). The MRI-AGCM3-2-S model, with a longer dataset, demonstrated a relatively stable reduction in orographic light rain frequency under different warming scenarios (1.5°C, 2°C, 3°C, and 4°C) after wind speed constraints, all of which are exceeding the original predictions.

How to cite: Dong, X., Gong, D., and Shi, C.: The frequency of summer light rain projections in typical terrain over eastern China constrained by surface wind speed, EGU General Assembly 2024, Vienna, Austria, 14–19 Apr 2024, EGU24-5260, https://doi.org/10.5194/egusphere-egu24-5260, 2024.

EGU24-6068 | ECS | Posters on site | AS1.35

21st Century climate change in the European Alps and its elevation dependency 

Anna Napoli, Michael Matiu, Sven Kotlarski, Dino Zardi, Alberto Bellin, and Bruno Majone

Climate change is a global phenomenon with regionally varying peculiarities. It is well known that mountainous regions are highly sensitive to climate change. Furthermore, the complex orography exerts a strong control on the expected impacts that often depend on several controlling factors such as elevation, slope, land use etc.. In addition, climate models introduce errors in reproducing local physical processes due to their coarse spatial resolution and partly poorly constrained parameterisations.

Elevation Dependent Climate Change has been observed in the European Alps as a consequence of the interplay of global warming and the specific Alpine orography. The Alpine region is considered as a climate change hot-spot given that a large portion of this region has warmed about twice as much as the global average with warming rates characterised by a strong dependence on elevation. On the contrary, observed precipitation trends show very high spatial variability, sometimes with significant dependence on the elevation. In this study we analyse these complex Alpine temperature and precipitation change patterns with the elevation in the EURO-CORDEX ensemble of regional climate models at 0.11° resolution including CORDEX-Adjust (bias-adjusted CORDEX simulation) and compare these results to different model outputs characterised by coarse grid resolution (GCMs, e.g. CMIP5 ) and selected convection permitting models. The future trends of climate indices covering both the mean the extremes are explored across spatial scales and different RCPs. This study includes also analysis of the effects of different bias-adjustment techniques on the trend reproduction.

How to cite: Napoli, A., Matiu, M., Kotlarski, S., Zardi, D., Bellin, A., and Majone, B.: 21st Century climate change in the European Alps and its elevation dependency, EGU General Assembly 2024, Vienna, Austria, 14–19 Apr 2024, EGU24-6068, https://doi.org/10.5194/egusphere-egu24-6068, 2024.

EGU24-6607 | ECS | Orals | AS1.35

Modelling the mountain boundary layer: Does higher resolution improve model performance? 

Brigitta Goger and Anurag Dipankar

The horizontal grid spacing of numerical weather prediction models keeps decreasing towards the hectometric range, where topography, land-use, and other static parameters are well-resolved. Still, models have to be evaluated over complex terrain, because it cannot be assumed that higher horizontal resolution automatically yields better model performance. In this study, we perform limited-area simulations with the ICON model across horizontal grid spacings (1 km, 500 m, 250 m, 125 m) in the Inn Valley, Austria. Simulations are ran with two turbulence schemes - a 1D parameterization and a 3D Smagorinsky-type scheme. We evaluate the model across scales with observations of the valley boundary layer from the CROSSINN measurement campaign. This allows us to investigate whether increasing the horizontal resolution automatically improves the representation of the thermally-induced circulation, surface exchange, and other mountain boundary layer processes. Results suggest that the valley topography is already well-represented at the kilometric range, but the simuations in the hectometric range show a more detailed representation of the vertical valley atmosphere structure and the up-valley flow. Across resolutions, the model struggles with the correct representation of interactions between larger and smaller scales. The two turbulence schemes show a similar performance, but the 3D Smagorinsky scheme simulates a delayed evening transition of the up-valley flow. It is argued that the major difference between schemes actually emerges from the different surface transfer schemes, and the choice of boundary layer parameterization is secondary.

How to cite: Goger, B. and Dipankar, A.: Modelling the mountain boundary layer: Does higher resolution improve model performance?, EGU General Assembly 2024, Vienna, Austria, 14–19 Apr 2024, EGU24-6607, https://doi.org/10.5194/egusphere-egu24-6607, 2024.

Redistribution of snow by the wind has been shown to greatly influence local snow accumulation in alpine terrain. Due to the small-scale nature of this process, previous studies either concentrated on short case studies over small areas or relied on highly simplified wind fields. To bridge the gap towards an assessment of the importance of snow drift over alpine glaciers on seasonal scales we present a new approach using simulations with the Weather Research and Forecasting (WRF) model and deep learning as a computationally efficient downscaling tool for near-surface winds and snow redistribution over complex topography.

We created a training data set of high-resolution (dx=50 m) WRF simulations coupled to a novel drifting-snow module that is representative for winter-time alpine environments. The idealized setup allows us to control the degrees of freedom that the final model has to learn. We developed a new technique to create synthetic topographies with similar spectral information as real terrain employing inverse Fourier transforms of scaled fields of random noise. Initial conditions for the WRF simulations are taken to represent the distribution of atmospheric and snow conditions over a winter season. This training data set we feed into a U-Net shape architecture using convolutional neural networks.

Here we present first results using a training data set with a reduced number of degrees of freedom as a prove of concept. Future developments will involve adding more complexity to the initial conditions as well as applying it to real-world settings. For this we will couple the model to a glacier mass balance model and run it with real-world atmospheric fields in order to asses the overall importance of drifting snow for alpine glaciers.

How to cite: Saigger, M. and Mölg, T.: Welcome to Fourier-Land: Deep-Learning based downscaling of near-surface winds and drifting snow using WRF simulations over synthetic topographies, EGU General Assembly 2024, Vienna, Austria, 14–19 Apr 2024, EGU24-8087, https://doi.org/10.5194/egusphere-egu24-8087, 2024.

EGU24-9427 | ECS | Posters on site | AS1.35

Climatic drivers of elevation-dependent warming (EDW): A concerted field and modeling assessment for an alpine national park 

Simon Zitzmann, Benjamin Fersch, and Harald Kunstmann

Mountain regions, such as the Alps, play a crucial role in providing ecosystem services, e.g., by acting as ‘water towers’ and substantially contributing to the discharge of the main European rivers. However, global warming is causing significant changes to the cryosphere, biodiversity and ecosystems in these regions. Hence, understanding the microclimatic changes in mountainous areas is essential, particularly the phenomenon of elevation-dependent warming (EDW), describing an amplified warming trend predominantly at higher elevations compared to adjacent lowlands. In the scientific community multiple drivers of EDW are being discussed, among them snow-albedo feedback, changes in cloud properties, and aerosols. The contribution of the individual drivers varies regionally and the role of surface energy balance components, especially ground heat flux, is rarely examined.

Therefore, this study focuses on investigating the elevation-dependency of temperature trends and surface energy balance components, as well as its driving mechanisms in the Berchtesgaden National Park, Germany. This area in the northern limestone Alps is characterized by a highly variable topography, diverse landscapes and numerous ecosystems. Preliminary results from this ongoing study are presented, emphasizing the methodological approach and initial insights gained:

Extensive data from the meteorological measuring station network, covering elevations from 600 to 2700 m.a.s.l., is analyzed to identify EDW patterns in the national park and its surroundings.

Additionally, from fall 2023 to 2025, a transect of three meteorological stations is established at different elevations (600 to 2000 m.a.s.l.) for a detailed investigation of land surface energy balance. Besides measuring the radiative components in highly variable terrain, the field observations focus especially on ground heat flux, obtained at multiple positions within each station site to capture the small-scale variance and aspect dependency of ground heat flux. Additionally, at one of the stations the turbulent heat fluxes are assessed, using the Modified Bowen Ratio Method.

To gain a holistic picture of the processes within the national park, the land surface model Noah-MP is employed to simulate the surface energy exchange processes at a high spatial resolution of 100 m. To improve the understanding of the development over time, model runs covering several decades in the past and a run during the measurement period (2023–2025) are performed, with results validated against the observational data.

How to cite: Zitzmann, S., Fersch, B., and Kunstmann, H.: Climatic drivers of elevation-dependent warming (EDW): A concerted field and modeling assessment for an alpine national park, EGU General Assembly 2024, Vienna, Austria, 14–19 Apr 2024, EGU24-9427, https://doi.org/10.5194/egusphere-egu24-9427, 2024.

EGU24-10043 | ECS | Orals | AS1.35

Using Novel Lake-based Snowfall Measurements in the Alps and Himalayas to optimise Cloud and Precipitation processes in a Regional Atmospheric Model (MetUM) 

Siddharth Gumber, Andrew Orr, Paul Field, Hamish Pritchard, Federico Covi, Pranab Deb, Marc Girona-Mata, Martin Widmann, and Emily Potter

Complex mountain orography induces sharp gradients in precipitation accumulation locally. The associated complexity in understanding these events depends on local orographic, microphysical, and dynamical conditions, which makes simulating snowfall a major challenge for regional atmospheric models. This study addresses these deficiencies by using a unique repository of snowfall measurements at a range of ‘super sites’ in the European Alps and Himalayas, which are used to produce a precipitation-optimised version of the atmosphere-only UK Met Office Unified Model (MetUM) at a spatial resolution of 1.5 km. The snowfall measurements involve using the winter time-series of water pressure in frozen lakes to measure the mass of falling snow during extreme precipitation events directly over the lake area, which are comparable in size to the model’s grid cells. Development of the precipitation-optimised version of the MetUM involves undertaking a series of model sensitivity experiments focused on varying the physical representation of cloud and precipitation microphysics, with the aim of better capturing the onset and end periods, and amounts of received snowfall during these extreme events. The MetUM is configured to use a double moment cloud microphysical scheme (CASIM: Cloud AeroSol Interacting Microphysics) with prescribed hydrometeor spectral attributes necessary to quantify both the auto-conversion rates and thresholds for the cloud conversion to take place. Results from these experiments suggest that local microphysical processes, often subsumed within small spatial scales, can influence dynamics at larger scales, impacting gradients in precipitation. Cloud radiative properties, including the hydrometeor effective radii and optical depths are further validated against satellite-based observations.

How to cite: Gumber, S., Orr, A., Field, P., Pritchard, H., Covi, F., Deb, P., Girona-Mata, M., Widmann, M., and Potter, E.: Using Novel Lake-based Snowfall Measurements in the Alps and Himalayas to optimise Cloud and Precipitation processes in a Regional Atmospheric Model (MetUM), EGU General Assembly 2024, Vienna, Austria, 14–19 Apr 2024, EGU24-10043, https://doi.org/10.5194/egusphere-egu24-10043, 2024.

EGU24-11038 | ECS | Orals | AS1.35

Investigating a local windstorm using measurements and large-eddy simulations 

Nicolai Krieger, Christian Kühnlein, Michael Sprenger, Heini Wernli, Philipp Bättig, Maxime Hervo, and Ulrich Krieger

During a winter storm in January 2007, a train derailed due to strong winds in a narrow valley in northeastern Switzerland. The accident was attributed to the Laseyer, a local windstorm characterized by flow reversal that manifests as easterly to southeasterly winds at the valley floor during strong prevailing northwesterly winds above. We analyze case studies of the local windstorm using sonic anemometer and Doppler lidar measurements. The data reveal a highly turbulent flow in the narrow valley and extreme wind speeds exceeding 45 m/s during Laseyer conditions.

Additionally, we use a newly developed large-eddy simulation (LES) atmospheric model to improve our understanding of the local windstorm. The model is implemented in a Python environment with the GT4Py (GridTools for Python) domain-specific library to enable performance portability.  Robust and efficient solution of the nonhydrostatic compressible equations is achieved using a finite-volume semi-implicit discretization following ECMWF’s IFS-FVM. LESs are performed above the highly complex terrain of northeastern Switzerland, which leads to extremely steep slopes exceeding 70°. With these LESs, we identify the mechanism behind the local windstorm, study its sensitivity to ambient flow conditions, and characterize the flow conditions in the narrow valley.

How to cite: Krieger, N., Kühnlein, C., Sprenger, M., Wernli, H., Bättig, P., Hervo, M., and Krieger, U.: Investigating a local windstorm using measurements and large-eddy simulations, EGU General Assembly 2024, Vienna, Austria, 14–19 Apr 2024, EGU24-11038, https://doi.org/10.5194/egusphere-egu24-11038, 2024.

EGU24-12631 | Orals | AS1.35

The Inn Valley exit jet: results of the TEAMx pre-campaign 

Katrin Sedlmeier, Meinolf Kossmann, Ivan Paunovic, Astrid Eichhorn-Müller, Oliver Nitsche, Ronny Leinweber, Eileen Päschke, and Gudrun Mühlbacher

Previous studies have found a pronounced nocturnal low-level jet at the exit of the Inn Valley north of the valley contraction near Schwaigen which reaches into the Alpine foreland (e.g. Pamperin and Stilke, 1985 as part of the MERKUR experiment or a model study by Zängl, 2004). The exit jet forms under nocturnal stably stratified atmospheric conditions and is interpreted as a transition from subcritical to supercritical hydraulic flow.

As part of the pre-campaign of the TEAMx programme in June-August 2022, we have conducted measurements to corroborate the previous findings on the formation and maintenance of the Inn valley exit jet and learn more about its turbulence structure, which has not been studied in previous experiments. For this purpose, a wind lidar was deployed in Brannenburg, north of the valley constriction. TKE profiles were derived from the Lidar measurements using the method described in Smalikho and Banakh (2017).  Furthermore, 3-hourly radiosondes were launched at the site of the wind lidar, accompanied by drone measurements during an IOP (18/19 July 2022) in high pressure weather conditions with low cloud cover.  

Upper air and surface wind measurements during the IOP captured a well pronounced Inn valley exit jet which is analyzed in detail in this contribution. Additionally, a statistical analysis of the occurrence and characteristics of nocturnal low-level jets within the whole pre-campaign period is presented.


References:

TEAMx: http://www.teamx-programme.org/

Smalikho, I.N., and V.A. Banakh. "Measurements of wind turbulence parameters by a conically scanning coherent Doppler lidar in the atmospheric boundary layer." Atmospheric Measurement Techniques 10.11 (2017): 4191-4208.

Pamperin, H., and G. Stilke. "Nächtliche Grenzschicht und LLJ im Alpenvorland nahe dem Inntalausgang." Meteorologische Rundschau 38.5 (1985): 145-156

Zängl, G. "A reexamination of the valley wind system in the Alpine Inn Valley with numerical simulations." Meteorology and Atmospheric Physics 87.4 (2004): 241-256.

How to cite: Sedlmeier, K., Kossmann, M., Paunovic, I., Eichhorn-Müller, A., Nitsche, O., Leinweber, R., Päschke, E., and Mühlbacher, G.: The Inn Valley exit jet: results of the TEAMx pre-campaign, EGU General Assembly 2024, Vienna, Austria, 14–19 Apr 2024, EGU24-12631, https://doi.org/10.5194/egusphere-egu24-12631, 2024.

EGU24-13294 | ECS | Orals | AS1.35

A new dataset of daily observations from a dense network of weather stations covering the Extended Alpine Region 

Giulio Bongiovanni, Michael Matiu, Alice Crespi, Anna Napoli, Bruno Majone, and Dino Zardi

Several observational products of key climate variables have been widely used to evaluate the extent of the ongoing effects of climate change in the Alpine area, one of the most vulnerable and sensitive regions to the continuous warming of climate. However, a limited spatial coverage in most observational products and quality issues of data may strongly impact climate and hydrological studies results in terms of reliability, accuracy and precision. Even though the collection and management of meteorological data for the whole Alpine area is a challenging task due to strong fragmentation and diversity of data sources, further efforts need to be dedicated to produce new harmonised, high-quality and high-resolution products able to permit a more robust assessment of climate change and its impacts.  

Here we present a new observational dataset gathering in-situ measurements of meteo-climatic variables provided by a variety of meteorological and hydrological services within the extended Alpine region. The observational network consists of about 10000 in-situ weather stations, measuring key climate variables up to 2020 at daily time resolution, resulting in an extended and homogeneous coverage, both in space and elevation. Data collected are screened, inspecting the presence of most important critical issues in terms of data quality. A deep quality control of collected time series has been performed by checking internal, temporal and spatial consistency of time series, exploiting the problem of outlier removal. Inhomogeneities in time series are detected by a multi-methods approach and significant inhomogeneous periods are corrected. 

A climatological and trend analysis, in terms of both mean and extreme values, was carried out on a selection of homogenised time series extending over the period 1961-2020. The most common climate indices and statistics are used to perform the analysis at different time frequencies and spatial scales. A further analysis concerned the relationship between climate variables and main teleconnection patterns.

The present dataset addresses the most important issues affecting state-of-the-art observational products and it represents a powerful tool for better understanding Alpine climate changes over the last decades and improving the reliability of future scenarios.

How to cite: Bongiovanni, G., Matiu, M., Crespi, A., Napoli, A., Majone, B., and Zardi, D.: A new dataset of daily observations from a dense network of weather stations covering the Extended Alpine Region, EGU General Assembly 2024, Vienna, Austria, 14–19 Apr 2024, EGU24-13294, https://doi.org/10.5194/egusphere-egu24-13294, 2024.

EGU24-13935 | ECS | Posters on site | AS1.35

Future Projections of Summer precipitation-driving Mechanisms over the South American Altiplano 

Jhoana Agudelo, Jhan-Carlo Espinoza, Clementine Junquas, and Paola A. Arias

The South American Altiplano is a high-altitude plateau (3800 m MSL) located in the central Andes between 15ºS and 22ºS. Bounded to the west by the coastal desert of Peru-Chile and to the east by the hyper-humid lowlands of Peru-Bolivia, the Altiplano exhibits a semi-arid climate, following a pronounced annual cycle, with over 70% of rainfall occurring during the austral summer (December-January-February). Associated with factors such as convective activity occurring west of the Amazon Basin, the generation of convective clouds over the central Andes occurs when eastward winds encounter the orographic barrier on the eastern slope of the Andes. This process represents the primary mechanism governing precipitation variability in the Altiplano. Previous studies analyzing future projections anticipate that the central Andes will become warmer during the 21st century, impacting the population, ecosystems, and glaciers of the South American Altiplano. This is particularly relevant since agriculture is the main economic activity in this region and depends directly on precipitation.

Summer precipitation over the Altiplano has shown a strong dependence on the magnitude of zonal flow in the free troposphere (200 - 300hPa). Nevertheless, General Circulation Models (GCMs) suggest a continuous increase in westerly flow over the central Andes, hindering moisture transport from the interior of the continent. Minvielle and Garreaud (2011) suggest a significant reduction (10%-30%) in Altiplano precipitation by the end of this century under moderate to strong greenhouse gas emission scenarios. More recently, Segura et al., (2020) found that precipitation variability in the Altiplano is also associated with upward motion over the western Amazon (WA). Thus, DJF precipitation over the Altiplano seems to respond directly and primarily to the upward motion over the WA, since the early 21st century.

Using a set of 13 GCMs, this study aims to explore possible future projections in precipitation processes under the SSP3-7.0 scenario. This study focuses on the evolution of two previously established mechanisms driving austral summer precipitation over the Altiplano: 1) easterly winds at upper levels over the central Andes, and 2) upward motion over the WA. As preliminary conclusions of this work, models indicate that both mechanisms appear to weaken for the future period analyzed (2050-2084), suggesting a reduction in summertime precipitation by the mid-21st century. Additionally, models project a more stable atmosphere over the central Andes for the future period, also indicating a reduction in precipitation in the region, reinforcing the initial conclusion.

How to cite: Agudelo, J., Espinoza, J.-C., Junquas, C., and Arias, P. A.: Future Projections of Summer precipitation-driving Mechanisms over the South American Altiplano, EGU General Assembly 2024, Vienna, Austria, 14–19 Apr 2024, EGU24-13935, https://doi.org/10.5194/egusphere-egu24-13935, 2024.

EGU24-14519 | ECS | Posters on site | AS1.35

Automatic identification of systematic model failures in ensemble precipitation forecasts 

Yuliya Kazachkova and Annette Miltenberger

Quantiative precipitation forecasting remains a major challenge even for kilometre-scale ensemble forecasating systems. However, operational high-resolution ensemble systems provide a large data-set from which - if combined with observational data - insight into systematic issues in the model physics can be gained. Here, we explore statistical methods to automatically identify systematic error patterns and their relation to the larger-scale conditions at example problem of precipitation at the Harz mountain range in northern Germany. For the analysis COSMO-D2-EPS forecasts for the years 2011-2018 are combined radar-derived and station-calibrated surface precipitation estimates provided by the German Weather Service (DWD). For the identification of common precipitation error patterns, empirical orthogonal function (EOF) analysis has been employed. For the winter season the leading order principal components show error features located on the elevated topography in the Harz region. Analysis of large-scale conditions (derived from ERA5) for each principal component shows systematic differences in upstream wind direction and speed, temperature, and specific humidity. In the summer seasons patterns are less localised, but some regional structure is maintained especially for the first principal component. Also the differentiation in large-scale conditions between EOFs is less. The challenges in summer are presumably related to a large contribution of convective precipitation. Overall, the leading 5 principal components explain 70,4% (48,2%) of the variance in winter (summer). To gain a better understanding of the relationship of error models to larger-scale conditions, as well as the physical mechanisms of model errors, simulations of precipitation at representative dates for principal components 1 and 2 were performed using the ICON-D2 model.

How to cite: Kazachkova, Y. and Miltenberger, A.: Automatic identification of systematic model failures in ensemble precipitation forecasts, EGU General Assembly 2024, Vienna, Austria, 14–19 Apr 2024, EGU24-14519, https://doi.org/10.5194/egusphere-egu24-14519, 2024.

Complex terrain is often characterized by mechanical sources, which force the initiation of convection in unstable atmospheric conditions, resulting in severe weather such as thunderstorms and hail, etc. With respect to the synoptic prevailing wind, the terrain can also cause heavy precipitation by converging flow and stationary rain bands. Rain gauges can provide a direct measure of accurate precipitation at a point station. However, low accessibility and high maintenance costs limit the ability to install high-resolution rain gauge networks in mountainous regions. Thus, quantitative precipitation estimation (QPE) through remote sensing using weather radar plays an important role in securing observation information on rainfall amounts in mountainous areas. 
In this study, we first analyzed the statistics of hazardous weather events retrieved from radar-based rainfall estimates over the Korean Peninsula according to complex topography. In order to analyze the frequency of occurrence of each type of hazardous weather such as torrential rain, hail, and snowfall according to orographic conditions, we used radar-based QPE. We investigated the correlation between topographic characteristics such as terrain altitude, wind direction, and downwind side and the frequency of occurrence and development of hazardous weather phenomena. 
We also examined the accuracy of QPE relating to rainfall mechanisms including radar echo top height for each warm and cold season. We analyzed the accuracy of QPEs according to various methods using radar reflectivity, dual-polarization parameters, and radar attenuation. We analyzed precipitation estimation error factors that may be caused by terrain shielding and high radar beam height in mountainous areas. We explored QPE errors based on radar beam height and echo intensity to improve the accuracy of QPE. 
Furthermore, in order to provide hazardous weather information specialized for the mountainous region, we have planned to develop an algorithm to estimate the probability of severe weather due to topographic characteristics by merging terrain altitude, atmospheric instability, and radar echo intensity by calculating Froude number using radar-based three-dimensional wind (Wind Synthesis System using Doppler Measurements, WISSDOM). In conjunction with the technology for calculating stationary precipitation information using radar echo image processing techniques, we aim to strengthen the ability to respond to dangerous weather by providing information on possible areas of heavy rain, snowfall, and extreme wind due to complex terrain.


How to cite: Lee, S., Park, J.-W., Mo, S.-J., and Gu, J.-Y.: Statistical Analysis of Radar-based Quantitative Precipitation Estimation over Complex terrain in Korea and Development of User-oriented Services for Mountainous Regions, EGU General Assembly 2024, Vienna, Austria, 14–19 Apr 2024, EGU24-14813, https://doi.org/10.5194/egusphere-egu24-14813, 2024.

EGU24-16067 | ECS | Posters on site | AS1.35

High-resolution model evaluation with self-supervised neural network approach targeted on severe storms over the Alps 

Daniele Corradini, Claudia Acquistapace, and Paula Bigalke

As climate change advances, the Alps are expected to experience increasingly intense thunderstorms, which are likely to cause more damage due to floods and landslides. This study aims at evaluating extreme precipitation in weather models over complex terrains where orography causes the hardest challenges to precipitation prediction. 

Our preliminary analysis assessed which infrared and visible satellite channels are most effective in predicting precipitation, by examining the MSG satellite channels and radar-derived rain products. This assessment considered the influence of terrain by comparing data from flatlands and more complex topographies.

We will then use a combination of the selected channels to train a self-supervised machine learning (ML) algorithm for both observations and model outputs. We will exploit the space where cloud classes are identified, known as feature space, in two distinct ways to evaluate the ICON-GLORI model. Firstly, we pinpoint significant cases of extreme precipitation and simulate them using the ICON-GLORI model. This data is then input into the observation-trained ML algorithm to determine the cluster within the feature space where the simulated cases will be categorized. Secondly, we construct a feature space using the ensemble ICON-GLORI model. A showcase of the ML algorithm trained using the cloud optical thickness from 2015 imagery over Germany will demonstrate the potential of this approach.

How to cite: Corradini, D., Acquistapace, C., and Bigalke, P.: High-resolution model evaluation with self-supervised neural network approach targeted on severe storms over the Alps, EGU General Assembly 2024, Vienna, Austria, 14–19 Apr 2024, EGU24-16067, https://doi.org/10.5194/egusphere-egu24-16067, 2024.

EGU24-18557 | ECS | Orals | AS1.35

Testing the capability of the WRF model on representing temperature inversions in alpine basins and valleys 

Katharina Perny, Herbert Formayer, and Imran Nadeem

Persistent inversions and associated low wind situations during the winter months often lead to air pollution problems in alpine basins and valleys, regardless of emission levels. The aim of this work is to determine how well high-resolution simulations with the Weather Research and Forecasting (WRF) model are able to reproduce the occurrence and weather conditions during temperature inversions in complex topography.

The city of Graz in south-eastern Austria often experiences increased strength and persistence of winter inversions due to its location and local topography. Experiments in this area with the WRF model show a better reproduction of these weather conditions when the shortwave radiation scheme Dudhia is used instead of the RRTMG, while variations in the microphysics and planetary boundary schemes did not lead to relevant changes in the model results.

In a next step, additional basins and alpine valleys will be investigated to determine the influence of shape and extent of the topography on the results.

The model is forced with the ECMWF-IFS analysis data with a spatial resolution of 9 km. Two one-way nested domains with resolutions of 3 and 1 km are used to investigate what resolution is required to adequately represent the local topographic effects. The model results are compared with station and radiosonde observations as well as with the analysis and nowcasting system INCA for Austria.

How to cite: Perny, K., Formayer, H., and Nadeem, I.: Testing the capability of the WRF model on representing temperature inversions in alpine basins and valleys, EGU General Assembly 2024, Vienna, Austria, 14–19 Apr 2024, EGU24-18557, https://doi.org/10.5194/egusphere-egu24-18557, 2024.

EGU24-19261 | Posters on site | AS1.35

Analysis of surface temperature and precipitation trends and climate indices in Spanish mountain areas 

Ramón Viloria and Verónica Tricio

Several studies and observations suggest that global warming processes are more prevalent in mountain areas, showing higher rates of warming and more pronounced changes in precipitation than in average land data. Snow and ice are highly sensitive to variations in climate. The importance of mountain areas as water reservoirs for the surrounding land and valleys at lower altitudes justifies paying special attention to this type of behaviour and to the changes brought about by global warming. This interest is enhanced by the special environmental sensitivity of mountain ecosystems, and the difficult balance between these fragile ecosystems and their use as tourist resources or winter resorts.

In this paper we analyse climate data collected at mountain weather stations in Spain in time series up to 80 years. Stations in mountain areas are not numerous and are sometimes very scattered; nevertheless, we have selected the available data on temperatures, precipitation and other meteorological variables at stations located in the various mountain ranges throughout the Iberian Peninsula. For the selected stations, trends in temperatures (mean, maximum and minimum) have been studied and a seasonal analysis has been carried out. In addition, the data were processed with RClimDex, statistical and climatic software package, to evaluate Climate Extreme Indices. Cooling and warming patterns have been detected, and changes in precipitation have been analysed, trying to address the distinctive characteristics of mountain areas in the studies conducted. Monthly and seasonal assessments have also been carried out to detect changes in behaviour patterns. In general, good agreement with previously published data has been obtained, although not many studies have been carried out systematically in Spain, except in the Pyrenees area.

How to cite: Viloria, R. and Tricio, V.: Analysis of surface temperature and precipitation trends and climate indices in Spanish mountain areas, EGU General Assembly 2024, Vienna, Austria, 14–19 Apr 2024, EGU24-19261, https://doi.org/10.5194/egusphere-egu24-19261, 2024.

Mountains play a crucial role in the climate system at various temporal and spatial scales. Additionally, they serve as vital sources of resources, such as fresh water, and host a diverse range of biodiversity. This influence on development and natural ecosystems is particularly significant in semi-arid regions like the Sierra de Guadarrama. This mountain range is located in the Iberian Peninsula and has been the subject of official meteorological observations since the mid-20th century. Nevertheless, there is a gap in the knowledge of the rainfall and temperature variability and its drivers in this important region. TROPA-UCM group has been intensively observing and studying this range since 1998 and recently, a methodology has been developed to extend the observations from 1900 to present using data from the ERA20C and in-situ observations. This has enabled longer time series and a deeper analysis of large-scale teleconnection patterns and climate variability, unlike ever before. The analysis includes trends in temperature, snow precipitation, and snowpack duration. Variations in precipitation and temperature have been identified, providing valuable information for estimating potential changes in seasonal runoff and rainfall intensity. This information can be of great use to organizations responsible for the management of this area, for developing adaptation strategies for new scenarios and to improve seasonal to decadal predictions.


How to cite: Durán, L., González-Cervera, Á., and Rodríguez-Fonseca, B.: Analysis of climate variability and teleconnection patterns in Sierra de Guadarrama (Iberian Peninsula) using 120-year observed and reconstructed time series, EGU General Assembly 2024, Vienna, Austria, 14–19 Apr 2024, EGU24-19545, https://doi.org/10.5194/egusphere-egu24-19545, 2024.

Analysis of surface precipitation accumulations upstream, near-shore, and adjacent to the Olympic mountains from the 17 December 2015 case during OLYMPEX using Weather Research and Forecasting (WRF) simulations, the NPOL dual-polarization radar, and high-resolution soundings investigates the role of low-level blocking on upstream precipitation enhancement. Past work shows that frontal systems often slow while approaching complex terrain if the Froude number is sufficiently low. Low-level blocking of stable air ahead of a front can modify precipitation distributions by frontal deformation, slowing, splitting, or merging. Observed coastal sounding-derived vertical stability profiles indicate high levels of low-level stability and significant vertical wind shear, which showed little change while a warm front propagated northeastward and stalled as the stable air mass likely dammed against the terrain. Radial velocity from the NPOL radar and simulated wind fields indicate strong down-valley flow coupled with a frontal jet also contributed to long-lasting Kelvin-Helmholtz (KH) waves extending offshore.

Using WRF simulations along with OLYMPEX observations, we examined the evolution of precipitation upstream of complex terrain by breaking down the distribution of pre-frontal and frontal precipitation accumulations as the warm front approached the Olympic Peninsula. Through dividing the event into regions upstream of NPOL and into timeframes relative to landfall, results indicate pre-warm frontal precipitation accumulations decrease with distance upstream of the coast with the highest accumulations present over the terrain. As the front's translation speed slowed and eventually stalled, the warm frontal period accumulations are highest far upstream of the coast and over the terrain, with lesser accumulations in the middle region. These results indicate that upstream precipitation enhancement upstream is an indirect effect of the terrain influencing the frontal shape and propagation, resulting in enhanced frontal precipitation accumulations.

How to cite: Hence, D. and James, S.: Evolution of Surface Precipitation Accumulations Upstream of the Olympic Mountains using Observations and Simulations: An OLYMPEX Case Study, EGU General Assembly 2024, Vienna, Austria, 14–19 Apr 2024, EGU24-20124, https://doi.org/10.5194/egusphere-egu24-20124, 2024.

EGU24-1327 | Orals | AS1.36 | Highlight

Evaluating coastal atmospheric properties using UAS during TRACER 

Gijs de Boer, Francesca Lappin, Brian Butterworth, Petra Klein, Daphne Quint, Radiance Calmer, Elizabeth Asher, and Brian Argrow

The Tracking Aerosol Convection Interactions Experiment (TRACER) project deployed a variety of observing systems to the greater Houston area in 2021/2022 to help improve our understanding of the interplay between the urban environment, aerosol particles, and coastal circulations and their combined influence on the development of convection and precipitation.  With approximately 40% of the planet’s population living in coastal regions, extreme precipitation events in these areas can have significant impact and result in significant damage and losses.  In the Houston urban metroplex many of these impacts are amplified by the generally low-lying terrain, which contributes to significant regional flooding events under heavy precipitation.


As part of TRACER, teams from the University of Colorado Boulder and University of Oklahoma deployed small uncrewed aircraft systems (UAS) to areas between the Gulf of Mexico and Houston.  Collecting data on thermodynamic, kinematic, and aerosol properties in the lower atmosphere, the measurements from these platforms provide unique perspectives on the vertical and horizontal variability in key parameters.  During this presentation, we will provide an overview of the sampling strategies employed during TRACER and the platforms used to collect airborne data, the types of measurements collected, and initial results on aerosol conditions and sea breeze properties from the deployment.  We will additionally provide broader context by combining these data with measurements from the US Department of Energy’s 2nd Atmospheric Radiation Measurement (ARM) program Mobile Facility (AMF-2), which was deployed to the region for the TRACER campaign.  

How to cite: de Boer, G., Lappin, F., Butterworth, B., Klein, P., Quint, D., Calmer, R., Asher, E., and Argrow, B.: Evaluating coastal atmospheric properties using UAS during TRACER, EGU General Assembly 2024, Vienna, Austria, 14–19 Apr 2024, EGU24-1327, https://doi.org/10.5194/egusphere-egu24-1327, 2024.

EGU24-2834 | ECS | Posters on site | AS1.36

Retrieving Refractivity using Interferometry of Refracted Aircraft Radio Broadcasts 

Ollie Lewis, Chris Brunt, and Malcolm Kitchen

Water vapour is the key tropospheric constituent driving meteorological processes in the atmosphere of Earth.  However, its extreme spatial and temporal variability in the lower atmosphere presents an enormous challenge for existing observing systems.  Crucially, no single existing observing system can accurately capture the detailed four-dimensional distribution of water vapour in the troposphere.  There is a growing need for opportunistic remote-sensing technologies that can provide low-cost, high-volume humidity observations for use in numerical weather prediction (NWP) models.

Observations of refractivity, which has a strong dependence on water vapour in the lower atmosphere, provide an important indirect source of humidity information for use in NWP. An effective method of obtaining refractivity measurements is through the Global Navigation Satellite System radio occultation (GNSS-RO) technique, which uses the change in bending angle of radio signals emitted by GNSS satellites due to variations in the refractive index to construct vertical profiles of refractivity.  However, despite GNSS-RO proving to be an invaluable source of refractivity data, the horizontal resolution of such retrievals is limited to the order of hundreds of kilometres.  Other humidity-sounding techniques, such as lidar and ground-based GNSS receiver technologies, also suffer from limited horizontal resolution.  As the resolution of NWP models continues to increase, there is a clear need for observing systems that can resolve short spatial and temporal variations in tropospheric refractivity.      

We present a new way to obtain information on atmospheric refractivity structure by measuring the angle of arrival (AoA) of radio signals routinely broadcast by commercial aircraft.  The radio transmissions are the 1090 MHz Automatic Dependent Surveillance-Broadcast (ADS-B) transmissions which all commercial aircraft are mandated to broadcast for air traffic purposes.  As the radio transmissions propagate through the atmosphere, variations in refractivity induce bending in the ray path.  A prototype ADS-B interferometer was used to simultaneously measure the incident AoA of the signal and extract the aircraft positional information encoded in the ADS-B.  We show how the interferometrically derived AoA can be combined with the known aircraft position to obtain information concerning the refractivity structure of the atmosphere.  The rapid broadcast rate of ADS-B (approximately twice per second) and the high density of air traffic over Northwestern Europe allow for detailed sampling of the lower atmosphere.  Sensitivity tests indicate that measurements of AoAs below an elevation of approximately 2 deg. with an accuracy of 0.01 deg. should allow for meteorologically useful information to be extracted.  Recent experiments indicate that large-scale changes in refractivity are detectable and that measurements of individual refracted ADS-B transmissions are approaching the 0.01 deg. accuracy through improvements in the interferometer array.  The technique is analogous to the existing GNSS-RO technique and it is anticipated that data assimilation schemes could be adapted to use this new source of bending angle data.  
     

This work has been funded by the University of Exeter, the Met Office and the Harry Otten Foundation.

How to cite: Lewis, O., Brunt, C., and Kitchen, M.: Retrieving Refractivity using Interferometry of Refracted Aircraft Radio Broadcasts, EGU General Assembly 2024, Vienna, Austria, 14–19 Apr 2024, EGU24-2834, https://doi.org/10.5194/egusphere-egu24-2834, 2024.

Understanding of global climate and the accurate forecasting of extreme weather in Europe rely on the validity of operational coupled atmosphere-ocean models over the north Atlantic. Robotic systems will play an increasing dual role in improving these models. Firstly climate models require improved parameterization schemes of the air-sea coupling, especially under existing data-sparse or data-disturbed conditions such as storm conditions or stratified turbulence respectively. Secondly, forecast model accuracy can be enhanced by targeted data assimilation, although this, at present, is costly.

The SRA, based at the Scottish Association for Marine Science with association with Oban Airport, is ideally placed geographically, logistically and academically to test and deploy air-sea interaction technology in the immediate and medium term.

We encourage academic and engineering collaboration from Europe and elsewhere to engage with the SRA to partner in the development of sensor and platform technology, validation of heterogenous swarms (airborne, surface and sub-surface) and trial operational studies.

How to cite: Anderson, P., Peterson, P., and Smith, L.: Introducing the Scottish Scientific Robotics Academy as a facility for testing and operating robotics for Ocean-Atmosphere Interaction studies., EGU General Assembly 2024, Vienna, Austria, 14–19 Apr 2024, EGU24-5957, https://doi.org/10.5194/egusphere-egu24-5957, 2024.

Stratospheric platforms can navigate to remote regions and dispense tiny micro-dropsondes. These lightweight sensors safely descend, transmitting weather data in high-resolution, all the way from stratosphere to sea-level. The data is received by the dispensing platform which disseminates the data in near real-time via SATCOM. Voltitude Ltd, “Unlocking the Stratosphere®”, is developing and operating two new upper air observation systems with great potential to improve the accuracy, reliability, spatial coverage and cost effectiveness of ocean and atmosphere observations in support of improving weather forecasting of extreme weather events.

The StratoSonde® system is a new upper air observation system, combining a long endurance balloon system with a new micro-dropsonde and dispensing system, to provide observations at low-cost from remote regions. The StratoSonde® balloon has total weight less than 3kg and provides multi-day endurance in the stratosphere, navigating by selecting different wind layers to drift towards remote regions of interest. Each system supports up to 10 micro-dropsondes, each weighing ~20g. Once dispensed the dropsondes take approximately 20-minutes to descend to sea-level, measuring Temperature, Pressure, Relative Humidity, Wind speed and Wind Direction in high vertical resolution all the way from stratosphere to sea-level. Data is transmitted to the dispensing balloon, which disseminates this in near-real-time via SATCOM. The StratoSonde system is being operated out of the Cabo Verde islands, off the west coast of Africa, to support Tropical Cyclone research and forecasting, and supports many other use cases for meteorological observation data gathering over Europe.

For targeted observations, the Voltitude ltd micro-dropsonde system can be implemented in an aerodynamic tubular housing for installation on other uncrewed air systems and drones. Each housing is self-contained, including dispensing system, UHF receiver and SATCOM data link, and weighs less than 1kg while full of 32 dropsondes. Under development is the StratoSat-25 solar electric stratospheric long endurance aircraft, being designed to support two dispensing pods, offering 64 targeted observations per mission. The StratoSat-25 has over 2-months endurance and is being designed to operate as part of a constellation to provide synchronous targeted observations over specific meteorological features of interest. The current generation of fixed-wing solar electric high altitude pseudo satellites (HAPS), have extremely restricted launch and recovery operating envelopes and are too vulnerable to gusts and turbulence to support missions requiring regular and routine recovery to “restock” dispensable payloads. The StratoSat-25 overcomes this challenge with great expansion of the operating envelope with enhanced resilience to gusts and turbulence, without penalising stratospheric performance.

The presentation “Dropsondes from the Stratosphere” will review the global weather observation challenges, priority use cases and how new stratospheric technological innovations are impacting this field, discussing in detail the emerging capabilities offered by low-cost long endurance stratospheric platforms.

How to cite: Stevens, P.: Dropsondes from the Stratosphere: Targeted Observations Over Remote Regions Using Stratospheric Platforms., EGU General Assembly 2024, Vienna, Austria, 14–19 Apr 2024, EGU24-6469, https://doi.org/10.5194/egusphere-egu24-6469, 2024.

Aircraft icing, a hazardous phenomenon involving the accumulation of ice or supercooled water droplets on an aircraft’s wings and airframe in freezing temperatures when an airplane flies through clouds, poses substantial risks to aviation safety. From a meteorological perspective, aircraft icing is determined by the air temperature, and the number and size of water droplets. In particular high values with water contents are a crucial factor correlating with increased icing intensity. Since weather radar can detect ice and water droplets larger than 2 mm in diameter within precipitable clouds, we have developed two radar-based aircraft icing products (icing potential areas and icing intensity) to facilitate safe aviation services in real-time. 

In this study, the estimation algorithm of aircraft icing intensity using Z-LWC relationship was presented. We utilized data from a ground-based S-band radar mosaic, an icing detector, and a cloud droplet probe installed on the aircraft (KMA/NIMS atmospheric research aircraft; NARA) for 13 cases of icing. Within the icing areas determined by the icing detector, 3-dimensional gridded reflectivity (Z) and liquid water content (LWC) were matched based on time and location. A Z-LWC relationship was then derived using the paired dataset sorted by size. We calculated LWC from Z using this relationship and categorized icing intensity into Trace, Light, Moderate, Heavy, and Severe, according to FAA criteria (FAA 2001). The estimation of icing intensity was solely focused within the identified icing potential areas (Kim et al. 2023). The algorithm was validated using a “Light” intensity icing case from aircraft report (AIREP), showing good performance, but further verification is needed. 

ACKNOWLEDGEMENTS
This research was supported by “Development of integrated radar analysis and customized radar technology (KMA2021-03021)” of “Development of integrated application technology for Korea weather radar” project funded by the Weather Radar Center, Korea Meteorological Administration.
This work was funded by the Korea Meteorological Administration Research and Development Program "Developing Application Technology using Atmospheric Research Aircraft" under Grants (KMA2018-00222).

How to cite: Ye, B.-Y. and Kim, Y.: Estimation of Aircraft Icing Intensity Using Z-LWC Relationship from Radar and Aircraft Data, EGU General Assembly 2024, Vienna, Austria, 14–19 Apr 2024, EGU24-7164, https://doi.org/10.5194/egusphere-egu24-7164, 2024.

EGU24-8490 | ECS | Posters on site | AS1.36

Atmospheric boundary layer structure at a small Alpine valley head detected with a network of UAS and ground-based sensors 

Almut Alexa, Norman Wildmann, and Alexander Gohm

In mountainous areas, the transport and exchange of mass, energy, and momentum in the atmospheric boundary layer (ABL) happens not only in the vertical, but also in the horizontal, and on multiple scales. The associated processes will be investigated within the observational campaign (TOC) of the TEAMx program at various locations. In a pre-campaign in 2022 (TEAMx-PC22), several sites, instrumentation, and measurement strategies were tested.

A site called Nafingalm was identified as a potential location for the investigation of boundary layer processes in a small Alpine valley. The site is located at the head of a tributary valley to the Inn Valley in Tyrol, Austria.

Measuring all the relevant scales within the ABL in the valley requires distributed sensors at the ground, but also aloft, ideally up to the boundary layer height. For this purpose, simultaneous, distributed measurements were conducted with quadrotor UAS from the SWUF-3D fleet during the TEAMx-PC22. Different configurations and flight strategies were tested between 20th and 28th June 2022 with up to three UAS being operated at the same time. The main flight strategies were simultaneous vertical profiles along the valley up to 120 m above ground, and horizontal profiles across the valley at up to 40 m above ground. Additionally, ground-based instrumentation was deployed during a three-month period to get a better understanding and statistics of typical conditions in the valley.

A case study was done for 23rd June 2022, analyzing the atmospheric processes that occurred during different periods of the day. It could be concluded that the UAS measurements were an important addition to and extension of the ground-based measurements. They illustrated the occurrence of thermally-driven winds, foehn winds, and the formation of a stable boundary layer at the valley ground. Nafingalm proved to be a suitable location to observe local and mesoscale phenomena and their interaction.

How to cite: Alexa, A., Wildmann, N., and Gohm, A.: Atmospheric boundary layer structure at a small Alpine valley head detected with a network of UAS and ground-based sensors, EGU General Assembly 2024, Vienna, Austria, 14–19 Apr 2024, EGU24-8490, https://doi.org/10.5194/egusphere-egu24-8490, 2024.

EGU24-8548 | Orals | AS1.36

Unmanned Aerial Vehicles for satellite calibration and validation 

Franco Marenco, Maria Kezoudi, Alkistis Papetta, Christos Keleshis, Rodanthi Mamouri, Eleni Marinou, Vassilis Amiridis, Konrad Kandler, Chris Stopford, Frank Wienhold, and Jean Sciare

A large amount of development has occurred in the last few years around the launch of two spaceborne lidar missions by the European Space Agency (ESA). Aeolus, active from 2018 to 2023, was the first satellite capable of observing winds from the surface to the stratosphere, and has led to significant progress in atmospheric dynamics research and operational weather forecasting. EarthCARE, expected to be launched in the first half of 2024, aims to significantly improve our understanding of how clouds and aerosols affect the Earth radiative budget, with observations at unprecedented levels of accuracy.

The Cyprus Institute (CyI) contributes to the calibration and validation of both satellites. During June 2022, the Unmanned Systems Research Laboratory (USRL), an ACTRIS national facility and mobile exploratory platform, took part in the ESA-ASKOS experiment in Mindelo, Cape Verde, and operated several Unmanned Aerial Vehicles (UAVs), fitted with a number of unique in-situ aerosol instruments able to profile the Saharan Air Layer between the surface and an altitude as high as 5,300 m ASL. The campaign aimed to validate the Aeolus L2A product in the presence of dust and marine aerosols, estimate the influence on Aeolus products of non-spherical particles, evaluate the impact of particle orientation, and study the diurnal cycle of the dust size-distribution at high altitudes. The instruments deployed on-board the UAVs  permitted evaluation of the vertically-resolved particle size-distribution between 0.1 and 40 µm diameter and complementing observations of ground-based remote sensing set out by NOA and TROPOS. Moreover, high-altitude dust samples were collected on impactors, for further analysis by Scanning Electron Microscopy. The airborne in-situ particle size-distributions and the lidar remote sensing observations show a similar atmospheric structure and comparable estimates of the aerosol concentrations. Moreover, the collected high-altitude samples are able to inform on the size-resolved particle mineralogy, dominated by clay and silicates in this campaign.

Similar experiments, to be held in Cyprus within the framework of the CORAL and ATMO-ACCESS pilot projects, will permit to evaluate the EarthCARE aerosol products. In addition to USRL, the Cyprus Institute operates the Cyprus Atmospheric Observatory (CAO), which provides long-term in-situ and remote sensing observations over the island, and which is another valuable validation infrastructure, and also an ACTRIS national facility. Moreover, a great potential for the exploitation of synergies is available through the collaboration and memorandum of understanding with the nearby ERATOSTHENES centre of excellence, home of another national facility, the Cyprus Atmospheric Remote Sensing Observatory (CARO).

In this presentation we will discuss the potential and complementarity of in-situ UAV observations with ground-based remote sensing for the cal/val of Aeolus and EarthCARE, the knowledge acquired during  the ASKOS campaign in Cape Verde, the opportunities stemming from the strategic location of Cyprus for the cal/val of EarthCARE, the existing plans, the room for further development, the funding opportunities, and the challenges.

How to cite: Marenco, F., Kezoudi, M., Papetta, A., Keleshis, C., Mamouri, R., Marinou, E., Amiridis, V., Kandler, K., Stopford, C., Wienhold, F., and Sciare, J.: Unmanned Aerial Vehicles for satellite calibration and validation, EGU General Assembly 2024, Vienna, Austria, 14–19 Apr 2024, EGU24-8548, https://doi.org/10.5194/egusphere-egu24-8548, 2024.

EGU24-8640 | ECS | Posters on site | AS1.36

Horizontal and vertical wind speed sampling using multirotor UAS aircraft 

Matteo Bramati, Martin Schön, Vasileios Savvakis, Yongtan Wang, Jens Bange, and Andreas Platis

The utilization of multirotor UAS aircraft for atmospheric data collection is an expanding field, and one method employed for measuring atmospheric wind speed is the tilt angle method. This method correlates the tilt angle assumed by the multicopter during hovering to compensate for aerodynamic drag forces with the atmospheric wind.
At the Umweltphysik Group of Uni Tübingen, a cost-effective and easily replicable calibration method has been devised and tested. However, this approach overlooks the crucial vertical component of the wind, essential for calculating vertical turbulent fluxes.
To address this limitation, a follow-up study proposes an analytical approach that involves calibrating relationships between wind speed and tilt angle, motor RPM and tilt angle, as well as vertical wind speed and RPM. The necessary data for this calibration can be obtained through telemetry from an open-source flight controller's log files.
Accurate calibration of these relationships is ensured through real-world flight testing to maintain precision. Indoor tests or wind tunnel experiments might yield biased results due to interactions with walls, failing to accurately represent the aircraft's outdoor aerodynamic behavior.
Considering environmental parameters is vital, as evidenced by notable differences between calibrations conducted in winter and summer. These variations underscore the necessity of accounting for environmental influences.
Subsequently, the method will undergo further validation by flying the aircraft in close proximity to a sonic anemometer to assess its accuracy in measuring atmospheric parameters.

How to cite: Bramati, M., Schön, M., Savvakis, V., Wang, Y., Bange, J., and Platis, A.: Horizontal and vertical wind speed sampling using multirotor UAS aircraft, EGU General Assembly 2024, Vienna, Austria, 14–19 Apr 2024, EGU24-8640, https://doi.org/10.5194/egusphere-egu24-8640, 2024.

EGU24-8879 | ECS | Posters on site | AS1.36

LES-based evaluation of UAV flight patterns to quantify local scale carbon emissions  

Abdullah Bolek, Mark Schlutow, Martin Heimann, and Mathias Goeckede

Understanding carbon flux processes and controls is crucial to constrain greenhouse gas exchanges of different ecosystems under a changing climate. However, over heterogeneous landscapes (e.g., Arctic permafrost regions), carbon exchange fluxes (CO2, CH4) show significant variations even on very small spatial scales. As a result, upscaled carbon fluxes from eddy covariance towers and flux chambers hold the potential to be biased due to their limited spatial representativeness. Therefore, quantifying carbon fluxes at different scales is needed to improve understanding of spatial variability, and the interaction of processes over heterogeneous landscapes. Constraining carbon fluxes with unmanned aerial vehicles (UAVs) carrying greenhouse gas analyzers has the potential to bridge this scaling gap since UAVs allow to monitor large areas with high spatial resolution. Nevertheless, only few guidelines are available on UAV flight strategies and methods to accurately quantify the surface-atmosphere carbon exchange fluxes.

In this study, we conducted synthetic UAV flights using a Large Eddy Simulation (LES) model to evaluate various carbon flux quantification methods based on UAV observations. These methods, including e.g. mass balance and flux gradient approaches, were tested with different flight strategies to find the optimum setup that maximizes information gain for a given flight time. In addition, we conducted experiments to improve the accuracy of the UAV-based carbon flux estimation from a campaign conducted in a subarctic heterogeneous ecosystem in which the UAV platform was able to collect in-situ atmospheric CO2 and CH4 concentrations, and environmental parameters such as 2D wind speed, air temperature, humidity, and pressure. Replicating these UAV flight strategies within the LES model enabled us to quantify the uncertainties and provide guidelines for future UAV flight campaigns in heterogeneous landscapes.

How to cite: Bolek, A., Schlutow, M., Heimann, M., and Goeckede, M.: LES-based evaluation of UAV flight patterns to quantify local scale carbon emissions , EGU General Assembly 2024, Vienna, Austria, 14–19 Apr 2024, EGU24-8879, https://doi.org/10.5194/egusphere-egu24-8879, 2024.

The SWUF-3D fleet of unmanned aerial systems (UAS) is utilized for in situ
measurements of turbulence as a contribution to closing observational gaps in
the atmospheric boundary layer (ABL). The wind measurement algorithm used
has only been calibrated in the free field up to this point. Therefore, we present
the calibration and verification in a wind tunnel.
Calibration is performed in x- and y-coordinate directions of the UAS body
coordinate frame and in wind speeds of 2 . . . 18 m s−1. We investigate the mea-
surement accuracy under different angles of sideslip (AoS) and wind speeds as
well as the portability of the calibration coefficients to other UAS of the fleet.
The wind tunnel is equipped with an active grid which is capable of generat-
ing measurement scenarios like gusts, velocity steps and statistical turbulence.
This allows systematic verification of the measurement capabilities and identifi-
cation of limitations. As a reference for the UAS measurements we use constant
temperature anemometers (CTAs).
With the derived calibration coefficients the uncertainty depends on the wind
speed magnitude and increases with higher wind speeds, resulting in an overall
root-mean-square error (RMSE) of less than 0.2 m s1. Applying the calibra-
tion coefficients from one UAS to others within the fleet results in comparable
accuracies, showing omission of wind tunnel calibration for the remaining UAS.
Furthermore, the wind measurement is susceptible to high AoS at high wind
speeds. The RMSE for measurements in different gusts is up to 0.6 m s−1. In
the most extreme velocity steps (i.e. a lower speed of 5 m s1 and an amplitude
of 10 m s1) the maximum RMSE occurs and exceeds 1.3 m s1. For variances
below approx. 0.5m−2 s2 and 0.3m−2 s2, the maximum resolvable frequen-
cies of the turbulence are about 2 Hz and 1 Hz, respectively. The verification
in the wind tunnel and the determination of uncertainties helps the analyses
of atmospheric measurements in complex terrain and in wind parks where the
SWUF-3D fleet is primarily deployed.

How to cite: Kistner, J. and Wildmann, N.: Calibration and verification of high resolution wind speed measurements with quadcopter UAS in a wind tunnel with active grid, EGU General Assembly 2024, Vienna, Austria, 14–19 Apr 2024, EGU24-9131, https://doi.org/10.5194/egusphere-egu24-9131, 2024.

A sample of 115 aircraft icing events in the Western Europe and Northeastern Atlantic sector, identified in aircraft pilot reports (PIREPs), is analyzed using satellite observations and products. Most of the icing events occurred between October and February, although a few cases were identified during late spring and even summer months. Icing conditions were generally reported at mid-troposphere, with 82.7% and 78.6% of moderate and severe icing, respectively, identified between FL100 and FL250 (≈ 3 - 7.6km). Satellite observations allow the identification of icing-prone conditions and also provide an independent means of validating some of the data in the aircraft reports. It is shown that aircraft icing occurs mainly within opaque clouds, with ice cloud-tops, or mixed-phase (ice and water). Accordingly, most events were associated with middle and high opaque clouds, with 10.8 μm brightness temperatures (BT10.8) between -40 and -8°C.

Moreover, a detailed analysis of three events, using model data, satellite, and synoptic observations, illustrates the occurrence of aircraft icing in precipitating clouds. Within those cases, one occurred below the upper layer of a thick nimbostratus associated with an occluded low centered in the Bay of Biscay. The second event, reported as severe, as in the former case, took place within low clouds over southern England in association with northwesterly winds driven by a complex low. Finally, a moderate event happened over southern Portugal, in association with a cold front, near the cloud top of nimbostratus. In all cases, the icing index operational at the Portuguese Weather Service, based on the European Centre for Medium-range Weather Forecasts (ECMWF) model, was able to predict prone-icing conditions, with higher severity in the severe cases.

How to cite: Belo-Pereira, M., Casqueiro, B., and Trigo, I.: Characterization of aircraft icing conditions in Western Europe and the North-East Atlantic. Case studies using aircraft reports, satellite, and synoptic data, EGU General Assembly 2024, Vienna, Austria, 14–19 Apr 2024, EGU24-10682, https://doi.org/10.5194/egusphere-egu24-10682, 2024.

Aviation emissions contribute to climate change, one of the key contributors being contrail cirrus clouds. The importance of the impact is strongly dependent on their formation and persistence. 

A condensation trail - or contrail - is composed of ice crystals which form behind the aircraft engine exhaust at high altitudes when local weather conditions are favorable. The formation is also influenced by the engine technology and operating conditions, and by the fuel type. The contrail persists and evolves as long as it remains in an ice supersaturated region - or ISSR-, a local atmospheric air mass characterized by a low temperature and a humidity level that is saturated versus ice. Only persistent contrails are considered as having a climate effect.

Weather forecast or reanalysis datasets were leveraged to understand if current data are sufficient to predict ISSRs and contrails, and to support the preparation of in-flight measurement campaigns. Statistics on ISSRs using multiple years of ERA5 ECMWF data will be presented for different months, and geographical areas. Results clearly help to identify geographical areas where the frequency of ISSRs is more important, as well as the seasonal, diurnal and vertical evolution of these frequencies. 

Using these results and incorporating information on annual meteorological changes, such as El Niño, a region and time of year was selected to conduct a contrail-related flight measurement campaign in Minnesota for two weeks of December 2023.

During this period, NOAA GFS forecasts were used to identify ISSRs and plan aircraft flight paths. The forecast for a flight will be presented and compared to what was observed during this flight. The use of different resolutions to establish this forecast will also be discussed.

How to cite: Mackay, C., Marizy, C., and Raguet, I.: The prediction of Ice SuperSaturated Regions and persistent contrail formation using weather data and in-flight observations., EGU General Assembly 2024, Vienna, Austria, 14–19 Apr 2024, EGU24-11247, https://doi.org/10.5194/egusphere-egu24-11247, 2024.

EGU24-12255 | Posters on site | AS1.36

Contrail forecast and nowcast evaluation using satellite-based LIDAR data 

Vincent Meijer, Sebastian Eastham, Ian Waitz, and Steven Barrett

Contrail avoidance promises to be a near-term solution for mitigating part of aviation’s climate impact [1]. Atmospheric regions that allow for contrails to form and persist have been shown to be horizontally wide but vertically thin [2], motivating the idea that small vertical deviations are sufficient for avoiding the most impactful contrails [1]. Nonetheless, the concept of contrail avoidance relies on skillful forecasts of the regions where contrails will form and persist. Recent comparisons of NWP data and humidity measurements and contrail observations show that the prediction of contrail persistence is problematic [3,4]. Since simulation studies that have previously investigated contrail avoidance have assumed the prediction of these regions to be correct [1], real-world contrail avoidance strategies may be less effective than thought previously [4]. There is thus a need to both understand and improve the performance of prediction methods that could be utilized for contrail avoidance.

Previous work has [5] has resulted in a dataset of over 3000 contrail cross-sections found in CALIOP LIDAR data, obtained by collocating contrails detected using GOES-16 imagery [6]. We have now developed an algorithm that finds the location where an aircraft’s exhaust plume intersects CALIOP data. This allows us to estimate which contrail cross-section corresponds to which flight, as well as estimate which flights did not form a persistent contrail. The resulting dataset is used for the evaluation of existing forecast methods that rely on numerical weather prediction data, as well as a nowcasting algorithm that relies on contrail detections and altitude estimates from GOES-16 data [5,6].

This new forecast evaluation dataset and method can be used to better understand the limitations of existing approaches and enable the development of improved techniques for persistent contrail prediction.

References:

[1] Teoh, R., Schumann, U., Majumdar, A., and Stettler, M. E. Mitigating the climate forcing of aircraft contrails by small-scale diversions and technology adoption. Environmental science & technology, 54(5):2941–2950, 2020.

[2] Gierens K., Spichtinger, P. and Schumann, U. Ice Supersaturation, In Atmospheric Physics. Background—Methods—Trends; Schumann, U., Ed.; Springer: Heidelberg, Germany, 2012; Chapter 9; pp. 135–150.

[3] Gierens, K.; Matthes, S.; Rohs, S. How Well Can Persistent Contrails Be Predicted? Aerospace 20207, 169.

[4] Geraedts S,. Brand E., Dean T., Eastham S.D., Elkin C., Engberg Z., Hager U., Langmore I., McCloskey K., Ng J.Y., Platt J.C. A scalable system to measure contrail formation on a per-flight basis. Environmental Research Communications. 2023

[5] Meijer V.R., Eastham S.D., Barrett S.R. Contrail Height Estimation Using Geostationary Satellite Imagery. AGU23. 2023.

[6] Meijer V., Kulik L, Eastham S.D., Allroggen F., Speth R.L., Karaman S., Barrett S.R. Contrail coverage over the United States before and during the COVID-19 pandemic. Environmental Research Letters. 2022.

How to cite: Meijer, V., Eastham, S., Waitz, I., and Barrett, S.: Contrail forecast and nowcast evaluation using satellite-based LIDAR data, EGU General Assembly 2024, Vienna, Austria, 14–19 Apr 2024, EGU24-12255, https://doi.org/10.5194/egusphere-egu24-12255, 2024.

EGU24-14026 | ECS | Posters on site | AS1.36

Development of Global Integrated Turbulence Forecast System for the Republic Of Korea Air Force 

Dan-Bi Lee, Jung-Hoon Kim, Jaedon Hwang, Jae-Ik Song, and Hyejeong Jung

Unexpected encounters with aviation turbulence, a hazardous weather phenomenon affecting aircraft operations, can cause casualties and aircraft damage. The Republic Of Korea Air Force (ROKAF) currently provides turbulence forecast information for the East Asia/Korean Peninsula area based on the Korea Air Force-Weather and Research Forecasting (KAF-WRF) model-derived turbulence diagnostics. However, because the turbulence forecast information is not provided for the global area, operational weather forecasting support to overseas areas, whose importance is increasing under modern warfare, is limited. Accordingly, in this study, we developed the global integrated turbulence forecast system considering various turbulence generation mechanisms, called the KAF-Global Turbulence Forecast (KAF-GTF) system, based on the two global numerical weather prediction (NWP) models being currently used in operation by the weather group of the ROKAF. The ROKAF’s global NWP models are the Global Forecast System (GFS) and European Centre for Medium-Range Weather Forecasts (ECMWF), which have horizontal resolutions of 0.5°x0.5° and 0.25°x0.25°, respectively. The two global NWP model-based KAF-GTF systems are developed based on the methodology of version 3 of the Graphical Turbulence Guidance (GTG) system of Sharman and Pearson (2017) and consist of the following three steps: i) individual clear-air turbulence and mountain wave turbulence diagnostics representing various turbulence generation mechanisms are calculated using the global NWP model output, ii) the raw values of those turbulence diagnostics are converted into eddy dissipation rate (EDR), which represents the intensity of atmospheric turbulence, using the simple EDR conversion equation, and iii) KAF-GTF forecast is derived by combining the EDR-scaled turbulence diagnostics through ensemble averaging. The combination set of individual turbulence diagnostics and the EDR conversion equations used in the KAF-GTF system are applied as in GTG 3, considering that the combination set of turbulence diagnostics and their EDR conversion equations optimized for the global turbulence forecast were already constructed in the GTG3. In this study, the performance of two KAF-GTFs based on GFS and ECMWF are compared using turbulence cases reported from aircraft turbulence observation data for the evaluation, and the evaluation results will be represented in the conference.

Acknowledgment: This research was funded by the Republic Of Korea Air Force Weather Group Research Program (2023UMM0343), and was supported by Basic Science Research Program through the National Research Foundation of Korea (NRF) funded by the Ministry of Education (RS-2023-00250021).

How to cite: Lee, D.-B., Kim, J.-H., Hwang, J., Song, J.-I., and Jung, H.: Development of Global Integrated Turbulence Forecast System for the Republic Of Korea Air Force, EGU General Assembly 2024, Vienna, Austria, 14–19 Apr 2024, EGU24-14026, https://doi.org/10.5194/egusphere-egu24-14026, 2024.

The US National Weather Service (NWS) Aviation Weather Center (AWC) provides domestic and international aviation weather forecasts and warnings. The constituent Aviation Weather Testbed is a research-to-operations (R2O) facility that connects partners in government, industry, and academia to continually advance the state of the art of aviation forecast operations.

Upcoming changes to the NWS rapid refresh modeling suite offer new opportunities with higher resolution, longer time range North American forecasts promising greatly enhanced gridded aviation forecasts. Work is underway to redevelop aviation postprocessing for airframe icing and turbulence, as are efforts evaluate all of the numerical output through multiple collaborative testbed experiments bringing together collaborators, aviation customers, airline representatives, university researchers, stakeholders and others, with widely varying backgrounds to demonstrate and evaluate ongoing efforts.

AWC also operates one of the two World Area Forecast Centers (WAFC) in coordination with US Federal Aviation Administration in order to facilitate international flight operations. Following years of development and evaluation WAFC products are set to undergo significant upgrades in resolution and service capability in 2024.

This presentation will discuss testbed evaluation findings including forecast performance, and detail upcoming improvements to products and services resulting from these advances.


How to cite: Cross, A.: Numerical Weather Prediction research-to-operations updates at the US Aviation Weather Center, EGU General Assembly 2024, Vienna, Austria, 14–19 Apr 2024, EGU24-14349, https://doi.org/10.5194/egusphere-egu24-14349, 2024.

EGU24-14911 | ECS | Posters virtual | AS1.36

Develop an Application for Detecting Thunderstorm Cells and Tracking Their Motion Behaviour From Radar Images by Using Image Processing Techniques 

Mahesh Ramadoss, Gajendra Kumar, Brajesh Kumar Kanaujiya, Arun Sobhanan, Anoop Kumar Mishra, Meyyappan Thirunavukkarasu, and Murugesan Gopal

Thunderstorms can lead to heavy or extreme heavy rainfall events and impact many sectors, such as aviation, urban infrastructure, and power systems. In Aviation Meteorology, The main objective of weather radar1 is to identify thunderstorm cells on the flight route and issue warning messages with the traces of wind motions, rainfall intensity and possible turbulence. These attributes contribute significantly to how air navigation is performed safely and efficiently against high-risk weather hazardous zones. To improve the severe thunderstorm forecast, develop an automated thunderstorm warning system application that detects the thunderstorm cells from the radar images by using image processing techniques. It recognizes the size of the thunderstorm cells and measures the gauge between the airport and each cell. Moreover, estimating the velocity of cell movement towards the airport is an added advantage. It is an added-value product of the Aviation Weather Decision Support System2 (AWDSS). This application utilizes the two main Python packages OpenCV3 and Wradlib4 .


Keywords: Aviation Meteorology, Decision Support System, Image Processing Technique, Weather radar, OpenCV, Thunderstorm, Radar Imaging.


References

1) Theodore Fujita, T., McCarthy, J. (1990). The Application of Weather Radar to Aviation Meteorology. In: Atlas, D. (eds) Radar in Meteorology. American Meteorological Society, Boston, MA. https://doi.org/10.1007/978-1-935704-15-7_43.

2) Eilts, Michael & Shaw, Brent & Barrere, Charles & Fritchie, Robert & Carpenter, Richard & Spencer, Phillip & Li, Yanhong & Ladwig, William & Mitchell, Dewayne & Johnson, J. & Conway, J. (2015). THE AVIATION WEATHER DECISION SUPPORT SYSTEM: DATA INTEGRATION AND TECHNOLOGIES IN SUPPORT OF AVIATION OPERATIONS.

3) Open Souce Computer Vision (OpenCV),https://docs.opencv.org/4.x/.

4) wradlib: An Open Source Library for Weather Radar Data Processing, https://docs.wradlib.org/en/latest/.

How to cite: Ramadoss, M., Kumar, G., Kanaujiya, B. K., Sobhanan, A., Mishra, A. K., Thirunavukkarasu, M., and Gopal, M.: Develop an Application for Detecting Thunderstorm Cells and Tracking Their Motion Behaviour From Radar Images by Using Image Processing Techniques, EGU General Assembly 2024, Vienna, Austria, 14–19 Apr 2024, EGU24-14911, https://doi.org/10.5194/egusphere-egu24-14911, 2024.

We present a newly developed UAS and method for sensitive and simultaneous mapping of multiple trace gases including methane (CH4) and nitrous oxide (N2O). Using this UAS capacity, a study of the most highly emitting process steps at several wastewater treatment plants (WWTPs) in Sweden will be presented, where CH4 and N2O emissions are compared, showing the advantage of simultaneously sampling the two gases and the ability allowed by a drone to measure total gas fluxes from extended treatment steps. Usually only CH4 is the main focus of WWTP emission studies, but even relatively small unknown N2O emissions can have a large impact on the climate due to its warming potential being ~10 times higher than CH4 (on a 100-year timescale).

The UAS has everything onboard to collect all data needed for the flux calculations, including GPS, a light-weight weather station, sensitive gas sensors, and telemetry data storage. Everything is stored on a customized logger at 1 Hz producing a point cloud from which fluxes of the different gases can be calculated in post-processing.

In total 13 WWTPs were included in a one-year measurement campaign using the UAS, targeting mainly sludge treatment and the biological process step. This study exemplifies the capacity and measurement opportunities generated by multi-gas UAS.

How to cite: Gålfalk, M. and Bastviken, D.: Using a multi-gas UAS to compare methane and nitrous oxide emissions from highly emitting process steps at wastewater treatment plants , EGU General Assembly 2024, Vienna, Austria, 14–19 Apr 2024, EGU24-15056, https://doi.org/10.5194/egusphere-egu24-15056, 2024.

EGU24-15058 | ECS | Orals | AS1.36

Meteomatics' Meteodrones as precise alternative to radiosondes: a comparison 

Melanie Kobras, Lukas Hammerschmidt, Philipp Kryenbühl, Brad Guay, and Martin Fengler

Meteodrones are hexacopters equipped with specific sensors to collect information about temperature, humidity and wind in the lower and middle atmosphere. Besides being substantially more sustainable than radiosondes, Meteodrones have the significant advantage of measuring atmospheric conditions in a vertical profile instead of being deflected from their launching position by wind.

For continual verification of data quality, the measurements are compared to co-located standard measurements from radiosondes and evaluated against the World Meteorological Organization's (WMO) observation requirements for high-resolution numerical weather prediction.

In addition to a selection of measurement profiles, we present the evaluation of atmospheric data within an extensive 6-month validation period, employing our improved processing algorithms. Therefore, we demonstrate the capability of automatically operated Meteodrones to close the meteorological data gap in the lower atmosphere in order to considerably improve numerical weather forecasts.

How to cite: Kobras, M., Hammerschmidt, L., Kryenbühl, P., Guay, B., and Fengler, M.: Meteomatics' Meteodrones as precise alternative to radiosondes: a comparison, EGU General Assembly 2024, Vienna, Austria, 14–19 Apr 2024, EGU24-15058, https://doi.org/10.5194/egusphere-egu24-15058, 2024.

EGU24-17567 | ECS | Posters on site | AS1.36

In-situ Saharan dust observations over the Eastern Mediterranean with an uncrewed aircraft system 

Vasileios Savvakis, Martin Schön, Matteo Bramati, Jens Bange, and Andreas Platis

The Saharan desert is the main source of mineral dust in the atmosphere, and its presence in the air can have a significant impact on the solar radiation budget. In evaluating the radiative effect of airborne mineral dust, aerosol charge may be a critical factor. This space charge and its relationship to particle concentrations is not taken into account by current model simulations, and such in-situ measurements are hardly available. In this work, a novel sensor network equipped on an uncrewed aircraft system (UAS) of type MASC-3 was employed for vertical profiling of Saharan dust particle concentrations, meteorological (temperature, relative humidity and wind field) parameters and turbulent kinetic energy (TKE), during a dust event that occurred in Orounda, Cyprus in April 2022. The MASC-3 performed profiles up to 3000 m altitude, and identified the vertical extent of the dust cloud, which was located between 1900 and 2500 m. We were able to capture the evolution of the event over several days, and additional numerical simulation and remote sensing observations verify the results. During the first day of measurements, when dust load was the highest, charge data from the MASC-3 also allowed for investigation of aerosol concentrations and dust electrification. For the first time, this innovative sensor system provided in-situ UAS measurements of the aforementioned quantities and described the dust event in detail, and with high resolution. Considerations on aircraft charging, the effect of turbulent levels and local meteorology, on the space charge / aerosol data collected by the MASC-3, as well as probing Saharan dust events more generally, are elaborated for further related research.

How to cite: Savvakis, V., Schön, M., Bramati, M., Bange, J., and Platis, A.: In-situ Saharan dust observations over the Eastern Mediterranean with an uncrewed aircraft system, EGU General Assembly 2024, Vienna, Austria, 14–19 Apr 2024, EGU24-17567, https://doi.org/10.5194/egusphere-egu24-17567, 2024.

EGU24-17655 | Orals | AS1.36

Measurement of Water Vapor on Commercial Aviation Flight Tracks 

Scott Herndon, Christoph Dyroff, Bruce Daube, Tara Yacovitch, and Michael Moore

We present a groundbreaking water vapor sensor specifically engineered for autonomous deployment on commercial aircraft. This innovative sensor was recently put to the test aboard a research aircraft, which conducted chase flights aimed at assessing the emissions from sustainable aviation fuel. In this presentation, we will explore the sensor's performance in flight conditions and delve into the key design features that make it suitable for this application.

A significant aspect of our study is the potential of this monitoring system to serve as a routine, cost-effective, and highly reliable solution for automated water vapor measurement on commercial flights. The data acquired through this system is expected to significantly enhance now-casting model systems. Specifically, it will provide high-resolution water vapor data crucial for evaluating the Appleman-Schmidt criterion, thereby aiding in the prevention of persistent contrail formation – a major environmental concern in aviation.

Our findings demonstrate the feasibility and value of implementing such a water vapor monitoring system in commercial aviation, with implications for both environmental monitoring and the advancement of sustainable aviation practices.

How to cite: Herndon, S., Dyroff, C., Daube, B., Yacovitch, T., and Moore, M.: Measurement of Water Vapor on Commercial Aviation Flight Tracks, EGU General Assembly 2024, Vienna, Austria, 14–19 Apr 2024, EGU24-17655, https://doi.org/10.5194/egusphere-egu24-17655, 2024.

EGU24-18251 | Orals | AS1.36

On the fidelity of numerical weather prediction model forecasts to identify ice supersaturated regions for aircraft contrail management 

Adam Durant, Greg Thompson, Chloé Sholzen, Scott O’Donoghue, Max Haughton, Rod Jones, and Conor Farrington

The potential atmospheric warming and impact on climate by aircraft contrails may be similar in magnitude to the direct effect from carbon dioxide emissions across all aviation.  Contrail management via optimized flight planning considering aircraft performance and CO2 emissions, and the presence of ice supersaturated regions (ISSR), could mitigate any potential climate impacts.  The success of aircraft deviations depends on accurate predictions of the water vapor in the upper troposphere and lower stratosphere (UTLS). 

To evaluate the performance of two global numerical weather prediction (NWP) models (the US Global Forecast System, GFS; and the European Integrated Forecast System, IFS), one reanalysis model (the European fifth generation ECMWF atmospheric reanalysis, ERA5), and one research-grade mesoscale model to predict UTLS moisture and ISSR, we compared humidity forecasts to observations from 383 aircraft flights and radiosondes from 168 launch times over Europe and the Middle East for 10 months in 2022.

The research model mirrored observed distributions of relative humidity with respect to ice (RHice)  at all locations above 25,000 ft AMSL, while GFS and IFS forecasts poorly reproduced the observed distribution, and ERA 5 reanalysis only slightly improved on the skill of the IFS. Furthermore, ISSR validation was performed using near equal-area neighbourhoods to compute the Matthew Correlation Coefficient and F1-score and demonstrated a higher model score (F1=0.66) than IFS (F1=0.62), while the GFS score is close to zero (F1≈0) due to an absence of predictions of RHice greater than 100% in stark contrast to observations.  Importantly, the research model also correctly predicts RHice<100% in 92% of model-observation comparisons, identifying where atmospheric conditions are not conducive to persistent contrail formation. 

In summary, NWP model skill is adequate, when configured for the use case, to identify both ISSR and dry atmosphere locations and ensure a mitigation of the atmospheric warming caused by aircraft contrails through aircraft routing to reduce non-CO2 climate impact of aviation.

How to cite: Durant, A., Thompson, G., Sholzen, C., O’Donoghue, S., Haughton, M., Jones, R., and Farrington, C.: On the fidelity of numerical weather prediction model forecasts to identify ice supersaturated regions for aircraft contrail management, EGU General Assembly 2024, Vienna, Austria, 14–19 Apr 2024, EGU24-18251, https://doi.org/10.5194/egusphere-egu24-18251, 2024.

EGU24-20568 | ECS | Orals | AS1.36

Redefining decision making: introducing probabilistic forecast products to aviation applications 

Hélène Barras, Roman Attinger, Gabriela Aznar, Melanie Irrgang, Johannes Landmann, Thomas Reiniger, Kathrin Wehrli, Szilvia Exterde, Thomas Jordi, and Claudia Stocker

There are no aviation operations without reliable weather information. Efficient and safe air traffic management relies on accurate meteorological predictions on different timescales from nowcasting to the midrange. On top of that, it is crucial to enable a safe interpretation of uncertain weather data so that these forecasts are fruitful for planning and decision making within aircraft operations.

So far, the aviation meteogram product issued by MeteoSwiss consists of deterministic predictions and threshold exceedance probabilities. This does not exploit the full potential of the underlying forecasts, as (1) deterministic predictions may be biased, and (2) the current product does not present the full uncertainty picture to decision makers.

In response to these challenges, we propose a transition towards delivering probabilistic forecasts. This shift unlocks the full potential of information-based decision making, which finally allows smoother and  economically and ecologically more sustainable aviation operations. Importantly, as probabilistic data and its potential is largely unknown to our customers so far, a robust program of frequent training and education is necessary.

In this presentation, we showcase new machine learning ensemble predictions for thunderstorms, wind, and visibility at airports in Switzerland for the nowcasting and short-term forecasting range. In particular, we focus on their comprehensive visualization in a meteogram tailored to convey ensemble information and discuss challenges, advantages and future ideas.

How to cite: Barras, H., Attinger, R., Aznar, G., Irrgang, M., Landmann, J., Reiniger, T., Wehrli, K., Exterde, S., Jordi, T., and Stocker, C.: Redefining decision making: introducing probabilistic forecast products to aviation applications, EGU General Assembly 2024, Vienna, Austria, 14–19 Apr 2024, EGU24-20568, https://doi.org/10.5194/egusphere-egu24-20568, 2024.

EGU24-21385 | ECS | Posters on site | AS1.36

Evaluation of Robust Flight Attribution Algorithm for Contrail Avoidance 

Maria Paula Barbosa, Steven Barrett, Sebastian Eastham, Vincent Meijer, and Louis Robion

Condensation trails, or “contrails,” are line-shaped clouds that form when airplanes fly through cold and humid parts of the atmosphere which are ice-supersaturated. Various studies have shown that long-lasting or “persistent” contrails may be responsible for more than half of aviation’s radiative forcing (RF) (Lee, et al., 2021). Efforts to mitigate persistent contrail formation include operational contrail avoidance. Current research suggests that minor (~2000 ft) deviations in altitude of flights during cruise, in conjunction with advancing technologies, have the potential to reduce contrail climate forcing by approximately 90% (Teoh, et al., 2020).

Identifying and attributing observed contrails to specific individual flights is critical to demonstrating the success of any contrail avoidance strategy, as it establishes whether a deviated flight created a contrail. Reliable attribution of contrails to individual flights is needed to provide verifiability and accountability before any large-scale implementation of contrail avoidance policies takes place. Flight attribution leverages both Earth-observation methods, such as satellite images and weather data, and flight data. However, temporal and spatial "blindspots" in satellite instruments, coupled with uncertainties in wind fields, have hindered reliable flight attribution.

In this work, we consider two approaches: a “Single-instance” probabilistic flight attribution algorithm and a “Multi-frame” probabilistic flight attribution algorithm that accounts for discrepancies in contrail observability and weather data errors. The inputs to both algorithms include contrail detections, ERA5 weather data, and FlightAware ADSB flight data. The Single-instance algorithm computes a probabilistic “match score” for flights and contrails at an individual temporal point. This probability is calculated using distance, heading, and altitude measures. The Multi-frame algorithm computes a probabilistic match score utilizing information from different wind ensembles and previous temporal points in addition to the same baseline measures.

To perform this analysis, a dataset of over a hundred manually labeled and attributed contrails was created that captured regional (across the continental United States) and diurnal variation. These were categorized depending on the perceived difficulty of the attribution (due to background cloudiness and flight track density). An initial assessment comparing the outputs of the algorithms to the manually labeled attributions shows that while both our algorithms exhibit strong performance in high contrail observability and low flight density scenes, the Single-instance algorithm demonstrates suboptimal results under conditions of interrupted contrail observability and increased flight density. The Multi-frame algorithm, however, was able to identify flight matches much more accurately in these more challenging scenes. The development of a robust flight-matching algorithm and evaluation dataset is critical to the validation of contrail avoidance efforts. Furthermore, it can provide additional insight into the relationship between meteorology, aircraft parameters, and observable contrails, supporting future efforts to reduce contrail formation through technological or operational means.

How to cite: Barbosa, M. P., Barrett, S., Eastham, S., Meijer, V., and Robion, L.: Evaluation of Robust Flight Attribution Algorithm for Contrail Avoidance, EGU General Assembly 2024, Vienna, Austria, 14–19 Apr 2024, EGU24-21385, https://doi.org/10.5194/egusphere-egu24-21385, 2024.

EGU24-22265 | Posters virtual | AS1.36

Mountain Ice Fog and Visibility during CFACT 

ismail gultepe, zhaoxia Pu, Eric Pardyjak, sebastian Hoch, Alexei Perelet, and Martin Agelin-Chaab

The objective of this study is to characterize visibility and microphysics of cold-fog conditions during The Cold Fog Amongst Complex Terrain (CFACT) project, which was designed to investigate the life cycle of cold fog in the Heber Valley, Utah. The field campaign was conducted from 7 January to 23 February 2022 and was supported with observations and resources from the NSF Lower Atmospheric Observing Facilities (LAOF), managed by NCAR’s Earth Observing Laboratory (EOL), as well as the University of Utah and Ontario Technical University. Heber Valley is surrounded by canyons, mountains and irregular topography where the Provo River streams along the valley floor from Jordanelle Reservoir at the north to Deer Creek (DC) Reservoir at the southeastern end at 1652 m above sea level (ASL). The highest peaks surrounding the valley are at about 3500 m (ASL) to the west and southwest of the project area.

The DC supersite had extensive ice and droplet microphysical as well as precipitation measurements obtained using a ground-based Gondola (composed of a Droplet Measurement Technologies (DMT) Cloud Droplet Probe - CDP and Back-scatter Cloud Probe - BCP), a DMT Fog Monitor (FM120), a Mesaphotonics Cloud Droplet Measurement System (CDMS), a DMT Ground-based Cloud Imaging Probe (GCIP), a Vaisala Present Weather Detector (PWD52), and an OTT Parsivel. During the project, aerosol measurements were performed using a GRIMM Aerosol Spectrometer, a T.S.I. Scanning Mobility Particle Sizer (SMPS), and a DMT Cloud Condensation Nuclei (CCN) counter, as well as filter samplers. These instruments covered a size range from 8 nm up to cm size range representing aerosols, fog particles, and precipitation. Measurements from a Halo Photonics doppler wind lidar, a Vaisala CL61 ceilometer, a tethered balloon system (TBS), and a 32-m turbulence tower were used to characterize vertical profiles of fog microphysics and aerosols, as well as the dynamic and thermodynamic structure. Eleven significant weather events occurred during the 47 days of the CFACT campaign that included snowfall, freezing fog, ice fog (IF), and light ice crystal precipitation when Vis<5 km. In the presentation, IF events will be discussed with respect to ice crystal particle size spectra and habit, visibility, physical parameterizations, as well as measurement and prediction challenges faced.


How to cite: gultepe, I., Pu, Z., Pardyjak, E., Hoch, S., Perelet, A., and Agelin-Chaab, M.: Mountain Ice Fog and Visibility during CFACT, EGU General Assembly 2024, Vienna, Austria, 14–19 Apr 2024, EGU24-22265, https://doi.org/10.5194/egusphere-egu24-22265, 2024.

EGU24-195 | ECS | Posters on site | ERE2.1

An observational study on the microclimate and soil thermal regimes under solar photovoltaic arrays 

Junqing Zheng, Yong Luo, Rui Chang, and Xiaoqing Gao

The high demand for low-carbon energy sources to mitigate climate change has prompted a rapid increase in ground-mounted solar parks. The implementation of photovoltaic (PV) significantly impacted the local climate and ecosystem, which are both poorly understood. To investigate the effects of a typical solar park on the Gobi ecological system, local microclimate and soil thermal regimes were measured year-round under and between PV arrays, at an applied solar park sited in Xinjiang, China. Our results demonstrated their seasonal and diurnal changes. Under solar PV arrays, the mean annual net radiation and wind speed decreased by 92.68% and 50.53% respectively. In contrast, PV panels caused an increase of the rear sides air by 10.12% with 0.87°C. South-facing PV panels reduced wind speed with the prevailing northerly wind below. In addition, the relative humidity rapidly decreased when snow covered the ground, but slightly increased from April to September. We found the soil under PV panels was cooler and tended to be a sink of energy during spring and summer whereas was more often a source during autumn and winter compared with the soil between PV panels. Observed data developed the understanding of the energy processes of solar parks in Gobi ecosystems and provided evidence to support the sustainable management of the solar park.

References:

Zheng, J., Luo, Y., Chang, R., and Gao, X., 2023. An observational study on the microclimate and soil thermal regimes under solar photovoltaic arrays. Solar Energy. 266, 112159.

How to cite: Zheng, J., Luo, Y., Chang, R., and Gao, X.: An observational study on the microclimate and soil thermal regimes under solar photovoltaic arrays, EGU General Assembly 2024, Vienna, Austria, 14–19 Apr 2024, EGU24-195, https://doi.org/10.5194/egusphere-egu24-195, 2024.

Wind resource assessment studies over large regions provide the basis for the preliminary identification of locations with promising wind energy prospects. In past studies, several authors have mapped the mean wind speed across large regions using spatial interpolation methods or machine learning models. In recent studies, more emphasis has been placed on mapping the entire wind speed distribution to evaluate the wind resource variability at unsampled locations. Most of these studies have assumed that the wind speed distribution across the entire region belongs to a single family of probability distribution functions and then processed to map the distribution parameters. A flexible non-parametric approach for wind speed distribution mapping is proposed in this study. The new approach is based on mapping various wind speed quantiles at some fixed percentile points in the region using a machine learning model. Then, at any unsampled location, these quantiles are used as input of an asymmetric kernel estimator of cumulative distribution function to recover the whole wind speed distribution. Asymmetric kernel estimators solve the probability leakage problem that appears when fitting symmetric kernels to bounded variables such as wind speed. The non-parametric approach for wind speed distribution mapping was more effective than a traditional approach based on mapping the parameters of a distribution function. In the best scenario, an improvement was observed between 6% (test samples) and 9% (cross-validation) of the Kolmogorov-Smirnov statistic between the observed and estimated wind speed distribution. The non-parametric approach is recommended for regions with highly variable wind regimes that cannot be captured by a single family of distribution functions.

How to cite: Houndekindo, F. and Ouarda, T.: Mapping wind speed distribution across large regions using machine learning and asymmetric kernel estimators., EGU General Assembly 2024, Vienna, Austria, 14–19 Apr 2024, EGU24-1432, https://doi.org/10.5194/egusphere-egu24-1432, 2024.

EGU24-1609 | Orals | ERE2.1

SHIRENDA: A long-term high-resolution database of electricity demand and wind, hydro and PV renewable resources for Spain 

David Pozo-Vázquez, Guadalupe Sánchez-Hernandez, Antonio Jiménez-Garrote, Miguel López-Cuesta, Inés Galván-León, Ricardo Aler-Mur, Joaquín Tovar-Pescador, José Antonio Ruiz-Arias, and Francisco Santos-Alamilllos

Renewable energies (RES) will play a central role in national energy systems worldwide in the near future, boosted by the climate change issue and the ever-growing competitiveness of these energies. An example is the Spanish roadmap to produce 80% of its electricity from renewables by 2030.
However, the transition from the current generation mix to decarbonized energy systems is a formidable challenge, as they must be technically reliable and economically viable. To design such systems, the spatial and temporal variability of RES, combined with proper simulation tools, are determinant. In recent decades, energy system models have emerged as valuable tools for conducting these analyses. These models allow, for a specific region, the analysis of the optimal allocation and sizing of new renewable plants, taking into account the variability of generation and demand, energy costs, integration and the issue of transmission. The key input to these models is a database of RES resources in the study region. However, in many cases, the extent to which these databases represent the actual RES for a given country is far from optimal, reducing confidence in the results. In general, current RES databases face two main problems: 1) low reliability of energy estimates and 2) lack of adequate spatial and/or temporal resolution. In most cases, these problems arise from the lack of actual measurements for model training and validation.
In this work, we present SHIRENDA (Spanish High-resolution Renewable ENergies and Demand database), an enhanced open access database of Spanish renewable energies resources and demand. The database consists of hourly values of wind, solar photovoltaic and hydroelectric capacity factors (CF), together with electricity demand, covering the period 1990-2020, for each of the Spanish NUTS3 regions, which is an unprecedented spatial resolution so far. CFs and demand values were derived using state-of-the-art machine learning models based on: 1) actual values of installed RES capacities (Jiménez-Garrote et al, 2023); 2) real energy and demand data derived from the Spanish TSO and 3) meteorological data derived from the ERA5 reanalysis. The database covers the period 1990-2020, with the period 2014-2020 used for model training and validation purposes.
The SHIRENDA database has been developed within the framework of the MET4LOWCAR project, funded by the Government of Spain, and aims to gather the desirable characteristics to carry out reliable studies on modeling and analysis of energy systems, thus contributing to an adequate energy transition. Notably, the high spatial resolution allows the very high spatial variability of RES resources in the study region to be properly taken into account. At the same time, the high temporal resolution, along with the temporal coverage, allows for properly assessing the impact of climate variability, extreme meteorological conditions and compound events in a future decarbonized energy systems in Spain. 


Reference: Jimenez-Garrote et al, 2023. https://doi.org/10.1016/j.solener.2023.03.009

How to cite: Pozo-Vázquez, D., Sánchez-Hernandez, G., Jiménez-Garrote, A., López-Cuesta, M., Galván-León, I., Aler-Mur, R., Tovar-Pescador, J., Ruiz-Arias, J. A., and Santos-Alamilllos, F.: SHIRENDA: A long-term high-resolution database of electricity demand and wind, hydro and PV renewable resources for Spain, EGU General Assembly 2024, Vienna, Austria, 14–19 Apr 2024, EGU24-1609, https://doi.org/10.5194/egusphere-egu24-1609, 2024.

In June 2023 Swiss people voted a new climate law that set a net-zero emission goal to be reached by 2050 via a full energetic transition from fossil fuels to renewables. The country’s Energy Strategy estimates that 7% (4.3 TWh) of future total renewable energy will be supplied by wind turbines, which requires an increase in the number of installed devices from the 37 currently operating to 760. Such an objective presents numerous challenges as available space is limited by technical restrictions, the country’s complex terrain, and competition with other types of land use.

Thanks to qualities like small size and weight, low noise emission levels, and the ability to operate with winds blowing from any direction at relatively low speed (> 2 m/s), vertical axis wind turbines (VAWTs) installed in urban areas are an attractive alternative to overcome the issues associated with large wind farms. Despite this, the potential for wind energy micro-generation in complex urban settings remains largely unexplored.

Private households use one third of all energy consumed in Switzerland, and residential renewable energy generation currently consists almost exclusively of photovoltaic (PV) panels which, in 2021, represented 78% of all solar systems operating in the country. No similar statistics are available for residential wind energy generation. Even in the scientific literature, current understanding of the interaction between wind and urban areas is limited, and the knowledge about urban wind resources is markedly inadequate to address the challenges posed by climate change to both local and global energy sectors.

Here we use use the Weather Research and Forecast (WRF) model to simulate mean near-surface wind speed over the cities of Lausanne and Geneva to assess the potential for wind energy generation. We perform simulations at 300 m grid spacing and across 85 vertical model levels, with hourly output interval throughout one entire year to identify diurnal and seasonal wind speed trends. We then use power curves of select VAWTs to translate mean wind speed data into potential electrical output maps and time series, over all model cells classified as urban.  

Our results show that mean wind speed is generally higher in Lausanne than in Geneva, especially at nighttime. Diurnal cycles evolve markedly differently between the two cities, although differences are at times minimized due to seasonal changes. The average potential for wind energy harvesting using VAWTs in urban environments varies with turbine size and geographical area. The average daily total energy generation potential is one order of magnitude greater in Lausanne compared to Geneva. In Lausanne, top generation is expected during the nighttime across most months, allowing for a good integration of photovoltaic generation. The opposite happens in Geneva where already lower peak wind speed, and associated energy generation, always culminate during the afternoon.

This research highlights the potential for urban wind energy micro-generation, drawing attention to the role of regional differences and the need and the importance of numerical simulations for quantitative assessments at the city and regional scales.

How to cite: Brandi, A. and Manoli, G.: Numerical assessment of urban wind energy micro-generation potential: a comparison between two Swiss cities, EGU General Assembly 2024, Vienna, Austria, 14–19 Apr 2024, EGU24-1770, https://doi.org/10.5194/egusphere-egu24-1770, 2024.

Short-term solar irradiance forecasts are becoming increasingly important as power grid operators have to deal with the uncertainty in incoming surface solar irradiance (SSI) and the expected photovoltaic (PV) power production. Geostationary satellites are an excellent source of spectral imagery of SSI-relevant atmospheric components over large geographical regions. The spectral measurements of the Spinning Enhanced Visible and Infrared Imager (SEVIRI) onboard the geostationary Meteosat Second Generation satellite form the basis of many SSI estimation and forecasting techniques [3], [4], [6]. These forecasting techniques usually rely on level 2 products to estimate SSI from reflectance but this induces a significant delay in the forecasting cycle. We demonstrate that using a deep learning regressor to estimate surface solar irradiance can drastically reduce this delay.

Previous machine learning-based methods for estimating SSI from geostationary reflectance imagers show great promise and can outperform state-of-the-art radiative transfer retrieval methods at the ground stations used as training sites [1], [2], [5]. Previous methods only use ground station SSI to train on, but point-wise estimators trained on a group of ground stations do not generalize well to out-of-sample ground stations, possibly because of changes in surface albedo [5].

To improve the generalization, we introduce a deep learning spatial convolution operator which is trained to emulate radiative-transfer SSI retrievals from spectral satellite imagery. Our SSI estimator model is fine-tuned on an extensive network of ground stations as a second training set. In this contribution, we will demonstrate the performance of the radiative transfer emulator, its applications and latency based on independent measurements from ground stations across Europe.


References
[1] H. Jiang, N. Lu, J. Qin, W. Tang, and L. Yao, “A deep learning algorithm to estimate hourly global solar radiation from geostationary satellite data,” Renewable and Sustainable Energy Reviews, vol. 114, p. 109 327, Oct. 1, 2019, ISSN: 1364-0321. doi: 10.1016/j.rser.2019.109327.
[2] D. Hao, G. R. Asrar, Y. Zeng, et al., “DSCOVR/EPIC-derived global hourly and daily downward shortwave and photosynthetically active radiation data at 0.1° × 0.1° resolution,” Earth System Science Data, vol. 12, no. 3, pp. 2209–2221, Sep. 15, 2020, Publisher: Copernicus GmbH, ISSN: 1866-3508. doi: 10.5194/essd-12-2209-2020.
[3] Y. Lu, L. Wang, C. Zhu, et al., “Predicting surface solar radiation using a hybrid radiative transfer–machine learning model,” Renewable and Sustainable
Energy Reviews, vol. 173, p. 113 105, Mar. 1, 2023, ISSN: 1364-0321. doi: 10.1016/j.rser.2022.113105.
[4] Q. Paletta, G. Terren-Serrano, Y. Nie, et al., “Advances in solar forecasting: Computer vision with deep learning,” Advances in Applied Energy, vol. 11,
p. 100 150, Sep. 1, 2023, ISSN: 2666-7924. doi: 10.1016/j.adapen.2023.100150.
[5] H. Verbois, Y.-M. Saint-Drenan, V. Becquet, B. Gschwind, and P. Blanc, “Retrieval of surface solar irradiance from satellite imagery using machine learning: Pitfalls and perspectives,” Atmospheric Measurement Techniques, vol. 16, no. 18, pp. 4165–4181, Sep. 19, 2023, ISSN: 1867-8548. doi: 10.5194/amt-16-4165-2023.
[6] A. Carpentieri, D. Folini, D. Nerini, S. Pulkkinen, M. Wild, and A. Meyer, “Intraday probabilistic forecasts of surface solar radiation with cloud scale-dependent autoregressive advection,” Applied Energy, vol. 351, doi: 10.1016/j.apenergy.2023.121775.

How to cite: Meyer, A. and Schuurman, K.: Predicting surface solar irradiance from satellite imagery with deep learning radiative transfer emulation, EGU General Assembly 2024, Vienna, Austria, 14–19 Apr 2024, EGU24-2452, https://doi.org/10.5194/egusphere-egu24-2452, 2024.

EGU24-2922 | Posters virtual | ERE2.1 | Highlight

Storm Daria: Societal and energy impacts in northwest Europe on 25-26 January 1990 

Anthony Kettle

Between late January and early March of 1990 Europe was hit by a sequence of severe winter storms that caused significant infrastructure damage and a large number fatalities. The storm sequence started with Hurricane Daria on 25-26 January 1990, which was one of the most serious events of the storm cluster, especially for the UK.  The low pressure centre moved in the west-northwest direction across Ireland, southern Scotland, and northern Jutland before moving further into the Baltic. The strongest winds south of the trajectory path caused significant damage and disruptions in England, France, Belgium, the Netherlands, and West Germany.   Media reports highlighted building damage, interrupted transportation networks, power outages, and fatalities.  There were also a series of maritime emergencies in the English Channel, North Sea, and Baltic Sea.  This contribution takes a closer look at Storm Daria, presenting an overview of meteorological measurements and the societal impacts, followed by an analysis of the North Sea tide gauge network to understand the storm surge and possible large wave occurrences.  The results for Storm Daria are compared with other serious storms of the past 30 years, highlighting similarities and differences in the patterns of storm impact.  Offshore wind energy was at the planning stage in this early period, but onshore wind energy was established in Europe, and the storm is an important case study of extreme meteorological conditions that that can impact energy infrastructure.  The 1990 winter storm sequence was analyzed in detail by the insurance industry because of the large damage costs, and evidence of an emerging climate change contribution was highlighted.

How to cite: Kettle, A.: Storm Daria: Societal and energy impacts in northwest Europe on 25-26 January 1990, EGU General Assembly 2024, Vienna, Austria, 14–19 Apr 2024, EGU24-2922, https://doi.org/10.5194/egusphere-egu24-2922, 2024.

EGU24-4688 | ECS | Orals | ERE2.1

Effects of Upstream Obstacles on Energy Production of Solar and Wind Farms 

Abhirup Bhattacharya and Somnath Baidya Roy

Power production from a renewable energy (RE) source such as a wind farm or urban roof-top solar panel installation is highly sensitive to the obstacles around it, particularly those which are in the upstream direction. RE installations can avoid or minimize the effects of obstacles using proper planning. However, obstacles that come up after the plant is operational can lead to significant loss in power production and revenue. In this study we quantitatively explore two common examples – shading effect of neighbouring buildings on roof-top solar plants and wake effects of upstream wind turbines on offshore wind farms.

The first example considers a horizontal solar panel atop an urban building in a relatively congested neighbourhood. We built a model to quantify the shading effects of neighbouring tall buildings on the solar panel. The model calculates the position of the Sun on the celestial dome at every minute with astronomical accuracy. Then the solar irradiance is calculated for a clear-sky environment. After that the shadow profile is calculated and visualized for obstacle buildings with any height and at any distance. And finally, the loss in available insolation and the power production is calculated. The results show significant power loss due to the building shading effect. For example, a roof-top solar panel surrounded by a 20m taller building at 20m distance can reduce power generation by more than 50%.

The second example is where a new wind farm is constructed upstream of an existing wind farm. We used two different models to quantify the meteorological effects of the upstream wind turbines on downwind turbines. The first one involves Jensen Wake Model (JWM), a static wake recovery model to simulate the wake effects of upstream obstacle turbine on downwind turbine. The second approach makes use of the Wind Turbine Parameterization (WTP) in WRF. This method implements wake loss using a wind turbine power curve data and wake recovery through atmospheric vertical mixing. A case study has been conducted for a hypothetical offshore wind farm situated in Palk Strait between India and Sri Lanka by placing wind farms of different shapes and dimensions in the upwind direction. The results show a range of losses in annual power production between 3 – 12 MW, which roughly converts into €1.1M – €4.1M.

This study demonstrates that the effects of upstream obstacles on RE sources are non-trivial and can have serious impacts on the performance on RE installations. Currently, local zoning laws in India and many countries do not protect RE installations from future constructions that can act as obstacles. Hence, effective policies are required to safeguard the return on investments in the RE industry.

How to cite: Bhattacharya, A. and Baidya Roy, S.: Effects of Upstream Obstacles on Energy Production of Solar and Wind Farms, EGU General Assembly 2024, Vienna, Austria, 14–19 Apr 2024, EGU24-4688, https://doi.org/10.5194/egusphere-egu24-4688, 2024.

EGU24-4715 | Orals | ERE2.1 | Highlight

Impacts of Air Pollutant Emissions on Solar Energy Generation 

Fei Yao, Paul Palmer, Jianzheng Liu, Hongwen Chen, and Yuan Wang

Particulate matter (PM) in the atmosphere and deposited on solar photovoltaic (PV) panels reduce PV energy generation. Reducing anthropogenic PM sources will therefore increase carbon-free energy generation. However, we lack a global understanding of the sectors that would be the most effective at achieving the necessary reductions in PM sources. We combine well-evaluated models of solar PV performance and atmospheric composition to show that deep cuts in air pollutant emissions from the residential sector substantially benefit Asian PV power output. Specifically, halving residential emissions of PM would lead to an additional 10.3 TWh yr-1 and 2.5 TWh yr-1 of PV energy generation in China and India in 2020, respectively. Compared to the 2020 electricity generation of 261.6 TWh yr-1 and 54.4 TWh yr-1 from solar PV technology in China and India, respectively, these unrealised sources of energy generation represent an improvement of approximately 4-5%. While anthropogenic PM sources originate mainly from producers, they are responding to changes in domestic and international consumer demand. This raises a critical question about the extent to which consumers, who benefit from the emission process, should be responsible for the resulting unrealised, cleaner PV energy generation. Focusing on Northeast Asia (NEA), we investigate the source-receptor relationship of PV energy losses attributable to PM pollution among China, South Korea, and Japan by incorporating a new input-output model into the combined models of solar PV performance and atmospheric composition. Our findings reveal that the solar energy generation losses attributable to PM pollution in NEA caused by emissions produced in China surpass those linked to China’s consumption that stimulates emissions in China and elsewhere, with the disparity amounting to 9.3 TWh yr-1. Conversely, a reverse pattern is observed for solar energy generation losses linked to emissions produced versus induced by consumption in South Korea and Japan, where the disparities are found to be -0.023 TWh yr-1 and -0.231 TWh yr-1, respectively. In other words, when we consider international trade across NEA, we find there is diminished (augmented) responsibility for China (South Korea and Japan) in explaining PV-related energy losses attributable to PM pollution.

How to cite: Yao, F., Palmer, P., Liu, J., Chen, H., and Wang, Y.: Impacts of Air Pollutant Emissions on Solar Energy Generation, EGU General Assembly 2024, Vienna, Austria, 14–19 Apr 2024, EGU24-4715, https://doi.org/10.5194/egusphere-egu24-4715, 2024.

EGU24-4887 | ECS | Posters on site | ERE2.1

A parameterization scheme for the floating wind farm in a coupled atmosphere-wave model (COAWST v3.7) 

Shaokun Deng and Shengli Chen

Coupling Weather Research and Forecasting (WRF) model with wind farm parameterization can be effective in examining the performance of large-scale wind farms. However, the current scheme is not suitable for floating wind turbines. In this study, a new scheme is developed for floating wind farm parameterization (FWFP) in the WRF model. The impacts of the side columns of a semi-submersible floating wind turbine on waves are firstly parameterized in the spectral wave model (SWAN) where the key idea is to consider both inertial and drag forces on side columns. A machine learning model is trained using results of idealized high-resolution SWAN simulations and then implemented in the WRF to form the FWFP. The difference between our new scheme and the original scheme in a realistic case is investigated using a coupled atmosphere-wave model. Results indicate that the original scheme underestimates the power output of the entire floating wind farm in the winter scenario. On average, the power output of a single turbine is underestimated by a maximum of 694 kW (12 %). The turbulent kinetic energy decreases within the wind farm, with the greatest drop of 0.4 m2 s-2 at the top of the turbine. This demonstrates that the FWFP is necessary for both predicting the power generated by floating wind farms and evaluating the impact of floating wind farms on the surrounding environment.

How to cite: Deng, S. and Chen, S.: A parameterization scheme for the floating wind farm in a coupled atmosphere-wave model (COAWST v3.7), EGU General Assembly 2024, Vienna, Austria, 14–19 Apr 2024, EGU24-4887, https://doi.org/10.5194/egusphere-egu24-4887, 2024.

EGU24-4945 | ECS | Orals | ERE2.1

Effect of Rainfall on Evolution of the wind turbine wake:A LES Study 

Xuefeng Yang and Shengli Chen

The rainfall directly affects wind turbine operation by eroding the turbine blades and changing their aerodynamic performance, however, little research has been conducted on the effects of rainfall on wake evolution. The present study simulates the impact of rainfall on wind turbine wake using a coupled LES-ADMR model, in which a double Euler method is employed for the rainfall injection. The numerical simulation results indicate that the rainfall reduces the wake wind speed in the sweep area while increasing it in the outer region of the upper blade tip, reaching up to 2.1% for increment. Rainfall also weakens the turbulence in the near wake and the outer region of the top tip (as much as 2.0%), with the influence extending up to 10 diameters downstream the wind turbine. These modifications are positively correlated with the rainfall intensity and inversely correlated with wind speed. By analyzing the rainfall-induced changes in MKE (Mean Kinetic Energy) and TKE (Turbulent Kinetic Energy) budget terms, the study reveals that the alteration of turbulent radial transport of MKE is the main cause of changes in wind speed, while the variation of shear production of  TKE is responsible for the turbulent intensity changes. The rainfall-induced change of  reynold stress u'w' is the root cause of the above phenomenons.

How to cite: Yang, X. and Chen, S.: Effect of Rainfall on Evolution of the wind turbine wake:A LES Study, EGU General Assembly 2024, Vienna, Austria, 14–19 Apr 2024, EGU24-4945, https://doi.org/10.5194/egusphere-egu24-4945, 2024.

EGU24-5042 | Orals | ERE2.1

West African operational daily solar forecast errors and their links with meteorological conditions 

Sandrine Anquetin, Léo Clauzel, Christophe Lavaysse, Guillaume Tremoy, and Damien Raynaud

With its commitment to reduce greenhouse gas emissions and harnessing the potential of renewable energy, the West African region is at the forefront of global environmental challenges. This work focuses on the specific aspect of solar energy, which holds significant promise in the region. High quality solar energy forecasts are necessary for solar plants and power systems management, while they remain poorly developed in this region, in particular because of the specificities of the West African climate. We evaluate the errors in Global Horizontal Irradiance (GHI) operational forecast models for two Sahelian solar power plants, Zagtouli in Burkina Faso and Sococim in Senegal, and investigate their links with local meteorological conditions, with a specific focus on clouds and dust aerosols.

This work begins by assessing aerosol products and our results support the use of the CAMS reanalysis for the assessment of Aerosol Optical Depth (AOD), particularly with respect to dust aerosols. We then assess the performance of three operational GHI forecast products: the Global Forecast System (GFS, NCEP/NOAA), the Integrated Forecast System (IFS, ECMWF), and SteadyMet (SM), developed by French company Steadysun, which is computed from the previously mentioned Numerical Weather Prediction (NWP) model outputs. The analysis reveals that IFS and SM outperform GFS in terms of forecast accuracy, with SM showing a slight advantage due to its probabilistic nature, which provides valuable information on forecast uncertainty.

Closer examination reveals a significant relationship between GHI forecast errors and local meteorological characteristics. These errors are more pronounced during the wet season, primarily attributed to cloud occurrence. Dust events are found to play a secondary role, particularly during the dry season. Correlation analyses underline the main link between forecast errors and cloudiness, while co-occurrence analyses highlight the fact that dust aerosol loading is a secondary factor in forecast errors for the GHI directly or for cloud representation (aerosol-cloud interaction).

How to cite: Anquetin, S., Clauzel, L., Lavaysse, C., Tremoy, G., and Raynaud, D.: West African operational daily solar forecast errors and their links with meteorological conditions, EGU General Assembly 2024, Vienna, Austria, 14–19 Apr 2024, EGU24-5042, https://doi.org/10.5194/egusphere-egu24-5042, 2024.

EGU24-6578 | Posters on site | ERE2.1

Evaluation of hub-height wind forecasts over the New York Bight 

Timothy Myers, Allison Van Ormer, Dave Turner, James Wilczak, Laura Bianco, and Bianca Adler

As offshore wind energy development accelerates in the U.S., it is important to assess the accuracy of hub-height wind forecasts from numerical weather prediction models over the ocean.  Leveraging approximately two years of Doppler lidar observations from buoys in the New York Bight, we provide an evaluation of 80-m wind speed forecasts from two weather models: the High-Resolution Rapid Refresh (HRRR) model and the Global Forecast System (GFS).  These two models have different horizontal (3 km vs 13 km) grid spacing, vertical layering, initialization methods, and parameterizations of boundary layer mixing and surface-atmosphere interactions.  Even with these differences, the models demonstrate similar and highly skillful short-term forecasts at three measurement sites (Day 1: root mean square error, RMSE, ≤ 2.4 m/s and r≥0.83; Day 2: RMSE≤3 m/s and r≥0.77).  Day-ahead forecasts also exhibit skill (Critical Success Index > ~0.5) in predicting quiescent winds and winds associated with maximum turbine power.  By Day 10, GFS forecasts on average have almost no skill.  Short-term forecast skill by the HRRR and GFS does not strongly depend on season or time of day, yet we find some dependence of the models' performance on near-surface stability.  Additionally, 5-14 day forecasts by the GFS exhibit lower RMSE during summer relative to other seasons.  The high skill of the HRRR and GFS short-term forecasts establishes confidence in their utility for offshore wind energy maintenance and operation.

How to cite: Myers, T., Van Ormer, A., Turner, D., Wilczak, J., Bianco, L., and Adler, B.: Evaluation of hub-height wind forecasts over the New York Bight, EGU General Assembly 2024, Vienna, Austria, 14–19 Apr 2024, EGU24-6578, https://doi.org/10.5194/egusphere-egu24-6578, 2024.

EGU24-7587 | Orals | ERE2.1 | Highlight

Replacement of meteorological towers with ground-based remote-remote sensing sodars: How close are we?  

Ebba Dellwik, Sten-Ove Rodén, Johan Arnqvist, Mikael Sjöholm, Corinna Möhrlen, and Andre Gräsman

As wind turbines have grown in size, it has become ever more costly to make the necessary tower-based wind observations needed both for the pre-operation (siting) phase and for wind turbine operations. In response to this challenge, the wind energy scientific community has - over the last decades - focused on evaluating and improving ground-based remote-sensing technology. The development has often been done in close collaboration with the innovative companies dedicated to providing the new solutions for replacing the expensive meteorological towers to the market.

The project EARS4WindEnergy, which started in March 2023, represents one such effort. The project is focused on a re-exploration of the sodar technology, which preceded the later focus on wind lidars. Here, we present a benchmarking of the AQ510 sodar equipped with new signal processing technology with tall-tower data focusing on the three “must-perform” criteria of accurate wind speed, accurate turbulence intensity and a reliable identification of erroneous data. The complementary aspects of data availability and robustness in relation to current wind lidars is also discussed. Most of the presented data are taken at the Østerild test site in Northern Denmark, where a 244m tall tower allows for accuracy quantification over most of the sodar’s measurement range.

How to cite: Dellwik, E., Rodén, S.-O., Arnqvist, J., Sjöholm, M., Möhrlen, C., and Gräsman, A.: Replacement of meteorological towers with ground-based remote-remote sensing sodars: How close are we? , EGU General Assembly 2024, Vienna, Austria, 14–19 Apr 2024, EGU24-7587, https://doi.org/10.5194/egusphere-egu24-7587, 2024.

EGU24-7725 | ECS | Orals | ERE2.1 | Highlight

Identifying weather patterns responsible for renewable energy production droughts in India 

Hannah Bloomfield, Kieran Hunt, and Isa Dijkstra

Energy systems across the globe are evolving to meet climate mitigation targets set by the Paris Agreement. This process requires a rapid reduction on nations’ reliance on fossil fuels and significant uptake of renewable generation (such as wind power, solar power, and hydropower). In parallel to the decarbonisation of the electricity sector, both the heat and transport sectors are electrifying to reduce their carbon intensity. Renewable energy sources are weather-dependent, causing production to vary on timescales from minutes to decades. A consequence of this variability is that there may be periods of low renewable energy production, here termed ‘renewable energy droughts’. This energy security challenge needs to be addressed to provide a consistent power supply and to ensure grid stability. India is chosen here as a study area as a region that already has a large existing proportion of renewable generation (42 GW of wind power, 61 GW of solar power and 51 GW of hydropower were installed as of October 2022) and a region that experiences good sub-seasonal predictability in large-scale patterns.

In this study, we use broad variety of data sources to quantify potential and realised capacity over India from 1979 to 2022 using the ERA5 reanalysis and a range of open source renewable energy installation data. Using gridded estimates of existing installed renewable capacity combined with our historical capacity factor dataset, we create a simple but effective renewable production model for each Indian state and at national level. We use this model to identify the timing of historical renewable energy droughts and then discuss potential weaknesses in the existing grid – particularly a lack of complementarity between wind and solar production in north India – and vulnerability to high deficit generation in the winter. The data produced here have all been made open access and the methods could easily be reproduced over any region of interest.

We then consider the weather patterns that could cause the largest renewable energy droughts over India and investigate potential sources of predictability. Existing large-scale daily weather types (based on large-scale wind map clustering) as well as novel patterns created by k-means clustering of more relevant variables for wind and solar power are used to investigate the different weather patterns causing renewable energy droughts. Renewable energy droughts largely occur during the winter season (January and February) and are caused by low seasonal wind speeds in combination with weather patterns bringing high cloud cover. These are mainly winter anticyclones and western disturbances.

Sources of potential sub-seasonal predictability are considered for the largest renewable energy droughts, including the Madden Julian Oscillation and Boreal Summer Intra-Seasonal Oscillation. Although both have a stronger relationship with high energy production days, links between phases of these two modes of variability and renewable energy droughts have been identified. These could help to provide early warnings for conditions that challenge supply security in the future.

How to cite: Bloomfield, H., Hunt, K., and Dijkstra, I.: Identifying weather patterns responsible for renewable energy production droughts in India, EGU General Assembly 2024, Vienna, Austria, 14–19 Apr 2024, EGU24-7725, https://doi.org/10.5194/egusphere-egu24-7725, 2024.

Long-term wind speed forecasting is still in its early stages, particularly in India. Due to lack of operational forecasts the Indian wind industry is forced to rely on climatological averages, that do not incorporate interannual variability. The overall goal of our study is to evaluate and enhance the capability of the Indian Institute of Tropical Meteorology Coupled Forecast System Version 2.0 (IITM CFSv2) model to forecast the summer monsoon (June-September) 10m wind speeds over India at seasonal scales as a part of the Monsoon Mission III program. The model runs were conducted in hindcast mode for the period 1981-2017. Initially, we conducted a systematic evaluation to assess the quality of the forecasts initialized in February and March for selected stations by comparing them against observations from the Global Summary of the Day (GSOD) dataset. Our findings indicate that the raw forecasts are poor quality with Symmetric Mean Absolute Percentage Error (SMAPE) in the 70% and 90% range.

Next, we developed calibration algorithms using ML techniques to improve the quality of the forecasts. Linear Regression, Random Forest, XGBoost, LSTM, Conv-LSTM, GRU were employed as regression models. The outcomes from the best-performing model demonstrate that calibration significantly enhances the quality of the forecasts. After calibration, the mean absolute error (MAE) values typically fall within the range of 0.5 to 0.9 m/s for most stations, though a few stations exhibit values exceeding 1 m/s, in contrast to the raw forecasts where the error range extends from 1.2 to 2 m/s. The SMAPE is reduced to between 30% and 60% after calibration. When compared with 30-year climatology, the calibrated forecasts in 60% of the stations show a positive Root Mean Square Error Skill Score (RMSESS) ranging from 0.01 to 0.3 whereas the scores for the raw forecasts are showing highly negative skill. This study demonstrates that ML based calibration is a promising technique that can significantly improve the quality of numerical model forecasts and perform significantly better than climatology.

How to cite: Banerjee, R. and Baidya Roy, S.: Long - term wind speed forecasting for the monsoon seasons at station scales over India: Integrating ML and Numerical techniques, EGU General Assembly 2024, Vienna, Austria, 14–19 Apr 2024, EGU24-7873, https://doi.org/10.5194/egusphere-egu24-7873, 2024.

EGU24-8687 | Posters on site | ERE2.1

Improvement of Korea Meteorological Administration insolation Information by Applying Detailed Terrain Data 

Jinah Yun, Jinwon Kim, Minwoo Choi, Hee-Wook Choi, Yeon-Hee Kim, Sang-Sam Lee, Ki-Hoon Kim, and Chulkyu Lee

  As the proportion of renewable energy continues to rise, solar energy reaching the Earth's surface holds a significant share compared to other sources such as wind power. Efficient utilization of solar energy necessitates accurate data on surface insolation. Consequently, both domestically and internationally, there's active research into developing insolation mapping using various numerical models based on solar meteorological resources.
The Korea Meteorological Administration's KMAP (Korea-Meteorological Administration Post-processing), hereafter KM, provides insolation data. However, its limitation lies in the inability to realistically account for complex terrains like mountains due to the 1.5 km resolution of the Meteorological Administration's LDAPS (Local Data Assimilation and Prediction System), an operational local forecast model.
 This study analyzes the impact and characteristics of different resolutions of Digital Elevation Models (DEMs) on the accuracy of surface insolation calculations performed by KMAP-Solar, the solar energy mapping system of the Korea Meteorological Administration (1.5 km and 100 m). Comparison and verification against insolation data from 42 Korea Meteorological Administration Automated Synoptic Observation Systems (ASOS) stations reveal that the introduction of high-resolution DEM reduces land-averaged solar radiation biases by up to 32 Wm
−2 at all observation points, particularly accentuating its effect in regions with complex terrains.
The enhanced accuracy due to high-resolution DEMs is attributed to their ability to alleviate errors caused by differences in Sky View Factors (SVF) between high and low-resolution DEMs. Both DEM resolutions exhibit correlations between insolation and terrain elevation (SVF). However, high-resolution DEMs significantly underestimate these relationships compared to low-resolution DEMs, primarily in areas with high elevations where low-resolution DEMs inadequately represent steep terrains and/or small SVFs.
This study demonstrates that high-resolution DEMs provide a more realistic distribution of insolation by integrating a broader range of crucial terrain parameters, thus proving their significance in accurate insolation calculations compared to low-resolution DEMs. It is anticipated that this research will play a crucial role in supporting future solar energy studies, real-time prediction, and management within solar power plant installations and the power grid.

How to cite: Yun, J., Kim, J., Choi, M., Choi, H.-W., Kim, Y.-H., Lee, S.-S., Kim, K.-H., and Lee, C.: Improvement of Korea Meteorological Administration insolation Information by Applying Detailed Terrain Data, EGU General Assembly 2024, Vienna, Austria, 14–19 Apr 2024, EGU24-8687, https://doi.org/10.5194/egusphere-egu24-8687, 2024.

EGU24-8933 | ECS | Posters on site | ERE2.1

An Austrian case study on empowering ReduceData solar power forecasting using a ML-driven semi-synthetic data generator 

Petrina Papazek, Pascal Gfäller, and Irene Schicker

Heterogenous, location dependent solar power/PV installations entail individually different production. This is a challenge for power grid operators as to feed-in PV-production, besides its vast output variability, the grid operators need very high-resolution (temporal and spatial) power forecasts, ideally tailored to each of these sites. Technological advances along with the expansion of solar energy will often modify the initial setup of a production site, thereby significantly altering the production data over their record time. Inevitably inconsistent presentations of historic data or short record periods (e.g.: in case of newly build sites) pose challenges in the renewable sector. This induces a common issue in AI driven post-processing:  machine learning and AI powered forecasts heavily rely on sufficient, consistent historic data, more so if simulating expected production peaks in high temporal resolution is part of the requirements. To address the need of such reduced historic data, we aim at generating semi-synthetic data within the ReduceData project by providing a sufficiently represented and continuous data set across multiple data sources. Building on random forest models, we exploit spatial and temporal strongly associated non-reduced auxiliary data, such as satellite data products (e.g.: CAMS) and reanalysis fields (e.g.: ERA5).  Due to their limited nature, PV production records and high-resolution numerical models (e.g.: AROME) will be targeted by our semi-synthetic data generator. The presented case study focuses on nowcasting- to short-range forecasts in 15-minute update frequency tailored to selected solar power production sites in East-Austria. We study to what extent deep learning methods benefit from a consistent semi-synthetic data set built on different raw data sources, highlighting the added value of combining various sources via deep learning. Inputs for the AI-driven post-processing are, for instance, the climatology of satellite data and reanalysis, pvlib’s estimations, AROME surface parameters, and in-house nowcasting models (e.g.: IrradPhyD-Net). Different settings of the semi-synthetic data generator are evaluated by cross-validation. In most studied cases, we achieve a high skill compared to available classical and standard methods (e.g.: persistence, climatology). 

How to cite: Papazek, P., Gfäller, P., and Schicker, I.: An Austrian case study on empowering ReduceData solar power forecasting using a ML-driven semi-synthetic data generator, EGU General Assembly 2024, Vienna, Austria, 14–19 Apr 2024, EGU24-8933, https://doi.org/10.5194/egusphere-egu24-8933, 2024.

To improve the process of solar energy production, we can utilize the downward
shortwave flux (DSSF) measurement, which constitutes a part of the satellite
derived total and diffuse downward surface shortwave flux (MDSSFTD) product.
MDSSFTD is issued by the Satellite Application Facility on Land Surface Analysis (LSA SAF).
However, its direct application in this area is inhibited by potential systematic
errors in the DSSF product. Therefore, this has to be addressed before the DSSF can be used downstream.

To this end, we implemented a neural network-based post-processing procedure
that uses previous temporal DSSF observations and additional predictors, such
as cloudiness and time of day, to generate a corrected DSSF value. The ground
truth for this regression task are the in-situ measurements across a variety of
locations in Slovenia. Additionally, the neural network produces DSSF estimates
in terms of quantiles, providing an uncertainty estimate of the corrected prediction itself.

We verified our new method on the aforementioned region over a period of
four years. We found that our neural network approach successfully reduces
the presence of systematic differences present in the DSSF. Additionally, the
neural network method outperforms a baseline look-up-table approach in terms
of multiple criteria, such as mean absolute error, bias, and error variability.

How to cite: Savli, M. and Mlakar, P.: Reduction of systematic differences of LSASAF shortwave solar radiation fluxes using neural networks, EGU General Assembly 2024, Vienna, Austria, 14–19 Apr 2024, EGU24-9396, https://doi.org/10.5194/egusphere-egu24-9396, 2024.

EGU24-9862 | Posters on site | ERE2.1

Do offshore wind farms weaken or enhance surface wind and wave fields? 

Xiaoli Larsén, Jana Fischereit, Konrad Bärfuss, and Astrid Lampert

Over the North Sea, larger and larger part of the water surface is being covered by wind farms. Studies have shown consistent results regarding farm wake effects at hub height, characteristic of reduced wind speed and enhanced turbulence. Close to water surface, published studies using both measurements and modeling have suggested enhanced wind speeds sometimes, and reduced wind speeds some other times. Hence, this study investigates the research question: Do offshore wind farms weaken or enhance surface wind and wave fields?

We use the mesoscale atmosphere-wave-wake coupled modeling system that consists of the Weather Research and Forecast (WRF) model, Spectral Wave Nearshore (SWAN) model with the wave boundary-layer model (Du et al. 2017, Fischereit et al. 2022). We use the Fitch Wind Farm Parameterization scheme (Fitch et al. 2012), with four coefficients for the advection of the wind farm-generated Turbulence Kinetic Energy (TKE): a = 1, 0.25, 0.1 and 0, corresponding to larger and larger TKE advection. The model is used together with flight measurements of wind fields upwind, above and downwind of offshore wind farms, collected during the project WIPAFF (Bärfuss et al. 2019, Lampert et al. 2020). We use two case studies, one following Bärfuss et al. (2021) (with fetch effect) and one following Larsén and Fischereit (2021) (without fetch effect). 

There is no evidence of generally enhanced surface winds and waves in the presence of wind farms. Enhanced surface winds and waves can however be generated numerically when using e.g. a = 1, as a result of numerical distribution of excessive TKE and momentum generated at hub height down to the surface. The study suggests that the wake effect is rather sensitive to the value of a, regarding both horizontal and vertical distribution from the hub height. Measurements are needed to understand the distribution of turbine-generated TKE and to help defining a- value for specific conditions.

References:

Bärfuss, et al. 2019: In-situ airborne measurements of atmospheric and sea surface parameters related to offshore wind parks in the German Bight,  https://doi.pangaea.de/10.1594/PANGAEA.902845, 2019.

Bärfuss et al. 2021: The Impact of OffshoreWind Farms on Sea State Demonstrated by Airborne LiDAR Measurements. J. Mar. Sci. Eng.  9, 644. https://doi.org/10.3390/jmse9060644

Du J., Bolaños R. and Larsén X. 2017: The use of a wave boundary layer model in SWAN. J. Geophys. Res.:Oceans. DOI: 10.1002/2016JC012104, vol. 122, No 1, p42 - 62.

Fischereit, J., Larsén, X.G. and Hahmann A. 2022: Climate impacts of wind-wave-wake interactions in offshore wind farms. Frontier Energy Res. doi: 10.3389/fenrg.2022.881459. Vol. 10., 881459.

Fitch et al. 2012: Local and Mesoscale Impacts of Wind Farms as Parameterized in a Mesoscale NWP Model, Mon. Weather Rev., 140, 3017–3038, https://doi.org/10.1175/MWRD-11-00352.1.

Lampert et al. 2020: In-situ airborne measurements of atmospheric and sea surface parameters related to offshore wind parks in the German Bight, Earth Syst. Sci. Data, 12, 935–946.

Larsén X. and Fischereit J. 2021: A case study of wind farm effects using two wake parameterizations in the Weather Research and Forecasting (WRF) model (V3.7.1) in the presence of low-level jets. Geo. Mod. Dev., 14(5), 3141-3158. https://doi.org/10.5194/gmd-14-3141-2021

How to cite: Larsén, X., Fischereit, J., Bärfuss, K., and Lampert, A.: Do offshore wind farms weaken or enhance surface wind and wave fields?, EGU General Assembly 2024, Vienna, Austria, 14–19 Apr 2024, EGU24-9862, https://doi.org/10.5194/egusphere-egu24-9862, 2024.

In the quest for accurate wind resource assessment crucial for the expansion of wind farms, this study tackles the scientific question of how varying time series lengths and temporal resolutions impact the estimation of wind resources, and introduce uncertainty into the assessment process. Recognizing the significant importance of considering temporal variability in wind speed distribution, we utilize in-situ observations from weather stations provided by the Norwegian Meteorological Institute, analyzing 1-hourly data spanning one to ten years. The study employs a comparative analysis of various wind speed distributions to determine the best-fit distribution for estimating wind resources. This process involves assessing the goodness-of-fit for each distribution under different time series lengths. Additionally, the study investigates the impact of temporal resolutions by examining data collected at 10-minute, hourly, daily, and monthly intervals from the same period and stations. The overarching goal is to systematically quantify uncertainty in wind resource estimation arising from the selection of wind speed distribution based on varying lengths and resolutions of time series data. The outcomes of this research aim not only to enhance the precision of wind resource assessments in the wind power sector but also to provide valuable insights applicable to fields influenced by wind conditions, including risk management and construction design. This study is financed by the Equinor academia project.

How to cite: Zhou, L. and Esau, I.: The impact of time series length and temporal resolution on wind resource assessment: a comparative analysis of wind speed distributions, EGU General Assembly 2024, Vienna, Austria, 14–19 Apr 2024, EGU24-10849, https://doi.org/10.5194/egusphere-egu24-10849, 2024.

EGU24-11653 | Posters on site | ERE2.1 | Highlight

Performance of Global Wind Atlas for Distributed Wind Resource Assessment in the United States 

Lindsay Sheridan, Danielle Preziuso, Caleb Phillips, Dmitry Duplyakin, and Heidi Tinnesand

Distributed wind projects, particularly those involving small wind turbines, are more subject to financial and temporal limitations than utility-scale wind energy. Onsite measurements are often not feasible or economically viable investments, leading to developers, analysts, and customers in the distributed wind community relying on wind resource models to establish generation estimates. One popular wind product used by the distributed wind community in the United States is the global, high-resolution Global Wind Atlas from the Technical University of Denmark and the World Bank Group.

Wind resource models are valuable tools for siting and establishing generation expectations but are not entirely accurate, which can lead to distributed wind customer dissatisfaction when actual energy generation does not meet pre-construction expectations. To enhance the understanding of the performance and limitations of utilizing Global Wind Atlas for wind resource assessment, this work presents the validation of the model wind speeds using meteorological towers across the diverse geography of the United States with measurement heights relevant to distributed wind hub heights (20 m – 100 m). The analysis expands to quantify the performance of Global Wind Atlas in representation of seasonal, diurnal, and interannual variability in the wind resource along with an assessment of wind shear accuracy at locations with measurements at multiple heights.

How to cite: Sheridan, L., Preziuso, D., Phillips, C., Duplyakin, D., and Tinnesand, H.: Performance of Global Wind Atlas for Distributed Wind Resource Assessment in the United States, EGU General Assembly 2024, Vienna, Austria, 14–19 Apr 2024, EGU24-11653, https://doi.org/10.5194/egusphere-egu24-11653, 2024.

EGU24-12053 | Orals | ERE2.1

Evaluation and Bias Correction of the ERA5 Reanalysis for Wind and Solar Energy Applications 

James M. Wilczak, Elena Akish, Antonietta Capotondi, and Gilbert Compo

The applicability of the ERA5 reanalysis for estimating wind and solar energy generation over the contiguous United States is evaluated using wind speed and irradiance variables from multiple observational data sets.  After converting ERA5 and observed meteorological variables into wind power and solar power, comparisons demonstrate that significant errors in the ERA5 reanalysis exist limiting its direct applicability for a wind and solar energy analysis.  Overall, ERA5-derived solar power is biased high, while ERA5-derived wind power is biased low.  Errors for the shortest duration, most extreme solar negative anomaly events are found to be statistically reasonably well represented in the ERA5, when completely overcast conditions occur in both ERA5 and observations.  Longer duration events on weekly to monthly timescales, which include partially cloudy days or a mix of cloud conditions, have ERA5-derived solar power errors as large as 40%.  ERA5-derived solar power errors are found to have consistent characteristics across the CONUS region.  The negative bias errors in the ERA5 windspeeds and wind power are largely consistent across the central and northwestern US, and offshore, while the eastern US has an overall small net bias.  For weekly to monthly timescales, the uncorrected ERA5-derived wind power errors approach 50%.  Corrections to the ERA5 are derived using a quantile-quantile method for solar power, and linear regression of wind speed for wind power.  These corrections greatly reduce the ERA5 errors, including for extreme events associated with wind and solar energy droughts, that will be most challenging for electric grid operation, while also avoiding potential over-inflation of the reanalysis variability resulting from differences between point-measurements and the temporally and spatially smoother reanalysis values.

How to cite: Wilczak, J. M., Akish, E., Capotondi, A., and Compo, G.: Evaluation and Bias Correction of the ERA5 Reanalysis for Wind and Solar Energy Applications, EGU General Assembly 2024, Vienna, Austria, 14–19 Apr 2024, EGU24-12053, https://doi.org/10.5194/egusphere-egu24-12053, 2024.

EGU24-12318 | ECS | Posters on site | ERE2.1

Estimation of Diffuse Solar Radiation Models for a Tropical Site in Nigeria 

Olanrewaju Soneye-Arogundade and Bernhard Rappenglueck

Knowledge of solar radiation and its components in a particular area is crucial in studying solar energy and constructing solar energy devices due to the many advantages solar radiation has over fossil fuels. In this two-year study, conducted at a tropical site in Ile-Ife, Nigeria, from January 2016 to December 2017, twenty-one empirical models were proposed to estimate diffuse solar radiation using continuous solar radiation data. The models were divided into five groups and developed using relative sunshine duration and/or clearness index as input variables. The performance of five models from the literature was also examined and compared to measured data. The models' performance was evaluated using the Akaike Information Criteria (AIC), the Global Performance Index (GPI), and various statistical errors. Model 11, a quadratic model with clearness index as an input variable, had the lowest AIC (1.8098), AICC (4.8099), ∆AICC (0.0000), and GPI (-2.1796) values and was the most accurate model for estimating diffuse solar radiation at the study site and other locations with similar climatic conditions. None of the models selected from the literature was suitable for estimating diffuse solar radiation at the study site; hence, the proposed models performed better.

How to cite: Soneye-Arogundade, O. and Rappenglueck, B.: Estimation of Diffuse Solar Radiation Models for a Tropical Site in Nigeria, EGU General Assembly 2024, Vienna, Austria, 14–19 Apr 2024, EGU24-12318, https://doi.org/10.5194/egusphere-egu24-12318, 2024.

EGU24-15512 | Posters on site | ERE2.1

Towards efficient methods for estimating spatio-temporal wind energy yields in mountainous regions 

Nora Helbig, Florian Hammer, Reinhard Bischoff, Michael Lehning, and Sarah Barber

Complex mountain winds provide a largely unknown wind energy potential. Mountainous terrain influences air flow by e.g., wind flow sheltering, ridge acceleration, channelling, deflections, blocking and recirculation. Its impact on the energy production of wind turbines has not yet been thoroughly quantified, but various studies show that it could be significant. To accurately assess the wind energy potential in mountainous terrain, spatio-temporal wind fields capturing local wind-topography interactions are required. Ground measurements can retrieve spatio-temporal wind fields, but even with a dense weather station network, atmospheric models are still needed to capture the full spatial variability. However, it is challenging to generate the necessary fine-scale wind fields over long timescales and large regions computationally efficiently. Wind farm planning in mountainous regions is therefore much more challenging and uncertain than in flat areas.

Here, we present our concept that addresses this challenge by evaluating and enhancing various state-of-the art computationally efficient downscaling methods (statistical and dynamical). These methods generate highly resolved spatio-temporal wind fields, considering dominant local wind-topography interactions. Using these fields, we can derive time-resolved wind energy yield potential. The evaluation involves assessing the methods across fine spatial scales (e.g., dekameter scale), large spatial extents (up to tens of kilometers), high temporal resolution (e.g., hourly scale), and long timescales (several years) in real Swiss mountain settings using wind field and energy production measurements. Our overall goal is to provide wind modelers and energy planners with recommendations for efficient methods for obtaining highly resolved spatio-temporal wind fields, enabling accurate energy yield estimations in mountainous terrain.

How to cite: Helbig, N., Hammer, F., Bischoff, R., Lehning, M., and Barber, S.: Towards efficient methods for estimating spatio-temporal wind energy yields in mountainous regions, EGU General Assembly 2024, Vienna, Austria, 14–19 Apr 2024, EGU24-15512, https://doi.org/10.5194/egusphere-egu24-15512, 2024.

With the rapid development of wind energy, the imperative for precise wind power predictions has intensified, with the crux lying in forecasting wind speeds. The accurate short-term (1 to 3 days) forecast of wind speeds at the hub height in boundary layer poses a significant scientific challenge. Generating such forecasts for wind farms 1 to 3 days in lead time necessitates reliance on global weather forecast products and the WRF model. In pursuit of heightened accuracy, artificial intelligence (AI) algorithms are employed to refine WRF-predicted wind speeds based on observational data.

This study draws upon observational data from five operational wind farms over three years, employing diverse deep time-series models, to examine the effectiveness and limitations of these models in post-processing corrections for WRF-predicted wind speeds. Based on our examination, we conclude that: 1) Transformer-based models have significant untapped potential, with the Pyraformer model emerging as a well-suited temporal model for post-processing corrections in wind speed and power predictions. 2) Traditional full-attention mechanisms are less effective, highlighting the importance of sparse attention as a vital approach for capturing temporal correlations in such problems. 3) The optimal model demonstrates a reduction of approximately 20% in RMSE for single-point post-processing corrections. In addition, wind speed prediction accuracy reaches around 86%, and power prediction accuracy is approximately 82%. 4) AI-based post-processing corrections may encounter challenges, including the underestimation for high-value and difficulties in reproducing forecasts below the average value.

How to cite: Xia, X. and Luo, Y.: Application of WRF-Based Single-Point Data Artificial Intelligence Post-Processing Correction Method in Practical Short-Term Wind Speed and Power Forecasting, EGU General Assembly 2024, Vienna, Austria, 14–19 Apr 2024, EGU24-16521, https://doi.org/10.5194/egusphere-egu24-16521, 2024.

EGU24-17204 | Orals | ERE2.1

Improving Renewable Energy Forecasting with Meteomatics EURO1k Model 

Julie Thérèse Pasquier, Johannes Rausch, Matthias Piot, Julia Schmoeckel, Marco Thaler, Christian Schluchter, and Martin Fengler

The production of renewable energy from wind and solar sources is intricately linked to meteorological conditions, where wind speed and solar radiation play critical roles. Due to the success of renewable energies, wind turbines are increasingly placed in sites with complex terrain, while solar panels are increasingly situated in alpine areas. However, current weather models often struggle to accurately forecast the weather, especially over complicated topography, due to limitations in spatial resolution. This leads to inaccurate predictions of power production, impacting the efficiency and reliability of renewable energy systems. To address this challenge, Meteomatics developed the EURO1k model, the first pan-European weather model with a 1 km² spatial resolution, providing optimal forecasting for wind and solar power.

The EURO1k model offers a 48-hour forecast horizon, generating a new forecast every hour. In addition to standard data sources such as weather stations, radar, satellite data, and radiosondes, the EURO1k model also incorporates data from a network of Meteodrones - small, unmanned aircraft systems developed by Meteomatics - which collect vertical atmospheric profiles up to 6000m in altitude. The high resolution of the EURO1k model enables accurate representation of small-scale weather patterns, resulting in highly accurate and precise forecasts.

Meteomatics uses a forecast system that combines various global and regional weather models to predict wind and solar power, aiming to reduce average errors. Recently, EURO1k has been integrated into this system, improving intraday and day-ahead power production forecasts. The normalized root mean square error (nRMSE) was reduced by up to 8.1% for intraday and by up to 8.5% for the day-ahead wind power forecast. Furthermore, a comparison of day-ahead forecasts with actual production data, combined with balancing energy costs, demonstrates improved earnings with the addition of the EURO1k model. Indeed, the EURO1k shows especially better performance in weather situations with large uncertainties. This underscores the added value of EURO1k in power forecasting, enhancing the cost efficiency of renewable energies and fostering greater integration into the energy mix, thereby reducing CO2 emissions.

How to cite: Pasquier, J. T., Rausch, J., Piot, M., Schmoeckel, J., Thaler, M., Schluchter, C., and Fengler, M.: Improving Renewable Energy Forecasting with Meteomatics EURO1k Model, EGU General Assembly 2024, Vienna, Austria, 14–19 Apr 2024, EGU24-17204, https://doi.org/10.5194/egusphere-egu24-17204, 2024.

EGU24-17213 | ECS | Posters on site | ERE2.1

Comparing PV and Wind Models to Analyse Dunkelflaute Events in Ireland 

Boris Morin, Damian Flynn, Conor Sweeney, and Aina Maimo Far

The 2024 Government of Ireland Climate Action Plan aims to increase the share of renewable energy sources (RES) from 38% to 80% by 2030. In 2022, the installed capacity of wind power will surpass 4.5 GW, and the goal is to reach the same level as solar power by 2025. As the proportion of energy generated from these weather-dependent sources increases, there is a need to more accurately quantify periods when the energy generated from such sources is low for an extended period, in order to plan for appropriate reserve capacity.

The terms "Dunkelflaute" and “Renewable Drought” have been used to refer to extended periods of time when the capacity factor of both wind and solar power falls below a given threshold for a set period of time. In this study, we define a Dunkelflaute event as occurring when the combined capacity factor for wind and solar falls below a fixed threshold for at least 24 hours. The effect of choosing different values for this fixed threshold is also investigated in our study.

This study aims to investigate how the expected frequency and duration of Dunkelflaute events identified in different RES datasets may change depending on the assumptions made by the underlying RES datasets.

The first RES dataset investigated is an hourly estimate of electricity generation based on ERA5 climate variables, made by C3S Energy, which was produced using statistical and physical models. The C3S Energy dataset provides a time series of electricity supply from wind and solar photovoltaic and is trained using European Network of Transmission System Operators for Electricity (ENTSO-E) data.

This dataset has certain limitations. First, it assumes a homogeneous spatial distribution of the installed capacity of wind and solar energy production, to maintain a methodological coherence between the two RES sources. Second, the energy conversion models applied, contain simplifying approximations, such as using a single wind turbine model with a fixed hub height for all locations.

The second RES dataset has been created by the authors, which uses more detailed information about the location of the wind and PV farms. Relevant atmospheric variables are interpolated from ERA5 data to the location of each RES farm. In addition, the characteristics of the wind and PV panels at each farm are taken into account.

Both datasets are compared against the actual wind and PV capacity factor data supplied by the national grid operator of Ireland, EirGrid, for the year 2023, to indicate the performance of each model. The two datasets are then analysed across the full range of the time series, from 1979 to 2023, to determine the frequency and duration of all Dunkelflaute events during this period.

Differences in the identified Dunkelflaute events highlight the importance of considering results in the context of the driving data, which would be important for future policy decisions such as planning reserve capacity requirements, or locating future RES farms.

How to cite: Morin, B., Flynn, D., Sweeney, C., and Maimo Far, A.: Comparing PV and Wind Models to Analyse Dunkelflaute Events in Ireland, EGU General Assembly 2024, Vienna, Austria, 14–19 Apr 2024, EGU24-17213, https://doi.org/10.5194/egusphere-egu24-17213, 2024.

EGU24-17394 | ECS | Orals | ERE2.1

How do convective cold pools influence the stability and turbulence conditions in the vicinity of wind turbines in Northern Germany? 

Jeffrey Thayer, Gerard Kilroy, Norman Wildmann, and Antonia Englberger

Convective cold pools routinely pass over the dense network of wind turbines in northern Germany, causing short-term changes in boundary-layer wind speeds (i.e., wind ramp events) and atmospheric stability. These large, rapid, and more-localized variations in the low-level kinematic and thermodynamic structure are difficult for numerical weather prediction models to forecast with sufficient spatial and temporal accuracy for utilization by wind turbine operators. As boundary-layer stability and winds strongly influence wind turbine structural loads, downstream turbulent wake behavior, and power generation, it is important to better understand how rapid changes in dynamic processes evolve within the vertical layer of wind turbine rotor blades (~50 - 150 meters altitude).

Using in-situ observations and high-resolution modeling focused on the WiValdi research wind park in Krummendeich, Germany, we examine how convective cold pool passages during July 2023 impact the inflow and turbulent wakes for two installed turbines with a hub height of 92 meters. Meteorological mast, Doppler wind lidar, and microwave radiometer observations provide upstream and downstream measurements of stability, vertical shear, and turbulence variations at ~1-minute resolution. While this measurement coverage adequately captures the cold pool evolution relative to each turbine, we remain somewhat limited by the fixed instrument locations for measuring upstream conditions and the three-dimensional turbulent wake structure. Therefore, we also utilize the mesoscale model WRF in large-eddy-simulation mode, with inserted generalized actuator disks acting as proxy wind turbines, to analyze far-upstream inflow conditions and three-dimensional wake characteristics during cold pool passages. The proposed work will provide a foundation for future analysis which will more robustly verify WRF output using additional WiValdi instrumentation.

How to cite: Thayer, J., Kilroy, G., Wildmann, N., and Englberger, A.: How do convective cold pools influence the stability and turbulence conditions in the vicinity of wind turbines in Northern Germany?, EGU General Assembly 2024, Vienna, Austria, 14–19 Apr 2024, EGU24-17394, https://doi.org/10.5194/egusphere-egu24-17394, 2024.

EGU24-17521 | ECS | Posters on site | ERE2.1

Fault Detection in Solar Thermal Systems using Probabilistic Reconstructions 

Florian Ebmeier, Nicole Ludwig, Jannik Thümmel, Georg Martius, and Volker H. Franz

As heating is the largest factor of Greenhouse gases in the household sector, it should
be the focus of our decarbonisation efforts. Solar Thermal Systems (STS), which provide
heat based on solar energy, are a promising technology in this regard. However, STS
are prone to faults due to improper installation, maintenance, or operation, often leading
to a substantial reduction in efficiency, damage to the system, or even an increase in
energy cost. As individual monitoring is economically prohibitive for small-scale systems,
automated monitoring and fault detection should be used to address this issue.
We propose a data-driven neural network approach for fault detection in small-scale
STS, utilising probabilistic reconstructions from a long short-term memory (LSTM) based
Variational Autoencoder (VAE). Key factors in our approach are generalising from faultless
data to previously unseen systems and an anomaly score derived from an ensemble of
reconstructions. We apply this to an operational dataset provided by our industry partner,
which includes systems with different types of faults.
Our results show that our model can detect faults in STS with comparable performance
to the state-of-the-art expert-based system used by our industry partner. Furthermore, our
model can detect previously undetected faults, specifically those resulting from unexpected
behaviour in the control software or behaviours that were entirely unexpected and not
considered in the expert-based system. Thus, a combination of our model and the expert-
based system covers a broader range of faults than either system and is proposed for
further use in the industry partner’s application. Additionally, other providers without a
functioning expert-based system could build upon our work to get a minimal viable product
for fault detection in STS, purely based on data from existing systems and without the
need to install additional sensors or domain-specific knowledge.

How to cite: Ebmeier, F., Ludwig, N., Thümmel, J., Martius, G., and Franz, V. H.: Fault Detection in Solar Thermal Systems using Probabilistic Reconstructions, EGU General Assembly 2024, Vienna, Austria, 14–19 Apr 2024, EGU24-17521, https://doi.org/10.5194/egusphere-egu24-17521, 2024.

EGU24-17552 | Orals | ERE2.1

Long range lidar for short term wind predictions for offshore wind parks 

Janina Bade, Hans-Jürgen Kirtzel, Leon Heinze, Piet Markmann, Gerhard Peters, Christoph Bollig, Sebastian Ulonska, Florian Jordan, and Guntram Huschenbeth

A novel lidar prototype for horizontal Doppler wind measurements with more than 30 km maximum range is presented. The request for such long-range measurements arose from the development of methods for improved prediction of potential and actual feed-in of wind power from offshore wind farms in the project WindRamp. The target is a short-term prediction horizon of up to 30 minutes.

The coherent lidar module is based on a robust fiber amplifier architecture developed within the project. This enables deployment in harsh environments in the future, e.g. at offshore wind farms. The emitted laser beam is eye save (class 1M).

In order to emulate operating conditions of an offshore platform, the system was deployed at the mouth of the Elbe river at 10 m above sea level with unobstructed view in a broad SW-sector. Scans between 204° and 304° azimuth at 0.35° Elevation were performed. The averaging time was 1 s and the angular speed 0.6° s-1.

The lidar performance is demonstrated by observations of wind fronts propagating through the observed area. The weather in North Germany during winter 2023/24 was characterized by unusual persistent precipitation, low hanging clouds and fog, which are unfavourable conditions for lidar operation. Therefore, the observed availability of valid data versus range represents a conservative estimate of the system’s potential.

How to cite: Bade, J., Kirtzel, H.-J., Heinze, L., Markmann, P., Peters, G., Bollig, C., Ulonska, S., Jordan, F., and Huschenbeth, G.: Long range lidar for short term wind predictions for offshore wind parks, EGU General Assembly 2024, Vienna, Austria, 14–19 Apr 2024, EGU24-17552, https://doi.org/10.5194/egusphere-egu24-17552, 2024.

EGU24-17848 | Posters virtual | ERE2.1

IEA Wind Task 51 – Minute and Seasonal Scale Forecasting Workshops for the Weather Driven Energy System 

Gregor Giebel, Caroline Draxl, Helmut Frank, John Zack, Corinna Möhrlen, George Kariniotakis, Jethro Browell, Ricardo Bessa, and David Lenaghan
The energy system needs a range of forecast types for its operation in addition to the narrow wind power forecast. Therefore, the notionally largest group world-wide discussing renewable forecasts, IEA Wind Task 51 “Forecasting for the Weather Driven Energy System” is reaching out to other IEA Technology Collaboration Programmes such as the ones for PV, hydropower, system integration, hydrogen etc. The three existing Work Packages (WPs) on NWP Improvements (WP1), Power and Uncertainty Forecasting (WP2) and optimal use of Forecasting Solutions (WP3), are complemented by thirteen work streams in a matrix structure.
 
The three work packages span three distinct areas of challenge in forecasting for the weather driven energy system. The first area is the continuing effort to improve the representation of physical processes in weather forecast models through both new high performance initializations and tailored parameterizations. The second area is the heterogeneity of the forecasters and end users, the full understanding of the uncertainties throughout the modelling chain and the incorporation of novel data into power forecasting algorithms. A third area is representation, communication, and use of these uncertainties to industry in forms that readily support decision-making in plant operations and electricity markets.

Task 51 focuses on facilitating communication and collaborations among international research groups engaged in the improvement of the accuracy and applicability of forecast models and their utility for the stakeholders in the wind industry, in the power sector and in the energy system.

The collaboration is also structured in work streams, more targeted around a particular topic and potentially spanning several work packages [1]. Two of those work streams are aligned around forecasting horizons, the one on Sub-seasonal to Seasonal (S2S) forecasting and the one on minute-scale forecasting. Both work streams had public workshops. The Seasonal Forecasting workshop was in Reading (UK) in May 2023, while the Minute Scale Forecasting workshop  was on 10/11 April 2024 in Risø (DK). While the S2S workshop was done in conjunction with WMO, the Minute Scale workshop had people from several other IEA Wind Tasks (Lidars, Wind Farm Flow Control and Hybrid Power Plants) as well as representatives of IEA PVPS Task 16 for the solar side in the committee. The poster will discuss the results of both workshops.


Reference: [1] https://www.iea-wind.org/task51/   The Task website, last accessed 10 January 2024

How to cite: Giebel, G., Draxl, C., Frank, H., Zack, J., Möhrlen, C., Kariniotakis, G., Browell, J., Bessa, R., and Lenaghan, D.: IEA Wind Task 51 – Minute and Seasonal Scale Forecasting Workshops for the Weather Driven Energy System, EGU General Assembly 2024, Vienna, Austria, 14–19 Apr 2024, EGU24-17848, https://doi.org/10.5194/egusphere-egu24-17848, 2024.

As China strides towards its carbon neutrality target by 2060, the strategic planning of renewable energy distribution and power plant installations becomes imperative to fulfill the renewable energy penetration goals. This study presents a comprehensive assessment of the future projections of solar and wind power resources in China, utilizing the latest Coupled Model Intercomparison Project Phase 6 (CMIP6) models. We examine various CMIP6 scenarios to project the geographical and temporal variations of solar and wind energy potential up to 2100. A verification assessment was carried out using terrestrial solar radiation and wind speed data sourced from 17 stations operated by the China Meteorological Administration (CMA). This evaluation revealed that the Meteorological Research Institute Earth System Model version 2-0 (MRI-ESM2-0) demonstrated overall superior performance in terms of correlation coefficients (R) and Root Mean Square Error (RMSE). Then MRI-ESM2-0 was selected to examine the spatial and temporal shifts in solar and wind potential in China. Notably, in the SSP585 scenario, a marked decrease in both PV power potential and wind power potential was observed. Additionally, the future spatial complementarity between solar and wind power in China was evaluated using the Pearson correlation coefficient and Kendall rank correlation coefficient and this was juxtaposed with the present complementarity. These maps provide a crucial reference for guiding the planning and management of renewable energy resources in China.

How to cite: Liao, Z., Xia, X., and Luo, Y.: Future Projections and Complementarity Assessment of Solar and Wind Power in China Using CMIP6 Models, EGU General Assembly 2024, Vienna, Austria, 14–19 Apr 2024, EGU24-18234, https://doi.org/10.5194/egusphere-egu24-18234, 2024.

EGU24-18322 | ECS | Posters on site | ERE2.1

An evaluation of wind speed profiles in model-based reanalyses using ground-based measurements of high quality in the context of wind energy generation 

David Geiger, Dehong Yuan, Thomas Spangehl, Doron Callies, Jaqueline Drücke, Garrett Good, Frank Kasper, and Lukas Pauscher

Wind speed from atmospheric reanalyses is often used as input for modelling wind energy production in energy systems analysis. While some studies compare energy generation of wind turbines to those modelled from reanalysis data sets for specific sites, such analyses are usually aggregated to regional or national levels. However, nationwide evaluations using high quality wind speed measurements at heights relevant for modern wind turbines are still scarce. 

This paper presents a detailed comparison of high quality wind speed measurements of tall profiles with different reanalysis datasets at more than 75 locations in Germany measured by lidars and masts. Among the evaluated model-based products are the regional reanalysis COSMO-REA6, the global reanalysis ERA5 and the new European reanalysis CERRA. They are evaluated at different measurement heights using statistical analysis. All sites include measurement heights above 100 m and are suited for wind energy applications. This evaluation dataset provides good coverage of the relevant terrain ranging from offshore to the low mountain regions. Measurement locations are distributed all over Germany. Data was collected over multiple years (2012 – 2023) and measurement durations at individual locations range from months to multiple years. Many of the measurements were carried out adhering to the current standards used in wind resource assessment or have comparable quality. Thus, the dataset allows for a unique and comprehensive evaluation of the reanalysis datasets with respect to the representation of geographic and topographic features as well as seasonal patterns in the context of wind energy generation. 

To address current advancements in wind power generation, our analysis focuses on heights above 100 m to reflect the height of modern wind turbines. 

First analysis results using ERA5 and COSMO-REA6 indicate a distinct effect of the terrain on the model skill. Both reanalyses have a small median bias across all measurements with larger variations seen for ERA5. There is a height dependency in the bias of the wind speed, with positive (negative) biases for lower (higher) orographic measurement heights – i.e. the terrain height at which the lidar or mast is installed. The bias varies depending on the elevation of the measurement position in hilly/mountainous terrain. A clear correlation can be observed for the bias and the difference of the terrain height at the measurement location and the orographic height of the assigned model grid box. While for elevated lidar/mast positions (higher than the model grid cell) a clear tendency towards higher measured wind speeds can be observed the effect vanishes for measurement sites close to the orographic model height. 

How to cite: Geiger, D., Yuan, D., Spangehl, T., Callies, D., Drücke, J., Good, G., Kasper, F., and Pauscher, L.: An evaluation of wind speed profiles in model-based reanalyses using ground-based measurements of high quality in the context of wind energy generation, EGU General Assembly 2024, Vienna, Austria, 14–19 Apr 2024, EGU24-18322, https://doi.org/10.5194/egusphere-egu24-18322, 2024.

EGU24-18854 | ECS | Orals | ERE2.1

Solar Radiation Forecasts from Large Eddy Simulations and Observations using Ensemble Kalman Filtering 

Marleen van Soest, Harm Jonker, and Stephan de Roode

The increase in renewable energy production demands forecasting of wind and solar radiation due to their greater variability compared to non-renewable energy sources. The variability in solar energy is primarily caused by clouds. Large Eddy Simulation (LES) proves effective for high-resolution solar radiation prediction, capturing clouds like stratocumulus where large-scale models cannot. LES uncertainty in clouds primarily stems from initial conditions taken from these large-scale models. In this study, an ensemble Kalman filter assimilates observations into LES initial conditions. A large ensemble is created from a limited amount of LES runs by taking advantage of their internal variability. From this ensemble and measurements from the Cabauw measurement site, improved initial conditions are calculated for a range of stratocumulus cases. These cases are simulated without further interference. The method shows a 60% reduction in Root Mean Square Error (RMSE) for shortwave down solar radiation at the initial condition over the unfiltered initial condition. This improvement persists at 45% after 3 hours of simulation, showing the lasting impact of assimilated observational data on predictive accuracy. The decrease can be accounted to a combination of microphysical processes, energy fluxes from the lower boundary condition and the advective tendencies in the model. In future work, possible improvements to these processes will be identified and the method will be evaluated for other sites and cloud conditions.

How to cite: van Soest, M., Jonker, H., and de Roode, S.: Solar Radiation Forecasts from Large Eddy Simulations and Observations using Ensemble Kalman Filtering, EGU General Assembly 2024, Vienna, Austria, 14–19 Apr 2024, EGU24-18854, https://doi.org/10.5194/egusphere-egu24-18854, 2024.

The growing importance of the offshore wind energy sector emphasizes the need for projections of the long-term energy yield for existing and planned wind farm installations. In the North Sea, where wind farms are already pivotal to the electricity mix of the surrounding countries, the production capacity is set to increase tenfold by 2050. Studies suggest that, by 2050, the wind climate over the North Sea basin may differ significantly from the historical climate (Carvalho et al., 2021; Hahmann et al., 2022). Here, we combine an analysis of CMIP6 projections with an ERA5-driven, mesoscale wind farm simulation to further explore the impact of near-future wind climate changes over the North Sea on the energy production. First, an ensemble of 17 GCMs is reduced to 12 GCMs based on an analysis of the ability to represent the historical wind rose at 100 m MSL (1985-2014). Next, we identify future decades for each season where the wind rose exceeds the range of the historical decadal variability. Based on these extreme wind roses, we then apply a sub-sampling to a 30-year, ERA5-driven COSMO-CLM simulation covering the North Sea and incorporating a projected, 250 GW wind farm layout. Based on the sub-sampled datasets, we then quantify the impact of these extreme 10-year wind roses on the energy production of different wind farm clusters and compare this against an historical baseline.

How to cite: Borgers, R., Pinto, J., Meyers, J., and van Lipzig, N.: Future wind energy production over the North Sea for extreme, 10-year wind roses based on CMIP6-informed subsampling of an ERA5-driven RCM simulation, EGU General Assembly 2024, Vienna, Austria, 14–19 Apr 2024, EGU24-20273, https://doi.org/10.5194/egusphere-egu24-20273, 2024.

EGU24-20569 | Posters on site | ERE2.1

Investigation of air-sea interaction with a One-Way Coupling: MIKE 3 wave and WRF-LES 

Sima Hamzeloo, Xiaoli Guo Larsén, Alfredo Peña, and Jacob Tornfeldt Soerensen

The study aims to couple the Weather Research and Forecasting (WRF) [1] model of the large eddy simulation (LES) module with the MIKE 21 wave [2] model to study the effect of surface waves on the atmospheric flow over the North Sea. We provide a realistic surface wave field with MIKE 21 by forcing Era5 wind speed. We examine the effect of such wave fields on the atmosphere for a variety of met-ocean conditions, from normal to extreme conditions. The methodology involves applying simulated significant wave heights as the surface boundary for the WRF model, employing the LES module to capture the three-dimensional as well as smaller scales of turbulence that are unresolved by WRF-LES. The simulations will be validated using atmospheric and wave measurements in the North Sea, e.g., from the FINO 1 and 3 metocean research platforms. The preliminary results include the model outputs, including the spatial distribution of wind fields under different wave conditions.

[1] Skamarock, W. C., Klemp, J. B., Dudhia, J., Gill, D. O., Liu, Z., Berner, J., … Huang, X. -yu. (2019). A Description of the Advanced Research WRF Model Version 4.1 (No. NCAR/TN-556+STR).

[2] https://www.mikepoweredbydhi.com/

How to cite: Hamzeloo, S., Guo Larsén, X., Peña, A., and Soerensen, J. T.: Investigation of air-sea interaction with a One-Way Coupling: MIKE 3 wave and WRF-LES, EGU General Assembly 2024, Vienna, Austria, 14–19 Apr 2024, EGU24-20569, https://doi.org/10.5194/egusphere-egu24-20569, 2024.

EGU24-22047 | Orals | ERE2.1

Effect of Saharan dust storm events on the forecast of photovoltaic power generation in Hungary 

György Varga, Fruzsina Gresina, József Szeberényi, András Gelencsér, and Ágnes Rostási

The expansion of renewable energy sources is a major issue from the sustainability, climate policy and energy security perspectives. All of this expansion can be optimal if its potential is exploited to the best possible effect, and accurate forecasting of irradiance levels, both for existing and planned capacity, is essential.

Solar forecasting is the process of predicting the expected solar output from a photovoltaic (PV) system over a given period. This process is important for power system operators and utility companies who need to ensure that they can meet the electricity demand of their customers by balancing the supply and demand of energy on the grid.

Our research investigated the impact of mineral dust on photovoltaic power generation and day-ahead forecast. We analysed the year 2022, when the number of Saharan dust storm events identified in Hungary (n=16) set a new record. Our methods included satellite measurements, numerical simulations, air mass movement trajectory calculations and synoptic meteorological analyses, as well as laboratory analyses of the dust material that washed out with precipitation during Saharan dust storm events. During some episodes, a deficit of up to 500 MW between actual and predicted output was periodically detected, which required the use of expensive and polluting back-up capacity.

We have shown that the semi-direct effect of atmospheric dust particles on high-level cloud formation rather than their direct irradiance-reducing effect is responsible for the reduced accuracies of e short-term (24-h) PV energy production forecasts during these events.

The results were published in Varga et al. (2024). Effect of Saharan dust episodes on the accuracy of photovoltaic energy production forecast in Hungary (Central Europe). Renewable and Sustainable Energy Reviews 193, https://doi.org/10.1016/j.rser.2024.114289

The research was supported by the NRDI projects FK138692 and RRF-2.3.1-21-2021. The research was funded by the Sustainable Development and Technologies National Programme of the Hungarian Academy of Sciences (FFT NP FTA).


How to cite: Varga, G., Gresina, F., Szeberényi, J., Gelencsér, A., and Rostási, Á.: Effect of Saharan dust storm events on the forecast of photovoltaic power generation in Hungary, EGU General Assembly 2024, Vienna, Austria, 14–19 Apr 2024, EGU24-22047, https://doi.org/10.5194/egusphere-egu24-22047, 2024.

EGU24-672 | ECS | Orals | CL3.1.1

Land-atmosphere coupling induced local moist convection initiation in central Europe 

Noah Breuninger and Kirsten Warrach-Sagi

In Europe, extreme weather events are expected to increase noticeably in frequency, duration, and intensity with the continued warming of the planet's climate. Land-atmosphere feedbacks have been shown to play an important role in the exacerbation of events such as heat waves and droughts. Due to the important role of convective events in local weather an improved understanding of the role that land-atmosphere feedback plays in the development of convection initiation is required.

The heated condensation framework (HCF) enables the quantification of land-atmosphere coupling strength and local convection events in dependence of the temperature and moisture profiles from the ground to the planetary boundary layer height. The HCF is applied to the hourly data from the Weather Research and Forecasting (WRF) model application of the University of Hohenheim (UHOH) within the decadal km-scale regional climate simulations within CORDEX-FPS convection.

The analysis reveals the Po-Valley area as a hotspot of land-atmosphere coupling-induced local convection initiation in central Europe. Further strong wet and dry soil anomalies impact the number of local convection initiation events throughout the studied domain.

How to cite: Breuninger, N. and Warrach-Sagi, K.: Land-atmosphere coupling induced local moist convection initiation in central Europe, EGU General Assembly 2024, Vienna, Austria, 14–19 Apr 2024, EGU24-672, https://doi.org/10.5194/egusphere-egu24-672, 2024.

EGU24-733 | ECS | Orals | CL3.1.1

Highlighting future climate extremes in CMIP6-based convection-permitting simulations over the Black Sea Basin 

Mehmet Baris Kelebek, Fulden Batibeniz, and Barış Önol

The frequency and severity of extreme weather events, including temperature and precipitation extremes, have been increasing globally due to human-induced climate change. The Black Sea Basin (BSB), with its complex topography and strong air-sea interactions, is particularly susceptible to climate change and serves as a hot-spot for studying regional climate extremes. To obtain reliable information in BSB, high-resolution convection-permitting simulations are necessary. In this research, we performed convection-permitting climate simulations for historical (2005–2014) and future (2061–2070) periods to investigate the changes in temperature and precipitation extremes and underlying mechanisms based on the SSP3-7.0 climate change scenario over the BSB. To achieve this, we downscaled the CMIP6-based MPI-ESM1.2-HR outputs to 3 km horizontal resolution using the WRF model. The future simulation demonstrates an increased exposure to warm extremes as indicated by the positive change of the TX90P index by about 18% and an increase of the heat wave duration index (HWDI) reaching 55 days per year over the BSB. These changes primarily occur over the highlands of Eastern Anatolia due to enhanced land-atmosphere interactions. In March, a change in low-level circulation leads to a sudden warming of approximately 6°C and an early onset of the melting season, resulting in a 20% reduction in snow cover over Eastern Anatolia. This shift increases extreme temperatures due to a substantial snow albedo feedback caused by a 10% reduction in surface albedo in this area. Furthermore, our analyzes highlight the intensification of daily and sub-daily precipitation along the coastal regions of the Black Sea. Particularly in winter and autumn, the ratio of daily extreme precipitation amounts to the seasonal total precipitation (R90PTOT index) reaches 45% in the future over the eastern Black Sea. Additionally, daily precipitation probabilities shift towards higher values for extreme precipitation amounts in the same area with maximum precipitations exceeding 280 mm/day. At the sub-daily scale, this region experiences an intensification in hourly precipitation throughout the day due to a 22% increase in low-level moisture flux resulting from 1°C warmer sea surface temperatures in winter. The increased extreme precipitation in the autumn is associated with the intensification of afternoon precipitation along the Black Sea coasts of Türkiye. This study emphasizes the importance of convection-permitting climate simulations in improving our understanding of climate extremes in the topographically complex BSB. It provides valuable insights for mitigation and adaptation efforts in this climate change hot-spot.

Acknowledgment: The numerical calculations reported in this paper were fully performed at TUBITAK ULAKBIM, High Performance and Grid Computing Center (TRUBA resources).

How to cite: Kelebek, M. B., Batibeniz, F., and Önol, B.: Highlighting future climate extremes in CMIP6-based convection-permitting simulations over the Black Sea Basin, EGU General Assembly 2024, Vienna, Austria, 14–19 Apr 2024, EGU24-733, https://doi.org/10.5194/egusphere-egu24-733, 2024.

EGU24-1873 | ECS | Posters on site | CL3.1.1 | Highlight

Exploring the climate change influence on short-duration convective precipitation extremes in the southeastern Alpine forelands 

Stephanie Haas, Gottfried Kirchengast, and Jürgen Fuchsberger

Short-duration extreme convective precipitation events (SDECPEs) are increasingly altered by climate change. Considering their severe risk, and high impact on our everyday lives, a profound understanding of such extreme precipitation is crucial. For their investigation we can leverage a newly developed class of Threshold-Exceedance-Amount (TEA) metrics, which enable the detection and tracking of weather and climate extremes. The compound indices based on these TEA metrics have proven to be a useful tool to investigate changes of different characteristics of temperature and precipitation extremes, both in isolation and in combination.

It is challenging, however, to perform such an analysis for SDECPEs, since their short durations of only about one to three hours and their highly localized character make them very weakly detectable in reanalysis datasets like ERA5-Land, with a spatial resolution of the order of 10 km (0.1° x 0.1° grid). High resolution datasets like from the WegenerNet climate station network in southeast Austria (100 m x 100 m, 5 min) and GeoSphere Austria’s INCA dataset (1 km x 1 km, 15 min) are far better suited for this purpose but offer only data over the most recent two decades. To our knowledge, there is currently no dataset that on its own fulfills all three key requirements (high spatial resolution, high temporal resolution, long data record) for the analysis of SDECPEs over time.

To get observations-based insight into the influence of climate change on SDECPEs in the southeast Alpine forelands, in particular their possible amplification, we aimed to bypass and overcome the weaknesses of any single dataset by a study consisting of two parts: (1) the high-resolution exploration of SDECPEs in the well-observed most recent two decades. Here we investigate the relationship between maximum hourly precipitation and average hourly precipitation on SDECPE-days and complement our findings with information about the temperature increase in the study region. (2) We perform a longer-term assessment of the development of SDECPEs based on reanalysis data. Using the knowledge gained from (1), we are able to model maximum hourly precipitation data and compare the changes in event characteristics to the ones of daily precipitation sums.

We show that our approach does reveal some evidence for a climate change induced amplification of SDECPEs in the southeast Alpine forelands. At the same time, the results vary strongly within the study region, mainly due to high natural variability.

How to cite: Haas, S., Kirchengast, G., and Fuchsberger, J.: Exploring the climate change influence on short-duration convective precipitation extremes in the southeastern Alpine forelands, EGU General Assembly 2024, Vienna, Austria, 14–19 Apr 2024, EGU24-1873, https://doi.org/10.5194/egusphere-egu24-1873, 2024.

This study examines an extreme wind gust event of over 45 m s-1 occurring in the Yangtze River Delta (YRD) in East China on 30 April 2021, which broke the historical record of surface wind speeds of 221 automated weather stations. A high-resolution mesonet of eight radar wind profilers (RWPs) and six triangular regions along the path of the propagating wind gust is utilized to investigate the dynamics of the extreme wind gust event. Downward transport of turbulence and momentum, and the changes in vertical divergence and vorticity distributions during the event are analyzed. Downward momentum transport likely contributes to the formation of a gust front, and the combination of a gust front and a mesocyclone is of significance in the formation of the extreme wind gust in addition to the large-scale environment. Intensification in mesoscale circulation produced by the merging process likely results in new convection initiation, which potentially accelerates the surface wind through intensified wind shear, and ultimately resulting in the occurrence of the extreme wind gust. This study highlights the role of multiscale processes in the formation of extreme wind gust, as well as the advantage of the non-negligible capability of RWP mesonet in monitoring the turbulence and momentum transport during the passage of the extreme wind systems. The RWP mesonet can serve as a good entry point in extreme wind nowcasting and prediction studies in the future.

How to cite: Chen, T.: An Observational Analysis of the Evolution and Structures of an Extreme Wind Gust Event in East China, EGU General Assembly 2024, Vienna, Austria, 14–19 Apr 2024, EGU24-2517, https://doi.org/10.5194/egusphere-egu24-2517, 2024.

EGU24-2976 | ECS | Posters on site | CL3.1.1

Intensification of mesoscale convective systems in the East Asian rainband over the past two decades 

Puxi Li, Fengfei Song, Haoming Chen, Jian Li, Andreas Prein, and Wenxia Zhang

 As one of the major producers of extreme precipitation, mesoscale convective systems (MCSs) have received much attention. Recently, MCSs over several hotpots, including the Sahel and US Great Plains, have been found to intensify under global warming. However, relevant studies on the East Asian rainband, another MCS hotpot, are scarce. Here, by using a novel rain-cell tracking algorithm on a high spatiotemporal resolution satellite precipitation product, we show that both the frequency and intensity of MCSs over the East Asian rainband have increased by 21.8% and 9.8% respectively over the past two decades (2000-2021). The more frequent and intense MCSs contribute nearly three quarters to the total precipitation increase. The changes in MCSs are caused by more frequent favorable large-scale water vapor-rich environments that are likely to increase under global warming. The increased frequency and intensity of MCSs have profound impacts on the hydroclimate of East Asia, including producing extreme events such as severe flooding. 

How to cite: Li, P., Song, F., Chen, H., Li, J., Prein, A., and Zhang, W.: Intensification of mesoscale convective systems in the East Asian rainband over the past two decades, EGU General Assembly 2024, Vienna, Austria, 14–19 Apr 2024, EGU24-2976, https://doi.org/10.5194/egusphere-egu24-2976, 2024.

EGU24-3009 | ECS | Orals | CL3.1.1

Exploring changes of precipitation extremes under climate change through global variable-resolution modeling 

Wei Sun, Jian Li, Rucong Yu, Nina Li, and Yi Zhang

Understanding the responses of precipitation extremes to global climate change remains limited owing to their poor representations in models and complicated interactions with multi-scale systems. Here we take the record-breaking precipitation over China in 2021 as an example, and study its changes under three different climate scenarios through a developed pseudo-global-warming (PGW) experimental framework with 60–3 km variable-resolution global ensemble modeling. Compared to the present cli- mate, the precipitation extreme under a warmer (cooler) climate increased (decreased) in intensity, cov- erage, and total amount at a range of 24.3%–37.8% (18.7%–56.1%). With the help of the proposed PGW experimental framework, we further reveal the impacts of the multi-scale system interactions in climate change on the precipitation extreme. Under the warmer climate, large-scale water vapor transport con- verged from double typhoons and the subtropical high marched into central China, enhancing the con- vective energy and instability on the leading edge of the transport belt. As a result, the mesoscale convective system (MCS) that directly contributed to the precipitation extreme became stronger than that in the present climate. On the contrary, the cooler climate displayed opposite changing characteris- tics relative to the warmer climate, ranging from the large-scale systems to local environments and to the MCS. In summary, our study provides a promising approach to scientifically assess the response of pre- cipitation extremes to climate change, making it feasible to perform ensemble simulations while inves- tigating the multi-scale system interactions over the globe.

How to cite: Sun, W., Li, J., Yu, R., Li, N., and Zhang, Y.: Exploring changes of precipitation extremes under climate change through global variable-resolution modeling, EGU General Assembly 2024, Vienna, Austria, 14–19 Apr 2024, EGU24-3009, https://doi.org/10.5194/egusphere-egu24-3009, 2024.

This contribution focuses on the change in 1h heavy precipitation distribution in response to the increasing air temperature in Czechia (Central Europe). The air temperature, the dew point temperature and the temperature of lifting condensation level are used as temperature characteristics. The change in the distribution of 1h precipitation measurements is compared with the results of reanalyses based on simulations of ALADIN-CZ NWP model and with the results of future climate simulations by ALADIN-CLIMAT-CZ climate model. In general, the increase in heavy precipitation appears clearly in the very upper part of precipitation distribution. Values of the upper percentiles of precipitation increase up to a certain temperature threshold and then they decrease, which is in line with other studies. This is also visible in the simulations of future climate.

How to cite: Sokol, Z. and Popova, J.: Change in the distribution of heavy 1h precipitation due to temperature changes in measured values, model reanalyses and model simulations of future climate, EGU General Assembly 2024, Vienna, Austria, 14–19 Apr 2024, EGU24-3043, https://doi.org/10.5194/egusphere-egu24-3043, 2024.

EGU24-3707 | ECS | Posters on site | CL3.1.1

Combined Radar Quality Index for Quantitative Precipitation Estimation of Heavy Rainfall Events 

Yang Zhang, Liping Liu, and Hao Wen

For quantitative precipitation estimation (QPE) based on polarimetric radar (PR) and rain gauges (RGs), the quality of the radar data is crucial for estimation accuracy. A combined radar quality index (CRQI) is proposed to represent the quality of the radar data used for QPE and an algorithm that uses CRQI to improve the QPE performance. Nine heavy rainfall events that occurred in Guangdong Province, China, were used to evaluate the QPE performance in five contrast tests. The QPE performance was evaluated in terms of the overall statistics, spatial distribution, near real-time statistics, and microphysics. CRQI was used to identify good-quality data pairs (i.e., PR-based QPE and RG observation) for correcting estimators (i.e., relationships between the rainfall rate and the PR parameters) in real-time. The PR-based QPE performance was improved because estimators were corrected according to variations in the drop size distribution, especially for data corresponding to 1.1 mm < average Dm < 1.4 mm, and 4 < average log10 Nw < 4.5. Some underestimations caused by the beam broadening effect, excessive beam height, and partial beam blockages, which could not be mitigated by traditional algorithms, were significantly mitigated by the proposed algorithm using CRQI. The proposed algorithm reduced the root mean square error by 17.5% for all heavy rainfall events, which included three precipitation types: convective precipitation (very heavy rainfall), squall line (huge raindrops), and stratocumulus precipitation (small but dense raindrops). Although the best QPE performance was observed for stratocumulus precipitation, the biggest improvement in performance with the proposed algorithm was observed for the squall line.

How to cite: Zhang, Y., Liu, L., and Wen, H.: Combined Radar Quality Index for Quantitative Precipitation Estimation of Heavy Rainfall Events, EGU General Assembly 2024, Vienna, Austria, 14–19 Apr 2024, EGU24-3707, https://doi.org/10.5194/egusphere-egu24-3707, 2024.

EGU24-3771 | Posters on site | CL3.1.1

Summer and tropical consecutive days in normal periods 1961-1990 and 1991-2020. 

Pavel Faško, Oliver Bochníček, and Ladislav Markovič

Summer and tropical days were and are part of the processing of historical observations. Their processing was the content of each monthly report of meteorological observations as well as the annual processing in the form of a yearbook. Changes in temperature (especially positive deviations from normal values) also cause their more frequent occurrence. This would not be unusual or unexpected, even if the regularity of these periods cannot be predicted. Higher air temperatures often cause health problems, especially for older and more sensitive people. Nausea and loss of concentration occur especially during longer periods of hot days. In this contribution, we decided to process the occurrence of periods of summer days (t_max≥25 °C) and periods of tropical days (t_max≥30 °C). The term period here means consecutive days (minimum 2). Professional and aerial meteorological stations covering the territory of Slovakia well were selected. Their length was considered for two normal periods, namely 1961-1990 and 1991 - 2020. The mutual comparison gave us a clear idea of the redistribution of periods of different lengths and the territorial unit (places in Slovakia). While for summer days we observe a decrease in shorter periods and an increase in longer periods, especially in lowland areas, in the rest of the territory, especially in the north, or in mountainous areas, rather an increase even from the shortest periods.

On tropical days, or when comparing the periods of tropical days in both normal periods (1961 - 1990 and 1991 - 2020), we find the fact of a very strong increase from the shortest periods of consecutive tropical days at all selected meteorological stations. Since it is impossible to compare the frequency of periods as well as the number of tropical days themselves in absolute terms, we helped ourselves with a percentage evaluation. The fact is that, especially for tropical days, the biggest increase is in the north of the country, the shortest periods (2-3 days in a row) increased by up to 250%. They even began to appear in places where they could not be observed in the period 1961 - 1990. The results conceived in this way will help not only the tourism industry, but also the adaptation of man and his environment to changes in the climate system.


How to cite: Faško, P., Bochníček, O., and Markovič, L.: Summer and tropical consecutive days in normal periods 1961-1990 and 1991-2020., EGU General Assembly 2024, Vienna, Austria, 14–19 Apr 2024, EGU24-3771, https://doi.org/10.5194/egusphere-egu24-3771, 2024.

EGU24-4436 | ECS | Orals | CL3.1.1

How Could Lake-Effect Snow Storms Evolve in a Warming Future Climate? 

Miraj Kayastha, Pengfei Xue, Chenfu Huang, Jiali Wang, Zhao Yang, William Pringle, Tirthankar Chakraborty, Yun Qian, and Robert Hetland

When cold, dry air travels over a relatively warmer lake, lake-effect snow (LES) develops due to an increase in moisture flux from the lake to the atmosphere, which in turn promotes cloud formation and subsequent precipitation. A destructive LES storm struck the Buffalo region in New York, from November 17-20, 2022. Buffalo, located at the eastern end of Lake Erie and subject to winter winds that sweep across the lake, was inundated with nearly 7 feet of snow, prompting the declaration of federal emergencies by multiple counties. The LES storm highlighted the need for at-risk communities to enhance their preparedness for comparable future incidents. Using a cloud-resolving 4 km scale, we investigated how such an LES storm might manifest in a warmer future climate by employing the Pseudo-Global Warming (PGW) method and a two-way coupled lake-atmosphere regional climate modeling system. The modeling system comprises a two-way coupled Weather Research and Forecasting (WRF) model and a Finite Volume Community Ocean Model (FVCOM)-based three-dimensional lake model. Under the PGW methodology, the future atmospheric forcing necessary for our regional climate modeling system was derived from a reanalysis climate dataset by incorporating projected atmospheric changes from a variety of CMIP6 earth system models. Furthermore, we integrated the warming signals in the lakes by utilizing the projected lake conditions obtained from a regional climate modeling system that was previously established and also incorporated an FVCOM-based lake model. According to our findings, the total storm precipitation for such an event by the end of this century could increase by 14% under a high-emission scenario, with an increase in rainfall at the expense of snowfall. Under the present-day climate conditions, snowfall was the primary type of precipitation experienced during the event. However, in a warmer future climate, the distribution of precipitation might be nearly equal between snowfall and rainfall. By conducting two additional simulations in which either the lake or atmosphere is warmed individually using the projected future conditions, we found that the warmer lakes primarily contributed to the increase in storm precipitation through increased evaporation, while the warmer atmosphere primarily influenced the form of storm precipitation during such an LES storm in the future.

How to cite: Kayastha, M., Xue, P., Huang, C., Wang, J., Yang, Z., Pringle, W., Chakraborty, T., Qian, Y., and Hetland, R.: How Could Lake-Effect Snow Storms Evolve in a Warming Future Climate?, EGU General Assembly 2024, Vienna, Austria, 14–19 Apr 2024, EGU24-4436, https://doi.org/10.5194/egusphere-egu24-4436, 2024.

EGU24-4916 | Orals | CL3.1.1

Climate variability outweighs influence of climate mean on summer precipitation extremes 

Kalle Nordling, Bjørn Samset, and Nora Fahrenbach

Climate change can involve changes in mean conditions, and in their variability on short to long timescales. But which of the two  is more important for our future climate?  We present a study indicating that for the number of extreme precipitation days, changes in climate variability dominate over  changes in the mean state. This analysis is based on three large ensemble simulations across three CMIP6 models (MPI-ESM1-2-LR, CanESM5, and ACCESS-ESM1-5). Here, we decompose the total changes in daily summer precipitation and daily maximum temperature into mean and variability components (standard deviation and skewness of the daily probability density functions).  Our key findings are that:1) Changes in climate variability (i.e., day-to-day variability of precipitation and changes in the precipitation distribution) have a more pronounced impact on extreme precipitation events than changes in the mean state. 2) In contrast, changes in the mean temperature state play a more dominant role in determining overall changes in daily temperature. These insights  are valuable for understanding the mechanisms driving extreme weather events and  highlight the need to consider daily variability changes in climate change impact assessments.

How to cite: Nordling, K., Samset, B., and Fahrenbach, N.: Climate variability outweighs influence of climate mean on summer precipitation extremes, EGU General Assembly 2024, Vienna, Austria, 14–19 Apr 2024, EGU24-4916, https://doi.org/10.5194/egusphere-egu24-4916, 2024.

The Analysis of Different Spatial-temporal Rainfall Characteristics and Drought Disaster Risk Assessment in Penghu Area


Keywords: Empirical Orthogonal Function, Wavelet Analysis, Standardized Precipitation Index, Drought


Under the impact of extreme climate and the trend of global warming, the frequency of natural disasters has increased, and extreme rainfall and extreme drought events have gradually increased, causing threats to human life, food shortages, and ecological catastrophes. In recent years, with the development of tourism industry in Penghu, the demand for water resources has increased, but available surface water sources are very scarce. At present, Penghu’s freshwater source is mainly seawater desalination, but this method is likely to affect Penghu’s unique coral reef marine ecology.

This study uses data mining methods to analyze rainfall characteristics and drought trends. Rainfall characteristic analysis uses empirical orthogonal function (EOF) and wavelet analysis (WA), and drought trend analysis uses the Standardized Precipitation Index (SPI) at different time scales. The results show that the rainfall characteristics of South Penghu Marine National Park and Penghu Island are different, and the rainfall difference between drought years and non-drought years is large. The drought index shows that in recent years, South Penghu Marine National Park is still in a relatively dry state, with a higher drought frequency than Penghu Island and Taiwan Island. The risk of agricultural drought and hydrological drought is high on a medium to long time scale. Therefore, special attention needs to be paid to the rainfall situation in South Penghu Marine National Park.

How to cite: Hsin-Wen, P. and Yuan-Chien, L.: The Analysis of Different Spatial-temporal Rainfall Characteristics and Drought Disaster Risk Assessment in Penghu Area, EGU General Assembly 2024, Vienna, Austria, 14–19 Apr 2024, EGU24-4924, https://doi.org/10.5194/egusphere-egu24-4924, 2024.

EGU24-6617 | ECS | Posters on site | CL3.1.1

Two-stage non-linear approach in the analysis of precipitation time series  

Beatrice Lioi, Krzysztof Kochanek, Tiziana Bisantino, and Vito Iacobellis

An increasing perception of climate change both on a global and local scale, accompanied by the increase in observed average surface temperature of the oceans, and by the increased frequency of extreme events in different territories, creates the necessity of developing hydrological tools and models within the framework of non-stationarity. This study analyses the daily and hourly rainfalls recorded in Puglia (Southern Italy). In scientific literature the widely used non-parametric Mann-Kendall (MK) test is suggested to identify monotonic trends, then followed by the application of a further non-parametric measure of trend, the Sen's Slope. Indeed, in parametric methods the non-stationary character is exercised with the addition of the temporal variable (co-variant) t in the probability distribution. In this framework the Two-Stage (TS) method allows to tackle this problem by associating the linear or non-linear temporal dependence to both mean and standard deviation of time series (Kochanek et al., 2013). In this field, we propose an advancement of the TS methodology by introducing a polynomial function in the mean trend, leaving the variance trend linear. The obtained results represent the first non-linear application of the TS method in a non-stationary approach to extreme events. With such application of the TS method, we show how to update the evaluation of quantiles with 5 or 10 years return time, in the aim of a technical application to hydraulic risk management and urban planning.

How to cite: Lioi, B., Kochanek, K., Bisantino, T., and Iacobellis, V.: Two-stage non-linear approach in the analysis of precipitation time series , EGU General Assembly 2024, Vienna, Austria, 14–19 Apr 2024, EGU24-6617, https://doi.org/10.5194/egusphere-egu24-6617, 2024.

EGU24-6792 | Orals | CL3.1.1

Exploring Continental Convection-Permitting Model Simulations for South America: Cross-correlation Dynamics between precipitation and temperature time series at São Paulo 

Kwok Pan Chun, Thanti Octavianti, Hristos Tyralis, Georgia Papacharalampous, Rosmeri Porfirio da Rocha, Emir Toker, Yasemin Ezber, Luminita Danaila, Kate Halladay, and Ron Kahana

Increasing spatial resolution to kilometre scales allows the deactivation of deep convection parameterisation schemes. As a result of various global initiatives for the next generation of climate studies, continental convection-permitting model (CPM) simulations are now accessible. Nonstationary local extremes, like heatwaves and intense precipitation, are probabilistically linked to regional circulation through scaling relationships. However, these relationships have not been extensively explored in the new simulations available in the early 2020s. Hourly time series data were extracted from the UK Climate Science for Service Partnership (CSSP) and the US South America Affinity Group (SAAG) CPM simulations to compare extreme characteristics of precipitation and temperature for 39 stations in a region of São Paulo, Brazil. Compared to reanalysis and satellite data, which exhibit lower variance in hourly time series, these two sets of CPM simulations have precipitation that is more similar to station observations than the ERA5 data and the Integrated Multi-satellitE Retrievals for the Global Precipitation Measurement (IMERG) data.

The cross-correlation structures of the time series are investigated to quantify temporal dependence and reveal patterns between temperature and precipitation at an hourly timescale. Within a higher-dimensional probability space for joint risk, the cross-correlation structures between temperature and precipitation at different lags demonstrate the "memory" of these variables, indicating the influence of past values on future behaviour across multiple time points. Their forecasting power for these two variable based on each other is also explored to offer insights into the physical processes within the evolving simulated dynamic system.

Overall, the results underscore the added value of convection-permitting models in providing more realistic simulations of local dynamics of extremes. The identified cross-correlation structures from the CPMs are valuable for exploring opportunities to design AI engines based on weather generator algorithms that use stochastic differential equations. Using CPM simulations, these weather generators can be employed to develop AI approaches for rapid decision support tools aimed at stakeholders facing extreme weather events related to compound risks of temperature and precipitation.

How to cite: Chun, K. P., Octavianti, T., Tyralis, H., Papacharalampous, G., da Rocha, R. P., Toker, E., Ezber, Y., Danaila, L., Halladay, K., and Kahana, R.: Exploring Continental Convection-Permitting Model Simulations for South America: Cross-correlation Dynamics between precipitation and temperature time series at São Paulo, EGU General Assembly 2024, Vienna, Austria, 14–19 Apr 2024, EGU24-6792, https://doi.org/10.5194/egusphere-egu24-6792, 2024.

Extreme precipitation events can cause flooding in central European river catchments. Climate simulations show that extreme precipitation, especially towards longer return periods, will intensify in a warmer climate for most parts of Europe. In order to study the mechanisms leading to the intensification of particularly extreme events, we investigate 10-year daily precipitation events over five major central European river catchments in Community Earth System Model Large Ensemble simulations. A statistical evaluation and comparison of large-scale circulation patterns associated with the events with operational ensemble weather prediction data from the ECMWF indicate a realistic representation of the 10-year extreme events in the climate model. Differences in these circulation patterns are analysed between the historical climate of 1990-2000 and a warmer climate at the end of the century (2091-2100). While most events occur in the core summer months (June-August) in the historical climate, there is a broadening of the seasonal distribution with extreme events from May to October in the warmer climate. Precipitation rates increase locally by 5-7%/K, similar to the Clausius-Clapeyron rate, related to significant increases in lower-tropospheric humidity. Averaged over the entire catchments, precipitation still increases, but with lower intensification rates varying between 1.2 and 3.8%/K for the individual catchments. This is due to a combination of thermodynamic and dynamic factors, in particular the shift towards the cold season, associated with smaller temperature increases during the events than expected from the overall warming, and a weakening of vertical motion over parts of the catchments. In future research, the robustness of these findings should be investigated through comparison with other climate simulations.

How to cite: Ruff, F. and Pfahl, S.: Projected future changes of very extreme precipitation events over central European river catchments from ensemble climate simulations, EGU General Assembly 2024, Vienna, Austria, 14–19 Apr 2024, EGU24-8043, https://doi.org/10.5194/egusphere-egu24-8043, 2024.

Arthropods play vital roles in the ecosystem (e.g., pollinators, decomposers, biological pest control), and thus can act as indicators of ecosystem integrity. The state of these ecosystems is sensitive to variations in climate conditions, especially on small islands. The Circum-Sicilian islands are a chain of small islands around Sicily in the central Mediterranean. With the use of Convection permitting simulations, many of these islands can finally be adequately resolved. The objective of the project PALEOSIM (PALEOclimate modelling of Small Islands in the Mediterranean and possible impacts on arthropod habitats) is to study climate impacts on the habitats of arthropods (mainly insects) in the Circum-Sicilian islands. To achieve this, RegCM5 is driven by CMIP6 and PMIP4 data for a 3 km region covering the west and central Mediterranean.

Climate indices from the simulations have been used to assess the ecological niche of select arthropod species and hence determine how these conditions have changed across different time scales. The data used to drive RegCM5 allows for the study of time slices across several scenarios, which include: the last glacial maximum, mid-Holocene, ~1000 CE, ~1850 CE, ~1995 CE (a historical baseline), and Global Warming Levels of 1.5, 2, and 3 °C. This analysis reveals how some species are especially sensitive to changes in climate conditions, and the significant threat of the current climate crisis.

How to cite: Ciarlo, J., Coppola, E., Micallef, A., and Mifsud, D.: Climate-induced variations in arthropod habitats of the Circum-Sicilian islands according to convection permitting simulations of the Mediterranean driven by CMIP6 and PMIP4 data, EGU General Assembly 2024, Vienna, Austria, 14–19 Apr 2024, EGU24-8279, https://doi.org/10.5194/egusphere-egu24-8279, 2024.

EGU24-9342 | Posters on site | CL3.1.1

Convection-Permitting simulations over South America: a look at the uncertainty sources at the sub-daily time scale 

Francesca Raffaele, Erika Coppola, Leidinice Silva, Maria Laura Bettolli, Josefina Blasquez, Jesus Fernandez, Josipa Milovac, Rosmeri Porfirio da Rocha, and Silvina Solman

A set of high resolution simulations have been performed over the La Plata region in South America, and a multi-model ensemble of Convection-Permitting simulations has been produced for a 3-years period (2018-2021). We have used this new high resolution ensemble to investigate more in depth the daily and hourly timescales.

The available satellite and gridded observational datasets show a clear uncertainty  when going to sub-daily timescale, therefore the validation of the model ensemble mean and extreme precipitation is performed by including also a station based observational dataset at both daily and hourly time scale, to assess  the model uncertainty within the context of the aforementioned observational uncertainty.

Moreover, a cluster analysis of the diurnal cycle precipitation has been used as a starting point for a spatial characterization of the precipitation in a region of heterogeneous topography. The ensemble models' performance has been validated inside five different regions in order to spatially homogenize the precipitation regimes at hourly timescales.

The results underlined a good agreement in the model ensemble especially in those areas where the homogenization of the stations is more pronounced.

On the other hand, the spread among models grow when looking at areas characterized by complex orography, thus highlighting the importance of having available a set of simulations as big as possible so that complexity can be represented within the  model uncertainty. 

How to cite: Raffaele, F., Coppola, E., Silva, L., Bettolli, M. L., Blasquez, J., Fernandez, J., Milovac, J., Porfirio da Rocha, R., and Solman, S.: Convection-Permitting simulations over South America: a look at the uncertainty sources at the sub-daily time scale, EGU General Assembly 2024, Vienna, Austria, 14–19 Apr 2024, EGU24-9342, https://doi.org/10.5194/egusphere-egu24-9342, 2024.

In the last 10 years, the very high resolution regional climate models have started to be used and recently the newly available regional climate model ensemble for the Great Alpine region, at the convection permitting (CP-RCM) resolution (> 3 km), has been released by the CORDEX Flagship Pilot Study on Convective phenomena at high resolution over Europe and the Mediterranean (FPSCONV). At such resolution, the improvement of the representation of local hydrological processes becomes relevant because the climate impact on the hydrological cycle at that scale is expected to be much better captured.  

To this aim, the CETEMPS hydrological model (CHyM) is used coupled off-line with the different CP-RCM ensemble members.  The model has been run in two different configurations, using either temperature and precipitation from the driving CP-RCM or directly the runoff. The hydrological simulation ensemble has been validated against local station data for the Po river and central Italian river basins, by using hydrological indicators, such as the Kling–Gupta efficiency (KGE). The climate change projections are compared with previous lower resolution simulation driven by convection parametrized regional climate models from the Euro-CORDEX ensemble.  

How to cite: Vargas-Heinz, L., Coppola, E., and García-Valdecasas Ojeda, M.: Impact of climate change on the hydrological cycle of the Great Alpine region by means of regional climate convection permitting high resolution simulations and hydrological model simulations. , EGU General Assembly 2024, Vienna, Austria, 14–19 Apr 2024, EGU24-10350, https://doi.org/10.5194/egusphere-egu24-10350, 2024.

The past 10 years of research proved that regional convection-permitting models (RCPMs) more realistically represent sub-daily statistics and extremes compared to GCMs and RCMs thanks to the possibility to switch off the parameterisation of convection at this resolution. Now, thanks to recent computational advancements, GCMs are approaching convection-permitting resolution (GCPM), but little is known on their performance at climatological scale over Europe.

Here we compare two 5-year GCPM simulations performed with IFS and ICON, respectively at 9 and 5km, within the NextGEMs project against the multi-model RCPM ensemble at circa 3 km run under the CORDEX Flagship Pilot project on Convective Phenomena over Europe and the Mediterranean (FPS Convection). The analysis focuses on the representation of sub-daily precipitation characteristics between GCPMs in comparison with the RCPM ensemble and several regional observational datasets over the greater Alpine region. In additional, the impact of a higher resolution (5km instead of 25km) of the ocean model is investigated thanks to an additional GCPM run. The natural variability of the GCPMs is evaluated with a bootstrapping approach and put in relation with the total and model uncertainty of the RCPM ensemble.  

Having GCMs that realistically represent the large-scale dynamics as well as the local scale process would be a crucial step forward and provide further confidence on the climate projections and support the Destination Earth project of the European Community.

How to cite: Fosser, G. and Bordoni, S.: Lessons learnt on convection-permitting models and their uncertainty at both global and regional scale , EGU General Assembly 2024, Vienna, Austria, 14–19 Apr 2024, EGU24-10431, https://doi.org/10.5194/egusphere-egu24-10431, 2024.

EGU24-10599 | ECS | Orals | CL3.1.1

Heatwave analysis over the city of Valencia (Spain) for past and future climate change models and scenarios 

Ana Fernandez-Garza, Eric Gielen, Manuel Pulido-Velazquez, Hector Macian-Sorribes, Adria Rubio-Martin, and Dariana Avila-Velasquez

Heatwaves have emerged as an increasingly recurrent extreme meteorological event, in the Mediterranean region and throughout Europe, during the summer. This is attributable to shifts in the distribution and magnitude of temperatures. In particular, the Comunitat Valenciana a region in Spain experienced the last summer its highest temperature, registering a 1.6ºC increase in the monthly average temperature compared to the reference period (1991-2020). On August 10, the historical record was exceeded by 3.4ºC, with temperatures exceeding 40ºC in more than 50% of the territory as reported by the Spanish Meteorological Agency (AEMET). During this climatic event, the Mortality Monitoring (MoMo) system reported a substantial spike in excess deaths, reaching 1,990 in August. This figure significantly exceeded the preceding month’s tally of 686 fatalities and the subsequent month’s count of 186 deaths. This concentration of mortality in the hottest month underscores the severity of the impact.

The analysis of heatwaves is crucial to provide scientific support for the necessary formulation of inform adequate public policies. Additionally, it enables the population to undertake necessary actions to mitigate the adverse effects of high temperatures.

In a context of increasing temperatures due to climate change, foreseeing its future evolution would provide valuable information for better preparedness. The present research analyses future heatwaves and trends in the city of Valencia, Spain. Future temperatures refer to five bias adjusted CMIP6 (Coupled Model Intercomparison Project Phase 6) climate change models across four different scenarios: historical (1979 to 2014), SSP126, SSP370 and SSP585 (2015-2100). Model suitability is evaluated comparing historical runs with reference data from W5E5-ERA5Land. Afterwards, an analysis of future heatwaves is conducted, using the operational definition of heatwave from Spain: periods of at least three consecutive days where maximum temperature exceeds a critical threshold set by each municipality, which in Valencia refers to the 90th percentile of maximum temperatures for the historical period.

For each detected heatwave the selected indicators are: the number, frequency, duration, intensity, amplitude, and risk level associated with these climatic events. Our analysis evaluates how the number of heatwaves vary, as well as to understand the behaviour of heatwaves in Valencia to determine how the risk might evolve in future contexts, and in a future generating a predictive model providing information on their spatial distribution, intensity, duration and severity.

Acknowledgements:

This study has received funding from the: “THE HUT project” (The Human-Tech Nexus – Building a Safe Haven to cope with Climate Extremes), under the European Union’s horizon research and innovation programme (GA No. 101073957).

How to cite: Fernandez-Garza, A., Gielen, E., Pulido-Velazquez, M., Macian-Sorribes, H., Rubio-Martin, A., and Avila-Velasquez, D.: Heatwave analysis over the city of Valencia (Spain) for past and future climate change models and scenarios, EGU General Assembly 2024, Vienna, Austria, 14–19 Apr 2024, EGU24-10599, https://doi.org/10.5194/egusphere-egu24-10599, 2024.

Convection permitting climate models (CPMs) display much improved present-day rainfall statistics at local scales as compared to common regional and global climate models. Yet, because CPMs are computationally very demanding, runs are short — typically covering 10 to 20 years  only  —  which makes it hard to distinguish the changes due to global warming from the noise due to internal variability. In addition, runs cover a limited set of changes at larger scales as only few global climate models have been downscaled so far. This challenges the representativeness of the results. Here, we discus these issues within the context of the production of the Dutch climate scenarios issued in fall 2023. We use spatial pooling of information to improve signal to noise. To produce scenarios for local rainfall extremes, we combined information from the CPMs with information from CMIP6 and one RCM (RACMO) using a simple scaling framework. From the CPMs we derived sensitivities of changes in rainfall intensity to surface dew point temperature change. By using spatial pooling and by taking out rain frequency change (using wet conditional statistics) a reasonable collapse of the data of 7 CPM simulations could be obtained, with typical dependencies between 1 and 2 times the Clausius Clapeyron relation. The change in rain frequency and the dew point temperature are derived from a  set of RACMO simulations using pseudo-global warming perturbations derived from CMIP6 combined with a simple perturbed physics method. With these RACMO simulations we covered a range in large-scale conditions compatible with CMIP6.  Subsequently, rain intensity change and frequency change are combined using a transformation of the observed rainfall distribution.  In this way, we could produce a set of climate scenarios for daily and hourly precipitation extremes covering a wide range in global change conditions. Besides these changing rainfall statistics, we also analyzed the spatial temporal characteristics of showers in order to investigate whether showers become larger in scale in the future climate.

How to cite: Lenderink, G., de Vries, H., and van Meijgaard, E.: Combining convection permitting modeling results with CMIP6 global climate model results to produce scenarios for local precipitation extremes, EGU General Assembly 2024, Vienna, Austria, 14–19 Apr 2024, EGU24-10660, https://doi.org/10.5194/egusphere-egu24-10660, 2024.

Extreme weather and climate events such as heat waves, droughts or heavy precipitation are already impacting urban areas worldwide, and such extremes are expected to become more frequent and/or severe with climate change. For vulnerability assessment and climate resilient urban planning, local decision-makers and stakeholders need high-resolution climate information that is tailored to their needs according to different geographical contexts (e.g. through the representation of mountainous areas, coastal lines or city characteristics). They also need information on the appropriate time scale, from specific events of a few days to decade-long statistics. Today, regional climate information often comes from global climate models that are downscaled to the local scale using statistical tools or regional climate models (RCMs) such as those used in the CORDEX initiative.

Longterm RCM simulations achieve horizontal resolutions of the order of ten kilometers and offer added value in certain respects compared with their global counterparts, but remain insufficient in certain specific geographical contexts such as the representation of cities, highly heterogeneous mountainous areas or along coastlines. The latest generation of RCMs, known as Convection Permitting Regional Climate Models (CPRCMs), now reach a spatial resolution of a few kilometers and can better represent heterogeneous land surfaces, with the potential offering a new quality of climate information better suited to local applications.

Here, we compare some evaluation simulations (e.g. driven by reanalysis) carried out as part of the EURO-CORDEX initiative (12,5 km RCM) and the CORDEX Flagship Pilot Study on Convection (3 km CPRCM) over the period 2000-2009. We analyze their ability to represent the urban climate of different European cities and the differences resulting from choices in urban parameterizations, land cover representation approaches (dominant coverage or fractional approaches) and land cover databases. We show that:

  • For most European cities, RCM simulations have a too coarse resolution; for example, for all coastal cities, the points that should be considered urban are mainly covered by water.

  • CPRCM simulations enable these areas to be better represented thanks to the increased resolution, but there are significant differences depending on how the different land covers are represented in a grid cell and how urban areas are simulated.

  • Depending on the meteorological variables of interest, some of the simpler urban parameterizations (altered slab) give results that are relatively close to the more sophisticated ones (multi-layer urban canyon).

  • While the increased complexity of CPRCM simulations enables urban climate to be better represented, it also increases the differences between simulations and makes it more difficult to quantify uncertainties and synthesize results into a general assessment (which is often needed by decision-makers) underlining the growing need to use ensembles of climate models for impact assessment.

How to cite: Le Roy, B. and Rechid, D.: Added values and uncertainties of convection permitting regional climate model simulations for urban impact studies over Europe, EGU General Assembly 2024, Vienna, Austria, 14–19 Apr 2024, EGU24-11048, https://doi.org/10.5194/egusphere-egu24-11048, 2024.

EGU24-11130 | ECS | Orals | CL3.1.1 | Highlight

How does 3°C global warming affect hail over Europe? 

Iris Thurnherr, Ruoyi Cui, Patricio Velasquez, Killian Brennan, Lena Wilhelm, Heini Wernli, Christian R. Steger, and Christoph Schär

Thunderstorm-related severe weather, in particular hail, causes extensive damage to life and infrastructure in the Alpine region. However, changes in hail impact due to a warmer climate are still not fully understood. In the scClim project, convection-permitting regional climate simulations over Europe using the model COSMO with a ~2.2 km horizontal resolution have been conducted for present-day climate conditions (2011-2021) and a climate scenario with a 3°C global warming using a pseudo-global-warming approach. ERA5 reanalyses were used as boundary conditions and a CMIP6 simulation (MPI-ESM1-2-HR) to infer the large-scale climate-change signal. The integrated online diagnostic HAILCAST is used to calculate maximum hail size. The simulations provide total precipitation and maximum hail size estimates every 5 minutes, which allows for hail cell tracking in the climate simulations and the analysis of hail events in a warmer climate. Validation of the present-day simulation against observations of temperature, precipitation and hail shows an overall good model performance. For hail in particular, radar-based, station-based and crowd-sourced observations have been used to assess the model performance in simulating hail on spatial, diurnal and seasonal scales. The validation outcome encourages further study of the climate signal of hail as simulated with the pseudo-global-warming approach. We will show projected changes in the spatial distribution and seasonal cycle of hail over Europe as well as changes in lifetime, storm area and location of hail cells due to a 3°C global warming.

How to cite: Thurnherr, I., Cui, R., Velasquez, P., Brennan, K., Wilhelm, L., Wernli, H., Steger, C. R., and Schär, C.: How does 3°C global warming affect hail over Europe?, EGU General Assembly 2024, Vienna, Austria, 14–19 Apr 2024, EGU24-11130, https://doi.org/10.5194/egusphere-egu24-11130, 2024.

EGU24-11157 | ECS | Orals | CL3.1.1 | Highlight

Evaluating sub-daily extreme precipitation from an ensemble of convection-permitting simulations: the role of topography. 

Nathalia Correa Sánchez, Eleonora Dallan, Francesco Marra, Giorgia Fosser, and Marco Borga

Past studies have shown that in orographically complex terrain, observed extreme precipitation intensity is impacted by elevation in different ways at different durations. Convection-permitting climate models (CPMs) are receiving increasing attention thanks to the more realistic representation of extreme sub-daily precipitation compared to coarser climate models. Two almost still unexplored themes concern: i) CPMs' ability to represent the observed relationship between precipitation and topography and ii) how the model ensemble uncertainty depends on elevation. To address these questions, we evaluate sub-daily extreme precipitation from an ensemble of eight CPM members (reanalysis-driven simulations) on topographically diverse terrains. We use observed data from rain gauges as benchmark. The analysis is conducted over the Eastern Italian Alps, where a strong relationship between precipitation sub-daily extremes and topography is observed (Dallan et al., 2023). We apply a non-asymptotic statistical approach (Simplified Metastatistical Extreme Value, SMEV) to estimate extreme precipitation return levels and assess their intra-model and inter-model uncertainties using a bootstrapped samples method. It is shown that the ensemble mean describes in a realistic way the precipitation extremes, with fractional standard errors of the mean-over-the-ensemble return levels ranging between 0,16 (24 hrs duration, 2 yrs return time) to 0,41 (1 hr duration, 100 yrs return time). We found that, compared to rain gauges, CPMs systematically underestimate extreme return levels in lowlands, whereas overestimate them at higher altitudes. Nevertheless, the CPMs can capture the relationship between rain depth and elevation, which is particularly important for 1-3 hrs duration. While the intra-model uncertainty decreases systematically with elevation at all durations, a more complex behaviour is observed for both inter-model and total uncertainty. These findings help to characterize the impact of elevation on the ensemble of CPM simulations, which is particularly required for the applications of these simulations for adaptation to future flood risk.

REFERENCES
Dallan, E., Marra, F., Fosser, G., Marani, M., Formetta, G., Schär, C., & Borga, M. (2023). ID56. How well does a convection-permitting regional climate model represent the reverse orographic effect of extreme hourly precipitation? Hydrology and Earth System Sciences, 27(5), 1133–1149. https://doi.org/10.5194/hess-27-1133-2023.

How to cite: Correa Sánchez, N., Dallan, E., Marra, F., Fosser, G., and Borga, M.: Evaluating sub-daily extreme precipitation from an ensemble of convection-permitting simulations: the role of topography., EGU General Assembly 2024, Vienna, Austria, 14–19 Apr 2024, EGU24-11157, https://doi.org/10.5194/egusphere-egu24-11157, 2024.

EGU24-11440 | ECS | Orals | CL3.1.1 | Highlight

High-resolution simulation of French Polynesia climate 

Amarys Casnin, Gilles Bellon, Marania Hopuare-Klouman, Cécile Caillaud, Victoire Laurent, and Sophie Martinoni-Lapierre

Islands of French Polynesia, located in the tropical Pacific Ocean, are small – Tahiti, the largest is about 50 km long – and can exhibit complex orography due to their volcanic origin. In order to simulate properly the atmospheric flow and convective motions over these islands, the non-hydrostatic model AROME is used at high-resolution (2.5 km) to produce a 20-year simulation of the climate over the Society Islands as well as part of the Tuamotu archipelago and Austral Islands. This simulation enables to evaluate AROME ability to simulate these island climates, particularly in terms of rainfall and wind.

AROME is significantly better than the quasi-hydrostatic regional climate model ALADIN with coarser resolution (20 km) at simulating the climate of French Polynesia, and provides a better description of this climate than the available gridded observation products.

By comparing model’s precipitation to observed precipitation at weather stations, results generally show a correct simulation of mean daily rainfall and diurnal cycles. There is however a dry bias for windward stations over Tahiti and a wet bias for leeward stations. These biases remain relatively weak and less pronounced than the biases of other gridded datasets such as IMERG and CMORPH satellite estimates.

The model also simulates winds that compare well to in situ observations and other gridded data. The typical island effect on low-level circulation is well simulated by AROME contrary to ERA5 and satellite data.

How to cite: Casnin, A., Bellon, G., Hopuare-Klouman, M., Caillaud, C., Laurent, V., and Martinoni-Lapierre, S.: High-resolution simulation of French Polynesia climate, EGU General Assembly 2024, Vienna, Austria, 14–19 Apr 2024, EGU24-11440, https://doi.org/10.5194/egusphere-egu24-11440, 2024.

Derechos are severe convective storms known for producing widespread damaging winds. While less frequent than in the United States of America (USA), derechos also occur in Europe. The notable European event on 18 August 2022 exhibited gusts exceeding 200 km h-1, spanning 1500 km in 12 hours. This study presents a first climatology of warm-season derechos in France, identifying thirty-eight (38) events between 2000 and 2022. Similar to Germany, derechos in France are associated with a southwesterly circulation and display comparable frequencies. While a suggestive trend of higher late-season frequency and a potential larger proportion of low-intensity events in France are observed, caution is warranted due to the lack of statistical significance arising from a relatively small sample size. The study also examines synoptic and environmental changes linked with analogues of the 500 hPa geopotential height patterns associated with past warm-season derechos, comparing analogues from a relatively distant past (1950–1980) with a recent period (1992–2022). For most events, a notable increase in convective available potential energy (CAPE) is observed, consistent with Mediterranean trends. However, there is no consistent change in 0–6 km vertical wind shear in the recent period. These environmental shifts align with higher near-surface temperatures, altered mid-level atmospheric flow patterns, and often, increased rainfall. The role of anthropogenic climate change in these changes remains uncertain, given potential influences of natural variability factors such as the El Niño Southern Oscillation (ENSO) or the Atlantic Multidecadal Oscillation (AMO).

How to cite: Fery, L. and Faranda, D.: Analyzing 23 years of warm-season derechos in France: a climatology and investigation of synoptic and environmental changes, EGU General Assembly 2024, Vienna, Austria, 14–19 Apr 2024, EGU24-11710, https://doi.org/10.5194/egusphere-egu24-11710, 2024.

EGU24-12016 | ECS | Orals | CL3.1.1 | Highlight

Determining the intensity of future heatwave episodes at urban scales: the case study of the Metropolitan Area of Barcelona 

Sergi Ventura, Josep Ramon Miró, Ricard Segura-Barrero, Fei Chen, Alberto Martilli, Changhai Liu, Kyoko Ikeda, and Gara Villalba

Given that cities concentrate more than half of the global population, it becomes crucial to assess the potential impacts of future climate change on cities. This study employs the Pseudo Global Warming (PGW) methodology to replicate recent heatwave (HW) episodes in the Metropolitan Area of Barcelona (AMB) under projected climate conditions until the year 2100. Initially, we identify all the HW events in the AMB over the past three decades (1991-2020) and simulate these HWs using the high-resolution Weather and Research Forecasting model (WRF) with the urban parameterizations BEP+BEM. 

Subsequently, the HWs observed in the last 30 years are replicated under mid-century (2041-2070) and end-century (2071-2100) climate conditions based on the SSP370 scenario. This scenario considers a future where greenhouse gas emissions and temperatures consistently rise, reflecting current climatic trends and geopolitical realities, including regional conflicts. Anticipated CO2 emissions are forecasted to nearly double from present levels by the year 2100.

The contrast between recent and future HWs is examined not only in terms of temperature and relative humidity but also concerning the synoptic patterns responsible for generating HW conditions. The findings reveal a potential increase in geopotential height by up to 100 geopotential meters (gpm) by the end of the century, reaching values of up to 6050 gpm. Average maximum 2-m air temperatures are projected to rise by 2.5°C during the mid-century and 4.2°C by the end of the century. The most significant temperature anomalies (deviations from the mean temperature) are associated with persistent and stable synoptic patterns, which are projected to increase the most in frequency and intensity. The findings on relative humidity reveal a general decrease over the AMB, with a peak value of -16.2% in the west of the domain during the PGW-END.

How to cite: Ventura, S., Miró, J. R., Segura-Barrero, R., Chen, F., Martilli, A., Liu, C., Ikeda, K., and Villalba, G.: Determining the intensity of future heatwave episodes at urban scales: the case study of the Metropolitan Area of Barcelona, EGU General Assembly 2024, Vienna, Austria, 14–19 Apr 2024, EGU24-12016, https://doi.org/10.5194/egusphere-egu24-12016, 2024.

EGU24-12321 | ECS | Posters on site | CL3.1.1 | Highlight

Changes in extreme precipitation in East Africa and Mount Kenya based on high-resolution regional climate model simulations for the end of the 21st century 

Martina Messmer, Santos J. González Rojí, Christoph C. Raible, and Thomas F. Stocker

The climate in Africa is very diverse ranging from tropical rainforest to deserts. Also, East Africa is covered by different climate zones and is very dry compared to other tropical regions. This is owed to various large-scale drivers, such as the complex topography, large water bodies such as Lake Victoria and vicinity to the Indian Ocean. The southern part of East Africa is characterized by two rainy seasons, which are separated by dry periods. The long rains from March to May feature more continuous precipitation, while the short rains from October to November show high interannual variability with days of high precipitation intensities and drier intervals.

The CMIP5 and CMIP6 models project a general wetting of East Africa in the future, with a high model agreement. To obtain a better understanding of what this means for extreme precipitation and changes in the hydrological cycle we performed three different regional downscaling simulations using WRF: one for the present period from 1981–2010, and two for the end of the century (2071–2100). The latter two simulations are driven by, the RCP2.6 and the RCP8.5 scenarios, and the respective global forcing fields are based on CESM model runs. The regional model covers four different domains, whereby the first extends from the Sahara down to Madagascar with 27 km horizontal resolution, the second domain focuses on East Africa with 9 km resolution, the third domain at 3 km resolution zooms into the western part of Kenya, covering land with complex topography, and the last domain centers on Mount Kenya and surroundings at 1 km resolution.

Preliminary results show that the rainy seasons are difficult to capture by WRF, when driven by a global climate model. This might be related to the fact that some of the atmospheric circulation is misrepresented in the global model and cannot be corrected by the regional model dynamics. While the long rains are underestimated in the present compared to a downscaling of ERA5, the short rains show an overestimation. A sensitivity study with adjusted SSTs to overcome some of the circulation issues in the global climate model only weakly improves the results. The projections for the future show an increase in extreme precipitation days, but also in the extreme daily precipitation amounts compared to present extreme (p99) precipitation. While the rainy seasons are projected to be more intense, the dry seasons tend to become drier, leaving some months without precipitation at all. The results further suggest that the extreme precipitation events do not differ for the RCP2.6 and RCP8.5. Thus, extreme precipitation events in Kenya might be limited by an upper bound, but this is subject of ongoing research.

How to cite: Messmer, M., González Rojí, S. J., Raible, C. C., and Stocker, T. F.: Changes in extreme precipitation in East Africa and Mount Kenya based on high-resolution regional climate model simulations for the end of the 21st century, EGU General Assembly 2024, Vienna, Austria, 14–19 Apr 2024, EGU24-12321, https://doi.org/10.5194/egusphere-egu24-12321, 2024.

EGU24-12413 | Posters on site | CL3.1.1

A very High-resolution Climate Dataset for a High-altitude Region in Southern Spain: Sierra Nevada (HighResClimNevada) 

Matilde García-Valdecasas Ojeda, David Donaire-Montaño, Feliciano Solano-Farias, Juan José Rosa-Cánovas, Emilio Romero-Jiménez, Nicolás Tacoronte, Yolanda Castro-Díez, María Jesús Esteban-Parra, and Sonia R. Gamiz-Fortis

High mountain regions are characterized by a high spatiotemporal variability in their climatic variables. Unfortunately, in these regions there is a lack of climatic information, mainly due to its difficult accessibility, and if any, it is usually short, sparse, or incomplete with numerous gaps and outliers. Sierra Nevada (SN), located in the southern Iberian Peninsula (IP), constitutes a double hot spot as it is a mountain region located in the Mediterranean, both of which are particularly vulnerable to climate change.

To investigate the impact of climate change on mountainous ecosystems in SN, a high-resolution dataset for this region, HighResClimNevada, was created for the period from 2001 to 2020. For this purpose, the Weather Research and Forecasting (WRF) model version 4.3.3 driven by ERA5 reanalysis was used as convection permitting model (CPM) with a two “one-way” configuration to achieve simulated climatic fields over SN with 1 km spatial resolution. Because SN is topographically complex, the parent domain (d01) was configured spanned the entire IP with 5 km spatial resolution, while the nested domain (d02) was centered in SN but covered the entire Andalusia region. Maximum and minimum temperatures, precipitation, wind speed, solar incoming radiation, relative humidity, and surface pressure available are available in HighResClimNevada.

HighResClimNevada has been evaluated in terms of precipitation and maximum and minimum temperatures using bioclimatic and extreme indices, which are of special interest for ecologists and botanists. For this evaluation, we compared climatic fields from HighResClimNevada to observational gridded products from different sources (i.e., station-based products, satellite, and reanalysis), but also with in-situ weather stations located in the study region. In general, results indicate that HighResClimNevada has a good ability to represent the general climate characteristics in SN, making it a very useful tool for studying climate, its impact, and trends in this complex region.

Data availability: HighResClimNevada is available on the World Data Center for Climate (WDCC) at DKRZ (https://doi.org/10.26050/WDCC/HighresolClimNevada_eval).

Acknowledgements: This research has been carried out in the framework of the projects PID2021-126401OB-I00, funded by MCIN/AEI/10.13039/501100011033/FEDER Una manera de hacer Europa, LifeWatch-2019-10-UGR-01 co-funded by the Ministry of Science and Innovation through the FEDER funds from the Spanish Pluriregional Operational Program 2014–2020 (POPE) LifeWatch-ERIC action line, and the project P20_00035 funded by FEDER/Junta de Andalucía-Consejería de Transformación Económica, Industria, Conocimiento y Universidades.

How to cite: García-Valdecasas Ojeda, M., Donaire-Montaño, D., Solano-Farias, F., Rosa-Cánovas, J. J., Romero-Jiménez, E., Tacoronte, N., Castro-Díez, Y., Esteban-Parra, M. J., and Gamiz-Fortis, S. R.: A very High-resolution Climate Dataset for a High-altitude Region in Southern Spain: Sierra Nevada (HighResClimNevada), EGU General Assembly 2024, Vienna, Austria, 14–19 Apr 2024, EGU24-12413, https://doi.org/10.5194/egusphere-egu24-12413, 2024.

EGU24-12651 | Orals | CL3.1.1 | Highlight

The influence of high Mediterranean Sea surface temperature on Storm Daniel intense rainfall 

Daniel Argüeso, Marta Marcos, and Ángel Amores

In September 2023, Storm Daniel hit the central Mediterranean and became the deadliest storm in the recorded history of the region. The storm originated from a low-pressure system around 4th September, which genesis can be attributed to an omega block centred in southern Europe. Then, it evolved into a Mediterranean tropical-like cyclone (medicane), impacting both the northern and the southern Mediterranean shores before dissipating around 12th September.

The storm particularly impacted Greece and Libya and, although the casualties and other major consequences are closely linked to significant infrastructure failures in Libya, both countries registered record-breaking rainfall amounts. For example, Zagora (Greece) experienced 754 mm in just 18 hours and Al-Bayda (Libya) saw a record highest daily rainfall of 414 mm. These events require an extraordinary supply of water vapor to maintain such rainfall rates. In the complex interplay of factors contributing to the development and intensity of weather systems like Storm Daniel, the Sea Surface Temperature (SST) stands as a likely primary driver. High SSTs provide not only the necessary energy, but also the moisture required to fuel the cyclone.

Over the months preceding Storm Daniel, the Mediterranean SST has consistently reached anomalously high levels, which was potentially a key ingredient in shaping the storm characteristics. To quantify the influence of local SST on the storm intensity, we used five ensembles of convection-permitting simulations (2 km) with an atmospheric model, which each of the ensemble members were initialized at different times. The five ensembles vary on the atmospheric and SST boundary and initial conditions, which were generated using different approaches to create counterfactual scenarios, from a simple removal of the mean climatological difference to an innovative data-driven method, which removes the long-term climate change signal correlated to global warming from SST. Combining these different estimates of atmosphere and SST counterfactual scenarios, we could quantify the relative contribution of global warming through local high SSTs and remote factors to rainfall amounts by Storm Daniel. In addition, we used a back-tracking algorithm to determine the source of water vapor that precipitated over Greece and Libya to understand the differences between the two phases of the event and the role of local SSTs. Our results show that local SST was crucial on the Libyan phase of the storm, while the rainfall amounts registered in Greece were mainly driven by remote factors. Also, the comparison of the different ensembles showed that the effects of long-term trends in SST are important in Libya, but the dominant contribution comes from the anomalous high SSTs that the region has recently experienced, which cannot be directly explained by mean climatological changes. In fact, these exception conditions are responsible for most of the record-breaking rainfall amounts observed during the second phase of the storm.

How to cite: Argüeso, D., Marcos, M., and Amores, Á.: The influence of high Mediterranean Sea surface temperature on Storm Daniel intense rainfall, EGU General Assembly 2024, Vienna, Austria, 14–19 Apr 2024, EGU24-12651, https://doi.org/10.5194/egusphere-egu24-12651, 2024.

EGU24-12958 | ECS | Posters on site | CL3.1.1

Regional Climate Projection for Atlantic Canada under SSP245 and SSP585 

Freddy Pinochet, Hugo Beltrami, Elena Garcia-Bustamante, Jorge Navarro, and Fidel Gonzalez-Rouco

We use the Weather Research and Forecasting (WRF4.4) model for a regional climate simulation in Atlantic Canada. We seek to establish a robust repository of future climate projections for the region, that include the influence of northern ice coverage from the Labrador Sea and Ungava Bay, and sea surface temperatures (SST). The simulation is bounded by a Bias-Corrected ensemble of 18 CMIP6 General Circulation Models (GCMs) that offer better quality boundary conditions than the individual CMIP6 models in terms of the climatological mean, interannual variance and extreme events.

The simulation extends within the historical period from 1980 to 2014 and two future scenarios (SSP245 and SSP585) from 2015 to 2100. The configuration includes three domains with progressively increasing resolution from 30km to 9km and 3km. The finest resolution of 3 km by 3 km covers an area of approximately 561 kilometers by 462 kilometers around the province of Nova Scotia, Canada. The temporal resolution in WRF is set at 180 seconds, with boundary conditions updated every 6 hours, yielding output at a 6-hour time step for all WRF variables.

To validate the historical simulation, we use the reanalysis from ECMWF (ERA5)  and Station-Level Inputs and Cross-Validation for North America from The Oak Ridge National Laboratory (DAYMET). Preliminary statistical metrics reveal that our historical simulation underestimates the daily maximum temperature by 13%, overestimates daily minimum temperature by 2.7%, and underestimates the daily total precipitation by 16%. These findings provide valuable insights into the model performance and variability, and highlight areas for potential refinement for our projection scenarios. Analyses of the future (2015-2100) simulations are focused on estimating future precipitation (convective permitting), and surface air temperature (T2) extreme events.

How to cite: Pinochet, F., Beltrami, H., Garcia-Bustamante, E., Navarro, J., and Gonzalez-Rouco, F.: Regional Climate Projection for Atlantic Canada under SSP245 and SSP585, EGU General Assembly 2024, Vienna, Austria, 14–19 Apr 2024, EGU24-12958, https://doi.org/10.5194/egusphere-egu24-12958, 2024.

EGU24-14514 | ECS | Posters on site | CL3.1.1

Numerical analysis of urban heat island in the coastal tropical desert city Doha, Qatar 

Rajeswari Jayarajan Roshini, Christos Fountoukis, Azhar Siddique, Shamjad Moosakutty, Mohammedrami Alfarra, and Mohammed Ali Ayoub

Qatar has witnessed substantial urbanization in recent years; the Doha metropolitan area grew by approximately a factor of 8 between 1984 and 2020, while bare land was reduced by more than 50%. Recent Climate projections mark the Middle East as a climate change hotspot, making it an ideal region for studying urbanization and its implications. The distribution of the Urban heat island effect and its modification with urbanization over the tropical desert city of Doha, Qatar is investigated using high-resolution Weather Research and Forecasting (WRF-ARW) model simulations. Two fair weather cases corresponding to the winter and summer seasons during 2022 are considered for analysis. Four sets of simulations are conducted by modifying the land use land cover (LULC) data and urban parameterization schemes keeping all other physics options and configuration constant. The study includes the recent 100m hybrid CGLC-MODIS-LCZ dataset (Hybrid-LCZ data), which includes the global map of Local Climate Zones (LCZ), for the first time in the region. The simulations are (1) Comparatively older LULC data corresponding to the year 2001 (hereafter MODIS), (2) the current extensive urban area corresponding to 2018 coupled with a single-layer urban canopy model (UCM) (hereafter LCZ-UCM), (3) hybrid LCZ data coupled with multilayer Building Environment Parametrization (BEP) (hereafter LCZ-BEP), and (4) hybrid LCZ coupled with Building energy model (BEM) (hereafter LCZ-BEM). To the best of our knowledge, this is the first numerical analysis of the UHI effect over this region that includes simulations with the local climate zones (LCZ). The results indicate the presence of strong UHI intensity with a maximum of 4.5˚C (6.5˚C) during the winter (Summer) period. During late night and early morning hours, the urban heat island (UHI) effect is strong and during daytime, a strong urban cool island (UCI) effect dominates the region. During the winter period, the intensity of UHI and UCI are controlled by the prevailing synoptic wind systems. The amplitude of the UHI and UCI trend is reduced by the prevailing North Westerly winds, while the moisture-rich South Westerly winds enhance it. However, during summer the surface representation along with local weather patterns modulates the intensity of the UCI and UHI. A consistent improvement in the simulated meteorological parameters is noted from the simulation with MODIS, UCM, BEP, and BEM during the summer season. The LCZ-BEM model accurately simulates the urban heat island intensity, temperature, and relative humidity with minimal deviation from observations. However, in winter as the synoptic features play a crucial role in the surface conditions all model experiments show similar performance in comparison to the observations.    


How to cite: Jayarajan Roshini, R., Fountoukis, C., Siddique, A., Moosakutty, S., Alfarra, M., and Ayoub, M. A.: Numerical analysis of urban heat island in the coastal tropical desert city Doha, Qatar, EGU General Assembly 2024, Vienna, Austria, 14–19 Apr 2024, EGU24-14514, https://doi.org/10.5194/egusphere-egu24-14514, 2024.

EGU24-15276 | ECS | Posters on site | CL3.1.1

Evaluation of Weather Research and Forecasting Model Sensitivity to Different Physics Schemes in Convection-Permitting Mode over Southern Iberian Peninsula 

David Donaire-Montaño, Feliciano Solano-Farías, Matilde García-Valdecasas Ojeda, Juan José Rosa-Cánovas, Emilio Romero-Jiménez, Yolanda Castro-Díez, María Jesús Esteban-Parra, and Sonia R Gámiz-Fortis

Convection-Permitting Models (CPMs) represent a crucial advancement in climate modeling, allowing for enhanced spatial resolution at convection scales (≤ 4 km). In convection-permitting simulations, various small-scale weather processes, notably microphysics and convection, play important roles. Evaluating the Weather Research and Forecasting (WRF) model's performance at convection scales becomes particularly pertinent in complex orography regions with substantial climate variability, such as Andalusia, in the southern part of the Iberian Peninsula (IP). To address this, convection-permitting simulations were conducted, focusing on the assessment of precipitation and 2-m temperature throughout the exceptionally wet year of 2018.

The simulations were based on two "one-way" nested domains: the parent domain (d01) covering the entire IP at 5 km spatial resolution and the nested domain (d02) covering the Andalusia region at 1 km spatial resolution. Implementing these simulations involved the exploration of 12 parameterization schemes, encompassing three microphysics (MP) schemes (THOMPSON, WRF single moment 6-class (WSM6), and WRF single moment 7-class (WSM7)) and four convection schemes for d01 (Grell 3D (G3), Grell-Freitas (GF), Kain-Fritsch (KF), along with the deactivated cumulus parameterization (OFF)). In the process of evaluating the model outputs, a comprehensive approach was adopted, using diverse observational datasets, including both gridded and station data. The comparisons were conducted on a point-to-point basis, considering various time aggregations (monthly, daily and hourly).

Main results show, on one hand, simulations employing the Grell-Freitas (GF) or deactivated cumulus parameterization (OFF) in d01 exhibited superior performance compared to reference datasets. On the other hand, while THOMPSON demonstrated a better fit in high mountain areas, it generally exhibited a poorer agreement with reference datasets than WSM6 and WSM7. In terms of temperature, the results displayed remarkable similarity, prompting the primary consideration of precipitation results. The WSM7-GF scheme emerged as the optimal configuration for the Andalusia region, underscoring its suitability in capturing the complex meteorological dynamics of this distinctive locale.

Keywords: sensitivity study, convection-permitting climate simulations, southern Iberian Peninsula, Andalusia, parameterization schemes, Weather Research and Forecasting model.


Acknowledgements:

This research has been carried out in the framework of the projects PID2021-126401OB-I00, funded by MCIN/AEI/10.13039/501100011033/FEDER Una manera de hacer Europa, P20_00035 funded by FEDER/Junta de Andalucía-Consejería de Transformación Económica, Industria, Conocimiento y Universidades, and LifeWatch-2019-10-UGR-01 co-funded by the Ministry of Science and Innovation through the FEDER funds from the Spanish Pluriregional Operational Program 2014–2020 (POPE) LifeWatch-ERIC action line.

How to cite: Donaire-Montaño, D., Solano-Farías, F., García-Valdecasas Ojeda, M., Rosa-Cánovas, J. J., Romero-Jiménez, E., Castro-Díez, Y., Esteban-Parra, M. J., and Gámiz-Fortis, S. R.: Evaluation of Weather Research and Forecasting Model Sensitivity to Different Physics Schemes in Convection-Permitting Mode over Southern Iberian Peninsula, EGU General Assembly 2024, Vienna, Austria, 14–19 Apr 2024, EGU24-15276, https://doi.org/10.5194/egusphere-egu24-15276, 2024.

EGU24-16029 | ECS | Orals | CL3.1.1 | Highlight

Convection-Permitting Climate Models: Present and Future Insights on daily and sub-daily Extreme Precipitation in Norway 

Kun Xie, Lu Li, Stefan Sobolowski, Hua Chen, and Chong-Yu Xu

Convection-permitting climate models (CPMs) have demonstrated enhanced capability in capturing extreme precipitation compared to convection-parameterization models. Despite this, a comprehensive understanding of their added values in daily or sub-daily extremes, especially at local scale, remains limited. In this study, we conduct a thorough comparison of daily and sub-daily extreme precipitation from HCLIM3 and HCLIM12 across Norway, divided into eight regions, using gridded and in-suit observations. Our main focus is to investigate the added values of HCLIM3 compared to HCLIM12 for precipitation extreme indices at daily and sub-daily time-steps on both local and regional scales. We find that the HCLIM3 better captures the maximum 1-day precipitation (Rx1d) at most of the regions except south-western region. Notably, the performance of HCLIM3 in capturing Rx1d shows a notable coastal-inland division, overestimating along the coastal areas and underestimating in the inland regions. In general, HCLIM3 better matches observations than HCLIM12 for daily and sub-daily precipitation extreme indices at regional scale in Norway. However, at the local scale, neither HCLIM3 nor HCLIM12 can capture the temporal evolution of Rx1h during 10 years, except one station near Oslo (eastern region), where only HCLIM3 fits the observations. In general, HCLIM3 performs better than HCLIM12 on Rx1d and Rx1h in Norway with the mean of bias distribution closer to zero, although it varies a bit among regions (for example, HCLIM3 performs worse in the south-western region). In addition, the seasonality of Rx1h can be also better captured by HCLIM3 at both regional and local scales, while HCLIM12 tends to underestimate hourly extremes. In a future warming climate, HCLIM3 with higher Clausius-Clapeyron (CC) scaling, exhibits a higher increase than HCLIM12 in the Rx1h and Rx1d over most regions of Norway except southern and south-west regions. Under global warming, short-duration extreme events with greater CC scaling have a higher increase rate than long-lasting events. This study highlights the importance of more realistic convection-permitting regional climate predictions and projections in providing reliable insights into the characteristics of precipitation extremes and their future changes across Norway's eight regions. Such information is crucial for effective adaptation management to mitigate severe hydro-meteorological hazards, especially for the local extremes.

How to cite: Xie, K., Li, L., Sobolowski, S., Chen, H., and Xu, C.-Y.: Convection-Permitting Climate Models: Present and Future Insights on daily and sub-daily Extreme Precipitation in Norway, EGU General Assembly 2024, Vienna, Austria, 14–19 Apr 2024, EGU24-16029, https://doi.org/10.5194/egusphere-egu24-16029, 2024.

The Sichuan Basin (SB), a lowland region in southwest China located at the eastern slope of the Tibetan Plateau (TP), regularly experiences heavy and extreme precipitation events. These extreme events often lead to flooding that can pose a threat to life and livelihoods of people in this densely populated area. A notable example is the summer of 2020, during which large parts of East Asia were affected by anomalously high precipitation. In the SB, these events broke the previous record of daily accumulated rainfall at multiple stations.  

Since such events are expected to increase in both frequency and intensity in a warmer climate, understanding their causes and the physical processes involved is of high relevance in the SB region. Modelling the climate in mountainous regions with complex topography is challenging but recent developments in convection-permitting modelling make it possible to perform process-based studies.

The CORDEX Flagship Pilot Study Convection-Permitting Third Pole (CPTP) aims to improve our understanding of the water cycle over the TP and its surrounding regions using a multi-model ensemble of kilometre-scale simulations. Recent results using a set of CPTP simulations for one extreme precipitation event suggest that an accurate representation of the large-scale forcing is crucial to correctly simulate the event. In this study, we assess how well different kilometre-scale CPTP simulations capture multiple observed heavy and extreme precipitation events that occurred in the SB during the summer of 2020 by validating them against observations and reanalysis data. In addition, we analyse how the simulations differ among each other in representing the observed events and related important physical factors, e.g. large- and mesoscale circulation and moisture transport. A realistic representation of extreme events in climate models can provide a basis for more reliable future projections and uncertainty estimates.

How to cite: Detjen, L., Curio, J., and Ou, T.: Heavy and extreme precipitation events in the Sichuan Basin during the 2020 summer season in a set of kilometre-scale simulations, EGU General Assembly 2024, Vienna, Austria, 14–19 Apr 2024, EGU24-17506, https://doi.org/10.5194/egusphere-egu24-17506, 2024.

EGU24-18143 | ECS | Posters on site | CL3.1.1

Advancing regional to local climate knowledge: Insights from German NUKLEUS and UDAG Consortium Projects 

Eleonora Cusinato, Christoph Braun, Hendrik Feldmann, Beate Geyer, Klaus Keuler, Patrick Ludwig, Julia Moemken, Kevin Sieck, Katjia Trachte, Barbara Frühe, Christian Steger, and Joaquim G. Pinto

According to the latest assessment of the IPCC report, regional climate changes in mean climate and extremes are expected to become more widespread and pronounced. As a consequence, climate hazards are projected to increase in every region of the world leading to the necessity of developing climate adaptation and mitigation plans.  In this context, the German Federal Ministry of Education and Research (BMBF) funded several projects whose primary goal is to provide up-to-date regional and local climate projections that will subsequently form the bases for climate German adaptation strategies.

This contribution aims at illustrating ongoing research within the framework of two of these consortium projects, namely NUKLEUS (Usable Locale Climate Information for Germany) and UDAG (Updating the data basis for adaptation to climate change in Germany) to the EURO-CORDEX community. The innovative aspect of both projects lies in the creation of an unprecedented ensemble of convection permitting climate projections for “hydrological Germany" at high temporal and spatial resolution, which allows to provide information on climate change at regional and local scales.

For this purpose, NUKLEUS downscaled three global coupled models (GCMs) within the CMIP6 framework using three regional climate models (namely REMO, COSMO-CLM6 and ICON-CLM) first to the EURO-CORDEX Eur-11 domain (12 km) and subsequently to the km-scale at approximately 3 km resolution over Germany for the scenario SSP3-7.0. However, the resulting ensemble is not sufficient to provide actionable climate change information.
UDAG project aims at overcoming this limitation by downscaling a wide range of CMIP6-GCMs (6-8) using ICON-CLM first to 12 km resolution providing regional climate simulations for Europe for the scenarios SSP3-7.0 and SSP1-2.6 and then to approximately 3 km to generate climate projections specifically targeted for "hydrological Germany."

Given the shared use of common CMIP6-GCMs in the downscaling process for both projects, and considering the early stage of the UDAG project, this contribution presents initial insights from the NUKLEUS project. Biases evaluation analysis is conducted, revealing noteworthy distinctions in the RCMs at 12 km and 3 km compared to the CMIP6-GCMs. Subsequently, key metrics for extreme values statistics related to temperature and precipitation are discussed. In summary, these methods and findings serve as a preliminary groundwork for the forthcoming UDAG analysis.


How to cite: Cusinato, E., Braun, C., Feldmann, H., Geyer, B., Keuler, K., Ludwig, P., Moemken, J., Sieck, K., Trachte, K., Frühe, B., Steger, C., and Pinto, J. G.: Advancing regional to local climate knowledge: Insights from German NUKLEUS and UDAG Consortium Projects, EGU General Assembly 2024, Vienna, Austria, 14–19 Apr 2024, EGU24-18143, https://doi.org/10.5194/egusphere-egu24-18143, 2024.

The detection of local climate change signals, in particular those related to extreme events, is challenging due to the large internal variability of the climate system. The BMBF-funded project ClimXtreme Module B-CoDEx focuses on improving the signal-to-noise ratio of climate change signals in extreme weather events using innovative data compression methods.

This study uses principal component analysis (PCA) for spatial extremes (Cooley and Thibaud, 2019) to analyse heatwaves and droughts over the northern hemisphere. An extremal pattern index (EPI) is introduced as an integrative measure of the intensity and spatial extent of an extreme heat anomaly. Its bivariate extension is used to account for simultaneous spatial extremes in two variables. EPI provides us with a compact description of heatwaves. We see, for example, that preceding precipitation deficits significantly influence the development of heatwaves, and that heat waves often coincide with instantaneous short-term droughts. 

To investigate extreme hourly precipitation, a scale-dependent decomposition using the dual-tree wavelet transform is proposed, as described e.g. in Buschow and Friederichs (2021). For this study, we rely on reanalysis data (COSMO-REA6, CERRA) over Germany. A comparison of the two datasets regarding their representation of large- and small-scale events shows significant differences, especially for the small-scale events. Furthermore, we apply established methods to perform a scale-dependent detection of extreme precipitation and to reveal trends that are hidden by variability on other scales. 

How to cite: Szemkus, S. and Friederichs, P.: Investigating heatwaves/droughts and convective precipitation extremes using compact descriptions of spatio-temporal fields, EGU General Assembly 2024, Vienna, Austria, 14–19 Apr 2024, EGU24-18175, https://doi.org/10.5194/egusphere-egu24-18175, 2024.

EGU24-18290 | ECS | Orals | CL3.1.1

Assessing Future Climate Extremes in Türkiye: A High Resolution CMIP6-based Analysis 

Berkin Gümüş, Sertaç Oruç, İsmail Yücel, and Mustafa Tuğrul Yılmaz

This study employs the latest versions of global climate models (GCMs) from the Coupled Model Intercomparison Project Phase 6 (CMIP6) to evaluate climate extremes in Türkiye from 2015 to 2100 under two future scenarios, SSP2-4.5 and SSP5-8.5. Utilizing a number of high resolution CMIP6 models and different scenarios over the full projection period make this study unique over the region. To downscale coarse-resolution climate models to approximately 9 km (0.1° × 0.1°) spatial resolution, Quantile Delta Mapping (QDM) is employed. The downscaling process utilizes the European Centre for Medium-Range Weather Forecasts Reanalysis 5-Land (ERA5-Land) dataset as the reference data. Analysis of 12 extreme precipitation indices (EPIs) and 12 extreme temperature indices (ETIs) between 2015 and 2100 consistently indicates an increased frequency and intensity of extreme weather events in Türkiye under both future scenarios. The SSP5-8.5 scenario predicts a higher degree of water stress compared to SSP2-4.5, with a 20% reduction in total precipitation in the Aegean and Mediterranean regions of Türkiye. Despite an overall decrease in precipitation, the findings suggest an increase in the severity and frequency of extreme precipitation events. This implies that a greater proportion of total precipitation will be contributed by these extreme events. Anticipated trends include an increase in temperature extremes, encompassing both the lowest and highest daily maximum temperatures across all regions of Türkiye. This signifies a warming signal of up to 7.5 °C by the end of the current century. Cold extremes also exhibit a tendency towards warming, as evidenced by a significant decrease in the number of ice days across all areas. This trend may potentially result in less snow accumulation, which negatively affects various sectors.

How to cite: Gümüş, B., Oruç, S., Yücel, İ., and Yılmaz, M. T.: Assessing Future Climate Extremes in Türkiye: A High Resolution CMIP6-based Analysis, EGU General Assembly 2024, Vienna, Austria, 14–19 Apr 2024, EGU24-18290, https://doi.org/10.5194/egusphere-egu24-18290, 2024.

EGU24-19237 | ECS | Posters on site | CL3.1.1

Climate Initiative for Iberian Mountain Areas (CIMAs): improving our understanding of climate variability over mountain areas using high resolution modelling. 

Emilio Greciano-Zamorano, Jesús Fidel González-Rouco, Cristina Vegas-Cañas, Félix García-Pereira, Jorge Navarro-Montesinos, Elena García-Bustamante, Esteban Rodríguez-Guisado, and Ernesto Rodríguez-Camino

Mountain areas are particularly sensitive to global warming as they usually present a complex distribution of climates and ecosystems and feedbacks tend to amplify the effects of climate change. Additionally, the large spatial variability of temperature gradients and heterogeneity in the occurrence, amount and distribution of precipitation and snow cover in mountainous areas are especially relevant for water resources and stresses the need for high altitude observations and high-resolution modelling over complex terrain. However, harsh meteorological conditions and the complex orography associated with this environment that, as part of the Mediterranean domain, has been underscored as a climate change hot-spot, hinder the obtention of a good coverage of high-altitude observations and pose challenges for regional climate models.

CIMAs is a joint effort aiming at improving our understanding of climate variability over mountain regions in Iberia. A pilot area has been selected over the Sierra de Guadarrama (Spanish Central range, about 50 km from Madrid) aiming at studying climate variability through very high (1 km) resolution simulations, exploring models’ ability to capture relevant processes at that scale. A set of observational sites ranging from high altitudes to low levels at both sides of the mountain range has been used.

ERA Interim, ERA5 and different WRF nested simulations, spanning the last three decades and reaching 1 km resolution, have been compared to a dense network of in situ observations. Results show a clear improvement with increasing resolution for temperature, but some altitude-related biases for precipitation. In this sense, some sensitivity tests to changing convection parameterizations and to convection permitting configurations have been assessed.

How to cite: Greciano-Zamorano, E., González-Rouco, J. F., Vegas-Cañas, C., García-Pereira, F., Navarro-Montesinos, J., García-Bustamante, E., Rodríguez-Guisado, E., and Rodríguez-Camino, E.: Climate Initiative for Iberian Mountain Areas (CIMAs): improving our understanding of climate variability over mountain areas using high resolution modelling., EGU General Assembly 2024, Vienna, Austria, 14–19 Apr 2024, EGU24-19237, https://doi.org/10.5194/egusphere-egu24-19237, 2024.

EGU24-19523 | ECS | Posters on site | CL3.1.1 | Highlight

Scaling of Precipitation in the Alps: Insights from a Convection Permitting Regional Climate Model Ensemble 

Luna Santina Lehmann, Patricio Velasquez, Albert Ossó, and Christoph Schär

Previous studies predict an intensification of heavy precipitation events with climate change. These events are widely known to cause natural disasters with great property damage and loss of life, like flash floods or landslides. Knowledge about the scaling of precipitation, referring to the changes of precipitation intensity to warmer temperatures, is important for effective mitigation measures. Previous studies have investigated this scaling with regards to the Clausius Clapeyron relation, over various regions worldwide, using observational as well as model data. In this study we analyze the precipitation scaling over an orographically complex region as the Alps, as well as compare different methods to obtain the scaling rate.

To this end, we employ a 10-year multi-model ensemble of kilometer-scale convection-permitting climate model (CPM) simulations over the Greater Alpine Region from the CORDEX-FPS, with a spatial resolution ranging from 2.2 to 4 km. These simulations were obtained by downscaling global climate model (GCM) projections to intermediate regional climate models (RCMs), which were in turn further downscaled to kilometer scale by convection permitting climate models (CPMs). Previous work has shown the added value of these CPMs compared to lower resolution RCMs especially for extreme precipitation. We analyze these simulations over four alpine subdomains, which are characterized by different climatological characteristics.

In the calculation of precipitation scaling rates, we use two different precipitation indices, wet-hour percentiles and all-hour percentiles. These indices differ in that the latter encompasses all events, wet and dry, whereas the wet-hour percentile only includes events that go over a certain threshold. We compare the scaling calculated using these precipitation indices on an annual and seasonal basis, to show insights into the mechanisms that may cause scaling rates to exceed expectations given from the Clausius Clapeyron relation. Our results show that future precipitation intensity may be inferred from present-day scaling. The seasonal analysis shows scaling exceeding the Clausius Clapeyron scaling in the summer and autumn seasons for the wet-hour analysis, but not for the all-hour analysis.

How to cite: Lehmann, L. S., Velasquez, P., Ossó, A., and Schär, C.: Scaling of Precipitation in the Alps: Insights from a Convection Permitting Regional Climate Model Ensemble, EGU General Assembly 2024, Vienna, Austria, 14–19 Apr 2024, EGU24-19523, https://doi.org/10.5194/egusphere-egu24-19523, 2024.

EGU24-20433 | Orals | CL3.1.1

High resolution regional re-analysis ensemble for Austria 

Nauman K. Awan, Christoph Wittmann, Clemens Wastl, and Florian Meier

In recent decades reanalysis products have emerged as a pivotal resource for numerical model evaluations, significantly enhancing our understanding of Earth’s system. They have also been employed in various projects aimed at climate monitoring and assessment of climate change impacts. In this study, we present first results from ongoing work aimed at creating a first of its kind high resolution reanalysis ensemble for Austria. ECMWF's ERA5 ensemble is downscale to a 2.5 km resolution by employing three-dimensional variational assimilation (3DVAR) system available in AROME. Upon completion, this dataset will provide spatially, temporally, and physically consistent 3D and 2D atmospheric fields spanning from 2012 to 2022. The presented analysis focused on representation of three distinct extreme precipitation events simulated in a one and a half year long simulation (01-01-2021 to 30-06-2022). The reanalysis ensemble is compared with operational weather models and a high resolution (1 km x 1 km) gridded observational reanalysis. Based on statistical scores, all variations are ranked. In general, the results are on par with our operational models, however, some ensemble members exhibit slightly better performance compared to our operational models, which highlights the advantages of employing an ensemble system.

How to cite: Awan, N. K., Wittmann, C., Wastl, C., and Meier, F.: High resolution regional re-analysis ensemble for Austria, EGU General Assembly 2024, Vienna, Austria, 14–19 Apr 2024, EGU24-20433, https://doi.org/10.5194/egusphere-egu24-20433, 2024.

AS2 – Boundary Layer Processes

EGU24-834 | ECS | Posters on site | AS2.1

Climatology of Lower Tropospheric Turbulence at Kochi using S-T radar. 

Ahana K k, Satheesan Karathazhiyath, and Ajil Kottayil

This study investigates the climatology of atmospheric turbulence, focusing on the dissipation rate of turbulent kinetic energy (ε) in the lower troposphere. Utilizing data from the 205 MHz S-T radar located in Kochi, Kerala, India, our examination extends to the lower troposphere, particularly the boundary layer characterized by meteorological factors such as temperature gradients, wind shear, and convective processes that contribute to turbulent air motion. Turbulence in the atmosphere can arise either thermally through convection-related instability or mechanically through phenomena like Kelvin–Helmholtz billows, the reversal or disruption of gravity waves, and inertial gravity waves. A thorough understanding and prediction of turbulence in this atmospheric layer are critical for ensuring the safety and efficiency of air travel and advancing our understanding of the intricate interplay of atmospheric dynamics. The study employs the spectral width method for estimating turbulence dissipation rate, accounting for broadening effects due to shear and beam. After filtering out convective data, turbulence dissipation rates are estimated over 6 years from March 2017 to December 2022 from a height of 0.4 to 5 km. Monthly median analysis reveals a subtle increasing trend in the lower troposphere, with a slope of 1.6 x 10⁻³. The vertical distribution indicates maximum data in the range of -4.5 to 1.75 m2 s-3, exhibiting a decrease in ε with height. ε displays definite seasonal variations, with maximum values and the least variation occurring within a specific range in the monsoon season. Winter season marks the least turbulent season. The study also explores the periodicity of the turbulence dissipation rate in the study region.

How to cite: K k, A., Karathazhiyath, S., and Kottayil, A.: Climatology of Lower Tropospheric Turbulence at Kochi using S-T radar., EGU General Assembly 2024, Vienna, Austria, 14–19 Apr 2024, EGU24-834, https://doi.org/10.5194/egusphere-egu24-834, 2024.

Similar ramp-like structures exist in the time variations of surface PM2.5 accumulation
during the four different heavy haze pollution processes in Beijing, from 3 November 2017 to 15 January
2018. Based on the ultrasonic anemometer observations at seven different altitudes on a 325 m tower, it is
shown that turbulence momentum flux exchanges between different altitudes were very weak during
the ramp period of PM2.5 concentration. Turbulence at the higher altitude associated with strong wind
shear, occasionally mixed downward toward the surface, showing upside-down transportation of turbulent
kinetic energy (TKE), especially during the rapid removal stage of the pollution. This was different from
the traditional upward TKE transportation above the surface. Vertical distribution of nondimensionalized
standard deviation of the horizontal velocity, vertical velocity, and potential temperature in the stable
boundary layer within the ramp-like structure show obvious “z-less” similarity, independent of z, and
almost equal to constants (𝜎u/u∗l ∼ 3.9, 𝜎w/u∗l ∼ 1.52, and 𝜎𝜃/T∗ ∼ 3.96).

How to cite: Shi, Y. and Hu, F.: Ramp-Like PM2.5 Accumulation Process and Z-Less Similarity in the Stable Boundary Layer, EGU General Assembly 2024, Vienna, Austria, 14–19 Apr 2024, EGU24-1419, https://doi.org/10.5194/egusphere-egu24-1419, 2024.

EGU24-1783 | Orals | AS2.1

Elucidating the boundary-layer turbulence profiles observed by a radar wind profiler network in the Tibetan Plateau  

Jianping Guo, Deli Meng, Xiaoran Guo, Yuping Sun, Tianmeng Chen, and Hui Xu

The planetary boundary layer (PBL) over the Tibetan Plateau (TP) imposes significant impact on regional and global climate, while its vertical structures and evolution features remain poorly understood. This study examines the evolution and possible mechanisms of daytime PBL turbulence profiles for cloud- and clear-sky conditions by using one-year observations from the radar wind profiler (RWP) network deployed over the TP, in combination with the measurements from the automatic weather station (AWS), millimeter-wave cloud radar (MMCR). The results show that the turbulence dissipation rate (e) are stronger and PBL height is higher in the norther part of TP (NTP), compared with those in the southern part of TP (STP). The presence of clouds inhibits turbulence transport within the PBL over the NTP, while the opposite effect was found over STP. Analysis of surface-air temperature difference  and wind shear data shows that both the thermal and dynamical effects strengthen the turbulence within PBL, and the thermodynamic effect is more important over STP than the NTP. The probability of PBL-cloud coupling is higher over the STP, and the cloud is found to enhance the PBL turbulence due to the strong wind shear, even although clouds can reduce the PBL height through radiative cooling effect. The findings help fill our knowledge gap in the PBL turbulence profiles throughout the whole TP, and highlight the significant role of the interaction between PBL turbulence and cloud in affecting the development of PBL turbulence over the whole TP.

How to cite: Guo, J., Meng, D., Guo, X., Sun, Y., Chen, T., and Xu, H.: Elucidating the boundary-layer turbulence profiles observed by a radar wind profiler network in the Tibetan Plateau , EGU General Assembly 2024, Vienna, Austria, 14–19 Apr 2024, EGU24-1783, https://doi.org/10.5194/egusphere-egu24-1783, 2024.

EGU24-1856 | Orals | AS2.1

Connection among meteorological observations,columnar aerosol properties and urban heat island during nighttime extreme heat events in the uRban hEat and pollution iSlands inTerAction in Rome and possible miTigation strategies(RESTART)project 

Monica Campanelli, Annalisa Di Bernardino, Erika Brattich, Stefania Argentini, Francesco Barbano, Giampietro Casasanta, Andrea Cecilia, Silvana Di Sabatino, Margherita Erriu, Serena Falasca, Tiziano Maestri, and Anna Maria Siani

The “uRban hEat and pollution iSlands inTerAction in Rome and possible miTigation strategies” (RESTART) is a 2-years project, funded by the Italian Ministry for University and Research as a Project of National Interest (PRIN2022).RESTART aims to explore the interaction between the Urban Heat Island (UHI) and the Urban Pollution Island (UPI) in Rome (Italy),providing a series of mitigation strategies, including tailored Nature-Based Solutions, and ready-to-use guidelines for the improvement of well-being and liveability in urban environments. The connection between UHI and UPI is investigated by inspecting quality-checked datasets of meteorological trace gases and aerosol observations, provided by local and international observatories and dense networks of instruments in Rome.Specifically,the UHI is studied by examining the time series of atmospheric near-surface temperature (average, minimum, maximum daily), relative humidity, pressure, and wind speed, while the UPI is characterised by the observations of trace gases (e.g., NO, NO2, O3, CO), particulate matter (PM10, PM2.5),aerosols optical properties (e.g., aerosol optical depth, AOD, Ångström exponent, single scattering albedo, SSA, particle volume size distribution) in terms of surface and columnar contents and vertical profiles, based on the availability of measurements.The city of Rome (Lat. 41.90 °N, Lon. 12.54 °E) is the most populous and extended Italian city and the third most densely populated metropolis in Europe. Rome is located in the central region of the Italian Peninsula, about 27 km inland from the Tyrrhenian coast. Due to its position in the middle of the Mediterranean Basin and the complex orography of its surroundings, the city is frequently subjected to the advection of Saharan dust in the case of persistent southerly winds, and to the sea breeze regime from the southwest, the latter particularly evident during summertime under anticyclonic conditions. In recent years, the city has experienced significant atmospheric warming and a substantial intensification of extreme weather events, such as heat waves, tropical nights, and droughts.This work explores the connection among some meteorological observations (near-surface temperature and relative humidity) from weather stations, columnar aerosol properties (AOD and SSA) from Skynet and AERONET international networks, and UHI intensities during heat waves, paying particular attention to nighttime. During the selected events, the synoptic weather conditions affecting the interaction between the UHI and the aerosol properties, are discussed.

How to cite: Campanelli, M., Di Bernardino, A., Brattich, E., Argentini, S., Barbano, F., Casasanta, G., Cecilia, A., Di Sabatino, S., Erriu, M., Falasca, S., Maestri, T., and Siani, A. M.: Connection among meteorological observations,columnar aerosol properties and urban heat island during nighttime extreme heat events in the uRban hEat and pollution iSlands inTerAction in Rome and possible miTigation strategies(RESTART)project, EGU General Assembly 2024, Vienna, Austria, 14–19 Apr 2024, EGU24-1856, https://doi.org/10.5194/egusphere-egu24-1856, 2024.

EGU24-2065 | Posters on site | AS2.1

Characteristics of fine particle matters at the top of Shanghai Tower 

Yin Changqin, Xu Jianming, Gao Wei, Pan Liang, Gu Yixuan, Fu Qingyan, and Yang Fan

To investigate the physical and chemical processes of fine particle matters at mid-upper planetary boundary layer (PBL), we conducted one-year continuous measurements of fine particle matters (PM), chemical composition of non-refractory submicron aerosol (NR-PM1) and some gas species (including sulfur dioxide, nitrogen oxides and ozone) at an opening observatory (~600 m) at the top of Shanghai Tower (SHT), which is the Chinese 1st and World’s 2nd highest building located in the typical financial central business district of Shanghai, China. This is the first report for the characteristics of fine particles based on continuous and sophisticated online measurements at the mid-upper level of urban PBL. The observed PM2.5 and PM1 mass concentrations at SHT were 25.5±17.7 and 17.3±11.7 μg m-3 respectively. Organics, nitrate (NO3) and sulfate (SO4) occupied the first three leading contributions to NR-PM1 at SHT, accounting for 35.8 %, 28.6 % and 20.8 % respectively. The lower PM2.5 concentration was observed at SHT by 16.4 % compared with that near surface during the observation period. It was attributed to the decreased nighttime PM2.5 concentrations (29.4 % lower than surface) at SHT in all seasons due to the complete isolations from both emissions and gas precursors near surface. However, daytime PM2.5 concentrations at SHT were 12.4-35.1 % higher than those near surface from June to October, resulted from unexpected larger PM2.5 levels during early to middle afternoon at SHT than surface. We suppose the significant chemical production of secondary aerosols existed in mid-upper PBL because strong solar irradiance, adequate gas precursors (e.g., NOx) and lower temperature were observed at SHT favorable for both photochemical production and gas-to-particle partitioning. This was further demonstrated by the significant increasing rate of oxygenated organic aerosols and NO3 observed at SHT during 8:00-12:00 in spring (7.4 % h-1 and 12.9 % h-1), autumn (9.3 % h-1 and 9.1 % h-1) and summer (13.0 % h-1 and 11.4 % h-1), which cannot be fully explained by vertical mixing. It was noting that extremely high NO3 was observed at SHT both in daytime and nighttime in winter, accounting for 37.2 % in NR-PM1, suggesting the efficient pathway from heterogeneous and gas oxidated formation. Therefore, we highlight the priority of NOx reduction in Shanghai for the further improvement of air quality. This study reported greater daytime PM2.5 concentrations at the height of 600 m in urban PBL compared with surface measurement, providing insight into their potential effects on local air quality, radiation forcing, and cloud/fog formations. We propose that the efficient production of secondary aerosol in mid-upper PBL should be cognized and explored more comprehensively by synergetic observations in future.

How to cite: Changqin, Y., Jianming, X., Wei, G., Liang, P., Yixuan, G., Qingyan, F., and Fan, Y.: Characteristics of fine particle matters at the top of Shanghai Tower, EGU General Assembly 2024, Vienna, Austria, 14–19 Apr 2024, EGU24-2065, https://doi.org/10.5194/egusphere-egu24-2065, 2024.

EGU24-2074 | ECS | Orals | AS2.1

Atmospheric boundary layer sensing using ultra-wideband photonic microwave spectrometer 

Mehmet Ogut, Shannon Brown, Sidharth Misra, Eric Kittlaus, Pekka Kangaslahti, Janusz Murakowski, and Michael Gehl

The Atmospheric Boundary Layer (ABL) is the portion of the troposphere that is directly influenced by the Earth’s surface and responds to combined action of mechanical and thermal forcing. Most of the energy exchange with respect to solar heating and evaporation that drive the atmosphere and the ocean occur within the ABL, yet it is one of the most poorly observed and modeled regions of the atmosphere. Conventional passive microwave systems fall well short of being optimized for near surface sensing due to limited number of spectral channels and coarse spectral resolution covering only a small portion of the spectrum of interest for ABL sensing.


The so called “window regions” of the microwave spectrum between and on the shoulders of the strong oxygen and water vapor absorption lines carry the information on the near surface thermodynamic structure in the boundary layer. Sampling these regions requires new spectrometers capable of resolving >50 GHz spectral regions at modest spectral resolution (~1GHz). The ultra-wideband photonic spectro-radiometer instrument is funded by NASA ESTO under ACT-20 program to combine low-noise wideband RF technology with a novel photonic integrated circuit (PIC) design for obtaining large bandwidth (>50 GHz) with enhanced channel resolution (<1 GHz). A high-speed, low-loss electro-optic modulator is used to convert radio frequency energy into sidebands on an optical carrier, preserving both amplitude and phase of the radiometric signal. The designed PIC includes an input star-coupler that divides the optical power transmitted from the optical modulator among N waveguides monotonically increasing in length within an arrayed waveguide grating (AWG) that provides chromatic dispersion, an output star-coupler that forms an image of the optical spectrum, and an array of photodiodes that convert the optical power to electrical signals. The ultra-wideband 50 GHz direct acquisition spectrometer capability has been successfully tested and validated on the fabricated PIC. The combination of a low-noise wide-band RF radiometer with an RF Photonics backend system is a key technology development allowing unprecedented ability to spectrally resolve the complete microwave spectrum which is critically needed for the planetary boundary layer sensing. In this paper, we will describe the capabilities of this system for measuring the thermodynamic structure in the lower ~2km of the atmosphere.


How to cite: Ogut, M., Brown, S., Misra, S., Kittlaus, E., Kangaslahti, P., Murakowski, J., and Gehl, M.: Atmospheric boundary layer sensing using ultra-wideband photonic microwave spectrometer, EGU General Assembly 2024, Vienna, Austria, 14–19 Apr 2024, EGU24-2074, https://doi.org/10.5194/egusphere-egu24-2074, 2024.

EGU24-2197 | Posters on site | AS2.1

Investigation of Physical Processes in Development of Hydrostatic Imbalance 

Jielun Sun, Volker Wulfmeyer, Florian Spaeth, Holger Voemel, William Brown, and Steven Oncley

The hydrostatic equilibrium addresses the approximate balance between the positive force of the vertical pressure gradient and the negative gravity force and has been widely assumed for atmospheric applications. The hydrostatic imbalance of the mean atmospheric state for the acceleration of vertical motions  in the vertical momentum balance is investigated using tower, the Global Positioning System radiosonde, and Doppler Lidar and Radar observations throughout the diurnally varying atmospheric boundary layer (ABL) under clear sky conditions. The imbalance is found to be mainly due to the vertical turbulent transport of changing air density as a result of thermal expansion/contraction in response to air temperature changes following surface temperature changes. In contrast, any pressure change associated with air temperature changes is small, and the positive vertical-pressure-gradient force is strongly influenced by its background value. The imbalance is found to be mainly responsible for the vertical advection of vertical turbulent motions, which is the vertical variation of the turbulent velocity variance. The vertical variation of the turbulent velocity variance from its vertical increase in the lower convective boundary layer (CBL) to its vertical decrease in the upper CBL is observed to be associated with the sign change of the imbalance from positive to negative due to the vertical decrease of the positive vertical-pressure-gradient force and the relative increase of the negative gravity force as a result of the decreasing upward transport of the low-density air. The imbalance is reduced significantly at night but does not steadily approaches to zero. Understanding the development of hydrostatic imbalance has important implications for understanding large-scale atmosphere especially for cloud development. 

How to cite: Sun, J., Wulfmeyer, V., Spaeth, F., Voemel, H., Brown, W., and Oncley, S.: Investigation of Physical Processes in Development of Hydrostatic Imbalance, EGU General Assembly 2024, Vienna, Austria, 14–19 Apr 2024, EGU24-2197, https://doi.org/10.5194/egusphere-egu24-2197, 2024.

Ultrafine particles (UFPs) are ubiquitously distributed throughout the global atmosphere. Their dimensions, often less than 100 nm, vary significantly from the surface. New particle formation (NPF) is a key process occurring in the planetary boundary layer (PBL). Newly formed particles are an important source of aerosols and cloud condensation nuclei (CCN) that influence clouds and climate, while the distribution of these new particles at different altitudes has rarely been studied. In-situ measurements of ultrafine particles (UFP) and New particle formation (NPF) observed at the ground and at the top of the Canton Tower (454 m) and Shenzhen tower located in southern China,both were analyzed using the measurements of multiple meteorological and physicochemical quantities, as both observed during a field campaign and simulated with the WRF-chem model. We found that turbulence and NPF characters vary considerably with heights, with UFP concentration diminishing by half from the surface to the tower top. This indicates the UFP transports upward from the ground in the lower boundary layer. A consistent relationship is established between the occurrences of NPF and the evolution of turbulence. The correlation between the exchange ratio at the tower top has correlated well with nucleation growth, suggesting that turbulence can play an important role in the episodes of NPF growth, whose growth rate is closely related to the turbulence exchange ratio, effectively dictating the ultrafine particle concentration before and during the lockdown period. A new mechanism is thus hypothesized: NPF happens eailer near the surface and grows faster at the upper PBL, attributed to condensable vapors being transported by turbulent vertical mixing in the boundary layer. Model simulations using the WRF-Chem model reveal that the exchange ratio changed the NPF parameters, supporting the proposed mechanism that the evolution of the PBL variation has a significant impact on NPF, which should not be omitted in the NPF research, since this physical factor could be a dominant one in the NPF mechanism.

How to cite: Wu, H.: Vertical transport of ultrafine particles and turbulence evolution impact on new particle formation based on tower observation, EGU General Assembly 2024, Vienna, Austria, 14–19 Apr 2024, EGU24-2582, https://doi.org/10.5194/egusphere-egu24-2582, 2024.

EGU24-2905 | Orals | AS2.1 | Highlight

CloudRoots-Amazon22: Integrating clouds with photosynthesis by crossing scales 

Jordi Vila-Guerau de Arellano and the CloudRoots-Amazon22

How are rainforest photosynthesis and turbulent fluxes influenced by clouds? To what extent are clouds affected by local processes driven by rainforest energy, water and carbon fluxes? These interrelated questions were the main drivers of the intensive field experiment CloudRoots-Amazon22 which took place at the ATTO/Campina supersites in the Amazon rainforest during the dry season, in August 2022. CloudRoots-Amazon22 collected observational data to derive causal-effect relationships between processes occurring at the leaf-level up to canopy scales in relation to the diurnal evolution of the clear-to-cloudy transition. First, we studied the impact of cloud and canopy radiation perturbations on the sub-diurnal variability of stomatal aperture. We found an asymmetry modulated by clouds that favors photosynthesis in the morning. Second, we combined 1 Hz-frequency measurements of the stable isotopologues of carbon dioxide and water vapor with measurements of turbulence to determine carbon dioxide and water vapor sources and sinks within the canopy. Using scintillometer observations, we inferred 1-minute sensible heat flux that responded within minutes to the cloud passages. Third, collocated profiles of state variables and greenhouse gases enabled us to determine the role of clouds in vertical transport. We then inferred the area fraction of cloud cover and cloud mass flux to probe the need of collecting a comprehensive data set to establish casualty between canopy and cloud processes and improve the representations in weather and climate models. Our findings contribute to advance our process knowledge of the coupling between cloudy boundary layers and primary carbon productivity of the Amazon rainforest.

How to cite: Vila-Guerau de Arellano, J. and the CloudRoots-Amazon22: CloudRoots-Amazon22: Integrating clouds with photosynthesis by crossing scales, EGU General Assembly 2024, Vienna, Austria, 14–19 Apr 2024, EGU24-2905, https://doi.org/10.5194/egusphere-egu24-2905, 2024.

Turbulence intermittency driven by submeso motions limits the progress of turbulence theory. Field observations from the Horqin Atmospheric Boundary-Layer and Environment Experimental Station, China were used to investigate turbulence intermittency. An automated algorithm to Separate and reconstruct Submeso and Turbulent motions (SST) was improved for more accurately extraction and quantitative characterization of submeso motions. The existing intermittency intensity indices, the local intermittency strength of turbulence (LIST) and intermittency strength (IS), which are based on kinetic energy only, are revised by considering the potential energy of submeso and turbulent motions to quantify intermittency intensity more comprehensively. The analysis of eight cases revealed that turbulent intermittency events are characterized by quiescent (pulsation, material, and energy transportation are weak) and burst (pulsation, material, and energy transportation fluctuate violently) periods. The conversion of both the kinetic and potential energy of submeso to turbulent motion contributes to the transition from quiescent to burst periods. The transition always occurs after ΔTE<0 (the Total Energy difference between the submeso motion and turbulence), followed by a significant increase in ΔTE. Atmospheric stability decreases during the transition from quiescent to burst periods in most cases. In a totally intermittent night, the burst periods take up most of the material and energy transport, and the amount transported is not smaller than that during a totally turbulent night. The weaker the intermittency at night, the greater the capacity of turbulent transport. A comparison of five types of turbulence intermittency intensity indices highlights the consistency and advantages between LIST (IS) and indices in the literature. Finally, we found that turbulent intermittency events tended to occur more easily in atmospheric boundary layer (ABL) with small winds (U<2 m/s) or stable stratification (Rib>1), although they can also occur in ABL with unstable stratification and in the non-stationary state of the day-night transition.

How to cite: Ren, Y. and Zhang, H.: Quantitative description and characteristics of submeso motion and turbulence intermittency, EGU General Assembly 2024, Vienna, Austria, 14–19 Apr 2024, EGU24-3266, https://doi.org/10.5194/egusphere-egu24-3266, 2024.

EGU24-3410 | ECS | Posters on site | AS2.1

Parameter estimation for boundary-layer turbulence parameterizations over heterogeneous terrain 

Magdalena Fritz, Stefano Serafin, and Martin Weissmann

The accurate representation of turbulent exchange in the mountain boundary layer is particularly challenging for numerical weather prediction models. However, the use of common planetary boundary layer (PBL) parameterization schemes, which invariably assume flat and homogeneous terrain, results in significant model errors over mountains.

We seek to improve the accuracy of PBL parameterization schemes over complex terrain using ensemble-based parameter estimation (PE). PE within the data assimilation framework offers a way to reduce model errors by constraining model parameters with atmospheric observations. For this purpose, we use an idealized modelling environment adopting Observing System Simulation Experiments (OSSEs) that consist of a large-eddy simulation (LES) providing a virtual truth and a single column model (SCM) ensemble, where the only model error source is the PBL parameterization. We attempt to estimate parameters in PBL schemes of varying complexity affecting vertical turbulent mixing by assimilating appropriate synthetic surface observations and vertical profiles from the LES run. We demonstrate that, with proper configuration of the data assimilation system, PE makes the estimated parameters converge towards optimal values, and at the same time reduces systematic errors in simulations of the atmospheric state.

How to cite: Fritz, M., Serafin, S., and Weissmann, M.: Parameter estimation for boundary-layer turbulence parameterizations over heterogeneous terrain, EGU General Assembly 2024, Vienna, Austria, 14–19 Apr 2024, EGU24-3410, https://doi.org/10.5194/egusphere-egu24-3410, 2024.

EGU24-6303 | ECS | Posters on site | AS2.1

The Relevance of the Subgrid-Scale-Model in Large-Eddy-Simulations of the Stably Stratified Atmospheric Boundary Layer 

Lukas Bührend, Antonia Englberger, and Andreas Dörnbrack

A realistic representation of the stable (nocturnal) boundary layer (SBL) is challenging for large-eddy simulations (LES) due to the small turbulence intensity and size of turbulent eddies compared to the daytime convective boundary layer. This increases the relevance of the subgrid scale (SGS) model, which parameterizes turbulent fluxes with a size smaller than the numerical grid. The SGS parameterization influences the shape of the mean wind and temperature profiles, especially close to the surface. The turbulence intensity also influences the SBL height. It is important to note that in the SBL, the mean wind and temperature profiles are different from the Monin-Obukhov similarity forms, especially within the roughness sublayer, which becomes relevant approaching to finer vertical resolution. Additionally, typical SBL characteristics like supergeostrophic mean windspeeds (low-level jets) and the rotation of the mean wind direction with height (Ekman spiral) are influenced by the SGS model.

In our work, we use the TKE (turbulent kinetic energy) closure model as described by Schumann (1990). To obtain resolved turbulence, a modification as described by Sullivan (1994) is used, which takes account of the turbulence anisotropy and the enhanced influence of mean shear close to the surface. We use an intercomparison of SBL-LES by the GABLS-initiative as reference.  The numerical results are produced with the multiscale flow solver EULAG (see Prusa et al. (2008)), solving the governing Boussinesq equations for velocity components and potential temperature perturbation.  Periodic boundary conditions (BC) are used for the horizontal border planes. For the surface, free slip Neumann BC (NBC) with surface fluxes for the potential temperature are applied. The combination of a sensible heat flux and a stably stratified regime is compliant due to the NBC at the surface. The use of NBC did not require the Monin-Obukhov similarity theory. This makes EULAG suitable for a detailed investigation of the dependency of the resulting mean wind, temperature and TKE profiles on numerical and physical parameters. The results thereof will be presented, with special emphasis placed on the SGS model in highly resolved LESs.

How to cite: Bührend, L., Englberger, A., and Dörnbrack, A.: The Relevance of the Subgrid-Scale-Model in Large-Eddy-Simulations of the Stably Stratified Atmospheric Boundary Layer, EGU General Assembly 2024, Vienna, Austria, 14–19 Apr 2024, EGU24-6303, https://doi.org/10.5194/egusphere-egu24-6303, 2024.

EGU24-7952 | ECS | Orals | AS2.1

A Nonlocal First-Order Closure PBL Parameterization for Sensible Heat Flux using Flux Imbalance Models 

Lijie Zhang, Stefan Poll, and Stefan Kollet

In numerical weather prediction models, the local first-order closure of turbulence, also known as K-theory, is widely used to parameterize the turbulent flux in the surface roughness layer. The non-local effects of large eddies in turbulent flows are not resolved by K-theory, leading to the flux imbalance that the simulated and measured fluxes are typically smaller than the true heat flux. Higher order closure schemes mitigate the flux imbalance problem but lead to increased complexity in parameterization and higher demands on computational resources. At the same time, flux imbalance models based on large eddy simulation results have been able to capture non-local effects of the energy-containing large eddies that span the entire boundary layer and improve the flux imbalances on both simulation results and eddy covariance measurements. These models inspired us to propose a new modified K-theory based on a correction factor that includes the non-local effects mentioned above, without using an extra term (e.g. counter-gradient flux). The formulation of the modified K-theory is straightforward and requires atmospheric stability parameters (u*/w*) and the ratio of measurement to boundary layer height (z/Zi), which are readily available in simulations and observations.

To test the performance of the modified K-theory, an idealized large eddy simulation was performed over a dry convective boundary layer with a prescribed sensible heat flux at the land surface. The result shows that the K-theory underestimates the sensible heat flux by 18% due to the mesoscale circulations, while the proposed modified K-theory reduces the underestimation to less than 6%, offering the potential to improve the parameterization in numerical weather prediction.

How to cite: Zhang, L., Poll, S., and Kollet, S.: A Nonlocal First-Order Closure PBL Parameterization for Sensible Heat Flux using Flux Imbalance Models, EGU General Assembly 2024, Vienna, Austria, 14–19 Apr 2024, EGU24-7952, https://doi.org/10.5194/egusphere-egu24-7952, 2024.

EGU24-8366 | Posters on site | AS2.1

Long-term evaluation of turbulence parameterisations using Doppler lidar  

Natalie Harvey, Helen Dacre, Chris Walden, Kirsty Hanley, and Humphrey Lean

Turbulence in the atmospheric boundary layer governs the exchange of heat, moisture, and other atmospheric constituents between the surface and the free troposphere. This exchange plays a pivotal role in initiating moist convection which influences the timing and location of convective rainfall. As operational weather forecasts increasingly move towards km and sub-km grid spacing, resolving larger boundary layer turbulent structures becomes possible, necessitating adjustments to turbulence parameterisation schemes. The UMBRELLA (UM Boundary-layer REpresentation with Land-Atmosphere Interactions) project aims to evaluate the performance of the UM (Met Office Unified Model) boundary layer turbulent parameterisation schemes for different grid spacings, ranging from 100m to 10km. 

Here, analysis of long-term Doppler lidar and sonic anemometer observations at Chilbolton, Hampshire is presented, with particular focus on long-term statistics on boundary layer vertical velocity, vertical velocity variance and skewness, along with sensible heat flux. These quantities are combined with the presence of cloud and aerosol height to classify the boundary-layer into different regimes and used to evaluate the UM turbulence parameterisations. The Doppler lidar statistics are compared to an 18-member ensemble UM run at 300m grid spacing for the 3-month WesCon field campaign which took place in the UK during summer 2023. While the primary focus of this project is on the UK and the UM, the developed methodology could be applied to other locations worldwide.

How to cite: Harvey, N., Dacre, H., Walden, C., Hanley, K., and Lean, H.: Long-term evaluation of turbulence parameterisations using Doppler lidar , EGU General Assembly 2024, Vienna, Austria, 14–19 Apr 2024, EGU24-8366, https://doi.org/10.5194/egusphere-egu24-8366, 2024.

EGU24-8430 | Posters on site | AS2.1

Variations in CO2 Fluxes at the Surface-Atmosphere Interface Within the Seoul Metropolitan Area 

Seonok Hong, Jinwon Kim, Young-Hwa Byun, Jinkyu Hong, Je-Woo Hong, Keunmin Lee, Sang-Sam Lee, and Yeon-Hee Kim

The monitoring and comprehension of CO2 fluxes in urban environments face challenges due to severe spatiotemporal heterogeneity of emissions sources and limited measurement networks. This issue is particularly critical for large cities, which stand as major contributors to anthropogenic CO2 in the climate system. Focusing on Seoul, Korea, this study analyzes CO2 fluxes at eight surface energy balance sites spanning 2017–2018. These sites comprise six urban locations (vegetation-area fraction < 15%) and two suburban sites (vegetation-area fraction > 60%), aiming to attribute the fluxes to local land-use and business types. To compare with rural area, CO2 fluxes from the Boseong Standard Meteorological Observatory, characterized by rice paddy, were utilized. Results reveal that CO2 flux variations at suburban sites are predominantly influenced by vegetation, while disparities between urban and suburban sites arise from differences in vegetation-area fraction and anthropogenic CO2 emissions.  For the CO2 fluxes at the urban sites; (1) vehicle traffic (traffic) and heating-fuel consumption (heating) contribute > 80% to the total, (2) vegetation effects are minimal, (3) the seasonal cycle is driven mainly by heating, (4) the contribution of heating is positively related to the building-area fraction, (5) the annual total is positively (negatively) correlated with the commercial-area (residential-area) fraction, and (6) the traffic at the commercial sites depend further on the main business types to induce distinct CO2 flux weekly cycles. This research demonstrates that comprehending and estimating CO2 fluxes in sizable urban areas necessitate meticulous site selections and analyses founded on detailed consideration of the refined land-use and business types, going beyond the commonly used single representative land-use type in contemporary studies. 

How to cite: Hong, S., Kim, ., Byun, .-H., Hong, ., Hong, .-W., Lee, ., Lee, .-S., and Kim, .-H.: Variations in CO2 Fluxes at the Surface-Atmosphere Interface Within the Seoul Metropolitan Area, EGU General Assembly 2024, Vienna, Austria, 14–19 Apr 2024, EGU24-8430, https://doi.org/10.5194/egusphere-egu24-8430, 2024.

EGU24-8700 | ECS | Posters on site | AS2.1

Observational Study of Valley Breezes in Heterogeneous Terrain: Vertical and horizontal characterization in the Aure Valley (Pyrenees) 

Pablo Ortiz-Corral, Carlos Román-Cascón, Carlos Yagüe, Juan Alberto Jiménez-Rincón, Mariano Sastre, Cristina Vegas-Cañas, Mathilde Jomé, Fabienne Lohou, Marie Lothon, and Jielun Sun

This research focuses on the observational analysis of the nocturnal downvalley flows within a valley in southern France, near Pyrenees.  Three meteorological stations strategically positioned throughout the valley were installed at different locations within the frame of the LATMOS-i* and WINDABL** projects and in collaboration with the french project MOSAI***. In addition to the measurements near the surface, several radiosoundings were launched during the nights with downvalley flow in order to characterize the vertical structure of these winds. Near the surface, nights with downvalley are characterized by southerly (from the Pyrenees) and progressively increasing winds that produce higher values of turbulent parameters than those observed during daytime when weak synoptic conditions are present. 

Moreover, the vertical structure of downvalley flow presents significant variations throughout the night, influenced by a complex interaction between the synoptic conditions and the surface processes. Days characterized by strong synoptic forcing, typically from the west in the study region, completely inhibit the downvalley flow formation. However, on days with even moderate synoptic forcing, the north-south orientation of the valley, coupled with the presence of mountains, seems to act as a shield against synoptic winds, allowing the nocturnal downvalley flow to form inside the valley. An analysis of the atmospheric stability using bulk Richardson number at different layers will also be presented. A key focus is to differentiate those layers with higher static/dynamic stability to discern whether turbulence originates from ground-induced thermal effects or dynamically driven by wind.

This study highlights the complexity of observational studies trying to differentiate the factors influencing the nocturnal downvalley flows behavior, emphasizing the need to consider both synoptic conditions and surface processes, including the significant roles played by local topography. 

How to cite: Ortiz-Corral, P., Román-Cascón, C., Yagüe, C., Jiménez-Rincón, J. A., Sastre, M., Vegas-Cañas, C., Jomé, M., Lohou, F., Lothon, M., and Sun, J.: Observational Study of Valley Breezes in Heterogeneous Terrain: Vertical and horizontal characterization in the Aure Valley (Pyrenees), EGU General Assembly 2024, Vienna, Austria, 14–19 Apr 2024, EGU24-8700, https://doi.org/10.5194/egusphere-egu24-8700, 2024.

EGU24-9484 | ECS | Orals | AS2.1

Open access Data Sets of Vertical Profiles for Turbulent Ekman Flow generated by DNS tlab code 

Sally Issa, Cedrick Ansorge, Juan Pedro Mellado, and Jonathan Kostelecky

In the pursuit of advancing our comprehension of the atmospheric boundary layer and the associated exchange processes near the surface, the accessibility of high-quality data assumes a pivotal role. An open-access approach is acknowledged for catalyzing collaborative efforts, empowering researchers globally to harness available information for their investigations. This has the potential to refine existing models, validate hypotheses, and instigate innovations in climate modeling and predictive simulations. Here, we introduce an open benchmark data repository, accessible through static collection of DOIs, to share the statistics of simulations for turbulent Ekman flow. This data, forming the foundation for numerous publications on Ekman flow, has been established as a suitable virtual lab environment in prior works for studying crucial aspects of the atmospheric boundary layer. We believe that the availability of this data under the FAIR paradigm has the potential to facilitate further exploitation, enhancing our understanding of process-level intricacies in the atmospheric boundary layer.
The data is being generated since 2011 using the tLab tool-suite (github.com/turbulencia/tlab) for direct numerical simulation (DNS) on some of Europe’s largest supercomputers, including juqueen and juwels at Jülich Supercomputing Centre, and hawk at Höchstleistungsrechenzentrum Stuttgart. It is now accessible in the long-term data repository refubium.fu-berlin.de of Freie Universität Berlin.
The inaugural contribution to this repository is a comprehensive, curated set of data exploring the influence of turbulence scale separation, specifically the Reynolds number. A series of simulations spans a range of Reynolds numbers, corresponding to a variation of approximately tenfold in the friction Reynolds number Reτ. The shared dataset encompasses various parameters, including vertical profiles of velocity, budget terms of scalar and momentum budgets, statistical moments up to the third order of velocities, scalars, and derivatives, providing a holistic view of Ekman flow dynamics across a range of Reynolds numbers. This enables the identification of inviscid scaling behavior and the development of scaling theories for the application of these simulations to real-world problems.
While the dataset also captures effects of stable stratification and rough surfaces, these aspects are, beyond the scope of this abstract.

Keywords— Numerical simulation, Ekman flow, Turbulence, Surface layer, Simulation Theory

This work is funded by the ERC Starting Grant "Turbulence-Resolving Approaches of the Intermittently Turbulent Atmos-
pheric Boundary Layer [trainABL]" of the European Research Council (funding ID 851347). The data was generated under that
computing grants hhh07, hku24, stadit at Jülich supercomputing centre and trainABL / Bundesprojekt 44187 at Höchstleistungs-
rechenzentrum Stuttgart)

How to cite: Issa, S., Ansorge, C., Pedro Mellado, J., and Kostelecky, J.: Open access Data Sets of Vertical Profiles for Turbulent Ekman Flow generated by DNS tlab code, EGU General Assembly 2024, Vienna, Austria, 14–19 Apr 2024, EGU24-9484, https://doi.org/10.5194/egusphere-egu24-9484, 2024.

EGU24-10013 | ECS | Orals | AS2.1

Analysis of coastal breeze and low-level jets events from numerical modeling and LiDAR measurements 

Mathieu Landreau, Boris Conan, and Isabelle Calmet

The complexity and variety of phenomena that can occur in coastal areas (e.g. breezes, internal boundary layers, low-level jets (LLJ)) often result in wind profiles strongly deviating from the Monin-Obukhov similarity theory. Moreover, the lack of offshore experimental data leads to gaps in knowledge of the marine coastal atmospheric boundary layer (MCABL). Characterizing the wind resources in MCABL has been identified by Veers et al. (2022) as one “Grand Challenge” for the development of offshore wind farms.

To partially fill these gaps, a joint numerical and experimental study is currently being performed. In 2020, scanning LiDAR measurements were carried out within a few kilometers of the French Atlantic coastline (Conan and Visich, 2023). In parallel, mesoscale to microscale simulations are performed with the Weather Research and Forecasting (WRF) code, using the grid-nesting method to progressively decrease the horizontal mesh size from a few kilometers (RANS modeling) down to a hundred meters (LES modeling). The simulation, giving access to more atmospheric variables in a large area, allows a complementary analysis.

On a particular week of this experiment, complex velocity profiles have been observed in the LiDAR data, highlighting the presence of LLJ and high wind-shear events. Velocity profiles from RANS simulations show good comparison with LiDAR data, which suggests that the mechanisms responsible for the observed phenomena are well reproduced. In addition, these large-scale simulations allow the identification of a complete sea-breeze circulation in the complex coastal area of Brittany.

The marine extent of the sea-breeze can be defined as the isoline where cross-coast velocity component decreases with the distance from the coast to a value of 1 m/s (Arritt, 1989 ; Finkele et al., 1995). The RANS results indicate that the sea-breeze can reach a distance of 70 km offshore during the studied period. A first analysis of the simulations also suggests that the nighttime LLJ observed on the Atlantic coast is related to the residual of a sea-breeze front moving southward from the north coast of Britanny.

Analysis of the LES simulations will permit to study more precisely the onset of the sea-breeze, the evolution of the LLJ across the coastline (related to transition in atmospheric stability and surface roughness) or the turbulence kinetic energy budget in the jet core.


Arritt, R.W. 1989. Quarterly Journal of the Royal Meteorological Society 115 (487): 547‑70. https://doi.org/10.1002/qj.49711548707.

Conan, B.,and A. Visich. 2023. Wind Energy Science Discussions, October, 1‑23. https://doi.org/10.5194/wes-2023-141.

Finkele, K., et al.. 1995. Boundary-Layer Meteorology 73 (3): 299‑317. https://doi.org/10.1007/BF00711261.

Veers, P., et al.. Wind Energy Science 7 (6): 2491‑96. https://doi.org/10.5194/wes-7-2491-2022.

How to cite: Landreau, M., Conan, B., and Calmet, I.: Analysis of coastal breeze and low-level jets events from numerical modeling and LiDAR measurements, EGU General Assembly 2024, Vienna, Austria, 14–19 Apr 2024, EGU24-10013, https://doi.org/10.5194/egusphere-egu24-10013, 2024.

EGU24-11351 | ECS | Orals | AS2.1

Impacts of using thermal stratification dependent critical bulk Richardson number in a PBL scheme of a climate model 

Prabhakar Namdev, Maithili Sharan, and Saroj K. Mishra

The planetary boundary layer height (PBLH) is a crucial component in almost all planetary boundary layer (PBL) parameterizations, and the PBLH is calculated using a method based on the bulk Richardson number (RiB), which utilizes a threshold value of RiB called the critical bulk Richardson number (Ricr). In most of the PBL schemes, Ricr prescribed as one single value, and its dependency on thermal stratification has been ignored. In the present study, an effort has been made to incorporate Ricr based on different stratification conditions following a study by Zhang et al. (2014) in the PBL parameterization proposed by Holtslag and Boville (1993) of the National Centre for Atmospheric Research Community Atmosphere Mode version 5 (NCAR-CAM5). The modified scheme is evaluated over Indian land and associated different climatic zones in simulating PBLH, surface turbulent fluxes, near-surface atmospheric variables, and precipitation during the winter (DJF), pre-monsoon (MAM), monsoon (JJA), and post-monsoon (SON) seasons. The simulations with the default and modified schemes have been carried out at a spatial resolution of ~1o for a period of six years, discarding the first year as spin-up time and considering the last five-year simulation for the analysis. The study reveals that the modified scheme is able to produce more accurate estimates for PBLH than the default scheme compared to the ERA5 reanalysis dataset over Indian land, which further enhances the accuracy of turbulent transport of heat, moisture, and momentum inside the PBL under various atmospheric stability regimes. The modified scheme noticeably improved the simulation of surface sensible and latent heat fluxes, surface air temperature, and precipitation compared to the default scheme over Indian land during all four seasons.

How to cite: Namdev, P., Sharan, M., and Mishra, S. K.: Impacts of using thermal stratification dependent critical bulk Richardson number in a PBL scheme of a climate model, EGU General Assembly 2024, Vienna, Austria, 14–19 Apr 2024, EGU24-11351, https://doi.org/10.5194/egusphere-egu24-11351, 2024.

EGU24-13675 | Posters on site | AS2.1

Planetary Boundary layer flow over complex terrain during a cold surge event: a case study 

Young-Hee Lee, Hee-Jeong Lim, and Gyuwon Lee

The planetary boundary layer (PBL) flows over complex terrain during a cold surge event were investigated using 3-hourly radiosonde measurements in the upwind, near ridge, and downwind of mountains in the northeastern part of South Korea and high-resolution (333-m) numerical simulation. A cold surge occurred on 23 January 2018 and lasted for 4 days. We analyzed onset day of the cold surge when air temperature dropped rapidly. Analysis of the radiosonde data shows that the PBL is characterized by an adiabatic layer with strong capping inversion in early morning and evening as well as during daytime in the upwind and near-ridge sites. The PBL flow at the near-ridge site was strongest among three sites except at 0600 local standard time (LST) when the PBL flow in the lee was strongest. We performed high-resolution (333-m) numerical simulations using the Weather Research and Forecasting (WRF) model. The adiabatic PBL in the upwind site at 0600 LST was simulated, although its depth was underestimated. The model reproduced the strong low-level wind at 0600 LST and large wind shear during the daytime in the lee, but it did not capture the exact timing of the large wind shear. Model showed an overall good performance in simulating the vertical profile of the virtual potential temperature and wind below 2 km above sea level at the three sites, with a high index of agreement (IOA) except for the wind at 1200 and 1500 LST in the lee. To examine the cause for the different behavior of PBL flow in the lee of mountains between 0600 LST and the daytime, we calculated the Froude number for PBL flow using radiosonde measurements based on reduced gravity shallow water (RGSW) theory. At 0600 LST, the upwind Froude number F0was close to 1, while during the daytime, it was much lower than 1. The observed lee flow behavior was consistent with the flow regime change of a single layer over an obstacle with changing F0; the flow with a propagating lee jump changes into that with a stationary lee jump with decreasing F0. Numerical simulation shows that the steepening of streamlines of lee-wave field leads to a jump-like structure in the lee of mountains during the daytime.

How to cite: Lee, Y.-H., Lim, H.-J., and Lee, G.: Planetary Boundary layer flow over complex terrain during a cold surge event: a case study, EGU General Assembly 2024, Vienna, Austria, 14–19 Apr 2024, EGU24-13675, https://doi.org/10.5194/egusphere-egu24-13675, 2024.

EGU24-14296 | ECS | Posters on site | AS2.1

Inferring Katabatic Jet Height with Near-Surface Measurements 

Cole Lord-May, Valentina Radić, and Ivana Stiperski

Understanding the development of katabatic wind systems above mountain glaciers is essential to better constrain the response of the local glacier microclimate and surface melting to large-scale climate forcing. The vertical turbulent flux profiles, and consequently turbulent fluxes at the glacier surface during katabatic flow, depend strongly on the height of the near-surface katabatic jet. However, direct measurements of jet heights are rare as they require balloon soundings or meteorological towers; neither of which are appropriate for long-term installation on glaciers. In this study, we conduct a multi-month field campaign in the summer of 2023 on the Kaskawulsh Glacier in the Yukon, Canada, measuring mean meteorological variables (up to 5m above the glacier surface), and turbulent fluxes at three heights (1m, 2m, and 3m above the surface) derived from eddy-covariance measurements. Over 30 hours of atmospheric  profiling with wind and temperature sensors tethered to a kite provides temporally and spatially high-resolution vertical profiles of katabatic flow. Using Multi-Resolution Flux Decomposition (MRD) applied to the eddy-covariance data from only one near-surface sonic anemometer, we introduce a method to infer the height of the katabatic wind speed maximum using the length scales of the most energetic eddies contributing to the heat flux. The inferred katabatic height for each 30-min interval of observations agrees with the corresponding measured 30-min average height from the atmospheric profiling, with a correlation of 0.73 and a mean bias error of 0.3m between the two datasets. We demonstrate that turbulent mixing lengths of momentum and heat fluxes can also be quantified with the use of MRD on the eddy-covariance data, and we propose a simple modification in the parametrizations of mixing-length models accounting for the near-surface katabatic jet. We corroborate these findings with data collected as part of the Second Meteor Crater Experiment (METCRAX II), providing tower-based measurements of deep katabatic flow at non-glacier terrain in the Arizona Meteor Crater.

How to cite: Lord-May, C., Radić, V., and Stiperski, I.: Inferring Katabatic Jet Height with Near-Surface Measurements, EGU General Assembly 2024, Vienna, Austria, 14–19 Apr 2024, EGU24-14296, https://doi.org/10.5194/egusphere-egu24-14296, 2024.

EGU24-15135 | Orals | AS2.1

Examining Turbulent Flow Anisotropy: Insights from Simplified Variance Budget Analyses 

Ivana Stiperski, Gabriel Katul, and Marc Calaf

Anisotropy fundamentally defines the nature of turbulent flows in natural environments, engineering, and technology.  At large scales, turbulence rarely attains an energy state that is equipartitioned between the three velocity components or a state where turbulent stresses disappear. This deviation from isotropy underscores turbulence's essential role in promoting momentum transfer.

In canonical boundary layers, turbulence anisotropy emerges primarily from two distinct mechanisms: streamwise energy injections through shear forces and the vertical modulation of turbulent kinetic energy by buoyancy, acting either as a source (unstable stratification) or sink (stable stratification) of turbulence kinetic energy. Close to a solid surface turbulence additionally experiences wall blocking, limiting the energy in the wall-normal direction. Furthermore, in complex terrain, a multitude of factors intricately modify the turbulence anisotropy, thus altering the applicability of traditional similarity scaling.

Here, we use simplified Reynolds stress budgets to examine how stratification influences the normal stress components across a comprehensive range of measurement datasets from canonical to highly complex terrain. This reduced set of budget equations assume a balance between shear and buoyancy production and dissipation, and model the return to isotropy using a linear Rotta scheme adjusted by the isotropization of the production. This model provides expressions for normalized velocity variances as function of Richardson number, highlighting the change of anisotropy as stratification becomes progressively more dominant. In canonical terrain, the model is shown to capture the dependence of energy anisotropy on Richardson number away from the surface (heights above 60m), however, it fails in predicting energy anisotropy close to the surface. Furthermore, the increase of terrain complexity leads to a decoupling of the dependence of anisotropy and Richardson number not predicted by the model, and shows a consistent decrease of the contribution of streamwise  velocity variance and increase of spanwise velocity variance to the total TKE budget. Finally, a progressively more important wind turning with height with terrain complexity in neutral stratification causes near-surface turbulence to be more anisotropic over complex than over canonical terrain. 

Our findings outline the nuanced role of terrain in shaping turbulence anisotropy, providing avenues for enhanced turbulence modeling and highlighting limitations of conventional approaches in complex environments.

How to cite: Stiperski, I., Katul, G., and Calaf, M.: Examining Turbulent Flow Anisotropy: Insights from Simplified Variance Budget Analyses, EGU General Assembly 2024, Vienna, Austria, 14–19 Apr 2024, EGU24-15135, https://doi.org/10.5194/egusphere-egu24-15135, 2024.

EGU24-15299 | Orals | AS2.1 | Highlight

Turbulence in thermally-driven slope winds 

Dino Zardi
The atmospheric boundary layer (ABL) in mountainous regions is characterised by a variety of airflows, originating from complex landform forcing, which encompass a range of scales of motion, from synoptic scale flows to very local phenomena, such as the daily-periodic thermally-driven circulations developing over inclines and in the valleys under clear sky and in the absence of major synoptic forcing. These airflows, and turbulence generated therein, affect a variety of processes, including surface-atmosphere exchanges of momentum, energy and mass, and transport across a variety of scales. They may also contribute to the initiation of orographic convection. 
The talk focuses on the simplest of these flows, namely slope winds, outlines the state of our present understanding, from measurements as well as from numerical model simulations, and highlights still open questions concerning the structure of turbulence properties and their representation in terms of similarity. Ongoing efforts to investigate these flows within the current initiative TEAMx - Multi-scale transport and exchange processes

in the atmosphere over mountains – programme and experiment (http://www.teamx-programme.org/)  are also presented.

How to cite: Zardi, D.: Turbulence in thermally-driven slope winds, EGU General Assembly 2024, Vienna, Austria, 14–19 Apr 2024, EGU24-15299, https://doi.org/10.5194/egusphere-egu24-15299, 2024.

Atmospheric boundary layers (ABLs) exhibit transient processes on various time and length scales, with a scale separation between the large-scale forcing and the small-scale response. Some crucial but standing challenges in modeling and simulation of ABL flows lie in the detailed representation of boundary layer turbulence (e.g. [1]). This includes intermittent and transient processes and the resulting turbulent and laminar response mechanisms. State-of-the-art subgrid-scale models utilize statistical closures for an averaged resolved flow state on the basis of the Monin–Obhukov similarity theory (MOST) to represent scalar fluxes and momentum fluxes (e.g. [2]). Fluctuations are not resolved in MOST. Instead, their ensemble effect is parameterized by the resolved large scales, neglecting backscatter from the unresolved small scales. Data-driven stochastic approaches aim to incorporate fluctuations and the spontaneous occurrence of instabilities, but at the expense of ad hoc forcings (e.g. [3]).

The mentioned limitations can be removed by a physically compatible representation of turbulent fluctuations. This is addressed here by utilization of a map-based stochastic approach that is based on the one-dimensional turbulence (ODT) model [4]. ODT autonomously evolves vertical flow profiles for prescribed initial and boundary conditions, and physical forcings. The model captures turbulent cascade phenomenology and aims to resolve all relevant turbulent scales along a physical coordinate. Turbulent advection is modeled by a stochastically sampled sequence of spatial mapping events that punctuate the deterministic advancement due to viscous and Coriolis forces. The offered dynamical complexity removes the need for artificial forcings.

In the contribution, key results from recent and ongoing studies related to the reduced-order modeling of ABL flows will be presented. First, surface scalar and momentum fluxes in turbulent channels are discussed emphasizing the correctly predicted inapplicability of the Reynolds analogy [5]. Second, the influence of system rotation and stratification is discussed for low-order velocity statistics and the participating turbulent scales [6,7]. Third, results for nonequilibrium conditions are presented for a transient ABL that exhibits turbulent bursts in response to an oscillatory geostrophic forcing [8]. Last, some preliminary results on the stochastic deconvolution of averaged data [9] will be presented focusing on the additional physical insight that is offered by the model.


References

[1] L. Mahrt. Annu. Rev. Fluid Mech. 46:23–45, 2014.
[2] I. Stiperski, and M. Calaf. Phys. Rev. Lett. 130:124001, 2023.
[3] V. Boyko, and N. Vercauteren. Q. J. R. Meteorol. Soc. 149(755):2125–2145, 2023.
[4] A. R. Kerstein, and S. Wunsch. Bound.-Lay. Meteorol. 118:325–356, 2006.
[5] M. Klein, H. Schmidt, and D. Lignell. Int. J. Heat Fluid Flow 93:108889, 2022.
[6] M. Klein, and H. Schmidt. Adv. Sci. Res. 19:117–136, 2022.
[7] L. S. Freire. Bound.-Lay. Meteorol. 184:25–43, 2022.
[8] M. Klein, and H. Schmidt. Adv. Sci. Res. 20:55–64, 2023.
[9] C. Glawe, M. Klein, and H. Schmidt. Proc. Appl. Math. Mech. 23:e202300055, 2023.

How to cite: Klein, M. and Schmidt, H.: Capturing features of transient boundary layers with a map-based stochastic modeling approach, EGU General Assembly 2024, Vienna, Austria, 14–19 Apr 2024, EGU24-15560, https://doi.org/10.5194/egusphere-egu24-15560, 2024.

EGU24-16046 | Orals | AS2.1

Flux-gradient relations: insights from anisotropy analysis 

Samuele Mosso, Marc Calaf, and Ivana Stiperski

Almost all Earth System Models (ESM) use Monin-Obukhov similarity theory (MOST) to parameterize near surface turbulence. Despite its popularity, MOST has limited applicability and creates high uncertainties in very stable and unstable regimes, over heterogeneous and complex terrain, and is known to incorrectly represent the fluxes at the surface. Including turbulence anisotropy as a non-dimensional scaling parameter has recently proved successful in extending MOST to complex terrain for the scaling of variances and other near surface statistical properties.

Here we extend this approach to the scaling of surface gradients of mean wind and temperature, using data from five datasets ranging from flat and homogeneous to slightly complex terrain. The flux-gradient scaling relations exhibit large scatter, especially in unstable conditions where the data’s behavior is unclear. We show that adding turbulence anisotropy into the scaling of gradients allows to drastically reduce the scatter in the relations and develop new and more accurate parametrizations. This is especially true for the flux-gradient relations for wind shear (φm) in unstable conditions, and for temperature gradient (φh) both in unstable and stable regime.

The strong dependence of scaled wind speed gradient (φm), on turbulence anisotropy also allows us to finally settle the debate on the free convective regime, which clearly exhibits a -1/3 power law when anisotropy is considered. Whereas the strong dependence of scaled temperature gradients (φh) might explain a poorer performance of that scaling relation in predicting the surface sensible heat flux. Furthermore, the eddy diffusivities for momentum and heat and the turbulent Prandtl number are heavily modulated by anisotropy and the latter vanishes in free convective conditions.

These results further accentuate the need to incorporate turbulence anisotropy in boundary layer studies and parametrizations, paving the way for reliable surface parametrizations in ESMs.

How to cite: Mosso, S., Calaf, M., and Stiperski, I.: Flux-gradient relations: insights from anisotropy analysis, EGU General Assembly 2024, Vienna, Austria, 14–19 Apr 2024, EGU24-16046, https://doi.org/10.5194/egusphere-egu24-16046, 2024.

EGU24-16193 | Orals | AS2.1

Turbulence-resolving Spatio-temporal measurements of ABL flow with a large fleet of multicopter UAS. 

Norman Wildmann, Johannes Kistner, and Almut Alexa

Small uncrewed aerial systems (UAS) are platforms which have been introduced into every-day life within the last decade due to their low cost, good availability and ease of use. They serve a large variety of applications, including aerial photography and cinematography, but also scientific purposes in earth observation. In atmospheric sciences, fixed-wing UAS have been used at first to collect in situ measurements especially in the atmospheric boundary layer (ABL). The way data was collected was based on common know-how from piloted research aircraft. Flow probes and fast-response sensors were installed to measure thermodynamic variables and derive turbulent fluxes. This study focuses on small multicopter UAS which are the most common type of UAS and usually referred to as `drones'. These systems are easier to operate due to their capability of vertical take-off and landing and advanced control systems.
For the most part in atmospheric measurements, multicopter UAS are applied to collect vertical profiles of wind, temperature and humidity. For such profiling tasks, similar sensors as in radiosondes can be deployed and provide a good accuracy for temperature and humidity, but resolving turbulence is usually not the primary focus. However, if multiple systems can be placed at most flexible locations within the ABL to observe thermodynamic features at a high resolution, this enables a variety of new possibilities for research. We show that with the DLR SWUF-3D (simultaneous wind measurement with a UAS fleet in 3D) quadrotor fleet that consists of 35 UAS, turbulence eddies can be resolved with a frequency of up to 2 Hz by the individual drones. This applies for 3D wind measurements as well as for temperature measurements with a newly developed fine-wire platinum resistance thermometer (FWPRT). Within the limits towards the smallest scales we show that the data can be used to calculate fluxes of momentum and sensible heat with reasonable uncertainties in many atmospheric conditions. Additionally to field measurements, the UAS were calibrated and the results were verified in a wind tunnel setup. 
We show how data of the SWUF-3D fleet can be used to calculate spatial correlation and coherence in ABL flow. The system was also used to measure complex flow in an Alpine valley and in the near wake of a wind turbine.  An overview of the applications is given to show the potential of turbulence-resolving, spatio-temporal measurements with a large fleet of multicopter UAS.

How to cite: Wildmann, N., Kistner, J., and Alexa, A.: Turbulence-resolving Spatio-temporal measurements of ABL flow with a large fleet of multicopter UAS., EGU General Assembly 2024, Vienna, Austria, 14–19 Apr 2024, EGU24-16193, https://doi.org/10.5194/egusphere-egu24-16193, 2024.

EGU24-16872 | ECS | Orals | AS2.1

The Diurnal Evolution of Atmospheric Boundary Layers in the LIAISE Field Campaign  

Mary Rose Mangan, Jordi Vila-Guerau de Arellano, Bart van Stratum, Marie Lothon, Guylaine Canut, and Oscar Hartogensis

The Land surface Interactions with the Atmosphere over the Iberian Semi-arid environment (LIAISE) field experiment took place in July 2021 in the Ebro River Valley in the northeast of Spain. In the domain of the LIAISE field campaign, thermal surface heterogeneity is induced by irrigation which was applied to agricultural fields that cover ∼65% of the LIAISE region contrasting with the remaining 35% of the region covered by non-irrigated agricultural fields. Observed Bowen ratios reach approximately 20 in non-irrigated fields, while observed Bowen ratios are approximately 0.1 in the irrigated fields. This contrast could lead to an interaction of scales that range from the a regional scale that encompasses both the irrigated and non-irrigated areas (∼10 km) down to a scale of an individual field (∼100 m).  In addition to surface fluxes, profiles of both the mean state of the atmospheric boundary layer (ABL) and turbulent transport in the ABL were measured over both the irrigated and non-irrigated landscapes. Observations confirm that the surface heterogeneity is felt most strongly near the surface; however, approximately 1000 m above ground level, there appears to be a blending height in which heterogeneity mixes so that the observed ABL potential temperature and specific humidity profiles are similar over both landscapes. Conversely, profiles of turbulent transport shows notable differences between the irrigated and non-irrigated boundary layers. Buoyancy flux over the irrigated area is driven by moisture fluxes, and above an internal boundary layer (approximately 25% of the non-irrigated ABL height), turbulent fluxes of scalers reach their maximum. Turbulence kinetic energy is higher over the non-irrigated landscape because of the increased buoyancy from the surface sensible heat flux, and the observed ABL heights are 100-500 m higher in the non-irrigated landscape than the irrigated landscape.


In this study, we discuss novel experiments that combine the synoptic- and meso-scale forcing (ERA) with the explicit simulation of secondary circulations driven by surface heterogeneity using large-eddy simulation (LES).   The surface of the LES is defined with prescribed sensible and latent heat fluxes from observations. With the LES, we aim to better understand the development of the ABL over the LIAISE domain and how the ABL differs in space between the irrigated and the non-irrigated areas Furthermore, we focus on the turbulent transport – both vertically and horizontally in space – to illustrate the most important processes which contribute to the locally observed ABL.

How to cite: Mangan, M. R., Vila-Guerau de Arellano, J., van Stratum, B., Lothon, M., Canut, G., and Hartogensis, O.: The Diurnal Evolution of Atmospheric Boundary Layers in the LIAISE Field Campaign , EGU General Assembly 2024, Vienna, Austria, 14–19 Apr 2024, EGU24-16872, https://doi.org/10.5194/egusphere-egu24-16872, 2024.

EGU24-17008 | ECS | Posters on site | AS2.1

Observational study and numerical simulations of sea breezes on the coast of Malaga 

Pablo Fernández-Castillo, Carlos Román-Cascón, and Carlos Yagüe

Sea breezes are thermally-driven flows that develop on the mesoscale as a result of differential surface heating between the land and ocean surface. These wind circulations appear on coastal areas, influencing their thermal regime and comfort, the characteristics of the Atmospheric Boundary Layer (ABL), the diffusion of pollutants, transport and circulation of relevant gasses, offshore wind power production and convection onset. Moreover, an important part of the worldwide population lives near the coast and is thus affected by sea breezes, highlighting the importance of their study and understanding of the associated processes. The sea breeze on the coast of Malaga (southern Spain) is analysed in this study, an area where the sea breeze has not been studied yet. This region features complex topography and shoreline orientation, high density of buildings as well as enhanced variability of sea-surface temperatures (SST) due to frequent coastal upwelling events. These factors interact with sea breezes, adding complexity and interest to the study. The first objective of this work is to characterize sea breezes in Malaga, for which observational data from three synoptic stations during the summer months of 2022 are analysed. Despite being relatively close to each other (a few kilometers), the sites exhibit differences in the evolution of temperature and humidity on sea breeze days. The arrival of the sea-breeze front is particularly visible closer to the shoreline, where it contributes to a temperature decrease, which is not apparent on sites 2-5 km inland. The sea breeze also causes an increase in the specific humidity and wind speed. The analysis of the breeze events and the SST suggest that this variable has an impact on temperature close to the shoreline on sea breeze days. The second objective is to perform and analyse a numerical simulation with the Weather Research and Forecasting (WRF) model of a sea breeze event of particular interest, in which important temperature differences existed between the observational sites. Results from the numerical simulation show that complex wind circulations appear in the study area and may explain the observed temperature differences, highlighting the contribution of high-resolution numerical simulations to the understanding of the underlying physical mechanisms.

How to cite: Fernández-Castillo, P., Román-Cascón, C., and Yagüe, C.: Observational study and numerical simulations of sea breezes on the coast of Malaga, EGU General Assembly 2024, Vienna, Austria, 14–19 Apr 2024, EGU24-17008, https://doi.org/10.5194/egusphere-egu24-17008, 2024.

EGU24-17564 | Posters on site | AS2.1

Investigating the impact of the vertical structure of the atmospheric boundary layer and the surface heterogeneities on the development of the valley and coastal breezes (the WINDABL project). 

Carlos Román-Cascón, Juan Alberto Jiménez-Rincón, Pablo Ortiz-Corral, and Carlos Yagüe and the WINDABL team

Thermally driven winds (breezes) are mesoscale diurnal/nocturnal wind circulations initiated by surface temperature gradients in areas with contrasting surfaces when weak and fair-weather synoptic conditions dominate. The characteristics of the breezes depend on the strength of the surface temperature gradient, but also on the interaction with other winds of different spatio-temporal scales, such as the background winds (of low-moderate intensity). Besides, the thermodynamic vertical profile of the atmospheric boundary layer (ABL) can also impact the breeze characteristics. In this context, some recent modelling experiments have shown how the vertical structure of the pre-existing ABL is a key factor that controls the impact of specific surface changes on the breeze characteristics. This issue motivated the development of the WINDABL project* to further investigate this finding through an observational and modelling strategy.

In this work, we present the methodology carried out for the observational part of the project, which consisted of the installation of meteorological (and surface energy balance) stations at strategic locations for the long-term monitoring of breezes and the launching of atmospheric soundings during intensive observation periods characterised by breeze conditions. This strategy was developed both at a coastal and a mountainous (valley) area. The former corresponds to the northern part of the Gulf of Cádiz (southwestern Iberian Peninsula coast) and the latter to the Vallée d’Aure, on the Northern side of the Pyrenees.

We also present some first results obtained from the analysis of the data of the different towers and from 26 radiosoundings launched during 8 different breeze events that allow to highlight the breezes characteristics during contrasting background winds and different ABL thermodynamic vertical structure at both locations. The results indicate how the contrasting synoptic conditions lead to important differences in the variables observed near the surface. As an example, we show how the formation hour, the duration and the degree of impact on the surface variables of the daytime marine breezes display a totally different behaviour depending on the pre-existing synoptic conditions.

* The WINDABL project (PR2022-055) is a project to impulse the career of young researchers funded by the University of Cádiz (Spain) (Plan Propio). The field activities of this project were developed in collaboration with the MOSAI project (Model and Observation for Surface-Atmosphere Interactions, https://mosai.aeris-data.fr/)  and with the LATMOS-i project (Land-ATMOSphere interactions in a changing environment: How do they impact on atmospheric-boundary-layer processes at the meso, sub-meso and local scales in mountainous and coastal areas?) (PID2020-115321RB-I00, funded by MCIN/AEI/ 10.13039/501100011033).

How to cite: Román-Cascón, C., Jiménez-Rincón, J. A., Ortiz-Corral, P., and Yagüe, C. and the WINDABL team: Investigating the impact of the vertical structure of the atmospheric boundary layer and the surface heterogeneities on the development of the valley and coastal breezes (the WINDABL project)., EGU General Assembly 2024, Vienna, Austria, 14–19 Apr 2024, EGU24-17564, https://doi.org/10.5194/egusphere-egu24-17564, 2024.

EGU24-17882 | Orals | AS2.1

Evaporation driven by Atmospheric Boundary Layer Processes over a Shallow Salt-Water Lagoon in the Altiplano 

Oscar Hartogensis, Francisca Aguirre Correa, Francisco Suárez, Felipe Lobos-Roco, Reinder Ronda, and Jordi Vilà-Guerau de Arellano

The Chilean Altiplano is a region composed by endorheic basins immersed in a complex topography. These basins are predominantly characterized by desert surfaces in which small-scale heterogeneities can be found in the form of salt flats with shallow, salt water lagoons, that act as preferential pathways for evaporation (E). Thus, understanding the processes that control E in the lagoons is essential for water balance predictions, and to understand the impacts of climate change on the region.

In addition to the local saline lagoon and desert conditions, the atmospheric boundary layer (ABL) and its interaction with large-scale forcing, play a key role in regulating E. Observations over a salt water lagoon in the Salar del Huasco basin show that in the morning E is virtually zero, with turbulence as a limiting factor due to the absence of wind. Under these conditions, a shallow, stable ABL is formed over the water. In the afternoon, E is triggered by the entrance of a thermally driven and topographically enhanced regional flow characterized by strong winds. Simultaneously, the ABL turns into a deep mixed layer similar to the one observed over the surrounding desert.

In this research we investigate the coupling between the ABL and E drivers using a land atmosphere model, observations and a regional model. We also analyze the ABL interaction with the aerodynamic and radiative components of E using the Penman equation adapted to salt water. Our results demonstrate that the morning ABL is controlled by the local advection of warm air (∼5 Kh-1), resulting in a shallow (<350 m), stable ABL, with virtually no mixing and no E (<50 Wm−2). The warm air advection ultimately connects the ABL with the residual layer above, sharply increasing the ABL height by ∼1 km around midday. During the afternoon, the regional flow arrives to the lagoon, causing an increase in wind (∼12 ms-1) and an ABL collapse due to the entrance of cold air (∼-2 Kh-1) with a shallower ABL (∼-350 mh-1). The turbulence produced by the wind decreases the aerodynamic resistance and mixes the water body releasing the energy previously stored in the lagoon. The ABL feedback on E through the vapor pressure enables high E values (∼450 Wm-2). These results are exemplary to E of water bodies in semiarid conditions and emphasize the importance of understanding ABL processes when describing E drivers.

How to cite: Hartogensis, O., Aguirre Correa, F., Suárez, F., Lobos-Roco, F., Ronda, R., and Vilà-Guerau de Arellano, J.: Evaporation driven by Atmospheric Boundary Layer Processes over a Shallow Salt-Water Lagoon in the Altiplano, EGU General Assembly 2024, Vienna, Austria, 14–19 Apr 2024, EGU24-17882, https://doi.org/10.5194/egusphere-egu24-17882, 2024.

EGU24-18003 | Orals | AS2.1

Comparison of Wind profile models across the Ekman layer 

Cedrick Ansorge
Knowledge of the wind profile in the planetary boundary layer is key to many applications from wind power engineering via boundary-layer schemes in the atmosphere to PBL closure in large- and mesoscale models. In this presentation, we will present an account on existing, operational wind profile models against a novel representation of the wind vector across the Ekman layer. Our novel representation of the wind profiles is based on a consistent non-dimensionalization of the entire boundary layer down to the surface and thus takes into account rotational effects in vicinity to the bottom boundary. We compare our theory to both existing wind profile models and to data from direct numerical simulation up to Reτ~4000.

*This work is part of the project "trainABL" funded by the European Commission throgh the European Research Council (ERC) under its Starting Grant Scheme (ERC-2019-StG Grant No. 851374)

How to cite: Ansorge, C.: Comparison of Wind profile models across the Ekman layer, EGU General Assembly 2024, Vienna, Austria, 14–19 Apr 2024, EGU24-18003, https://doi.org/10.5194/egusphere-egu24-18003, 2024.

EGU24-18883 | Posters virtual | AS2.1

Evolution of the convective boundary layer in connection with land-atmosphere interactions at the Land Atmosphere Feedback Observatory in Stuttgart-Hohenheim 

Hans-Stefan Bauer, Kirsten Warrach-Sagi, Diego Lange, Syed Saglain Abbas, and Volker Wulfmeyer

The land surface strongly influences the evolution of turbulence in and the energy exchange with the planetary boundary layer (PBL). High-resolution model simulations provide detailed insights into the evolving processes.

We apply the WRF-NOAHMP model system in a nested configuration from the mesoscale (1.25 km) down to the LES scale (10 m). Driven by the ECMWF operational analysis, this setup allows high-resolution simulations with realistic lower boundary and meteorological forcing. A consistent set of physical parameterizations is applied through the whole chain of domains.

Applying this setup, the evolution of the planetary boundary layer and land-atmosphere (L-A) feedback were investigated in detail for a selected day around the Land-Atmosphere-Feedback Observatory (LAFO) in Hohenheim.

Apart from the evolution of the boundary layer at different horizontal resolutions, another focus is set on the derivation of turbulence variables and its comparison with data from lidar systems operated at the LAFO observatory on that day.

The comparisons revealed that the high-resolution simulations in turbulence-permitting and LES scale realistically represent the temporal and spatial evolution of the convective boundary layer including the transitions between the nighttime and daytime boundary layers. Time-height cross sections of turbulence variables and fluxes are compared with lidar data and first results are presented on the meeting.

How to cite: Bauer, H.-S., Warrach-Sagi, K., Lange, D., Abbas, S. S., and Wulfmeyer, V.: Evolution of the convective boundary layer in connection with land-atmosphere interactions at the Land Atmosphere Feedback Observatory in Stuttgart-Hohenheim, EGU General Assembly 2024, Vienna, Austria, 14–19 Apr 2024, EGU24-18883, https://doi.org/10.5194/egusphere-egu24-18883, 2024.

EGU24-20206 | ECS | Orals | AS2.1

Physical understanding of anisotropy in the Reynolds stress tensor of near-surface turbulence 

Federica Gucci, Lorenzo Giovannini, Samuele Mosso, Ivana Stiperski, Dino Zardi, and Nikki Vercauteren

Classical theories of atmospheric turbulence work well for isotropic turbulence. However, near the surface, as well as under strongly stable stratification, turbulence can be very anisotropic, due to the physical constraints of the ground and the buoyancy, respectively. This anisotropy has an impact on the mixing properties of turbulence, which need to be taken into account in parameterizations.

In atmospheric boundary-layer studies, turbulence anisotropy mainly refers to the difference in intensity of velocity fluctuations along different directions. This analysis can be performed along the principal directions of the Reynolds stress tensor. By doing so, a classification of turbulence according to its anisotropy, independent of the choice of the coordinate system where turbulence is measured, can be developed. This classification is an useful tool for improving current scaling relations of near-surface turbulence.

The present contribution focuses on the physical understanding of these different anisotropic states of turbulence, by exploring the possible sources which are driving  them. In addition, their relation with the variances and turbulent fluxes evaluated in the coordinate system commonly adopted in studies of near-surface turbulence is investigated. Special attention is given to results for stably stratified boundary layer, as under this condition the anisotropization of turbulence is considered one of the causes for poor performance of current parameterization at high Richardson number. 

How to cite: Gucci, F., Giovannini, L., Mosso, S., Stiperski, I., Zardi, D., and Vercauteren, N.: Physical understanding of anisotropy in the Reynolds stress tensor of near-surface turbulence, EGU General Assembly 2024, Vienna, Austria, 14–19 Apr 2024, EGU24-20206, https://doi.org/10.5194/egusphere-egu24-20206, 2024.

EGU24-4289 | ECS | Orals | AS2.2

Modelling of urban lake breeze circulation: the implications on urban heat island mitigation 

Qilong Zhong, Jiyun Song, Xiaoxue Wang, and Yuguo Li

Recent years have seen more intense and frequent heatwaves across the globe. Urban overheating phenomenon induced by global warming and urban heat island (UHI) effect has adverse impact on human health. In particular, compact high-rise cities witnessed worsened wind environment, exacerbating the UHI phenomenon. Blue space such as urban lakes may help mitigate the UHI effect and improve citizens’ living environment. Under weak synoptic wind conditions, the temperature difference between built-up areas and lakes can induce wind circulation, known as lake-breeze circulation (LBC). The LBC system can transport cool and fresh air from lake surfaces into built-up areas, reducing urban air temperature and improving urban wind environment, while increasing urban air humidity. In this study, we developed a multi-scale water-energy coupled CFD model to simulate the transport processes of heat and moisture between lake surfaces and built-up areas within the urban boundary layer. The model adopted a porous turbulence model to simulate the entire urban canopy layer, a lake evaporation model and a species transport model to simulate lake dynamics, and a coordinate transformation method to simulate the effect of the background atmosphere. The model features the capability of resolving dynamics of atmospheric temperature, humidity, and wind at both street canyon scale (1 m) and city scale (50 km) with relatively low computational costs. Based on this model, we conducted sensitivity analysis to investigate the impact of urban parameters (e.g., city scale, building height and density, anthropogenic activities) and lake parameters (e.g., lake scale and lake surface temperature) on the spatial variation of temperature, humidity, wind, and thermal comfort index. Our results can provide significant references for urban planning and city design for sake of UHI mitigation.

How to cite: Zhong, Q., Song, J., Wang, X., and Li, Y.: Modelling of urban lake breeze circulation: the implications on urban heat island mitigation, EGU General Assembly 2024, Vienna, Austria, 14–19 Apr 2024, EGU24-4289, https://doi.org/10.5194/egusphere-egu24-4289, 2024.

EGU24-4829 | ECS | Orals | AS2.2

A one-dimensional urban flow model with an Eddy-diffusivity Mass-flux (EDMF) scheme and refined turbulent transport (MLUCM v3.0) 

Jiachen Lu, Negin Nazarian, Melissa Hart, and Scott Krayenhoff

In recent years, urban canopy models (UCMs) have been used as fully coupled components of mesoscale atmospheric models as well as offline tools to estimate temperature and surface fluxes using atmospheric forcings. Examples include multi-layer urban canopy models (MLUCMs), where the vertical variability of turbulent fluxes is calculated by solving prognostic momentum and turbulent kinetic energy (TKE, $k$) equations using length scale ($l$) and drag parameterizations. These parameterizations are based on the well-established 1.5-order $k-l$ turbulence closure theory and are often informed by microscale fluid dynamics simulations. However, this approach can include simplifications such as the assumption of the same diffusion coefficient for momentum, TKE, and scalars. In addition, the dispersive stresses arising from spatially-averaged flow properties have been parameterized together with the turbulent fluxes while being controlled by different mechanisms. Both of these assumptions impact the quantification of turbulent exchange of flow properties and subsequent air temperature prediction in urban canopies. To assess these assumptions and improve corresponding parameterization, we conducted 49 large-eddy simulations (LES) for idealized urban arrays, encompassing variable building height distributions and a comprehensive range of urban densities ($\lambda_p\in[0.0625,0.64]$) seen in global cities. We find that the efficiency of turbulent transport (numerically described via diffusion coefficients) is similar for scalars and momentum but 3.5 times higher for TKE. Additionally, the parameterization of the dispersive momentum flux using the $k-l$ closure was a source of error, while scaling with the pressure gradient and urban morphological parameters appears more appropriate. In response to these findings, we propose two changes to MLUCM v2.0: (a) separate characterization for turbulent diffusion coefficient for momentum and TKE; and (b) introduction of an explicit physics-based "mass flux" term to represent the non-Gaussian component of the dispersive momentum transport as an amendment to the existing "eddy diffusivity" framework. The updated one-dimensional model, after being tuned for building height variability, is further compared against the original LES results and demonstrates improved performance in predicting vertical turbulent exchange in urban canopies.

How to cite: Lu, J., Nazarian, N., Hart, M., and Krayenhoff, S.: A one-dimensional urban flow model with an Eddy-diffusivity Mass-flux (EDMF) scheme and refined turbulent transport (MLUCM v3.0), EGU General Assembly 2024, Vienna, Austria, 14–19 Apr 2024, EGU24-4829, https://doi.org/10.5194/egusphere-egu24-4829, 2024.

EGU24-5608 | ECS | Orals | AS2.2

Impacts of urban development on the local weather: A comprehensive analysis from 1970 to 2020 in Madrid. 

Juan Carbone, Beatriz Sánchez, Carlos Román-Cascón, Alberto Martilli, Dominic Royé, and Carlos Yagüe

The proportion of the world’s population living in cities has increased from 37% to 56% over the last 50 years, and it is expected to continue rising further to 60% by 2030 (UN, 2022). As an essential effect of this evolution, urban land cover has expanded rapidly. In the case of Madrid, the increase in urban fraction during the period from 1970 to 2020 has been 20%. It is well known that urbanization reduces the vegetated cover and modifies surfaces properties altering the surface-atmosphere interactions and the different terms of the Surface Energy Balnace (SEB) compared to nearby rural areas. Therefore, analyzing the influence of these changes in urban land cover contributes to understand the potential risks that urban residents might face considering the urban grown and the expected temperatures increases, as this has adverse impacts on human health, livelihoods, and key urban infrastructure.

The aim of the present study is to examine the consequence of Madrid's urban growth on the near-surface air temperature and on the SEB. We conduct a modeling study using WRF-ARW with the multilayer urban parameterization BEP-BEM, in which the land use and the land cover have been modified according to urban expansion in Madrid and its surroundings from 1970 to 2020. Two scenarios of common meteorological conditions of special interest are selected for this study: a period of intense heatwave during the summer season and a short period of strongly stable atmospheric conditions in winter, both observed in 2020. The results show that in areas where the urban fraction become greater an increase in near-surface air temperature is found for both simulated periods, especially during the night, pointing out that the cooling rate decreases in urban areas. The growing of urban land cover over time also modifies the SEB and turbulent transport in Madrid and surroundings, leading to an increase in temperatures, specially for the minima ones.

How to cite: Carbone, J., Sánchez, B., Román-Cascón, C., Martilli, A., Royé, D., and Yagüe, C.: Impacts of urban development on the local weather: A comprehensive analysis from 1970 to 2020 in Madrid., EGU General Assembly 2024, Vienna, Austria, 14–19 Apr 2024, EGU24-5608, https://doi.org/10.5194/egusphere-egu24-5608, 2024.

EGU24-6308 | ECS | Orals | AS2.2

The Implementation of the BEP+BEM Offline Parameterization Scheme: Exploring Urban Dynamics through Climatic Projections 

Gianluca Pappaccogli, Andrea Zonato, Alberto Martilli, Riccardo Buccolieri, and Piero Lionello

As climate change continues to exert an impact on urban areas, the comprehension of its effects on the urban environment becomes crucial for sustainable urban planning. This study presents a novel approach employing the Building Effect Parameterization (BEP) coupled with a Building Energy Model (BEM) in an offline configuration to simulate urban climates. The multi-layer BEP+BEM model, properly describes the vertical arrangement of urban fabric, accounting for the distribution of heat, moisture, and momentum sources throughout the urban canopy layer. Additionally, energy consumption within buildings for both cooling and heating is estimated by the BEM, providing a comprehensive perspective on the urban energy balance. Coupled with a 1-D column model of urban canopy flow, the BEP+BEM offline model accurately estimates drag coefficients and turbulent length scales based on urban fabric characteristics. In the proposed version, the model has been extended to consider additional factors such as green areas and street trees, along with existing green roofs, photovoltaic panels and the permeability of urban materials. This expansion enhances the model's capability to assess the effectiveness of sustainable infrastructure in mitigating climate change effects on urban areas. In this study, the BEP+BEM scheme is forced by data from climate projections, allowing for the dynamic representation of various Local Climate Zones (LCZs) under distinct climatic conditions. Simulations in different LCZs and under different climatic conditions are compared to evaluate the impact of climate change on urban environment, enabling the exploration of how different urban areas respond to changing meteorological forcings. The sensitivity analysis includes a range of standard urban typologies (i.e. LCZs), capturing the complexity of interactions between the built environment and the atmosphere. This approach offers an assessment of the impacts of climate change on key urban phenomena, such as urban heat islands (UHI), thermal discomfort, and heightened energy consumption by buildings. The outcomes of this study provide valuable insights for the urban climate community, policymakers, and researchers with the aim of enhancing the resilience of cities in the face of a changing climate. By bridging the gap between climate projections and urban climate simulations, a consistent framework is presented in this work for evaluating and adapting various urban environments to future climatic conditions.

How to cite: Pappaccogli, G., Zonato, A., Martilli, A., Buccolieri, R., and Lionello, P.: The Implementation of the BEP+BEM Offline Parameterization Scheme: Exploring Urban Dynamics through Climatic Projections, EGU General Assembly 2024, Vienna, Austria, 14–19 Apr 2024, EGU24-6308, https://doi.org/10.5194/egusphere-egu24-6308, 2024.

EGU24-7011 | Orals | AS2.2

UrbanTALES: A comprehensive dataset of Urban Turbulent Airflow using systematic Large Eddy Simulations 

Negin Nazarian, Jiachen Lu, Melissa Hart, and E. Scott Krayenhoff

The urban canopy layer (UCL) is characterized by a heterogeneous flow pattern that responds to heterogeneous urban geometries. The varying heights and layouts of buildings play a pivotal role in shaping this spatial variability, as they block, divert, and slow wind and determine the exchange of momentum and energy above the urban canopy. When representing these complex dynamics, however, research has conventionally relied on microscale simulations conducted over limited (often idealized) building arrays. Extending the findings to realistic urban neighborhoods and urban parameterizations presents a clear limitation, as evidenced by discrepancies in multi-model comparisons with observational data in cities.

More extensive datasets of urban airflow are needed to cover a range of realistic urban neighborhoods and provide a more holistic analysis of turbulent flow in different urban characteristics. Responding to this gap in the field, we developed a historically extensive and comprehensive dataset of Urban Turbulent Airflow based on state-of-the-art  Large Eddy Simulations (UrbanTALES). The dataset includes 400 urban layouts with both idealized and realistic configurations. Realistic urban neighborhoods were obtained from major cities worldwide, incorporating variations in plan area densities [0.0625-0.64] and height distributions [4-70m]. Idealized urban arrays, on the other hand, include two commonly studied configurations (aligned and staggered arrays), featuring both uniform and variable height scenarios along with oblique wind directions. 

UrbanTALES offers canopy-averaged data as well as 2D and 3D flow fields tailored for different applications in urban climate research. The dataset provides time-averaged wind flow properties, as well as second- and third-order flow moments that are critical for understanding turbulent processes in the UCL. Here, we describe the UrbanTALES dataset and its application, noting the unique opportunity to deploy a comprehensive representation of realistic urban neighborhoods for a) revisiting neighborhood-scale urban canopy parameterizations in various models and b) informing in-canopy flow and turbulent analyses. Furthermore, we discuss the application of this dataset for training Machine Learning algorithms for pedestrian wind speed. 

How to cite: Nazarian, N., Lu, J., Hart, M., and Krayenhoff, E. S.: UrbanTALES: A comprehensive dataset of Urban Turbulent Airflow using systematic Large Eddy Simulations, EGU General Assembly 2024, Vienna, Austria, 14–19 Apr 2024, EGU24-7011, https://doi.org/10.5194/egusphere-egu24-7011, 2024.

EGU24-7970 | ECS | Posters on site | AS2.2

Can urban heating inadvertently induce urban cooling? 

Klaas Laan and Dilia Kool

EGU24-7970

Can urban heating inadvertently induce urban cooling?

Klaas Laan and Dilia Kool


Cities are getting hotter—and will continue to get hotter with projected climate change and increases in urbanization. However, is it possible that rising temperatures present an opportunity for enhanced evaporative cooling? Evaporative cooling generally increases linearly with an increase in the vegetative fraction. But it is also well documented that this linearity breaks down at a certain point, and that as the vegetation becomes denser, the relative increase in evapotranspiration becomes more marginal. One possible explanation is the known phenomenon that lateral heat advection enhances evapotranspiration from “scattered” or “patchy” vegetation. Lateral heat advection occurs when there is a large temperature contrast between hot, non-vegetated surfaces and much cooler vegetated surfaces. Lateral heat advection is expected to be larger at lower vegetation fractions (more source areas) and in climates that have more extreme temperatures (arid regions, future climate change-affected areas (?)). We expect that potential evaporation per unit area, enhanced by lateral heat advection, will be inversely proportional to the vegetation fraction. Thus, higher temperatures and lower vegetation fractions would result in higher evaporative cooling per unit vegetated area. This, then, could explain the non-linear relationship between evaporative cooling and vegetation fraction.

We here present a novel analysis of the dynamics of potential and actual evapotranspiration as a function of vegetation fraction using an existing urban energy balance dataset for 13 locations representing a range of climate conditions (Lipson et al., 2022; doi 10.5194/essd-14-5157-2022). A separate assessment of the horizontal component of potential evaporation and its potential implications for enhanced evaporation sheds light on whether urban heating could, to some extent, induce urban cooling.

How to cite: Laan, K. and Kool, D.: Can urban heating inadvertently induce urban cooling?, EGU General Assembly 2024, Vienna, Austria, 14–19 Apr 2024, EGU24-7970, https://doi.org/10.5194/egusphere-egu24-7970, 2024.

EGU24-13329 | Posters on site | AS2.2

A Versatile Reduced Order Model of Urban Boundary Layer Dynamics in the Center of Paris 

Konstantin Kuznetsov, Paul Sylvestre, Pavel Litvinov, Oleg Dubovik, and David Fuertes

The computational demands of Computational Fluid Dynamics (CFD) often limit its real-time or large-scale applications, particularly in scenarios requiring multiple simulations based on varying input parameters. This study introduces a surrogate reduced order model (ROM) that not only addresses the computational challenges of CFD but also underscores its potential for broad applicability.

We focus on the dynamics of the Urban Boundary Layer (UBL), a key factor in understanding urban microclimates and their impact on energy consumption, thermal comfort, and local weather phenomena. Using a representative urban test case from the city center of Paris, we illustrate the effectiveness of our approach. During the offline phase, the ROM is constructed by assembling a database of Dynamic Mode Decomposition (DMD) modes [1] associated with various aspects of UBL dynamics, such as temperature distribution, wind patterns, and turbulence characteristics. These modes are determined based on a set of meteorological conditions defined through k-means clustering analysis. During the online phase, we interpolate these DMD modes from the database, enabling us to determine the dynamic characteristics of the UBL within the domain without initiating computationally intensive code_saturne calculations.

Our validation for the UBL dynamics in central Paris indicates that the online phase can achieve a Normalized Root Mean Square Error (NRMSE) of 2-8%. A distinctive aspect of our approach is the incorporation of DMD during the code_saturne computation process. Some modifications of DMD can be seamlessly integrated into numerous code_saturne simulations, harnessing the advantages of DMD with minimal computational trade-offs. This ROM approach offers a promising tool for urban climate studies, urban planning, and environmental management, providing a more efficient means to simulate and understand the complex dynamics of the Urban Boundary Layer.

How to cite: Kuznetsov, K., Sylvestre, P., Litvinov, P., Dubovik, O., and Fuertes, D.: A Versatile Reduced Order Model of Urban Boundary Layer Dynamics in the Center of Paris, EGU General Assembly 2024, Vienna, Austria, 14–19 Apr 2024, EGU24-13329, https://doi.org/10.5194/egusphere-egu24-13329, 2024.

EGU24-15662 | ECS | Posters on site | AS2.2

How does urbanization shape the record-breaking temperatures in Izmir, Turkey ? 

Fatma Başak Saka and Yurdanur Unal

The urban heat island effect, denoting the temperature difference between urban and rural areas, has become more widely recognized due to the increasing urbanization over the years. Recent studies related to the urban heat island effect mainly focus on changes in atmospheric changes and their role in triggering significant weather phenomena. Understanding these dynamics is crucial for making future projections. This research is motivated by the need to understand how the urban heat island intensity affects the boundary layer and temperature structure of İzmir, Türkiye during a record-breaking temperature period, in July 2023.  Temperatures in the Aegion region for July 2023 are above season normals of the 1991-2020 period by 1.7ºC. To investigate how urbanization contributed to the temperature changes the chosen timeframe is modeled using the Weather Research and Forecasting (WRF) Model (version 4.3). To enhance spatial resolution, we integrated the Coordination of Information on the Environment (CORINE) land cover data into the model, employing a nested domain setup ranging from outer to inner domains with resolutions of 9-3-1 km. ERA5 Reanalysis was chosen as the initial condition to force the model throughout the selected period. Following the simulations using the parameterizations set optimized for the Izmir region in July 2023, the obtained results were scrutinized through a comparison with data from meteorological observation stations to analyze the accuracy and performance of the simulations.    Then, to examine how urban areas affect atmospheric behavior under record-breaking conditions, atmospheric conditions of  July 2003 were simulated by utilizing the same parameterizations and boundary conditions with altered land use categories.   The urban land-use categories within the domain were changed to the most dominant rural land-use category.   In evaluating the city's influence on record-breaking temperatures, the analysis focused on changes in the atmospheric boundary layer and its associated parameters by comparing the simulations with urbanizations and without urbanization in İzmir.

How to cite: Saka, F. B. and Unal, Y.: How does urbanization shape the record-breaking temperatures in Izmir, Turkey ?, EGU General Assembly 2024, Vienna, Austria, 14–19 Apr 2024, EGU24-15662, https://doi.org/10.5194/egusphere-egu24-15662, 2024.

EGU24-16346 | ECS | Posters on site | AS2.2

Urban roughness sublayer characteristics: sensitivity to planetary boundary layer schemes and multi-layer urban models 

Wanliang Zhang, Jimmy Chi Hung Fung, and Mau Fung Michael Wong

The Pearl River Delta (PRD) region in China is characterized by a large fraction of urbanized areas of which the growth rate is unprecedented. Modelling a realistic meteorological field for such a region is challenging mainly due to the uncertainties in the meso-scale numerical model, and the paucity of high-resolution profiler-type observations. In this study, we aim to improve the understanding of the urban effects on the modelled meteorological field in the PRD region by applying different fine-tuned planetary boundary layer (PBL) schemes coupled with two multi-layer urban models and leveraging the high spatial-temporal wind LiDAR observations. Particularly, the momentum in the urban roughness sublayer (RSL, about three times the building height) will be thoroughly investigated using long-lasting profiler-type observations.

The Weather Research and Forecast (WRF) model offers a variety of PBL schemes which may feature a non-local transport algorithm under unstable atmospheric conditions. Most PBL schemes utilize the surface layer fluxes calculated based on the Monin-Obukhov similarity theory, acting on the first model layer only. Although this bulk parameterization of surface layer fluxes is appropriate for urban areas occupied predominantly by low-rise buildings, it is unable to reflect the momentum drag and thermal exchange processes when the average building height (H) within a model cell greatly exceeds the height of the lowest model. Multi-layer urban models, Building Effects Parameterization (BEP), and Building Energy Model (BEM) can be coupled with PBL schemes to provide a more realistic interaction between buildings and air within the RSL. Required input for initializing the multi-layer urban models include H and average street width, which can be simply prescribed (assumed) or derived from the local climate zones.

Despite many efforts have been made to study the improvements by urban models on the surface meteorological variables, such as 10-m wind speed, 2-m temperature and moisture, little investigation of modelled results has been carried out focusing on the RSL and the entire boundary layer over a long-time series due to scarce observations. Recently, three wind LiDAR units were deployed in Hong Kong, providing us with a valuable opportunity to monitor wind profile evolution continuously at a 25-m and 1-hr resolution and to reveal the transport of surface layer fluxes to the overlying RSL.  In the result section, we first present the wind speed profiles to understand the benefits of a multi-layer urban model compared to the bulk parameterization, justified by the LiDAR observations. Secondly, as the non-local PBL scheme can transport the surface fluxes to non-adjacent cells, a comparison of the momentum flux profile will be presented between local and non-local PBL schemes under different stabilities.

How to cite: Zhang, W., Fung, J. C. H., and Wong, M. F. M.: Urban roughness sublayer characteristics: sensitivity to planetary boundary layer schemes and multi-layer urban models, EGU General Assembly 2024, Vienna, Austria, 14–19 Apr 2024, EGU24-16346, https://doi.org/10.5194/egusphere-egu24-16346, 2024.

EGU24-16420 | Orals | AS2.2

Representing mean wind speed profile over urban canopy with building height variability 

Keisuke Nakao, Hideki Kikumoto, Hiroshi Takimoto, Jia Hongyuan, and Wang Xiang

 The horizontal mean wind speed profile in vertical direction within and above urban canopy (UC) is an essential information to drive the exchange of momentum, heat, moisture and pollutants in atmosphere. Well-known profiles in logarithmic and exponential layers, which express upper and lower wind over UC, respectively, are efficient assumptions used to express UC wind profile.

 This study attempted to add the intermediate layer (IL) between those two-layers to include the effect of building height variability on the mean wind speed profile. Large-eddy simulations (LESs) of UC with building height variability were conducted using a wide range of morphology parameters, that is, plan area index, aspect ratio, and the standard deviation of building height.

 A tendency of the bulk drag coefficient of the IL was expressed by the plan area index and the frontal area index at the intermediate layer. The wind speed at IL was modeled linearly by the length- and velocity-scale analysis. By parameterizing the coefficients of these three layers, we attempted to analytically represent an entire wind speed profile by the three-layer wind profiles. The results indicated reasonable consistency in the wind speeds at mean building height and the momentum flux with LES data. Effect of the thermal stratification was investigated by the correction of the length-scale in IL.

How to cite: Nakao, K., Kikumoto, H., Takimoto, H., Hongyuan, J., and Xiang, W.: Representing mean wind speed profile over urban canopy with building height variability, EGU General Assembly 2024, Vienna, Austria, 14–19 Apr 2024, EGU24-16420, https://doi.org/10.5194/egusphere-egu24-16420, 2024.

EGU24-16891 | ECS | Orals | AS2.2

A systematic investigation of urban modifications of mixed layer height and cloud cover in Berlin, Germany 

Daniel Fenner, Andreas Christen, Russell Glazer, Sue Grimmond, Simone Kotthaus, Dana Looschelders, Fred Meier, William Morrison, and Matthias Zeeman

In order to better understand how urban areas modify the regional atmospheric boundary layer (ABL) and to improve and evaluate weather and climate models for urban applications and services, detailed ABL observations are needed. With new instrument technologies and advanced automatic algorithms for detection of aerosols, mixed-layer height (MLH) and boundary-layer clouds, ground-based remote sensing instruments are increasingly used in urban observational networks.

During a one-year measurement campaign in Berlin, Germany (urbisphere-Berlin, Autumn 2021 – Autumn 2022), a variety of ground-based ABL observations were carried out in the greater Berlin region. Berlin as an isolated continental city with approximately 3.8 million inhabitants provides a fairly homogeneous rural background. The urbisphere network included five inner-city, six outer-city and 14 rural sites equipped with continuously-operated Automatic Lidar and Ceilometers (ALC). The measurement network was designed and set up in a systematic and rigorous manner in order to capture intra-urban, urban-rural, and upwind-city-downwind effects of MLH, cloud-base height (CBH), and cloud cover fraction (CCF) along several transects as air masses move over the city. Based on the ALC observations, MLH, CBH and CCF were automatically derived. ALC observations are complemented by measurements of wind and temperature profiles over the city using Doppler-Wind Lidars and radiosondes concurrently released in urban and rural locations during selected days. Surface heat fluxes are continuously measured with six eddy-covariance flux towers and seven path-averaging scintillometers in urban and rural settings.

This contribution highlights the scientific considerations of the systematic measurement network design and the corresponding data analysis. We are proposing a scheme of attributing measurements to rings around the city centre representing the inner city (radius of 6 km), the outer city (radius of 18 km) and rural areas (radius of 90 km), further separated into upwind, downwind and other sectors. A detailed statistical analysis of the year-long dataset finds differences in MLH, CBH and CCF during different seasons and under different weather forcings. Selected case-study days are analysed in more detail to understand the processes controlling the interactions between surface fluxes and mixed-layer dynamics. These days are further used to evaluate the forecasting skill of hectometric dynamical-modelling runs with regard to ABL dynamics, quantifying also the sensitivity of ABL dynamics in the model to surface representation (e.g. soil moisture, heat flux partitioning).

How to cite: Fenner, D., Christen, A., Glazer, R., Grimmond, S., Kotthaus, S., Looschelders, D., Meier, F., Morrison, W., and Zeeman, M.: A systematic investigation of urban modifications of mixed layer height and cloud cover in Berlin, Germany, EGU General Assembly 2024, Vienna, Austria, 14–19 Apr 2024, EGU24-16891, https://doi.org/10.5194/egusphere-egu24-16891, 2024.

EGU24-17628 | ECS | Posters on site | AS2.2

Large-Eddy Simulations of Methane Dispersion at the Utrecht University Campus 

Steven van der Linden, Judith Tettenborn, Thomas Röckmann, Stephan de Roode, and Bas van de Wiel

Last June 2023 a controlled release experiment (CRE) of methane was conducted at the campus of the Utrecht University, the Netherlands, with the aim of improving models for emission quantification. The methane was released at different flow rates and subsequently measured in the local area (along closed paths of approximately 500 m length) using vehicle mounted sensors. In addition, several wind sensors were deployed at approximately 35 meters distance of the release location covering the dominant flow pathways between the buildings.

Although the setup enables us to relate the variability in wind direction and concentration peaks in the direct vicinity of the release, the limited spatial extent of the setup still makes it challenging to determine the dispersion of methane on the larger campus scale. Therefore, we explore the possibility to use meter-scale Large-Eddy Simulations (LES) in which the flow around the buildings is explicitly resolved with an immersed boundary method. With this approach, we aim to provide detailed information on the dispersion of methane ranging from the street-level to the campus scale.

Here, we will show the first results of our simulations and a comparison with the observations. The controlled release experiment and wind measurements serve as validation for the LES, with the LES ideally reproducing the observed concentrations and wind directions in a statistical sense. We will discuss the model complexity required to accurately model observed dispersion features and look at the dependence of this result to changes in model setup. For example, how the model result changes with respect to a change in the prescription of large-scale meteorological conditions.

Such validated urban LES may in the future be used not only for forward-in-time prediction of pollutant concentrations but also for inverse modelling to estimate the location of pollutant release, when only a limited number of observations are available.

How to cite: van der Linden, S., Tettenborn, J., Röckmann, T., de Roode, S., and van de Wiel, B.: Large-Eddy Simulations of Methane Dispersion at the Utrecht University Campus, EGU General Assembly 2024, Vienna, Austria, 14–19 Apr 2024, EGU24-17628, https://doi.org/10.5194/egusphere-egu24-17628, 2024.

EGU24-17845 | Orals | AS2.2

Can a city modify a severe convective windstorm? 

Francesco De Martin, Andrea Zonato, and Silvana Di Sabatino

It is well known that cities can modify the rainfall distributions, in particular deep moist convection is more frequently triggered over and downwind urban areas. However, the effect of cities on the most extreme convective events, such as hailstorms, downbursts or tornadoes, is poorly studied. This topic needs further investigation since exposure and vulnerability to severe storm risk is larger in cities than in the surrounding rural area. What happens if a severe convective windstorm impacts a big city? Is the storm modified by the urban land use?

Our analysis focuses on a case study that occurred on 25 July 2023, when a nocturnal downburst affected the city of Milan, in northern Italy, with measured wind gusts up to 30 m/s. The intense wind gusts downed many trees in the public parks and over the streets, blocking urban mobility. The event is investigated in depth using both observations and high-resolution numerical simulations performed with the WRF model.

Observations show that a UHI over Milan before the storm was negligible, while there was a drier air mass over the city than over the surrounding rural area. Consequently, a pool with low values of equivalent potential temperature (theta-e), a quantity that strongly influences deep moist convection, was present over the city.

Four nested WRF simulations are carried out with grid resolution from 9 km up to 333 m, and 64 vertical levels starting from 5m AGL. Two different boundary layer parametrizations are tested, namely MYJ and BouLac schemes, as well as two different microphysics schemes: Thompson and WRF Single-moment 6-class. Moreover, simulations with bulk urban parametrizations are compared with those coupled with the building effect parameterization and the building energy model (BEP-BEM), employing data of the World Urban Database and Access Portal Tools (WUDAPT).  Simulations without the urban land use (no-urban) are carried out to test the effect of the Milan urban area on the convective storm. Results of all these simulations are compared with surface observations and radar data. The simulations have a similar skill, with slightly better results using the BouLac scheme coupled with BEP-BEM. Simulations using urban parametrizations are able to reproduce the pre-storm pool with low theta-e values over Milan, while no-urban simulations do not simulate the low theta-e pool.

All WRF simulations accurately reproduce the violent windstorm, both in terms of simulated wind gusts, rainfalls and radar reflectivity. Removing the city, stronger wind gusts are simulated at the surface due to the significantly reduced drag. However, rainfalls are slightly intensified downwind of the city, as well as the drop of potential temperatures associated with the downdrafts.

In conclusion, the urban canopy may have prevented the development of even more violent wind gusts in the city, due to the increased surface roughness. On the other hand, despite the presence of a pool of low theta-e values, the storm likely intensified downwind the city. A possible motivation to that intensification will be proposed in the presentation. 

How to cite: De Martin, F., Zonato, A., and Di Sabatino, S.: Can a city modify a severe convective windstorm?, EGU General Assembly 2024, Vienna, Austria, 14–19 Apr 2024, EGU24-17845, https://doi.org/10.5194/egusphere-egu24-17845, 2024.

EGU24-18040 | Orals | AS2.2

Linking synoptic flow and city dynamics: PANAME observations of the Paris urban boundary layer   

Simone Kotthaus, Martial Haeffelin, Jonnathan Céspedes, Jean-François Ribaud, Jean-Charles Dupont, Marc-Antoine Drouin, Pauline Martinet, and Aude Lemonsu

Atmospheric boundary layer dynamics form in response to synoptic flow and surface-atmosphere exchanges. Over cities, the complex roughness and additional heat from storage and anthropogenic emissions clearly affect atmospheric stability, with implications for heat risk and pollution dispersion. This work examines how the specific dynamics of the Paris region urban atmosphere interact with the synoptic flow using observations from a dense measurement network.

The interdisciplinary PANAME initiative is a framework coordinating the synergy of numerous projects that are studying the Paris atmosphere using both numerical modelling at various scales and novel observations. The measurement network not only includes dense surface station measurements and turbulent flux towers, but also ground-based atmospheric profile remote sensing and additional radiosonde measurements within the city. This work exploits observations from automatic lidars and ceilometers (ALC), Doppler wind lidars (DWL), and microwave radiometers (MWR) that are operated along a suburban-urban transect to collect simultaneous profiles of air temperature, wind, turbulence, and aerosol characteristics at high vertical and temporal resolution. The continuous observations from a network of compact ground-based remote sensing instruments are shown to be extremely valuable for an improved understanding of the complex processes that govern the urban atmosphere as they are highly variable in space and time.

The complex dynamics of the urban atmospheric boundary layer are explored through advanced measurement products, such as low-level jet characteristics and mixed layer heights. We evaluate how different indicators of atmospheric stability from synergy of multiple remote sensing profile data can portray the spatial and temporal variations in urban boundary layer dynamics. The work highlights the importance of atmospheric boundary layer dynamics as a crucial driver for near-surface conditions.

How to cite: Kotthaus, S., Haeffelin, M., Céspedes, J., Ribaud, J.-F., Dupont, J.-C., Drouin, M.-A., Martinet, P., and Lemonsu, A.: Linking synoptic flow and city dynamics: PANAME observations of the Paris urban boundary layer  , EGU General Assembly 2024, Vienna, Austria, 14–19 Apr 2024, EGU24-18040, https://doi.org/10.5194/egusphere-egu24-18040, 2024.

EGU24-18319 | ECS | Orals | AS2.2

Wind tunnel study on the influence of vegetation density and wind direction on urban canyon ventilation 

Annika Vittoria Del Ponte, Sofia Fellini, Massimo Marro, Pietro Salizzoni, and Luca Ridolfi

Inserting vegetation within the urban environment mitigates the urban heat island effect, the flooding risk, and improves air quality. However, its aerodynamic effect has remarkable impact on the pollutant transport and, consequently, on human health comfort. Indeed, the presence of vegetation within an urban canyon leads to non-trivial patterns of pollutant concentration and mass fluxes, as a consequence of complex mean and turbulent velocity fields. In addition to the vegetation density, the flow structure within canyons is influenced by their geometry and by the wind direction.

   The aim of the present study is to experimentally investigate the velocity field within a canyon, varying the vegetation density and the wind direction. We measured flow velocity statistics within an indefinitely long street canyon, with unit height-to-width ratio, subject to a neutrally stratified boundary layer modeled in the wind tunnel of École Centrale de Lyon. The aerodynamic impact of vegetation was reproduced by inserting plastic miniatures of trees along the two long sides of the canyon. We considered an empty canyon and a vegetated canyon, whose longitudinal axes are oriented with angles of 0°, 30°, and 60° with respect to the external wind flow.

  Results reveal that when the canyon is inclined with respect to the external wind direction the mean flow follows a complex helicoidal structure. The presence of trees decreases significantly the mean longitudinal velocity and weakens the transversal circulation in the inclined canyon. The dampening effect of the mean longitudinal flow is more marked increasing the inclination angle of the canyon. Turbulent fluctuations are enhanced above the tree crowns, mostly when the wind blows parallel to the canyon axis. On the contrary, turbulent fluctuations decreases at tree trunk and crown levels, in particular when the canyon is inclined of 60° with respect to the external wind direction. Spectra of the velocity signal show that the presence of trees induces an evident shift of the energy peak towards high frequencies.

  The collected data constitute a step forward to understand and modeling the urban microclimate.

How to cite: Del Ponte, A. V., Fellini, S., Marro, M., Salizzoni, P., and Ridolfi, L.: Wind tunnel study on the influence of vegetation density and wind direction on urban canyon ventilation, EGU General Assembly 2024, Vienna, Austria, 14–19 Apr 2024, EGU24-18319, https://doi.org/10.5194/egusphere-egu24-18319, 2024.

In this work, various very-high-resolution simulations with the Harmonie-AROME Numerical Weather Prediction (NWP) model are performed for the city of Paris during an intense heatwave event in the summer of 2022, to evaluate the capability of the model to reproduce real conditions, at various resolutions and incorporating different kinds of landuse and urban morphology types.


In particular, simulations are performed using ECWMF operational forecasts at 9 km resolution as boundary conditions, for the operational 2.5 km runs. Moreover, two 500 m and 100 m resolution domains have been one-way nested in the parent one.

For considering the impact of urban areas, the state-of-the-art urban canopy parameterization Town Energy Balance (TEB, Masson et al., 2000), has been employed within the modeling system, and its single-layer and multi-layer options have been compared to evaluate the improvements brought by the multi-layer capability.


To test the impact of various urban morphologies, simulations have been run with 1) the default ECOCLIMAP-SG landuse at 300-meter resolution, which considers urban areas as 10 different categories, derived from the WUDAPT Local Climate Zones Classification, and 2) the Geoclimate urban morphology at 100-meter resolution, derived from the Open Street Map (OSM) database (Bernard et al., 2022). The latter employs the Open Street Map database to estimate close-to-reality urban geometries, with the help of a random forest technique to estimate missing building heights in the dataset.


The comparison with 79  in-situ observations shows that all the simulations are able to currently represent urban air temperature trends for homogeneous areas, such as the Paris city center and compact homogeneous areas. 

On the other hand, heterogeneous and scattered urban areas temperatures are not well represented by both higher-resolution simulations and the category-based ECOCLIMAP-SG landuse.On the contrary, the OSM-based landuse is sensible to city heterogeneity and horizontal variability.

 Considering the 100-m simulations, it is clear that category-based land uses are not suitable for very-high-resolution urban canopy layer simulations, since they cannot truly capture the neighborhood-scale variation within the same city.

For this reason, it is important, with increasing NWP resolution, to employ suitable landuse datasets, coherent with the employed horizontal resolution and applicable physical parameterizations.

How to cite: Zonato, A. and Theeuwes, N.: Very-high-resolution simulations with Harmonie-AROME of a heatwave case for the city of Pari with different landuse datasets., EGU General Assembly 2024, Vienna, Austria, 14–19 Apr 2024, EGU24-18500, https://doi.org/10.5194/egusphere-egu24-18500, 2024.

EGU24-18976 | ECS | Posters on site | AS2.2

Integrating Airborne LiDAR Data into Urban Flow Models: A Focus on Buildings and Trees 

Dana Lüdemann, Niels Troldborg, Jan Pehrsson, and Ebba Dellwik

Airborne LiDARs can provide updated and highly accurate information of the 3D urban layer. This presentation focuses on transforming such information into boundary conditions for urban flow models.

When addressing buildings, we use a method called City3D [1], which outputs a watertight geometrical model at a specified level of detail (LoD).This resulting model is then utilized in the computational fluid dynamics (CFD) solver EllipSys [2]. We demonstrate how a novel implementation of the immersed boundary method (IBM) [3] simulates the wind flow and dispersion around the building. Additionally, we explore how different LoD
influence the simulation results.

The LiDAR data can also be used to model the drag force of trees. We demonstrate this process based on recent observations of a real tree. Finally, we discuss the relative importance of trees and buildings in an urban modelling context, highlighting the significance of including more details in the 3D urban layer.

References
[1] Jin Huang, Jantien Stoter, Ravi Peters, and Liangliang Nan. City3d: Large-scale building reconstruction from airborne lidar point clouds. Remote Sensing, 14(9), 2022.
[2] Jess A. Michelsen. Basis3D - a Platform for Development of Multiblock PDE Solvers: - release, volume AFM 92-05. Technical University of Denmark, 1992.
[3] Niels Troldborg, Niels N. Sørensen, and Frederik Zahle. Immersed boundary method for the incompressible reynolds averaged navier–stokes equations. Computers Fluids, 237:105340, 2022.

How to cite: Lüdemann, D., Troldborg, N., Pehrsson, J., and Dellwik, E.: Integrating Airborne LiDAR Data into Urban Flow Models: A Focus on Buildings and Trees, EGU General Assembly 2024, Vienna, Austria, 14–19 Apr 2024, EGU24-18976, https://doi.org/10.5194/egusphere-egu24-18976, 2024.

EGU24-19930 | Posters on site | AS2.2

Modelling the urban heat island in Birmingham, UK at the neighbourhood scale  

Jian Zhong, Yanzhi Lu, Jenny Stocker, Victoria Hamilton, and Kate Johnson

Cities have higher peak temperatures compared to surrounding rural areas. The urban-rural surface air temperature difference is known as the urban heat island (UHI). As extreme heat exposure can lead to adverse health effects, information on UHI characteristics of cities is important for future urban climate planning strategies. This study applied the ADMS-Urban Temperature and Humidity model to investigate the key processes driving the UHI in Birmingham, UK, at the neighbourhood scale. This model was configured with a range of input datasets (such as meteorological data, landuse data, building data, anthropogenic heat sources etc) and run on the University of Birmingham’s BlueBEAR HPC. This urban climate modelling was evaluated against the temperature measurement datasets from UK Met Office and Weather Underground. The spatiotemporal variations of surface air temperature in Birmingham, UK were captured by this model. This modelling study can be further applied to explore the impacts of local urban head island mitigation strategies.

How to cite: Zhong, J., Lu, Y., Stocker, J., Hamilton, V., and Johnson, K.: Modelling the urban heat island in Birmingham, UK at the neighbourhood scale , EGU General Assembly 2024, Vienna, Austria, 14–19 Apr 2024, EGU24-19930, https://doi.org/10.5194/egusphere-egu24-19930, 2024.

EGU24-20040 | Posters on site | AS2.2

Dynamics and spatial distribution of air pollution over Minsk, Belarus as revealed by mesoscale and high-resolution urban WRF-Chem modelling 

Siarhei Barodka, Ilya Bruchkouski, Nikita Kasushkin, Tsimafei Schlender, Piotr Silkov, and Tatiana Tabalchuk

This study is devoted to simulation of the Urban Pollution Island (UPI) phenomena over the urban territory of Minsk, Belarus and its surrounding area. We aim at recreating the common features of the air pollution spatial distribution and its time evolution on diurnal, week-long and seasonal scales. For that purpose we utilize WRF-Chem modelling system in nested runs using BEP/BEM urban parametrization schemes for the innermost high-resolution domains (500 m, 300 m, 100 m grid step). We employ two different approaches to urban morphology representation in the model (the Local Climate Zones methodology and direct representation of some of the urban parameters on the given model grid) and use ML-processed Open Street Maps (OSM) vector data and available remote sensing data to represent land use / land cover, buildings and streets parameters for Minsk urban territory and the surrounding area. A series of model runs is performed for time periods with various cases of meteorological conditions in different seasons of recent years. Anthropogenic emissions are specified for the Minsk area as several point sources (representing industrial emissions) and distributed sources over a network of main street and roads (representing vehicle emissions). By proceeding from national statistical data with estimates of main sources of atmospheric pollution in Belarus over the recent years, we formulate hypothetical distributions of emissions intensity over the specified sources and its temporal dynamics with diurnal and weekly cycles. Simulation results obtained with different configurations of the model, different weather conditions and different emission scenarios are compared to available observations: satellite remote sensing data, ground-based observations of air quality and meteorological parameters, vertical profiles of atmospheric pollution and meteorological parameters retrieved from MAX-DOAS and sodar observations.

How to cite: Barodka, S., Bruchkouski, I., Kasushkin, N., Schlender, T., Silkov, P., and Tabalchuk, T.: Dynamics and spatial distribution of air pollution over Minsk, Belarus as revealed by mesoscale and high-resolution urban WRF-Chem modelling, EGU General Assembly 2024, Vienna, Austria, 14–19 Apr 2024, EGU24-20040, https://doi.org/10.5194/egusphere-egu24-20040, 2024.

EGU24-579 | ECS | Posters on site | AS2.4

Meteorological and Soil Moisture Measurements in Mount Kenya Region at Various Scales 

Peter K. Musyimi, Balázs Székely, Hellen W. Kamiri, Tom Ouna, and Tamás Weidinger

The optimal solution for solving many uncertainties associated with weather and climate data is accurate field measurement. This enhances various climate services that can be offered to different sectoral case studies and solve societal weather-related challenges by ensuring the obstacles are overcome amicably, for instance, climate adaptation barriers in the face of climate variability. The main goal of our study was to make long-term meteorological measurements in Mount Kenya region rainforest biome at an elevation of 1998 m above sea level (Karatina University weather station) and 3055 m above sea level (Mount Kenya field station) used at various scales from 2022. We are using Temperature-Moisture-Sensor (TMS) burial (1 m) and TMS Long (45 cm) soil sensors as well as temperature/relative humidity data loggers. These devices provide us with crucial data and reshape field measurement campaigns in data-scarce regions of Kenya. The soil moisture sensors also measure soil temperature, surface, and air temperature. The soil moisture data and temperature at various scales is acquired at an interval of 10 minutes while the data logger records data at an interval of 30 minutes.  Another key goal was to acquire soil moisture data at tropical rainforest biome which is scarce as well as relative humidity and temperature. The objectives of the study are to analyze reference evapotranspiration and estimation of real evapotranspiration in humid Mount Kenya climatic region, Nyeri County; compare climate parameters in two different elevations; to understand microclimatic changes associated with varying elevations and ensure data quality control in analysis by checking uncertainties and sensitivities associated with ERA5 reanalysis, synoptic (GFS/ECMWF) and station datasets. Therefore, to narrow the gap between missing data, uncertainties, and quality control of data, meteorological field measurements cannot be misconstrued.

Keywords: data loggers, field measurement, soil moisture, quality control, Kenya,

How to cite: Musyimi, P. K., Székely, B., Kamiri, H. W., Ouna, T., and Weidinger, T.: Meteorological and Soil Moisture Measurements in Mount Kenya Region at Various Scales, EGU General Assembly 2024, Vienna, Austria, 14–19 Apr 2024, EGU24-579, https://doi.org/10.5194/egusphere-egu24-579, 2024.

The impact of increasing CO2 on global temperature and strengthening of the greenhouse effect makes the measurements of gas exchange between the Earth’s surface and the atmosphere particularly important. Observational data on greenhouse gases exchange between different types of ecosystem and the atmosphere are crucial in thorough understanding the global climate mechanisms. Fruit tree ecosystems constitute an important kind of land use in Central Europe and apple is very extensively cultivated fruit tree crop in the world. Because intensively used apple orchards have a potential for carbon (C) sequestration and to be an important sink of atmospheric CO2 the continuous measurements of processes of ecosystem-atmosphere exchange are necessary for properly determining of global carbon (C) budget.

This work presents the results of continuous closed-path EC measurements of carbon dioxide (CO2) fluxes in the apple orchard located near Grójec in the Masovian voivodeship on the largest orchard area in Poland. These are the results of the first and the only measurements of the net CO2 fluxes (started in February 2023) carried out in the apple orchard ecosystem in Poland. The main goal of the work is to present variations of CO2 flux at different time scales at different stages of fruit tree growth and during different climatic conditions. The turbulent fluxes of CO2 were calculated on a 30-min basis. The raw data were computed using the EddyPro -7.0.9 software taking into account the necessary corrections and procedures to correct the obtained results. CO2 fluxes were characterized by clear daily variability with negative values during the day (CO2 uptake in the photosynthesis process) and positive at night (CO2 release in plants respiration processes). The most intensive CO2 absorption took place between May and September (phases of flowering and fruit development and ripening) the with a maximum in June. Negative 30 min mean CO2 flux value reached for this month was around 12 µmol ּ m-2 ּ s-1 around noon. In the remaining months the CO2 absorption processes were lower and ranged around a few µmol ּ m-2 ּ s-1

How to cite: Pawlak, I. and Kleniewska, M.: Variability of turbulent carbon dioxide flux netto at different time scales in an apple orchard ecosystem in Central Poland, EGU General Assembly 2024, Vienna, Austria, 14–19 Apr 2024, EGU24-592, https://doi.org/10.5194/egusphere-egu24-592, 2024.

EGU24-956 | ECS | Posters on site | AS2.4

Fluxible: an R package to calculate ecosystem gas fluxes in a reproducible and automated workflow. 

Joseph Gaudard, Richard Telford, Vigdis Vandvik, and Aud Helen Halbritter

Measurements of gas fluxes are widely used when assessing the impact of global-change drivers on key aspects of ecosystem dynamics, especially carbon. It shows whether an ecosystem is a source or a sink of atmospheric carbon, and how the storage dynamics could change in the future. Ecosystem gas fluxes are typically calculated from field-measured gas concentrations over time, using a linear or exponential model and manually selecting good quality data. This approach is highly time consuming and prone to potential bias that might be amplified in further steps, as well as having major reproducibility issues. The lack of a reproducible and bias-free approach creates challenges when combining global-change studies to make biome and landscape scale comparisons.

The Fluxible R package aims to fill this critical gap by providing a workflow that removes individual evaluation of each flux, reducing risk of bias, and making it reproducible. Users set specific data quality standards and selection parameters as function arguments that are applied to the entire dataset. The package runs the calculations automatically, without prompting the user to take decisions mid-way, and provides quality flags and graphs at the end of the process for a visual check. This makes it easier to use with large flux datasets and to integrate into a reproducible workflow. Using the Fluxible R package makes the workflow reproducible, increases compatibility across studies, and is more time efficient.

How to cite: Gaudard, J., Telford, R., Vandvik, V., and Halbritter, A. H.: Fluxible: an R package to calculate ecosystem gas fluxes in a reproducible and automated workflow., EGU General Assembly 2024, Vienna, Austria, 14–19 Apr 2024, EGU24-956, https://doi.org/10.5194/egusphere-egu24-956, 2024.

EGU24-1084 | ECS | Orals | AS2.4

Analysis of fog occurrence changes in the Namib Desert across time and space and impacts on natural and artificial fog collection 

Eleonora Forzini, Giulio Castelli, Aida Cuni-Sanchez, and Elena Bresci

In the Namib Desert, along the South-Western African coast, fog represents the main water input for local flora and fauna. During the last years, changes in the timing of fog occurrence and in the quantity of water that can be harvested from it, have been observed in several areas of the world, including the Namib Desert. A deeper insight into fog presence and fog water yield changes can help to understand to what extent Namib Desert’s ecosystem is being and will be affected in future by climate change. This information can also contribute to local environmental protection and carbon dioxide sequestration strategies, as fog water can be used for reforestation and land restoration. An 8-year-long dataset of harvested fog water rates recorded daily in 13 ground stations along the Namib Desert was statistically analysed to inspect advection fog occurrence evolution. The results show a noticeable intra-annual and inter-annual variability in rates and seasonality of harvested fog water. On the other hand, observed trends in collected fog water time series are generally decreasing, but longer time series are required to confirm the trend since El Niño Southern Oscillation (ENSO) phenomenon presence in the analysed period might have had an impact. The main hypothesis is that changes in fog occurrence and its characteristics are due to climate modifications, given that no extensive human activities are present in the area. However, further analyses on fog-related climatic and meteorological factors, possibly including remote sensing or reanalysis datasets aiming to increase the available data timespan, are envisioned to understand to what extent fog collection in the Namib Desert will be affected in future by climate change.

How to cite: Forzini, E., Castelli, G., Cuni-Sanchez, A., and Bresci, E.: Analysis of fog occurrence changes in the Namib Desert across time and space and impacts on natural and artificial fog collection, EGU General Assembly 2024, Vienna, Austria, 14–19 Apr 2024, EGU24-1084, https://doi.org/10.5194/egusphere-egu24-1084, 2024.

The observed surface wind speed (SWS) over China has declined in the past four decades, and recently, the trend has reversed, which is known as SWS stilling and recovery. The observed SWS is vulnerable to changes in nonclimatic factors, i.e., inhomogeneity. Unfortunately, most of the existing studies on the long-term trend of SWS were based on raw datasets without homogenization. In this study, by means of geostrophic wind speed and penalized maximal T test, we conduct a systematic homogeneity test and exploration of the homogenization impact for SWS at over 2,000 stations in China from 1970 to 2017. The results show that the inhomogeneity in the observed SWS over China is detectable at 59% of national weather stations. The breakpoint years are mainly concentrated in the late 1970s, mid-1990s and early 2000s. Overall, 18% of breakpoints are caused by station relocations, and the remaining breakpoints are likely related to anemometer replacement and measurement environment changes that occurred during the mid-1990s and early 2000s. After homogenization, the decreasing trend in SWS during 1970-2017 decreased from -0.15 m/s decade-1 to -0.05 m/s decade-1. The homogenized SWS recovery period advanced from the early 21st century to the early 1990s, which is consistent with the SWS variations, excluding the impact of urbanization around weather stations. The phase change in the Western Hemisphere warm pool (WHWP) might be one of the causes of homogenized SWS recovery.

How to cite: Zhang, Z.: Homogenization of observed surface wind speed based on geostrophic wind theory over China from 1970 to 2017, EGU General Assembly 2024, Vienna, Austria, 14–19 Apr 2024, EGU24-1358, https://doi.org/10.5194/egusphere-egu24-1358, 2024.

EGU24-2642 | Posters on site | AS2.4

Can dry get wetter even if rainfall declines? 

Nurit Agam and Dilia Kool

Drylands are 57% of the terrestrial area of the world, and are disproportionally affected by climate change. This is particularly pertinent in so-called “climate-change hotspots” such as the Mediterranean, where temperature increases at a rate of up to 0.45 oC/decade and precipitation is expected to decline. Given the sparsity of studies in drylands and the consequent lack of understanding of the unique processes in drylands, the degree to which these projections are accurate for drylands is questionable. The fact that drylands, by definition, are classified according to the aridity index, exposes the inherent assumption that desert hydrology is primarily governed by precipitation and potential evapotranspiration (ET0). There is increasing evidence, however, that non-rainfall water inputs (NRWIs; fog, dew, and water vapor adsorption) are a substantial source of water in multiple desert environments. In arid and hyper-arid drylands, water vapor adsorption is not only the least studied of the three NRWIs, but also likely the most common. In the Negev desert, Israel, the projected decrease in rainfall and increase in temperature, and therefore increase in ET0, is expected to result in drier soils. This potentially will increase the amount of water vapor adsorption. Here we present the actual rate of warming and the corresponding changes in ET0 in the Negev desert. We then elucidate, for the first time, the contribution of water vapor adsorption to desert hydrology and how it might be affected by climate change based on changes observed in the last 20 years.

How to cite: Agam, N. and Kool, D.: Can dry get wetter even if rainfall declines?, EGU General Assembly 2024, Vienna, Austria, 14–19 Apr 2024, EGU24-2642, https://doi.org/10.5194/egusphere-egu24-2642, 2024.

EGU24-3967 | Orals | AS2.4

Impact of Subsurface Thermal Anomalies on Air Temperatures in Idealized Scenarios Using PALM-4U 

Patricia Glocke, Christopher C. Holst, Basit A. Khan, and Susanne A. Benz

The impact of underground heat (or cold) sources such as man-made infrastructures or geothermal systems have been extensively studied in geosciences. Soil temperatures near underground parking garages may be up to 10 K warmer than their surroundings. However, the coupling between these temperature anomalies in the soil and the atmosphere as a bottom-up scheme has been neglected so far. We investigated how this scenario can be modeled in the turbulence and building resolving large eddy simulation urban climate model PALM-4U and assessed the impact of modified soil temperatures on air temperatures in an idealized domain. Hereby, the soil temperatures at 2-meter depth were increased and decreased by 5 K, respectively. Multiple scenarios were considered, differentiating between cyclic and Dirichlet/radiation boundary conditions along the x-axis. Further, we ran the simulations under summer and winter conditions, day and night, and three land cover types which are bare soil, short grass, and tall grass. After three days of simulation time, cyclic boundary conditions induced air temperature anomalies due to changes in the subsurface temperature. However, Dirichlet/radiation boundary conditions did not show alterations. Analyzing the cyclic scenarios, although the absolute air temperature was significantly influenced by the landcover, the magnitude of the air temperature anomaly shows little variation. Daytime and seasonality exerted a greater influence on the magnitude. The greatest positive near-surface air temperature anomaly when increasing the soil temperature was 0.38 K for all land cover types and develops during winter between 09:00 and 10:00 CET. Smallest influence was found during summer at 09:00 CET, where increased soil temperatures resulted in a 0.02 K rise over short- and tall grass, and 0.18 K over bare soil. Conversely, decreasing soil temperatures showed predominantly inverse patterns.

The findings contribute to the general comprehension of the coupling of soil- and atmospheric temperatures, inferring also insights of simulating idealized but reality-oriented scenarios in PALM-4U.

How to cite: Glocke, P., Holst, C. C., Khan, B. A., and Benz, S. A.: Impact of Subsurface Thermal Anomalies on Air Temperatures in Idealized Scenarios Using PALM-4U, EGU General Assembly 2024, Vienna, Austria, 14–19 Apr 2024, EGU24-3967, https://doi.org/10.5194/egusphere-egu24-3967, 2024.

EGU24-5207 | Posters on site | AS2.4

Eddy Covariance (EC) measurements in a restored floodplain area at the Morava River in Austria within the EU funded REWET project 

Anna Lindenberger, Magdalena von der Thannen, and Hans Peter Rauch

Although occupying only 7% of the earth's surface, wetlands store 33% of the world's terrestrial carbon. When these ecosystems are drained to be converted into agricultural, forestry or mining exploitations, they release greenhouse gases contributing to climate change. While bringing together 18 partners from 9 countries, the REWET (REstoration of WETlands to minimise emissions and maximise carbon uptake – a strategy for long term climate mitigation) project focuses on determining how the restoration and management of wetlands can be optimised to maximise their carbon uptake while in balance with type-specific natural processes and biodiversity.

The REWET project draws upon a network of seven Open Labs (OLs) located in different geographical areas of Europe and covers different types of terrestrial wetlands: freshwater wetlands, peatlands and floodplains. The heterogeneity of the Open labs allows the application of different restoration methodologies while following the same monitoring plan to provide replicable knowledge.

This paper presents the measurements and the first result of the OL in Austria within the REWET project. The site is a restored and now protected floodplain area at the Morava River. EC measurements are used to calculate the CO2 and CH4 fluxes and the seasonal as well as annual carbon balance of the ecosystem. Furthermore, the effect of floodplain water levels and grazing in this area is investigated. The EC instruments have been set up on a floating platform to allow measurements also during flood events, when understudied, critical transition of GHG fluxes may occur. The CO2/H2O analyser started collecting the first data in the middle of October 2023 whereas the CH4 analyser was added in end of December 2023. Since the CO2 analyser was put on site first flood events occurred end of December, which is the first data to be processed and analysed. Additional to the results the challenges in setting up an EC tower in a floodplain area will be presented.


Funded by the European Union. Views and opinions expressed are however those of the author(s) only and do not necessarily reflect those of the European Union or CINEA. Neither the European Union nor the granting authority can be held responsible for them.

How to cite: Lindenberger, A., von der Thannen, M., and Rauch, H. P.: Eddy Covariance (EC) measurements in a restored floodplain area at the Morava River in Austria within the EU funded REWET project, EGU General Assembly 2024, Vienna, Austria, 14–19 Apr 2024, EGU24-5207, https://doi.org/10.5194/egusphere-egu24-5207, 2024.

EGU24-5340 | ECS | Posters on site | AS2.4

Uncertainty of eddy covariance-derived net ecosystem CO2 exchange over a mountain forest reduced by multiple nighttime filtering approaches 

Alexander Platter, Katharina Scholz, Albin Hammerle, Mathias W. Rotach, and Georg Wohlfahrt

The assessment of net ecosystem CO2 exchange often relies on eddy covariance systems. However, this method overlooks CO2 advection, even if it is often non-negligible. This is especially the case under stable, low-turbulence nighttime conditions. Hence, there is a need to filter nighttime eddy covariance data for periods when advection can be expected to be non-negligible. This study evaluates both well-established and novel filtering methods at a mountain forest site in Tyrol, Austria (Forest-Atmosphere-Interaction-Research (FAIR) site, AT-Mmg). Established methods, including friction velocity (u*) filtering, its counterpart using the standard deviation of vertical velocity  fluctuations (σw) and an after-sunset flux maxima approach (commonly referred to as van Gorsel method) are applied. Additionally we use a more recent approach with a physically-derived measure of flow decoupling for filtering. With this method also stability information is taken into account, not only a turbulence scale, as in the commonly used u* filtering. As often seen in literature, the uncorrected CO2 flux underestimates the nighttime respiration, as it appears for all the filtering methods. Despite being based on widely differing assumptions, the various filtering approaches yielded relatively similar carbon budget estimates over 14 months of measurements (-252 to -290 g C/m2). in contrast to the uncorrected budget of -521 g C/m2.

Furthermore, we introduce a novel K-means clustering approach that groups flow situations into clusters based on vertical profiles of temperature, σw and wind speed. These clusters need then to be evaluated to determine whether they represent a flow situation in which CO2 advection is expected to be irrelevant. Such scenarios are often Foehn periods or early-night situations with high turbulence and low stability. This approach is relatively straightforward to implement, works with an unlimited number of input variables and has the advantage that the identified periods are easy to interpret. This method results in a 14-month budget of -232 g C/m2 for our study site. 

The universality of the clustering method allows not only for an unlimited number of input variables, it can be also easily extended for the entire day. There is no a priori reason not to filter eddy covariance data during the daytime when low-turbulence situations with persistent in-canopy flows may lead to non-negligible advection, especially in complex terrain. We made an attempt of daytime filtering in this study with the clustering method, but also with some adapted versions of the benchmark methods. All of these daytime filtering methods suggest that there is an underestimation of the CO2 uptake in the morning for the uncorrected measurements. Filtering for both nighttime and daytime leads to a range of 14-month budgets of -451 to -359 g C/m².

Further analysis, incorporating different established sites, direct advection measurements or numerical simulations, could be used in future to explore the full potential of the novel clustering approach, especially with its application to daytime flux data.

How to cite: Platter, A., Scholz, K., Hammerle, A., Rotach, M. W., and Wohlfahrt, G.: Uncertainty of eddy covariance-derived net ecosystem CO2 exchange over a mountain forest reduced by multiple nighttime filtering approaches, EGU General Assembly 2024, Vienna, Austria, 14–19 Apr 2024, EGU24-5340, https://doi.org/10.5194/egusphere-egu24-5340, 2024.

EGU24-5597 | ECS | Orals | AS2.4

Investigating forest management's impact on local climate in Fennoscandia through statistical and dynamical modeling 

Bo Huang, Yan Li, Xia Zhang, Chunping Tan, Xiangping Hu, and Francesco Cherubini

The forest plays a crucial role in the land ecosystem, impacting local climates through various biophysical mechanisms. While numerous observational and modeling studies have explored the distinctions between forested and non-forested areas, the impact of forest management on surface temperature has been relatively understudied. This limited attention is attributed to the inherent challenges associated with adapting climate models to effectively account for the complexities of forest structure parameters. Employing a combination of machine learning-based statistical analysis and a regional climate model, along with high-resolution maps detailing various forest compositions and structures, we explore the connection between specific forest management strategies and local temperature variations. The findings reveal a tendency for more developed forests to contribute to higher land surface temperatures compared to younger or less developed ones. Relative to the present state of Fennoscandian forests, an ideal scenario with fully developed forests is found to an annual mean warming of 0.26 ℃ in statistical models, with a range of 0.03 to 0.69 ℃ (5th to 95th percentile). However, the dynamical model indicates an annual average cooling effect of -0.25 °C, ranging from -0.42 to -0.10 °C (5th to 95th percentiles), attributing this difference to the dynamical model's inability to accurately simulate winter warming. Both models project a cooling effect in summer, with statistical and dynamical models showing -0.03 ± 0.22 ℃ and -0.53 ± 0.20 ℃, respectively. Conversely, scenarios involving undeveloped forests result in an annual average cooling of -0.29 ℃ in statistical models, with a range of -0.61 to -0.01 ℃, a slight summer warming of 0.03 ± 0.16 ℃, and a winter cooling of -0.69 ± 0.47 ℃. The dynamical model, however, predicts an annual average warming of 0.28 ± 0.18 °C, a summer warming of 0.53 ± 0.15 °C (mainly driven by increased sensible heat fluxes), and a winter cooling of -0.29 ± 0.25 °C. This study deepens our understanding of how alterations in vegetation impact climate patterns. While our findings shed light on the intricate connections between forest composition and surface temperatures, there's a clear need to refine how regional climate models capture the intricate biophysical mechanisms within forest dynamics. Enhancements in this representation will be crucial for establishing a comprehensive understanding of how forest management practices specifically influence local climate regulation services.

How to cite: Huang, B., Li, Y., Zhang, X., Tan, C., Hu, X., and Cherubini, F.: Investigating forest management's impact on local climate in Fennoscandia through statistical and dynamical modeling, EGU General Assembly 2024, Vienna, Austria, 14–19 Apr 2024, EGU24-5597, https://doi.org/10.5194/egusphere-egu24-5597, 2024.

EGU24-6114 | Orals | AS2.4

Reflect sunlight or use it to store carbon? 

Alexander Graf, Georg Wohlfahrt, Ankur Desai, and the FLUXNET ALBEDO team

In considerations about land management and global climate, biophysical effects like those of albedo are known to modify biochemical effects of greenhouse gas release or uptake. In particular, the cooling effect of afforestation via creation of carbon sinks has been shown to be partly offset by the low albedo and snow-masking effect of tree canopies.

In this presentation, we give a global overview on the relationship between albedo and CO2 uptake (net ecosystem productivity NEP and net biome productivity NBP). We focus on a recent study (Graf et al. 2023, https://doi.org/10.1038/s43247-023-00958-4) and the questions:

(i) Do ecosystems sequestering more CO2 have a lower albedo as a rule?

(ii) How close would such a relation be and how much room does it leave for climate-smart land use?

(iii) Given the different immediacy of albedo and NBP based radiative forcing, are there different mitigation policies to be preferred at different points in time?

To empirically investigate these questions with direct in-situ measurements, we identified 176 FLUXNET stations with sufficient coverage of NEP, incoming and outgoing shortwave radiation and ancillary data. A method to fill gaps in outgoing shortwave radiation and identify snow cover periods was developed and validated against available data and PI-provided snow statistics. 

We found a hyperbola-like decrease in maximum achievable effective (flux-weighted) long-term albedo as NEP increases, and vice versa. Apart from this joint limit, which also applied to non-forest and snow-free sites, the relation scattered strongly, indicating some room for climate-smart land use considering both albedo and carbon sequestration.

A conceptual model based on a paired-site permutation approach showed that maximizing each site’s NEP without considering albedo, leads to albedo-based positive radiative forcing (warming) during the first approximately 20 years, before being offset by an even stronger NBP-based cooling. However, the fact that most sites are currently far below their possible maximum albedo-NEP combination also allows for a balanced scenario in which both parameters are improved simultaneously. It avoids warming on all timescales, but provides less cooling than pure NEP maximization in the long term. We discuss how these timelines would interact with current emission reduction policies, the reasons underlying the relationship and real-world examples of joint NEP and albedo change.

How to cite: Graf, A., Wohlfahrt, G., Desai, A., and team, T. F. A.: Reflect sunlight or use it to store carbon?, EGU General Assembly 2024, Vienna, Austria, 14–19 Apr 2024, EGU24-6114, https://doi.org/10.5194/egusphere-egu24-6114, 2024.

EGU24-6150 | ECS | Posters on site | AS2.4

Investigation of the Vertical Geometry of Low Level Clouds in the Namib Desert 

Deepanshu Malik, Hendrik Andersen, and Jan Cermak

This study comprehensively investigates the vertical geometry of low-level clouds in the Namib desert. Using ceilometer measurements and meteorological station observations, a precise determination of cloud-base height and the separation of low-level stratus and fog is performed.
The Namib Desert, known for hyper-arid conditions and frequent cloudiness, presents an intriguing environment for the study of low-level clouds and their vertical geometry. Fog (ground-touching low-level clouds), a common atmospheric phenomenon in the Namib Desert, is influenced by the interplay of coastal upwelling and spatial temperature differences. Differentiation of fog from other low-level clouds and understanding cloud dynamics are crucial, as fog impacts the water balance in this arid region. Here, ceilometer measurements of cloud base altitude are analyzed and combined with local station measurements with the aim of developing a statistical model to robustly predict cloud base altitude.
Initial results suggest a robust correlation between the cloud base height and surface relative humidity, as well as other meteorological variables. This finding proves beneficial for utilizing meteorological parameters such as the lifted condensation level as a surrogate for cloud-base height. The outcomes of this study hold significance for modeling of satellite-based fog probability product and ecological studies.

How to cite: Malik, D., Andersen, H., and Cermak, J.: Investigation of the Vertical Geometry of Low Level Clouds in the Namib Desert, EGU General Assembly 2024, Vienna, Austria, 14–19 Apr 2024, EGU24-6150, https://doi.org/10.5194/egusphere-egu24-6150, 2024.

EGU24-6590 | ECS | Orals | AS2.4

Continuous, long-term monitoring of soil CO2 concentration and CO2 flux using a novel, low-cost CO2 sensor system 

Thi Thuc Nguyen, Ariel Altman, Nadav Bekin, Nurit Agam, and Elad Levintal

Soil respiration (Fs) datasets often exhibit low temporal-spatial resolution and spatial bias, particularly lacking observations in arid/semi-arid regions. This limitation significantly constrains our understanding of the mechanisms governing soil carbon dynamics and hinders the correct estimation of CO2 emissions at regional to global scales. Challenges in Fs estimation arise mainly from logistical constraints in manual data collection and the high costs of commercial measuring devices. To address this, we developed a low-cost, open-source, autonomous soil CO2 sensor system. The system design emphasized easy adoption and customization for non-engineer end-users, enabling the collection of high-frequency, long-term soil CO2 concentration data, and consequently, Fs estimates. A system including six low-cost CO2 sensors distributed at two soil depths (5 and 10cm) was deployed in the Negev Desert since May 2023. Fs estimates were determined from CO2 concentration gradient using Fick's law (FG) and cross-validated with Fs measured by automated chambers (FC). We found a good agreement between FG and FC both in the short term (i.e., sub-daily fluctuation) and long term (i.e., annual net CO2 emission). Our data also revealed daily and seasonal Fs patterns correlating with environmental factors like temperature and precipitation. The results demonstrate that our system, despite costing less than 10% of automated chamber systems, offers equivalent accuracy in Fs estimates, higher temporal resolution, and potential for enhanced spatial resolution if widely adopted.

How to cite: Nguyen, T. T., Altman, A., Bekin, N., Agam, N., and Levintal, E.: Continuous, long-term monitoring of soil CO2 concentration and CO2 flux using a novel, low-cost CO2 sensor system, EGU General Assembly 2024, Vienna, Austria, 14–19 Apr 2024, EGU24-6590, https://doi.org/10.5194/egusphere-egu24-6590, 2024.

The eddy covariance (EC) method has been widely used to capture the temporal and spatial patterns of nitrous oxide (N2O) emissions from a wide variety of agricultural ecosystems. Technological advancements in the recent years have brought new tunable infrared laser-based closed-path gas analyzers suitable for EC measurements. To achieve high sensitivity and low measurement noise, these analyzers use multi-pass optical cells with long sensing path. A drawback of these cells is the relatively large internal volume requiring high-flow rate, high-power pumps to attain fast response to changes in gas concentration.  Additionally, these cells are prone to contamination and require in-line filters. In this study we evaluate the frequency response of a novel, low-power, field deployable N2O closed-path EC system consisting of: (1) a gas analyzer with a small volume single-pass optical cell, (2) a 3 m sulfonated tetrafluoroethylene ionomer intake tube acting as water vapor permeable membrane to dry the air sample, (3) a cyclone type, non-barrier inertial particle separator (IPS) to mitigate the effects of particulates contamination of the optical sample cell, and (4) a small, low-power pump module with an automatic pressure and flow control. The performance of the new N2O EC system is evaluated in-situ 3 m above a fertilized agricultural wheat field and compared to a co-located fast-response H2O and CO2 open-path gas analyzer and sonic anemometer (IRGASON). Tube delays, determined by cross-covariance of N2O with vertical wind, were consistent over time and varied between 0.2 and 0.5 s. Spectral and co-spectral analysis of vertical wind, temperature, H2O, CO2 and N2O showed good agreement. Ogive functions demonstrated that the new system has adequate frequency response to capture >90% of the N2O fluxes for a wide range of wind speeds and atmospheric stabilities and is suitable for deployment in remote areas.

How to cite: Bogoev, I.: Frequency Response Evaluation of a Low-power Closed-path Eddy Covariance System for Measuring Nitrous Oxide Fluxes, EGU General Assembly 2024, Vienna, Austria, 14–19 Apr 2024, EGU24-6604, https://doi.org/10.5194/egusphere-egu24-6604, 2024.

EGU24-7308 | ECS | Posters on site | AS2.4

Role of vegetation and soil-induced effects of microclimate on non-rainfall water inputs 

Jannis Groh, Thomas Pütz, Daniel Beysens, Harry Vereecken, and Wulf Amelung

Precipitation (i.e. rain, snow, hail) is the main form of water input to our ecosystem. However, depending on local climatic conditions, a significant amount of water can also be produced by various fractions of non-rainfall water inputs (NRWIs), namely dew, hoar-frost, rime, fog, and adsorption of water vapour in the soil. Such NRWIs are often neglected because they are typically small compared to daily rainfall. However, these NRWIs provide our ecosystems with additional water, which is important for the survival of the fauna and flora in the ecosystem, especially during drier periods.

Although NRWIs are understood in principle, much remains to be learnt about their precise determination at the ecosystem level, their spatial and temporal distribution, and their ecological function for the ecosystem. We present a conceptual measurement setup that allows us to determine each non-rainfall water component for natural and extensive grasslands as well as for agricultural ecosystems. Our results for the experimental site Selhausen (Germany, TERENO-SOILCan) show that i) the main part of NRWI comes from dew formation, ii) the rate and frequency of dew formation differs significantly between vegetation types under similar atmospheric boundary conditions, and iii) the drivers of dew formation during a dry down period differ between ecosystems (grassland and arable land). A better understanding of these vegetation and soil-dependent effects will help us to better predict dew formation processes in our ecosystems in the future.

How to cite: Groh, J., Pütz, T., Beysens, D., Vereecken, H., and Amelung, W.: Role of vegetation and soil-induced effects of microclimate on non-rainfall water inputs, EGU General Assembly 2024, Vienna, Austria, 14–19 Apr 2024, EGU24-7308, https://doi.org/10.5194/egusphere-egu24-7308, 2024.

EGU24-7892 | Posters on site | AS2.4

Simultaneous trace gas flux monitoring of 10 greenhouse gases and air pollutants with a single instrument 

Morten Hundt, Marco Brunner, Jonas Bruckhuisen, and Oleg Aseev

Monitoring of trace and greenhouse gas fluxes is key to understand the interaction between atmosphere, plants, and soil and therefore to improving our understanding of the climate system in general.

Complex flux systems, in environments where both biogenic and anthropogenic sources and sinks play a role, require measurement of many different inert and reactive trace gases and greenhouse gases simultaneously to obtain a complete budget.

Until recently, however, the monitoring was usually limited to only a few gases per measurement device making the technique complex and expensive but providing only a limited picture. MIRO Analytical has developed a novel multicompound gas analyzer that can monitor up to 10 air pollutants (CO, NO, NO2, O3, SO2 and NH3), greenhouse gases (CO2, N2O, H2O and CH4) and other atmospheric trace gases such as (OCS, HONO, CH2O) simultaneously at ppb level.

The eddy covariance (eddy flux) technique is often used to measure fluxes of trace gases but requires a high time resolution. Our compact instrument, combing several mid-infrared lasers (QCLs), offers 10 Hz sampling rate, outstanding precision, selectivity and accuracy and an automatic water vapor correction, which makes it ideal for eddy covariance flux measurements.

In our contribution, we will introduce the measurement technique and will demonstrate application examples of this all-in-one atmospheric flux monitor. The system will be compared to alternative devices in parallel measurements and results of long-term observations and shorter campaigns will be presented.

How to cite: Hundt, M., Brunner, M., Bruckhuisen, J., and Aseev, O.: Simultaneous trace gas flux monitoring of 10 greenhouse gases and air pollutants with a single instrument, EGU General Assembly 2024, Vienna, Austria, 14–19 Apr 2024, EGU24-7892, https://doi.org/10.5194/egusphere-egu24-7892, 2024.

Atmospheric fluxes near the surface are key metrics for understanding the interactions between the biosphere and the atmosphere. There is an increasing demand for highly accurate flux measurements for species where fast-response analytical techniques are not available. This includes, among others, stable isotopes, oxygen, ammonia, nitrogen compounds, and bio-aerosols.

Here we introduce quantized eddy accumulation with error diffusion, a new easy-to-implement, high-accuracy eddy accumulation method that is compatible with slow-response analytical techniques. Similar to relaxed eddy accumulation, this method involves sampling air at a constant flow rate and directing it into one of two containers, depending on the vertical wind velocity. The flux is then calculated based on accumulated concentration averages over the flux averaging interval. However, unlike relaxed eddy accumulation, the new method is a direct method that does not require the empirical coefficient β. These developments were made possible by developing a new representation of conditional sampling at a constant flow rate as a quantization process of vertical wind velocity. Fluxes estimated with relaxed eddy accumulation were found to be biased due to sub-optimal quantization. To account for these errors, an error diffusion algorithm was developed, which made it possible to minimize the biases inherent in the quantization process, thereby allowing for accurate and direct flux estimates.

Quantized eddy accumulation with error diffusion is shown to achieve direct flux measurements with errors smaller than 0.1% of the reference eddy covariance flux. Additionally, this method enables an increase in the concentration difference in accumulated samples between updrafts and downdrafts without compromising accuracy, making it especially suitable for detecting smaller fluxes. It also provides improved accumulation volume dynamics, flexible accumulation intervals, and is less prone to errors from non-zero vertical wind velocities.

These new developments are especially useful for measuring small fluxes of elusive atmospheric constituents, particularly in the presence of measurement challenges such as instrument drift or frequency attenuation. A notable application is the accurate measurement of water stable isotopes, which enables the tracing of biological processes and the accurate partitioning of measured fluxes.

How to cite: Emad, A.: Quantized eddy accumulation with error diffusion: a new direct micrometeorological technique with minimal requirements, EGU General Assembly 2024, Vienna, Austria, 14–19 Apr 2024, EGU24-8926, https://doi.org/10.5194/egusphere-egu24-8926, 2024.

Automated Solution for Discrete Gas Sample Analyses with
Picarro G2508 and SAM Autosampler
Jan Woźniak1, Joyeeta Bhattacharya2, Magdalena E. G. Hofmann1, Frank Krijnen3, Guillermo Hernandez
Ramirez4
1Picarro B.V., Eindhoven, The Netherlands, 2Picarro Inc., Santa Clara, USA; 3University of Saskatchewan; 4University of Alberta

Abstract
Greenhouse gas research community has witnessed an ever-increasing need for automated
solutions for measuring greenhouse gas concentrations in small discrete gas samples. However,
traditional solutions like gas chromatographs often incur high initial and maintenance costs or are
complicated to deploy and maintain, and almost impossible to work with in the field. There has
been a rising interest in the SAM autosampler (www.openautosampler.com) which so far has
been utilized mostly for isotopic measurements of greenhouse gases (e.g., isotopic CO2/CH4), in
conjunction with low flow Picarro analyzers (<50 mL/min). In this report, we demonstrate the
compatibility, efficiency, and advantages of the SAM autosampler with Picarro Greenhouse Gas
(GHG) Concentration analyzers like the G2508 multi species gas analyzer, with much higher flow
rates (>200 mL/min). The results of our experiments show excellent precision and accuracy for
discrete CH4, CO2 and N2O gas measurements. Also, we have been able to determine linearity in
dilution factors and characterized memory effects and its variability in different gas species (e.g.,
comparing CO2 vs N2O). This report also provides recommendations on the methods and best
practices for discrete gas sample measurements. In summary, the Picarro G2508 (or other GHG
analyzers) in conjunction with SAM Autosampler offers an attractive, cost-effective, and simpler
alternative to gas chromatograph or similar available solutions

How to cite: Wozniak, J.: Automated Solution for Discrete Gas Sample Analyses withPicarro G2508 and SAM Autosampler, EGU General Assembly 2024, Vienna, Austria, 14–19 Apr 2024, EGU24-9193, https://doi.org/10.5194/egusphere-egu24-9193, 2024.

EGU24-9231 | ECS | Orals | AS2.4

Constructing a comprehensive numerical experiment to study biospheric-atmospheric feedbacks driving dry season cloud formation over the Amazon Basin  

Vincent de Feiter, Sebastiaan de Haas, Jordi Vilà-Guerau de Arellano, Raquel González Armas, Daniël Rikkers, Guido Haytzmann, Martin Janssens, Oscar Hartogensis, Imme Benedict, Luiz Machado, and Cléo Quaresma

The Amazonian hydrological and carbon cycle are controlled by a complex, interconnected and interdependent myriad of surface and atmospheric processes. Improving our understanding and numerical representation of these cycles under a changing climate requires a deeper exploration of the biospheric-atmospheric coupling and the processes governing the formation and deepening of shallow cumulus clouds. Utilising a comprehensive set of surface and upper-air atmospheric measurements from the CloudRoots-Amazon22 campaign alongside an integrated hierarchy of models, we construct a numerical experiment to systematically study these processes throughout the dry season of 2022. The model hierarchy consists of a large eddy simulation resolving turbulence and shallow cumulus formation, a coupled rainforest-atmosphere mixed-layer model to map the sensitivity to surface and atmospheric observations and a moisture tracking model to identify and quantify moisture sources, sinks, and long-range transport. Individual days of observations were characterised into representative shallow convective and shallow-to-deep convective regimes. We accurately replicated the evolution of radiation and the asymmetrical exchange fluxes of energy, momentum, moisture, and carbon during the shallow convective regime. By analysing the diurnal variability of the state variables, we can determine how turbulent mixing controls the morning transition, from strong gradients to well-mixed conditions above the forest. Ongoing work involves improving the representation of in-canopy processes and simulating the shallow-to-deep convective regime by introducing thermodynamic forcings, such as moist air intrusion or increased wind sheared conditions, on the shallow convective experiment.  

How to cite: de Feiter, V., de Haas, S., Vilà-Guerau de Arellano, J., González Armas, R., Rikkers, D., Haytzmann, G., Janssens, M., Hartogensis, O., Benedict, I., Machado, L., and Quaresma, C.: Constructing a comprehensive numerical experiment to study biospheric-atmospheric feedbacks driving dry season cloud formation over the Amazon Basin , EGU General Assembly 2024, Vienna, Austria, 14–19 Apr 2024, EGU24-9231, https://doi.org/10.5194/egusphere-egu24-9231, 2024.

EGU24-9320 | ECS | Orals | AS2.4

Water and Carbon Dioxide Interactions in the most unlikely places: The hidden dynamics of the Sahara Desert soils 

Nadav Bekin, Dennis Ashilenje, Abdelghani Chehbouni, Lhoussaine Bouchaou, Lamfeddal Kouisni, Dilia Kool, and Nurit Agam

Soil CO2 efflux is primarily attributed to the metabolic activity of soil organisms and is a major component of the global carbon balance. The carbon balance of deserts, such as the Sahara Desert, the largest desert on Earth, is considered neutral as low soil moisture inhibits biological activity and reduces the soil CO2 efflux to its lower limit. Studies in the last decades challenge this paradigm, reporting a mysterious nocturnal CO2 uptake by desert soils, which in some cases leads to a net gain of carbon by the soil. While the factors controlling this phenomenon are still under debate, it is clear that the presence of water is essential. How, then, can nocturnal CO2 uptake occur in the driest soil conditions when no apparent water is available to drive the process? We embarked on a field expedition in the Sahara Desert, southwest Morocco, during the summer of 2022 to explore the dynamics of water and carbon in this presumably “stagnant” ecosystem. We discovered nocturnal water vapor adsorption, driven by atmospheric water vapor transported from the Atlantic Ocean and penetrating hundreds of kilometers inland where the vapor is captured in the soil’s top layer. Changes in soil water content were determined from soil relative humidity (measured using a profile of relative humidity sensors) and soil-specific vapor sorption isotherms (measured using a vapor sorption analyzer). With this novel method, we were able to detect a daily increase of 0.3 mm of water even at a distance of 250 km from the Ocean. Concurrent measurements of CO2 fluxes (measured using manual and automatic flux chamber systems), confirmed that small atmosphere-to-soil CO2 fluxes occurred during the night, coinciding with downward water vapor fluxes. This indicates that the atmosphere provides a consistent water source and may initiate soil CO2 uptake. Simultaneous measurements of water vapor and CO2 fluxes at a second site suggested that the quality of the correlation between the two fluxes depends on soil properties. Overall, the daily CO2 cycle was unbalanced (net uptake of 0.08 g m-2) implying that the soil acted as a carbon sink. This sink is small, but considering its occurrence even in inland desert ecosystems and the fact that arid and hyper-arid regions occupy 26% of Earth’s terrestrial surface, the effect of atmospheric water capture by desert soils on CO2 exchange may play a significantly larger role in the global carbon balance than previously thought. 

How to cite: Bekin, N., Ashilenje, D., Chehbouni, A., Bouchaou, L., Kouisni, L., Kool, D., and Agam, N.: Water and Carbon Dioxide Interactions in the most unlikely places: The hidden dynamics of the Sahara Desert soils, EGU General Assembly 2024, Vienna, Austria, 14–19 Apr 2024, EGU24-9320, https://doi.org/10.5194/egusphere-egu24-9320, 2024.

EGU24-9627 | ECS | Orals | AS2.4

Increased spatial replication above heterogeneous agroforestry improves the representativity of eddy covariance measurements 

José Ángel Callejas Rodelas, Alexander Knohl, Ivan Mammarella, Timo Vesala, Olli Peltola, and Christian Markwitz

Eddy covariance (EC) studies typically involve the use of one or maximum two measuring towers, which leads to a low level of spatial replication, compromising the statistical representativity of EC measurements, especially above highly heterogeneous ecosystems, such as agroforestry systems. Lower-cost eddy covariance setups (LC-EC) represent a potential solution to this problem, since their affordability allows for the installation of multiple EC towers to study heterogeneity at the landscape scale. In the last years, several LC-EC setups have been successfully validated against conventional EC setups (CON-EC), with the main difference being the use of slower gas analyzers. These introduce a higher uncertainty due to the enhanced high-frequency spectral attenuation in the turbulent energy spectrum.

In this study, we analyzed turbulent fluxes of CO2 and H2O and turbulence characteristics measured by three flux towers equipped with LC-EC setups above one agroforestry system located in Wendhausen, Germany. The agroforestry system was a Short Rotation Alley Cropping (SRAC) system, consisting of alternating rows of trees and crops. The three flux towers were installed at different North-South aligned tree stripes. Additionally, we compared the results of the three LC-EC setups above the SRAC with another LC-EC setup installed at an adjacent monocropping (MC) field.

The objectives of the study were: (i) to evaluate the spatial variability of EC fluxes from the three flux towers above the SRAC system; (ii) to compare the variability of fluxes within the SRAC to the variability of fluxes between SRAC and MC; (iii) to quantify whether the use of several LC-EC setups counteracts the higher uncertainty associated to LC-EC, due to the increased statistical robustness of the measurement network compared to the hypothetical use of just one EC station.

The highest spatial variability across the SRAC was measured for CO2 fluxes, followed by latent heat (LE) flux, with coefficients of variation, calculated following Oren et al. (2006) (https://doi.org/10.1111/j.1365-2486.2006.01131.x), of 2.3 and 1.4 (dimensionless), respectively. The spatial variability in CO2 and LE fluxes within the SRAC was similar to the variability between MC and SRAC, and was attributed to the different land cover types around the towers. On the other hand, the spatial variability in sensible heat flux (H), momentum flux and turbulence characteristics (such as friction velocity and variance of vertical wind speed), within the SRAC, was smaller than the variability between SRAC and MC, likely explained by the development of an internal boundary layer (IBL) above the SRAC.

Our results show that the heterogeneity of the SRAC, despite not affecting significantly the turbulence characteristics across the site, leads to a large spatial variation in CO2 and LE fluxes. Therefore, a distributed network of several EC systems is necessary to properly quantify patterns and drivers of CO2 and latent heat fluxes above such heterogeneous land-use systems.

How to cite: Callejas Rodelas, J. Á., Knohl, A., Mammarella, I., Vesala, T., Peltola, O., and Markwitz, C.: Increased spatial replication above heterogeneous agroforestry improves the representativity of eddy covariance measurements, EGU General Assembly 2024, Vienna, Austria, 14–19 Apr 2024, EGU24-9627, https://doi.org/10.5194/egusphere-egu24-9627, 2024.

EGU24-9790 | ECS | Posters on site | AS2.4

Turbulence generation by unresolved orography 

Shreyas Deshpande and Cedrick Ansorge

Slope flows, resulting from the interplay between buoyancy and gravitational forces, are well-known to govern a plethora of local weather phenomena. In particular, orographic features and the associated surface roughness can induce turbulent mixing in the planetary boundary layer. While orographic drag models have been proposed to understand the effects of turbulence and waves due to orography, numerical simulations locally rely on closures based on the Monin-Obukhov Similarity Theory. The validity of these models and their interaction regarding turbulence production due to orography at unresolved scales is questionable. We study the turbulence generation by small-scale orography under the influence of stable stratification and weak mixing. To bypass the common complications with surface modeling, we use direct numerical simulation featuring a shallow valley to study the problem at a reduced scale. To imitate the intricate boundary conditions, an Immersed Boundary Method is used that features fully resolved three-dimensional roughness elements in the form of a local valley. However, modeling such flows also poses challenges due to the numerous parameters governing the triggering of turbulence. In this presentation, we introduce a scaling framework orographic for the problem and a viable numerical set-up along with the first results from preliminary studies at intermediate scale separation.

* This work is funded by the ERC Starting Grant ”Turbulence-Resolving Approaches of the Intermittently Turbulent Atmospheric Boundary Layer [trainABL]” of the European Research Council (funding ID 851347).

How to cite: Deshpande, S. and Ansorge, C.: Turbulence generation by unresolved orography, EGU General Assembly 2024, Vienna, Austria, 14–19 Apr 2024, EGU24-9790, https://doi.org/10.5194/egusphere-egu24-9790, 2024.

Atmospheric flows virtually always occur over rough surfaces, which enhances the drag, mixing and vertical transport of pollutants and moisture in the atmospheric boundary layer (ABL). During nighttime, when the absence of solar radiation leads to surface cooling, a stratified surface layer forms, and turbulence decreases in intensity and spatial extent, giving rise to large-scale intermittency. Roughness is known to counteract the buoyancy-induced reduction of turbulence in the stable regime by an increase of mixing, but the effects are lumped together in surface-layer similarity. To investigate the interaction of surface roughness and stable density stratification in the ABL at the process level, direct numerical simulation (DNS) of rough turbulent Ekman flow at Reynolds numbers well within the turbulent regime and for large domains is performed. Roughness is represented by an array of 56×56 roughness elements with a uniform width and height distribution on the lower wall. This small-scale three-dimensional surface roughness is fully resolved with an immersed boundary method (IBM) and has a packing density of 10%. For neutral stratification, we have obtained data in the transitionally rough regime and at the verge of the fully rough regime. Starting from the roughest neutral case with z0+≈2, stable stratification is gradually increased with a constant-temperature (Dirichlet) boundary condition. The focus of this study is the direct effect of roughness on the stability regime, the rough-wall scaling in the logarithmic layer and the scaling for the roughness parameters z-nought for momentum and temperature, which is crucial for the Monin–Obukhov similarity theory.


* This work is funded by the ERC Starting Grant ”Turbulence-Resolving Approaches of the Intermittently Turbulent Atmospheric Boundary Layer [trainABL]” of the European Research Council (funding ID 851347). Simulations were performed on the resources of the High-Performance Computing Center Stuttgart (HLRS) on the Hawk cluster. The computing time and storage facilities were provided by the project trainABL with the project number 44187.

How to cite: Kostelecky, J. and Ansorge, C.: Simulation and scaling analysis of small-scale roughness in neutrally and stably stratified turbulent Ekman flow, EGU General Assembly 2024, Vienna, Austria, 14–19 Apr 2024, EGU24-10016, https://doi.org/10.5194/egusphere-egu24-10016, 2024.

EGU24-10102 | Orals | AS2.4

The Land-Atmosphere Feedback Initiative 

Volker Wulfmeyer and the The LAFI Team

The quality of weather forecasts, seasonal simulations, and climate projections depends critically on the adequate representation of land-atmosphere (L-A) feedbacks. These feedbacks are the result of a highly complex network of processes and variables related to the exchange of momentum, energy, and mass. Significant challenges persist in understanding processes and feedbacks, which this initiative will address.

The Land-Atmosphere Feedback Initiative (LAFI) is an interdisciplinary consortium of researchers from atmospheric, agricultural, and soil sciences as well as from bio-geophysics, hydrology, and neuroinformatics proposing a novel combination of advanced research methods. The overarching goal of LAFI is to understand and quantify L-A feedbacks via unique synergistic observations and model simulations from the micro-gamma (» 2 m) to the meso-gamma (» 2 km) scales across diurnal to seasonal time scales.

LAFI consists of a network of closely intertwined projects addressing six research challenges formulated as objectives and hypotheses on 1) alternative similarity theories, 2) the impact of land-surface heterogeneity, 3) partitioning evapotranspiration, 4) understanding entrainment, 5) synergistic characterization of L-A feedback, and 6) droughts or heatwaves potentially investigated by ad-hoc field observations. Collaboration across the twelve projects will be fostered by three Cross Cutting Working Groups on Deep Learning, Sensor Synergy and Upscaling, as well as the LAFI Multi-model Experiment.

In this presentation, an overview of the LAFI research approach is given with particularly emphasis of the synergy of observations and modeling efforts substantiated by first results from the Land-Atmosphere Feedback Observatory (LAFO) at the University of Hohenheim in Stuttgart, Germany.

How to cite: Wulfmeyer, V. and the The LAFI Team: The Land-Atmosphere Feedback Initiative, EGU General Assembly 2024, Vienna, Austria, 14–19 Apr 2024, EGU24-10102, https://doi.org/10.5194/egusphere-egu24-10102, 2024.

EGU24-10295 | ECS | Posters on site | AS2.4

Exploring Nocturnal Canopy Advection in Complex Terrain Through Active Heating Fiber Optics: Unraveling Temperature Dynamics and Airflow Patterns 

Yi Fan Li, Kuo Fong Ma, Chin Jen Lin, Yen Jen Lai, Po Hsiung Lin, and Taro Nakai

Nocturnal advection significantly influences the accurate estimation of net ecosystem exchange (NEE). This phenomenon is prevalent in Taiwan's subtropical montane forests, introducing a potential bias when relying solely on eddy covariance data for carbon budget calculations. From the preliminary analysis, the wind speed can be well estimated through the temperature difference between the heated and unheated fiber optical.The derived five-minute average wind speed exhibits a high coefficient of determination (R^2) of up to 0.94.

In the current study, a fiber observational setup consisting of a 40m vertical section and a 90m horizontal section has been implemented to investigate temperature dynamics and airflow in complex terrain. The wind speed profile can be well reflected from the preliminary data analysis. Insights gained through this approach contribute to a better understanding of the nocturnal canopy advection model, offering valuable corrections to NEE estimates.

How to cite: Li, Y. F., Ma, K. F., Lin, C. J., Lai, Y. J., Lin, P. H., and Nakai, T.: Exploring Nocturnal Canopy Advection in Complex Terrain Through Active Heating Fiber Optics: Unraveling Temperature Dynamics and Airflow Patterns, EGU General Assembly 2024, Vienna, Austria, 14–19 Apr 2024, EGU24-10295, https://doi.org/10.5194/egusphere-egu24-10295, 2024.

EGU24-11109 | ECS | Orals | AS2.4

Time-scale turbulent transport extraction and high time resolution flux estimation using wavelet analysis 

Gabriel Destouet, Nikola Besic, Emilie Joetzjer, and Matthias Cuntz

Flux estimation from eddy-covariance flux tower measurements faces the problem of integrating fluxes only in the case of fully developed turbulence and in non-stationary environments with advective components. The standard eddy-covariance method operates on fixed-length signals, requiring the knowledge of a maximum correlation time-length as well as post-processing steps assessing the suitability and quality of the data. Statistical tests are carried out to assess if flux estimates were performed during sufficiently developed turbulence and if they were corrupted by advective components. Tests with friction velocity u* or σw, steady-state tests, and flux variance similarity are now standard during and after flux calculations. More elaborate methods such as ogive optimisation are used to deal with advection. An important disadvantage of all these statistical tests is that they discard the whole time interval such as half an hour if they detect failure.

Time-scale (time-frequency) analyses have been used as an alternative to the standard time-analysis approach to estimate ecosystem fluxes. In particular, wavelet analysis, which is well adapted to the study of non-stationary and scale invariant processes such as turbulence, has been used in previous works. It presents the ability of separating the different components of the flux in time-scale space and as such could be an efficient alternative for flux estimation avoiding the above statistical tests.

To address this problem, we propose a general framework for analysing fluxes in time-scale space, and propose a new method for identifying and extracting turbulent transport that avoids advective components and does not need statistical tests after the flux calculations. The new method is based on the analysis in time-scale domain of the amplitude of the vertical component of the Reynold stress tensor and can be seen as a time-scale transposition of standard tests mentioned above. As a direct consequence, we are able to estimate fluxes at high time resolution over times and scales with sufficiently developed turbulence. We show application of the framework at the beech forest site FR-Hes and demonstrate its relation with standard eddy covariance calculations. Our methodology is implemented in the Julia package TurbulenceFlux.jl and is readily available. The proposed framework and its code implementation is fully differentiable and hints to further investigations, such as the study of flux ecosystem response times, or sensitivity analysis against wavelet and averaging window parameters.

How to cite: Destouet, G., Besic, N., Joetzjer, E., and Cuntz, M.: Time-scale turbulent transport extraction and high time resolution flux estimation using wavelet analysis, EGU General Assembly 2024, Vienna, Austria, 14–19 Apr 2024, EGU24-11109, https://doi.org/10.5194/egusphere-egu24-11109, 2024.

EGU24-12298 | Posters on site | AS2.4

The dynamics of water vapor  absorption by soils typical of arid lands 

Pedro Berliner, Mercy Ama Boadi Manu, Dillia Kool, and Nurit Agam

Water vapor adsorption (WVA), a non-rainfall water input, is a poorly documented phenomenon despite its role in regulating water and energy fluxes in soils of coastal deserts. Water vapor movement towards the soil surface and its absorption by the soil occurs whenever the atmospheric water potential is higher than that of the air-filled soil pores. The latter is influenced by soil characteristics, in particular the soil surface area and pore connectivity. Thus, it is expected that under similar atmospheric conditions,  absorption of water vapor will be determined by soil characteristics. We carried out a detailed field trial in which we compared two loamy soils with different salt content.

Water vapor absorption was measured using micro-lysimeters (MLs) instrumented with relative humidity (RH) and temperature sensors at depths 0.5cm, 2cm, 5cm, 10cm, and 45cm in both MLs during the 2022 and 2023 summers. Total absorption was determined as the increase in mass from a minimum (obtained during late afternoon) to a peak observed on the next day before sunrise. Concurrent changes in soil water potential at each depth were computed by applying the Kelvin equation.

Relative humidity in both soils was low during the entire season with the average computed water potential values being lower in the high salt content soil. The total daily water vapor absorption was lower in the low salt content soil, and the rate of absorption was different . The temperature and RH distribution patterns with depth also differed consistently throughout the measuring season for both soils. The effect of salt on water vapor absorption will be highlighted.

How to cite: Berliner, P., Boadi Manu, M. A., Kool, D., and Agam, N.: The dynamics of water vapor  absorption by soils typical of arid lands, EGU General Assembly 2024, Vienna, Austria, 14–19 Apr 2024, EGU24-12298, https://doi.org/10.5194/egusphere-egu24-12298, 2024.

EGU24-13667 | Orals | AS2.4

Deployment of Doppler lidar within forests: Advancing our understanding of canopy-atmospheric boundary layer processes  

Sonia Wharton, Matteo Puccioni, Holly Oldroyd, Matthew Miksch, Matthias Falk, Stephan de Wekker, Robert Arthur, and Jerome Fast

The atmospheric boundary layer above forest canopies is difficult to measure in practice, and our understanding of its flow physics usually is still limited to tall tower measurements which have limited reach above the canopy, or vertically-profiling remote sensing measurements which are usually taken outside of the canopy. We present a recent 5-month study of wind flow measurements taken above a 50-m tall forest in Washington state, USA, using two Doppler lidars. One vertical-profiling lidar was placed directly on top of the 70-m tall Wind River National Ecological Observatory Network (NEON) tower and took measurements of wind velocity, direction and turbulence up to 220 m above ground level. A scanning lidar was placed in a nearby clearing and programmed to scan the wind field over the forest canopy, including overlapping its scans with the profiling lidar on top of the tower. The scanning lidar also captured terrain induced flows across the surrounding mountain-valley terrain. Both lidars captured wind jets and periods of intermittent turbulence over the forest canopy. How and when these mechanically-forced turbulence events penetrate the high leaf area index (LAI) forest canopy are studied using NEON’s eddy covariance flux exchange measurements and the tower profile measurements of air temperature, pressure, moisture, and wind velocity within the forest.


Applications of studying wind flow over the forest canopy are broad and vary from a better characterization of the wind profile for wind energy resource assessment to improving our understanding of vertical exchange processes by studying how “top-down” forced turbulence events influence mass and energy fluxes between the forest canopy and atmosphere. Special consideration of how above canopy processes influence canopy coupling/decoupling, including top-down turbulent sweep events, will be presented for the tall Wind River forest. We will also discuss upcoming experiments including 1) the deployment of 3-d sonic anemometers in the Wind River subcanopy (as part of a larger Integrated Carbon Observation System (ICOS) below-canopy study) to advance our understanding of canopy mixing processes and 2) a new campaign planned for the deciduous Mountain Lake Biological Station NEON tower in the mountains of Virginia, USA. The latter study is designed to observe changes in the above-canopy wind profile and its interactions with below-canopy flows and vertical flux exchanges across a summer-to-winter LAI transition.


How to cite: Wharton, S., Puccioni, M., Oldroyd, H., Miksch, M., Falk, M., de Wekker, S., Arthur, R., and Fast, J.: Deployment of Doppler lidar within forests: Advancing our understanding of canopy-atmospheric boundary layer processes , EGU General Assembly 2024, Vienna, Austria, 14–19 Apr 2024, EGU24-13667, https://doi.org/10.5194/egusphere-egu24-13667, 2024.

EGU24-14868 | Orals | AS2.4

Mapping soil moisture uptake by dry soils across Eddy covariance measurement sites 

Sinikka Paulus, Rene Orth, Sung-Ching Lee, Jacob A. Nelson, Anke Hildebrandt, Ngoc Nguyen, Markus Reichstein, and Mirco Migliavacca

Soils take up water vapor from the atmosphere through processes that involve vapor diffusion and water retention. This can theoretically occur in any ecosystem under the preconditions of a humid atmosphere and dry soil pores. It can play a critical role in dry ecosystems because it can provide a substantial proportion of the total water inputs at the daily timescale. However, it remains insufficiently investigated in many regions, partly due to the absence of continuous, dedicated measurements.

In this study, we use a recently developed algorithm to detect and filter Eddy Covariance (EC) derived negative latent heat flux data collected at semi-arid and arid sites to identify soil water vapor adsorption. In a previous study, we successfully used EC data to detect soil water vapor adsorption for a Mediterranean ecosystem. 

Our findings indicate that these negative latent heat fluxes exhibit a correlation with soil water content and relative humidity at various sites suggesting that a part of the negative latent heat flux is related to soil water vapor adsorption. Building on these findings, we demonstrate that soil water vapor adsorption occurs during the dry season in various ecosystems, including woody savannas, grasslands, shrublands, and even some forests. The flux magnitude reaches values comparable to daily evaporation, which is in line with existing literature on the few previously measured ecosystems.

Furthermore, we analyze the drivers of the occurrence and dynamics of soil water vapor across sites. Thereby we study the influence of e.g. soil texture or vegetation height. This way, our study expands our knowledge of the spatial extent and inter-annual dynamics of soil water vapor adsorption in natural ecosystems and, more generally, sheds light on a mostly overlooked aspect of land-atmosphere interaction.

How to cite: Paulus, S., Orth, R., Lee, S.-C., Nelson, J. A., Hildebrandt, A., Nguyen, N., Reichstein, M., and Migliavacca, M.: Mapping soil moisture uptake by dry soils across Eddy covariance measurement sites, EGU General Assembly 2024, Vienna, Austria, 14–19 Apr 2024, EGU24-14868, https://doi.org/10.5194/egusphere-egu24-14868, 2024.

EGU24-15005 | Posters on site | AS2.4

Climatology of surface parameters for the city of Turin using UTOPIA (Italy) land surface model 

Claudio Cassardo, Valentina Andreoli, Davide Bertoni, Sujeong Lim, Massimiliano Manfrin, and Seon K. Park

While there are several series of daily observations of temperature, precipitation and few other parameters available in many locations in the world, sometimes lasting more than a century, there are much less series of other variables related to the surfae atmospheric layer or underground soil, such as sensible and latent heat fluxes, soil heat flux, soil temperature and moisture in the root layer and below it. This work aims to propose a method to evaluate such parameters at a climatic time scale using a trusted land surface model, taking the variables from the outputs of the simulation and creating a database. In this work, the selected model is the UTOPIA (University of TOrino land surface Process Interaction model in Atmosphere). This technique can be applied in general to each site in which hourly observations of the seven parameters needed for the simulation are available (temperature, humidity, pressure, the two components of the horizontal wind velocity, precipitation and solar radiation or cloudiness). In a preliminary phase, the database will be created on the period 1992-2023, on which we have the availability of hourly measurements carried out at the Department of Physics of the Turin University. In a second phase, we plan to develop a methodology to derive hourly observtions from the existing series of data gathered in the city of Turin, using peculiar methods to interpolate or extrapolate the missing observations of required inputs and to downscale hourly observations from daily observations. This methodology could be tested using the eisting data in the recent climate period.

How to cite: Cassardo, C., Andreoli, V., Bertoni, D., Lim, S., Manfrin, M., and Park, S. K.: Climatology of surface parameters for the city of Turin using UTOPIA (Italy) land surface model, EGU General Assembly 2024, Vienna, Austria, 14–19 Apr 2024, EGU24-15005, https://doi.org/10.5194/egusphere-egu24-15005, 2024.

EGU24-15582 | ECS | Posters on site | AS2.4

A satellite-based analysis of fog and low stratus life cycle processes in the Po valley, Italy 

Eva Pauli, Jan Cermak, Hendrik Andersen, and Michaela Schütz

A better understanding of fog and low stratus (FLS) life cycle processes can help traffic safety, improve solar power planning and enhance the understanding of ecosystem processes in fog-prone regions. Nevertheless, large-scale analyses of FLS life cycle processes are challenging due to the high spatial variability of FLS and complex interactions between the land surface and the atmosphere.

Here, we use a satellite-based FLS formation and dissipation time data set, as well as reanalysis data to investigate regional variations in the FLS life cycle in the Po valley region in northern Italy. With its large spatial extent, relatively low topographic variability and high FLS occurrence, the Po valley is an ideal area to study FLS life cycle processes in central Europe. In a case study approach, we analyze FLS life cycle processes pertaining to variations in land surface characteristics and atmospheric drivers. First results reveal the importance of the temporal development of temperature, specific humidity and boundary layer height for FLS formation during radiation-driven FLS events. These effects are further modified by the local topography and the synoptic situation.

This analysis provides a basis to set up further process-oriented sensitivity studies using explainable machine learning, which has shown to be an ideal tool to gain a deeper understanding of the effect of non-linear land-atmosphere interactions on the FLS life cycle.

How to cite: Pauli, E., Cermak, J., Andersen, H., and Schütz, M.: A satellite-based analysis of fog and low stratus life cycle processes in the Po valley, Italy, EGU General Assembly 2024, Vienna, Austria, 14–19 Apr 2024, EGU24-15582, https://doi.org/10.5194/egusphere-egu24-15582, 2024.

EGU24-16214 | ECS | Orals | AS2.4

Microphysical and Electrical Characteristics of Fog in the United Arab Emirates 

Narendra Reddy Nelli, Diana Francis, Ricardo Fonseca, Olivier Masson, Mamadou Sow, Rachid Abida, and Emmanuel Bosc

Fog is a prevalent weather phenomenon in several arid regions, including the Empty Quarter desert in the United Arab Emirates (UAE), located on the northeastern side of the Arabian Peninsula. Despite being primarily an arid country with desert landscapes dominating its terrain, most events causing visibility to drop below 1 km in the UAE are attributed to condensation processes rather than dust occurrences. We present in-situ measurements of fog microphysics from the Barakah Nuclear Power Plant (BNPP, a coastal site located at 23.968052°N, 52.267309°E) and atmospheric electric field measurements obtained during the Wind-blown Sand Experiment (WISE)-UAE field campaign conducted at Madinat Zayed (23.5761° N, 53.7242° E; elevation: 119 m).

Measurements of fog microphysics were conducted during the winter season of 2021 -2022 at the BNPP, located in the Western coastal region of the United Arab Emirates. Twelve fog events were observed during this period. The primary objective of this study is to detail the microphysical characteristics of these events and refine current visibility parameterization schemes based on in-situ measurements of fog microphysical properties. All observed fog events are found to share a common feature: a bimodal distribution in droplet number concentration (Nc), with modes at 4.5 µm and 23.2 µm . Despite the high proportion of fog smaller droplets associated with the fine mode, the greatest contribution to the liquid water content (LWC) comes essentially from medium to large droplets between 10 µm and 35 µm. The recalibration of existing visibility parameterization schemes revealed that the decrease (increase) in horizontal visibility with increasing (decreasing) LWC (FI, fog index) tends to be more gradual for the studied cases compared to standard visibility parameterization schemes. Additionally, the fog sedimentation velocity, estimated to be at a maximum of 1.85 cm s-1, occurs predominantly in the LWC range of 100 - 200 mg m3, corresponding to a median volume diameter 24.8 µm. Our findings shed new light on the complexity of fog microphysics and its impact on visibility, underscoring their importance in refining weather models for accurate fog forecasting.

For the first time, the changes in the atmospheric electric field (Ez) during foggy conditions is studied in a hyper-arid region; the United Arab Emirates (UAE), using comprehensive measurements during the Wind-blown Sand Experiment (WISE)-UAE. The longer the fog persists, the more variable Ez becomes, primarily due to the fog's ability to absorb and redistribute the charges of the atmospheric small ions. This absorption alters the ion balance, affecting electrical conductivity within the atmosphere, which in turn leads to sustained alterations in Ez. A record high Ez value of 2571 V m-1 was measured during a long-lasting fog event. Ez values returned to normal during the fog dissipation phase. The results of this work can be applied to develop techniques for fog harvesting and to improve fog forecasting by accounting for the effect of the electric field on fog lifetime and characteristics.

How to cite: Nelli, N. R., Francis, D., Fonseca, R., Masson, O., Sow, M., Abida, R., and Bosc, E.: Microphysical and Electrical Characteristics of Fog in the United Arab Emirates, EGU General Assembly 2024, Vienna, Austria, 14–19 Apr 2024, EGU24-16214, https://doi.org/10.5194/egusphere-egu24-16214, 2024.

EGU24-16368 | ECS | Posters on site | AS2.4

Examining the fog occurrence over the Bucharest Henri Coandă International Airport and its adjacent area 

Alex Vlad, Gabriela Iorga, Nicu Barbu, and Sabina Stefan

Fog forecasting and fog nowcasting events are challenging issues especially when the fog phenomenon appears in the vicinity of airports because the reduced visibility associated with fog represent a high risk for air traffic events. Bucharest Henri Coandă International Airport (OTP, 44.57°N, 26.1°E, 95 m above sea level) is the largest airport in Romania and is located about 16 km north of Bucharest, the capital and most developed city of Romania. Its surroundings are comprised partly of residential and natural protected areas, and partly have agricultural use. Due to its geographic position, the airport is an important air traffic hub on the routes between western and eastern world destinations. In terms of numbers of flights, during the observation period analyzed here, the air traffic at OTP was significantly lowered during the spring of 2020 due to COVID-19 pandemic but soon after the restrictions were lifted and due to redirection of the flights over Ukraine after 2022, the air traffic is significantly increased in present.

Data and analyses reported here cover a period of 2 decades from the beginning of 2003 to the end of 2023. Meteorological data, including fog events, relative humidity, wind speed and direction, were measured by the weather station of Romanian Air Traffic Services Administration ROMATSA R.A. Data about boundary layer and solar radiation was extracted from the public available database from the European Centre for Medium-Range Weather Forecasts (ECMWF) ERA5.

Present study reports the analysis of the evolution of the frequency of fog events and the relationships between fog events and speed and direction of the wind, and between fog events and the relative humidity. The correlations between the boundary layer height, solar radiation and the fog events were also investigated. Bivariate polar plots revealed fog appears with higher frequency (about 32%) during cold season, from October to March, and during early morning hours. Overview of the entire data set shows in some years mono-modal distributions of the fog frequency of occurrence with respect to the local time with peaks during the night and in the early morning hours and mono-modal flat distributions in other years. We observed the fog events are correlated with dominant wind directions of east-nord-east (ENE) and west-south-west (WSW). Statistical analysis of the data also showed a prevalence of the radiation fog over the advection fog.

Acknowledgement: AV was supported by the University of Bucharest, PhD research grant. AV acknowledges the partial funding from the NO Grants 2014-2021, under Project contract no. 31/2020, EEA-RO-NO-2019-0423 project. Data regarding boundary layer and solar radiation was extracted from the public available database from the European Centre for Medium-Range Weather Forecasts (ECMWF) ERA5. We thank ROMATSA R.A. for access to the database.

How to cite: Vlad, A., Iorga, G., Barbu, N., and Stefan, S.: Examining the fog occurrence over the Bucharest Henri Coandă International Airport and its adjacent area, EGU General Assembly 2024, Vienna, Austria, 14–19 Apr 2024, EGU24-16368, https://doi.org/10.5194/egusphere-egu24-16368, 2024.

EGU24-16844 | Posters on site | AS2.4

Leaf thermoregulation and fog wetting dynamics of Erica platycodon in a Macaronesian cloud forest 

Carlos M. Regalado, Omar Garcia-Tejera, and Axel Ritter

Interception of fog droplets in cloud forests leads to wetting of the canopy, hampering transpiration and affecting the energy dynamics of the vegetation due to evaporation of the leaf water lamina and the reduction in the incoming solar radiation. We carried out continuous concurrent measurements of the canopy temperature (through infrared thermometers), artificial leaf wetness (LWS) and the micrometeorology of a cloud forest in the Anaga Biosphere Reserve (Tenerife, Canary Islands) during a 4-month period. Fog presence at the site, characterized by visibility measurements (Ω), was coincidental with variations in LWS and a decline in net solar radiation, Rn, i.e. 62.2 W m-2 during foggy conditions (Ω < 1 km) versus 245.0 W m-2 for fog-free conditions (Ω ≥ 1 km). Infrared readings during foggy conditions of one of the representative species of the cloud forest stand, the perennial tree Erica platycodon, showed that differences between canopy and ambient temperatures were primarily driven by Rn. After a fog event, E. platycodon was estimated to remain wet for at least 30 minutes up to 2.25 hours. This study provides information about the consequences of fog in the wetting/drying dynamics of cloud forests of the Canary Islands and their leaf thermoregulation.

How to cite: Regalado, C. M., Garcia-Tejera, O., and Ritter, A.: Leaf thermoregulation and fog wetting dynamics of Erica platycodon in a Macaronesian cloud forest, EGU General Assembly 2024, Vienna, Austria, 14–19 Apr 2024, EGU24-16844, https://doi.org/10.5194/egusphere-egu24-16844, 2024.

EGU24-16949 | ECS | Posters on site | AS2.4

Measuring Greenhouse Gas Exchange from Paddy Field Using Eddy Covariance Method in Mekong Delta, Vietnam 

Khue Vu Hoang Ngoc, Georg Jocher, Vu Le D. A., Son Le T., An Bui T., Bang Ho Q., and Huong Pham Q.

Agriculture is an important economic sector of Vietnam, the most common is wet rice cultivation. Wet rice cultivation is known as the main contributor to national greenhouse gas emissions. To better understand greenhouse gas exchange in wet rice cultivations and to investigate the factors influencing carbon cycling and sequestration in these types of ecosystems, since 2019, the first eddy covariance station has been installed in a paddy field in Long An province, Mekong Delta, Vietnam. The station is equipped with state-of-the-art equipment for CO2 and CH4 gas exchange and meteorological ancillary measurements. Data from the station are processed following the ICOS recommendations (Integrated Carbon Observation System) for CO2. For CH4, data are separately processed and gap-filled using a random forest model from methane-gap fill-ml, a machine learning package, as there is no standard method for CH4 flux gap-filling yet. Finally, the CO2 equivalent (CO2eq) based on CO2 and CH4 fluxes was estimated. The study area implemented a new water management practice called alternate wetting and drying, which helps to save water and reduce methane emissions. This practice resulted in the minor release of 0.8 kg CH4 per hectare in 2020 and 0.67 kg CH4 per hectare in 2021. However, CO2eq from the rice fields was negative, indicating that the rice fields acted as a sink for CO2eq, with -5.54 kg CO2eq per hectare in 2020 and -7.03 kg CO2eq per hectare in 2021. On a provincial level, rice cultivation activities in Long An, with a total area of 498293 ha, resulted in a CO2eq uptake of 2760 and 3503 tons in 2020 and 2021, respectively. This result is in contrast to the initial hypothesis that rice fields are a source of greenhouse gases. However, N2O was not investigated in this study, which is also known as a strong greenhouse gas.

How to cite: Vu Hoang Ngoc, K., Jocher, G., Le D. A., V., Le T., S., Bui T., A., Ho Q., B., and Pham Q., H.: Measuring Greenhouse Gas Exchange from Paddy Field Using Eddy Covariance Method in Mekong Delta, Vietnam, EGU General Assembly 2024, Vienna, Austria, 14–19 Apr 2024, EGU24-16949, https://doi.org/10.5194/egusphere-egu24-16949, 2024.

EGU24-17604 | ECS | Orals | AS2.4

The role of forest canopy-wind interactions on experimental fire behavior using coupled atmosphere-fire modeling 

William Antolin, Mélanie Rochoux, and Patrick Le Moigne


Session: AS2.4: Air-Land Interactions


Abstract:

Experimental fires provide insights into the behavior of wildland fires and their interactions with the atmosphere. They help modelers build simulations capable of accurately describing fire dynamics, and which can help identify the key processes driving fire development. In particular, the FireFlux I case (a tall grass fire covering 30 hectares) was the first experimental fire to provide in situ measurements of atmospheric dynamics near the fire, highlighting the complexity of fire-induced flows and the importance of fire-induced upward vertical motion (Clements et al. 2007). Despite much theoretical work on forest canopy turbulence, its interactions with fire dynamics are still poorly understood, while they could play an important role (Heilman et al. 2021).

One of the difficulties in wildland fire simulations stems from the disparity between scales. Highly detailed models based on computational fluid dynamics (CFD) tend to represent chemical, radiation, and turbulence processes at the cost of reduced domain size. Conversely, meteorological models tend to provide a better representation of ambient wind over a larger domain size, but this is at the expense of parameterization choices. An intermediate modeling scale is needed to represent the geographical and micrometeorological scales involved in a wildland fire, especially in the development of the fire plume and the induced air entrainment. In recent years, we have therefore worked on designing and validating a coupled atmosphere-fire model, Meso-NH/BLAZE (Costes et al. 2021), where BLAZE represents the fire as a propagating flaming front and Meso-NH is run in large-eddy simulation (LES) mode at high resolution (10-100 m). This preliminary work has highlighted the predominant influence of surface wind on fire behavior and thus the critical need to make it more representative.

In this study, we show that accounting for interactions between forest canopy, surface wind and fire can be done by adding a drag term in the Meso-NH momentum and TKE equations (Aumond et al. 2013), and by running coupled atmosphere-fire simulations at very high resolution (10m and finer). We also assess for the FireFlux I case, the impact of the forest canopy on fire spread through several original data analyses, including wavelet transforms, fire-canopy interaction statistics, and sensitivity to atmospheric turbulence.


References

Clements, C. B., et al. (2007) Observing the Dynamics of Wildland Grass Fires: FireFlux – A Field Validation Experiment. Bull. Amer. Meteor. Soc., 88, 1369–1382. doi: 10.1175/BAMS-88-9-1369

 E.Heilman WE, et al. (2021) Observations of Sweep–Ejection Dynamics for Heat and Momentum Fluxes during Wildland Fires in Forested and Grassland Environments. Journal of Applied Meteorology and Climatology 60(2), 185–199. doi:10.1175/jamc-d-20-0086.1

Costes, A., et al. (2021) Subgrid-scale fire front reconstruction for ensemble coupled atmosphere-fire simulations of the FireFlux I experiment. Fire Safety Journal, 126, 103475, doi: 10.1016/j.firesaf.2021.103475

Aumond, P., et al. (2013) Including the drag effects of canopies: Real case large-eddy simulation studies. Boundary-Layer Meteorology, 146, 65–80, doi: 10.1007/s10546-012-9758-x

How to cite: Antolin, W., Rochoux, M., and Le Moigne, P.: The role of forest canopy-wind interactions on experimental fire behavior using coupled atmosphere-fire modeling, EGU General Assembly 2024, Vienna, Austria, 14–19 Apr 2024, EGU24-17604, https://doi.org/10.5194/egusphere-egu24-17604, 2024.

EGU24-18634 | ECS | Posters on site | AS2.4

Urban Surface Energy Flux Estimations Utilizing a Thermodynamic Analytical Framework 

Mayank Gupta, Ajinkya Khandare, and Subimal Ghosh

At the local scale, energy exchange shapes microclimates and ecosystems crucial for human health and well-being. For urban areas, the effect, such as Urban Heat Island, is directly manifested in these surface energy fluxes with contrasting responses in values between urban and rural areas. Although progress has been achieved in modeling the land surface energy balance, challenges arise from complex, variable parameterizations linked to surface and climate characteristics, introducing uncertainties. In this work, we utilized the thermodynamic theory that considers the land-atmosphere as a radiative-convective system to analytically estimate total turbulent heat flux and land surface heat storage flux for 20 Urban sites and compared them with Eddy covariance observations. The heat fluxes are determined only from four primary parameters: incoming and outgoing longwave and shortwave radiations at the terrestrial surface. Using the monthly averages derived from the total turbulent flux estimates at the eddy covariance sites, we observed root-mean-square error (RMSE) of 29.16 ± 11.3 Wm−2, a mean bias error (MBE) of -7.09 ± 19.6 Wm−2 and R2 value of 0.82 ± 0.16. We further tested the analytical estimates with land use land cover of Urban sites. Our findings illustrate the distribution of land surface heat storage flux estimates following land use land cover characteristics. The analytical estimates of heat fluxes for urban areas offer several advantages, such as ease of implementation and inexpensive computation, facilitating the evaluation of urban land use feedback for informed urban planning.

How to cite: Gupta, M., Khandare, A., and Ghosh, S.: Urban Surface Energy Flux Estimations Utilizing a Thermodynamic Analytical Framework, EGU General Assembly 2024, Vienna, Austria, 14–19 Apr 2024, EGU24-18634, https://doi.org/10.5194/egusphere-egu24-18634, 2024.

EGU24-20860 | ECS | Posters on site | AS2.4

Laboratory analysis on fog harvesting meshes employing durability tests 

Maria Giovanna Di Bitonto, Carol Monticelli, Salvatore Viscuso, and Alessandra Zanelli

Fog harvesting, an ancient water extraction technique, has gained renewed attention in recent years with the introduction of the Fog Water Collector. Comprising a mesh and supporting structure, this collector has proven effective in extracting water from atmospheric moist air. The Raschel mesh, initially designed for agricultural purposes, has become the predominant choice due to its affordability and widespread availability. Current research endeavors aim to enhance fog water yield by optimizing both collector design and mesh properties.

While Raschel mesh coatings have traditionally been explored to improve efficiency, recent findings suggest that alternative meshes may outperform the conventional Raschel mesh. However, challenges persist in understanding the resistance, lifespan, and maintenance requirements of these newer materials.

Our research takes a systematic approach to address this gap by assessing the durability of various fog harvesting meshes under laboratory conditions. A series of standardized tests are conducted to evaluate their efficiency, providing insights into the intricate relationship between cost, water collection efficiency, duration, and environmental impact. The study aims to inform decision-making processes surrounding fog harvesting mesh selection, considering factors such as initial investment, operational efficiency, and long-term sustainability.

By conducting these analyses in a controlled laboratory environment, we aim to provide valuable insights without the logistical challenges associated with field studies. This approach allows for a thorough examination of fog harvesting mesh performance, contributing to the broader understanding of NRWIs and their potential applications at different scales.

How to cite: Di Bitonto, M. G., Monticelli, C., Viscuso, S., and Zanelli, A.: Laboratory analysis on fog harvesting meshes employing durability tests, EGU General Assembly 2024, Vienna, Austria, 14–19 Apr 2024, EGU24-20860, https://doi.org/10.5194/egusphere-egu24-20860, 2024.

EGU24-22205 | Posters on site | AS2.4

Quantification of storage change at two contrasting eddy covariance sites 

Anastasia Gorlenko, Konstantinos Kissas, Charlotte Scheutz, and Andreas Ibrom

Eddy covariance (EC) flux measurements are relevant for the study of global change biology when integrated over long-term periods (Baldocchi, 2019). This could lead to researchers being reluctant to adopt state-of-the-art correction methods, especially for sites that have collected continuous data and trends for the last 20 years. The storage change (SC) correction has often been overlooked and simplified and is generally under-investigated in the literature. The present study highlights the dynamics of the storage change term in two different landscapes and proposes a simple correction factor that can be applied backwards to historical data in a forested ecosystem.

The first studied site is a mixed deciduous forest in Denmark (DK-Sor), where a sequential vertical profile system (12 heights) has been installed in 2021 to characterize the vertical component of the storage change more accurately. We compare the often-used 1 point method with the results from the profile system for CO2 and H2O. We study the SC component in terms of its diurnal course, its impact on the annual carbon budget, and its relation to atmospheric stability parameters.

The second site is a Danish rural area (DK-Hove), where four different greenhouse gas fluxes are measured with EC sensors installed at 3 heights on a 200 m tall telecommunication tower. The SC profile system here consists of 5 levels and needs to adapt to the dynamic eddy covariance measurement height of the landscape-scale GHG monitoring system. We present 6 months of SC data from the tall tower for CO2, CH4, N2O and CO, their diurnal courses and relation to meteorological variables.

Overall, this work aims at bringing an additional contribution to shed light on the often-neglected SC term.


Reference:

Baldocchi, Dennis D. How eddy covariance flux measurements have contributed to our understanding of Global Change Biology. United Kingdom: N. p., 2019. Web. doi:10.1111/gcb.14807.

How to cite: Gorlenko, A., Kissas, K., Scheutz, C., and Ibrom, A.: Quantification of storage change at two contrasting eddy covariance sites, EGU General Assembly 2024, Vienna, Austria, 14–19 Apr 2024, EGU24-22205, https://doi.org/10.5194/egusphere-egu24-22205, 2024.

EGU24-22211 | Orals | AS2.4

Optimising the sampling strategy in tall tower eddy covariance flux measurements 

Andreas Ibrom, Konstantinos Kissas, Anastasia Gorlenko, and Charlotte Scheutz

Tall tower eddy covariance (EC) measurements can be used to narrow down the gap between the ecosystem and the continental scale observations by capturing greenhouse gas (GHG) fluxes in a landscape scale (>10 km2). Because of the large footprint, tall tower platforms enable monitoring of greenhouse gas net fluxes, integrating over a multitude of diverse GHG sources and sinks within anthropogenic ecosystems. Yet, the temporal variability of atmospheric stability and atmospheric boundary layer affects the size of the flux footprint and the quality of EC flux estimates, respectively, thereby complicating the interpretation of surface flux estimates. The objective of this study is to determine an optimal sampling scheme alternating between different measuring heights (zm) in order to maximise the number of valid flux measurements as well as mitigating the effect of weather fluctuations on the longitudinal position of the footprint.

We used a six months’ data set of continuous turbulence data measured from a recently deployed prototype flux observation station in a rural area close to the Danish Capital of Copenhagen, Zealand. The system is mounted on a 200 m telecommunication tower equipped with 3D ultrasonic anemometers in three different heights (70m, 90m, 115m) and with a TILDAS GHG analyser capable of switching between three sampling lines corresponding to the specified heights.

We define an optimal sampling strategy based on the peak location of the individual, crosswind-integrated footprints from valid samples. As valid, we characterized those flux measurements, when the zm was within the constant flux layer, as estimated from ceilometer measurement. For each of the half hours, we selected the zm with the footprint’s peak location closest to a target position.

In this presentation, we demonstrate the ability to constrain the flux footprint within a target landscape area by establishing a sampling schedule across the three sampling heights. The results showed that designing a sampling strategy that combines multiple heights has the potential to bring the aggregated footprint for the entire period (footprint climatology) closer to the targeted area. A similar outcome can be attained when sampling from a single height and excluding the instances where the footprint significantly deviates from the target area. Nevertheless, this comes with the trade-off of discarding valid data. Moreover, the weather effect on the variability of the crosswind-integrated footprints was reduced by setting an optimal, multi-height strategy in comparison to the aggregated footprints from the individual heights.

How to cite: Ibrom, A., Kissas, K., Gorlenko, A., and Scheutz, C.: Optimising the sampling strategy in tall tower eddy covariance flux measurements, EGU General Assembly 2024, Vienna, Austria, 14–19 Apr 2024, EGU24-22211, https://doi.org/10.5194/egusphere-egu24-22211, 2024.

The Kentucky Mesonet is a great asset for the Commonwealth of Kentucky, from realtime storm monitoring to building a detailed climate record. A detailed climate record is essential as causality between observations and extreme weather can be identified. The climate record being developed at the 80+ Kentucky Mesonet observation stations consists of approximately 75 indices. The indices include frequency, extremes, range, duration, and trends of precipitation, droughts, and temperature. For example, calculations of Warm/Dry days (daily mean temperature > 75th percentile of daily mean temperature and daily mean rainfall < 25th percentile of daily precipitation sum where the percentiles are based on a climatology taken from reanalysis between 1961 and 1990) are done for daily, monthly, seasonal, bi-annual, and annual aggregation periods. Particular attention will given to soil moisture - precipitation feedbacks as Kentucky has a karst geology which generates soil moisture gradients. Soil Moisture-precipitation feedbacks, the beginning and ending of land-atmosphere interactions in general, are highly dependent on the wind flow regime and atmospheric stability, so these relationships will elucidated in the presentation.  Tools will be developed based on interactions with policymakers and stakeholders as they will be making decisions today that impact the region’s main economic sectors (e.g. water, energy, transportation, etc.) as infrastructure erected today will likely be in place when the climate is different than at present. Examples will be provided that sample the different climate zones of the state, relative elevations of site locations, as well as different land cover and land uses.

How to cite: Rappin, E.: Land-Atmosphere Interactions as Observed by a Statewide in-situ Surface Observation Network, EGU General Assembly 2024, Vienna, Austria, 14–19 Apr 2024, EGU24-22465, https://doi.org/10.5194/egusphere-egu24-22465, 2024.

EGU24-6685 | PICO | AS2.5

Evaluation of errors in bulk aerodynamic parameterizations over snow-covered sea ice due to approximations of roughness length 

Christopher Cox, Michael Gallagher, Ola Persson, Chris Fairall, Matthew Shupe, Ludovic Bariteau, Elizabeth Thompson, and Byron Blomquist

Direct measurements using eddy covariance methodology of turbulent heat and momentum fluxes were observed from the Met City tower during MOSAiC. In models, these fluxes are parameterized using bulk aerodynamic algorithms for which the transfer coefficients must be found. In practice, the coefficients are constrained iteratively to resolve the co-dependence between Obukhov Length (necessary for calculating the coefficients) and the friction velocity, u* (an expression of the Reynold’s stress solved for by the algorithm). The aerodynamic roughness length, z0, is also needed to calculate the coefficients. For calculations over the global ocean, z0 is coupled to the atmosphere through u*. However, over sea ice the meteorological correlation is weak and the physical surface roughness is heterogeneous and decoupled from the atmosphere. This introduces a vulnerability into the calculation and necessitates assumptions about z0. At MOSAiC, the tower measurements of z0 show an evolution from early- to late-winter of nearly 2 orders of magnitude where 1 order nominally corresponds to a 30-40% differences in the derived fluxes. In this presentation we evaluate the error in bulk calculations due to the z0 assumption to assess what could be gained from a surface aware scheme.

How to cite: Cox, C., Gallagher, M., Persson, O., Fairall, C., Shupe, M., Bariteau, L., Thompson, E., and Blomquist, B.: Evaluation of errors in bulk aerodynamic parameterizations over snow-covered sea ice due to approximations of roughness length, EGU General Assembly 2024, Vienna, Austria, 14–19 Apr 2024, EGU24-6685, https://doi.org/10.5194/egusphere-egu24-6685, 2024.

Mixed-phase stratocumulus clouds in the polar region affect high-latitude climate in many ways, not least by regulating the boundary layer moisture and energy budgets. Sea ice coverage and thickness are decreasing sharply under global warming, changing the characteristics of the surface underlying much of the polar boundary layer, and the circulation patterns that govern lower tropospheric temperature and humidity inversions may change as well. Given the strength of ocean-ice-atmosphere interactions in the polar boundary layer, it is imperative to understand how different surface and atmospheric inversion conditions affect cloud formation and characteristics from both microphysical and macrophysical perspectives. Stable water isotopes have excellent potential as a tool to study the water cycle in the polar boundary layer, but their applications to understanding mixed-phase clouds in the polar region are limited by the lack of both direct observations and isotope-enabled models at appropriate spatial and temporal scales. Recent observational campaigns such as MOSAiC have observed isotopic composition at and near the Arctic surface under a range of different conditions, creating opportunities to expand the use of isotopes in Arctic water cycle research. Previous research has also established the ability of large-eddy simulations (LESs) to explicitly resolve boundary layer processes in the Arctic region and simulate the sensitivity of Arctic clouds to different atmospheric and surface conditions. To better exploit the potential of recent isotopic observations, we have developed an isotope-enabled large eddy model based on the PyCLES (Python Cloud Large Eddy Simulation) model framework to close some of the gaps between observations and modeling in the study of polar boundary layer clouds. iPyCLES is equipped with a two-moment microphysics scheme and includes representations of all essential isotopic fractionation processes at the surface and within clouds. In this presentation, we briefly introduce a series of sensitivity experiments targeting different surface and tropospheric inversion conditions to evaluate the isotopic signatures of surface-ice-atmosphere interactions within the polar boundary layer. The simulations are based on two well-studied field campaigns conducted near Barrow, Alaska, one in spring and one in autumn. Together with standard metrics of cloud evolution and turbulence mixing, isotope ratios in water vapor, cloud liquid and ice, and snow are tracked during the simulation. Isotopic signatures of each experiment are evaluated for their potential to provide observable constraints on polar clouds and boundary layer processes.

How to cite: Hu, Z. and Wright, J.: Large-Eddy Simulations of the Isotopic Signatures of Arctic Mixed-Phase Stratocumulus Clouds Under Different Surface and Atmospheric Conditions, EGU General Assembly 2024, Vienna, Austria, 14–19 Apr 2024, EGU24-7284, https://doi.org/10.5194/egusphere-egu24-7284, 2024.

EGU24-8132 | ECS | PICO | AS2.5

Sources and processes governing the annual cycle of aerosol chemical composition in the central Arctic Ocean 

Benjamin Heutte, Lubna Dada, Imad El Haddad, Jakob B. Pernov, Gang Chen, Kaspar R. Daellenbach, Vaios Moschos, Hélène Angot, Matthew Boyer, Nora Bergner, Jessie M. Creamean, Kerri A. Pratt, Jessica A. Mirrieless, Rachel Kirpes, Andrew P. Ault, Matthew D. Shupe, Silvia Henning, Paul Zieger, Tuija Jokinen, and Julia Schmale and the the EERL and INAR teams (continued)

Aerosols play a crucial role in the radiative balance of the Arctic, a place that is warming at faster rates than anywhere else on Earth. As a function of their physicochemical state (size, abundance, chemical composition, degree of aging and mixing state), aerosols can directly interact with the incoming solar radiation by absorbing or scattering light, and/or serve as seeds for cloud formation, thus indirectly modulating the amount of shortwave and longwave radiation respectively reaching and escaping the Earth’s surface. In the central Arctic Ocean, observations of the aerosols’ physicochemical characteristics have mostly been limited to summertime. As a result, large knowledge gaps remain on the role of aerosols in the central Arctic radiative budget throughout the year, in particular during the dark autumn and winter months, with great implications for model performances. Here, we present the first annual central Arctic Ocean observations of the chemical composition of submicron aerosols, as measured by a high-resolution time-of-flight aerosol mass spectrometer (AMS) during the “Multidisciplinary drifting Observatory for the Study of Arctic Climate” (MOSAiC) expedition. Measurements from the Arctic Ocean 2018 expedition close the summer data gap when no chemical composition measurements were available during MOSAiC. Based on the size-resolving and high-time resolution capabilities of the AMS, we further investigate the sources, emission processes, and potential radiative impacts of aerosols during the aerosol-sensitive autumn season. We find that episodic events of blowing snow and long-range transport of pollutants from lower latitudes are key contributors to the submicron aerosol and cloud condensation nuclei number concentrations, where blowing snow represents the only source of Aitken mode aerosols.

Focusing on the spring and summer, we also present the results of a source apportionment study focused on the chemical and geographical sources of organic aerosols (OAs). Using a statistical method called positive matrix factorization, we find that anthropogenic OAs, of Eurasian origin, dominate the central Arctic Ocean OAs budget until at least the month of May. Warm air mass intrusions in mid-April are found to bring large amount of pollution to the central Arctic, with a chemical composition distinct from that of the background haze. Episodic bursts in naturally-sourced marine OAs, originating from the marginal ice-zone and open ocean regions, become increasingly important during summer.

Together, the results from these studies will serve to greatly improve our understanding of aerosol sources and related physicochemical properties in the central Arctic Ocean, as well as their role in the central Arctic radiative budget.

How to cite: Heutte, B., Dada, L., El Haddad, I., Pernov, J. B., Chen, G., Daellenbach, K. R., Moschos, V., Angot, H., Boyer, M., Bergner, N., Creamean, J. M., Pratt, K. A., Mirrieless, J. A., Kirpes, R., Ault, A. P., Shupe, M. D., Henning, S., Zieger, P., Jokinen, T., and Schmale, J. and the the EERL and INAR teams (continued): Sources and processes governing the annual cycle of aerosol chemical composition in the central Arctic Ocean, EGU General Assembly 2024, Vienna, Austria, 14–19 Apr 2024, EGU24-8132, https://doi.org/10.5194/egusphere-egu24-8132, 2024.

EGU24-10025 | ECS | PICO | AS2.5

Analysis of the vertical dispersion of pollution layers in the urban Arctic during the ALPACA 2022 field campaign 

Roman Pohorsky, Andrea Baccarini, Brice Barret, Natalie Brett, Slimane Bekki, Elsa Dieudonné, Gianluca Pappaccogli, Federico Scoto, Antonio Donateo, Maurizio Busetto, Stefano Decesari, Steve Arnold, Javier Fochesatto, William Simpson, Kathy Law, and Julia Schmale

The Alaskan Layered Pollution and Chemical Analysis (ALPACA) field campaign was conducted during the winter months of January and February 2022 to examine urban pollution sources and transformations in Fairbanks, Alaska. Several data collection sites were set up throughout the city to investigate the less-explored dynamic, physical, and chemical mechanisms governing air pollution events during the cold and dark winter.

The vertical dispersion of pollutants was investigated from an observation site in the suburban area just outside downtown Fairbanks. It featured ground-based measurements, a ten-meter mast for eddy covariance measurements, and a tethered balloon for vertical profiling of the atmosphere. Sampling included measurements of aerosol microphysical characteristics and trace gases (CO, CO2, O3, NOx).  Meteorological parameters were also continuously measured at 2m and 10m from the mast, and also during the balloon flights. The tethered balloon was deployed to assess the vertical mixing of pollutants under stable atmospheric conditions from sources located at the surface but also at higher elevations, such as emissions from high power plant stacks.

A total of 148 individual profiles (up to a maximum altitude of 350 m above ground level) from 24 flights were collected between January 26 and February 25, 2022. The atmospheric conditions featured surface-based temperature inversions (SBI) in 86% of the cases due to the upwelling longwave radiation dominating the surface energy budget. Interestingly, eight flights captured elevated pollution plumes from power plants located downtown.   

The analysis of profiles reveals that the atmospheric stability and mixing of the surface layer was affected by two mechanisms. On one hand, radiative cooling promoted strong SBI locally, suppressing turbulence. On the other hand, a drainage flow at the surface from a nearby valley increased the shear stress at the surface, promoting mechanical turbulence near the surface. The measurements show how these two competing mechanisms affect the mixing of the surface layer.

The second part of the study focuses on the vertical dispersion of elevated plumes. The vertical mixing of pollutant plumes and their potential to contribute to surface pollution are investigated using the chemical and physical signature of the plumes and their vertical extents.

Together, the results of this study contribute to improving our understanding of pollution mixing under the very stable conditions typical of the Arctic winter and can help to design pollution mitigation strategies by identifying the conditions and mechanisms leading to high pollution events. 


How to cite: Pohorsky, R., Baccarini, A., Barret, B., Brett, N., Bekki, S., Dieudonné, E., Pappaccogli, G., Scoto, F., Donateo, A., Busetto, M., Decesari, S., Arnold, S., Fochesatto, J., Simpson, W., Law, K., and Schmale, J.: Analysis of the vertical dispersion of pollution layers in the urban Arctic during the ALPACA 2022 field campaign, EGU General Assembly 2024, Vienna, Austria, 14–19 Apr 2024, EGU24-10025, https://doi.org/10.5194/egusphere-egu24-10025, 2024.

EGU24-10160 | ECS | PICO | AS2.5

Insight in Antarctic aerosol particle composition regarding free amino acids 

Christina Breitenstein, Manuela van Pinxteren, Sebastian Zeppenfeld, and Hartmut Herrmann

As a pristine region, the Antarctic peninsula can be a model for the preindustrial atmospheric environment and, accordingly, give insights in processes related to climate change. Most studies performed in this region focus on either aerosol sources, for example the ocean, or the chemical composition of aerosol particles. Wind and wave driven physical mechanisms for particle mobilization (e.g. bubble bursting) lead to the formation of sea-spray aerosol particles (SSA) consisting of sea salt together with primary organic aerosol (POA), which is rich in organic matter (OM). The molecular nature of this OM is not fully understood to this day. The second-largest fraction of OM are likely proteins, which consist of amino acids (AA). AA contribute massively to the global nitrogen cycle and have impact on cloud chemistry, for example by acting as cloud condensation nuclei (CCN) or ice nucleating particles (INP).

             To date, chemical analysis of AAs is often provided as sum parameter, as robust methods for their analysis in original form are lacking. Therefore, individual differences between sample sets cannot be determined and information on biotic or abiotic transfers are lacking. For that reason, we developed a hydrophilic interaction liquid chromatography electrospray ionization time-of-flight mass spectrometry (HILIC-ESI-TOF-MS) method, utilizing the potential of HILIC to separate more polar analytes, compared to standard LC methods. Advantages of the developed method are not only its broad window of analytes, but also its robustness as it can be applied to complex marine samples with a short sample preparation, as derivatization steps are not needed.

This new method was applied to Antarctic low volume size segregated aerosol samples. Due to the nature of HILIC, the polar analytes show a good retention and separation from matrix components. Through these measurements, further insights can be gained on the enrichment and chemo-selective transfer of AA from the ocean to the atmosphere and their respective degradation processes. A higher variation and concentration of FAA than in previous literature was observed, with dominating marine derived FAAs. First results, also regarding the influence of air masses to the composition of different AA and comparison with other constituents, will be shown.

Sources

Jaber et al. (2021) Biogeosciences, 18, 1067–1080.

Zeppenfeld et al. (2021), ACS Earth Space Chem. 5, 1032−1047

How to cite: Breitenstein, C., van Pinxteren, M., Zeppenfeld, S., and Herrmann, H.: Insight in Antarctic aerosol particle composition regarding free amino acids, EGU General Assembly 2024, Vienna, Austria, 14–19 Apr 2024, EGU24-10160, https://doi.org/10.5194/egusphere-egu24-10160, 2024.

EGU24-10928 | ECS | PICO | AS2.5

Exploring links between the atmospheric water and trace element cycles in the Kara and Laptev Seas 

Esther S. Breuninger, Iris Thurnherr, Julie Tolu, Franziska Aemisegger, Heini Wernli, and Lenny H.E. Winkel

The atmosphere is an important reservoir for the essential elements selenium (Se) and sulfur (S) as well as for the toxic element arsenic (As). Atmospheric deposition is a source of these elements to terrestrial and marine environments, which can affect ecosystems and human health. The mobility and bioavailability of Se, S, and As in surface environments depend on their chemical forms (speciation). The factors that determine elemental speciation in atmospheric deposition are likely controlled by the speciation of these elements at the source (atmospheric emissions) and by their (bio)chemical transformations during transport. In addition, atmospheric transport of trace elements and their deposition patterns might be strongly linked to the atmospheric water cycle in particular cloud and precipitation formation, because wet deposition during precipitation is an important removal mechanism of trace elements from the atmosphere. To investigate the dynamical processes that govern the cycles of atmospheric water and trace elements in polar regions, including their sources, transport pathways, and sinks, we performed various chemical measurements (total element concentrations and speciation of Se, S and As) on atmospheric samples collected during the Arctic Century Expedition in the Kara and Laptev Seas (August-September 2021). Notably, trace element analyses were combined with a 4-week continuous time series of ship-based measurements of the isotopic composition of water vapour (i.e., δ2H and δ18O). Air parcel backward trajectories were used to identify atmospheric transport patterns of elemental and water isotope signatures, based on three-dimensional wind fields from the ERA5 atmospheric reanalysis dataset. Based on our chemical and meteorological observations and transport diagnostics, we present new insights into the variability of Se, S, and As concentration and speciation in atmospheric deposition and how they are linked to the atmospheric polar water cycle.

How to cite: Breuninger, E. S., Thurnherr, I., Tolu, J., Aemisegger, F., Wernli, H., and Winkel, L. H. E.: Exploring links between the atmospheric water and trace element cycles in the Kara and Laptev Seas, EGU General Assembly 2024, Vienna, Austria, 14–19 Apr 2024, EGU24-10928, https://doi.org/10.5194/egusphere-egu24-10928, 2024.

EGU24-13109 | ECS | PICO | AS2.5

A study of the near-surface vertical distribution and chemistry of pollutants in cold-climate urban areas with the novel PACT-1D model 

Jonas Kuhn, Jochen Stutz, Meeta Cesler-Maloney, William R. Simpson, Thorsten Bartels-Rausch, Tjarda J. Roberts, Jennie L. Thomas, Jack Dibb, Laura Heinlein, Michael O. Sunday, Cort Anastasio, Kathleen Fahey, James H. Flynn, and Fangzhou Guo

Cold-climate urban areas often face severe air pollution events in wintertime because of residential heating and vehicle emissions into shallow surface inversion layers. Many state-of-the-art regional chemistry-transport models cannot capture the small spatio-temporal scale of the transport and chemical processes occurring in these environments.

Here we introduce a new version of our one-dimensional atmospheric chemistry and transport model, PACT-1D that includes continuous exchange of atmospheric air with the interstitial air of a snow layer and a kinetic treatment of multi-phase chemical processes in air and snow. PACT-1D allows modeling and assessment of the interaction of transport, chemistry, and emissions on the time and length scales relevant to polluted wintertime environments.

We use the model to analyze observations made during the ALPACA campaign (Jan. and Feb. 2022 in Fairbanks, AK, USA). Many atmospheric and snow parameters were recorded, including measurements of the vertical distribution of trace species in the atmosphere and snow. The near surface transport is constrained by a passive tracer method, using reported sulfur dioxide emissions and respective profile measurements. We present preliminary model results and analyze sources of oxidants in the snow and the influence of the snow layer on the near-surface atmospheric compositions.

How to cite: Kuhn, J., Stutz, J., Cesler-Maloney, M., Simpson, W. R., Bartels-Rausch, T., Roberts, T. J., Thomas, J. L., Dibb, J., Heinlein, L., Sunday, M. O., Anastasio, C., Fahey, K., Flynn, J. H., and Guo, F.: A study of the near-surface vertical distribution and chemistry of pollutants in cold-climate urban areas with the novel PACT-1D model, EGU General Assembly 2024, Vienna, Austria, 14–19 Apr 2024, EGU24-13109, https://doi.org/10.5194/egusphere-egu24-13109, 2024.

EGU24-17270 | ECS | PICO | AS2.5

A laboratory and 0D box modelling study of the wintertime formation of HONO from aerosol surfaces in Fairbanks, Alaska 

Rachel L. James, Stephen R. Arnold, Dwayne E. Heard, Daniel Stone, and Lisa K. Whalley and the ALPACA Team

As a high-latitude city, Fairbanks, Alaska, undergoes prolonged, cold winters with limited sunlight, and strong surface temperature inversions. These conditions coupled with its position at the bottom of the Tanana Valley lead to cold, dark, stagnant weather conditions, which when combined with demands for heating and transportation contribute to substantial degradations in air quality. These factors have led to Fairbanks exceeding the Environment Protection Agency PM2.5 standard and being classified as a serious nonattainment area for air quality. 


The ability to mitigate harmful pollution concentrations in Fairbanks is hampered by a lack of knowledge of the physicochemical processes which drive localised extreme pollution episodes during wintertime. For example, low levels of sunlight and ozone concentrations inhibit the well-established formation mechanisms of HOx via photolysis or radical reactions. However, nitrous acid (HONO) can be a major source of OH radicals even in cold, dark, polluted environments. Despite being a major source of OH radicals, the formation of HONO is poorly represented in models. HONO is directly emitted from vehicles or formed via gas-phase reactions or via heterogeneous reactions such as those occurring from the surface of aerosols.


Using observations made during the Alaska Layered Pollution and Chemical Analysis Campaign (ALPACA), which took place in Fairbanks during January – February 2022, we conducted constrained chemical box model experiments to investigate HONO and oxidant sources during the ALPACA campaign. Our results show that gas-phase only reactions cannot account for observed HONO concentrations nor correctly reproduce diurnal trends. This suggests additional sources of HONO present in Fairbanks, potentially including formation from the surface of aerosols, which is not currently well constrained, especially at temperatures and relative humidities pertinent to wintertime Fairbanks.


Here, we present laboratory results aimed at addressing the lack of studies into HONO formation on the surface of aerosols in cold, dark environments and provide a wider atmospheric context via chemical box modelling constrained to observations from the ALPACA campaign. We purpose-built a chamber designed to reach temperatures similar to wintertime conditions in Fairbanks to study the formation of HONO from aerosol samples collected on filters during the ALPACA campaign, as well as filters collected from idealised single-source emission experiments in the laboratory. The generated HONO was detected in the gas-phase following its photolysis at 355 nm to OH and NO, with the OH detected via OH laser-induced fluorescence spectroscopy. We comprehensively studied HONO formation from aerosol filter samples as a function of aerosol surface area, NO2 concentration, relative humidity, and temperature under actinic light levels applicable to wintertime conditions in Fairbanks. Inclusion of our experimental results into the chemical box model suggests enhancement of HONO concentrations over gas-phase only reactions alongside improved diurnal trends.

How to cite: James, R. L., Arnold, S. R., Heard, D. E., Stone, D., and Whalley, L. K. and the ALPACA Team: A laboratory and 0D box modelling study of the wintertime formation of HONO from aerosol surfaces in Fairbanks, Alaska, EGU General Assembly 2024, Vienna, Austria, 14–19 Apr 2024, EGU24-17270, https://doi.org/10.5194/egusphere-egu24-17270, 2024.

EGU24-18934 | PICO | AS2.5

Assessment of aerosol dry depositions and their impact on snow composition at an Arctic urban site 

Stefano Decesari, Gianluca Pappaccogli, Federico Scoto, Maurizio Busetto, Roberta Zangrando, Andrea Gambaro, Andrea Spolaor, Roman Pohorsky, Julia Schmale, Javier Fochesatto, and Antonio Donateo

Dry depositions contribute to regulate the lifetime of the aerosol in the atmosphere and at the same time they are responsible for the surface flux of nutrients, reactive compounds and pollutants. In polar areas, in particular, atmospheric depositions represent an important source of uncertainty in assessing the lifetime of particulate matter and short-living climate forcers (including black carbon, cloud condensation nuclei and ice nuclei). Dry depositions are deemed to affect snow composition (in terms of reactive compounds, light-absorbing species and persistent pollutants), although its relative importance with respect to wet depositions remains undetermined. There is a paucity of observational data of size-segregated particle fluxes in polar areas, which remains a challenge for the development of reliable parameterizations, given the peculiarities of the turbulence in the polar boundary layer as it is affected by the low solar angles, the presence of a snowpack, the strong surface radiative cooling.

The Alaskan Layered Pollution and Chemical Analysis (ALPACA) experiment is the first, comprehensive air quality study at a urban Arctic location. In the frame of ALPACA, atmospheric transport and vertical distribution of anthropogenic aerosols were investigated by a suite of experimental and modelling approaches. At the same time, the characteristic of the atmospheric boundary layer and surface fluxes of energy and particles have been investigated, while the composition of surface snow was determined on a daily basis. ALPACA was conducted in Fairbanks (AK, US) in Jan – Feb 2022 and comprehensive boundary layer observations were carried out at the sub-urban “Farm” location, over a large, flat terrain with little local pollution sources. In the dark Arctic winter, minimum temperatures dropped as low as -35 °C during the first part of the campaign. As a result of the surface cooling, the temperature gradient reached 10 °C in the first 10 meters above the ground. However, surface-based inversions were systematically perturbed by changes in the surface radiative budget caused by the intermittent presence of clouds and by surface winds promoted the thermal gradients between the Fairbanks plain and the surrounding elevated terrains. Whenever the surface inversions shrank and sufficient amount of aerosol was present in the lower levels, a clear surface particle surface flux was observed by means of an eddy-covariance technique. Such fluxes were intensified during the first part of the campaign when anthropogenic pollution developed in the lower atmospheric layers. In the same period, inorganic and organic compounds in surface snow progressively accumulated in absence of precipitations. The assessment of size-segregated particle fluxes and the analysis of particulate matter composition enabled to quantitatively assess atmospheric dry depositions. Their contribution to the evolution of snow chemistry was species-dependent, but in general dry depositions were found to be a significant sources of pollutants in snow during ALPACA. The effect of meteorology, vertical aerosol distribution and aerosol mixing state on the fluxes on the snowpack are discussed.

How to cite: Decesari, S., Pappaccogli, G., Scoto, F., Busetto, M., Zangrando, R., Gambaro, A., Spolaor, A., Pohorsky, R., Schmale, J., Fochesatto, J., and Donateo, A.: Assessment of aerosol dry depositions and their impact on snow composition at an Arctic urban site, EGU General Assembly 2024, Vienna, Austria, 14–19 Apr 2024, EGU24-18934, https://doi.org/10.5194/egusphere-egu24-18934, 2024.

EGU24-152 | ECS | Orals | OS1.7

Improving Estimates of Arctic Ocean CO2 Uptake 

Victoria Dutch, Dorothee Bakker, Peter Landschützer, Alizée Roobaert, and Jan Kaiser

The Arctic Ocean covers only 3 % of the Earth’s surface but contributes 5 - 14 % of the global ocean carbon sink. Sparse and unevenly distributed observations of the partial pressure of CO2 (pCO2) hinder our understanding of the magnitude and the controlling mechanisms of this carbon sink. In order to constrain the magnitude of this flux, we adapt the Self-Organising Map – Feed-Forward neural Network (SOM-FFN) method of Landschützer et al. (2016) to interpolate existing observations and construct a monthly 1 x 1 degree pCO2 product for the Arctic Ocean from 1991 - 2022. We first divide the Arctic Ocean (i.e., the region ≥ 55° N) into five biogeochemical provinces; four obtained from using the SOM method and a fifth for all grid cells with greater than 85 % ice cover. For each province, we then derive non-linear relationships between pCO₂ and predictor variables (i.e., biogeochemical drivers) using the FFN method. The monthly reconstructed Arctic pCO2 product is then evaluated against existing observations of surface ocean pCO2, chiefly from SOCATv2023 and from independent timeseries stations. Our study shows that biogeochemical properties previously selected as predictor variables at the global scale are not well suited to the Arctic Ocean. Limiting the spatial domain from which relationships are derived also improves performance, with less biased p(CO2) values predicted when excluding the Baltic Sea. 

How to cite: Dutch, V., Bakker, D., Landschützer, P., Roobaert, A., and Kaiser, J.: Improving Estimates of Arctic Ocean CO2 Uptake, EGU General Assembly 2024, Vienna, Austria, 14–19 Apr 2024, EGU24-152, https://doi.org/10.5194/egusphere-egu24-152, 2024.

EGU24-232 | Orals | OS1.7

Coral Reefs: Sinks of Atmospheric CO2 ? 

Hamish McGowan, Nadav Lensky, Shai Abair, and Mellissa Saunders

Quantification of air-sea CO2 exchange over coral reefs has relied primarily on measurements of the CO2 partial pressure (pCO2) gradient between the water overlying a reef and the lower atmosphere. A gas transfer velocity based on wind speed is then used to estimate the air-sea CO2 mass exchange. While this approach may be suitable over the oceans or where instrumented buoys have been deployed for long-term monitoring, the method overlooks many factors that influence turbulent transport and air-sea CO2 exchange. These include surfactants, bubble exchange, atmospheric turbulence, and wave breaking, which may be particularly important over near shore fringing coral reefs.


Using eddy covariance (EC) systems deployed at the shoreline adjacent to coral reefs and on pontoons we show through direct measurements these ecosystems may be net sinks of atmospheric CO2. Results show sequestration of atmospheric CO2 by healthy coral reefs and adjacent lagoons at time scales of several days to several months exceed published CO2 sequestration rates of mature pine plantations measured by EC by an order of magnitude. These findings highlight the importance of coral reefs in carbon budgets in addition to their widely known ecosystem services and societal benefits. Conserving coral reef ecosystems and ensuring they remain healthy and resilient to the threats of climate change, pollution, overfishing, tourism, and mining should be a priority. Future research will aim to track the CO2 influx through coral reef ecosystems.        

How to cite: McGowan, H., Lensky, N., Abair, S., and Saunders, M.: Coral Reefs: Sinks of Atmospheric CO2 ?, EGU General Assembly 2024, Vienna, Austria, 14–19 Apr 2024, EGU24-232, https://doi.org/10.5194/egusphere-egu24-232, 2024.

EGU24-290 | ECS | Orals | OS1.7

How the treatment of sea surface temperature affects the water cycle in EURO-CORDEX simulations 

Francis Da Silva Lopes and Michael Schindelegger

Regional climate models (RCMs) over Europe often exhibit wet precipitation biases, primarily attributed to excess oceanic evaporation across time scales. One likely source for such wet biases are therefore imperfections in the models’ lower boundary condition (LBC) over the ocean, as realized by time-evolving sea surface temperature (SST) fields. SST data from atmospheric reanalyses (e.g., ERA5) are commonly adopted in RCMs, but ambiguity exists about the exact SST variable in these products (e.g., foundation or skin temperature) and the manner with which they represent the diurnal cycle and spatial gradients. Here we explore these questions with a ~12-km setup of ICON-CLM (Icosahedral Nonhydrostatic Model in Limited-Area Mode) over the EURO-CORDEX domain, run repeatedly for 6 years with various SST datasets. We use ERA5-based daily SST and skin temperature and hourly upper-layer SST drawn from our own global ocean simulations with FESOM2 (Finite Element Sea-Ice Ocean Model) at ~10-km node spacing in the eastern North Atlantic. Specifically, prescribing the FESOM2 SST fields in ICON-CLM both with and without spatial smoothing allows us to examine the effects of oceanic eddies and fronts on precipitation characteristics onshore. Preliminary results from 7 months of integration with ICON-CLM suggest that the choice of the SST data appreciably impacts latent heat fluxes, moisture transport onto land, and cumulative continental precipitation, generally in areas of pronounced moisture recycling. “Mind your SST” is therefore the advice we can give to ongoing dynamical downscaling efforts aimed at modeling future precipitation changes over land.

How to cite: Da Silva Lopes, F. and Schindelegger, M.: How the treatment of sea surface temperature affects the water cycle in EURO-CORDEX simulations, EGU General Assembly 2024, Vienna, Austria, 14–19 Apr 2024, EGU24-290, https://doi.org/10.5194/egusphere-egu24-290, 2024.

EGU24-730 | ECS | Posters on site | OS1.7

Estimates of Arctic Ocean carbon uptake from atmospheric inverse analyses for the period 2000-2017 

Jayashree Ghosh, Parvadha Suntharalingam, Zhaohui Chen, Jan Kaiser, Dorothee Bakker, and Victoria Dutch

 The Arctic Ocean is responsible for around 5-10% of oceanic CO2 uptake, despite the region only accounting for approximately 4% of the world's oceans (Bates & Mathis, 2009). In this study, we investigate the exchange of CO2 between the atmosphere and the ocean in the Arctic Ocean for the period 2000-2017. Our estimates are obtained using the GEOSChem-LETKF inverse model system (Chen et al. 2021), in combination with data from the NOAA surface CO2 monitoring network (ObsPack, Cooperative Global Atmospheric Data Integration Project, 2018). We evaluate the impact of alternative representations of the prior flux distribution for air-sea CO2 fluxes. These include the following datasets: Landschutzer et al. (2016), Rodenbeck et al. (2014), and Watson et al. (2020). We present estimates of the long-term trend, year-to-year fluctuations, and regional and seasonal variability in air-sea CO2 exchange in the Arctic Ocean, with a focus on the region north of 58˚N. The sea ice extent of the regional seas of the Arctic Ocean has an influence on the magnitude and seasonality of the regional air-sea CO2 flux. We also investigate the potential links between changes in sea-ice extent and changes in air-sea CO2 fluxes.

How to cite: Ghosh, J., Suntharalingam, P., Chen, Z., Kaiser, J., Bakker, D., and Dutch, V.: Estimates of Arctic Ocean carbon uptake from atmospheric inverse analyses for the period 2000-2017, EGU General Assembly 2024, Vienna, Austria, 14–19 Apr 2024, EGU24-730, https://doi.org/10.5194/egusphere-egu24-730, 2024.

EGU24-732 | ECS | Posters on site | OS1.7

Cross-linking laboratory and field measurements to quantify the role of bubbles in air-sea CO2 exchange 

Yuanxu Dong, Bernd Jähne, and Christa Marandino

The global oceans are a major sink of anthropogenic carbon dioxide (CO2), playing a critical role in mitigating climate change. The ocean CO2 uptake estimate contains significant uncertainties due to a lack of mechanistic understanding of the role of bubbles in air-sea CO2 exchange. Bubbles resulting from wave breaking may mediate about 40% of the global air-sea CO2 flux.  However, bubble-mediated transfer is poorly quantified and under-represented in CO2 flux estimates. In this study, we will present a synthesis analysis of the bubble-mediated gas transfer measurements in the last decade. We show contrasting evidence regarding the importance of bubbles in the air-sea CO2 exchange, particularly in the comparison between laboratory and field measurements. This suggests a lack of mechanistic understanding of the air-sea gas exchange processes. Through innovative cross-linking of comprehensive field and laboratory observations using multiple techniques, we aim to make a step change in understanding the mechanisms of bubble-mediated transfer and reconcile field and laboratory measurements.  We also aim to provide novel parameterisations of gas transfer velocity with explicit representation of bubbles, thereby reducing uncertainty in air-sea CO2 flux estimates.

How to cite: Dong, Y., Jähne, B., and Marandino, C.: Cross-linking laboratory and field measurements to quantify the role of bubbles in air-sea CO2 exchange, EGU General Assembly 2024, Vienna, Austria, 14–19 Apr 2024, EGU24-732, https://doi.org/10.5194/egusphere-egu24-732, 2024.

EGU24-1139 | ECS | Orals | OS1.7

Sampling the SML for traces gases: a case study of sampling technique and resulting correction factors 

Lea Lange, Dennis Booge, Josefine Karnatz, Hermann Bange, and Christa Marandino

The sea surface microlayer (SML) is the uppermost thin oceanic surface layer in the range of 100µm with properties that are distinct from the water below. With an ocean coverage of up to 70% it is supposed to have a significant impact on air-sea gas exchange rates. In global studies, the SML is often supposed to be a missing source of trace gases, when oceanic production and the subsequent emissions alone cannot explain observed atmospheric mixing ratios. Despite the attention in the past 20 years, also in the SOLAS science plan, it remains difficult to sample volatile trace gases from the SML with existing sampling techniques. Consequently, an incomplete process understanding of trace gas cycling within the SML inhibits its effect on air-sea gas exchange.

In this study, we focus on existing and common SML sampling methods (glass plate, Garrett screen) in order to ensure that trace gas samples are comparable to other parameters sampled with the same method. A series of laboratory experiments was set up to determine a correction factor which quantifies the loss of trace gases due to the sampling method itself. Dimethyl sulfide, isoprene and carbon disulfide were sampled with a glass plate and with a Garrett screen under varying surfactant concentrations and environmental conditions (salinity, temperature). Based on physiochemical properties of the examined trace gases, we extended the correction factor to nitrous oxide and methane. Losses are high, but not as variable as expected. Around 90% are lost due to sampling with small variations between different gases. The presence of surfactants has a small effect on the losses.

The lab-based correction factors are applied to in-field SML samples from a mesocosm study in May/June 2023 conducted within the DFG research unit BASS. Those results clearly indicate that the composition of the SML highly influences the correction factor for each trace gas individually. Comparing corrected SML concentrations with underlying bulk water concentrations reveal the accumulation of specific traces gases in the SML which highly influence the magnitude of trace gas emissions to the atmosphere.

How to cite: Lange, L., Booge, D., Karnatz, J., Bange, H., and Marandino, C.: Sampling the SML for traces gases: a case study of sampling technique and resulting correction factors, EGU General Assembly 2024, Vienna, Austria, 14–19 Apr 2024, EGU24-1139, https://doi.org/10.5194/egusphere-egu24-1139, 2024.

EGU24-1372 | ECS | Orals | OS1.7

Carbonate System Changes Within an Evaporating Sea Spray Droplet 

Lucy Hendrickson, Penny Vlahos, and Leonel Romero

Modeling the air-sea flux of CO2 is a key factor in understanding climate change and predicting its effects. The contribution of sea spray to this flux is highly uncertain yet important for reducing error margins in global estimates. In this work, a modified CO2SYS routine is used to quantify the effect of evaporation on aqueous carbonate reactions in sea spray in order to assess this flux. Factors that affect these reactions are the increasing salinity and temperature changes of the droplet as it evaporates. The size of the droplet is also a determining factor as it affects the time aloft and thus the amount of evaporation and gas exchange that can occur. Using these factors and a number of simplifying assumptions, we model the change in DIC, TA, pCO2 and pH in an evaporating sea spray droplet.

How to cite: Hendrickson, L., Vlahos, P., and Romero, L.: Carbonate System Changes Within an Evaporating Sea Spray Droplet, EGU General Assembly 2024, Vienna, Austria, 14–19 Apr 2024, EGU24-1372, https://doi.org/10.5194/egusphere-egu24-1372, 2024.

EGU24-2187 | ECS | Orals | OS1.7 | Highlight

Impact of the ocean-atmosphere coupling on Mediterranean cyclones 

Marco Chericoni, Giorgia Fosser, and Alessandro Anav

The Mediterranean basin is well recognized as one of the main climate change hotspots; besides, this region is one of the most active cyclogenetic area of the Northern Hemisphere with a large number of intense cyclones occurring every year. Intense Mediterranean cyclones are often responsible for extreme precipitation and strong wind events leading to severe socio-economic and environmental impacts especially over densely populated coastal areas. Complex feedback between the Mediterranean Sea and the atmosphere on various temporal and spatial scales plays a major role in the variability in and extremes of the regional climate system.

This study aims to investigate the impact of the ocean-atmosphere coupling on the regional climate during intense Mediterranean cyclones. To this end, two simulations are performed using the ENEA-REG regional earth system model at 12 km atmospheric horizontal resolution over the Med-CORDEX domain, both driven by ERA5 reanalysis. The first experiment uses the mesoscale WRF model with prescribed ERA5 Sea Surface Temperature (SST), while the second is coupled to the MITgcm ocean model at horizontal resolution of 1/12°. Cyclones are tracked by applying a Lagrangian algorithm to the mean sea level pressure field. The 500 most intense cyclones mainly occur in winter over the Thyrrenian, Adriatic, Ionian and Aegean Sea. They are similarly reproduced between WRFs and ERA5 in terms of seasonal and spatial distribution, due to the same large-scale atmospheric conditions. The coupled simulation is compared with the standalone WRF in terms of sub-daily fields, such as evaporation, precipitation and wind speed, during the mature stage of the cyclones. The different SST distribution between the models appears to be the main controlling factor for the differences in the atmospheric properties affecting not only the surface, but also the entire atmospheric boundary layer (ABL) and its height, due to the mixing of the turbulent processes, enhanced during intense cyclones. A statistically significant higher specific humidity and wind speed are found in the coupled model from the surface to the top of the ABL, as well as higher precipitation over sea and coastal areas. These results are consequences of higher turbulent heat and moisture fluxes in the coupled model that destabilize the ABL and provide higher moisture content available for convection.

We conclude that the use of the coupled model is crucial for a more realistic representation of the energy redistribution in both the ocean mixed layer and the ABL during intense Mediterranean cyclones. This highlights the importance of the coupled model to study the influence of climate change on intense Mediterranean cyclones and associated impacts under different future scenarios.

How to cite: Chericoni, M., Fosser, G., and Anav, A.: Impact of the ocean-atmosphere coupling on Mediterranean cyclones, EGU General Assembly 2024, Vienna, Austria, 14–19 Apr 2024, EGU24-2187, https://doi.org/10.5194/egusphere-egu24-2187, 2024.

The climatological mean and trend of salinity change evidently due to the acceleration of hydrological cycle under global warming. However, no systematic research has been focused on the decadal and long-term changes of salinity and their contributions to ocean stratification during 1940-2019. In this study, the nonlinear trend of salinity is firstly exacted using the ensemble empirical mode decomposition method, and the corresponding long-term trends and their impacts on stratification in the tropical Pacific are analyzed emphatically. The results confirm that the sea surface water becomes fresher in the tropical western Pacific and southern Pacific convergence zone, while saltier in the southeastern Pacific under global warming. Moreover, the salinity changes are regional- and time-dependent, which the salinity trends in different regions of the tropical Pacific show differences at different periods responding to SST trend. As results, under the combined effects of temperature and salinity, the sea surface density reduces significantly in the tropical Pacific, with the largest reduction centered in the warm pool, while the subsurface density in the tropical western Pacific increases. These opposite changes enhance the contrast for the density between the surface and the subsurface water, leading to more stable ocean stratification. Then, the mixed layer becomes shallower near the equatorial dateline and deeper in the warm pool, mainly due to salinity variations. Salinity and temperature contribute differently to the variations of barrier layer thickness in different regions, where the changes of salinity (temperature) correspond to the thickening of barrier layer located at 160°E east (west). It is suggested that the salinity variations in the Pacific affect the ocean thermodynamic processes under global warming, which then modulate the climate variability.

How to cite: hai, Z.: Salinity Change and Its Implications for Ocean Stratification in the Tropical Pacific under Global Warming, EGU General Assembly 2024, Vienna, Austria, 14–19 Apr 2024, EGU24-2734, https://doi.org/10.5194/egusphere-egu24-2734, 2024.

The cool skin effect, known as the temperature difference (ΔT) across the skin layer of sea surface, is of vital importance for the accurate computation of the latent heat flux (LHF). The observed features of ΔT in the South China Sea are analyzed using in situ data from a buoy platform over an approximately six-week period. Only nighttime data are used to exclude the possible warm layer effect. The positive values of ΔT falling into the range of 0 to 1 K comprise 95% of the data, and the most frequently observed values occur in the range of 0.4 to 0.6 K (38%). The cool skin model in the COARE 3.0 algorithm is then validated against those observations. The cool skin model has an efficient but insufficient ability to reduce the overestimation of the LHF. The overestimation of the LHF is reduced to 9.5% from 18.0%, leaving nearly half of the biases in the LHF unresolved. The Saunders constant (λ) in the cool skin model is markedly underestimated, leading to a much weaker prediction of ΔT. A strong linear relationship exists between the mean values of λ and the LHF with a slope of -0.9 W m-2. With an approximately doubled λ, the biases in ΔT and in the LHF could be eliminated. Considering the possible uncertainties in sensors, the value of λ is estimated as 11.6±6.7 in the current study.

How to cite: Zhang, R.: Cool Skin Effect and its Impact on the Computation of the Latent Heat Flux in the South China Sea, EGU General Assembly 2024, Vienna, Austria, 14–19 Apr 2024, EGU24-3766, https://doi.org/10.5194/egusphere-egu24-3766, 2024.

EGU24-3811 | Posters on site | OS1.7

Impact of ocean vertical mixing parametrization on sea ice properties using NEMO-SI3 model in the Arctic Ocean 

Sofia Allende, Anne Marie Treguier, Camille Lique, Clément de Boyer Montégut, François Massonnet, and Thierry Fichefet

In recent decades, global climate change has strongly affected the Arctic region, leading to a rapid decline in sea ice extent. This decline affects the interactions between sea ice, the atmosphere, and the ocean, driven by complex thermodynamic and dynamical processes. The Arctic mixed layer (ML), located in the upper ocean, plays a key role in regulating the interactions between the deep ocean, sea ice, and the atmosphere. This region is strongly affected by exchanges of mass (such as freshwater and saltwater fluxes) and momentum driven by various forces like ocean currents, tides, waves, and winds. Here, we study the ad-hoc vertical turbulent kinetic energy (TKE) mixing scheme within the NEMO-SI3 model. Specifically, we focus on the influence of surface and internal wave breaking in sea ice-covered regions. The critical parameters are the fraction of surface TKE that penetrates below the ML, the nature of the exponential TKE penetration decrease beneath the ML, and the damping effect on Langmuir and surface wave breaking beneath the ice cover. We aim to assess how these parameters affect the ML and various sea ice properties.

Our findings reveal significant impacts on Arctic sea ice thickness under two scenarios: when ice cover does not affect wave dynamics and when the mixing process weakens. Stronger mixing leads to a deeper ML and reduced sea ice thickness by 30 to 40 centimeters, while weaker mixing results in a shallower ML and a moderate sea ice increase of 10 to 20 centimeters. Results also show that reduced sea ice models exhibit a larger volume of freshwater content in the ocean with consistent spatial patterns. Conversely, increased sea ice simulations reveal reduced freshwater content, although clear spatial patterns are not evident. Differences in upper ocean properties, particularly in ocean stratification, highlight the significant impact of strong sea ice attenuation in the mixing parametrization. These findings underscore the substantial influence of enhanced ocean mixing on the physical properties of ocean and sea ice.

How to cite: Allende, S., Treguier, A. M., Lique, C., de Boyer Montégut, C., Massonnet, F., and Fichefet, T.: Impact of ocean vertical mixing parametrization on sea ice properties using NEMO-SI3 model in the Arctic Ocean, EGU General Assembly 2024, Vienna, Austria, 14–19 Apr 2024, EGU24-3811, https://doi.org/10.5194/egusphere-egu24-3811, 2024.

EGU24-5785 | ECS | Posters on site | OS1.7 | Highlight

Daily to decadal changes: Insights from a high resolution 10-year record of atmospheric carbon dioxide, observed from coastal Antarctica. 

Freya Squires, Anna Jones, Tony Phillips, James France, Nellie Wullenweber, and Rolf Weller

The Southern Ocean is the dominant marine sink for anthropogenic carbon, absorbing around 40% of carbon emitted since industrialisation, but it is a remote and challenging region to measure. Sparsity of observational data is the main cause of uncertainty in air-sea carbon flux in the Southern Ocean. Year-round observations of CO2 mixing ratios can aid understanding of air-sea flux in this critical region and provide valuable insight into how the carbon sink is changing over time as well as its seasonal and interannual variability.

This work presents ten years of high frequency in situ carbon dioxide mixing ratios measured from two coastal Antarctic research stations; Halley, operated by the British Antarctic Survey, and the German research station, Neumayer. This data set provides a rare long-term measurement of CO2 in the Southern Ocean region, allowing annual growth rates, seasonal changes and interannual variability to be studied. The mean annual growth rate was calculated to be ~2.4 ppm year-1 between 2013 and 2022.

The coastal location of these stations mean they are ideally placed to explore air-sea CO2 exchange in the Southern Ocean. Both the Halley and Neumayer records show short-term fluctuations in CO2 mixing ratios during the summer, with up to ~0.5 ppm decreases in CO2 over the course of a day, about one fifth of the average annual growth rate. Air mass trajectory analysis carried out using Hysplit with ERA5 meteorological data, suggests that these decreases in CO2 correspond to periods where the air sampled has spent time over the Southern Ocean, suggesting CO2 uptake has occurred. This work explores the possible drivers for the short-term variability in CO2 mixing ratios, focusing on the role of ocean uptake in the summer.

How to cite: Squires, F., Jones, A., Phillips, T., France, J., Wullenweber, N., and Weller, R.: Daily to decadal changes: Insights from a high resolution 10-year record of atmospheric carbon dioxide, observed from coastal Antarctica., EGU General Assembly 2024, Vienna, Austria, 14–19 Apr 2024, EGU24-5785, https://doi.org/10.5194/egusphere-egu24-5785, 2024.

EGU24-5985 | ECS | Posters on site | OS1.7

Surface density fluxes and water mass transformation over global oceans from reanalysis and climate models 

Vladimir Kukushkin, Sergey Gulev, and Margarita Markina

We analyze interannual and seasonal variability of surface density fluxes and water mass transformation rates over the global oceans for 1979-2018 using data from CFSR reanalysis and historical simulations by climate models. By analyzing density fluxes we quantify the the effect of surface heat and mass fluxes onto the formation of surface waters in the World Ocean. First, by using net fluxes from CFSR reanalysis we derive global climatology of surface density flux and further integrate it for density classes and T,S-classes, providing global and regional view of surface water mass transformation and its variability in space and in time. We precisely looked onto the role of salinity and sea ice formation in the density flux during the winter period. On average, the contribution of salinity to sea ice formation results in the differences of 9% in the density flux with the maximum effect of 12% identified in 1989. Interdecadal variability in surface transformation of the subpolar modal water and Labrador Sea waters shows opposite tendencies for the last decades. Then we analyze historical experiments from CMIP6 model ensemble and compare characteristics of surface water mass transformation with those revealed from reanalysis. We conclude that surface density fluxes and transformation rates derived from INM, MPI and MIROC are stronger compared to those diagnosed by CFSR with the largest differences identified over the Gulf Stream and the North Atlantic Current. For the same models we derive projections of surface density fluxes and surface water mass transformation for 2100 under ssp126, ssp370 and ssp585 scenarios. For all SSP scenarios, computations show a decrease in the magnitude of surface water mass transformation by the end of the century.

How to cite: Kukushkin, V., Gulev, S., and Markina, M.: Surface density fluxes and water mass transformation over global oceans from reanalysis and climate models, EGU General Assembly 2024, Vienna, Austria, 14–19 Apr 2024, EGU24-5985, https://doi.org/10.5194/egusphere-egu24-5985, 2024.

EGU24-6195 | Orals | OS1.7

Amino acids, carbohydrates and lipids in the tropical oligotrophic Atlantic Ocean: Sea-to-air transfer and atmospheric in situ formation  

Manuela van Pinxteren, Sebastian Zeppenfeld, Khanneh Wadinga Fomba, Nadja Triesch, Sanja Frka, and Hartmut Herrmann

Carbohydrates, amino acids, and lipids are important contributors to organic carbon (OC) in the marine environment. To study their sea-to-air transfer, including their enrichment in the sea surface microlayer (SML), potential atmospheric in situ formation or degradation, and their oceanic contribution to the ambient marine aerosol particles, we provide measurements from the tropical Atlantic Ocean at the Cape Verde Atmospheric Observatory (CVAO) where the above compounds were investigated in both surface seawater and in ambient submicron aerosol particles.

In bulk seawater and the SML, similar distributions among species were found for the lipids and carbohydrates with moderate SML enrichments (enrichment factor EFSML = 1.3 ± 0.2 and 1.1 ± 0.5 respectively). In contrast, the amino acids exhibited a higher enrichment in the SML with an average EFSML of 2.3 ± 0.4 although they are less surface-active than lipids. The same compounds studied in the seawater were found on the ambient submicron aerosol particles whereas the lipids were more pronounced enriched (EFaer. = 1.6x10⁵) compared to the amino acids and carbohydrates (EFaer. = 1.5x10³ and 1.3x10³ respectively), likely due to their high surface activity and/or the lipophilic character. Detailed molecular analysis of the seawater and aerosol particles revealed changes in the relative abundance of the individual organic compounds. They were most pronounced for the amino acids and are likely related to an in situ atmospheric processing by biotic and/or abiotic reactions.

On average 49% of the OC on the aerosol particles (≙ 97 ng m-3) could be attributed to the specific components or component groups investigated in this study. The majority (43%) was composed of lipids. Amines, oxalic acid, and carbonyls, comprised an OC fraction of around 6%. Carbohydrates and amino acids made up less than 1% of the OC. This shows that carbohydrates, at least when resolved via molecular measurements of single sugars, do not comprise a very large fraction of OC on marine aerosol particles, in contrast to other studies. However, carbohydrate-like compounds are also present in the high lipid fraction (e.g., as glycolipids), but their chemical composition could not be revealed by the measurements performed here.

Since the identified compounds constituted about 50% of the OC and belong to the rather short-lived biogenic material probably originating from the surface ocean, a pronounced coupling between ocean and atmosphere was indicated for this oligotrophic region. The remaining, non-identified OC fraction might in part contain recalcitrant OC, however, this fraction does not constitute the vast majority of OC in the aerosol particles here investigated.

The study contributes to the international SOLAS program.


Ref: van Pinxteren, M., Zeppenfeld, S., Fomba, K. W., Triesch, N., Frka, S., and Herrmann, H.: Amino acids, carbohydrates, and lipids in the tropical oligotrophic Atlantic Ocean: sea-to-air transfer and atmospheric in situ formation, Atmos. Chem. Phys., 23, 6571–6590, https://doi.org/10.5194/acp-23-6571-2023, 2023.

How to cite: van Pinxteren, M., Zeppenfeld, S., Fomba, K. W., Triesch, N., Frka, S., and Herrmann, H.: Amino acids, carbohydrates and lipids in the tropical oligotrophic Atlantic Ocean: Sea-to-air transfer and atmospheric in situ formation , EGU General Assembly 2024, Vienna, Austria, 14–19 Apr 2024, EGU24-6195, https://doi.org/10.5194/egusphere-egu24-6195, 2024.

The increasing amount of data in earth-observing systems allows us to move from considering low-order moments (means and variances) of fluctuating observations to their PDFs (Probability Density Functions). For two years of HFR (High Frequency Radar) sea surface current increments in the Gulf of Trieste (Northern Adriatic Sea) we found the analytical fat-tailed PDF form (a combination of a gaussian and a convolution of two exponentials) using superstatistics and the maximum entropy principle twice: on a short and on a longer time scale. The data observed under different wind regimes (Bora, Sirocco and low wind, from the WRF model local forecasts) follow the same analytical PDF, pointing towards a universal behaviour.

We developed an idealised deterministic-stochastic model of the wind-driven sea surface currents in the Gulf of Trieste. The deterministic model consists of a time-dependent Ekman layer system, including the tidal signal, with a quadratic drag. It describes 57% of the variability, missing the fast fluctuations. The stochastic part accounts for the fast fluctuations, reproducing the superstatistical PDFs from the observations. The model, providing a huge amount of data, allows for studying the PDF of the mechanical power-input into the ocean and the associated extreme events.

How to cite: Flora, S., Ursella, L., and Wirth, A.: Superstatistical analysis of HF Radar sea surface currents in the Gulf of Trieste, their idealized wind-driven stochastic modeling and extreme power-input events, EGU General Assembly 2024, Vienna, Austria, 14–19 Apr 2024, EGU24-6484, https://doi.org/10.5194/egusphere-egu24-6484, 2024.

The Kuroshio Extension (KE) bimodality has important effects on the ocean environment, ecosystem and climate. Previous studies have revealed that the Kuroshio Extension (KE) bimodality is mainly determined by the westward-propagating Rossby wave triggered by the North Pacific decadal variability such as PDO or NPGO: the positive (negative) phase of NPGO corresponds to the stable (unstable) KE state. However, the KE state and the NPGO seem to be decoupled since 2017, during which the NPGO takes a negative phase but the KE is in a stable state. This study employs the Convergent Cross Mapping (CCM) method to investigate the causality between the KE bimodality and NPGO. Simultaneously, we divide the KE region into the upstream (west of 146°E) and downstream regions. It is found that the NPGO has a significant causal impact on the downstream KE state. But the effect on the upstream KE state significantly weakens around 2017. Further analysis indicates that the upstream KE state is mainly caused by eddy activity in the Kuroshio large meander region south of Japan. In particular, the changes in the eddy activity affect the downstream advection of eddies and induce changes in the Kuroshio position over the Izu ridge, which cause different states in the KE upstream region. Therefore, we should not only consider the NPGO change, but also the eddy activity change in the Kuroshio region south of Japan when understanding and predicting the KE low-frequency variability.

How to cite: Wang, Q.: Revisiting the relationship between the North Pacific decadal variability and the Kuroshio Extension bimodality, EGU General Assembly 2024, Vienna, Austria, 14–19 Apr 2024, EGU24-7259, https://doi.org/10.5194/egusphere-egu24-7259, 2024.

EGU24-7477 | ECS | Orals | OS1.7 | Highlight

The impact of rain on the global ocean carbon uptake 

Laetitia Parc, Hugo Bellenger, Laurent Bopp, Xavier Perrot, and David Ho

Precipitation alters sea surface physical and biogeochemical properties locally. However, due to its high temporal and spatial variations, it has largely been overlooked in studies assessing global ocean carbon uptake. Air-sea CO2 flux is mainly due to the interfacial exchange of CO2 molecules between the liquid and gaseous phases media. Rain may impact this interfacial air-sea CO2 flux by (i) enhancing the turbulence at the air-sea interface and (ii) diluting the CO2 concentration near the ocean surface. At the same time, rain directly injects into the ocean CO2 absorbed by the raindrops during their fall. This latter component, known as wet deposition, contributes to the CO2 flux into the ocean. This study provides the first comprehensive global estimate of these effects and their combined influence on the global ocean carbon uptake during the period 2008-2018. We use different representations of the ocean surface response to rain and different rain products with different rain rate distributions (ERA5 and IMERG) to quantify the uncertainty of the global impact of rain on CO2 sink. We show that rain increases the global ocean carbon sink by +0.14 to +0.19 PgC yr-1 over 2008-2018, representing an increase of 5 to 7% of the global carbon uptake (2.66 PgC yr-1). Both interfacial flux and wet deposition have comparable orders of magnitude. Rain mainly increases the CO2 sink in the tropics, where strong rain rates and weak winds induce noticeable dilution at the ocean surface, in the storm track regions, and in the Southern ocean.

How to cite: Parc, L., Bellenger, H., Bopp, L., Perrot, X., and Ho, D.: The impact of rain on the global ocean carbon uptake, EGU General Assembly 2024, Vienna, Austria, 14–19 Apr 2024, EGU24-7477, https://doi.org/10.5194/egusphere-egu24-7477, 2024.

EGU24-8197 | Orals | OS1.7

SEAS: a simulation system for forecasting the atmosphere-coupled ocean dynamics in the Southern EuropeAn Seas 

Francesco Maicu, Nadia Pinardi, Silvio Guadi, Emanuela Clementi, Francesco Trotta, and Giovanni Coppini

The prototype of a short-term forecasting system of the ocean dynamics of Southern European Seas (SEAS), was developed. It is based on a regional coupled ocean-atmosphere model, with NEMO and WRF codes implemented on the same computational grid, with 1/24° resolution, which encompasses Mediterranean Sea, Marmara Sea and Black Sea. The domain extends also westward and northward in the Atlantic Ocean to downscale properly the mid-latitudes atmospheric perturbations from the parent ECMWF HRES model.

The forecasting uncertainty of the atmospheric regimes in such a complex Euro-Mediterranean region must be considered along with the uncertainties of the parametrizations of the surface processes at the ocean-atmosphere interface. Therefore, the goal of coupling oceanic and atmospheric models is to reduce these uncertainties and exploit the second type predictability to increase the forecast skills of the ocean dynamics.

The uncoupled ocean model has been validated against Sea Surface Temperature (SST) satellite observed data, and the skills compared to those of the Copernicus Mediterranean Forecasting System (MedFS hereafter) both in the short-term forecast over two seasonal periods and in the simulation of the medicane Ianos.

Various physical schemes, domain extensions, boundary, and initial conditions were initially tested using the uncoupled atmospheric model to obtain the best representation of the medicane Ianos. Furthermore, these experiments were also useful to determine the coupling strategy more appropriate to reduce the heat fluxes imbalance between the two components.

The SST differences between coupled and uncoupled experiments are determined by the heat fluxes computation in the atmospheric component rather than using the MedFS bulk formulae implemented in the ocean model. These differences are largely dependent on the surface boundary layer scheme used in WRF, therefore, several coupled experiments were conducted.

In terms of SST, the coupled model replicates the skills of the MedFS in the winter period while in the summer period the skills are worsened due to the larger heat fluxes. Numerical experiments focused on the parametrizations of the atmospheric boundary layer are still ongoing work.

The skill of the coupled model in reproducing the observed SST during the medicane Ianos is comparable with the one of the uncoupled oceanic model in the Ionian Sea. In terms of heat fluxes, the coupling changes significantly the heat budget locally in the Ionian Sea, mainly through the latent heat flux and the shortwave radiation. The coupling is not that relevant for the intensification of the cyclone, whereas it enhances the representation of its path and the time of the landfall on the Ionian Islands.

How to cite: Maicu, F., Pinardi, N., Guadi, S., Clementi, E., Trotta, F., and Coppini, G.: SEAS: a simulation system for forecasting the atmosphere-coupled ocean dynamics in the Southern EuropeAn Seas, EGU General Assembly 2024, Vienna, Austria, 14–19 Apr 2024, EGU24-8197, https://doi.org/10.5194/egusphere-egu24-8197, 2024.

EGU24-8431 | ECS | Orals | OS1.7 | Highlight

The evolution of turbulence, stratification, and the surface jet in Diurnal Warm Layers 

Mariana Miracca Lage, Claire Ménesguen, Lucas Merckelbach, Julia Dräger-Dietel, Alexa Griesel, and Jeff Carpenter

The ocean's upper layer is inherently turbulent and constantly forced by momentum and buoyancy fluxes, and their interplay operates to mix and/or stratify the first meters of the water column. Incoming solar short-wave radiation acts to stabilize the upper layer, whereas the wind transfers momentum to the ocean and acts to vertically mix the water column. However, if the wind is not strong enough to trigger mixing, stratification in the near-surface is immediately formed in a layer of O(10) m thickness, called the diurnal warm layer (DWL). Above the bottom boundary of the DWL, shear production can be enhanced leading to large dissipation of turbulent kinetic energy (TKE) rates, i.e. high turbulence. Based on observational data from an ocean glider with a mounted microstructure package and drifters, we show the evolution of three DWLs sampled on the rim of a mesoscale eddy in the South Atlantic ocean (32oS, 4oE) with respect to temperature and buoyancy anomalies, potential energy and dissipation of TKE. In the near-surface, temperature and buoyancy anomalies increase with the evolution of the DWL, and the latter has the same magnitude as the time-integrated surface buoyancy flux. We also show the development of a diurnal jet with magnitude of O(10) cm/s that veers with the wind. Late in the afternoon, when the diurnal jet is fully developed, the bulk Richardson number (Rib) indicates that the stratified layer related to the DWL becomes marginally unstable (Rib ~ 0.25). During this period, the potential energy also decays, suggesting that the enhanced turbulence within the DWL acts to destroy stratification through turbulent mixing. We further assess whether a one-dimensional turbulence model is able to reproduce the observed DWL’s characteristics and the change in stability throughout the day.

How to cite: Miracca Lage, M., Ménesguen, C., Merckelbach, L., Dräger-Dietel, J., Griesel, A., and Carpenter, J.: The evolution of turbulence, stratification, and the surface jet in Diurnal Warm Layers, EGU General Assembly 2024, Vienna, Austria, 14–19 Apr 2024, EGU24-8431, https://doi.org/10.5194/egusphere-egu24-8431, 2024.

EGU24-10253 | ECS | Posters on site | OS1.7

Spatial variation of future trends in Atlantic upwelling cells from CMIP6 models 

Raquel Flügel, Steven Herbette, Anne Marie Treguier, Robin Waldman, and Malcolm Roberts

Eastern Boundary Upwelling Systems (EBUS) are characterised by wind-triggered upwelling of deep waters along the coast. They are hotspots of biological productivity and therefore have a high economic, ecological and social importance. Here we investigate the evolution of the two Atlantic EBUS during the historical period and in a future high-emission scenario in CMIP6 models from two modelling centres, with spatial resolutions ranging from 1° to 1/12° in the ocean. The decomposition of the upwelling systems into subregions reveals differences between the equatorward and poleward parts. Our analysis is focused on the modelled vertical transport, which is shown to be consistent with the wind-derived Ekman index. Integrating the vertical transport provides a synthetic view of the upwelling cells, their strength, depth and distance to the coast. The models show high interannual variability over the 21st century century, which explains why significant trends could only be found in few subregions of the Atlantic EBUS. The results suggest a poleward migration of upwelling systems with climate change and a change of the upwelling cells, rather than the uniform intensification which had been hypothesised by Bakun in 1990.

How to cite: Flügel, R., Herbette, S., Treguier, A. M., Waldman, R., and Roberts, M.: Spatial variation of future trends in Atlantic upwelling cells from CMIP6 models, EGU General Assembly 2024, Vienna, Austria, 14–19 Apr 2024, EGU24-10253, https://doi.org/10.5194/egusphere-egu24-10253, 2024.

EGU24-11098 | ECS | Posters on site | OS1.7

Feedbacks between turbulent air-sea fluxes and their role in the adjustment of the Earth Climate System 

Clément Dehondt, Pascale Braconnot, Sébastien Fromang, and Olivier Marti

In state of the art Earth System Models (ESM), the variables at the ocean-atmosphere interface (wind, air temperature, humidity, surface currents and SST) are linked to turbulent surface fluxes (momentum, sensible and latent heat) in a complex manner via bulk closures.

Understanding how turbulent fluxes interact between them and with the ocean-atmosphere interface variables is a major scientific challenge because it connects local interactions with large scale energy and water cycles.

These interactions between the different air-sea turbulent fluxes are difficult to diagnose from fully coupled ocean-atmosphere simulations due to the fact that in most modelling groups coupled and stand alone components do not necessarily use consistent forcing or representation of the air-sea fluxes. Also rigorous protocols between coupled and stand alone atmosphere and ocean simulations need to be implemented to be able to properly disentangle the role of different physical representation at the air-sea interface from global ocean-atmosphere-land adjustment feedbacks that may counteract the direct effects of air-sea fluxes modeling.

Here we use an ensemble of fully coupled and stand alone simulations using a version of the IPSL ESM [1] based on the new DYNAMICO atmospheric dynamical core [2] and the ocean engine NEMO [3]. We analyse an ensemble of experiments differing by the the bulk formulation of the air-sea turbulent fluxes (NCAR, COARE3.6, ECMWF and LMDZng). The analyses will focus on the adjustment of the system in the different cases, especially on the differences in the transport of heat and water, mixed layer depth adjustement, feedback on ocean surface properties, intertropical convergence zone (ITCZ) and mid-latitude storm tracks.


[1] Boucher O., Servonnat, J., Albright, A. L., Aumont, O., Balkanski, Y., Bastrikov, V., et al. (2020). Presentation and evaluation of the IPSL‐CM6A‐LR climate model. Journal of Advances in Modeling Earth Systems, 12, e2019MS002010. https://doi.org/10.1029/2019MS002010

[2] Dubos, T., Dubey, S., Tort, M., Mittal, R., Meurdesoif, Y., and Hourdin, F.: DYNAMICO-1.0, an icosahedral hydrostatic dynamical core designed for consistency and versatility, Geosci. Model Dev., 8, 3131–3150, https://doi.org/10.5194/gmd-8-3131-2015, 2015.
 
[3] “NEMO ocean engine”, Scientific Notes of Climate Modelling Center, 27 — ISSN 1288-1619, Institut PierreSimon Laplace (IPSL), doi:10.5281/zenodo.1464816

How to cite: Dehondt, C., Braconnot, P., Fromang, S., and Marti, O.: Feedbacks between turbulent air-sea fluxes and their role in the adjustment of the Earth Climate System, EGU General Assembly 2024, Vienna, Austria, 14–19 Apr 2024, EGU24-11098, https://doi.org/10.5194/egusphere-egu24-11098, 2024.

EGU24-11282 | ECS | Orals | OS1.7

Can sea spray aerosol be a source of gas-phase perfluoroalkyl substances (PFAS)? A study in the Eastern North Atlantic Ocean 

Sneha Aggarwal, Olga Garmash, Delaney Kilgour, Christopher Jernigan, Julika Zinke, Xianda Gong, Shengqian Zhou, Jiaoshi Zhang, Jian Wang, Timothy Bertram, Joel Thornton, Matt Salter, Paul Zieger, and Claudia Mohr

Sea spray aerosol (SSA) formed after wave breaking at the ocean surface influences our climate by scattering incoming solar radiation and acting as cloud condensation nuclei. Furthermore, they provide a microenvironment for aqueous phase chemistry, selective uptake of surfactants, and gas-to-particle partitioning of compounds by providing an acidic pH at the air-water interface (Angle et al., 2022). Despite these known effects, a crucial question remains unanswered: which volatile organic compounds (VOCs) are emitted from SSA, and how do they change over time via atmospheric aging?

To address this, we designed a novel experimental setup during the AGENA* Campaign 2022 at Graciosa Island, Portugal. For the first time, we connected a sea spray simulation chamber to a chemical ionization mass spectrometer (CIMS) to measure the freshly emitted gases from both seawater and SSA. Additionally, we aged the samples for an equivalent period of about 3-3.5 days in an oxidation flow reactor to investigate compositional changes after ageing.

Surprisingly, our findings reveal that nearly half of the mass-spectrometer signal from the fresh samples constituted fluorinated compounds, specifically short-chain perfluoroalkyl carboxylic acids - a class of perfluoroalkyl substances (PFAS). While, previous studies have shown that SSA can release and play a key role in the long-range transport of PFAS, these studies have primarily focused on particle-phase emissions (Johansson et al., 2019, Sha et al, et al., 2022). In contrast, our study provides new insights into oceanic PFAS emissions and transport to the atmosphere by examining gas-phase emissions.  

Furthermore, we observed that the gas-phase PFAS almost completely disappears after ageing. Our hypothesis is that these compounds partition into the particle phase. We plan to test this hypothesis by analyzing the particle filters collected during the campaign.

*Aerosol Growth in the Eastern North Atlantic (AGENA) https://www.arm.gov/research/campaigns/ena2022agena

Angle, K. J., Crocker, D. R., Simpson, R. M., Mayer, K. J., Garofalo, L. A., Moore, A. N., ... & Grassian, V. H. (2021). Acidity across the interface from the ocean surface to sea spray aerosol. Proceedings of the National Academy of Sciences118(2), e2018397118.

Johansson, J. H., Salter, M. E., Navarro, J. A., Leck, C., Nilsson, E. D., & Cousins, I. T. (2019). Global transport of perfluoroalkyl acids via sea spray aerosol. Environmental Science: Processes & Impacts21(4), 635-649.

Sha, B., Johansson, J. H., Tunved, P., Bohlin-Nizzetto, P., Cousins, I. T., & Salter, M. E. (2021). Sea spray aerosol (SSA) as a source of perfluoroalkyl acids (PFAAs) to the atmosphere: field evidence from long-term air monitoring. Environmental Science & Technology56(1), 228-238.

How to cite: Aggarwal, S., Garmash, O., Kilgour, D., Jernigan, C., Zinke, J., Gong, X., Zhou, S., Zhang, J., Wang, J., Bertram, T., Thornton, J., Salter, M., Zieger, P., and Mohr, C.: Can sea spray aerosol be a source of gas-phase perfluoroalkyl substances (PFAS)? A study in the Eastern North Atlantic Ocean, EGU General Assembly 2024, Vienna, Austria, 14–19 Apr 2024, EGU24-11282, https://doi.org/10.5194/egusphere-egu24-11282, 2024.

The Coupled Ocean-Atmosphere-Wave-Sediment Transport (COAWST) model has been employed to simulate the anomalous post-monsoon tropical cyclone (TC) Jawad that originated over the Bay of Bengal (BoB) in December 2021. The atmospheric initial and boundary conditions (IC and BC) have been obtained from the Global Forecasting System (GFS) Analyses and Forecasts and two contrasting ocean IC and BCs, viz., HYCOM (experiment name GFS-HYCOM) and INCOIS (experiment name GFS-INCOIS), are implemented in two separate coupled experiments to evaluate the influence of TC Jawad on the surface and sub-surface characteristics of BoB. The track of the TC, including its recurvature, was well captured by both experiments with significant accuracy. A proper contrast in temperature between the two sides of the TC track was noted in the surface and sub-surface temperatures observed by two buoys, i.e., (1) BD11 (west of the TC track) and (2) BD13 (east of the TC track), and the simulated temperatures were validated with these observations. Contrary to the usual scenario, the higher sub-surface warming on the eastern side of the TC track was captured by GFS-HYCOM, but with a significant overestimation. The lower temperature on the western side of the TC track can be attributed to the weak upwelling associated with the cyclonic circulation caused by the interaction of the TC with the southward coastal currents. An unusually higher downwelling on the eastern side of the TC track was observed in the vertical distribution of the temperature across the longitudes, which suggested the existence of a strong clockwise circulation near the location of BD13. GFS-HYCOM, which simulated a higher current magnitude in the sub-surface than GFS-INCOIS on the eastern side of the TC track, captured the circulation near BD13 more rigorously. From further analysis, it was inferred that the interaction of the cyclonic wind flow of TC Jawad (westerly) near the surface with the easterly flow caused the generation of the clockwise circulation over the ocean surface on the eastern side of the TC track, leading to intense downwelling and warming of the sub-surface temperature. This scenario was further corroborated by the simulated Ekman transport and higher convective activity in the eastern quadrants of the TC. The present study not only emphasizes the capability of the coupled ocean-atmosphere models to simulate TCs but also highlights the necessity of investigating the air-sea interaction processes and their responses to the passage of an anomalous TC like Jawad.

How to cite: Chakraborty, T., Pattnaik, S., and Joseph, S.: Modulation of surface and sub-surface circulation in the Bay of Bengal by the passage of tropical cyclone Jawad: coupled ocean-atmosphere feedback , EGU General Assembly 2024, Vienna, Austria, 14–19 Apr 2024, EGU24-11375, https://doi.org/10.5194/egusphere-egu24-11375, 2024.

EGU24-11879 | Posters on site | OS1.7

Estimates of Polar Ocean CO2 Uptake from Atmospheric Inverse Analyses  

Parvadha Suntharalingam, Zhaohui Chen, and Jayashree Ghosh

Estimates of global scale air-sea CO2 fluxes have traditionally been derived from ocean biogeochemistry models and ocean surface pCO2 data products (Friedlingstein et al. 2022). An alternative means of estimating ocean carbon uptake is provided by atmospheric inversions; these use optimization procedures and data assimilation methods to combine atmospheric CO2 measurements with numerical transport model simulations and prior knowledge of air-sea fluxes. 

Here we use the GEOSChem-LETKF (GCLETKF) inverse system (Chen et al. 2021) in conjunction with atmospheric observations from the NOAA-GML surface CO2 measurement network to derive grid-scale air-sea CO2 flux estimates for the period 2000-2017. We focus, in particular, on estimates of CO2 uptake by the polar oceans (Southern and Arctic oceans). These  regions have accounted for a significant component of global oceanic carbon uptake  in recent decades (e.g., more than 20% of global ocean uptake, in comparison to their ocean areal  extent of < 10%).

We present GCLETKF estimates of ocean CO2 uptake at global and regional scales, and assess the robustness of our results with a suite of metrics that include model concentration bias, CO2 flux error reduction, and comparison to independent atmospheric measurements. GCLETKF flux estimates for the 2000-2017 period indicate regional CO2  uptake of 0.1-0.2 PgC/year for the Arctic,  and  0.45-0.55 PgC/yr for the Southern Ocean. We also provide summary estimates of the  interannual variations and  decadal-scale trends of the polar ocean carbon fluxes, and compare the GCLETKF results  to estimates derived from global ocean biogeochemistry models and surface ocean pCO2 data products.  

How to cite: Suntharalingam, P., Chen, Z., and Ghosh, J.: Estimates of Polar Ocean CO2 Uptake from Atmospheric Inverse Analyses , EGU General Assembly 2024, Vienna, Austria, 14–19 Apr 2024, EGU24-11879, https://doi.org/10.5194/egusphere-egu24-11879, 2024.

EGU24-12623 | ECS | Posters on site | OS1.7

Evaluation of several meteorological models by comparison with qualified Air-Sea observations 

Saïd Benjeddou, Denis Bourras, and Christopher Luneau

Meteorological models are important simulation tools to improve our understanding of the climate behavior on seasonal, annual, decadal and centennial scales. Their complexity has increased considerably since 1990. The output fieds of several widely available meteorological such as GFS, ECMWF, WRF, ARPEGE and MERRA are evaluated, by comparing the output fields to in situ data performed during six campaigns with the wave-following platform OCARINA (Ocean Coupled with the Atmosphere, Research on the Interface on Annex Ship) developed at MIO. Following a recent comparison for wind and SST by Benjeddou et al. (2024), emphasis will now be laid on the comparison of heat fluxes and associated bulk variables, in open sea conditions, versus close to the shore line.

How to cite: Benjeddou, S., Bourras, D., and Luneau, C.: Evaluation of several meteorological models by comparison with qualified Air-Sea observations, EGU General Assembly 2024, Vienna, Austria, 14–19 Apr 2024, EGU24-12623, https://doi.org/10.5194/egusphere-egu24-12623, 2024.

Estimates of air-sea fluxes rely on the knowledge of the gas transfer velocity. Despite more than half a century of field measurements, starting with the GEOSECS program in the 70ies, there are still many open questions. At low wind speeds, no reliable measurements are available, because all available techniques (dual-tracer, eddy covariance and active thermography) are either not suitable for measurements under these conditions or deliver too uncertain results. At high wind speeds beyond 25 m/s, almost no measurements are available. In the intermediate wind range enough reliable data are available. But the data are partly contradictionary. The effect of the many other parameters influencing the transfer velocity besides the wind speed is still uncertain. This includes the effect of the sea state (wave age), bubbles, and surfactants.

In wind-wave tunnels, it is easy to perform systematic studies. But the conditions deviate significantly from those at the open ocean in traditional linear facilities because of the short interaction length between wind. Therefore, only young wind seas can be generated, far away from a wind sea in equilibrium with the wind (“fetch gap”).

In 2021, we started a laboratory program, funded by a Reinhart Koselleck Project of the German Science Foundation. It includes three innovative key elements, which together overcome most disadvantages of previous wind-wave tunnel experiments. Firstly, a large annular facility is used, the Heidelberg Aeolotron. Because of the infinite fetch, wind waves come into equilibrium with the wind as at the ocean. Secondly, two imaging techniques are used to measure transfer velocities locally and instantaneously. Active thermography is used to measure the heat transfer velocity across the aqueous viscous boundary layer and a novel fluorescence technique to image the concentration fields in the mass boundary layer and to estimate the gas transfer velocity. Thirdly, measurements are performed under non-stationary conditions. In this way the whole fetch range can be investigated, when the wind speed is turned on, and decaying wind seas, when the wind speed is lowered.

In this talk first results of these measurements will be shown:

At low wind speeds, a significant overshoot in the transfer velocity occurs at low-fetch wind-wave fields.

The change in the Schmidt number exponent of the transfer velocity from 2/3 to 1/2 is related to the increasing frequency of microscale wave breaking.

An insoluble monomolecular monolayer of hexadecanol has the same effect as the soluble surfactant TritonX-100 (5 ppm by volume): Wind waves are completely suppressed up to wind speeds of about 8 m/s and the spatial patterns of the concentration field in the boundary layer are the same. In contrast, lowering the surface tension to about 43 mN/m by adding 1-hexanol to the water (2.4 kg/m3) did not suppress wind waves and transfer velocities at all.

How to cite: Jähne, B.: On the Crucial Role of Wind-Wave-Tunnel Studiesto Reveal the Mechanisms of Air-Sea Gas Exchange, EGU General Assembly 2024, Vienna, Austria, 14–19 Apr 2024, EGU24-13372, https://doi.org/10.5194/egusphere-egu24-13372, 2024.

EGU24-13779 | ECS | Orals | OS1.7 | Highlight

Two extremes: Investigating the impact of the co-occurrence of medicanes and marine heatwaves in the Mediterranean Sea. 

Kenechukwu Uba, Manal Hamdeno, Alexander Barth, and Aida Alvera-Azcárate

The oceans are steadily warming, which affects global weather and climate and leads to an increase in extreme events such as storms, hurricanes and marine heatwaves (MHWs). Future warming scenarios predict an increase in the frequency and intensity of such events. In the Mediterranean region, both extratropical cyclones and occasional Mediterranean hurricanes (medicanes) occur, causing considerable damage to infrastructure and major socio-economic losses in coastal regions. Using ERA-5 atmospheric reanalysis data and satellite-derived sea surface temperatures (SST), this study looks at medicanes that occurred between 2011 and 2023 and examines their characteristics and impacts on the water column. The interaction with simultaneous MHWs in the Mediterranean is also investigated. A total of 15 medicanes occurred during the study period. Of these, 5 occurred in the western Mediterranean (WMed), mainly in November; 9 in the central Mediterranean and Ionian (CMed) between September and December, two of which terminated in the eastern basin; and 1 event was localised entirely in the eastern Mediterranean (EMed) in October. During the study period, 2014 recorded the highest number of medicanes with three events. One event, Ilona, occurred in January in the WMed, while the other two events, Qendresa and Xandra, occurred in November in the CMed and WMed respectively. Two events took place in both 2020 and 2021. In 2020, both Ianos in September and Elaina in December were in the CMed. In 2021, the CMed and WMed witnessed the passage of Apollo in October and Blas in November respectively. In the 15 medicanes, the mean sea level pressure (MSLP) was between 988 and 1005 hPa, while the wind speeds (Ws) were between 17 and 23 m/s. Among the events, Ilona in January 2014 had the lowest MSLP and highest Ws and the lowest associated MSLP anomaly. Of the 15 events, 11 (73%) were associated with anomalously high sea surface temperatures (SSTA) and five of these SSTAs were defined as MHW events. Moreover, the high SST anomalies were observed three or more days before the onset of these medicanes, which may have contributed to the intensification of the passing storms and amplified their impact through air-sea heat exchange. In turn, the medicanes were also observed to influence the MHWs, as the heat released from the ocean during the medicanes prevented the MHWs from deepening beyond the surface layer, demonstrating a dynamic interplay between these events. In summary, as the oceans warm, medicanes and MHWs in the Mediterranean increase, with complex interactions determining their behavior and impacts. Understanding these dynamics is crucial for predicting and mitigating the impacts of these events on marine ecosystems and coastal regions. 

How to cite: Uba, K., Hamdeno, M., Barth, A., and Alvera-Azcárate, A.: Two extremes: Investigating the impact of the co-occurrence of medicanes and marine heatwaves in the Mediterranean Sea., EGU General Assembly 2024, Vienna, Austria, 14–19 Apr 2024, EGU24-13779, https://doi.org/10.5194/egusphere-egu24-13779, 2024.

EGU24-15234 | ECS | Posters on site | OS1.7

A catalogue of wind events for assessing the connectivity among Marine Protected Areas in the German Bight (North Sea) 

Sara Rubinetti, Vera Sidorenko, Enrico Arnone, Alexey Androsov, Kingsly C. Beng, Kerstin Klemm, Anne F. Sell, Anna Akimova, Santiago E. A. Pineda-Metz, Bernadette Pogoda, Sarah Brand, Mathias Wegner, Lisa Shama, Silke Laakmann, Sabine Horn, and Karen H. Wiltshire

Marine protected area (MPA) networks are fundamental for restoring and conserving ecosystem functions like biodiversity and general ecosystem health. Ideally, the effects of local conservation measures are not limited to one particular MPA alone but influence and connect regions beyond, or even other MPAs, through the spreading, replenishment and potential recovery of populations and communities. Connectivity defines, in a probabilistic sense, the functional linkage exchange between individual MPAs or key regions, and it depends on the features of the selected tracers (including the specific biological traits of target organisms), but it is also to a large degree determined by the hydrodynamic circulation patterns in the area. For the German Bight (south-eastern North Sea), we are focusing in particular on potential spillover from a restoration site for the European flat oyster (Ostrea edulis) through the spread of planktonic life stages. 
The circulation regimes are determined mainly by tidal and wind forcings. The prevailing wind-driven surface circulation in the area is cyclonic, influenced by frequent south-westerly to westerly winds. However, winds from other directions, for instance from the North-West, have the potential to modify and even reverse this circulation pattern. Wind intensity and directions have a clear seasonal variability, with higher magnitudes in winter and lower in summer, but also exhibit a significant interannual variability driven by the strength and location of high and low mean sea level atmospheric pressure centres. Moreover, winds from the East are relatively rare compared to the other patterns but can be extremely persistent (up to hundreds of hours) and thus affect the hydrodynamics and, hence, the connectivity between the MPAs. In this study, we catalogued the wind events according to their typical duration and magnitude using 10m eastward and northwards components retrieved from ERA5 reanalysis data and characterized them according to their seasonality and interannual variability. The results can be used to define realistic atmospheric scenarios to numerically simulate the sea dynamics in the southern North Sea and, consequently, assess the connectivity among different sites, including established MPAs. These efforts are crucial for a proper planning of conservation and restoration measures in the German Bight, which is one of the most exploited marine regions in the world. 

How to cite: Rubinetti, S., Sidorenko, V., Arnone, E., Androsov, A., Beng, K. C., Klemm, K., Sell, A. F., Akimova, A., Pineda-Metz, S. E. A., Pogoda, B., Brand, S., Wegner, M., Shama, L., Laakmann, S., Horn, S., and Wiltshire, K. H.: A catalogue of wind events for assessing the connectivity among Marine Protected Areas in the German Bight (North Sea), EGU General Assembly 2024, Vienna, Austria, 14–19 Apr 2024, EGU24-15234, https://doi.org/10.5194/egusphere-egu24-15234, 2024.

EGU24-16489 | Orals | OS1.7 | Highlight

Vertical fluxes in subpolar eddies from a high-resolution, multiplatform experiment in the Labrador Sea 

Ahmad Fehmi Dilmahamod, Johannes Karstensen, Jochen Horstmann, and Gerd Krahmann

Mesoscale structures are key dynamical features of the ocean. They are associated with a variety of short lived and small-scale dynamics linked to physical, biological, and chemical processes at the submesoscale, such as cascading energy, impacting ocean stratification, and guiding ocean carbon and oxygen uptake. In the high latitudes, the spatial extent of the mesoscale is only tens of kilometres, making it challenging to observe the submesoscale processes. In August-September 2022, an extensive submesoscale-resolving multiplatform experiment was conducted across an Irminger Ring in the Labrador Sea. The experiment leveraged two underwater electric gliders equipped with nitrate, microstructure shear, chlorophyll fluorescence, oxygen, and turbidity sensors, operated in concert with a variety of ship operated instruments including underway-CTD’s, a moving vessel profiler, Thermosalinograph, ADCPs and a X-band radar system. Observations were acquired both, along the peripheries and within the core of the eddy, and offered insight into submesoscale dynamics of the ring. Making use of nearly concurrent turbulence and nutrients observations, we estimated the vertical flux pattern across the eddy’s frontal and interior regions. From the recorded and expected glider vehicle motion a vertical water velocity could be inferred and compared with the nutrient flux pattern. The stability of the ring was tracked with surface drifters, for weeks after the ship and glider survey ended, and a link between the disintegration of the ring and an atmospheric event was investigated

How to cite: Dilmahamod, A. F., Karstensen, J., Horstmann, J., and Krahmann, G.: Vertical fluxes in subpolar eddies from a high-resolution, multiplatform experiment in the Labrador Sea, EGU General Assembly 2024, Vienna, Austria, 14–19 Apr 2024, EGU24-16489, https://doi.org/10.5194/egusphere-egu24-16489, 2024.

EGU24-16669 | ECS | Posters on site | OS1.7 | Highlight

Buoyant gravity currents triggered by a collapsing mid-latitude submesoscale front 

Grete Boskamp, Peter Holtermann, and Lars Umlauf

Sharp fronts with temperature differences of approximately 0.5°C across a remarkably small lateral scale of order 10 m were observed in a subtropical region with strong mesoscale and submesoscale activity in the southeast Atlantic at 34°S, 6.5°E, far away from any coastal freshwater sources. These fronts were formed at the leading edge of a buoyant gravity current of 20-40 m thickness that propagated at a speed of order 0.1 m/s relative to the colder and thus denser surrounding waters. High-resolution turbulence microstructure observations revealed strongly enhanced turbulence inside the nose of the gravity current, while turbulence in the trailing bulk region was mainly wind- and convectively-driven and showed a strong diurnal modulation. Satellite and meteorological data suggest that the gravity current was triggered by the mesoscale strain-induced sharpening and final collapse of a larger-scale front at the edge of a mesoscale eddy during a period with decaying winds. In contrast to previous studies that have identified similar buoyant gravity currents in the equatorial ocean, our data suggest that they can also form at a mid-latitude location where rotational effects are strong. This suggests that even balanced fronts can decay into gravity currents under certain conditions, indicating a potentially important pathway for mesoscale energy dissipation and mixing.

How to cite: Boskamp, G., Holtermann, P., and Umlauf, L.: Buoyant gravity currents triggered by a collapsing mid-latitude submesoscale front, EGU General Assembly 2024, Vienna, Austria, 14–19 Apr 2024, EGU24-16669, https://doi.org/10.5194/egusphere-egu24-16669, 2024.

EGU24-16888 | Posters on site | OS1.7

North Atlantic SST variability during strong winter extratropical cyclones 

Margarida L. R. Liberato

Extreme weather and climate events, such as extratropical cyclones and droughts, represent a topic of paramount importance in the Iberian Peninsula and the North Atlantic Ocean plays an important role in shaping their frequency and intensity. Sea surface temperature (SST) variations, which are important indicators of ocean variability, can result in anomalous diabatic heating or cooling of the overlying atmosphere. In this study, the contributions of different physical processes to the development of North Atlantic explosive extratropical cyclones (EC) affecting the Iberian Peninsula are investigated using the ERA5 reanalysis from the European Centre for Medium-Range Weather Forecasts (ECMWF). Results suggest that the North Atlantic Ocean SST contributed to the formation and intensification of extratropical cyclones, and particularly to the formation and development of intense storms. Furthermore, the combined analysis of SST and net surface heat flux (QN) also shows the cooling of the ocean associated with the EC tracks caused by the heat exchanges between the ocean and the atmosphere.


Acknowledgements

This work is supported by national funds by FCT - Portuguese Foundation for Science and Technology, under the project UIDB/04033/2020 (https://doi.org/10.54499/UIDB/04033/2020).


How to cite: Liberato, M. L. R.: North Atlantic SST variability during strong winter extratropical cyclones, EGU General Assembly 2024, Vienna, Austria, 14–19 Apr 2024, EGU24-16888, https://doi.org/10.5194/egusphere-egu24-16888, 2024.

EGU24-18069 | ECS | Posters on site | OS1.7

Seasonal Variation of Mesoscale Horizontal Stirring in the North Pacific Ocean 

Gyuseok Yi, Wonsun Park, and June-Yi Lee

The mesoscale horizontal stirring (MHS) is closely linked to various mesoscale dynamical phenomena, encompassing not only eddies but also meanders, filaments, and fronts. A clear understanding of its seasonality holds the potential to enhance our understanding of horizontal mixing and material dispersion. Here, we analyze the seasonal variation of MHS in the North Pacific surface ocean using ocean reanalysis (GLORYS12) current velocity data with a horizontal resolution of 1/12° from 1993 to 2019. Based on the characteristic of stirring to separate adjacent fluid trajectories, MHS is quantified using the finite-size Lyapunov exponent (FSLE), one of the Lagrangian diagnostics. The FSLE in the North Pacific shows clear seasonality but the phases of its evolution differ regionally. We identify two major modes, which contribute to over 80% of the seasonality of FSLE in the North Pacific, through the application of empirical orthogonal function (EOF) analysis to the climatological monthly mean FSLE. The first mode (57%) exhibits a variation peaking in April within the Kuroshio Extension region and the Subtropical Countercurrent region, where baroclinic instability plays a significant role. The second mode (25%) peaks during the summer season over the Kuroshio area and coastal upwelling areas of western North America. It is found that the strong seasonality in the upwelling area is induced by the North Pacific High.

How to cite: Yi, G., Park, W., and Lee, J.-Y.: Seasonal Variation of Mesoscale Horizontal Stirring in the North Pacific Ocean, EGU General Assembly 2024, Vienna, Austria, 14–19 Apr 2024, EGU24-18069, https://doi.org/10.5194/egusphere-egu24-18069, 2024.

EGU24-19544 | Orals | OS1.7 | Highlight

Plastics Affect the Ocean's Uptake of Atmospheric CO₂ across the Marine Boundary Layer 

Luisa Galgani, Eleni Tzempelikou, Ioanna Kalantzi, Anastasia Tsiola, Manolis Tsapakis, Paraskevi Pitta, Chiara Esposito, Anastasia Tsotskou, Iordanis Magiopoulos, Roberto Benavides, Tobias Steinhoff, Amedeo Boldrini, Alessio Polvani, and Steven A. Loiselle

Microplastics can support biomass production by acting as substrates for microbial activity. This may imply potentially relevant effects for the sea-surface microlayer, the interface mediating air-sea gas exchange and where biological organic compounds can accumulate.

We tested this hypothesis by using six large scale mesocosms to simulate a future “high plastic ocean”. During the course of a 12-days experiment, we explored microbial organic matter dynamics in the sea-surface microlayer in the presence and absence of microplastics in the underlying water. We used as a reference a known number of polystyrene beads of 30 µm diameter and compared the three treatment mesocosms to an equal number of plastic-free control mesocosms.

The presence of microplastics represented a spur for microbial activity, and in the treated mesocosms biomass production was enhanced, leading to an increased concentration of organic compounds accumulating in the sea-surface microlayer. This initial boost in biological productivity led to a ∼3 % reduction of dissolved CO₂ in the underlying water, which we could imagine potentially reversed once the degradation phase took off. Based on our results and on other recent studies, we will discuss potential interference of plastic with the composition of the sea-surface microlayer, with direct and indirect impacts on the uptake of CO₂ and the marine carbon cycle. 

How to cite: Galgani, L., Tzempelikou, E., Kalantzi, I., Tsiola, A., Tsapakis, M., Pitta, P., Esposito, C., Tsotskou, A., Magiopoulos, I., Benavides, R., Steinhoff, T., Boldrini, A., Polvani, A., and Loiselle, S. A.: Plastics Affect the Ocean's Uptake of Atmospheric CO₂ across the Marine Boundary Layer, EGU General Assembly 2024, Vienna, Austria, 14–19 Apr 2024, EGU24-19544, https://doi.org/10.5194/egusphere-egu24-19544, 2024.

EGU24-20158 | ECS | Orals | OS1.7

On the influence of hydrodynamic and environmental conditions on wave breaking in the nearshore 

Susanne Støle-Hentschel, Patricio Catalán, Michael Streßer, Jochen Horstmann, and Frédéric Dias

An improved understanding of wave breaking is still a hot topic owing to its relevance in the coupling of ocean and atmosphere. Multiple communities are focusing on numerical simulations of the fully coupled two-phase flow, the validation of such models remains challenging. Herein, we demonstrate how coherent marine radars can help to shed light on how different wave and wind parameters influence the evolution of waves towards breaking in the nearshore. The interpretation of the results is undermined by SWASH simulations of shoaling waves for different wave spectra and two beaches and simulations of radvarimages of these waves. Data of three independent measurement campaigns shows that the shoaling characteristics are strongly influenced by the wave steepness, relative depth the Ursell number and the wind. The influence of individual parameters cannot be isolated, but must be understood in its entirety.

How to cite: Støle-Hentschel, S., Catalán, P., Streßer, M., Horstmann, J., and Dias, F.: On the influence of hydrodynamic and environmental conditions on wave breaking in the nearshore, EGU General Assembly 2024, Vienna, Austria, 14–19 Apr 2024, EGU24-20158, https://doi.org/10.5194/egusphere-egu24-20158, 2024.

EGU24-20277 | ECS | Posters on site | OS1.7

Impact of marine biogenic VOC emissions on the marine boundary layer of the Eastern Mediterranean 

Elissavet Bossioli, Dimitrios Kourakos, Dionysios E Raitsos, Antonia Kournopoulou, John Karagiorgos, Georgia Methymaki, Panagiotis Portalakis, Stavroula Karatasou, and Sarantis Sofianos

The production by biological and photochemical mechanisms of short-lived Volatile Organic Compounds (VOC) in the surface ocean is regulated by environmental parameters and nutrient abundance, and hence climate change. These gases then enter the atmosphere through the air–sea interface and contribute to photochemical pollution, affect the cloud properties, the radiative forcing and precipitation. Despite the improved understanding of the temporal and spatial distribution of marine trace gases of biogenic origin and their potential effects, further investigation is needed in different geographical regions and especially in polluted marine environments and populated coastal regions (Tinel et al., 2023). In this study we estimate the spatiotemporal distribution of seawater VOC concentrations in the climate sensitive geographical region of Eastern Mediterranean. State-of-the art empirical models linking remotely-sensed data of phytoplankton biomass (EU Copernicus Marine Environment Monitoring Service, CMEMS) and environmental parameters such as sea-surface temperature, and photosynthetically available radiation are used (Gali et al., 2018). Ocean-model data such as mixed layer depth, and euphotic zone are also exploited. The impact of the sea-to-air VOC emission fluxes on photochemistry, marine aerosols and cloud properties are assessed and quantified through advanced atmospheric simulations with the WRF-Chem atmospheric model coupled to chemistry and aerosols during typical conditions but also extreme events.


References

Gali M., Levasseur, M., Devred, E., Simo, R. and Babin, M., Sea-surface dimethylsulfide (DMS) concentration from satellite data at global and regional scales, Biogeosciences, 15, 2018, pp. 3497-3519, https://bg.copernicus.org/articles/15/3497/2018 , doi:10.5194/bg-15-3497-2018.

Tinel L., J. Abbatt, E. Saltzman, A. Engel, R. Fernandez, et al.. Impacts of ocean biogeochemistry on atmospheric chemistry. Elementa: Science of the Anthropocene, 2023, 11 (1), ff10.1525/elementa.2023.00032ff. ffhal-04221390f


How to cite: Bossioli, E., Kourakos, D., Raitsos, D. E., Kournopoulou, A., Karagiorgos, J., Methymaki, G., Portalakis, P., Karatasou, S., and Sofianos, S.: Impact of marine biogenic VOC emissions on the marine boundary layer of the Eastern Mediterranean, EGU General Assembly 2024, Vienna, Austria, 14–19 Apr 2024, EGU24-20277, https://doi.org/10.5194/egusphere-egu24-20277, 2024.

Current Feedback (CFB) and Thermal Feedback (TFB) strongly influence atmospheric and oceanic dynamics at the oceanic mesoscale (O(10-250) km). At smaller scales, oceanic submesoscale currents (O(0.1-10 km)) play a major role in the ocean's energy budget, variability, and ecosystems. However, air-sea interactions at the submesoscale are not well understood due to observational and modeling limitations related to their scales. 
 
This talk addresses this gap by using submesoscale coupled ocean-atmosphere models.  These models are implemented over diverse regions characterized by distinct physical properties. The findings provide compelling evidence that submesoscale modulation affects both the atmosphere and oceanic dynamics. Both TFB and CFB significantly modulate low-level wind curl and divergence as well as momentum and heat fluxes between the ocean and the atmosphere, with a direct impact on the oceanic submesoscale energy budget.

How to cite: Renault, L.: Submesoscale air-sea interactions: atmospheric response and impacts on the ocean dynamics, EGU General Assembly 2024, Vienna, Austria, 14–19 Apr 2024, EGU24-20391, https://doi.org/10.5194/egusphere-egu24-20391, 2024.

With the aim of studying the momentum flux in wind-wave modulation situations, a 7 month field experiment was set-up in 2023 from the Belle-Ile-en-Mer island off the West coast of France. The site was selected for its exposure to dominant wind and swell, the proximity of a wave buoy, and the rapidly increasing water depth to allow a focus on deep to intermediate wave dispersion regimes. A scanning wind LiDAR [1,2] installed on the coast of the island was used to measure the vertical profile of the horizontal wind speed and direction from 1 to 3 kilometers from the coast. The configuration allowed for measurements of the wind speed and direction profiles starting at some meter above the water surface and going up to some 150m. This original approach enables to obtain quasi-instantaneous vertical planes of the wind speed as well as 30-min mean profiles simultaneously with a wave parameter.

The wide range of wind and wave combinations observed during the deployment allows statistical analysis. Significant wave heights, wave peak periods, and U10 wind speeds were observed in the range 0-6.5 m, 2-20 s, and 0.5-18 m/s, respectively. From this rich database, the near-surface momentum flux estimated by the wind profile close to the water surface appears to match well with results from COARE 3.5 algorithm. The possibility of the scanning wind LiDAR to measure mean wind profiles allows an original point of view to analyze wind-wave interactions. It was observed that for young seas, the profile can be in equilibrium, following Monin-Obukov similarity theory from close to the water surface up to some 100m. In contrast, for fast-travelling waves, significant deviations of the wind profile are observed compared to the surface fluxes. These deviations are parametrized as function of height and analyzed as function of the wave age.

[1] Paskin, L., Conan, B., Perignon, Y., & Aubrun, S. (2022). Evidence of Ocean Waves Signature in the Space–Time Turbulent Spectra of the Lower Marine Atmosphere Measured by a Scanning LiDAR. Remote Sensing, 14(13), 3007.

[2] Conan, B., & Visich, A. (2023). Measurement and analysis of high altitude wind profiles over the sea in a coastal zone using a scanning wind LiDAR–application to wind energy. Wind Energy Science Discussions, 2023, 1-23.


How to cite: Conan, B. and Bruch, W.: Analysis of wind profiles above the water surface in wind-wave interaction thanks to a scanning wind LiDAR, EGU General Assembly 2024, Vienna, Austria, 14–19 Apr 2024, EGU24-21643, https://doi.org/10.5194/egusphere-egu24-21643, 2024.

AS3 – Atmospheric Composition, Chemistry and Aerosols

EGU24-852 | ECS | Orals | AS3.1

The Cyprus Atmospheric Observatory: A unique outpost to monitor the increase of Middle East Air Pollution  

Elie Bimenyimana, Michael Pikridas, Konstantina Oikonomou, Minas Iakovides, Emily Vasiliadou, Chrysanthos Savvides, Nikos Mihalopoulos, and Jean Sciare

Cyprus is located at the south easternmost of the Mediterranean basin, a highly populated region (400 million inhabitants) threatened by exceptionally rapid urbanization and industrialization, intense dust storms, and heat extremes leading to drastic degradation of air quality, expected to exacerbate in the coming decades. Air pollution, especially particulate matter (PM), plays a crucial role in regional climate and has major adverse health effects and major economic consequences. The Cyprus Atmospheric Observatory (CAO) is a regional background station of the pan-European ACTRIS Research Infrastructure Network. It was established in 2015 with a view to fill-in the current observational gaps in this region through high quality, long term monitoring of atmospheric pollutants of climate and health relevance.

In close collaboration with the Department of Labour Inspection and in the framework of the Horizon 2020 EMME-CARE research project, CAO has built a unique and detailed PM chemical composition database for the past decade which was further processed to investigate the long-term trends using the mann-kendall non-parametric statistical test while the identification of the geographic location of the major pollution sources affecting the island was achieved through the Lagrangian particle dispersion model FLEXPART.

Based on the statistical Mann-Kendall trend analysis, an increasing trend in PM10 levels was observed at the regional background (CAO) station (+0.23 µg.m-3.y-1). It is interesting to note that the concentrations of most PM species are rising, especially mineral dust with an average increasing rate of +0.26 µg.m-3.y-1 followed by OM (+0.1 µg.m-3.y-1). The source regions analysis indicates that the Middle east sector is associated not only with the most elevated concentrations for the main PM10 components, both of natural (mineral dust) and anthropogenic origin (carbonaceous species, nitrate and nss-K+), but also with increasing trends for most of them. Especially for sulfate, it is worth mentioning that while rather stable levels were recorded for different source regions, the Middle East sector exhibited increasing trend (+0.2 µg.m-3.y-1) indicating increasing fossil fuel (oil and gas) emissions.


This project has received funding from the European Union’s Horizon 2020 EMME-CARE project (grant agreement No 856612).


How to cite: Bimenyimana, E., Pikridas, M., Oikonomou, K., Iakovides, M., Vasiliadou, E., Savvides, C., Mihalopoulos, N., and Sciare, J.: The Cyprus Atmospheric Observatory: A unique outpost to monitor the increase of Middle East Air Pollution , EGU General Assembly 2024, Vienna, Austria, 14–19 Apr 2024, EGU24-852, https://doi.org/10.5194/egusphere-egu24-852, 2024.

EGU24-861 | Orals | AS3.1

Characteristics of size-segregated particle number concentrations in an urban location in India 

Vijay Kanawade, Mathew Sebastian, Nishant Mittal, and Tuija Jokinen

Atmospheric aerosols exhibit considerable variability in size, spanning a broad range with a difference of four orders of magnitude between the smallest and largest particles. The spatiotemporal heterogeneity in natural and anthropogenic emission sources results in significant variability in aerosol properties, making it extremely hard to precisely quantify aerosol’s climatic effect. New particle formation (NPF, via gas-to-particle conversion) is the largest source of aerosol numbers to the terrestrial atmosphere, and therefore ultrafine particles (particles less than 100 nm diameter). The growth of newly formed particles or primary particles can significantly alter the total aerosol mass and composition which has implications for Earth’s radiation budget and hydrological cycle via aerosol’s direct and indirect effects, respectively. In the Indian context, NPF has been poorly studied in the absence of state-of-the-art instrumentation to characterize atmospheric NPF events. The main objective of this study is to quantitatively assess the role of NPF in the size-segregated particle number concentration in an urban location, Hyderabad. Here, we have used long-term (2019-2022) measurements of particle number size distributions from the nano Condensation Nucleus Counter (nCNC) in the size range of 1 to 3 nm and the Scanning Mobility Particle Sizer (SMPS)  in the size range from 10 nm to 514 nm. Measurements were conducted at the University of Hyderabad campus site. The observation days were broadly categorized into three event types, namely NPF, non-event and undefined based on the visual inspection of the contour plot of particle number size distributions. We additionally utilized in-situ measurements of particulate matter with a diameter smaller than 2.5 µm (PM2.5) to identify polluted days following the NAAQS criteria (days with PM2.5 > 60 µg m-3). The size-segregated particle number concentrations in the cluster mode (sub-3nm), nucleation mode (10-25 nm), Aitken mode (25-100 nm), and accumulation mode (100-514 nm) were calculated for each identified event type. The size-segregated particle number concentrations showed a distinct seasonal pattern, with the highest particle number concentrations during the spring (March - May) and the lowest during the winter months (December - February). The highest particle number concentrations in spring coincide with the highest frequency of NPF event occurrence.  Amongst them, the cluster-mode particles constituted the largest fraction of particle number concentrations and the accumulation-mode particles constituted the lowest. The cluster mode particle number concentrations were found to be the highest during NPF event days than other event types. The positive association between cluster mode particles and PM2.5 indicates that NPF is not inhibited at high pre-existing particle concentrations unlike in the USA and EUROPE. This suggests that the balance between the precursor vapour concentrations and the pre-existing particle concentrations decides when NPF will trigger in the polluted boundary layer under a given atmospheric condition. However, the negative association between nucleation mode particles and PM2.5 suggests that not all cluster mode particles grow to nucleation mode size. 

How to cite: Kanawade, V., Sebastian, M., Mittal, N., and Jokinen, T.: Characteristics of size-segregated particle number concentrations in an urban location in India, EGU General Assembly 2024, Vienna, Austria, 14–19 Apr 2024, EGU24-861, https://doi.org/10.5194/egusphere-egu24-861, 2024.

EGU24-1241 | Posters virtual | AS3.1

Phase state and chemical composition of PM2.5 in Northeast Asian cities: Insights for aerosol pollution 

Mijung Song, Changjoon Seong, Daeun Kim, Zhijun Wu, Changhyuk Kim, Kyoung-Soon Jang, Jiyi Lee, Kwangyul Lee, Joonyoung Ahn, and Amgalan Natsagdorj

The phase state and chemical composition of PM2.5 are pivotal factors that influence their pollution mechanisms. Nevertheless, there is a notable gap in our understanding of how chemical composition affects the phase state of PM2.5. To address this gap, we conducted an investigation into the influence of chemical composition on the phase state of PM2.5 in four prominent cities: Seoul, Seosan, Beijing, and Ulaanbaatar, spanning from 2020 to 2023. Our research has unveiled that the range in which PM2.5 can exist in liquid, semisolid, and solid states may exhibit variations contingent upon its chemical composition. By emphasizing the significance of aerosol chemical characteristics on the phase state, this study significantly contributes to our comprehension of how phase state and chemical composition underpin atmospheric pollution mechanisms. The results will be presented.

How to cite: Song, M., Seong, C., Kim, D., Wu, Z., Kim, C., Jang, K.-S., Lee, J., Lee, K., Ahn, J., and Natsagdorj, A.: Phase state and chemical composition of PM2.5 in Northeast Asian cities: Insights for aerosol pollution, EGU General Assembly 2024, Vienna, Austria, 14–19 Apr 2024, EGU24-1241, https://doi.org/10.5194/egusphere-egu24-1241, 2024.

The anthropogenic activities are playing an increasingly important role in regulating the atmospheric environment and local climate, therefore, it is of great significance to explore the effects of large anthropogenic heat sources on the structure of the atmospheric boundary layer (ABL), as well as their dispersion on the air pollutants. In this study, high spatio-temporal resolution observations of the ABL structure within a large coal-burning steel plant were performed in Yuncheng city (Shanxi province) in July of 2021. Results revealed that the strong anthropogenic heats disturbed the thermodynamic and material structure of the ABL, resulting in vertically homogeneous air pollutants in the daytime and high concentration pollutants stored within the nighttime residual layer (RL). Moreover, a dry heat island was formed above the coal-burning plant at night due to the horizontally spatial thermal contrast with the surrounding fields and villages. The dry heat-island was generally generated after sunset and disappeared within 1-2 hours beyond sunrise, with 3-10°C higher and 30-60% drier than the neighboring areas. Large-eddy simulations constrained by the in-situ measurements show that the heat-island circulation can diffuse the plant-discharged pollutants to penetrate through the stable boundary layer and enter into the RL, horizontally spreading below the upper boundary of the RL and eventually forming a "mushroom cloud". The formation, size, and pollutant concentration of the “mushroom cloud” are significantly influenced by the dynamic wind speed and anthropogenic heat intensity. As the increase of the solar irradiance in the next day, the pollutants retained within the RL can be downward transported to the ground, leading to the morning peaks of various pollutants at the surface level, which were statistically found to be common phenomenons not only in the areas adjacent to the plant, but also in the major urban clusters across China.

How to cite: Ma, Y.: Anthropogenic heat island motivated by coal-burning plants and its dispersion on the air pollutants, EGU General Assembly 2024, Vienna, Austria, 14–19 Apr 2024, EGU24-1559, https://doi.org/10.5194/egusphere-egu24-1559, 2024.

EGU24-1735 | ECS | Orals | AS3.1

Spontaneous formation of OH oxidation products at the interfaces of pure organic droplets 

Maria Angelaki and Christian George

There are now many evidence that OH and H2O2 can be spontaneously formed at the air – water interface of aqueous droplets due to the presence of a strong electric field (~109 V m−1). OH anion has been suggested that it partially exist as an ion pair (OH...e-), which may undergo charge separation in the presence of this electric field. This can lead to OH radical and electron production, while H2O2 can be formed via subsequent reactions. The presence of organic molecules on aqueous droplet surfaces and the OH radicals that are spontaneously generated can lead to oxidation products formation altering the composition of the particles.

In this work we studied the OH products formation of pure organic aerosols while they interact with water vapour. We investigated the product formation in the absence of OH radicals precursors, in the dark in the range of RH 0 – 100 %. Organic droplets, in a range of diameter 10 to 300 nm, were generated by nebulizing citric acid solutions. The particles passed through a diffusion dryer and entered inside a flow tube reactor. Particles were collected either on filters or by using a spot sampler. The particle phase analysis was performed via Ultra High-Performance Liquid Chromatography coupled with Electrospray Ionization Orbitrap Mass Spectrometry. Gas phase products were also monitored using a VOCUS mass spectrometer.

All the experiments provide evidence that organic droplets can be oxidized while interacting with water vapours. No products were observed under dry conditions. Oxidation products were formed in the particle phase and their production displayed a systematic increase with the increase of RH denoting the enhancement of OH radical generation. At complete humid conditions, products were also observed in the gas phase due to their desorption. H2O2 was also monitored in the gas phase confirming that interfacial OH and electron generation can lead to its formation. Results from this study are expected to significantly improve our insights on the interfacial processes that occur in atmospheric droplets and on the atmospheric multiphase oxidation chemistry.

How to cite: Angelaki, M. and George, C.: Spontaneous formation of OH oxidation products at the interfaces of pure organic droplets, EGU General Assembly 2024, Vienna, Austria, 14–19 Apr 2024, EGU24-1735, https://doi.org/10.5194/egusphere-egu24-1735, 2024.

EGU24-3877 | Orals | AS3.1

Black carbon-induced regime transition of boundary layer development stronglyamplifies severe haze 

Hang Su, Jiandong Wang, Chao Wei, Guangjie Zheng, Jiaping Wang, Tianning Su, Chengcai Li, Cheng Liu, Jonathan E. Pleim, Zhanqing Li, Aijun Ding, Meinrat O. Andreae, Ulrich Poeschl, and Yafang Cheng

Black carbon (BC) aerosol can strongly influence planetary boundary layer (PBL) development and thus severe hazeformation, but its distinct role compared with scattering aerosols are not yet fully understood. Here, combiningnumerical simulation and field observation, we found a “tipping point”, where the daily maximum PBL heightdecreases abruptly when exceeding a critical threshold of aerosol optical depth (AOD), due to a BC-induced decouplingof mixing zones. Because the threshold AOD decreases with increasing BC mass fraction, our results suggest that theabrupt transition of PBL development to adverse conditions can be avoided by reducing the AOD below the threshold,but more efficiently by reducing the BC mass fraction to increase the threshold (e.g., up to 4-6 times more effective inextreme haze events in Beijing). To achieve co-benefits for air quality and climate change, our findings clearlydemonstrate that high priority should be given to controlling BC emissions.

How to cite: Su, H., Wang, J., Wei, C., Zheng, G., Wang, J., Su, T., Li, C., Liu, C., Pleim, J. E., Li, Z., Ding, A., Andreae, M. O., Poeschl, U., and Cheng, Y.: Black carbon-induced regime transition of boundary layer development stronglyamplifies severe haze, EGU General Assembly 2024, Vienna, Austria, 14–19 Apr 2024, EGU24-3877, https://doi.org/10.5194/egusphere-egu24-3877, 2024.

A long-term study (2019-2021) to understand the chemical characteristics of atmospheric aerosols (PM10), collected fortnightly on quartz fibre filters in an urban/industrial location of Hyderabad, India was carried out by measuring the trace, rare earth and heavy elements, water-soluble inorganic ions and carbon isotopes. High K+nss/OC was observed during post-monsoon and winter, suggesting contribution from local and biomass/crop residue burning from surrounding regions. Cr, Mo, Cs, Ce and Pb were observed to be 22%, 88%, 92%, 20% and 18% higher than WHO's daily and annual limit. The role of transition elements, mainly Fe and Mn, in catalysing HO2- or O2- and converting them to H2O2 and H2O, respectively was explored, where Cu/Fe (annual average: 0.02 ± 0.01) and Cu/Mn (0.24 ± 0.15) ratios suggested the dominance of H2O regime compared to H2O2 regime. The enrichment factor (EF) of trace and heavy metals were mostly in the range of 10 < EF < 100 (Fe ref ) and 1 < EF < 10 (Ti ref). Enrichment of Ba and Se during post-monsoon, Sb and Cr during post-monsoon 2019 and winter 2020 and Co during summer were observed. The stable carbon isotopes of TC (δ13CTC) and EC (δ13CEC) varied from - 28.1 to - 24.7 ‰ (avg. - 26.5 ± 0.7) and - 32.5 to - 24.6 ‰ (avg. - 27.4 ± 1.1), indicating contribution from C3 plant burning and liquid fuel combustion (vehicular exhausts). Positive value of δ13COC - δ13CEC and heavier δ13CTC, along with gradual enrichment in δ13CTC and δ13CEC from December 2020 to March 2021, implied the photochemical aging of CA. Lighter δ13CTOC and OC/EC > 4 for all seasons suggest the dominance of biomass burning (wood and crop residue burning), photochemical oxidation and SOA formation.

Further, the inhalation risk on human health during exposure to harmful metals was investigated for entire sampling duration, and the dominance of sources for carcinogenic Cd at the sampling location were inferred compared to electronic-plastic waste-burning sources (eg Sn). La, Ce, V, Mo, Cs and Rb were observed to be from continental crust sources, considering their common sources. Carcinogenic inhalation risk for Cr(VI) was only observed during post-monsoon 2019, and non-carcinogenic inhalation risk (hazard index >1) was observed throughout the sampling duration for all considered metals was observed.

How to cite: Attri, P. and Mani, D.: Source, enrichment and risk assessment of atmospheric aerosols (PM10) at urban/industrial city, Hyderabad, India, EGU General Assembly 2024, Vienna, Austria, 14–19 Apr 2024, EGU24-4544, https://doi.org/10.5194/egusphere-egu24-4544, 2024.

EGU24-4654 | ECS | Orals | AS3.1

Atmospheric organic matter forms core-shell aerosol particles on mineral surfaces  

Martin King, Megan McGrory, and Andrew Ward

Core-shell particles have been created in an optical trap by placing thin films (∼ 10−40 nm) of atmospheric matter collected and extracted from urban aerosol and wood-burning smoke samples onto mineral silica particles (diameter ∼2 μm). The structures formed by these samples were a symmetrical core-shell and not an engulfing structure or asymmetric structure. Mie scattering of light from the optically trapped particles demonstrated that the experimental and calculated Mie spectra were consistent with the scattering of light by core-shell aerosol, and not with the scattering of homogeneous or partially-engulfed aerosol. The work presented may be the first experimental demonstration of organic materials extracted from the atmosphere favouring a symmetrical core-shell morphology on solid particles. Furthermore oxidation of these core-shell particles with ozone demonstrated a thinning shell of organic film and no change in morphology . Figure 1 demonstrates our initial results with an increasing thicker core-shell film of woodsmoke extract on a silica core particle and Figure 2 demonstrates the ability to follow refractive index and film thickness during oxidation of this thin film. The Mie scattering allows calculation of the refractive indices as a function of wavelength and film thicknesses. The refractive index of ∼40nm thick shells were determined to a precision of ∼0.01 and ∼0.006, and the thickness of the shell was determined to a precision of 0.2nm and 0.1nm for the aged urban and wood-smoke samples respectively.  The core-shell morphology, significantly reduces the complexity of atmospheric modelling of the radiative properties of these aerosol.


How to cite: King, M., McGrory, M., and Ward, A.: Atmospheric organic matter forms core-shell aerosol particles on mineral surfaces , EGU General Assembly 2024, Vienna, Austria, 14–19 Apr 2024, EGU24-4654, https://doi.org/10.5194/egusphere-egu24-4654, 2024.

EGU24-4696 | ECS | Orals | AS3.1 | Highlight

Household Chemicals Amplifying Urban Pollution 

Georgios Gkatzelis and the AEROMMA Team

Urban aerosol particles are one of the largest human health hazards globally. A significant fraction of urban aerosol is secondary, .i.e., formed via atmospheric chemical reactions of emitted trace gases, with secondary organic aerosol (SOA) driving health impacts in urban air. Decades of air quality regulations have substantially reduced the motor vehicle emissions of organic compounds that act as precursors to SOA and ozone pollution. In this presentation we show that volatile chemical products from household chemicals are becoming one of the largest sources of organic vapors in US and European cities. We highlight the potential of such emission sources to form ozone and SOA using data collected during mobile measurements conducted in 2018 and aircraft measurements conducted in the summer of 2023 on NASA's DC-8 aircraft as part of the AEROMMA mission. Moreover, we will emphasize upcoming measurements in Germany utilizing a Zeppelin as an aerial platform, which will allow us to probe the urban “breath” of European cities and quantify the chemical evolution and SOA production from volatile chemical products downwind of urban centers. These measurements will be complemented by controlled atmospheric simulation chamber experiments to oxidize urban emissions and retrieve their SOA yields as a parametrization to be used by chemical transport models.

How to cite: Gkatzelis, G. and the AEROMMA Team: Household Chemicals Amplifying Urban Pollution, EGU General Assembly 2024, Vienna, Austria, 14–19 Apr 2024, EGU24-4696, https://doi.org/10.5194/egusphere-egu24-4696, 2024.

EGU24-5233 | Orals | AS3.1

Exploring seasonal variations in δ13C of dicarboxylic acids in fine aerosols: Insights from a Central European background site 

Petr Vodička, Kimitaka Kawamura, Jaroslav Schwarz, and Vladimír Ždímal

In this study, we present the measurement results of stable carbon isotope ratio (δ13C) performed on a one-year aerosol samples (n = 96, 24h time resolution during Sep. 2013 - Aug. 2014) for dicarboxylic acids (hereafter “diacids”) and related compounds in PM1 at a rural background site National Atmospheric Observatory Košetice (NAOK), Czech Republic, Central Europe. In previous study on the molecular distributions of diacids (Vodička et al., 2023a), we observed a distinct seasonal variation in the composition of diacids in PM1. In winter, approximately 75% of the organic aerosols originated from anthropogenic sources, whereas in summer, over 75% were attributed to biogenic sources. The objective of this study was to investigate whether these differences are reflected in δ13C of diacids.

In general, we observed higher δ13C values for lower carbon molecules (Vodička et al., 2023b). A comparison of δ13C values of major diacids (oxalic (C2), succinic (C4), malonic (C3), azelaic (C9)) with those from other background sites, especially in Asia, shows similar values to those from the European site. This comparison also demonstrated that C2 is more enriched with 13C at background sites than at urban ones. In general, we did not observe significant seasonal differences in δ13C values of diacids at NAOK. We observed statistically significant differences (p value < 0.05) between winter and summer δ13C values solely for C4, glyoxylic (ωC2), glutaric (C5) and suberic (C8) acids.

The only significant correlations between δ13C of C2 and δ13C of C3 were found in spring and summer, suggesting that the oxidation of C3 to C2 is significant in these months with a strong contribution from biogenic aerosols. The strongest season-independent annual correlation was observed between C2 and C4, the two dominant dicarboxylic acids. Therefore, C4 appears to be the main intermediate precursor of C2 throughout the whole year.

Acknowledgement:

This conference contribution was supported by the Ministry of Education, Youth and Sports of the Czech Republic under the project ACTRIS-CZ-LM2023030, by the Czech Science Foundation grant No. 20–08304J and by the Japan Society for the Promotion of Science (JSPS) through Grant-in-Aid No. 24221001. We appreciate the financial support of JSPS fellowship to P. Vodička (P16760) in Japan.

References:

Vodička, P., Kawamura, K., Deshmukh, D.K., Pokorná, P., Schwarz, J., Ždímal, V., 2023a. Anthropogenic and biogenic tracers in fine aerosol based on seasonal distributions of dicarboxylic acids, sugars and related compounds at a rural background site in Central Europe. Atmos. Environ. 299, 119619. doi:10.1016/j.atmosenv.2023.119619

Vodička, P., Kawamura, K., Schwarz, J., Ždímal, V., 2023b. A year-round observation of δ13C of dicarboxylic acids and related compounds in fine aerosols: Implications from Central European background site. Chemosphere 337. doi:10.1016/j.chemosphere.2023.139393

How to cite: Vodička, P., Kawamura, K., Schwarz, J., and Ždímal, V.: Exploring seasonal variations in δ13C of dicarboxylic acids in fine aerosols: Insights from a Central European background site, EGU General Assembly 2024, Vienna, Austria, 14–19 Apr 2024, EGU24-5233, https://doi.org/10.5194/egusphere-egu24-5233, 2024.

EGU24-5978 | ECS | Orals | AS3.1

Global Modeling of Organic-related New Particle Formation and its Contribution to Global Aerosol Number Concentrations using CAM6-Chem 

Xinyue Shao, Minghuai Wang, Ken Carslaw, Xinyi Dong, and Yaman Liu

New particle formation involving organic compounds has been identified as an important process affecting aerosol particle number concentrations in the global atmosphere. Here a global chemistry-climate model has been developed to include explicit chemical reactions of highly oxygenated molecules (HOMs) and accretion products based on monoterpene-derived peroxy radical (RO2) unimolecular autoxidation and self- and cross-reactions with other RO2 species. The improved model incorporates a comprehensive biogenic organic nucleation scheme including heteromolecular nucleation of sulfuric acid and organics, neutral pure organic nucleation, and ion-induced pure organic nucleation. These organic-related mechanisms are combined with an inorganic nucleation scheme derived from published chamber experimental data from the CLOUD project. Additionally, the organic condensational growth rate for newly formed particles (sub-20nm) is taken into account. The updated model captures the occurrence frequency of new particle formation events (normalized mean bias, NMB changes from -96% to -15%) and shows reasonable agreement with measured rates of nucleation (NMB changes from -97% to -64%) and growth (NMB changes from -54% to 39%) globally except in China (NMB of nucleation rate > -100%). The model successfully reproduces surface-level aerosol number concentrations over oceans and vertical profiles over the Amazon Basin. Globally, we find that organics contribute to 45% of the annual average vertically integrated nucleation rate and 25% of the vertical mean growth rate. The inclusion of organic-related processes leads to a 39% increase in the global annual mean aerosol concentration and a 33% increase in cloud condensation nuclei at 0.5% supersaturation compared to a simulation with only inorganic nucleation. Our work also indicates that organic initial growth is more important for particle number than organic nucleation on global average.

How to cite: Shao, X., Wang, M., Carslaw, K., Dong, X., and Liu, Y.: Global Modeling of Organic-related New Particle Formation and its Contribution to Global Aerosol Number Concentrations using CAM6-Chem, EGU General Assembly 2024, Vienna, Austria, 14–19 Apr 2024, EGU24-5978, https://doi.org/10.5194/egusphere-egu24-5978, 2024.

EGU24-6316 | ECS | Posters on site | AS3.1

Evaluation of analytical techniques for organic peroxide measurements in polar and non-polar systems. 

Daniel Alba-Elena, Xinke Wang, Jonathan Abbatt, Edelmira Valero, and Maria Teresa Baeza-Romero

Peroxides and hydroperoxides are generated during the oxidation of volatile organic compounds (VOCs) in both gaseous and aqueous phases. The ozonolysis of alkenes in the gas phase is a significant source of peroxy radicals (RO2) in both nocturnal and diurnal chemistry. In the absence of NO, the recombination reactions of RO2 radicals lead to the formation of H2O2 and/or organic hydroperoxides (Atkinson, 2000). Hydroperoxides are highly reactive and play a crucial role in atmospheric chemistry, such as the oxidation of SO2 to H2SO4 in atmospheric aqueous droplets and heterogeneous SO2 uptake (Wang, 2021). Moreover, peroxides are suggested to constitute a significant fraction of laboratory-generated secondary organic aerosol (SOA) (Docherty 2005) and can serve as reservoirs of HOx and ROx radicals (Li, 2016).

Various spectrophotometric methods have been employed to quantify SOA-bound peroxides offline. The Iodometry method quantifies peroxides present in any form (H2O2, ROOH, and ROOR) except for tertiary dialkyl peroxides. The principle of the method is A faster and more sensitive alternative to this method was developed by our group, which accelerates the reaction by microwave heating (Alba-Elena, 2023). These assays typically use water as a solvent. Here, for the first time, an alternative procedure using 1-propanol as an organic solvent is proposed and tested for H2O2 and various less reactive peroxides.

Other spectrophotometric methods include: the 4-nitrophenyl boronic acid (NPBA) assay, which is based on the reaction between the hydroperoxide and NPBA to form the colored nitrophenol, the absorbance of which is measured (Jiang, 2017), and the Fenton reaction-assisted ferrous-xylenol (FOX2) assay, which is based on the oxidation of Fe2+ by the organic hydroperoxide to form Fe3+, which forms a complex with Xylenol orange that can be detected spectrometrically (Morrison, 2023).

All these assays, as well as the 2,7-dichlorofluorescein-based horseradish peroxidase (DCF-HRP) assay, a widely used fluorescence method that is more sensitive to H2O2 compared to other organic peroxides and hydroperoxides (Badali, 2015), have been tested using water and polar organic solvents such as 1-propanol and non-polar organic solvents such as chloroform. Their response to different types of peroxide: H2O2, tertbutyl hydroperoxide, ditertbutyl peroxide, methyl ethyl ketone peroxide, and dibenzoyl peroxide, has been evaluated. A comparative study of the results, their different characteristics, and their possible interferences has been conducted.


ACKNOWLEDGEMENT

This research was supported by the Spanish Ministry of Science, Innovation and Universities (MICINN, https://www.ciencia.gob.es/) with grants PID2019-106468RB-I00 and PID2022-139724OB-I00, funded by MCIN/AEI/10.13039/501100011033 and co-funded by the European Union; the UCLM groups research grant No. 2022-GRIN-34199, funded by the own research plan of the UCLM for applied research projects, co-financed by the European Fund for Regional Development (FEDER). D. Alba thanks MCIN/AEI for his “Contrato Predoctoral” Ref BES-2020-094874 associated to the project indicated.

How to cite: Alba-Elena, D., Wang, X., Abbatt, J., Valero, E., and Baeza-Romero, M. T.: Evaluation of analytical techniques for organic peroxide measurements in polar and non-polar systems., EGU General Assembly 2024, Vienna, Austria, 14–19 Apr 2024, EGU24-6316, https://doi.org/10.5194/egusphere-egu24-6316, 2024.

EGU24-6995 | Orals | AS3.1

Microphysical complexity of black carbon particles restricts their warming potential 

Jianfei Peng, Xiao-Feng Huang, Yan Peng, Jing Wei, Xiao-Yu Lin, Meng-Xue Tang, Yong Cheng, Zhengyu Men, Tiange Fang, Jinsheng Zhang, Ling-Yan He, Chao Liu, Li-Ming Cao, Hongjun Mao, John H. Seinfeld, and Yuan Wang

Black carbon (BC) strongly absorbs solar radiation, but its warming effect on climate is poorly quantified. A key challenge is to accurately assess BC light absorption after BC is mixed with non-BC components. However, there has consistently been a large observation-modeling gap in BC light absorption estimation, reflecting the insufficient understanding of realistic BC complexity. Here, we conduct comprehensive in situ measurements of BC single-particle microphysics, e.g., size, coating amounts, density, and shape, along with optical closure calculation. Specifically, the observed particle-to-particle heterogeneities in size and coating and the non-spherical BC shape only explain the lower observed BC absorption by ∼20% and ∼30%, respectively. A remaining gap for fully aged spherical BC-containing particles is related to the off-center BC-core position. The global climate model assessment shows that fully accounting for the observed BC complexity in the aerosol microphysical representation reduces the global BC direct radiative forcing by up to 23%.

How to cite: Peng, J., Huang, X.-F., Peng, Y., Wei, J., Lin, X.-Y., Tang, M.-X., Cheng, Y., Men, Z., Fang, T., Zhang, J., He, L.-Y., Liu, C., Cao, L.-M., Mao, H., Seinfeld, J. H., and Wang, Y.: Microphysical complexity of black carbon particles restricts their warming potential, EGU General Assembly 2024, Vienna, Austria, 14–19 Apr 2024, EGU24-6995, https://doi.org/10.5194/egusphere-egu24-6995, 2024.

EGU24-8745 | ECS | Posters on site | AS3.1

Excited triplet states from aerosol extracts competing with OH radical and singlet oxygen 

Emma Amalie Petersen-Sonn, Marcello Brigante, Laurent Deguillaume, Jean-Luc Jaffrezo, Sébastien Perrier, and Christian George

Recently, excited triplet states of organic molecules (3C*) have been investigated for their abilities as oxidants in the aqueous aerosol phase. Here, we aim to understand if triplet states could have an influence on aqueous chemistry that is comparable to or even larger than two of the main oxidants in this environment, singlet oxygen (1O2) and hydroxyl radicals (•OH).

Aerosols were collected in Grenoble, France both in winter and summer time during the period 02/12/2021 – 17/06/2022, and analyzed for their ability to produce 3C*, 1O2, and •OH. The optical properties of the aerosol samples show that compared to the summer samples, the winter samples have higher absorbance in the UV/Vis and likewise higher fluorescence intensity in the two major peaks in the excitation emission matrix (EEM), with λex/em = 225/415 nm and 320/425 nm. There was a good correlation between the mass absorption efficiency at 365 nm (MAE365), which is a common parameter for light absorption from BrC extracts, and the fluorescence intensity of the two peaks.

From the degradation of various chemical probes and analysis by liquid chromatography (LC) with UV or fluorescence detection, we estimated the steady-state concentration of these three oxidants in aerosols at sample concentrations of 10 mgC L-1. The resulting concentrations of all oxidants were found to be larger in the winter samples than in summer samples. [3C*]ss showed an average of (1.87 ± 0.53) ∙ 10-13 M in winter samples, and (9.95 ± 2.9) ∙ 10-14 M in summer samples. [1O2]ss was found to have an average of (6.51 ± 0.32) ∙ 10-13 M in winter samples and (4.40 ± 0.28) ∙ 10-13 M in summer samples. For •OH the steady-state concentrations were (2.01 ± 0.52) ∙ 10-16 M in winter samples and (1.07 ± 0.30) ∙ 10-16 M in summer samples. These values give a trend of oxidant concentrations of [1O2]ss > [3C*]ss > [•OH]ss. Through a literature search for values of second-order rate constants between the mentioned oxidants with organic species in aqueous media, we observed a trend of kOH,ORG > k3C*,ORG > k1O2,ORG. When considering both steady-state concentrations and second-order rate constants, the triplet states appear to be highly important in aqueous media. By further experiments, the concentration of a single aerosol extract sample was varied (2.5 – 20 mgC L-1), and we observed a plateau of 3C* concentrations at approximately 2∙10-13 M at 7.5 mgC L-1 (corresponding to 3 ∙ 10-5 µg PM / µg H2O). From these observations, we suggest that in a range of similar particulate matter to water ratios (µg PM / µg H2O ≈ (0.3 – 1) ∙ 10-4), this could serve as an estimate of steady-state triplet state concentrations in aerosols.

Overall, this study emphasizes the relevance of excited triplet states compared to singlet oxygen and OH radicals in aqueous aerosols by including both estimated steady-state concentrations and literature second-order rate constants in aqueous solution for the oxidants with organic species.

How to cite: Petersen-Sonn, E. A., Brigante, M., Deguillaume, L., Jaffrezo, J.-L., Perrier, S., and George, C.: Excited triplet states from aerosol extracts competing with OH radical and singlet oxygen, EGU General Assembly 2024, Vienna, Austria, 14–19 Apr 2024, EGU24-8745, https://doi.org/10.5194/egusphere-egu24-8745, 2024.

EGU24-8987 | ECS | Orals | AS3.1

Non-conventional oxidation of SO2 by iodine oxides: A source of nighttime sulfuric acid in the marine boundary layer 

Avinash Kumar, Siddharth Iyer, Shawon Barua, Prasenjit Seal, and Matti Rissanen

The formation of sulfuric acid (H2SO4, SA), a key aerosol precursor in the atmosphere, hinges on the rate-limiting oxidation of SO2. During the daytime, hydroxyl radical (OH) is the main SO2 oxidant, but the measured ambient SA concentration suggests the existence of other unaccounted pathways via other oxidants (Berresheim et al., 2014). The nocturnal presence of SA in marine environments is particularly interesting as the formation mechanism is not straightforward due to the lack of photochemical reactions. In marine environments, molecular iodine and iodocarbons are prevalent, and their reactions with the nitrate radical (NO3) are known sources of nighttime IO and OIO radicals (Saiz-Lopez and Plane, 2004). OIO has low daytime concentrations due to its large photolysis cross-section but can accumulate during nighttime. In the absence of a photolysis sink, OIO predominantly undergoes self-reaction, leading to the generation of the iodine oxide I2O4 at nighttime. The reported lifetime of I2O4 against the thermal decomposition back to OIO + OIO is about 30 seconds, which means that it is relatively short-lived, but can survive long enough for reactions with other atmospheric trace gases to become relevant (Kaltsoyannis and Plane, 2008).

In this study, laboratory experiments for the reaction of iodine oxides with SO2 were carried out using a flow reactor coupled with a nitrate-based chemical ionization mass spectrometer (NO3--CIMS). The iodine oxides were generated in situ by the reaction of iodine vapors and ozone in the presence of nitrate radical, mimicking the nighttime oxidation of SO2 to form SO3 and consequently SA. The experiments were carried out at room temperature and atmospheric pressure conditions. The experiments were complemented by high-level quantum chemical calculations to get detailed insights into the mechanism and feasibility of the oxidation of SO2 by iodine oxides to produce SA. Among all the formed iodine oxides, I2O4 reacts sufficiently fast with SO2 with a rate coefficient of 2.0×10⁻¹⁴ molecule-1 cm3 s-1 and can thus lead to appreciable concentrations of SO3. These results suggest that I2O4 can be a key SO2 oxidant in the marine environment and explain a significant fraction of the produced SA in the nighttime.  

References:

Berresheim, H., Adam, M., Monahan, C., O'dowd, C., Plane, J. M., Bohn, B. and Rohrer, F.  Atmos. Chem. Phys. 14, 12209-12223, 2014.

Saiz–Lopez, A. and Plane, J. M. Geophys. Res. Lett. 31, 2004.

Kaltsoyannis, N. and Plane, J.M. Phys. Chem. Chem. Phys., 10, 1723-1733, 2008.


How to cite: Kumar, A., Iyer, S., Barua, S., Seal, P., and Rissanen, M.: Non-conventional oxidation of SO2 by iodine oxides: A source of nighttime sulfuric acid in the marine boundary layer, EGU General Assembly 2024, Vienna, Austria, 14–19 Apr 2024, EGU24-8987, https://doi.org/10.5194/egusphere-egu24-8987, 2024.

EGU24-10263 | ECS | Orals | AS3.1

Elucidating the role of brown carbon in HONO and NOx production from renoxification of nitrate-containing aerosol 

Fengxia Bao, David Bell, Arianna Tronconi, Lucia Iezzi, Yanfang Chen, Ka Yuen Cheung, Kaspar Rudolf Dällenbach, and Markus Ammann

Oxides of nitrogen (NOx = NO + NO2) and nitrous acid (HONO) play crucial roles in forming tropospheric ozone (O3), hydroxyl radicals (·OH), and secondary aerosols. The photochemical reactions of nitrate aerosol are of significant atmospheric interest as they produce HONO and NOx, a process termed renoxification. Light-absorbing organic species, particularly chromophoric Brown Carbon (BrC) predominantly derived from biomass burning, are suggested to be key players in renoxification, though the mechanism remains controversial. Here, we investigate BrC-associated renoxification upon irradiation of films containing BrC extracts from authentic biomass-burning aerosols and BrC model compounds using the coated wall flow tube (CWFT) technique. We mimic real-world aerosol conditions by adjusting the pH, nitrate concentration, and relative humidity of the CWFT films, ensuring atmospheric relevance. We show that the renoxification rate is enhanced in the presence of BrC. This is likely due to the photosensitizing effect of BrC, which enhances the reduction of nitrate, rather than the previously proposed surface-enhanced direct photolysis of adsorbed nitrate. Given the efficient use of the solar spectrum from UV to visible light by this photosensitized mechanism and the widespread coexistence of nitrates and BrC in various environmental systems, we suggest BrC-photosensitized renoxification could be a substantial source of HONO and NOx. This process may significantly influence the trends and distributions of tropospheric O3, ·OH and secondary aerosols, marking an important, yet largely unexplored, area in atmospheric chemistry.

How to cite: Bao, F., Bell, D., Tronconi, A., Iezzi, L., Chen, Y., Cheung, K. Y., Dällenbach, K. R., and Ammann, M.: Elucidating the role of brown carbon in HONO and NOx production from renoxification of nitrate-containing aerosol, EGU General Assembly 2024, Vienna, Austria, 14–19 Apr 2024, EGU24-10263, https://doi.org/10.5194/egusphere-egu24-10263, 2024.

EGU24-10375 | ECS | Posters on site | AS3.1

CIAO - CNR-IMAA Atmospheric Observatory: first intensive aerosol remote sensing and in-situ integration campaign 

Teresa Laurita, Francesco Cardellicchio, Emilio Lapenna, Serena Trippetta, Davide Amodio, Aldo Amodeo, Aldo Giunta, Nikolaos Papagiannopoulos, Nicola Gianluca Di Fiore, Marco Rosoldi, Giuseppe D'Amico, and Lucia Mona

Human health, air quality, atmospheric visibility, and climate are affected by aerosol particles. In order to understand these effects, the study of their physical and chemical characteristics are highly needed.Ground based in-situ and remote sensing measurement platforms are crucial tools for continuous monitoring and evaluation of air quality.

At the Istituto di Metodologie per l’Analisi Ambientale of the Italian National Research Council (CNR-IMAA) the advanced atmospheric observatory, named CIAO, has recently been upgraded with the aerosol in-situ observational component, thus complementing the high-quality long-term remote sensing observations of aerosol gained over more than two decades of research activity.

CIAO is located in Tito Scalo, Potenza, Southern Italy (40.60° N, 15.72° E, 760 m asl) in a plain surrounded by low mountains, less than 150 km from the West, South and East coasts. It operates in a typical mountain weather strongly influenced by Mediterranean atmospheric circulation, resulting in generally dry, hot summers and cold winters. Due to its features, the site is particularly interesting for studying aerosol properties, especially those of natural origin such as desert dust, volcanic aerosol and biomass burning.

The new aerosol in-situ facility at CIAO observatory, founded by an Italian project (PER-ACTRIS-IT), has been proposed as ACTRIS (Aerosol Clouds and Trace Gases Research InfraStructure) National Facility observational platform and allows the measurements of various aerosol in-situ physical and chemical variables: Particle number concentration > 10 nm; Particle number size distribution – mobility diameter 10 to 800 nm; Particle light scattering & backscattering coefficient; Particle light absorption coefficient and equivalent black carbon concentration and particle chemical - elemental composition.

Following this recent update, the first intensive aerosol remote sensing and in-situ integration campaign at CIAO has been planned for March 2024.

First results will be presented and discussed during the conference, focusing attention on the importance of in-situ aerosol measurements as they represent the only way to evaluate the chemical-physical characteristics of the aerosol at ground level and provide a better view of the aerosol sources observed particles and also how in-situ measurements together with aerosol profiling enable better understanding of the vertical transport processes of particles to the surface.


Acknowledgements:

MIUR (Italian Ministry of University) PON Ricerca e Innovazione 2014-2020 – PER-ACTRIS-IT – “Potenziamento della componente italiana dell'Infrastruttura di Ricerca Aerosol, Clouds and Trace Gases Research”

CIR01_00015 - PER-ACTRIS-IT “Potenziamento della componente italiana della Infrastruttura di Ricerca Aerosol, Clouds and Trace Gases Research Infrastructure - Rafforzamento del capitale umano” - Avviso MUR D.D. n. 2595 del 24.12.2019 Piano Stralcio “Ricerca e Innovazione 2015-2017”

IR0000032 – ITINERIS, Italian Integrated Environmental Research Infrastructures System (D.D. n. 130/2022 - CUP B53C22002150006) Funded by EU - Next Generation EU PNRR- Mission 4 “Education and Research” - Component 2: “From research to business” - Investment 3.1: “Fund for the realisation of an integrated system of research and innovation infrastructures” 

How to cite: Laurita, T., Cardellicchio, F., Lapenna, E., Trippetta, S., Amodio, D., Amodeo, A., Giunta, A., Papagiannopoulos, N., Di Fiore, N. G., Rosoldi, M., D'Amico, G., and Mona, L.: CIAO - CNR-IMAA Atmospheric Observatory: first intensive aerosol remote sensing and in-situ integration campaign, EGU General Assembly 2024, Vienna, Austria, 14–19 Apr 2024, EGU24-10375, https://doi.org/10.5194/egusphere-egu24-10375, 2024.

EGU24-10499 | ECS | Posters on site | AS3.1

Investigating radical processes at the surface of secondary organic aerosols   

Abigail McConnell, Daniel Stone, and Dwayne Heard

Secondary Organic Aerosols (SOAs) have been estimated to be the highest proportion by mass of atmospheric aerosols averaged globally and a significant fraction of particulate matter below 2.5 μm (PM2.5). Previous studies have established its formation pathways, but fewer studies have focused on the processing of SOAs and how SOAs interact with trace gas species in the atmosphere. Concentrations of HO2, a critical radical in many atmospheric processes, are often overestimated in atmospheric models. These discrepancies have sometimes been attributed to the heterogeneous uptake onto atmospheric aerosols. There is a significant lack of data with respect to the uptake of HO2 onto secondary organic aerosols. The principal objective of this project is to explore the heterogeneous reactions of HO2 occurring on the surface of atmospherically relevant secondary organic aerosols.

Atmospherically relevant SOAs have been produced in a Potential Aerosol Mass Chamber (PAM) from the oxidation with OH and ozone of volatile organic compounds, α-pinene, d-limonene and 1,3,5 – trimethyl benzene. A scanning mobility particle sizer (SMPS) characterised the aerosol's physical properties. Results from these chamber studies show that the size distribution of the SOA can be altered by changing the initial mixing ratio of the VOC or oxidant. A flow tube coupled to a Fluorescence Assay Gas Expansion (FAGE) detection cell, which utilises laser-induced fluorescence (LIF) spectroscopy, is used to measure radical species in the gas phase.

HO2 uptake is observed by an increased loss of HO2 with increasing aerosol surface area. There is competition between the uptake of HO2 onto SOAs and the production of HO2 from SOAs. Thus, both processes must be well understood to obtain an HO2 uptake coefficient for SOAs and are investigated in this presentation.

How to cite: McConnell, A., Stone, D., and Heard, D.: Investigating radical processes at the surface of secondary organic aerosols  , EGU General Assembly 2024, Vienna, Austria, 14–19 Apr 2024, EGU24-10499, https://doi.org/10.5194/egusphere-egu24-10499, 2024.

EGU24-10543 | ECS | Posters virtual | AS3.1

Evaluation of MERRA-2 reanalysis for Sulfur dioxide aerosol in China 

Abdallah Shaheen, Robabeh Yousefi, Fang Wang, Quansheng Ge, and Renguang Wu

Considering the uncertainty of the reanalysis data is essential, the uncertainty of Modern-Era Retrospective Analysis for Research and Applications, version 2 (MERRA-2) SO2 concentration still is lacking. In this talk, we evaluated the MERRA-2 SO2 concentrations in China. Monthly SO2 concentrations from 100 ground observation during the years 2015-2021 were used to evaluate the monthly MERRA-2 SO2 data. Our results showed that the MERRA-2 SO2 concentrations exhibit a moderate Pearson correlation coefficient (R) with ground-based SO2 measurements (R = 0.62). In terms of root-mean square error (RMSE) and mean absolute error (MAE), biases (≤ 10 μg m-3) were found mainly for extensive regions (about 70%) of the Chinese sites. According to the results, the relative mean bias (RMB) and fractional gross error (FGE) showed values greater than 1 and 0, respectively, in the eastern China, which indicates that MERRA-2 overestimates the SO2 measurements in the urban regions, while underestimation of MERRA-2 SO2 was found in rural regions of China. A parameterized method could be suggested to improve the quality of MERRA-2 SO2

How to cite: Shaheen, A., Yousefi, R., Wang, F., Ge, Q., and Wu, R.: Evaluation of MERRA-2 reanalysis for Sulfur dioxide aerosol in China, EGU General Assembly 2024, Vienna, Austria, 14–19 Apr 2024, EGU24-10543, https://doi.org/10.5194/egusphere-egu24-10543, 2024.

EGU24-10689 | ECS | Orals | AS3.1

Aerosols complex refractive indices determination from far infrared to UV: application to dust and residual ashes of biomass burning 

Maria Chehab, Hervé Herbin, Sylvie Gosselin, Valentine Bizet, and Denis Petitprez

Due to their ability to absorb and scatter solar radiation, major injections of aerosols can have a significant effect on the atmosphere including impacts on the radiation balance of the Earth and changes in temperature. Given the variability and spatial heterogeneity of their concentration, size and chemical composition, it is important to quantify these aerosols, from remote sensing techniques, in order to better identify their sources and understand their environmental impact from regional to global scale. Satellite instruments, such as the Infrared Atmospheric Sounding Interferometer (IASI) and the Atmospheric Infrared Sounder AIRS for the thermal IR region and FORUM for the far infrared, can give us information about chemical composition (Alalam et al. 2022) and microphysical parameters of the aerosols such as the effective radius, concentration and mass (Deguine et al. 2023). Nonetheless, these techniques require accurate information about the optical properties, specifically the complex refractive index (CRI)   .CRI databases available in the literature however, span over limited wavelength ranges and provide mainly reflectance measurements on bulk materials or pressed pellets. In particular, the latter can have several limitations such as the modification of the microphysical properties of the particles (size distribution and morphology). Furthermore, in pellet samples, the particles are present in a compressed matrix causing modifications of the vibrational modes. For bulk measurements, there is strong underestimation of the scattering signal.  Therefore, the optical constants coming from such techniques are not fitted for aerosols and atmospheric applications (McPheat et al. 2002).

We present an improved retrieval methodology combining an experimental setup that allows simultaneously the measurement of high spectral-resolution extinction spectra (up to 0.5 cm-1) from far infrared (FIR) (50 µm /200 cm-1) up to UV (0.25 µm /40,000 cm-1) and the recording of the size distribution of both fine and coarse particles (Hubert et al. 2017). Introducing these experimental measurements in a numerical iterative process, the real and imaginary parts of the CRI are retrieved using an optimal estimation method (OEM) associated to scattering theories and the single subtractive Kramers-Kronig (SSKK) relation (Herbin et al. 2017).

Kaolinite, one of the main clays found in dust, has been used as a first application of this methodology. For the first time, homogenous values of CRI have been retrieved continuously from FIR to UV for suspended particles. This methodology is also being used to retrieved CRI of biomass burning aerosols (BBA). Preliminary result obtained from residual ashes will be present, showing IR extinction spectra as well as chemical analysis.

How to cite: Chehab, M., Herbin, H., Gosselin, S., Bizet, V., and Petitprez, D.: Aerosols complex refractive indices determination from far infrared to UV: application to dust and residual ashes of biomass burning, EGU General Assembly 2024, Vienna, Austria, 14–19 Apr 2024, EGU24-10689, https://doi.org/10.5194/egusphere-egu24-10689, 2024.

EGU24-10818 | ECS | Posters on site | AS3.1

Added value of AOD assimilation in synergy between MODIS and CALIOP instruments in MOCAGE. 

Abdennacer Ayouzi, Laaziz El Amraoui, and Olivier Pannekoucke

The aim of this study is to evaluate the added value of the assimilation of MODIS and CALIOP in synergy. The observations issued from both instruments will be assimilated in the CTM MOCAGE model in terms of Aerosol Optical Depth (AOD) for MODIS and backscatter, or extinction coefficient for CALIOP.  The objective is to improve the spatial representation of AOD by carrying out a comparison between the analyses and AERONET observations in terms of AOD. The assimilation model will  run with a global configuration of 1° x 1° (longitude x latitude) in a pre-operational context. The analyses concerning the synergy assimilation will be compared first the separate assimilations of the two instruments in order to assess the assimilation scores. 

The methodology will consist of debiasing both observations before the assimilation exercise. We will give more details about the application of this technique. The debiasing coefficient will be  applied to one kind of observation in order to make the two datasets consistent. Finally, we will evaluate the capability of the synergistic assimilation to better represent the tri-dimensional distribution of aerosol within the model compared to the individual assimilations.

How to cite: Ayouzi, A., El Amraoui, L., and Pannekoucke, O.: Added value of AOD assimilation in synergy between MODIS and CALIOP instruments in MOCAGE., EGU General Assembly 2024, Vienna, Austria, 14–19 Apr 2024, EGU24-10818, https://doi.org/10.5194/egusphere-egu24-10818, 2024.

EGU24-12470 | ECS | Posters on site | AS3.1

Measurements of Atmospheric Aerosol with the Vaporization Inlet for Aerosols and the Filter Inlet for Gases and Aerosols on a Bipolar Multi-Reagent Chemical Ionization Mass Spectrometer 

Mitchell Alton, Manjula Canagaratna, Anita Avery, Andrew Lambe, Juha Kangasluoma, Mikael Ehn, Valter Mickwitz, Jian Zhao, and Doug Worsnop

Atmospheric aerosols can be composed of a wide variety of organic and inorganic chemicals, which can dramatically affect the environmental impact of the particles. Understanding the chemical composition of aerosol assists in understanding the sources and fate of these emissions. Additionally, as volatile chemical products (VCPs) have surpassed vehicle emissions in urban areas, there is a need to understand the changing composition of urban aerosol and how it affects aerosol loadings and formation. Here, I present a simple tool called the Vaporization Inlet for Aerosols (VIA) to vaporize ambient aerosol to measure the chemical composition of the resulting gas-phase products with a time-of-flight chemical ionization mass spectrometer. The laboratory results from the VIA are compared to those obtained from the previously characterized Filter Inlet for Gases and Aerosols (FIGAERO). Both inlets have different benefits in terms of temporal resolution, gas-phase comparisons, ease of use, and long-term operation, which will be discussed. Finally, the thermal decomposition products of organic molecules in the VIA is compared to the FIGAERO to understand the chemical formulas detected by the mass spectrometer.

How to cite: Alton, M., Canagaratna, M., Avery, A., Lambe, A., Kangasluoma, J., Ehn, M., Mickwitz, V., Zhao, J., and Worsnop, D.: Measurements of Atmospheric Aerosol with the Vaporization Inlet for Aerosols and the Filter Inlet for Gases and Aerosols on a Bipolar Multi-Reagent Chemical Ionization Mass Spectrometer, EGU General Assembly 2024, Vienna, Austria, 14–19 Apr 2024, EGU24-12470, https://doi.org/10.5194/egusphere-egu24-12470, 2024.

Acidity is one central parameter in atmospheric multiphase reactions, influencing aerosol formation and its effects on climate, health, and ecosystems. Weak acids and bases, mainly CO2, NH3, and organic acids, are long considered to play a role in regulating atmospheric acidity. However, unlike strong acids and bases, their importance and influencing mechanisms in a given aerosol or cloud droplet system remain to be clarified. Here, we investigate this issue with new insights provided by recent advances in the field, in particular, the multiphase buffer theory. We show that, in general, aerosol acidity is primarily buffered by NH3, with a negligible contribution from CO2 and a potential contribution from organic acids under certain conditions. For fogs, clouds, and rains, CO2, organic acids, and NH3may all provide certain buffering under higher pH levels (pH > 4). Despite the 104to 107 lower abundance of NH3and organic weak acids, their buffering effect can still be comparable to that of CO2. This is because the cloud pH is at the very far end of the CO2multiphase buffering range. This Perspective highlights the need for more comprehensive field observations under different conditions and further studies in the interactions among organic acids, acidity, and cloud chemistry.

How to cite: Zheng, G., Su, H., and Cheng, Y.:  Role of Carbon Dioxide, Ammonia, and Organic Acids in Buffering Atmospheric Acidity: The Distinct Contribution in Clouds and Aerosols , EGU General Assembly 2024, Vienna, Austria, 14–19 Apr 2024, EGU24-13623, https://doi.org/10.5194/egusphere-egu24-13623, 2024.

EGU24-14449 | ECS | Orals | AS3.1

Elucidating the formation and conversion mechanisms of HONO and HNO3 in the atmosphere of Daejeon, Korea 

Kyoungchan Kim, Chunsang Lee, Dayeong Choi, Sangwoo Han, Jiwon Eom, Hungsoo Joo, and Jinseok Han

Nitrogen oxide (NOX) in the atmosphere causes oxidation reactions with photochemical radicals and volatile organic compounds, causing ozone (O3) accumulation. In the composition of NOy, NOX accounts for the highest portion, and followed by nitrous acid (HONO) and nitric acid (HNO3). HONO significantly contributes to the reaction cycle of NOX and hydrogen oxide (OH). The generation of OH radicals and nitric oxide by photolysis is the main HONO removal mechanism in the morning. The OH radicals generated at this time trigger O3 accumulation in the atmosphere, affecting photochemical smog in urban areas. HNO3 in the atmosphere is produced by the reaction between NO2 and OH during the day while N2O5 and H2O during night time. Aerosolization by heterogeneous reactions of HNO3 is the major mechanism of HNO3 reduction. Aerosolization (heterogeneous) reactions adversely affect humans and plants by increasing the secondary aerosol concentration in the atmosphere and lowering visibility; therefore understanding the conversion mechanism of HNO3 to aerosols is important. In this study, HONO, HNO3, and their precursor gases in the atmosphere were observed using parallel-plate diffusion scrubber-ion chromatography. And a 0-D box model simulated the compositional distribution of NOy in the atmosphere, and the formation reactions and conversion mechanisms of HONO and HNO3 were analyzed.

Acknowledgments:

This research was supported by Particulate Matter Management Specialized Graduate Program through the Korea Environmental Industry & Technology Institute (KEITI) funded by the Ministry of Environment (MOE)

How to cite: Kim, K., Lee, C., Choi, D., Han, S., Eom, J., Joo, H., and Han, J.: Elucidating the formation and conversion mechanisms of HONO and HNO3 in the atmosphere of Daejeon, Korea, EGU General Assembly 2024, Vienna, Austria, 14–19 Apr 2024, EGU24-14449, https://doi.org/10.5194/egusphere-egu24-14449, 2024.

EGU24-14502 | ECS | Orals | AS3.1

Radiative effects of pre-monsoon dust and anthropogenic aerosols over India 

Kanishtha Dubey and Shubha Verma

Recent investigation of aerosols from global aerosol multi-models show that forward model simulations were unable to reproduce the ground-based station-observed aerosol optical depth (AOD) and their spatial distribution over the Indian subcontinent. Estimation of aerosol-induced radiative effects and its impact on climate requires accurate analysis of aerosols optical properties. In the present study high-resolution aerosol transport simulations are carried out with a state-of-the-art Eulerian chemistry-transport model, CHIMERE, forced externally by Weather Research and Forecasting model as a meteorological driver in offline mode. Simulations are carried out over the Indian domain (6° N to 38° N and 68° E to 99.25° E) at a horizontal resolution of 0.25° × 0.25°. The spatial distribution of pre-monsoon mean AOD at 550 nm is compared with satellite observations for the year 2015. The spatial pattern of AOD showing high values in the Indo-Gangetic Plain (IGP, 0.45-0.55) is consistent with the features of observed AOD from satellite retrievals (0.4-0.55) with a slight over-estimation (30%) in the upper-IGP region. The IGP has a higher AOD than most parts of India attributed to high population density and greater emission sources. Large seasonal mean AOD values are also estimated over the Indian state of Telangana (0.5-0.6) which is over-estimated (25%-35%) as compared to satellite retrievals. The simulated AOD is also found to be in good agreement (NMB: 17% for 16 locations) with AOD from ground-based observations (AERONET and individual measurements) at stations over India. Assessment of anthropogenic and dust AOD showed high influence of anthropogenic aerosols over the IGP region while that of dust over north-western region.

Further, the pre-monsoon shortwave radiative perturbation due to total, dust and anthropogenic aerosols over the Indian region is evaluated at surface (SUR), atmosphere (ATM) and top of atmosphere (TOA). The positive value of the radiative effect signifies warming due to aerosols and vice versa for the negative value of the radiative effect. The radiative effect at TOA due to total aerosols is negative over the north-western region and positive for other parts of India. The net radiative effect of total aerosols at the SUR is cooling (-70 to -80 W m-2) in contrast to warming (+65 to +80 W m-2) in the atmosphere. The magnitude of radiative perturbations caused by anthropogenic aerosols is higher compared to dust at SUR and ATM. Anthropogenic aerosols have a net warming effect at TOA (+20 to +50 W m−2) in contrast to a net cooling effect (-20 to -40 W m-2) by dust aerosols. The most substantial values of radiative perturbations due to anthropogenic aerosols are observed over the IGP region while the effect of dust aerosols is prominent over the north-western region of India.

How to cite: Dubey, K. and Verma, S.: Radiative effects of pre-monsoon dust and anthropogenic aerosols over India, EGU General Assembly 2024, Vienna, Austria, 14–19 Apr 2024, EGU24-14502, https://doi.org/10.5194/egusphere-egu24-14502, 2024.

EGU24-14587 | Posters on site | AS3.1

Improvement of ammonia emission inventory using life cycle assessment based on livestock manure flow: A case study of manure management sector of Korea 

HungSoo Joo, HyeMin Lee, Kyoungchan Kim, JinSeok Han, and Jeongdeok Baek

Ammonia is one of precursor gases to form particulate matter (PM) which is reacted with nitrogen oxides and sulfur oxides in the atmosphere. Based on Clean Air Policy Support System (CAPSS) of Korea, annual ammonia emission is 261,207 tons (year of 2020) and the agricultural sources (manure management sector) emits the highest portion of ammonia. In this study, we aim to recalculate ammonia emissions of livestock industry using the UK's estimation method which is used the life cycle assessment of livestock manure mass flow. four major animal kinds were selected, i.e., cattle (beef cattle and dairy cow), pigs and chickens and three major processes as the manure flow were included such as housing, manure treatment (composting and liquefied fertilization) and land application. Total ammonia emissions were estimated to be approximately 33% higher than the current official ammonia emissions by CAPSS. Ammonia emissions from pigs and poultry were high in four major animal kinds. Relative ammonia emissions from beef cattle and poultry was much higher than those by CAPSS. Highest ammonia emissions were emitted from land application on manure flow. The emission factors of dairy cow and poultry was much higher than those by CAPSS, while the emission factor of pigs was slightly lower than that those by CAPSS. The methodology for the estimation of ammonia emissions used in this study can be a new approach for the estimation of the manure management sector in CAPSS. As a further study, the development of Korean emission factors for each manure flow can be suggested.


Acknowledgments:

This research was supported by Particulate Matter Management Specialized Graduate Program through the Korea Environmental Industry & Technology Institute (KEITI) funded by the Ministry of Environment (MOE)

How to cite: Joo, H., Lee, H., Kim, K., Han, J., and Baek, J.: Improvement of ammonia emission inventory using life cycle assessment based on livestock manure flow: A case study of manure management sector of Korea, EGU General Assembly 2024, Vienna, Austria, 14–19 Apr 2024, EGU24-14587, https://doi.org/10.5194/egusphere-egu24-14587, 2024.

EGU24-15070 | ECS | Orals | AS3.1

Local influences of emission source characteristics and meteorological factors on nitrate and ammonium partitioning in Korea 

Jihoon Seo, Jin Young Kim, Kyung Hwan Kim, and Jong Bum Kim

Particulate air pollution in Korea is influenced by both local emissions and the transportation of particles and precursors in continental outflows. Alongside local high-NOx and NH3 conditions, the inorganic-rich and hygroscopic transported particles enhance the gas-particle partitioning of inorganic precursor gases (HNO3, NH3) into particulate nitrate and ammonium, synergistically resulting in heavy haze pollution. Local source characteristics can impact concentrations of precursor gases and particle acidity, which are crucial factors in inorganic gas-particle partitioning. However, the episodic or background effects of transported particles and precursors make it challenging to clearly identify the local influences of emission source characteristics on chemical composition and concentrations. In this study, we investigated local effects on the gas-particle partitioning into nitrate and ammonium using hourly data of PM2.5 chemical compositions, NH3 concentration, and meteorological variables from three different sites in Korea: a typical urban site in Seoul, an industrial site in Ansan, and a rural site affected by industrial sources in Seosan. To isolate the effect of local characteristics from the impact of long-range transport from China, backward trajectories and wind speed were additionally utilized. Partitioning ratios of total HNO3 (HNO3 gas + particulate nitrate) and total NH3 (NH3 gas + particulate ammonium) were analytically calculated by using particle acidity and liquid water contents from the ISORROPIA II thermodynamic model. Results show that the particle acidity from the three sites is not significantly different, despite a large difference in total HNO3 and total NH3 concentrations. However, high relative humidity and liquid water content at the coastal-industrial site, Ansan, can result in a larger nitrate fraction. Local characteristics of secondary inorganic aerosols depend not only on different local source characteristics but also on different local meteorological conditions, particularly relative humidity, which affects nitrate and ammonium partitioning.

How to cite: Seo, J., Kim, J. Y., Kim, K. H., and Kim, J. B.: Local influences of emission source characteristics and meteorological factors on nitrate and ammonium partitioning in Korea, EGU General Assembly 2024, Vienna, Austria, 14–19 Apr 2024, EGU24-15070, https://doi.org/10.5194/egusphere-egu24-15070, 2024.

EGU24-15588 | Orals | AS3.1

Direct observation of wintertime secondary formation of sulfate in ambient aerosols in Fairbanks, Alaska 

Jingqiu Mao, Kunal Bali, James Campbell, Ellis Robinson, Peter DeCarlo, Amna Ijaz, Brice Temime-Roussel, Barbara D’Anna, William Simpson, and Rodney Weber

Sulfate comprises an average of 20% of the ambient PM2.5 mass during the winter months in Fairbanks, as indicated by 24-hour average filter measurements. During ALPACA 2022 field campaign (Jan 15th-Feb28th of 2022), we deployed two aerosol mass spectrometers (AMS) and one aerosol chemical speciation monitor (ACSM) at three urban sites, combined with Scanning Mobility Particle Sizer (SMPS), to examine the evolution of aerosol composition and size distribution at a sub-hourly time scale. During an intense pollution episode (ambient temperature is between -25 and -35 °C), all three instruments (two AMS and one ACSM) exhibit a sharp increase in sulfate mass within a matter of hours, while organic aerosols, black carbon and SO2 concentrations remain relatively stable. This notable increase in sulfate mass contributes to approximately half of the observed change in ambient PM2.5. The abrupt rise in sulfate mass is concurrent with a substantial increase in particle number density within the accumulation mode (100-1000 nm), suggesting the secondary formation of sulfate onto pre-existing aerosols. We further investigate possible mechanisms and have ruled out the possible role of cloud chemistry and transition metal ion. The rapid formation of sulfate seems to be linked to the ambient level of nitrogen oxides and, possibly, sunlight. Further investigation is underway to elucidate the intricate connections underlying this rapid sulfate formation.

How to cite: Mao, J., Bali, K., Campbell, J., Robinson, E., DeCarlo, P., Ijaz, A., Temime-Roussel, B., D’Anna, B., Simpson, W., and Weber, R.: Direct observation of wintertime secondary formation of sulfate in ambient aerosols in Fairbanks, Alaska, EGU General Assembly 2024, Vienna, Austria, 14–19 Apr 2024, EGU24-15588, https://doi.org/10.5194/egusphere-egu24-15588, 2024.

This study aims to analyze the dynamics of aerosol behavior, particularly focusing on particle number size distribution (PNSD) in contrasting environments — coastal and rural areas of the Netherlands. Our goal is to interpret the environmental factors and mechanisms influencing New Particle Formation (NPF) events in these distinct geographic settings, thereby enhancing our understanding of aerosol dynamics in varied environmental conditions. Our results indicate significant differences in particle number concentrations between the sites, with Cabauw showing notably higher concentrations, largely due to Ultrafine Particles (UFPs). Wind patterns strongly influence UFP levels, particularly winds from the direction of Amsterdam airport and the Rotterdam port area. However, the two sites exhibited good agreement (r²=0.62) in the concentration of accumulation mode particles, suggesting a regional rather than local source. Seasonal variations in nuclei mode particles were observed for both sites, with concentrations peaking in summer and diminishing in winter. 

Our analysis extends to PNSD clusters and NPF classes. The results suggest that NPF events are typically associated with high solar radiation, lower relative humidity, higher temperature, and higher SO2 and O3, but lower NOx. The growth of these newly formed particles often relies on stable diffusion radiation conditions, while frequent cloud occurrence impedes particle growth. Additionally, particle size growth is often accompanied by increased concentrations of organics, nitrate, and ammonium. Notably, two distinct NPF episodes in the morning and at noon were observed at Cabauw. Suppressed growth of morning particles often coincides with higher NOx concentrations. In contrast, Lutjewad often experienced noon NPF events, which demonstrated sustained growth in particle size until the following day. These findings underscore the influence of local environmental conditions on aerosol dynamics.

How to cite: Liu, X., Henzing, B., Mulder, J., and Dusek, U.: Two-year observations of aerosol size distributions: investigating new particle formation at coastal and rural sites in the Netherlands, EGU General Assembly 2024, Vienna, Austria, 14–19 Apr 2024, EGU24-16529, https://doi.org/10.5194/egusphere-egu24-16529, 2024.

EGU24-16874 | ECS | Posters on site | AS3.1

ACTRIS - University of Helsinki Topical Centre units provide support for measurements of secondary aerosol formation 

Nina Sarnela, Janne Lampilahti, Tuukka Petäjä, Katrianne Lehtipalo, and Silja Häme

ACTRIS is a European distributed research infrastructure producing high-quality data on short-lived atmospheric constituents. ACTRIS facilitates free access to long-term atmospheric data and access to its world-class facilities and extends its resources to academia, the private sector, and the general public. The infrastructure comprises National Facilities, encompassing observational and exploratory platforms, and Central Facilities that support these units through training, guidelines, and standard operation procedures.

University of Helsinki (UH) is hosting two specialized Topical Centre Units dedicated to standardizing measurements of secondary aerosol formation. The Cluster Calibration Centre (CCC) focuses on sub-10nm aerosol particle concentration and size distribution measurements, while CiGas-UHEL concentrates on condensable trace gases, which can serve as aerosol precursors.

The main tasks of the UH Topical Centre Units are to 1) provide training and consultancy, 2) produce and provide measurement and data procedures and tools 3) improve the methods to calibrate the relevant instrumentation and provide instrument calibrations for ACTRIS National Facilities, 4) organize calibration and intercomparison workshops and 5) carry out measurement and calibration method and instrument development.

Currently, both CCC and CiGas-UHEL are at the midpoint of their implementation, with full operative capacity anticipated by 2026. In the past year, significant strides were made with piloting ACTRIS intercomparison workshops. CiGas-UHEL hosted the 1st Chemical Ionization Mass Spectrometer intercomparison workshop in March 2023 (Leipzig), while CCC organized the 1st Neutral cluster and Air Ion Spectrometer (NAIS) intercomparison workshop in May 2023 (Helsinki) and the 1st Nanoparticle instrument intercomparison workshop in November 2023 (Helsinki). These workshops serve as critical platforms, providing essential insights into measurement techniques and instrument functionality .

How to cite: Sarnela, N., Lampilahti, J., Petäjä, T., Lehtipalo, K., and Häme, S.: ACTRIS - University of Helsinki Topical Centre units provide support for measurements of secondary aerosol formation, EGU General Assembly 2024, Vienna, Austria, 14–19 Apr 2024, EGU24-16874, https://doi.org/10.5194/egusphere-egu24-16874, 2024.

EGU24-17070 | ECS | Posters on site | AS3.1

Aerosol size distribution: One year of measurements and retrieval procedures comparison 

Ilya Bruchkouski, Artur Szkop, and Aleksander Pietruchuk

Aerosol size distribution (ASD) is the most important physical characteristic of aerosols, which determines the extent of aerosol penetration into a human’s respiratory tract: how particles are inhaled and where they deposit within the respiratory system. Therefore, correct measurements of aerosol size distribution are essential for assessing their potential impact on human health. Also, information about ASD is important for many different scientific applications, including radiative transfer models, source identification, air quality monitoring, optical remote sensing, atmospheric correction procedures, aerosol-cloud interactions, environmental impact assessment and climate studies.

The retrieval of ASD from a diverse range of optical observations can be accomplished using GRASP (Generalized Retrieval of Atmosphere and Surface Properties) [1]. This study focuses on employing in-situ nephelometer measurements for ASD retrieval through the GRASP technique. To ensure the accurate processing of nephelometer data by the GRASP technique, it is imperative to determine appropriate model settings. The primary objective of this work is to determine the optimal GRASP settings for harmonizing a one-year series of in-situ aerosol measurements. The significance of this research lies in the developing of a multi-instrumental approach aimed at determining a correct model configuration, applicable to aerosol scattering measurements under diverse meteorological conditions.

In-situ one-year measurements were conducted at the suburban measurement site in Racibórz (50 °E, 18 °N), utilizing the Aurora 4000, Aerodynamic Particle Sizer (APS) and Scanning Mobility Particle Sizer (SMPS) spectrometers. The Aurora 4000 is an integrating nephelometer that can measure light scattering in a sample of ambient air at three wavelengths: 450, 525, and 635 nm in several angular sectors from 10° to 90° through to 170°. Aerosol scattering measurements in 17 different angular ranges served as input for the GRASP algorithm, which was employed to obtain the size distribution of fine and coarse aerosol modes separately. The GRASP retrievals of aerosol size distribution were subsequently compared to measurements taken by both APS and SMPS instruments.

A one-year series of data allows for the comparison of relatively long time series and the testing of different settings of the software and its performance. Special attention was given to finding best model settings under different meteorological conditions. This work was supported by the National Science Centre under grant 2021/41/B/ST10/03660.

[1] Moallemi, A., Modini, R. L., Lapyonok, T., Lopatin, A., Fuertes, D., Dubovik, O., Giaccari, P., and Gysel-Beer, M.: Information content and aerosol property retrieval potential for different types of in situ polar nephelometer data, Atmos. Meas. Tech., 15, 5619–5642, 2022. https://doi.org/10.5194/amt-15-5619-2022 

How to cite: Bruchkouski, I., Szkop, A., and Pietruchuk, A.: Aerosol size distribution: One year of measurements and retrieval procedures comparison, EGU General Assembly 2024, Vienna, Austria, 14–19 Apr 2024, EGU24-17070, https://doi.org/10.5194/egusphere-egu24-17070, 2024.

EGU24-18810 | Orals | AS3.1

Molecular Self-Organisation in Surfactant Atmospheric Aerosol Proxies 

Christian Pfrang, Adam Milsom, Adam Squires, and Andy Ward

Surface-active molecules (surfactants) make significant contributions to aerosol emissions, with sources ranging from cooking to sea spray. These molecules alter the cloud droplet formation potential by changing the surface tension of aqueous droplets and thus increasing their ability to grow. They can also coat solid surfaces such as windows (“window grime”) and dust particles. Such surface films are more important indoors due to the higher surface-to-volume ratio compared to the outdoor environment, increasing the likelihood of surface film–pollutant interactions.

A common cooking and marine emission, oleic acid, is known to self-organize into a range of 3-D nanostructures. These nanostructures are highly viscous and as such can impact the kinetics of aerosol and film aging (i.e., water uptake and oxidation). There is still a discrepancy between the longer atmospheric lifetime of oleic acid compared with laboratory experiment-based predictions.

We have created a body of experimental and modelling work focusing on the novel proposition of surfactant self-organization in the atmosphere. Self-organized proxies were studied as nanometer-to-micrometer films, levitated droplets, and bulk mixtures. This access to a wide range of geometries and scales has resulted in the following main conclusions (Milsom et al., Acc. Chem. Res. 2023, 56, 19, 2555–2568): (i) an atmospherically abundant surfactant can self-organize into a range of viscous nanostructures in the presence of other compounds commonly encountered in atmospheric aerosols; (ii) surfactant self-organization significantly reduces the reactivity of the organic phase, increasing the chemical lifetime of these surfactant molecules and other particle constituents; (iii) while self-assembly was found over a wide range of conditions and compositions, the specific, observed nanostructure is highly sensitive to mixture composition; and (iv) a “crust” of product material forms on the surface of reacting particles and films, limiting the diffusion of reactive gases to the particle or film bulk and subsequent reactivity. These findings suggest that hazardous, reactive materials may be protected in aerosol matrixes underneath a highly viscous shell, thus extending the atmospheric residence times of otherwise short-lived species.  

We will also report on our latest work quantifying how hygroscopicity and reactivity of fatty acid atmospheric aerosol proxies is affected by nanostructure: we found that hygroscopicity is linked to nanostructure and is dependent on the geometry of the nanostructure and reaction with ozone revealed a nanostructure-reactivity trend, with notable differences between th varying nanostructures.

How to cite: Pfrang, C., Milsom, A., Squires, A., and Ward, A.: Molecular Self-Organisation in Surfactant Atmospheric Aerosol Proxies, EGU General Assembly 2024, Vienna, Austria, 14–19 Apr 2024, EGU24-18810, https://doi.org/10.5194/egusphere-egu24-18810, 2024.

EGU24-160 | ECS | Posters on site | AS3.2

Study of formaldehyde (HCHO) columns abundance from OMI satellite data in two agricultural regions in the south of Mexico 

Cristina Alejandra Mendoza Rodriguez, Claudia Ines Rivera Cardenas, and Carlos Crispin Espinosa Ponce

HCHO is one of the most abundant carbonyl compounds in the troposphere. At global scale, HCHO is mainly produced from the oxidation of volatile organic compounds (VOC) which come from biogenic (predominantly isoprene) emissions, biomass burning, and anthropogenic emissions. HCHO is produced in high amounts when both isoprene and nitrogen oxides (NOx, NO + NO2) are present. In order to determine the driver factors and the principal months of enhancement of HCHO over the Oaxaca and the Chiapas regions, important rain-fed maize agricultural areas located in the south of Mexico, HCHO columns from the Ozone Monitoring Instrument (OMI) were used in conjunction with isoprene emissions, NOx  emissions from biomass burning (NOx_bb), and NOemissions from soils with their different sources (biomes: NOx_bio, fertilization and manure: NOx_fer, deposition of N: NOx_dep, pulses: NOx_pul, and total: NOx_tot) from January 2005 to December 2016. Based on scatterplots, Spearman rank correlations, and multiple regression models, we determined that isoprene and NOx_bb were important drivers of HCHO abundance in the Oaxaca region, especially in April and May. In the Chiapas region, important drivers were isoprene, NOx_bb, and NOx_fer, mainly from April to August. With the estimated regression coefficients, the contribution (in %) of the relevant emission fluxes for each region were calculated in order to know which source was the predominant one in the exacerbation of modeled HCHO (HCHOMOD). In the Oaxaca region, isoprene predominates over NOx_bb. In the Chiapas region, the emissions of NOx were more importantthan isoprene. NOx_bb and NOx_fer were enhanced principally due to the agricultural activity taking place in the Oaxaca and the Chiapas regions. Thus, this work demonstrates the impact of agricultural activity on HCHO columns observed by the OMI instrument.

How to cite: Mendoza Rodriguez, C. A., Rivera Cardenas, C. I., and Espinosa Ponce, C. C.: Study of formaldehyde (HCHO) columns abundance from OMI satellite data in two agricultural regions in the south of Mexico, EGU General Assembly 2024, Vienna, Austria, 14–19 Apr 2024, EGU24-160, https://doi.org/10.5194/egusphere-egu24-160, 2024.

EGU24-204 | ECS | Posters on site | AS3.2

Elucidating Isoprene Oxidation: Pathways to Highly Oxygenated Molecules formation 

Liwen Yang, Wei Nie, Chao Yan, and Mikael Ehn

Isoprene is globally recognized as the preeminent biogenic volatile organic compounds (BVOCs) and is the most extensively researched species among volatile organic compounds (VOCs). Nevertheless, prevailing global and regional atmospheric models inadequately represent its molecular-level oxidation process. The predominate explicit chemical mechanisms, such as Master Chemical Mechanism (MCM) and CalTech isoprene mechanism, underestimate the complexities of isoprene oxidation, particularly the formation of Highly Oxygenated Molecules (HOMs) — a vital process from VOC to secondary organic aerosol (SOA). Here, we address a critical gap in the understanding of isoprene oxidation mechanism within existing models, especially the formation of fragmentation products and HOM-level oxidation products. The updated model integrates the influence of multigenerational OH-initiated oxidation and photolysis processes, thereby enriching the dynamics of free radical cycling. Our updated model was validated against previous molecular-level chamber experiments, demonstrating an enhanced ability to simulate the radical cycle and HOM formation, thus more accurately reflecting SOA formation.

How to cite: Yang, L., Nie, W., Yan, C., and Ehn, M.: Elucidating Isoprene Oxidation: Pathways to Highly Oxygenated Molecules formation, EGU General Assembly 2024, Vienna, Austria, 14–19 Apr 2024, EGU24-204, https://doi.org/10.5194/egusphere-egu24-204, 2024.

EGU24-1318 | ECS | Orals | AS3.2

Airborne flux measurements for validation of VOC emission inventories and source attribution  

Eva Y. Pfannerstill, Caleb Arata, Qindan Zhu, Benjamin C. Schulze, Roy Woods, Colin Harkins, Rebecca H. Schwantes, Brian C. McDonald, John H. Seinfeld, Anthony Bucholtz, Ronald C. Cohen, and Allen H. Goldstein

For accurate prediction and modelling of air quality and climate, it is necessary to understand the emissions of volatile organic compounds (VOCs) from the potpourri of sources that they are emitted from: traffic, industry, households, plants, agriculture, etc. In the past, efforts to understand the magnitude and composition of VOC emissions have often relied on indirect methods – either using bottom-up emission models, or inferring emissions top-down from concentration measurements via chemical transport models. Both approaches rely on a number of assumptions regarding chemical reactions and transport - and thus are subject to large uncertainties.

Airborne flux observations provide direct emission and deposition information at landscape scale with a resolution of a few km. We performed airborne eddy covariance measurements of a large range of VOCs on board a Twin Otter aircraft in Los Angeles and the agricultural San Joaquin Valley in California using PTR-ToF-MS. Combining these observations with a footprint model, we matched them with gridded inventories in space and time. The comparison with the inventories showed a good representation of typical traffic VOCs, but a significant underestimation of oxygenated VOCs (likely from volatile chemical products and cooking) and terpenoids by the inventories.

Using airborne flux footprints in combination with landcover information of the San Joaquin Valley, we disaggregated the observed VOC emissions by multivariate linear regression and attributed them to their sources. This way, we obtained typical VOC emission rates and composition for dairy farms, citrus crops, citrus processing facilities, oak forests, oil and gas wells, and urban areas.

How to cite: Pfannerstill, E. Y., Arata, C., Zhu, Q., Schulze, B. C., Woods, R., Harkins, C., Schwantes, R. H., McDonald, B. C., Seinfeld, J. H., Bucholtz, A., Cohen, R. C., and Goldstein, A. H.: Airborne flux measurements for validation of VOC emission inventories and source attribution , EGU General Assembly 2024, Vienna, Austria, 14–19 Apr 2024, EGU24-1318, https://doi.org/10.5194/egusphere-egu24-1318, 2024.

Development of a molecular-level understanding of the processes governing the evolution of organic aerosol mass has been a long running challenge. I will present new insights into the potential for biogenic volatile organic compounds (BVOC) to form new particles and contribute to organic aerosol formation. Specifically, I will illustrate the coupled roles of organic peroxy radical chemistry and shallow and deep convective clouds in transporting or processing BVOC and their oxidations products that impact aerosol particle formation and growth on scales that are typically unresolved in global scale chemical transport models. The fate of organic peroxy radicals from BVOC depends upon NOx, with natural and anthropogenic sources, as well as temperature and therefore changes substantially with both altitude and region. Deep convection efficiently transports BVOC to the upper troposphere with significant decreases in temperature and, over land substantial NOx from lightning and from co-transport of polluted boundary layer air. The fates of BVOC-derived organic peroxy radicals in the upper troposphere will therefore occur in conditions rarely probed experimentally, with implications for the formation of low volatility products. In addition, during transport through shallow or deep convective clouds, soluble BVOC oxidation products commonly considered important precursors to secondary organic aerosol (SOA) will partition and potentially react in the cloud water. Thus, the common occurrence of both shallow cumulus and deep convective clouds is a large but poorly represented lever on biogenic SOA formation. 

I will show results from studies of the above processes using a hierarchy of models, including parcel models run along trajectories from Large Eddy Simulation (LES) models of deep convective clouds, LES models of cumulus-topped boundary layers with online multi-phase chemistry, and global chemical transport simulations with online chemistry and implications for new particle formation and organic aerosol mass budgets. Chemical mechanisms are informed by recent laboratory studies of organic peroxy radicals, such as autoxidation, accretion product formation from cross-reactions, and organic nitrate formation, as well as the aqueous chemistry of isoprene-derived epoxy diols. Comparisons of these models to observations reveal the importance of scattered cumulus clouds to the fate of isoprene epoxy diols and thus its SOA formation potential, the role of lightning and soil NOx in new particle formation from BVOC oxidation in the upper-tropospheric outflow of deep convective clouds, and the potential for isoprene oxidation at high NO and low temperature to serve as a key source of low volatility organics that drive new particle formation in deep convective outflow.

How to cite: Thornton, J.: Biogenic VOC Multiphase Chemistry – From Cloud Scavenging to New Particle Formation  , EGU General Assembly 2024, Vienna, Austria, 14–19 Apr 2024, EGU24-2952, https://doi.org/10.5194/egusphere-egu24-2952, 2024.

EGU24-3112 | ECS | Orals | AS3.2

Atmospheric Gas Phase Formation Mechanism of Methanesulfonic Acid 

Jing Chen, Joseph R. Lane, Kelvin H. Bates, and Henrik G. Kjaergaard

The oxidation of dimethyl sulfide (DMS) leads to the formation of sulfuric acid (SA) and methane sulfonic acid (MSA), which has a great impact on atmospheric aerosol and cloud formation (Barnes, Hjorth et al. 2006). Despite the great importance, the formation mechanism of MSA from DMS has remained unclear for decades (Shen, Scholz et al. 2022).

           The reaction of DMS with OH radical forms methanesulfinic acid (MSIA), methane sulfenic acid (MSEA), methylation radical (CH3S) radical, and hydroperoxymethyl thioformate (HPMTF)(Berndt, Scholz et al. 2019, Shen, Scholz et al. 2022). Among them, the oxidation of the first three all undergoes either the CH3SO radical or the CH3SO2 radical as intermediates(Kukui, Borissenko et al. 2003, Berndt, Chen et al. 2020, Chen, Berndt et al. 2021).

           We theoretically investigated the atmospheric fate of the CH3SO and CH3SO2 radicals. The results suggest that CH3SO radical mainly reacts bimolecularly forming CH3SO2, and the CH3SO2 radical either decomposes forming SO2 or adds O2 forming the peroxy radical CH3S(O)2OO in the atmosphere. We show that the branching ratio of SO2 and CH3S(O)2OO formation from CH3SO2 is temperature sensitive, and the ratio of SO2 to CH3S(O)2OO decreases from about 99:1 to about 95:5 when reducing the temperature from 300 K to 260K. The peroxy radical CH3S(O)2OO can react bimolecularly forming the CH3SO3 intermediate, which can abstract an H from HO2 forming MSA. In addition, we show that MSA can also form directly via the reaction of MSIA and OH followed by O2 addition (Chen, Lane et al. 2023).

           Our study indicates that temperature may play a crucial role in explaining atmosphere MSA formation. SO2 is likely the dominant product from DMS + OH in the tropics and warm regions, while in the colder and polar regions, large amounts of MSA can be formed in the gas phase by DMS reacting with OH. Global modeling indicates that the proposed temperature-sensitive MSA formation mechanism leads to a substantial increase in the simulated global atmospheric MSA formation and burden (Chen, Lane et al. 2023).

How to cite: Chen, J., Lane, J. R., Bates, K. H., and Kjaergaard, H. G.: Atmospheric Gas Phase Formation Mechanism of Methanesulfonic Acid, EGU General Assembly 2024, Vienna, Austria, 14–19 Apr 2024, EGU24-3112, https://doi.org/10.5194/egusphere-egu24-3112, 2024.

EGU24-3572 | ECS | Orals | AS3.2

Impact of deep convection on biogenic volatile organic compounds in the upper troposphere over the Amazon Rainforest 

Nidhi Tripathi, Achim Edtbauer, Nijing Wang, Akima Ringsdorf, Bianca Krumm, Thomas Klüpfel, Jos Lelieveld, and Jonathan Williams

Biogenic volatile organic compounds (BVOCs) play an essential role in tropospheric chemistry, forming secondary organic aerosol and influencing ambient ozone. Since particles produced from BVOCs may grow to form cloud condensation nuclei (CCN) and influence cloud properties, BVOCs also indirectly affect the global radiation budget. The terrestrial biosphere is a significant source of BVOCs, with the emissions from the tropical forests (mainly the Amazon) contributing about 80% to the global BVOC budgets. Our understanding of BVOC emissions and chemistry, particularly their role in particle formation over the Amazon rainforest, is incomplete. Therefore, a comprehensive suite of atmospheric instruments was used to measure BVOCs, particles and other trace gases over the Amazon rainforest using the High Altitude and Long-range Observation (HALO) aircraft from Dec 2022 to Jan 2023. The main focus of the field campaign was to investigate how tropical convection affects the atmospheric chemistry of BVOCs using measurements made from 300m to 15km altitude. The measurements of BVOCs were performed using PTR-ToF-MS and fast GC-MS.

 Isoprene was found to be the dominant BVOCs in the Amazon boundary layer. Interestingly, as a result of the regional strong convection, we observed elevated mixing ratios of isoprene (>1ppb), its oxidation products, and the sum of monoterpenes (MTs) in the upper troposphere (~10-12 km). This shows that despite the fast reaction rate of isoprene with OH (lifetime 1 hour) significant amounts can reach the outflow regions of the upper troposphere. The diel (24-hour) profile of isoprene mixing ratios, its oxidation products, and MTs in the upper troposphere were observed to change markedly with altitude. Near the surface (300m) BVOC emissions including isoprene varied with light and temperature peaking at circa 13:00 local time. However, between 10-12km, isoprene mixing ratios rose during the night and peaked before dawn and the onset of photochemical oxidation. This suggests that the nocturnal convection of residual isoprene is an effective vertical transport mechanism that primes the upper troposphere for particle production the following day. The boundary layer isoprene mixing ratios were also found to vary spatially with the strongest gradient found between the forested and deforested regions. The mean mixing ratios of isoprene (2.96 ±0.72 ppbv) and MTs (0.31±0.09 ppbv) in the forested regions were ~4 times higher than their values measured in the deforested regions. In both the boundary layer and outflow regions of the tropical Amazonian troposphere isoprene is a key player in the atmospheric chemistry. Preliminary results of the spatio-temporal variation and vertical profiles of other selected BVOCs will be presented.

How to cite: Tripathi, N., Edtbauer, A., Wang, N., Ringsdorf, A., Krumm, B., Klüpfel, T., Lelieveld, J., and Williams, J.: Impact of deep convection on biogenic volatile organic compounds in the upper troposphere over the Amazon Rainforest, EGU General Assembly 2024, Vienna, Austria, 14–19 Apr 2024, EGU24-3572, https://doi.org/10.5194/egusphere-egu24-3572, 2024.

EGU24-3892 | Orals | AS3.2

Atmospheric isoprene measurements reveal larger-than-expected Southern Ocean emissions 

Neil R.P. Harris, Valerio Ferracci, James Weber, Conor Bolas, Andrew Robinson, Fiona Tummon, Pablo Rodríguez-Ros, Pau Cortés-Greus, Andrea Baccarini, Roderick L Jones, Martí Galí, Rafel Simó, and Julia Schmale

Isoprene is a key trace component of the atmosphere emitted by vegetation and other organisms. It is highly reactive and can impact atmospheric composition and climate by affecting the greenhouse gases ozone and methane and secondary organic aerosol formation. Marine fluxes are poorly constrained due to the paucity of long-term measurements; this in turn limits our understanding of isoprene cycling in the ocean. Here we present the analysis of isoprene concentrations in the atmosphere measured across the Southern Ocean over 4 months in the summertime. Some of the highest concentrations (> 500 ppt) originated from the marginal ice zone (MIZ) in the Ross and Amundsen seas, indicating the MIZ is a significant source of isoprene at high latitudes. Using the global chemistry-climate model UKESM1 we show that current estimates of sea-to-air isoprene fluxes underestimate observed isoprene by a factor >20. A daytime source of isoprene is required to reconcile models with observations. The model presented here suggests such an increase in isoprene emissions would lead to >8% decrease in the hydroxyl radical in regions of the Southern Ocean, with implications for our understanding of atmospheric oxidation and composition in remote environments, often used as proxies for the pre-industrial atmosphere.

How to cite: Harris, N. R. P., Ferracci, V., Weber, J., Bolas, C., Robinson, A., Tummon, F., Rodríguez-Ros, P., Cortés-Greus, P., Baccarini, A., Jones, R. L., Galí, M., Simó, R., and Schmale, J.: Atmospheric isoprene measurements reveal larger-than-expected Southern Ocean emissions, EGU General Assembly 2024, Vienna, Austria, 14–19 Apr 2024, EGU24-3892, https://doi.org/10.5194/egusphere-egu24-3892, 2024.

Aerosols formed on the Qinghai-Tibet Plateau, also known as the world's third pole, are more likely to enter the free troposphere due to its high altitude. This has far-reaching effects on radiative forcing and global climate. The southeastern Qinghai-Tibet Plateau, adjacent to the Himalayas, is commonly regarded as a pristine area that can offer insight into aerosol formation under pre-industrial conditions, free from the influence of human activities. Here we present observations taken at a representative site in southeast Tibet, a region covered by alpine forests and grasslands. The average aerosol particle nucleation rate (J1.7) is 2.5 cm-3s-1, exceeding the kinetic limit of sulfuric acid (SA) nucleation in most cases due to the low SA concentrations (with a mean of 2.5×105 cm-3). The critical role of highly oxygenated organic molecules (HOMs) in in-situ aerosol production is then to be found. Ultra-low and extremely low volatile HOMs dominate particles' nucleation and initial growth, respectively. Furthermore, these organic vapors come from the atmospheric oxidation of biogenic precursors, mainly monoterpenes with some contributions from sesquiterpenes and diterpenes. Surprisingly, over half of the ultra- and extremely-low volatile HOMs are organic nitrates, mainly formed through RO2 + NO terminations or NO3-initiated oxidations. These findings suggest that anthropogenic emissions influence the chemistry that drives biogenic new particle formation in the southeastern Qinghai-Tibet Plateau. As human activity increases, this region is transitioning from a pre-industrial to a post-industrial environment. The potential impact of this process on aerosol production and climate should be given more consideration.

How to cite: Liu, Y.: Biogenic particle formation over the southeastern Qinghai-Tibet Plateau is increasingly influenced by anthropogenic emissions, EGU General Assembly 2024, Vienna, Austria, 14–19 Apr 2024, EGU24-4669, https://doi.org/10.5194/egusphere-egu24-4669, 2024.

EGU24-4712 | Posters on site | AS3.2

A Bipolar Multi-Reagent Chemical Ionization Mass Spectrometer for Versatile Measurements of Gas and Particle Phase Organics 

Manjula Canagaratna, Harald Stark, Leah Williams, Mitch Alton, Taekyu Joo, Felipe Lopez-Hilfiker, Anita Avery, Veronika Pospisilova, Drew Gentner, and Andrew Lambe

Organic species in the atmosphere originate from a wide range of sources and processes. While real time chemical ionization mass spectrometry (CIMS) has improved our capability to characterize individual organic species in the atmosphere, the selectivity of CIMS reagent ions can limit the range of species that can be measured.  In this work the need to detect a broader range of species with a single CIMS instrument is addressed. A fast-switching bipolar time-of-flight CIMS that switches between four different reagent ions, including positive and negative ions, is demonstrated.  The performance and utility of this instrument is demonstrated by measurements obtained on board a ship in Antarctica during the PolarChange field campaign and from New York City during the AEROMMA campaign.  During both campaigns the instrument cycled through iodide (I-), benzene (C6H6+), and acetone dimer ((C3H6O)2H+) reagent ions at a 2 second data acquisition rate per cycle.  In the case of PolarChange, this combination of ions enabled simultaneous detection of trends in primary marine biological emissions such as dimethyl sulfide, nucleating species such as ammonia and methyl amine, and acids, such as nitric acid.  During AEROMMA, the fast bipolar switching capability enabled Eddy Correlation measurements of primary biogenic and urban emissions (i.e. monoterpenes and aromatics), secondary products of atmospheric oxidation (i.e. highly oxidized organics and organic nitrates), and reduced nitrogen species.  Preliminary results from this dataset, including positive matrix analyses of the combined multi-reagent ion datasets, are discussed.  Simultaneous gas and aerosol composition measurements obtained by coupling this mass spectrometer with aerosol inlets are also described.

How to cite: Canagaratna, M., Stark, H., Williams, L., Alton, M., Joo, T., Lopez-Hilfiker, F., Avery, A., Pospisilova, V., Gentner, D., and Lambe, A.: A Bipolar Multi-Reagent Chemical Ionization Mass Spectrometer for Versatile Measurements of Gas and Particle Phase Organics, EGU General Assembly 2024, Vienna, Austria, 14–19 Apr 2024, EGU24-4712, https://doi.org/10.5194/egusphere-egu24-4712, 2024.

EGU24-5216 | Orals | AS3.2

Understudied BVOC emissions in Europe and their potential atmospheric impacts 

Heidi Hellén, Toni Tykkä, Simon Schallhart, Steven Thomas, Wenche Aas, Robert Wegener, Thérèse Salameh, Kaisa Rissanen, Roseline Thakur, Mari Losoi, Lauri Laakso, Jukka Seppälä, Kaisa Kraft, Hannele Hakola, and Arnaud Praplan

Europe is one of the most studied areas related to biogenic volatile organic compound (BVOC) emissions. However, our knowledge of these atmospheric reactive compounds is still quite limited even there. Total hydroxyl radical (OH) reactivity studies indicate that half of the atmospheric reactive compounds are still unknown especially in the forested areas (Yang et al. 2016) and OH and ozone reactivity studies of our group have shown high fractions of reactivity from biogenic emissions (Praplan et al. 2020 and Thomas et al. 2023).

Globally, isoprene is the primary emitted BVOC. While boreal forests in Northern Europe are mainly considered as monoterpene emitters, Central Europe is expected to be dominated by isoprene (e.g. Messina et al. 2016). However, our results from a campaign at 17 stations over Europe in summer 2022 indicated that BVOC mixing ratios are highly variable and some areas also in Central Europe may be dominated by monoterpenes.

Sesquiterpenes and diterpenes have very high potential for secondary organic aerosol formation, but much less is known on their emissions and atmospheric concentrations. Our studies show that birches and spruces may be strong sesquiterpene emitters. We have also found that some urban trees in Montreal and wetlands in Lapland known as isoprene emitters may also release significant amounts of sesquiterpenes. Additionally, forest floor represents a potential source of sesquiterpenes.

Compared to terrestrial sources very little is known on the marine emissions of BVOCs. There are studies on dimethyl sulphide, but our recent results on an island in Baltic Sea suggest that other sulphuric compounds, like methanethiol, may be important too and could have strong impacts on SO2 production and therefore also on new particle and cloud formation. Furthermore, our recent campaign at the coast of Baltic Sea indicates that phytoplankton and macrophytes could be a source of isoprene and monoterpenes (Thakur et al., 2024 publication under prep).

Compounds classified as BVOCs (e.g. monoterpenes) can also be emitted from anthropogenic sources, such as construction sites (e.g. from wooden material), as well as cleaning and personal care products. Our studies in a street canyon in Helsinki in 2022 indicates that they strongly impact local atmospheric chemistry even in wintertime.


Messina, P., Lathière, J., Sindelarova, K., Vuichard, N., Granier, C., Ghattas, J., Cozic, A., and Hauglustaine, D. A.: Global biogenic volatile organic compound emissions in the ORCHIDEE and MEGAN models and sensitivity to key parameters, Atmos. Chem. Phys., 16, 14169–14202, https://doi.org/10.5194/acp-16-14169-2016, 2016

Praplan, A. P., Tykkä, T., Schallhart, S., Tarvainen, V., Bäck, J., and Hellén, H.: OH reactivity from the emissions of different tree species: investigating the missing reactivity in a boreal forest, Biogeosciences, 17, 4681–4705, https://doi.org/10.5194/bg-17-4681-2020, 2020.

Thomas, S. J., Tykkä, T., Hellén, H., Bianchi, F., and Praplan, A. P.: Undetected biogenic volatile organic compounds from Norway spruce drive total ozone reactivity measurements, Atmos. Chem. Phys., 23, 14627–14642, https://doi.org/10.5194/acp-23-14627-2023, 2023.

Yang, Y., Shao, M., Wang, X., Nölscher, A. C., Kessel, S., Guenther, A., and Williams, J.: Towards a quantitative understanding of total OH reactivity: A review, Atmos. Environ., 134, 147–161, https://doi.org/10.1016/j.atmosenv.2016.03.010, 2016.

How to cite: Hellén, H., Tykkä, T., Schallhart, S., Thomas, S., Aas, W., Wegener, R., Salameh, T., Rissanen, K., Thakur, R., Losoi, M., Laakso, L., Seppälä, J., Kraft, K., Hakola, H., and Praplan, A.: Understudied BVOC emissions in Europe and their potential atmospheric impacts, EGU General Assembly 2024, Vienna, Austria, 14–19 Apr 2024, EGU24-5216, https://doi.org/10.5194/egusphere-egu24-5216, 2024.

EGU24-6109 | ECS | Posters on site | AS3.2

Characterization of semi-volatile organic species in the particulate and gaseous phases in São Paulo, Brazil, and in the vicinity of Paris, France 

Olatunde Murana, Sebastien Dusanter, Marina Jamar, Samara Carbone, Lucas Chiari, Adalgiza Fornaro, Agnes Borbon, Christopher Cantrell, Manuela Cirtog, Vincent Michoud, Véronique Riffault, and Joel F. de Brito

Semi-volatile organic compounds (SVOCs) exist in both gaseous and particulate phases in the atmosphere, and are important intermediate species for the formation of secondary organic aerosols. In this study, both phases of SVOCs are studied in the vicinity of Paris, France, and within São Paulo, Brazil aiming to better understand the coupling between anthropogenic and biogenic emissions in distinct urban settings. Both regions are representative of strong anthropogenic and biogenic sources of pollutants. These areas were within the scope of the ACROSS (Atmospheric Chemistry of the Suburban Forest) and BIOMASP+ (Biogenic emissions, chemistry, and impacts in the Metropolitan Area of São Paulo) projects, respectively. The ACROSS campaign took place from June to July 2022 and data analyzed here were acquired at the Rambouillet (RMB) forested site, about 50 km southwest of Paris. BIOMASP+ conducted intensive observations in April and May 2023, and data were collected at the Institute of Astronomy, Geophysics, and Atmospheric Sciences (Matão-IAG) urban site, within the University of São Paulo campus. Continuous measurements of ambient organics through a CHemical Analysis of aeRosols ON-line (CHARON) inlet coupled to a high-resolution proton-transfer-reaction time-of-flight mass spectrometer (PTR-ToF-MS) were carried out at both sites, as well as complementary variables such as aerosol chemical composition, regulated pollutants, and meteorological parameters, among others.

The concentration of submicron bulk organic aerosol was comparable at both sites during ACROSS and BIOMASP+, reaching 5.0 µg/m3 and 7.3 µg/m3 for RMB and Matão-IAG, respectively. These are higher than typical 1-year averages observed at urban sites in Europe (3-4 µg/m3) [1] and previous observations near Matão-IAG in October 2012 (4.8 µg/m3) [2]. Biogenic VOCs showed distinct concentrations and temporal variabilities between sites with isoprene levels of 0.51 ppb vs 0.26 ppb of monoterpene in Brazil and Paris (0.35 ppb of isoprene vs 0.23 ppb of monoterpene) thus potentially leading to important differences in the subsequent secondary organic aerosol formation. Additionally, toluene, an anthropogenic marker, was higher at Matão-IAG (1.52 ppb) compared to RMB (0.25 ppb). This study will focus on SVOCs according to their mass spectra and temporal evolution and will compare the field observations to chamber experiments of biogenic and anthropogenic secondary organic aerosol formation. Those observations shall aid in understanding secondary formation processes and improve air quality modelling, as well as efficient pollution mitigation strategies in two contrasting large urbanized areas.

Keywords: SVOC, Sao Paulo, Paris, SOA, CHARON-PTR-ToF-MS

Acknowledgments: This work is funded and supported by Labex CaPPA, CPER ECRIN, ANR, and INSU LEFE-CHAT within the framework of BIOMASP and ACROSS projects. O. Murana’s field campaign in Brazil was supported by the Graduate Program “Science for a Changing Planet”, funded by the Program “Investissements d’avenir” (I-SITE ULNE / ANR-16-IDEX-0004 ULNE).

References

[1] Chen, G. et al., Environment International, vol. 166, p. 107325, 2022

[2] Almeida, G. P. et al., Atmos. Chem. Phys., vol. 14, no. 14, pp. 7559-7572, 2014

How to cite: Murana, O., Dusanter, S., Jamar, M., Carbone, S., Chiari, L., Fornaro, A., Borbon, A., Cantrell, C., Cirtog, M., Michoud, V., Riffault, V., and F. de Brito, J.: Characterization of semi-volatile organic species in the particulate and gaseous phases in São Paulo, Brazil, and in the vicinity of Paris, France, EGU General Assembly 2024, Vienna, Austria, 14–19 Apr 2024, EGU24-6109, https://doi.org/10.5194/egusphere-egu24-6109, 2024.

EGU24-6457 | ECS | Posters on site | AS3.2

PAHs and levoglucosan in particulate matter sources apportionment through GC-C-IRMS and GC-MS 

Davide Di Rosa, Fabio Marzaioli, Maria Di Rosa, Salvatore Di Rosa, and Mauro Rubino

Air pollution is a leading cause of human health problems. Among various dangerous substances that may be found in atmosphere, Particulate Matter (PM) is one of the main concerns , since small size particles (<10 μm Ø) can easily enter the lungs and convey pollutants like heavy metals, dioxins, nitrogen oxides, etc.


EU directive 2008/50/CE of May 21st  2008 defines objectives for environmental air quality designed to avoid, prevent or reduce harmful effects on human health and the environment as a whole. The directive fines EU countries in which PM atmospheric concentration (in particular PM 10 and PM 2.5) and pollutants concentrations transported by the PM overcome certain limits, but those fines are applied only if the PM has anthropogenic origins ; therefore, it is essential to be able to perform PM sources apportionment.


For this purpose, in collaboration with the region Campania environmental agency (ARPAC), we are developing analytical methods for:

• Extraction and purification of some Polycyclic Aromatic Hydrocarbons ( PAHs ) from quartz filters (which are the physical supports where PM is collected during sampling). These molecules derive from incomplete combustion of organic matter (included fuels) and are present in PM emission of both anthropogenic and non anthropogenic sources.
• Extraction, purification, and derivatization of levoglucosan from quartz filters. Levoglucosan is a molecule deriving from the combustion of biomasses containing cellulose and hemicellulose and it is present in PM emission of both anthropogenic and non anthropogenic sources , like chimneys emissions and forest fires.
• The determination of isotopic ratio of carbon stable isotopes (δ 13C ) using isotopic ratio mass spectrometry coupled with gas chromatography GC-C-IRMS of PAHs and levoglucosan, which carbon isotopic fingerprint is dependent on the origin of these molecules.
• Target molecules identification by GC-MS.
• Quantitative analysis of PAHs on PM using GC MS method (US EPA 8270 E).
• Quantitative analysis of levoglucosan using Ionic Chromatography coupled with a Pulsed Amperometric Detector (IC-PAD).


ARPAC is collecting samples of PM 10 and PM 2.5 in different sites, both urban and rural, usinig both low volume (2.3 m3/h for 24h on 47mm Ø quartz filters) and high volume (100 L/min for 24h on 102mm Ø quartz filters) sampling methods. ARPAC will also provide PM samples collected at the main PM sources to get more accurate data about PAHs and levoglucosan isotopic fingerprint in their atmospheric emissions.


The attribution of these substances to anthropogenic sources and their quantification can provide essential information about the origins of the collected PM and, in case of PM limits exceeding, when it is possible, regional authorities of Campania could use the information collected to take steps to lower PM level.

How to cite: Di Rosa, D., Marzaioli, F., Di Rosa, M., Di Rosa, S., and Rubino, M.: PAHs and levoglucosan in particulate matter sources apportionment through GC-C-IRMS and GC-MS, EGU General Assembly 2024, Vienna, Austria, 14–19 Apr 2024, EGU24-6457, https://doi.org/10.5194/egusphere-egu24-6457, 2024.

EGU24-7218 | ECS | Posters on site | AS3.2

Gaseous Nitrophenols sources and their contribution to HONO formation in an urban area 

Morshad Ahmed, Bernhard Rappenglueck, Lucksagoon Ganranoo, and Purnendu K Dasgupta

Nitrophenols (NPs) are compounds that comprise of hydroxyl (-OH) and nitro (-NO2) functional groups attached to at least one aromatic ring. NPs have significant impacts on human health, climate, and atmospheric chemistry. Despite numerous measurements of particulate NPs, little is still known about their gaseous atmospheric sources, chemistry, and fate. In this study, four gaseous NPs - 2,4-dinitrophenol (2,4-DNP), 4-nitrophenol (4-NP), 2-nitrophenol (2-NP), and 2-Methyl-4-nitrophenol (2-Me-4-NP) were continuously monitored during late spring in an urban area of Houston, Texas. Among the four NPs, 4-NP showed the highest abundance, followed by 2-Me-4-NP, 2-NP, and 2,4-DNP, with average concentrations of 0.47 ± 0.12 ppt, 0.41 ± 0.16 ppt, and 0.27 ± 0.09 ppt, respectively. Utilizing the Positive Matrix Factorization (PMF) model, seven sources: industrial NPs, secondary formation, phenol sources, acetonitrile source, natural gas/crude oil, traffic, and petrochemical industries/oil refineries were identified with NPs’ contributions to each factor of 83.3%, 6.6%, 3.3%, 3.2%, 2.0%, 0.9%, and 0.7%, respectively. A zero-dimensional Atmospheric Chemistry (AtChem2) box model was used to simulate the observed 2-NP and 2,4-DNP. The model revealed a 50.0% and 70.0% contribution from JNO2, aligning with measured 2-NP and 2,4-DNP, respectively. This resulted in a nitrous acid (HONO) production of 7.5 ± 2.5 ppt/h between 06:00 and 18:00 Central Standard Time (CST) from both NPs. An extrapolation including other known NPs suggests a maximum HONO formation of 13.8 ppt/h, still magnitudes lower than other known HONO formation processes. Nevertheless, it represents a non-negligible fraction and should be considered in areas with substantial primary NPs emissions, and the corresponding reaction mechanisms should be included in any such model. Combining PMF analysis with a photochemical box model provides identification of NPs sources and their atmospheric impact on HONO formation, offering policymakers insights for implementing effective control measures.

How to cite: Ahmed, M., Rappenglueck, B., Ganranoo, L., and Dasgupta, P. K.: Gaseous Nitrophenols sources and their contribution to HONO formation in an urban area, EGU General Assembly 2024, Vienna, Austria, 14–19 Apr 2024, EGU24-7218, https://doi.org/10.5194/egusphere-egu24-7218, 2024.

EGU24-7417 | ECS | Posters on site | AS3.2

Investigating vertical gradients of trace gases and aerosol at the Amazon Tall Tower Observatory (ATTO) using MAX-DOAS measurements 

Sebastian Donner, Bianca Lauster, Steffen Ziegler, Paulo Artaxo, Steffen Beirle, Christian Gurk, Mark Lamneck, and Thomas Wagner

Multi-AXis (MAX)-Differential Optical Absorption Spectroscopy (DOAS) measurements use trace gas absorptions in spectra of scattered sun light recorded under different elevation angles to retrieve vertical profiles of trace gas concentrations and aerosol extinctions in the lower troposphere as well as the corresponding total tropospheric vertical column densities (VCDs). A major advantage of this kind of measurements is the possibility to observe multiple trace gases e.g., formaldehyde (HCHO), glyoxal (CHOCHO) and nitrogen dioxide (NO2), for the same air mass simultaneously with one instrument. A first MAX-DOAS instrument was installed at the Amazon Tall Tower Observatory (ATTO) at an altitude of 80 m above ground in October 2017. Since March 2019, a second instrument is operational at an altitude of 298 m. Besides the individual profile retrievals for both instruments, this measurement strategy allows the identification of (small scale) vertical gradients of trace gas and aerosol abundances by directly comparing the VCDs and concentrations (at instrument altitude) measured by both instruments. Such (small scale) vertical gradients provide important insights into the chemical processing of the different species. Located in a pristine rain forest region in the central Amazon Basin about 150 km north-east of Manaus, the ATTO site offers a rare possibility to study the chemical processing of tropospheric trace gases far from major anthropogenic emission sources. 

In the presented study, a general overview of the trace gas and aerosol results covering several years is provided. Thereby, a specific focus is put on the HCHO and glyoxal results including the annual variations of their abundances in the course of the characteristic alternation between wet and dry seasons. Based on the ratio of their abundances, our measurements indicate that different precursor compositions of both species prevail in the different seasons, whereby in the wet season the relative amount of precursors favouring the formation of glyoxal, e.g. monoterpenes, appears to be larger than in the dry season. In addition, (small scale) vertical gradients in the altitude range between both instruments are presented. Our results suggest that HCHO is mostly formed in the lowest 200 m above the canopy, while glyoxal is already degraded in this altitude range. Together with their characteristic profile shapes, these findings indicate different chemical processing (production and degradation) of HCHO and glyoxal, despite similar sources of their precursors.   

How to cite: Donner, S., Lauster, B., Ziegler, S., Artaxo, P., Beirle, S., Gurk, C., Lamneck, M., and Wagner, T.: Investigating vertical gradients of trace gases and aerosol at the Amazon Tall Tower Observatory (ATTO) using MAX-DOAS measurements, EGU General Assembly 2024, Vienna, Austria, 14–19 Apr 2024, EGU24-7417, https://doi.org/10.5194/egusphere-egu24-7417, 2024.

EGU24-7707 | ECS | Orals | AS3.2

Formation and temperature dependence of Highly Oxygenated Organic Molecules from ∆3-carene ozonolysis 

Yuanyuan Luo, Ditte Thomsen, Emil Mark Iversen, Pontus Roldin, Jane Tygesen Skønager, Linjie Li, Michael Priestley, Henrik B. Pedersen, Mattias Hallquist, Merete Bilde, Marianne Glasius, and Mikael Ehn

Monoterpenes, comprising 15% of global biogenic volatile organic compound emissions, play a pivotal role in atmospheric chemistry. ∆3-carene, the second most prevalent monoterpene, has been identified as a significant source of secondary organic aerosol (SOA) upon oxidation, potentially surpassing α-pinene under similar conditions. Despite its importance, research has predominantly focused on α-pinene , leaving gaps in our understanding of ∆3-carene's oxidation pathways, particularly its capacity to form highly oxygenated organic molecules (HOM).

To address this knowledge gap, we conducted an investigation into HOM formation during the ozonolysis of ∆3-carene using atmospheric simulation chambers. Employing a chemical ionization atmospheric pressure interface time-of-flight mass spectrometer with nitrate as the reagent ion (NO3-CIMS), we measured HOM resulting from ∆3-carene ozonolysis. Additionally, we explored the impact of temperature and relative humidity on HOM composition and distribution across various conditions (0, 10, and 20 ºC, and humidity levels below 15% and around 80%).

Our analysis revealed diverse HOM monomers and dimers from ∆3-carene ozonolysis. Predominant HOM monomers included C10H14,16O9 and C9H12,14O9, while the largest dimers comprised C19H30O6,10,11 and C20H32O7,9,11. Significantly, HOM monomers with 9 or more oxygen atoms and all dimers irreversibly condensed onto particles, while those with 6-8 oxygen atoms behaved as semi-volatile organic species, maintaining notable gas-phase concentrations. Intriguingly, ∆3-carene ozonolysis produced higher HOM concentrations than α-pinene, suggesting distinct formation pathways for these two monoterpenes. Furthermore, we observed a substantial decrease in HOM concentrations at lower temperatures, consistent with previous studies on α-pinene ozonolysis. Despite similar main HOM species at temperatures of 20, 10, and 0 ℃, the ratio of HOM dimers to monomers increased from 0.78 to 1.51 as temperatures decreased. This temperature-dependent variation underscores the complexity of ∆3-carene's atmospheric processing, revealing nuanced behaviors of HOM under different environmental conditions.

In conclusion, this study provides valuable insights into the HOM formation pathways of ∆3-carene, shedding light on its unique atmospheric chemistry. The observed differences in HOM concentrations and temperature-dependent behaviors highlight the need for a more comprehensive understanding of various monoterpenes, moving beyond the well-studied α-pinene. These findings contribute to the broader knowledge of biogenic volatile organic compounds and their impact on atmospheric processes.

How to cite: Luo, Y., Thomsen, D., Iversen, E. M., Roldin, P., Skønager, J. T., Li, L., Priestley, M., Pedersen, H. B., Hallquist, M., Bilde, M., Glasius, M., and Ehn, M.: Formation and temperature dependence of Highly Oxygenated Organic Molecules from ∆3-carene ozonolysis, EGU General Assembly 2024, Vienna, Austria, 14–19 Apr 2024, EGU24-7707, https://doi.org/10.5194/egusphere-egu24-7707, 2024.

Synthetic musk compounds, like cashmeran, are a group of semi-volatile organic compounds commonly used as fragrances in perfumes. In addition to being potential indoor pollutants, they are also regarded as emerging outdoor pollutants, known at volatile chemical products (VCPs). Cashmeran is a bicyclic synthetic musk compound, and a major component of a commercial perfume for men. Here, we aim to better predict the atmospheric fate of cashmeran indoors and outdoors using a Vocus proton transfer time-of-flight mass spectrometer.

Using the Vocus, we show that cashmeran was the dominant musk in a commercial perfume among other musk compounds like galaxolide, astratone, and rosamusk. Next, we measured the rate constant of cashmeran (C14H22O) with ozone for the first time under different experimental conditions to probe its ozonolysis mechanism. In the absence of O2, we calculated a rate constant of (2.78 ± 0.31) x 10-19 cm3mol-1s-1 at (293 ± 1) K and observed the formation of C14H22O2 as the key oxidation production. The ozonolysis reaction in the absence of O2 did not generate SOA. In the presence of O2, preliminary results show the rate constant to be 5.00 x 10⁻¹⁸ cm3mol-1s-1 at 293 K and the ozonolysis reaction formed SOA with a mass yield of 121 µg m-3. The rate constant observed in the presence of O2 indicate the importance of key carbon-radical chemistry and impact of partitioning sinks in understanding the fate of this molecule in the atmosphere. We hypothesize that the slow oxidation of cashmeran with ozone makes loss to partitioning to aerosols a competitive sink in determining its fate.

Furthermore, we investigated how partitioning sinks might be competitive to gas-phase oxidation for the fate of cashmeran from a commercial perfume in an office environment. We show that partitioning to cotton is the major sink, suggesting this molecule can be easily transported outdoors by humans and their clothing.

We further tested this hypothesis during THE CIX urban field campaign in Toronto, Canada in July-August 2023. We detected cashmeran outdoors throughout the campaign up to 10 ppt. As expected from a fragrant VCP, cashmeran peaked during the week only and in the morning. Based on our findings, we conclude that musk compounds, like cashmeran, are long-lived SVOCs capable of impacting urban air quality.

How to cite: Borduas-Dedekind, N., Akande, A., and Depp, C.: The atmospheric fate of cashmeran from musk-smelling volatile chemical products (VCPs) in chamber, indoor, and outdoor environments, EGU General Assembly 2024, Vienna, Austria, 14–19 Apr 2024, EGU24-7733, https://doi.org/10.5194/egusphere-egu24-7733, 2024.

EGU24-7764 | Posters on site | AS3.2

Impact of meteorological conditions on BVOC emission rate from Eastern Mediterranean vegetation under drought  

Eran Tas, Qian Li, Efraim Lewinsohn, Einat Bar, and Maor Gabay

Biogenic volatile organic compounds (BVOCs) exert a significant influence on photochemical air pollution and climate change, with their emissions strongly affected by meteorological conditions. However, the effect of drought on BVOC emissions is not well-characterized, limiting the predictive power of this feedback on climate change and air quality. This study focused on two main objectives: i) test our hypothesis that under severe drought conditions, BVOC emissions will be more sensitive to instantaneous intraday variations in meteorological parameters than to the absolute values of those parameters; ii) test the impact of a plant under drought stress receiving a small amount of precipitation on BVOC emission rate, and the manner in which the emission rate is influenced by meteorological parameters. 

To address these objectives we employed: i) proton transfer reaction time-of-flight mass spectrometry (PTR-ToF-MS) to quantify the mixing ratios of a suite of soluble and insoluble VOCs (including isoprene, monoterpenes, sesquiterpenes, acetone, acetaldehyde, methanol, ethanol, formaldehyde, formic acid, acetic acid, 1,3-butadiene, dimethyl sulfide (DMS), and H2S) under severe drought conditions in a natural Eastern Mediterranean forest in autumn 2016 ; and ii) branch-enclosure sampling measurements in Ramat Hanadiv Eastern Mediterranean Nature Park, both under natural drought and after irrigation, for six selected branches of Phillyrea latifolia, the highest BVOC emitter in this park, during September–October 2020.

Notably, both independent analyses revealed that instantaneous changes in meteorological conditions, especially in relative humidity (RH), can serve as a better proxy for drought-related changes in BVOC emission rate than the absolute values of meteorological parameters. However, after irrigation (equivalent to 5.5–7 mm precipitation), the correlation of the detected BVOC emission rate with the instantaneous changes in RH became significantly more moderate, or even reversed. Our findings highlight that under drought, the instantaneous changes in RH, and to a lesser extent in temperature (T), are the best proxy for the emission rate of monoterpenes (MTs) and sesquiterpenes (SQTs), whereas under moderate drought conditions, T or RH serves as the best proxy for MT and SQT emission rate, respectively. In addition, the detected emission rates of MTs and SQTs increased by 150% and 545%, respectively, after the small amount of irrigation. The findings further highlight the importance of analyzing the effect of meteorological conditions on BVOC emissions under drought conditions on a daily—or shorter—timescale, and support biogenic emission sources for 1,3-butadiene.

How to cite: Tas, E., Li, Q., Lewinsohn, E., Bar, E., and Gabay, M.: Impact of meteorological conditions on BVOC emission rate from Eastern Mediterranean vegetation under drought , EGU General Assembly 2024, Vienna, Austria, 14–19 Apr 2024, EGU24-7764, https://doi.org/10.5194/egusphere-egu24-7764, 2024.

EGU24-7967 | ECS | Posters on site | AS3.2

Elucidating formation of highly oxygenated organic molecules (HOMs) from α-pinene ozonolysis with isotopic labelling 

Melissa Meder, Frans Graeffe, Jingyi Luo, Yuanyuan Luo, Jonathan Varelas, Otso Peräkylä, Theo Kurtén, Matti Rissanen, Franz Geiger, Regan Thomson, and Mikael Ehn

Upon oxidation, some volatile organic compounds (VOCs) have been shown to go through a rapid process called autoxidation forming highly oxygenated organic molecules (HOMs). The exact autoxidation pathway taken affects the formation rates and the properties of the HOMs, however, a comprehensive step-by-step mechanism of HOM formation has not been described for any system of atmospheric relevance. In the autoxidation process, peroxy radical (RO2) intermediates undergo intramolecular hydrogen abstractions (H-shifts) followed by oxygen (O2) additions. This process can be monitored using chemical ionisation mass spectrometry and selective deuteration, where the precursor molecule has had the hydrogen atoms (1H) of a specific carbon replaced with deuterium atoms (2H). In this work, we studied the initial formation pathways of HOMs in reactions of the monoterpene α-pinene with ozone. We had access to all separately deuterated carbon positions in α-pinene that have hydrogens, i.e. we had in total eight different selectively deuterated α-pinenes. We were able to determine which of the deuterated precursors were prone to losing D during the (aut)oxidation process, which helped us understand the pathways leading to HOM formation.

How to cite: Meder, M., Graeffe, F., Luo, J., Luo, Y., Varelas, J., Peräkylä, O., Kurtén, T., Rissanen, M., Geiger, F., Thomson, R., and Ehn, M.: Elucidating formation of highly oxygenated organic molecules (HOMs) from α-pinene ozonolysis with isotopic labelling, EGU General Assembly 2024, Vienna, Austria, 14–19 Apr 2024, EGU24-7967, https://doi.org/10.5194/egusphere-egu24-7967, 2024.

EGU24-8261 | Posters on site | AS3.2

Significant missing OH reactivity in the tropical marine boundary layer 

Lisa Whalley, Samuel Seldon, Graham Boustead, Rachel Lade, Dwayne Heard, Katie Read, Anna Callaghan, Shalini Punjabi, James Lee, Lucy Carpenter, and Luis Neves

It has recently been highlighted that observed OH reactivity (kOH) in the remote marine boundary layer cannot be fully explained by the measured or modelled speciated VOCs [1]. Understanding the identity and magnitude of the species that contribute to OH reactivity (and influence the concentration of OH) in the tropical marine boundary layer is particularly important however, as approximately 25 % of the total tropospheric methane removal, driven by the reaction with OH, occurs in this region [2].  Ground-based observations of kOH and comparisons with calculated or modelled kOH from individually measured VOCs and inorganics offers the opportunity to investigate diel trends and variabilities driven by changing air-masses, which can provide a valuable insight into the identity and impact of any missing kOH. We made the first observations of kOH at the Cape Verde Atmospheric Observatory in the remote tropical marine boundary layer in February 2023. The observed kOH ranged from 1.5 s-1 to 2.5 s-1 with the highest reactivity recorded when long-range transport of Saharan air-masses reached the observatory. The calculated kOH from the different inorganic and VOC species measured during the campaign did not capture the total kOH observed and even when the contribution from model-generated species (determined from a detailed 0D box model utilising the Master Chemical Mechanism) were considered, missing reactivity on the order of 0.2 – 0.5 s-1 remained, consistent with the levels of missing kOH previously determined in the marine boundary layer during the ATom aircraft campaign [1]. The diel profile highlighted that missing kOH was greatest during the night and morning and was at its lowest during the afternoon. Missing kOH correlated well with the OH reactivity contribution from species such as alkenes, CO and DMS, but was anti-correlated with the carbonyl reactivity suggesting the nature of the missing reactivity could be related to an unknown or unmeasured primary emission rather than a secondary species formed during the day via OH oxidation. Through modelling studies, we will present the impact that different missing primary emissions have on modelled OH concentrations and on the production of secondary oxygenated VOCs.

[1] Thames, A.B., et al., Missing OH reactivity in the global marine boundary layer, Atmospheric Chemistry and Physics, 2020, 20, 4013-4029.

[2] Bloss, W.J., et al., The oxidative capacity of the troposphere: Coupling of field measurements of OH and a global chemistry transport model. Faraday Discussions, 2005. 130: p. 425-436.

How to cite: Whalley, L., Seldon, S., Boustead, G., Lade, R., Heard, D., Read, K., Callaghan, A., Punjabi, S., Lee, J., Carpenter, L., and Neves, L.: Significant missing OH reactivity in the tropical marine boundary layer, EGU General Assembly 2024, Vienna, Austria, 14–19 Apr 2024, EGU24-8261, https://doi.org/10.5194/egusphere-egu24-8261, 2024.

EGU24-8394 | ECS | Posters on site | AS3.2

On the potential use of highly oxygenated organic molecules (HOM) as indicators for ozone formation sensitivity 

Jiangyi Zhang, Jian Zhao, Yuanyuan Luo, Valter Mickwitz, Douglas Worsnop, and Mikael Ehn

Ozone (O3), an important and ubiquitous trace gas, protects lives from harm of solar ultraviolet (UV) radiation in the stratosphere but is toxic to living organisms in the troposphere. Additionally, tropospheric O3 is a key oxidant, and source of other oxidants (e.g., OH and NO3 radicals) for various volatile organic compounds (VOC). Recently, highly oxygenated organic molecules (HOM) were identified as a new compound group formed from oxidation of many VOC, making up a significant source of secondary organic aerosol (SOA). The pathways forming HOM from VOC involve autoxidation of peroxy radicals (RO2), formed ubiquitously in many VOC oxidation reactions. The main sink for RO2 is bimolecular reactions with other radicals, HO2, NO or other RO2, and this largely determines the structure of the end products. Organic nitrates form solely from RO2 + NO reactions while accretion products (“dimers”) solely from RO2 + RO2 reactions. The RO2 + NO reaction also converts NO into NO2, making it a net source for O3 through NO2 photolysis.

There is a highly nonlinear relationship between O3, NOx, and VOC. Understanding the O3 formation sensitivity to changes in VOC and NOx is crucial for making optimal mitigation policies to control O3 concentrations. However, determining the specific O3 formation regimes (either VOC- or NOx-limited) remains challenging in diverse environmental conditions. In this work we assessed whether HOM measurements can function as a real-time indicator for the O3 formation sensitivity based on the hypothesis that HOM compositions can describe the relative importance of NO as a terminator for RO2. Given the fast formation and short lifetimes of the low-volatile HOM (timescale of minutes), they describe the instantaneous chemical regime of the atmosphere. In this work, we conducted a series of monoterpene oxidation experiments in our chamber while varying the concentrations of NOx and VOC under different NO2 photolysis rates. We also measured the relative concentrations of HOM of different types (dimers, nitrate-containing monomers, and non-nitrate monomers) and used ratios between these to estimate the O3 formation sensitivity. We find that for this simple system, the O3 sensitivity could be described very well based on the HOM measurements. Future work will focus on determining to what extent this approach can be applied in more complex atmospheric environments. 

How to cite: Zhang, J., Zhao, J., Luo, Y., Mickwitz, V., Worsnop, D., and Ehn, M.: On the potential use of highly oxygenated organic molecules (HOM) as indicators for ozone formation sensitivity, EGU General Assembly 2024, Vienna, Austria, 14–19 Apr 2024, EGU24-8394, https://doi.org/10.5194/egusphere-egu24-8394, 2024.

EGU24-8625 | Posters on site | AS3.2

Evidences for the influence from key chemical structures of per- and polyfluoroalkyl substances on their environmental behaviors 

Yulong Yan, Yiru Zhuang, Jing Wu, Bingqi Dong, Fan Wang, Yu Bo, and Lin Peng

In recent years, perfluoroalkyl and polyfluoroalkyl substances (PFASs) have received widespread attention from the international community due to their persistence, long range atmospheric transport (LRAT), bioaccumulation and toxic. This study carried out the atmospheric and precipitation observation in Beijing for nearly one year, and firstly simultaneously observed the pollution characteristics of ultra short-chain, short-chain, long-chain PFASs and their main isomers, focusing on their gas-particle partitioning mechanism and dry and wet deposition characteristics. The results showed that the total concentration of PFASs was 3,415±2,932 pg m-3, of which ultra short-chain PFASs accounted for the highest proportion (55%), followed by short chains (41%) and long chains (3.9%). The proportion of short-chain PFASs was greater than that of long-chain PFASs which may be because short-chains have been produced and consumed as substitutes for long-chain PFASs. After deducting PFASs in the aqueous phase of particulate matter, the gas-particle partitioning coefficients (-7.04 m3 μg to -5.49 m3 μg) were about 3–4 units smaller than the previous results (-2.77 m3 μg to -1.51 m3 μg), which could more accurately reflect the phase partitioning characteristics between the gas phase and the hydrophobic phase of particulate matter. All PFASs and their main isomers were more distributed in the gas phase, followed by the aqueous phase of particulate matter and the hydrophobic phase of particulate matter. Dry deposition was dominant in the atmospheric deposition of each PFAS and isomer, but the relative contribution of dry deposition was significantly different. It was found that the gas-particle partitioning coefficient can be influenced by key chemical structures such as carbon chain length, functional group type, and isomer structure. Furthermore, the gas-particle partitioning can influence the dry and wet deposition of PFASs. Specifically, PFASs with longer carbon chains, carboxylic acid functional group or branched chain structures had larger gas-particle partitioning coefficients and can be more distributed in the hydrophobic phase of particulate matter, and their relative contributions of dry deposition were smaller.

How to cite: Yan, Y., Zhuang, Y., Wu, J., Dong, B., Wang, F., Bo, Y., and Peng, L.: Evidences for the influence from key chemical structures of per- and polyfluoroalkyl substances on their environmental behaviors, EGU General Assembly 2024, Vienna, Austria, 14–19 Apr 2024, EGU24-8625, https://doi.org/10.5194/egusphere-egu24-8625, 2024.

EGU24-8748 | Orals | AS3.2

Reversing the particulate-phase organosulfate chronology: Direct organosulfur compound synthesis in the gas-phase by SO3 + acid reactions 

Matti Rissanen, Siddharth Iyer, Shawon Barua, Emin Besic, Prasenjit Seal, and Avinash Kumar

Organosulfates (OS) are a major constituent of atmospheric secondary organic aerosol (SOA). In lack of apparent gas-phase compounds directly contributing to the particulate bound OS, their synthesis has been thought of taking place by acid-catalyzed reactions in the condensed phase, mainly initiated by H2SO4. The most well-known sulfur bearing molecules are the isoprene epoxydiol derived organosulfates (Riva et al., 2019). In 2015 Mackenzie et al., showed that under very dry condition SO3 can react to form sulfuric anhydrides by carboxylic acid + SO3 reactions (Mackenzie et al., 2015). More recently, several theoretical papers have reported a more general gas-phase source by SO3 reactions with a multitude of atmospheric acids. The potential importance of this newly found chemistry was highlighted by observations of gas-phase SO3 in urban Beijing at concentrations similar to H2SO4 (Yao et al., 2020), strongly implying that SO3 reactions are occurring in urban atmospheres.

In the present work we have performed a joint experimental-theoretical characterization of acid + SO3 reactions utilizing flow reactor setups coupled to nitrate (NO3-) chemical ionization mass spectrometry (CIMS) detection combined with supporting quantum chemical computations and master equation simulations. The studied reactions included mono- and dicarboxylic acids, and the strong acids most associated with atmospheric new particle formation events (i.e., H2SO4 and HIO3; Sipilä et al., 2016; Kerminen et al., 2018). Intriguingly, all acids were found to react rapidly with SO3 even with rate coefficients approaching the collision limit and were found to result in analogous acid sulfuric anhydride products. These sulfuric anhydrides provide a path for OS partitioning from gas to particle (i.e., “backwards” in considering the common particulate-phase synthesis route). Furthermore, the subsequent particulate-phase hydrolysis of the formed organic sulfuric anhydrides is a potential source of the small acids into the nanoparticles that would not be expected to partition significantly otherwise. The formed sulfuric anhydrides, especially the disulfuric acid and iodic acid sulfate, are likely to have similar, if not better, properties at initiating NPF as their parent compounds have.

References:

Kerminen, V.-M. et al., Atmospheric new particle formation and growth: review of field observations, Environ. Res. Lett. 2018, 13, 103003.

Mackenzie, R. et al., Gas Phase Observation and Microwave Spectroscopic Characterization of Formic Sulfuric Anhydride, Science 2015, 349, 58−61.

Riva, M. et al., Increasing Isoprene Epoxydiol-to-Inorganic Sulfate Aerosol Ratio Results in Extensive Conversion of Inorganic Sulfate to Organosulfur Forms: Implications for Aerosol Physicochemical Properties, Environ. Sci. Technol. 2019, 53, 8682-8694.

Sipilä, M. et al., Molecular-scale evidence of aerosol particle formation via sequential addition of HIO3, Nature 2016, 537, 532-534.

Yao, L. et al., Unprecedented ambient sulfur trioxide (SO3) detection: Possible formation mechanism and atmospheric implications, Environ. Sci. Technol. Lett. 2020, 7, 809-818.

How to cite: Rissanen, M., Iyer, S., Barua, S., Besic, E., Seal, P., and Kumar, A.: Reversing the particulate-phase organosulfate chronology: Direct organosulfur compound synthesis in the gas-phase by SO3 + acid reactions, EGU General Assembly 2024, Vienna, Austria, 14–19 Apr 2024, EGU24-8748, https://doi.org/10.5194/egusphere-egu24-8748, 2024.

EGU24-9054 | Posters on site | AS3.2

How aromatic carbonyls autoxidize in the atmosphere? 

Prasenjit Seal, Shawon Barua, Avinash Kumar, Siddharth Iyer, and Matti Rissanen

Aromatic carbonyls, emitted either directly in the atmosphere or secondarily formed through hydrocarbon oxidations, represent one of the key members in the family of volatile organic compounds (VOCs). They are common constituents of natural and polluted atmospheres, and their gas-phase oxidation yields highly oxygenated organic molecules (HOM), which are key to the formation of atmospheric aerosol. Although, there are investigations in explaining the autoxidation chemistry of aliphatic carbonyls (Barua et al., 2023; Castañeda et al., 2012, Wang et al., 2015), insights underpinning the molecular level mechanism for the aromatic carbonyl autoxidation, on the other hand, have remained scarce (Iuga et al., 2008). The present work is an attempt to start filling this gap.

Herein, we conducted a combined theoretical-experimental analyses in atmospheric conditions for the OH radical initiated autoxidation of aromatic carbonyls, namely, benzaldehyde (PhCHO), acetophenone (PhCOCH3), and phenylethanal (PhCH2CHO). The energetics of the species in the proposed mechanism were obtained using high-level quantum chemical calculations. Subsequently, master equation simulations and multiconformer transition state theory (MC-TST) were used to estimate the rate coefficients and branching ratios for the autoxidation pathways.

A nitrate-based time-of-flight chemical ionization mass spectrometer (nitrate-CIMS) was used to detect the products in these oxidation reactions. Chemical ionization was achieved by supplying synthetic air (sheath flow) containing nitric acid (HNO3) under exposure to X-rays. This produces nitrate (NO3) ions which are mixed with the sample flow and ionizes HOMs as NO3adducts. The precursors are mixed in a quartz flow tube reactor where the oxidant OH is produced in-situ by the ozonolysis reaction of tetramethylethylene (TME).

The study indicates that autoxidation in aromatic carbonyls proceeds via a bicyclic peroxy radical (BPR) intermediate similar to that observed in case of toluene autoxidation (Iyer et al., 2023). The mechanism involves opening of the BPR ring to produce ring-broken intermediates having high excess energy. These nascent intermediates can then lead to several autoxidation pathways resulting in the HOM formation. Our flow reactor measurements for PhCHO oxidation at variable reaction times show the ample formation of HOM monomers and dimers, well in-line with the proposed mechanism. 


REFERENCES

Barua, S. et al. (2023). Atmos. Chem. Phys., 23, 10517–10532.

Castañeda, R. et al. (2012). J. Mex. Chem. Soc., 56, 316–324.

Iuga, C. et al. (2008). Chem. Phys. Chem., 9, 1453–1459.

Iyer, S. et al. (2023). Nat. Commun., 14, 4984.

Wang, S. et al. (2015). Proc. Combust. Inst., 35, 473–480.

How to cite: Seal, P., Barua, S., Kumar, A., Iyer, S., and Rissanen, M.: How aromatic carbonyls autoxidize in the atmosphere?, EGU General Assembly 2024, Vienna, Austria, 14–19 Apr 2024, EGU24-9054, https://doi.org/10.5194/egusphere-egu24-9054, 2024.

EGU24-9137 | ECS | Posters on site | AS3.2

Changes in atmospheric aerosols from reduced BVOC precursors in future deforestation scenarios 

Ryan Vella, Matthew Forrest, Alexandra Tsimpidi, Andrea Pozzer, Thomas Hickler, Jos Lelieveld, and Holger Tost

Biogenic volatile organic compounds (BVOC) are emitted in large quantities from the terrestrial biosphere and play a significant role in major atmospheric processes. Such emissions account for 90\% of the total volatile organic compound (VOC) emissions and exert a significant influence on the atmosphere's oxidation capacity. The oxidation of BVOCs yields intermediate species with lower vapour pressures, resulting in organic condensation and the formation of secondary organic aerosols (SOA). SOA directly affect the radiation budget through scattering and absorption, as well as indirectly by modifying cloud formation and distribution. It has been shown that changes in atmospheric states due to SOA contribute to feedbacks with vegetation, exerting a significant impact on global BVOC budgets. Despite their contribution to the uncertainty surrounding the impact of carbonaceous aerosols on future climate forcings, BVOC-climate feedbacks are often neglected in modelling studies. In this work, we use the chemistry-climate model EMAC coupled with the dynamic global vegetation model (DGVM) LPJ-GUESS, enabling interactive calculations of BVOC emission fluxes that respond to changes in atmospheric and vegetation states. We employ deforestation scenarios using different projections for pasture land to disturb the natural potential vegetation simulated in LPJ-GUESS. Utilising a sophisticated description of secondary organic aerosols, the direct relation of atmospheric particles originating from interactive isoprene and terpene fluxes with the atmospheric state can be analysed. Consequently, we use state-of-the-art process descriptions in EMAC to study the impacts of biogenic SOA on global radiation budgets and clouds, shedding light on potential future changes in the atmosphere resulting from perturbations in the biosphere.

How to cite: Vella, R., Forrest, M., Tsimpidi, A., Pozzer, A., Hickler, T., Lelieveld, J., and Tost, H.: Changes in atmospheric aerosols from reduced BVOC precursors in future deforestation scenarios, EGU General Assembly 2024, Vienna, Austria, 14–19 Apr 2024, EGU24-9137, https://doi.org/10.5194/egusphere-egu24-9137, 2024.

EGU24-9218 | ECS | Posters on site | AS3.2

Atmospheric Oxidation of Imidazole by Hydroxyl Radicals: Fate of Peroxyl Radical Products 

Thomas Golin Almeida, Carles Martí, Theo Kurtén, Judit Zádor, and Sommer L. Johansen

In recent years, imidazole and its derivatives have received attention due to their role as components of brown carbon in atmospheric aerosol particles. These compounds absorb solar radiation in the UV-visible range, altering the aerosol optical properties, and acting as photosensitizers, prompting accelerated aerosol particle growth. Although atmospheric imidazoles are thought to be mainly produced in the particle-phase (e.g. via reaction of glyoxal with amines), these compounds were recently observed also in the gas-phase. Studies investigating the fate of imidazole in the gas-phase explored the initial steps of its oxidation by OH radical, identifying the major outcome to be the formation of an OH-addition product. However, this product is an alkyl (C-centered) radical, and its fate following reaction with O2 is still unexplored. In this work, we employed computational methods to investigate the reaction channels available to the first-generation peroxyl radicals produced from the reaction of imidazole with OH radical and O2. The unimolecular reaction pathways were explored with the automated reaction search and kinetics code KinBot. Product distributions under a range of temperatures and NOx concentrations were subsequently obtained by assembling and solving a master equation. Our findings predict that under most conditions considered, the formation of two major closed-shell products is expected: the cyclic diimine 4H-imidazole-4-ol, and the ring-opened species N,N’-diformylformamidine (FMF). The relative yields of these two products is, however, sensitive to NOx levels. While both compounds may be produced under pristine conditions (low NOx), the yield of FMF is predicted to be above 95 % under more polluted conditions (high NOx). These compounds may be further oxidized in the gas-phase, or they may partition into aerosol particles to participate in aqueous-phase reactions.

How to cite: Golin Almeida, T., Martí, C., Kurtén, T., Zádor, J., and Johansen, S. L.: Atmospheric Oxidation of Imidazole by Hydroxyl Radicals: Fate of Peroxyl Radical Products, EGU General Assembly 2024, Vienna, Austria, 14–19 Apr 2024, EGU24-9218, https://doi.org/10.5194/egusphere-egu24-9218, 2024.

EGU24-9501 | ECS | Orals | AS3.2

Volatile Organic Compounds shipping emissions observed in an industrial harbour of northern France  

Erwan Volent, Liselotte Tinel, Joel F. de Brito, Marina Jamar, and Stéphane Sauvage

Among the regulated sources of pollutants, shipping has a significant contribution to NOx and SO2 global emissions 1–3. The international maritime transport regulation was updated in 2020 lowering the sulphur content in marine fuel globally from 3.5% to a maximum of 0.5% (m/m). Specific Sulphur Emission Control Areas have been established where the emissions of sulphur are further restricted, such as the Channel, between France and the U.K. However, other pollutants such as Volatile Organic Compounds (VOC) or Particulate Matter (PM), are not regulated in terms of shipping emissions. VOCs are of particular importance in the atmospheric chemistry processes, especially because of their role in the formation of ozone and as precursors of secondary PM in the vicinity of densely populated coastal areas 4. This raises the question of which VOC are emitted by ships under these new emission standards, what their emission rates are and what their impact on air quality is? Only a few studies considered the speciation of VOC emitted by ships 5, yet those data are crucial for reliable gas-phase atmospheric chemistry modelling and correct impact assessment. Our study presents the analysis of a VOC dataset collected during an intensive one-month field campaign in the harbour of Dunkirk in northern France, the third largest French port. The observations were conducted on a site near ferry and cargo terminals and provided high temporal resolution measurements of VOCs, using a PTR-ToF-MS, alongside many other parameters (meteorology, particles, gases). Data analysis allowed the identification of more than 65 plumes from different ferries, based on a methodology that relies on favourable meteorological conditions, port office entries and tracers like SO2. Firstly, Emission Factors (EFs) have been calculated, providing an estimate of the relative amount of a pollutant emitted relative to CO2. For species like SO2 or CH4, our results were consistent with the EMEP emission inventory of 2021 (De Lauretis et al. 2021), however, some VOCs displayed large differences compared to ship exhaust determined EF within the EU/SCIPPER project 7. As an example, the median EF of benzene ions (C6H6.H+) was 27.87 mg/kg(fuel) versus 5.31 mg/kg(fuel) for SCIPPER, whereas toluene (C7H8.H+) was 23.37 mg/kg(fuel) versus 0.49 mg/kg(fuel) for exhaust measurement. Secondly, Positive Matrix Factorization has been applied to the dataset to investigate a shipping chemical profile of VOC that will allow us to calculate the contribution of shipping emission to the total VOC concentration in such harbour area.

1. Corbett, J. J. et al. Environ. Sci. Technol. 41, 8512–8518 (2007).

2. Faber, J., Hanayama, S., Zhang, S. & Pereda, P. Fourth IMO GHG Study 2020 Executive-Summary. (2020).

3. Merk, O. Shipping Emissions in Ports. vol. 2014/2 (2014).

4. Fang, H. et al. Journal of Geophysical Research: Atmospheres 127, e2022JD037301 (2022).

5. Xiao, Q. et al. Atmos. Chem. Phys. 18, 9527–9545 (2018).

6. De Lauretis, R., Ntziachristos, L. & Trozzi, C. Air pollutant emission inventory guidebook 2019, update 2021. (2021).

7. Timonen, H. et al. Ship on-board emissions characterisation. (2022).

How to cite: Volent, E., Tinel, L., F. de Brito, J., Jamar, M., and Sauvage, S.: Volatile Organic Compounds shipping emissions observed in an industrial harbour of northern France , EGU General Assembly 2024, Vienna, Austria, 14–19 Apr 2024, EGU24-9501, https://doi.org/10.5194/egusphere-egu24-9501, 2024.

EGU24-9952 | Orals | AS3.2

Towards understanding aromatic SOA by studying the molecular level oxidations mechanisms of xylene isomers 

Siddharth Iyer, Avinash Kumar, Shawon Barua, Jian Zhao, Anni Savolainen, Prasenjit Seal, Lukas Pichelstorfer, Pontus Roldin, Mikael Ehn, and Matti Rissanen

Aromatic compounds like xylene contribute significantly to the formation of tropospheric secondary organic aerosol (SOA) that have strong implications on health and on climate. The sources of this class of molecules are primarily anthropogenic, but biogenic sources of aromatics can be significant too. To form SOA, the volatile xylene needs to oxidize into low volatility aerosol precursors with multiple oxygen containing polar functional groups called highly oxygenated organic molecules (HOMs). It does this through the autoxidation mechanism, which is a sequential process involving peroxy radicals where each intra-molecular reaction step such as an H-atom shift is followed quickly by O2 addition. While laboratory measurements using the sensitive chemical ionization mass spectrometer (CIMS) instrument indicate rapid conversion of xylene to HOM, this is unsupported by established oxidation mechanisms. This is due to the assumed stability of the crucial bicyclic peroxy radical (BPR), an intermediate that is intrinsic to aromatic oxidation in general. Recently, we showed that the BPR associated with toluene oxidation can be unstable, and its decomposition is pivotal to the subsequent autoxidation mechanism that leads to HOM. [1]


Through investigating the autoxidation mechanisms of xylene in this work, we establish the importance of aromatic derived BPR decomposition to the formation of SOA. We combine theoretical modelling with sub-second HOM measurements using CIMS to develop the Aerosol Dynamics gas- and particle-phase chemistry model for laboratory CHAMber (ADCHAM) code [2] for xylene that is robust at reproducing the SOA mass yields we measure from our chamber experiments. We also show that the underlying autoxidation mechanisms are remarkably similar for many of the atmospherically dominant monocyclic aromatics, which opens the remarkable prospect of significantly improved model predictions of aromatic SOA even in the absence of theoretical and experimental data.

[1] Iyer, S., Kumar, A., Savolainen, A. et al. Molecular rearrangement of bicyclic peroxy radicals is a key route to aerosol from aromatics. Nat. Commun. 14, 4984 (2023). https://doi.org/10.1038/s41467-023-40675-2

[2] Roldin, P., Eriksson, A.C., Nordin, E.Z., Hermansson, E., Mogensen, D., Rusanen, A., Boy, M., Swietlicki, E., Svenningsson, B., Zelenyuk, A. and Pagels, J., 2014. Modelling non-equilibrium secondary organic aerosol formation and evaporation with the aerosol dynamics, gas-and particle-phase chemistry kinetic multilayer model ADCHAM. Atmospheric Chemistry and Physics14(15), pp.7953-7993.

How to cite: Iyer, S., Kumar, A., Barua, S., Zhao, J., Savolainen, A., Seal, P., Pichelstorfer, L., Roldin, P., Ehn, M., and Rissanen, M.: Towards understanding aromatic SOA by studying the molecular level oxidations mechanisms of xylene isomers, EGU General Assembly 2024, Vienna, Austria, 14–19 Apr 2024, EGU24-9952, https://doi.org/10.5194/egusphere-egu24-9952, 2024.

EGU24-10015 | ECS | Posters on site | AS3.2

Is green waste fertilization in agriculture an important source of VOC?  A field study based on  PTR-Qi-TOF-MS and eddy covariance 

Yang Liu, Pauline Buysse, Benjamin Loubet, Florence Lafouge, Anais Feron, Jérémie Depuydt, Florent Levavasseur, and Raluca Ciuraru

Agriculture is a potentially large yet poorly characterized source of volatile organic compounds (VOCs). Crops are the largest and most well-known source of VOCs from agriculture. Agricultural management practices, and especially organic fertilization is an especially unknown source of VOCs. A 3-week field campaign was conducted in September 2023 in Saclay, France, 30 km southwest of Paris. We investigated VOC fluxes over a mustard and moha field (cover crops) by eddy covariance using a PTR-Qi-TOF-MS. Green waste was applied during the second week of measurements.

We detected over a hundred VOCs with fluxes 3 times above the detection limit, and found that: 1) Oxygenated VOCs and monoterpenes are the most emitted compound groups. 2) High fluxes of methanol, ethanol, acetone, and acetaldehyde were detected after organic fertilizer spread. 3) A relatively strong sesquiterpene emission was observed after fertilization and was not previously reported. Our results provide new insights into VOC emissions from cover crops and green waste application.    

How to cite: Liu, Y., Buysse, P., Loubet, B., Lafouge, F., Feron, A., Depuydt, J., Levavasseur, F., and Ciuraru, R.: Is green waste fertilization in agriculture an important source of VOC?  A field study based on  PTR-Qi-TOF-MS and eddy covariance, EGU General Assembly 2024, Vienna, Austria, 14–19 Apr 2024, EGU24-10015, https://doi.org/10.5194/egusphere-egu24-10015, 2024.

EGU24-11361 | Orals | AS3.2

Humidity-dependent dry deposition of methacrolein to plant species 

Sergiy Medinets, Ben Langford, Chiara Di Marco, Massimo Vieno, and Eiko Nemitz

Volatile organic compounds (VOCs) together with nitrogen oxides contribute to the formation of ground-level ozone as well as PM2.5 pollution through secondary organic aerosol formation, with adverse effects on human health and environment. Researchers have mainly focused on quantifying VOC emissions from plant canopies and their controls, leading to improvements in atmospheric chemistry models (Jimenez et al., 2009). However, much less attention has been spent on quantifying dry deposition of primary and secondary VOCs to surfaces, with most models often using deposition rates extrapolated from SO2 (as a proxy of a water-soluble gas of limited reactivity) and O3 (as a proxy of an insoluble reactive gas), making uncertain assumptions on the relative behaviour of key VOCs (Wesely, 2007). To address this, we conducted the first systematic, measurement-based investigation into VOC dry deposition as part of the ‘Dry Deposition Processes of VOCs’ project funded by Natural Environment Research Council. The overarching aim of the study was to reduce uncertainty in atmospheric chemistry models by developing parameterisations for the dry deposition of VOCs. The preliminary results of our laboratory study on plant fumigation with methacrolein (MACR), among other selected VOCs, are presented here.

An automated dynamic gas-exchange chamber system was developed to expose test plants to specific VOCs at various concentrations under controlled conditions. Overall, six plant species (see below) were tested with each experiment lasting four days: one day to observe background emissions and three days with VOC fumigation at 20, 15 and 10 °C. Three levels of relative humidity (RH) were applied during day and night times, being fumigated with five concentrations of VOCs within each RH level. In total, eleven VOCs were selected for fumigation: water-insoluble (isoprene, benzene, toluene, xylene, a-pinene) and water-soluble (methanol, acetonitrile, acetaldehyde, acetone, acetic acid and MACR). VOCs were measured using a proton transfer reaction instrument equipped with time-of-flight mass spectrometer (PTR-Qi-TOF). Fluxes were calculated based on concentration difference between blank and measurement chambers and then normalized by the corresponding plant leaf area indices.

MACR appears to be ‘valuable’ VOC to study dry deposition as it is not typically emitted by plants but is an important first-order product of isoprene oxidation in the atmosphere. Nevertheless, minor MACR emissions have been reported, suggesting that oxidation may also take place within leaves (Fares et al., 2015).   

The deposition velocity of MACR was found to increase with RH, and larger deposition velocities were consistently observed during the daytime compared to the night. This diurnal dependence indicates either stomatal control or photochemical processes, or a combination of the two, were present under daylight conditions. However, this varied substantially across tested plants being ranked in the following order Pinus sylvestris > Hedera sp. > Picea glauca > Betula sp. > Tsuga heterophylla > Ilex aquifolium. At all times, MACR compensation points were found to be negligible (near zero) or even negative, suggesting minor or no impact on deposition rates.

These findings are enhancing our understanding of VOC deposition and will inform the development of new parameterizations for atmospheric chemistry models.

How to cite: Medinets, S., Langford, B., Di Marco, C., Vieno, M., and Nemitz, E.: Humidity-dependent dry deposition of methacrolein to plant species, EGU General Assembly 2024, Vienna, Austria, 14–19 Apr 2024, EGU24-11361, https://doi.org/10.5194/egusphere-egu24-11361, 2024.

EGU24-11383 | Orals | AS3.2

Biogenic sulfur compounds and their oxidation products in the spring-to-summer Arctic marine atmosphere 

Megan Willis, Cort Zang, Julia Asplund, Fredrik Mattsson, Paul Zieger, and Michael Tjernström

Gas-phase biogenic organosulfur compounds, and their oxidation products are important for the formation and growth of aerosol in the marine environment. During the spring-summer increase in marine biological activity in the northern hemisphere, dimethyl sulfide ((CH3)2S, DMS) and methanethiol (CH3SH, MeSH) are emitted from ocean and sea-ice environments. The emission or transport, and following oxidation, of organosulfur compounds to the Arctic marine environment impacts the available aerosol number and cloud condensation nuclei. Here, we examine organosulfur compound composition, atmospheric fate, and relationships to the aerosol population at the onset of sea-ice melt.

We present shipborne gas-phase measurements of reduced and oxidized organosulfur compounds made with a H­3O+/NH4+ reagent ion switching chemical ionization time-of-flight mass spectrometer as part of the Atmospheric Rivers and the onseT of sea ice MELT (ARTofMELT) campaign on IB Oden. Our measurements during ARTofMELT spanned from May 7th to June 15th of 2023 and took place over pack ice and the marginal ice zone between 78 and 81°N between the east coast of Greenland and the Svalbard archipelago (the Fram Strait). Non-DMS organosulfur species made a significant contribution to atmospheric sulfur during the campaign. MeSH was present at concentrations ~10% of DMS (10’s of pptv) during periods of elevated organosulfur compounds (DMS exceeding ~100 pptv) and was correlated with DMS (R2 > 0.8). Ambient temperatures ranged between -15 and 2°C, making the primary oxidation reaction between DMS and the hydroxyl radical the OH-addition pathway to produce dimethyl sulfoxide (DMSO). We observed DMSO in concentrations occasionally exceeding 150 pptv, and the chemical formula C2H6SO2 (likely dimethyl sulfone) at similar concentrations to DMSO. During low ozone periods (< 10 ppbv), the loss of DMS was potentially influenced by halogen chemistry resulting in an increased abundance of DMSO relative to DMS. We use our measurements to investigate organosulfur compound composition and loss pathways under a variety of atmospheric conditions.

How to cite: Willis, M., Zang, C., Asplund, J., Mattsson, F., Zieger, P., and Tjernström, M.: Biogenic sulfur compounds and their oxidation products in the spring-to-summer Arctic marine atmosphere, EGU General Assembly 2024, Vienna, Austria, 14–19 Apr 2024, EGU24-11383, https://doi.org/10.5194/egusphere-egu24-11383, 2024.

EGU24-13530 | ECS | Orals | AS3.2

Aircraft measurements of PAN (CH3C(O)OONO2) and PAA (CH3C(O)OOH) in the tropical atmosphere 

Carolina Nelson, Simone T. Andersen, and John N. Crowley
The two trace gases peroxyacetyl nitrate (PAN, CH3C(O)OONO2) and peracetic acid (PAA, CH3C(O)OOH) are products of reactions of the acetylperoxy radical with NO2 and HO2, respectively. They are formed during the oxidation of anthropogenic and biogenic VOCs and in biomass burning. PAN represents an important source of NOx in remote regions, while PAA is an indicator of the fate of peroxy radicals. To date, there have been very few simultaneous measurements of PAN and PAA. In this study, we present airborne measurements of PAN and PAA using a chemical ionization mass spectrometer (CIMS) in the clean troposphere above the Amazon rainforest in the framework of the CAFE Brazil measurement campaign. The absolute and relative abundances of PAN and PAA are analysed using data obtained during 20 flights performed during December 2022 until the end of January 2023.

How to cite: Nelson, C., Andersen, S. T., and Crowley, J. N.: Aircraft measurements of PAN (CH3C(O)OONO2) and PAA (CH3C(O)OOH) in the tropical atmosphere, EGU General Assembly 2024, Vienna, Austria, 14–19 Apr 2024, EGU24-13530, https://doi.org/10.5194/egusphere-egu24-13530, 2024.

EGU24-13774 | ECS | Orals | AS3.2

Changes in chiral monoterpenes during drought in a rainforest reveal distinct source mechanisms 

Joseph Byron, Juergen Kreuzwieser, Gemma Purser, Joost van Haren, S. Nemiah Ladd, Laura Meredith, Christiane Werner, and Jonathan Williams

Monoterpenes (C10H16) are emitted in large quantities by vegetation to the atmosphere (>100 TgC year−1), where they readily react with hydroxyl radicals and ozone to form new particles and, hence, clouds, affecting the Earth’s radiative budget and, thereby, climate change[1-3]. Although most monoterpenes exist in two chiral mirror-image forms termed enantiomers, these (+) and (−) forms are rarely distinguished in measurement or modelling studies[4-6]. Therefore, the individual formation pathways of monoterpene enantiomers in plants and their ecological functions are poorly understood. Here we present enantiomerically separated atmospheric monoterpene and isoprene data from an enclosed tropical rainforest ecosystem in the absence of ultraviolet light and atmospheric oxidation chemistry, during a four-month controlled drought and rewetting experiment, the Biosphere 2 Water, Air and Life Dynamics campaign (B2WALD) in 2019[7, 8]. The measurements were obtained with an on-line gas chromatograph-mass spectrometer over five time periods: pre-drought, early drought, severe drought, deep rewet and rain rewet.

Surprisingly, the emitted enantiomers showed distinct diel emission peaks, which responded differently to progressive drying. Isotopic labelling established that vegetation emitted mainly de novo-synthesized (−)-α-pinene, whereas (+)-α-pinene was emitted from storage pools. As drought progressed, the source of (−)-α-pinene emissions shifted to storage pools which would favour cloud formation since the peak concentration became more aligned with temperature. Pre-drought mixing ratios of both α-pinene enantiomers correlated better with other monoterpenes than with each other, indicating different enzymatic controls. These results show that enantiomeric distribution is key to understanding the underlying processes driving monoterpene emissions from forest ecosystems and predicting atmospheric feedbacks in response to climate change.

1. Jokinen, T., et al., Production of extremely low volatile organic compounds from biogenic emissions: Measured yields and atmospheric implications. Proceedings of the National Academy of Sciences, 2015. 112(23): p. 7123-7128.

2. Engelhart, G.J., et al., CCN activity and droplet growth kinetics of fresh and aged monoterpene secondary organic aerosol. Atmos. Chem. Phys., 2008. 8(14): p. 3937-3949.

3. Laothawornkitkul, J., et al., Biogenic volatile organic compounds in the Earth system. New Phytologist, 2009. 183(1): p. 27-51.

4. Yáñez-Serrano, A.M., et al., Monoterpene chemical speciation in a tropical rainforest:variation with season, height, and time of dayat the Amazon Tall Tower Observatory (ATTO). Atmos. Chem. Phys., 2018. 18(5): p. 3403-3418.

5. Jardine, K.J., et al., Monoterpene 'thermometer' of tropical forest-atmosphere response to climate warming. Plant Cell Environ, 2017. 40(3): p. 441-452.

6. Guenther, A., et al., The Model of Emissions of Gases and Aerosols from Nature version 2.1 (MEGAN2. 1): an extended and updated framework for modeling biogenic emissions. 2012.

7. Byron, J., et al., Chiral monoterpenes reveal forest emission mechanisms and drought responses. Nature, 2022. 609(7926): p. 307-312.

8. Werner, C., et al., Ecosystem fluxes during drought and recovery in an experimental forest. Science, 2021. 374(6574): p. 1514-1518.


How to cite: Byron, J., Kreuzwieser, J., Purser, G., van Haren, J., Ladd, S. N., Meredith, L., Werner, C., and Williams, J.: Changes in chiral monoterpenes during drought in a rainforest reveal distinct source mechanisms, EGU General Assembly 2024, Vienna, Austria, 14–19 Apr 2024, EGU24-13774, https://doi.org/10.5194/egusphere-egu24-13774, 2024.

EGU24-15356 | Posters on site | AS3.2

Multiphysical description of atmospheric pressure interface chemical ionization in MION2 & Eisele type inlets 

Henning Finkenzeller, Jyri Mikkilä, Paxton Juuti, Cecilia Righi, Nina Sarnela, and Juha Kangasluoma

The inlets of chemical ionisation mass spectrometers are fundamental instrument components in chemical ionisation mass spectrometry (CIMS). However, the sample gas and reagent ion trajectories are often understood only in a general and qualitative manner. Here we evaluate two common atmospheric pressure chemical ionisation inlets (MION2 and Eisele type inlet) with 3D physico-chemical models regarding the reagent ion and sample gas trajectories and evaluate their efficiencies of reagent ion production, reagent ion delivery from the ion source volume into the ion-molecule mixing region, and the interaction between reagent ions and target molecules. The models are validated by laboratory measurements and quantitatively reproduce observed sensitivities to tuning parameters, including ion currents and changes in mass spectra. The study elucidates how the different transport and chemical processes proceed within the studied inlets, how space charge is already relevant at concentrations of as low as 107 cm-3, and compares the two investigated models. The models provide insights into how to operate the inlets and will help in the development of future inlets that further enhance the capability of CIMS.

How to cite: Finkenzeller, H., Mikkilä, J., Juuti, P., Righi, C., Sarnela, N., and Kangasluoma, J.: Multiphysical description of atmospheric pressure interface chemical ionization in MION2 & Eisele type inlets, EGU General Assembly 2024, Vienna, Austria, 14–19 Apr 2024, EGU24-15356, https://doi.org/10.5194/egusphere-egu24-15356, 2024.

EGU24-15717 | Posters on site | AS3.2

Modelling the influence of biogenic SOA precursor volatility on aerosol forcing 

Muhammed Irfan, Thomas Kühn, Taina Yli-Juuti, Anton Laakso, Eemeli Holopainen, Douglas R. Worsnop, Annele Virtanen, and Harri Kokkola

Secondary organic aerosol (SOA) plays a significant role in atmospheric processes, influencing particulate matter, air quality, and global climate. The volatility basis set (VBS) framework facilitates simulating the large number of SOA species by grouping SOA precursors based on volatility, thus reducing computational challenges. However, volatilities of SOA forming vapors are inadequately constrained in global climate models, causing uncertainties in predicted aerosol mass loads and climate effects. Using a process-scale particle growth model and a global climate model, we analyse the sensitivity of simulated cloud condensation nuclei (CCN) and SOA mass concentrations to the volatility distribution of SOA precursor gases from monoterpenes emitted by boreal trees. Our findings reveal that uncertainties in the volatilities of condensing organic vapors significantly affect particle growth rates and CCN survival in the process-scale model. Global model simulations show less sensitivity in CCN and cloud droplet number concentration (CDNC). A one order of magnitude shifts in volatility results in a 13% increase or a 9% decrease in SOA mass concentration over the boreal region. Furthermore, the study compares a finely resolved 9-bin VBS setup and a coarser 3-bin VBS setup, highlighting the importance of accurately representing saturation concentration values for volatility bins, especially in global models with reduced bin numbers. In addition, the study found that the radiative forcing attributed to changes in SOA is notably more sensitive to the volatility distribution of semi-volatile compounds than low-volatile compounds. This underscores the need for improved representations of semi-volatile compounds in global scale models to accurately predict aerosol loads and subsequent climate effects.

How to cite: Irfan, M., Kühn, T., Yli-Juuti, T., Laakso, A., Holopainen, E., R. Worsnop, D., Virtanen, A., and Kokkola, H.: Modelling the influence of biogenic SOA precursor volatility on aerosol forcing, EGU General Assembly 2024, Vienna, Austria, 14–19 Apr 2024, EGU24-15717, https://doi.org/10.5194/egusphere-egu24-15717, 2024.

EGU24-16019 | ECS | Posters on site | AS3.2

Ether and ester formation from peroxy radical recombination 

Lauri Franzon, Theo Kurtén, Bernard Aumont, Marie Camredon, and Richard Valorso
In a recent combined experimental and computational investigation (Peräkylä et al, JACS 145,35 7780–7790, 2023) of the Peroxy Radical Recombination (RO2 + RO2) products of α-pinene, we discovered a previously unknown product channel, in which the expected attachment of the two alkoxy radical (RO) intermediates into a peroxide accretion product (ROOR) is preceded by a rapid decomposition of one of the intermediate RO into an acyl-centered radical, resulting in the formation of a smaller but more stable ester accretion product R’(O)COR. In the presented work, the atmospheric implications of this new reaction channel have been explored further using a modified version of the GECKO-A (Generator for Explicit Chemistry and Kinetics of Organics in the Atmosphere, Aumont et al, ACP 5, 2497–2517, 2005) to generate a large representative sample of RO2 + RO2 reactive pairs from the atmospheric oxidation of n-Decane, Toluene, the seven most common Monoterpene molecules) and one Sesquiterpene along with all the known decomposition channels of the intermediate RO formed in the reactions. The reaction rates of these decomposition channels are then compared to previous theoretical work on the product branching from RO2 + RO2 reactions (Hasan et al. JPCA, 124, 8305–8320, 2020 & 127, 1686–1696, 2023; Franzon JPCA 127, 5956–5966, 2023) to determine for which systems these RO decompositions might be competitive.

The generated chemical data is discussed in terms of the atmospheric formation of low-volatility organic molecules. Data is presented on the most important RO decomposition reactions for ether and ester accretion product formation, on vapour pressure trends of the various products, and on new accretion product-inhibiting reaction channels that at best produce two closed-shell molecules with the same carbon count as the reactant RO2.

Since our work is exploratory, and as the calculation of reaction rates rests on many assumptions, no certain conclusions can be drawn from our calculated product branching ratios. However, the present work provides valuable new insights on the formation of low-volatility organics in the atmosphere, and raises many open questions worthy of detailed studies of their own. We hope our results will be of great general interest to the atmospheric chemistry and physics community.

How to cite: Franzon, L., Kurtén, T., Aumont, B., Camredon, M., and Valorso, R.: Ether and ester formation from peroxy radical recombination, EGU General Assembly 2024, Vienna, Austria, 14–19 Apr 2024, EGU24-16019, https://doi.org/10.5194/egusphere-egu24-16019, 2024.

EGU24-16619 | Orals | AS3.2

Role played by Organic Nitrates in the Production of Secondary Organic Aerosol in a megacity 

Eleonora Aruffo, Junfeng Wang, Daniel J. Jacob, Jianhuai Ye, Xinlei Ge, and Piero Di Carlo

Secondary Organic Aerosol (SOA) production and chemical composition play a crucial role in the urban air pollution. Here, we used observations from two summer campaigns in Beijing in 2017 and 2023 to show that nighttime production of NOz (NOy - NOx) is particularly enhanced in specific conditions and that can play a significant role for SOA the next day. The observations showed nocturnal peaks of NOz of about 40 ppb, correlated with very high NO and NO2. We employed the Framework for 0-D Atmospheric Modeling (F0AM) model, based on the Master Chemical Mechanism (MCM), running simulations to investigate the organic nitrates (ONs) speciation, and founding that during the night the alkyl nitrates is the most abundant ONs, produced by oxidation of volatile organic compounds (VOCs) by the nitrate radical (NO3). Finally, we used the Framework for 0-D Atmospheric Modeling- Washington Aerosol Module (F0AM-WAM) model, which couple the gas phase chemistry with the SIMPOL representation for the particle phase, to correlate the nocturnal ONs peaks, that we suggested to be mainly in gas phase, to the diurnal particle growth events registered in Beijing.

How to cite: Aruffo, E., Wang, J., Jacob, D. J., Ye, J., Ge, X., and Di Carlo, P.: Role played by Organic Nitrates in the Production of Secondary Organic Aerosol in a megacity, EGU General Assembly 2024, Vienna, Austria, 14–19 Apr 2024, EGU24-16619, https://doi.org/10.5194/egusphere-egu24-16619, 2024.

EGU24-16754 | Posters on site | AS3.2

Towards a complete picture of organics in the atmosphere with a filter-based CIMS approach 

Anna Franck, Henning Finkenzeller, Jyri Mikkilä, and Tuija Jokinen

Chemical Ionization Mass Spectrometry (CIMS) is an effective technique for accurate and sensitive detection of atmospheric organic compounds relevant to atmospheric chemistry and aerosol particle formation. Several types of mass spectrometers have been developed and used widely by the atmospheric community for online measurements. One of the limitations of the online technique is its size and weight and therefore, challenges in measuring in remote locations.

To facilitate measurements of organic vapours, a filter desorption unit was developed that can be easily mounted to APi-ToF (Tofwerk AG) or Orbitrap (ThermoFisher) mass spectrometers. Tenax-coated filters, which maximize the retention of organic vapours, are used for the collection of ambient air. Then, the collected filter deposit is thermally desorbed while the temperature rises to 200 C in three minutes. In the next step Multi-scheme chemical ionization inlet, MION2 (Karsa Ltd.), is used for chemical ionization with X-ray and preparation of the analyte to the detection in the mass spectrometer without further chromatographic separation. The whole process takes less than five minutes.

This new method has already been tested on various groups of compounds, including organics, and will be extended to more species in the near future.

In conclusion, the new filter-based approach in combination with the excellent detection limits of MION2, expands the use of CIMS instruments and opens possibilities for sampling in remote locations as well as on new platforms, such as drones.

How to cite: Franck, A., Finkenzeller, H., Mikkilä, J., and Jokinen, T.: Towards a complete picture of organics in the atmosphere with a filter-based CIMS approach, EGU General Assembly 2024, Vienna, Austria, 14–19 Apr 2024, EGU24-16754, https://doi.org/10.5194/egusphere-egu24-16754, 2024.

EGU24-18536 | Posters on site | AS3.2

Exploring rice biomass burning and its chemical transformations in the Valencia Region 

Esther Borràs, Rubén Soler, Teresa Vera, Tatiana Gómez, Mila Ródenas, Enrique Mantilla, Eduardo Yubero, Javier Crespo, and Amalia Muñoz

Rice is one of the most widely cultivated cereals in the world. In Europe, rice cultivation is limited to Mediterranean countries, where geographical characteristics for rice production can be found. Spain is the second largest European producer. There are some regions in Spain, being Levante (Valencia) the most important one, with a long cultural, social, and gastronomic tradition associated with rice production. Valencian Community annually produce more than 60 kt of straw, a large part of which will follow a burning process of elimination due to sanitary reasons. The practice of burning it in the field produces harmful effects on the environment and human health.

The burning of rice straw, a common practice in many agricultural regions, continues to be a significant source of air emissions. causing frequent acute pollution episodes and exceedances of regulatory limits. However, there is a notable lack of knowledge about the nature of the emissions and their potential health hazards, as well as their contribution to secondary pollution and in particular to photochemical processes. Within this context, emissions and their chemical transformation were studied from 27/09/2023 to 02/11/2023 in the Valencia Region near a smoke-affected area. Using advanced analytical techniques, including gas chromatography, and particle analysis, a detailed evaluation of the components emitted during the burning of rice straw has been carried out. Various analytical instruments were used to characterize both the optical properties and chemical composition of the particle phase (aethalometers, nephelometer, PM low-cost sensors and PM10 and PM2.5 filters for offline analysis) and the gas phase (optical equipment, monitors, Tenax, DNPH and C18 cartridges, and high-resolution state-of-the-art spectrometers: PTR-MS), which allowed a detailed examination of the chemical composition, aging and transformation of the emissions.

The results reveal a diversity of gaseous pollutants, including nitrogen oxides (NOx), sulfur dioxide (SO2) and volatile organic compounds (VOCs), whose concentrations and compositions vary significantly depending on combustion conditions.In addition, an exhaustive characterization of the aerosols and particles generated has been carried out, highlighting the presence of fine particulate matter with potential impact on air quality and human health. The preliminary results show high values ​​of VOCs, PM10, PM2.5 and PM1 in the populated areas near the burned plots. These emissions also caused elevated ozone values up to 120 µg m-3 ​​in interior areas of the region, previously associated with high PM values.

These findings offer a deeper understanding of the complexity of emissions from rice straw burning and provide a solid foundation for future mitigation strategies and the development of environmental policies in affected regions.


This work is part of a project that is supported by ATMOBE  PID2022-1423660B-100 funded by MCIN/AEI/ 10.13039/501100011033 and,  by “ERDF A way of making Europe” and by PROMETEO (EVER project) CIPROM/20200/37

How to cite: Borràs, E., Soler, R., Vera, T., Gómez, T., Ródenas, M., Mantilla, E., Yubero, E., Crespo, J., and Muñoz, A.: Exploring rice biomass burning and its chemical transformations in the Valencia Region, EGU General Assembly 2024, Vienna, Austria, 14–19 Apr 2024, EGU24-18536, https://doi.org/10.5194/egusphere-egu24-18536, 2024.

EGU24-18564 | ECS | Posters on site | AS3.2

Computational study of cresol autoxidation: Initial steps in secondary organic aerosol formation 

Aliisa Ojala and Siddharth Iyer

Aromatic compounds, especially BTEX-compounds (benzene, toluene, ethylbenzene and xylene) and their derivatives can have an impact on the climate and human health through secondary organic aerosol (SOA) formation. They primarily originate from anthropogenic sources, such as vehicle emissions, industrial processes and solvent evaporation. These volatile organic compunds (VOCs) in the atmosphere can autoxidize, which is a sequential process of intramolecular reactions of peroxy radicals (molecules with R-O-O· structure) followed quickly by O2 additions. This leads to low-volatility products with multiple oxygen-containing functional groups, called highly oxygenated organic molecules (HOMs).[1] These molecules can condense irreversibly to form and grow SOA, which have an impact on the climate through the scattering and absorption of sunlight and acting as seeds for cloud formation.

The oxidation process for aromatics is initiated by OH-radicals, which leads quickly to bicyclic peroxy radical (BPR) intermediates in significant yields. BPRs retain the initial 6-membered ring, but add an additional endoperoxide bridge, consisting of two oxygen atoms, that connects to carbon atoms on both sides of the initiating OH-addition site. BPRs are sterically hindered, and their autoxidation is therefore slow, preferring to undergo bimolecular reactions with e.g. NO in polluted environments. Recently, a unimolecular pathway for ring-opening of BPRs was reported, leading to HOM formation in even sub-second timescales[2]. This opens up a pathway for aromatics to lead to SOA, even in non-polluted environments.

In this work, the autoxidation of cresols is studied. The cresol pathway is a major source of overall SOA for BTEX-compounds, as it is expected to account for up to 40% of toluene-related SOA formation[3]. ωB97XD/aug-cc-pVTZ-level of theory is used for geometry optimization with single point energy calculations done at ROHF-ROCCSD(T)-F12a/cc-pVDZ-F12-level. A thorough conformer sampling is done at a lower level of theory, and multi-conformer transition state theory (MC-TST) is used for rate calculations with Eckart-tunneling correction. For cresols, the OH-addition can happen at six different sites with different yields, leading to different chemistry. Preliminary results for ortho-cresol suggest that sites 3, 1 and 2 relative to the methyl group have the highest yields in descending order. Slow ring breakage is seen for the two highest yield addition sites, whereas fast ring breakage is seen for the BPR formed from 2-position addition. This is compatible with previous results for the ring-breaking of other substituted aromatic compounds[2]. The results of this study shed light on the SOA formation processes in the atmosphere. This will improve current models of SOA formation, which are known to have inconsistencies[1].

[1] Nault et al. Secondary organic aerosols from anthropogenic volatile organic compounds contribute substantially to air pollution mortality. Atmospheric Chemistry and Physics, 2021.
[2] Iyer et al. Molecular rearrangement of bicyclic peroxy radicals is a key route to aerosol from aromatics. Nature communications, 2023.
[3] Schwantes et al. Formation of highly oxygenated low-volatility products from cresol oxidation. Atmospheric Chemistry and Physics, 17(5):3453–3474, 2017.

How to cite: Ojala, A. and Iyer, S.: Computational study of cresol autoxidation: Initial steps in secondary organic aerosol formation, EGU General Assembly 2024, Vienna, Austria, 14–19 Apr 2024, EGU24-18564, https://doi.org/10.5194/egusphere-egu24-18564, 2024.

EGU24-18908 | ECS | Orals | AS3.2

Integrated model-measurement approaches to chamber SOA studies 

Hannah Kenagy, Colette Heald, Nadia Tahsini, Matthew Goss, and Jesse Kroll

Many of the quantitative descriptions of secondary organic aerosol (SOA) formation in regional and global models are derived from environmental chamber experiments, an experimental approach commonly used to assess multi-phase product distributions from atmospheric oxidation pathways.  As such, model accuracy for predicting aerosol abundance hinges on our ability to represent atmospheric conditions in chambers.  Here, we develop a new experimental approach that leverages both global modeling and detailed mechanisms to design chamber SOA experiments that capture atmospheric chemical environments for two key branching points in VOC oxidation: atmospheric oxidant balances and atmospheric RO2 chemistry. Using isoprene as a model system for multi-generation SOA production, we focus first on competition between oxidation by OH and Cl.  Global modeling indicates that multi-oxidant, multi-generation oxidation outcompetes single-oxidant, multi-generation oxidation in this system; we design and perform a series of chamber experiments to measure multi-phase product distributions from multi-oxidant, multi-generation isoprene oxidation.  Second, we develop a framework for quantitatively describing atmospheric RO2 chemistry and show that no previous experimental approaches to studying SOA formation have accessed the relevant atmospheric RO2 chemistry.  Leveraging multi-scale modeling, we design and perform a series of chamber experiments to measure isoprene SOA production under a range of atmospheric RO2 fate distributions.

How to cite: Kenagy, H., Heald, C., Tahsini, N., Goss, M., and Kroll, J.: Integrated model-measurement approaches to chamber SOA studies, EGU General Assembly 2024, Vienna, Austria, 14–19 Apr 2024, EGU24-18908, https://doi.org/10.5194/egusphere-egu24-18908, 2024.

EGU24-20198 | Orals | AS3.2

Significance of hydrogen abstraction in the formation of highly oxygenated organic molecules in the OH oxidation of monoterpenes 

Defeng Zhao, Hongru Shen, Hao Luo, Vereecken Luc, Sungah Kang, Pullinen Iida, Hendrik Fuchs, Mattias Hallquist, Andreas Wahner, Astrid Kiendler-Scharr, and Thomas Mentel

Secondary organic aerosol (SOA), formed by oxidation of volatile organic compounds, significantly influence air quality and climate. Biogenic highly oxygenated organic molecules (HOM), particularly those formed from monoterpenes, play a key role in SOA formation and growth. As the most important daytime oxidant, hydroxyl radical (OH•) initiated HOM from monoterpenes is believed to be mainly formed via OH addition channel. However, for α-pinene and limonene, we found that the contribution of hydrogen abstraction channel by OH contribute a significantly to HOM formation. We will present our observations and theoretical calculations, showing the role of hydrogen-abstraction and alkoxy radicals for fast autoxidation leading to HOM formation. We also provide formation mechanisms of and yields of HOM, suggesting the non-negligible contribution of the hydrogen abstraction channel to ambient SOA, particularly in OH-rich areas.

How to cite: Zhao, D., Shen, H., Luo, H., Luc, V., Kang, S., Iida, P., Fuchs, H., Hallquist, M., Wahner, A., Kiendler-Scharr, A., and Mentel, T.: Significance of hydrogen abstraction in the formation of highly oxygenated organic molecules in the OH oxidation of monoterpenes, EGU General Assembly 2024, Vienna, Austria, 14–19 Apr 2024, EGU24-20198, https://doi.org/10.5194/egusphere-egu24-20198, 2024.

EGU24-211 | Posters on site | AS3.3 | Highlight

Contribution of ozonation forming the particulate nitrosodi-methylamine (NDMA) in the ambient air  

Na Rae Choi, Yong Pyo Kim, Ji Yi Lee, Eunhye Kim, Soontae Kim, and Hye Jung Shin

Nitrosamines, organic compounds featuring the nitroso functional group (N-NO), are found in both gas and particle phases in the ambient air, known for their carcinogenic properties. The International Agency for Research on Cancer (IARC) has classified most nitrosamines as likely carcinogenic to humans. Given their carcinogenic nature, it is crucial to manage ambient concentrations of nitrosamines. Nevertheless, the concentrations of nitrosamines in Seoul, South Korea, surpass the recommended level of 10 ng/m3 set by the Norwegian Institute of Public Health (NIPH).

In the previous study, the contributions of primary emissions and atmospheric reactions were investigated using field measurement data from Seoul, Korea, along with a kinetic box. It was estimated that there was a mixed contribution of the atmospheric reaction and primary emission. In addition, the model estimation result showed that nitrosamine formation was enhanced by nitrosation under higher concentrations of NOx in Seoul. However, there was a large discrepancy between the measured and estimated concentrations of particulate nitrosamines in Seoul. Therefore, further identification of the hidden reaction forming nitrosamines was necessary.

This study aimed to identify whether ozonation could be an unknown reaction forming particulate nitrosodi-methylamine (NDMA) to reduce the discrepancy between the measured and estimated concentration of NDMA in the previous study. Ozonation of dimethylamine (DMA) can form dimethylhydrazine (UDMH), subsequently, UDMH reaction with O3 and O2 can produce NDMA in the ambient air. In order to quantify the contribution of ozonation, the ozonation mechanism was added to the kinetic box model developed in the previous study. The model simulation results showed that (1) the ozonation contributed to the ambient concentration of NDMA (7.9 ± 3.8% (winter); 1.9 ± 3.0% (spring); 10.0 ± 0.77% (summer); 3.6 ± 7.3% (autumn)), (2) the relatively higher O3/NOx ratio in summer (1.63 ± 0.69; 0.64 ± 0.52 (winter); 1.14 ± 0.92 (spring); 0.52 ± 0.54 (autumn)) could enhance ozonation, and (3) relatively lower pH in summer (2.2 ± 0.4; 5.3 ± 1.2 (winter); 3.9 ± 1.2 (spring); 3.9 ± 0.7 (autumn)) could hinder nitrosation compared to that in other seasons.

How to cite: Choi, N. R., Kim, Y. P., Lee, J. Y., Kim, E., Kim, S., and Shin, H. J.: Contribution of ozonation forming the particulate nitrosodi-methylamine (NDMA) in the ambient air , EGU General Assembly 2024, Vienna, Austria, 14–19 Apr 2024, EGU24-211, https://doi.org/10.5194/egusphere-egu24-211, 2024.

EGU24-301 | ECS | Posters on site | AS3.3 | Highlight

Aerosolisation of “forever chemicals” from contaminated water  

Jishnu Pandamkulangara Kizhakkethil, Zongbo Shi, Anna Bogush, and Ivan Kourtchev

Introduction

Poly- and perfluoro alkyl substances (PFASs), also known as “forever chemicals”, are persistent in the environment and are challenging to eliminate. There is a growing concern over their widespread presence in the environment and potential adverse effects on human health and ecosystems. Most of the current studies on PFAS pollution are related to aqueous and soil matrices while less emphasis has been given to their relevance to air quality. Several recent studies reported presence of PFASs in atmosphere; however, their atmospheric sources, especially for restricted for more than a decade perfluorooctanoic acid (PFOA) and perfluorooctanesulfonic acid (PFOS), are not well understood (e.g. Kourtchev et al., 2022; Zhou et al., 2021). Wastewater treatment (WWT) plants are repositories of 1000s of pollutants including PFASs (Barisci & Suri, 2021). Aerosolisation/volatilisation during WWT processes (e.g., aeration, trickling filtration) is suggested as one of the potential sources of PFASs in the atmosphere. However, to the best of our knowledge, aerosolisation potential of PFASs was conducted on a very small number of molecules from that class and under relevant to other than WWT processes conditions e.g., seaspray. 

The aim of this work is to investigate, for the first time, the aerosolisation potential of the extensive number of PFASs from contaminated waters under relevant to WWT plant conditions.

Method and results

Aerosolisation potential of PFASs, covering short-, medium- and long-chain compounds and including legacy PFOA, PFOS and perfluorononanoic acid (PFNA), was examined by aerating PFAS-fortified aqueous solutions at relevant to wastewater effluent concentrations and pHs in an aeration chamber. The generated PFAS-enriched aerosol was collected onto a prebaked glass fiber filter and methanolic solution using a filter pack, and an impinger. The samples were extracted and analysed using an on-line solid phase extraction (SPE) liquid chromatography (LC)-Orbitrap-Mass spectrometry (MS). The PFAS decay from the fortified aqueous solutions were also monitored to understand the extent of PFAS partitioning onto aerosol.

Our study indicates that a significant fraction of PFASs can be aerosolised from the contaminated water. This effect was more pronounced for long-chain PFASs irrespective of the pH of the contaminated water. Perfluorocarboxylic acids showed an increase in aerosol phase enrichment with increasing carbon chain length. Short chain PFASs showed lowest aerosol phase enrichment and losses from the contaminated water.

Conclusions

This study, for the first time, establishes the liquid-to-air transfer potential of 15 persistent semi-volatile PFASs including new generation replacements for legacy PFASs such as 4:2 fluorotelomer sulfonate (4:2 FTS) and 8:2 fluorotelomer sulfonate (8:2 FTS) via aerosolisation. The aerosolisation tendency of PFASs was found to increase with increasing carbon chain length. Legacy PFOS and PFOA were detected in the aerosol phase at alarming concentrations suggesting that the contaminated with PFAS waters exposed to aeration can be responsible for  observation of “forever chemicals” in the atmosphere.

 Reference:

Barisci and Suri, Water Sci.Technol., 84(12), 3442-3468. https://doi.org/10.2166/wst.2021.484

Kourtchev et al.  Sci. Total Environ., 835, 155496. https://doi.org/10.1016/j.scitotenv.2022.155496

Zhou et al. Environ.Sci.: Processes Impacts, 23(4), 580-587. https://doi.org/10.1039/D0EM00497A

How to cite: Pandamkulangara Kizhakkethil, J., Shi, Z., Bogush, A., and Kourtchev, I.: Aerosolisation of “forever chemicals” from contaminated water , EGU General Assembly 2024, Vienna, Austria, 14–19 Apr 2024, EGU24-301, https://doi.org/10.5194/egusphere-egu24-301, 2024.

Polycyclic aromatic hydrocarbons (PAHs) generally form an integral component of air pollutants in the ambient atmosphere. This study focuses on how proximity to roadways affects the ambient concentration of PAHs. Spatial and seasonal distribution of sixteen PAHs, and collectively represented as Σ16 PAHs were determined in the ambient atmosphere of Delhi, the National Capital Region (NCR) of India. The results showed that the average mass concentration of Σ16 PAHs near the roadway (67.8 ± 40.2 ng m-3) is significantly higher as compared to the urban background site (56 ± 30 ng m-3). Moreover, a source apportionment study indicated that major PAH-emission sources in Delhi NCR are traffic and coal combustion. Health risks associated with inhalation of particulate PAHs were assessed using benzo(a)pyrene equivalent concentration (BaPeq) and incremental lifetime cancer risk (ILCR) approach. ILCR values at both sites fall in the range of 10-2 to 10-4 which corresponds to the priority risk level (10-3) and not the acceptable risk level (10-6). Thus, the present study concludes that the concentration of ambient PAHs is significantly higher at a site with busy traffic than at an urban background site, thereby indicating a significantly higher health risk to the population of Delhi.

How to cite: Sonwani, S. and Saxena, P.: Atmospheric Polycyclic Aromatic Hydrocarbon Inhalation Exposure and Human Health Risk Assessment at Traffic Site in Delhi, India, EGU General Assembly 2024, Vienna, Austria, 14–19 Apr 2024, EGU24-474, https://doi.org/10.5194/egusphere-egu24-474, 2024.

EGU24-881 | ECS | Orals | AS3.3 | Highlight

Assessing the impact of PM2.5 constituents in its overall toxicity in the urban region of Indo-Gangetic Plain  

Aman Deep Gupta, Tarun Gupta, Piyush Kumar, and Santosh Misra

A detailed physio-chemical investigation of ambient PM2.5 constituents was conducted in order to identify the factors affecting its toxicological endpoints. The PM chemical components for various inorganic ions (SO42-, NO3-, NH4+, etc.), PAHs, water-soluble organic carbon (WSOC), water-soluble nitrogen (WSN), elemental and organic carbon (EC/OC) were analysed. The indicators mentioned above were assessed using ambient PM2.5 samples (n=30) collected from October to December 2021, over urban Kanpur region in the Indo-Gangetic Plain. To assess the toxicity of PM, cell viability assays were conducted on three distinct cell lines, namely NIH-3T3, B16-F0, and A549. It was found that PM chemical composition was major determinant in toxicity assessment rather than its mass concentration. PM2.5 samples containing greater amounts of OC and high-molecular-weight PAHs (4-6 rings) exhibited a more pronounced toxicity. Elevated concentrations of SO42- and NO3- were concurrent with these samples. The observed association between OC, SO42- and NO3- with cell toxicity suggests that chemical processing has the potential to increase the toxicity of PM2.5 particles. This was further validated by analysing the light absorption spectra of PM2.5 samples (350–500 nm), which revealed that samples with reduced cell viability exhibited more absorption in the spectra. Further, the spectrum analysis of higher toxicity samples indicated the possible presence of nitroaromatic and HULIS type chromophores causing toxicity in PM2.5. The other PM components, particularly EC, exhibited no association with any of the PM2.5 components which may be due to its inert nature. Therefore, EC and low-molecular-weight PAHs (2–3 rings) had the least impact on PM2.5 toxicity. This study revealed that the primary factors contributing to the toxicity of PM2.5 are the existence of organic molecules and their subsequent secondary transformations in the presence of SO42-, NH4+,and NO3-. Further, the study improves our understanding regarding the toxicity profiling of particulate matter, which may help in policy formulation to mitigate its impact.

How to cite: Gupta, A. D., Gupta, T., Kumar, P., and Misra, S.: Assessing the impact of PM2.5 constituents in its overall toxicity in the urban region of Indo-Gangetic Plain , EGU General Assembly 2024, Vienna, Austria, 14–19 Apr 2024, EGU24-881, https://doi.org/10.5194/egusphere-egu24-881, 2024.

EGU24-1071 | ECS | Posters on site | AS3.3

Carbonaceous aerosols in restaurants: optical properties and possible impact on climate 

Debayan Mandal, Abhishek Chakraborty, and Shruti Tripathi

Organic carbon is a significant constituent of PM2.5. The organic carbon percentage in indoor microenvironments is higher than in the ambient environment. Water soluble organic carbon (WSOC) is responsible for altering hygroscopicity, hence determining the ability of particles to act as cloud condensation nuclei (CCN). In this study, quartz fiber filters were collected from two restaurants (R1 and R2 ) using an Airmetrix low-volume sampler at a 5 lpm flow rate. R1 was a closed restaurant where dining tables and the cooking locations were adjacent to each other. R2 was a semi-indoor environment; two sides of the dining place were open with adjoining dining tables, and cooking locations. Organic carbon (OC), elemental carbon (EC), and water-soluble organic carbon (WSOC) were estimated using DRI thermal optical analyzer and total organic carbon analyzer instruments. All these constituents can exfiltrate outdoors and alter the climate. Absorption coefficient (babs)  and Mass Absorption Efficiency (MAE) were calculated for Water-soluble carbon at 365 nm. Average OC and EC concentrations were very high in R1, i.e. 160.31 µg/m3 and 14.99 µg/m3,respectively. It was lower in R2, i.e., 29.61 µg/m3 and 4.88 µg/m3,respectively. As there was a direct biomass burning source, i.e., cooking, the major portion of the OC was POC. In R1, the average POC was ~67%, and in R2, ~60% of the total OC. The average WSOC percentages in the R1 and R2 were 8.01% and 25.21%, respectively. MAE values were comparable, i.e., 0.04 and 0.03 in R1 and R2, as the nature of the source was similar. Brown Carbon (BrC) absorption peaks at 365 nm were observed in both locations, confirming its presence. A negative correlation was observed between babs and WSOC, indicating BrC as the main absorption component of the WSOC. The effective carbon ratio (ECR= SOC/[POC+EC]) was calculated to estimate the impact of the particles on the local radiative energy balance. The values were 0.42 in R1 and 0.51 in R2. Aerosol generated from both locations was more absorbing in nature than scattering. In the R1, the aerosol had more absorption capability than in R2 . This study did not quantify the amount of  WSOC and BrC from different food and cooking fuels. But, from this study, it was noticed that cooking-related aerosols are absorbing in nature and can exfiltrate outdoors and alter the local climate.

Keywords: Water Soluble Organic Carbon, Mass Absorption Effiency , Effective Carbon Ratio, Brown Carbon

How to cite: Mandal, D., Chakraborty, A., and Tripathi, S.: Carbonaceous aerosols in restaurants: optical properties and possible impact on climate, EGU General Assembly 2024, Vienna, Austria, 14–19 Apr 2024, EGU24-1071, https://doi.org/10.5194/egusphere-egu24-1071, 2024.

EGU24-1465 | Orals | AS3.3 | Highlight

Brown carbon aerosols in the Asian outflow region: Seasonal variations and source-specific light absorption properties 

Chunmao Zhu, Takuma Miyakawa, Fumikazu Taketani, Bhagawati Kunwar, Dhananjay Deshmukh, Kimitaka Kawamura, and Yugo Kanaya

Light-absorbing organic aerosols (BrC) play a significant role in Earth's climate, but their sources and optical properties remain unclear. We investigated seasonal variations and source-specific contributions to BrC in the Asian outflow region, focusing on Fukue Island, a gateway from the continent to the North Pacific. We conducted parallel analyses of BrC light absorption and organic aerosol composition over a year. We found that BrC levels were markedly higher during winter-spring, coinciding with air masses carrying emissions from Asian sources. Water-soluble BrC absorption exhibited a strong correlation with a specific marker for fossil fuel combustion, suggesting its significant influence on BrC levels. Biomass burning emissions, as indicated by another marker, contributed to BrC levels, particularly in spring. The fraction of BrC soluble in methanol was significantly higher during summer, suggesting potential contributions from additional sources, such as local biogenic emissions, present in air masses from this period. This study sheds light on the seasonal dynamics and source-specific light absorption characteristics of BrC in the Asian outflow region. Our findings contribute to a better understanding of BrC sources and their impact on climate.

How to cite: Zhu, C., Miyakawa, T., Taketani, F., Kunwar, B., Deshmukh, D., Kawamura, K., and Kanaya, Y.: Brown carbon aerosols in the Asian outflow region: Seasonal variations and source-specific light absorption properties, EGU General Assembly 2024, Vienna, Austria, 14–19 Apr 2024, EGU24-1465, https://doi.org/10.5194/egusphere-egu24-1465, 2024.

EGU24-1775 | ECS | Orals | AS3.3

Temporal Evolution of Isomer-Specific Reactivity in Dark-Aged β-Pinene Secondary Organic Aerosols 

Julian Resch, Kangwei Li, and Markus Kalberer

Collection of secondary organic aerosol (SOA) onto filters is often used in combination with LC-MS for detailed chemical characterization. Studies have shown that a large fraction of laboratory-generated SOA can be attributed to high molecular weight oligomeric compounds. Often there is a significant delay between sample collection and analysis (e.g., during automated filter collection) which may lead to changes in the chemical profile of the samples.

In this study β-pinene SOA was generated by O3 and OH oxidation and collected onto filters, which were either extracted in a mixture of water and acetonitrile or left on the filter and stored at room temperature, to investigate changes in the overall chemical composition profile over time up to one month. The samples were analyzed by UHPLC-ESI-MS in negative polarity mode.

An untargeted analysis led to several thousand detected compounds and principal component analysis indicated significantly different compositional changes between the samples stored on filters or as extracts. In order to understand these differences, further focus was put on previously identified carboxylic acids, dimer esters and other oligomers. The concentration of several hundred compounds in the monomer mass range increased in extracts over the 4-week time span, whereas the opposite was observed for samples stored on filters, where the concentration of a large number of monomers decreased. For dimers in samples stored on filters, a large number of compounds increased in concentration, while extracts show the opposite behavior.

A possible explanation for these trends could be the decomposition through hydrolysis of dimer esters and other components in extracts and the formation of oligomers on filters. This indicates the continuous chemical aging of the SOA particles deposited and stored on filters. To test this hypothesis, we nebulized a solution of carboxylic acid standards in excess onto filters where β-pinene SOA was deposited and monitored the temporal evolution of dimer esters which have been reported to form from diaterpenylic acid and carboxylic acids. A stronger increase of the dimers (and a stronger decrease of the monomer precursor products) was observed for these “spiked” samples in comparison to the “non-spiked” SOA filter controls.

This study not only highlights that the persistent changes observed on filters are due to previously overlooked on-filter reactions, which can lead to misinterpretation of the detailed chemical composition of samples collected on filters for offline analyses. These on-filter reactions also mimic particle phase non-oxidative aging of SOA over the entire lifetime of SOA particles in the atmosphere of days or weeks.

How to cite: Resch, J., Li, K., and Kalberer, M.: Temporal Evolution of Isomer-Specific Reactivity in Dark-Aged β-Pinene Secondary Organic Aerosols, EGU General Assembly 2024, Vienna, Austria, 14–19 Apr 2024, EGU24-1775, https://doi.org/10.5194/egusphere-egu24-1775, 2024.

EGU24-2245 | ECS | Orals | AS3.3

Enhanced daytime secondary aerosol formation driven by gas-particle partitioning in downwind urban plumes 

Mingfu Cai, Chenshuo Ye, Bin Yuan, Ee Zheng, and Suxia Yang

Anthropogenic emissions from city clusters can significantly enhance secondary organic aerosol (SOA) formation in the downwind regions, while the mechanism is poorly understood. To investigate the effect of pollutants within urban plumes on organic aerosol (OA) evolution, a field campaign was conducted at a downwind site of the Pearl River Delta region of China in the fall of 2019. A time-of-flight chemical ionization mass spectrometer coupled with a Filter Inlet for Gases and Aerosol (FIGAERO-CIMS) was used to probe the gas- and particle-phase molecular composition and thermograms of organic compounds.  For air masses influenced by urban pollution, strong daytime SOA formation through gas-particle partitioning was observed, resulting in higher OA volatility. The obvious SOA enhancement was mainly attributed to the equilibrium partitioning of non-condensable (100.5 μg m-3) organic vapors. We speculated that the elevated NOx concentration could suppress the formation of highly oxidized products, resulting in a smooth increase of condensable (100.5 μg m-3) organic vapors. Evidence showed that urban pollutants (NOx and VOCs) could promote daytime SOA formation by increasing the OH production rate. Our results highlight the important role of urban anthropogenic pollutants in SOA control in the suburban region.

How to cite: Cai, M., Ye, C., Yuan, B., Zheng, E., and Yang, S.: Enhanced daytime secondary aerosol formation driven by gas-particle partitioning in downwind urban plumes, EGU General Assembly 2024, Vienna, Austria, 14–19 Apr 2024, EGU24-2245, https://doi.org/10.5194/egusphere-egu24-2245, 2024.

    Secondary organic aerosols (SOAs) account for a large fraction of atmospheric aerosol mass and play significant roles in visibility impairment by scattering solar radiation. However, comprehensive evaluations of SOA scattering abilities under ambient relative humidity (RH) conditions on the basis of field measurements are still lacking due to the difficulty of simultaneously direct quantifications of SOA scattering efficiency in dry state and SOA water uptake abilities. In this study, field measurements of aerosol chemical and physical properties were conducted in winter in Guangzhou using a humidified nephelometer system and aerosol chemical speciation monitor. A modified multilinear regression model was proposed to retrieve dry-state mass scattering efficiencies (MSE, defined as scattering coefficient per unit aerosol mass) of aerosol components. The more oxidized oxygenated organic aerosol (MOOA) with O/C ratio of 1.17 was identified as the most efficient light scattering aerosol component. On average, 34% mass contribution of MOOA to total submicron organic aerosol mass contributed 51% of dry-state organic aerosol scattering. The overall organic aerosol hygroscopicity parameter κOA was quantified directly through hygroscopicity closure, and hygroscopicity parameters of SOA components were further retrieved using multilinear regression model by assuming hydrophobic properties of primary organic aerosols. The highest water uptake ability of MOOA among organic aerosol factors was revealed with κMOOA reaching 0.23, thus further enhancing the fractional contribution of MOOA in ambient organic aerosol scattering. In particular, the scattering abilities of MOOA was found to be even higher than those of ammonium nitrate under RH of <70% which was identified as the most efficient inorganic scattering aerosol component, demonstrating that MOOA had the strongest scattering abilities in ambient air (average RH of 57%) during winter in Guangzhou. During the observation period, secondary aerosols contributed dominantly to visibility degradation (~70%) with substantial contributions from MOOA (16% on average), demonstrating significant impacts of MOOA on visibility degradations. The findings of this study demonstrate that more attention needs to be paid to SOA property changes in future visibility improvement investigations. Also, more comprehensive studies on MOOA physical properties and chemical formation are needed to better parameterize its radiative effects in models and implement targeted control strategies on MOOA precursors for visibility improvement.

How to cite: Liu, L.: Strong light scattering of highly oxygenated organic aerosols impacts significantly on visibility degradation, EGU General Assembly 2024, Vienna, Austria, 14–19 Apr 2024, EGU24-2324, https://doi.org/10.5194/egusphere-egu24-2324, 2024.

EGU24-3189 | ECS | Posters on site | AS3.3

A universal method to isolate, enrich, and quantify atmospheric organosulfates 

Jialiang Ma, Cunliang Zhao, Natalie Reininger, and Alexander Vogel

Organosulfates (OSs) are ubiquitous compounds in ambient aerosols, being formed by multiphase chemistry.1,2 However, accurate quantification of unknown and suspected OSs remains difficult. One of the main reasons for this is the limited availability of authentic standards. Furthermore, a large amount of unknown and not yet identified OSs might remain undetected in ambient samples.

To overcome the two main difficulties, we developed a new solid phase extraction (SPE) method to enrich and fractionate OSs compounds. Preliminary result shows that with this approach the majority of the OSs fraction was separated from the native sample matrix. Furthermore, we can easily enrich the native extract by a factor of ~300 and get good recovery of those targeted OS-compounds. Following this SPE-method, a charged aerosol detector (CAD) was employed for the quantification of the OSs fraction extracts after chromatographic separation. CAD, which has universal response as a prominent feature, is advantageous to the quantification of non-volatile species without the necessity for the preparation of authentic or surrogate standards.3 

The sample preparation by SPE greatly reduced the complexity of both chromatograms detected with a mass spectrometer and the CAD, thereby increasing our confidence for the peak identification and quantification. Although, CAD has a sub-nanogram sensitivity, our classical extraction method for ambient filter samples most OSs are below the limit of detection. Therefore, the SPE enrichment of an ambient filter extraction is necessary for CAD detection.

Moreover, the volatility for majority OSs compounds is very low, which perfectly match the CAD feature. With this method we can identify and quantify ~40 OSs compounds and nitrooxy-OSs in an ambient Chinese PM2.5 sample. This work emphasizes the potential of the SPE approach in combination with CAD to quantify the unknown and suspected OSs precisely in ambient air. The presented method is able to quantify the individual OS compounds without authentic or surrogate standards.


References

1. Brüggemann, M. et al. Organosulfates in Ambient Aerosol: State of Knowledge and Future Research Directions on Formation, Abundance, Fate, and Importance. Environ. Sci. Technol. 54, 3767–3782 (2020).

2. Gao, K. & Zhu, T. Analytical methods for organosulfate detection in aerosol particles: Current status and future perspectives. Sci. Total Environ. 784, 1–10 (2021).

3. Vehovec, T. & Obreza, A. Review of operating principle and applications of the charged aerosol detector. J. Chromatogr. A 1217, 1549–1556 (2010).

How to cite: Ma, J., Zhao, C., Reininger, N., and Vogel, A.: A universal method to isolate, enrich, and quantify atmospheric organosulfates, EGU General Assembly 2024, Vienna, Austria, 14–19 Apr 2024, EGU24-3189, https://doi.org/10.5194/egusphere-egu24-3189, 2024.

EGU24-3353 | ECS | Posters on site | AS3.3 | Highlight

Modeling Iron-Copper Cycling in Photochemically Aged Organic Aerosol Particles 

Kevin Kilchhofer, Ashmi Mishra, Peter A. Alpert, Lucia Iezzi, Allan K. Bertram, Thomas Berkemeier, and Markus Ammann

Photochemical aging of redox-active transition metals in organic aerosol (OA) particles contributes
to an increase in oxidative potential and changes their atmospheric fate. We evaluated the
poorly characterized role of copper as a highly emitted transition metal in a well-established iron-
containing proxy for SOA material (citric acid with iron citrate). Here, we computationally
model photochemical aging experiments from a coated-wall flow-tube to derive an iron-copper cy-
cling mechanism that explains the enhanced aging with copper found in scanning transition X-ray
microscope measurements. Aging was carried out under UV light irradiation (λ = 365 nm) at at-
mospherically relevant residence times as a function of relative humidity. We measure volatilized
CO2as the first decarboxylation product of iron citrate to quantify the rate of photochemical iron
redox cycling. For kinetic modeling, we utilized the kinetic multilayer model of aerosol surface and
bulk chemistry (KM-SUB) for films, in which we incorporated chemical reaction mechanisms
built on previous work. The model explicitly treats photo- and redox chemistry along with the
mass transfer of reactants and products between the condensed and gas phase, and is used to
describe CO2production in the flow reactor. The model was applied to data from experiments
using iron citrate alone and to mixed iron and copper citrate experiments. We tested chemical
mechanisms for iron-copper cycling found in the literature and a newly developed mecha-
nism [3]. Inverse modeling and global optimization techniques were used to constrain kinetic
parameters and optimize the chemical reaction mechanism. In addition, some physical para-
meters were quantified anew by measuring the viscosity of aged and non-aged iron-copper citric
acid particles. This supports the KM-SUB modeling, including exact microphysical properties un-
der different humidity and/or aging conditions. The new model uniquely includes redox reactions
between iron and copper complexes in a multiphase system, which may elucidate the role of photo-
chemically active OA in the atmosphere. In future work, the model will also be used for similar
aging processes with SOA such as α-pinene and OA particles containing nitrate and/or iodine
species.


How to cite: Kilchhofer, K., Mishra, A., Alpert, P. A., Iezzi, L., Bertram, A. K., Berkemeier, T., and Ammann, M.: Modeling Iron-Copper Cycling in Photochemically Aged Organic Aerosol Particles, EGU General Assembly 2024, Vienna, Austria, 14–19 Apr 2024, EGU24-3353, https://doi.org/10.5194/egusphere-egu24-3353, 2024.

Determining the chemical composition of organic aerosols (OA) is still challenging and requires accurate and precise mass spectrometric measurements. Understanding the chemical composition of these OA can provide crucial insight into the origins, formation, and characteristics of OA.  A particularly demanding environment for the characterization of OA is the Po-Valley (Itay) since it is one of the European hotspots for air pollution. The main reasons for the air pollution here are intensive agriculture, livestock breeding and industrial areas in combination with unfavorable topographic and meteorological conditions. This combination can lead to long, stagnant weather conditions, resulting in the accumulation of atmospheric pollutants in the valley.

The interaction of these factors was investigated during the ALFA (Aerosol Loadings of the Future Atmosphere) measurement campaign in Schivenoglia (Lombardy, Italy) from September to November 2023. During this campaign, we deployed an ultrahigh-resolution mass spectrometry system on an agricultural field site for the first time to measure in real-time how agricultural activities influence OA's formation and chemical composition. For a comprehensive investigation, we equipped a measurement container capable of assessing particle phase composition. The chemical analyses of aerosols were conducted by measuring with an atmospheric pressure chemical ionization Orbitrap mass spectrometer (APCI-Orbitrap-MS), which operated continuously in either positive or negative full-MS mode or was selectively used for targeted MS2 fragmentation experiments. Additionally, we deployed an Aerosol Chemical Speciation Monitor (ACSM) in tandem with the Orbitrap measurements to reinforce the online measurement results and providing quantitative information.

With this mode of operation, we obtained time series for diurnal cycles of various OA and recorded individual events of biomass-burning. Especially worth mentioning are strong diurnal cycles of organic nitrates (C8H13O8N, C8H11O8N and C10H17O7N), which reach their peak concentration at night and are completely depleted during the day. On the contrary, and mainly influenced by daytime photochemistry, diurnal cycles of MBTCA (C8H12O6) and shikimic acid (C7H10O5), which peak during the day and decrease at night, were detected. Additionally, biomass-burning events were detected in real-time, during which typical biomass-burning markers such as levoglucosan (C6H10O5), vanillin (C8H8O3), galactosan (C6H12O6) increased significantly.

Overall, during this measurement campaign, we successfully deployed an APCI-Orbitrap-MS into a field-side measurement station for the first time without the need for complicated infrastructure. The use of this method has demonstrated many benefits, which will be presented in this work.

How to cite: David, J., D´Angelo, L., Simon, M., and Vogel, A.: Real-Time Measurements of Biomass-Burning and Secondary Organic Aerosol Composition in the Po Valley using Ultra-High Resolution (Orbitrap) Mass Spectrometry, EGU General Assembly 2024, Vienna, Austria, 14–19 Apr 2024, EGU24-3434, https://doi.org/10.5194/egusphere-egu24-3434, 2024.

EGU24-4246 | ECS | Posters on site | AS3.3

New insights into the sources of atmospheric organic aerosols in East China: a comparison of online molecule-level and bulk measurements 

Dafeng Ge, Wei Nie, Yuliang Liu, Dandan Huang, Chao Yan, Jinbo Wang, Yuanyuan Li, Chong Liu, Lei Wang, Jiaping Wang, Xuguang Chi, and Aijun Ding

Organic aerosols (OA) are of great concern because they contribute to haze pollution, threaten human health and affect the radiation balance. However, tracking OA evolution in real time at the molecular level is still limited, hindering a comprehensive understanding of their origins and behaviors. In this study, we investigated wintertime OA in a megacity in East China by combining simultaneous measurements from an extractive electrospray time-of-flight mass spectrometer (EESI-TOF) and a high-resolution time-of-flight aerosol mass spectrometer (HR-TOF-AMS). AMS results show that the OA mass concentration account for about 27% of non-refractory submicron particulate matters (NR-PM1) on average during the measurement. Speciated-organic data from EESI-TOF further reveals that CxHyOz and CxHyN1-2Oz are the predominant components of OA, contributing over 70% and 20%, respectively. By performing factorization analysis of data obtained from both instruments, we found that traffic, cooking and biomass burning are major primary sources of OA, but most of OA (>70% for EESI-TOF, >55% for AMS) come from secondary production. Compared to AMS, EESI-TOF misses hydrocarbon-like OA but owns advances in providing molecular information on oxygenated OA, revealing that aromatics and aliphatics are important precursors. Specifically, EESI-TOF further splits the less oxidized secondary organic aerosols (SOA) into two factors with distinct molecular compositions, possibly resulted from diverse source regions. Importantly, EESI-TOF additionally identifies two factors based on the tracer molecules, one possibly related to plasticizers and the other representing the SOA formation from the oxidation of monoterpenes by NO3 radicals. In conclusion, our findings suggest that EESI-TOF is highly complementary to the widely used AMS, providing valuable molecular information that aids in uncovering chemical processes underlying the formation of OA, especially in the highly complex urban environment.

How to cite: Ge, D., Nie, W., Liu, Y., Huang, D., Yan, C., Wang, J., Li, Y., Liu, C., Wang, L., Wang, J., Chi, X., and Ding, A.: New insights into the sources of atmospheric organic aerosols in East China: a comparison of online molecule-level and bulk measurements, EGU General Assembly 2024, Vienna, Austria, 14–19 Apr 2024, EGU24-4246, https://doi.org/10.5194/egusphere-egu24-4246, 2024.

EGU24-5130 | ECS | Orals | AS3.3

Molecular characterization of the formation and aging of biomass burning-derived organic aerosols 

Cecilie Carstens, David Bell, Félix Sari Doré, Imad Zgheib, Jens Top, Clément Dubois, Yanjun Zhang, Juliette Dignum, Carys Lynch, Chen Le, Sébastien Perrier, Mathieu Cazaunau, Imad El Haddad, David De Haan, Bénédicte Picquet-Varrault, and Matthieu Riva

Secondary organic aerosols (SOA) have significant effects on visibility1, human health2, and climate3. They are formed from the oxidation of volatile organic compounds (VOCs) in the atmosphere, leading to less volatile oxidation products that can subsequently partition into, or react with existing, aerosol particles.4-5 Biomass burning (BB) is estimated to be the second-largest source of VOCs and the largest source of fine OA globally.6 Extreme fires have been estimated to increase by 30% by 2050, which will greatly increase the concentration of BB VOCs and OA in the atmosphere. While photochemistry and humidity are known to influence SOA formation and aging,7–10 their impacts on BB-SOA remain poorly constrained and should be addressed to better capture the evolution of BB-SOA in the atmosphere.

In this work, an oxygenated aromatic BB-marker, i.e., o-cresol (C7H8O), and two types of fuels (South African grass and chaparral from California) were used to study the chemical processes leading to the formation and aging of BB-SOA. The experiments were conducted in simulation chambers at PSI and LISA, respectively. Various oxidants (OH, O3, NO3) and humidity levels were used for these experiments, to explore gas- and particle-oxidation processes. A fast-switching chemical-ionization Orbitrap mass spectrometer, and a Vocus proton-transfer-reaction mass spectrometer were used to characterize gaseous species, while BB-SOA were characterized using an extractive electrospray ionization mass spectrometer, and a newly developed Vocus wall-less aerosol load - evaporator (WALL-E) AIM mass spectrometer.


1 Finlayson-Pitts, B. J. et al. Chemistry of the upper and lower atmosphere: theory, experiments, and applications; Academic Press: San Diego, 2000.
2 Nel, A. Science 2005, 308, 804–805.
3 Boucher, O. et al. IPCC Report 2013, 571–657.
4 Ziemann, P. J. et al. Chem. Soc. Rev. 2012, 41, 6582.
5 Srivastava, D. et al. NPJ Clim. Atmos. Sci. 2022, 5, 22.
6Akagi, S. K. et al. Atmos. Chem. Phys. 2011, 11, 4039–4072.
7 McNeill, V. F. Environ. Sci. & Technol. 2015, 49, 1237–1244.
8 Xu, W. et al. Environ. Sci. & Technol. 2017, 51, 762–770
9 Kuang, Y. et al. Environ. Sci. & Technol. 2020, 54, 3849–3860.
10 Wang, J. et al. Proc. Natl. Acad. Sci. (PNAS), 2021, 118.

How to cite: Carstens, C., Bell, D., Sari Doré, F., Zgheib, I., Top, J., Dubois, C., Zhang, Y., Dignum, J., Lynch, C., Le, C., Perrier, S., Cazaunau, M., El Haddad, I., De Haan, D., Picquet-Varrault, B., and Riva, M.: Molecular characterization of the formation and aging of biomass burning-derived organic aerosols, EGU General Assembly 2024, Vienna, Austria, 14–19 Apr 2024, EGU24-5130, https://doi.org/10.5194/egusphere-egu24-5130, 2024.

EGU24-5583 | ECS | Posters on site | AS3.3

Investigating the Chemical Composition of Organic Aerosols and their Contribution to the Oxidative Potential 

Anna Breuninger, Alexander Vogel, and Sarah Steimer

Atmospheric aerosols play an important role not only due to the effect on climate but especially because of the adverse effects on human health, which studies consistently link to the exposure to particulate matter. Here, especially fine particles below a diameter of 2.5 μm can enter deep into the lungs, causing inflammation or translocate into the bloodstream and eventually lead to further disease.

To investigate and describe the potential toxicity of atmospheric particles, the oxidative potential (OP) can be measured. Since particles can be formed by many reaction paths and therefore be a mixture of many compounds, a deeper understanding of the composition is needed in order to understand the main chemical drivers for OP. It is known, that especially metals and secondary organic aerosols (SOA) lead to OP, but in order to attribute sources, a
further chemical characterization of SOA, linked to OP, is needed.

In this study, 42 samples from different locations in Frankfurt, Germany and Beijing, China have been measured by inductively coupled plasma - mass spectrometry (ICP-MS), in order to obtain the metal content and by high pressure liquid chromatography - high resolution mass spectrometry (HPLC-HRMS) to determine organic compounds and their composition groups via non target analysis. The OP then was determined by extracting the filters and either measuring directly or treating with Chelex® 100 to remove the metals and carry out the measurement afterward. By employing this technique, the contribution of metals and organics can be investigated separately to gain a better understanding of the OP caused by SOA. In order to examine the contribution of different compound groups to OP, a hierarchical cluster analysis and several Pearson correlations have been carried out. By this approach, similarities between samples can be observed, which then might give an indication about relevant compounds. Moreover, correlations between the variability of the OP throughout the sample and the variability of compounds point to certain OP-effective compounds.

First results show that the metal containing extracts have a higher volume-normalized OP (OPV ) compared to the non-metal ones, with 0.2 to 5 nmol DTT min-1m-3, which is mainly due to manganese and copper. After the Chelex® 100 treatment, there is still a OPV of 0.1 up to 4 nmol DTT min-1m-3, indicating the significance of organic matter, causing the oxidative potential. Comparing the different locations, the samples from Beijing show an OP up to four
times higher than samples from Frankfurt. Looking deeper into the chemical composition, especially chemical groups containing phosphor and nitrogen, such as CHOP and CHNO, correlate with high OP.

How to cite: Breuninger, A., Vogel, A., and Steimer, S.: Investigating the Chemical Composition of Organic Aerosols and their Contribution to the Oxidative Potential, EGU General Assembly 2024, Vienna, Austria, 14–19 Apr 2024, EGU24-5583, https://doi.org/10.5194/egusphere-egu24-5583, 2024.

EGU24-5660 | ECS | Orals | AS3.3

Molecular-level insight into the organic aerosol formation under the interactions between VOCs and inorganic sulfate and NOx 

Yujue Wang, Song Guo, Zhijun Wu, Yang Zhou, Jianzhen Yu, Min Hu, and Huiwang Gao

Field observations were conducted in various environments, from polluted urban to clean marine atmospheres, to understand the organic aerosol formation under the influence of inorganic sulfate and NOx. Molecular compositions of organic aerosols were analyzed using an ultrahigh-resolution mass spectrometer. The S-containing and N-containing organics are important fractions for SOA accumulation during pollution episodes or under high humidity conditions. To further investigate their formation pathways, organosulfates (OSs) and nitro-aromatics (NACs) were quantified using HPLC-MS.

Particulate OSs were formed via acid-catalyzed aqueous-phase reactions in the presence of sulfate aerosols. When sulfate dominated the accumulation of secondary inorganic aerosols, OS formation would be obviously promoted as the increasing of acidic sulfate aerosols, aerosol liquid water and acidity. The formation of biogenic OSs and their notable roles in organic aerosols calls for elaboration in regions with substantial biogenic-anthropogenic interactions and over marine areas with high biological activity and high SST.

Anthropogenic NOx influences the SOA formation via nighttime NO3-initiated oxidation of monoterpene, as well as involving in the oxidation of toluene and benzene. As the increasing of NOx concentration levels, the formation of nitrooxy-OSs or NACs shift from NOx-limited to NOx-excess regimes. Transported anthropogenic NOx from continental outflows would obviously enhance the nitrooxy-OSs formation in organic aerosols over marginal seas.

How to cite: Wang, Y., Guo, S., Wu, Z., Zhou, Y., Yu, J., Hu, M., and Gao, H.: Molecular-level insight into the organic aerosol formation under the interactions between VOCs and inorganic sulfate and NOx, EGU General Assembly 2024, Vienna, Austria, 14–19 Apr 2024, EGU24-5660, https://doi.org/10.5194/egusphere-egu24-5660, 2024.

C2-3 organosulfates (C2-3OSs) are significant contributors to the overall abundance of OSs and secondary organic aerosols, featuring widespread occurrence and notable impact on aerosol properties. However, due to the lack of authentic standards and demanding techniques, accurate quantification of these C2-3OSs remains scarce, causing bias in our understanding of their atmospheric chemistry. Existing data primarily rely on offline liquid chromatography/electrospray ionization-mass spectrometry (LC/ESI-MS) analysis. Neglecting matrix effects, as well as variations in instrument configurations across laboratories in implementing LC separation and electrospray ionization, introduce large uncertainties when comparing results. In this study, we first evaluated the efficacy of two previously adopted LC methods – reverse-phase liquid chromatography (RPLC) and hydrophilic interaction liquid chromatography (HILIC) – coupled with Orbitrap MS, in characterizing and quantifying PM2.5-bound C2-3OSs. Ambient aerosol samples were collected at four sites in southern China (two in Hong Kong and two in Guangzhou) during the summer (SM) and autumn+winter (AW) of 2020. We focused on three C2-3OSs with available authentic standards: hydroxyacetone sulfate (HAS), glycolic acid sulfate (GAS), and lactic acid sulfate (LAS). Our results demonstrated that HILIC outperformed RPLC in retentive capacities and peak resolving abilities, generating more reliable quantitative measurements. RPLC had poor retention of small polar analytes. The RPLC/ESI-MS method significantly underestimated the concentrations of C2-3OSs, which was attributed to the prevalent matrix effect that occurred in the gradient-front and the lack of adequate internal standards for compensation. This analytical work underscores the need for careful methodological considerations when studying small and polar OSs like C2-3OSs.

Based on the HILIC/ESI-MS analysis, the sum concentration of C2-3OSs across the four sites was dominated by GAS (avg. 37±56 ng/m3) and was in the range of 0.2-517 ng/m3, equivalent to 0.004-0.9% of PM2.5 mass. The three C2-3OSs exhibited strong correlations, suggesting their common or similar precursors and/or formation pathways. Despite geographical proximity, the Guangzhou sites recorded higher C2-3OSs abundance than the Hong Kong sites (stricter air quality regulations). Contrary to the seasonality of biogenic emissions, C2-3OSs concentrations were generally higher in AW than in SM for both regions, plausibly attributed to the mild seasonal contrasts in meteorological conditions (ΔTSM-AW=8°C, ΔRHSM-AW=15%) and the regional transport of polluted inland air by the northeasterly monsoon wind during AW. Key factors influencing C2-3OSs formation included aerosol acidity, liquid water content, sulfate, Ox (O3+NO2), and trace metals (e.g., Fe). Notably, a typhoon-induced episode captured exceptionally high levels of C2-3OSs, characterized by regional transport of air masses from polluted northwestern regions, stagnant air, aerosol pH at ~2.5, and high Ox & low NO conditions. These field-based observations uncover the intricate interplays between biogenic emissions, atmospheric chemistry, and meteorological parameters, especially highlighting the importance of atmospheric oxidation capacity, regional transport, and potential atmospheric aging processes in understanding C2-3OSs formation.

How to cite: Liang, S., Wang, Y., and Yu, J. Z.: Particulate C2-3 Organosulfates: Method Development and Investigation of Environmental Factors Influencing Formation Processes, EGU General Assembly 2024, Vienna, Austria, 14–19 Apr 2024, EGU24-5668, https://doi.org/10.5194/egusphere-egu24-5668, 2024.

EGU24-5771 | ECS | Posters on site | AS3.3

Sources of organic aerosols in Central Europe identified with labelled species in a chemical transport model and a complementary measurement campaign. 

Hanna Wiedenhaus, Roland Schroedner, Ralf Wolke, Shubhi Arora, Laurent Poulain, Radek Lhotka, and Jaroslav Schwarz

This work is part of the project ‘TRACE’: Transport and transformation of atmospheric aerosol across Central Europe with emphasis on anthropogenic sources. Synergic measurement methods and state-of-the art modelling tools are combined to obtain a comprehensive picture of the contribution of transported anthropogenic aerosol compared to local emissions.

Measurement data are available for three sites which are located in an important transition area between highly polluted and less polluted regions in Central Europe for winter 2021. This study focuses on the application of a simplified labelling approach within the COSMO-MUSCAT model (Wolke et al., 2012) for the identification of particulate matter sources. For this purpose, emissions of organic matter (OM) and black carbon were tracked by emission class and source country with a spatial resolution of about 2 km.

The modelled source attribution shows a high contribution of residential heating to organic matter sources. While the model reproduces the OM values at two of our measuring stations quite well, the measured data are strongly underestimated at one station near Prague. Since we can reproduce the black carbon concentrations for this station reasonably well, we are confident that we are capturing the primary aerosols correctly.

We assume an underestimation of anthropogenic volatile organic compound (AVOC) emissions from residential wood and coal burning, leading to an underestimation of secondary organic aerosols (SOA) produced by these precursors. Although biogenic sources account for the majority of VOCs, in urban environments light aromatic hydrocarbons emitted during combustion processes can contribute up to 30% of VOCs (Srivastava et al., 2022). Due to the low temperature dependence of these AVOCs, SOA formation occurs even in winter at lower temperatures (Bruns et al., 2016). This indicates that AVOC precursors could account for a considerable proportion of our SOA budget.

So far, only the contribution of biogenic VOCs to SOA formation has been evaluated and improved in COSMO-MUSCAT. First results of the implementation of a new emission factor for anthropogenic VOCs from combustion sources and a corresponding SOA yield in COSMO-MUSCAT will be presented.


E. A. Bruns et al., “Identification of significant precursor gases of secondary organic aerosols from residential wood combustion,” Scientific Reports, vol. 6, no. 1, Jun. 2016, doi: DOI: 10.1038/srep27881.

D. Srivastava, T. V. Vu, S. Tong, Z. Shi, and R. M. Harrison, “Formation of secondary organic aerosols from anthropogenic precursors in laboratory studies,” npj Climate and Atmospheric Science, vol. 5, no. 1, Mar. 2022, doi: https://doi.org/10.1038/s41612-022-00238-6.

R. Wolke, W. Schröder, R. Schrödner, and E. Renner, “Influence of grid resolution and meteorological forcing on simulated European air quality: A sensitivity study with the modeling system COSMO–MUSCAT,” Atmospheric Environment, vol. 53, pp. 110–130, Jun. 2012, doi: doi:10.1016/j.atmosenv.2012.02.085.

How to cite: Wiedenhaus, H., Schroedner, R., Wolke, R., Arora, S., Poulain, L., Lhotka, R., and Schwarz, J.: Sources of organic aerosols in Central Europe identified with labelled species in a chemical transport model and a complementary measurement campaign., EGU General Assembly 2024, Vienna, Austria, 14–19 Apr 2024, EGU24-5771, https://doi.org/10.5194/egusphere-egu24-5771, 2024.

EGU24-5942 | Posters on site | AS3.3

Effects of Anthropogenic Emissions on Secondary Organic Aerosol Formation from Biogenic Volatile Organic Compound 

Guangzhao Xie, Aristeidis Voliotis, Thomas Bannan, Hugh Coe, and Gordon McFiggans

Atmospheric secondary organic aerosols (SOA) can significantly affect air quality, climate, and human health. The formation of SOA is attributable to the vapour phase oxidation of biogenic or anthropogenic organic compounds and subsequent partitioning to the particulate phase. The oxidation of biogenic volatile organic compounds (bVOCs), such as monoterpenes, has received extensive attention owing to their larger global emissions compared with anthropogenic volatile organic compounds (aVOCs). α-Pinene, constituting nearly 50% of the global monoterpene emissions and with a high SOA forming efficiency is thereby considered one of the most important SOA precursors in the atmosphere.

The essential characteristics of α-pinene SOA, such as the oxidation pathways, molecular constitutions, volatility, and yields, have been widely studied in chamber experiments. However, most of them focused on single precursor systems. In the real atmosphere, SOA formation is influenced by the interactions of other molecules. Human emissions, such as the aVOCs, NOx, and CO, are likely to affect α-pinene SOA formation processes. Thus, the chamber investigation on SOA formation should be considered more realistically. Establishing a framework to understand the interactions of mixed SOA precursors in the presence of NOx and CO is needed.

Diesel vehicular emission is an important anthropogenic source for SOA precursors in urban areas. n-Dodecane (C12H26) represents a reasonable proxy for intermediate volatility organic compounds (IVOC) in diesel exhaust. In this study, we plan to investigate the SOA formation from (i) α-pinene and n-dodecane system and (ii) α-pinene and diesel exhaust system, under controlled NOx and CO conditions.

The experiments are conducted at the Manchester Aerosol Chamber (MAC) facility, which is an 18 m3 fluorinated ethylene propylene bag. A combination of gas-phase and particle-phase analytical instruments are employed for the experiments: High-Resolution Time-of-Flight Chemical Ionization Mass Spectrometer with a Filter Inlet for Gases and Aerosols (FIGAERO-CIMS) equipped with iodide reagent, Proton-transfer-reaction Time-of-Flight Mass Spectrometry (PTR-ToF-MS), Differential Mobility Particle Sizer (DMPS), Compact Time-of-Flight Aerosol Mass Spectrometer (C-ToF-AMS), and Gas Analysers.

This work reports the changes in SOA compositions, SOA particle volatility, and yields in the mixtures of α-pinene and n-dodecane/diesel exhaust under controlled NOx and CO conditions. The results provide new insights into SOA formation in mixtures.

How to cite: Xie, G., Voliotis, A., Bannan, T., Coe, H., and McFiggans, G.: Effects of Anthropogenic Emissions on Secondary Organic Aerosol Formation from Biogenic Volatile Organic Compound, EGU General Assembly 2024, Vienna, Austria, 14–19 Apr 2024, EGU24-5942, https://doi.org/10.5194/egusphere-egu24-5942, 2024.

EGU24-6074 | Orals | AS3.3

Real-time monitoring of dynamic isomer populations with CI-SLIM IMS-MS 

Matthieu Riva, Sebastian Gerber, Megan Claflin, Peter Mettke, Molly Frauenheim, Rebecca Rice, Avram Gold, Jason Surratt, Vasyl Yatsyna, Stephan Graf, Manjula Canagaratna, Hartmut Herrmann, Urs Rohner, Michael Kamrath, and Felipe Lopez-Hilfiker

Ion mobility spectrometry (IMS) using Structures for Lossless Ion Manipulations (SLIM) is an emerging powerful tool for rapid isomer separations. This technology offers high mobility resolution due to prolonged ion mobility path lengths that are achieved on a small form factor separation device. In this work, we interface SLIM IMS separation with a chemical ionization source, which allows one to sample from the gas- and particle-phases directly. As such, one can monitor dynamic isomer populations in ambient air in real-time without prior sample preparation. This technology opens the door to new possibilities in atmospheric chemistry where isomer distribution is expected to play a key role in gas phase processes and in the formation of organic aerosols.

                  The CI-IMS-TOF instrument built by TOFWERK produces ions via a two-step chemical ionization process, which involves 1) producing reagent ions and 2) ionizing neutral analyte molecules via the reagent ions through either charge transfer or adduct formation. Once generated, these secondary ions travel into the SLIM IMS region, where a series of DC- and AC-electrodes on printed circuit boards create a traveling wave driving force. As the ions travel through the helium buffer gas, they separate based on their rotationally averaged collision cross-sections.

In the present work, various experiments were performed using an aerosol flow tube reactor and an atmospheric simulation chamber to recreate atmospheric conditions. Gas-phase oxidation of isoprene was used to explore the capabilities of the CI-SLIM IMS-MS under atmospheric relevant conditions. Firstly, the most important oxidation products produced from the OH-oxidation of isoprene were used including methacrolein, methyl vinyl ketone, isoprene epoxy diols (IEPOX), isoprene hydroxy hydroperoxide (1,2 and 4,3-ISOPOOH), and other C5H10O3 reactive uptake products as a single component or as a mixture to first evaluate the capabilities of the CI-SLIM IMS-MS at resolving the different isomers. Secondly, the reactive uptake of IEPOX onto acidic particles and OH-initiated oxidation (low and high NO regimes) of isoprene were studied to characterize the dynamic of the isomers generated within the simulation chamber under various environmental conditions. Results will be presented to demonstrate the capabilities of the newly developed CI-SLIM IMS-MS at resolving isomers in real time.

How to cite: Riva, M., Gerber, S., Claflin, M., Mettke, P., Frauenheim, M., Rice, R., Gold, A., Surratt, J., Yatsyna, V., Graf, S., Canagaratna, M., Herrmann, H., Rohner, U., Kamrath, M., and Lopez-Hilfiker, F.: Real-time monitoring of dynamic isomer populations with CI-SLIM IMS-MS, EGU General Assembly 2024, Vienna, Austria, 14–19 Apr 2024, EGU24-6074, https://doi.org/10.5194/egusphere-egu24-6074, 2024.

EGU24-6167 | Orals | AS3.3

Investigations on the organic aerosol in the Po Valley: ultra-high resolution mass spectrometry and non-target analysis of urban and rural sites in the well-known European air pollution hot-spot 

Luca D’Angelo, Florian Ungeheuer, Jialiang Ma, Georg Menzel, Eleonora Cuccia, Cristina Colombi, Umberto Dal Santo, Beatrice Biffi, and Alexander Lucas Vogel

It is a matter of fact that exposure to persistently high concentrations of atmospheric particulate matter (PM) leads to respiratory, cardiovascular, and brain dementia diseases[1]. Establishing a direct link between the chemical composition of PM and its detrimental health effects could potentially inform policies to act on the sources of specific harmful compounds. Unfortunately, PM is composed of thousands of organic compounds, and for most of them, their sources, molecular structures, and fates are unknown[2]. Significant progress in investigating organic particles is successfully achieved by the application of ultra-high-resolution mass spectrometry, which allows for the determination of the exact mass of unknown substances[3]. Finally, non-target analysis leads to the assignment of molecular formulae of organic compounds, which is the first step in identification and understanding their behavior in the atmosphere[4].

Thus, we analyzed the fine fraction of PM with a soft ionization technique (heated electrospray ionization) and an Orbitrap mass spectrometer after a separation with an ultrahigh-performance liquid chromatograph. 1-year of PM2.5 samples were collected daily at two sites in the renowned European air pollution hot-spot, i.e. the Po Valley: Milan, the most populated city in the basin, and Schivenoglia, a rural background site representative of the countryside. Using a non-target screening approach, we identified more than 5000 features for each ionization mode, subsequently investigated alongside the meteorological conditions observed throughout the year. The results indicate pronounced seasonality in CHO compounds, with peaks during spring-summertime in both intensity and the number of features. Moreover, sulfur-containing compounds (in negative mode) exhibit a similar pattern, while N-containing compounds contribute significantly to overall intensity during the colder seasons. In the urban site, Milan, nitrogen-containing compounds intensity increased in mid-October, suggesting the influence of biomass burning as a heating source. This is further supported by an increase in mono- and polycyclic aromatic compounds. The CHN-group shows distinct behavior in positive mode: aliphatic compounds exhibit limited seasonality in number, while mono-aromatics experience a drastic increase in intensity (such as aliphatic ones) and number during wintertime. Finally, a detailed investigation of features contributing significantly to overall intensity was conducted for each site. This highlights variability in the chemical composition of the organic particle phase, and hypotheses regarding their identity were formulated based on their MS2 fragmentation spectra matches with the available libraries such as mzCloud and the Aerosolomic database[5].


[1] Puris, E., et al. (2022). Air pollution exposure increases ABCB1 and ASCT1 transporter levels in mouse cortex. Environ Toxicol Pharmacol.

[2] López, A., et al. (2022). Identification of Unknown Substances in Ambient Air (PM10), Profiles and Differences between Rural, Urban and Industrial Areas. Toxics

[3] Ma, J., et al. (2022). Nontarget Screening Exhibits a Seasonal Cycle of PM 2.5 Organic Aerosol Composition in Beijing. Environ. Sci. Technol.

[4] Nozière, B., et al. (2015) The Molecular Identification of Organic Compounds in the Atmosphere: State of the Art and Challenges. Chem. Rev.

[5] Thoma, M., et al. (2022). Mass spectrometry-based Aerosolomics: a new approach to resolve sources, composition, and partitioning of secondary organic aerosol. Atmos. Meas. Tech.

How to cite: D’Angelo, L., Ungeheuer, F., Ma, J., Menzel, G., Cuccia, E., Colombi, C., Dal Santo, U., Biffi, B., and Vogel, A. L.: Investigations on the organic aerosol in the Po Valley: ultra-high resolution mass spectrometry and non-target analysis of urban and rural sites in the well-known European air pollution hot-spot, EGU General Assembly 2024, Vienna, Austria, 14–19 Apr 2024, EGU24-6167, https://doi.org/10.5194/egusphere-egu24-6167, 2024.

EGU24-6180 | ECS | Posters on site | AS3.3 | Highlight

Pesticides in Particulate Matter (PM2.5) at the Rural Background Station Taunus Observatory, Germany  

Franziska Saur and Alexander L. Vogel

No other group of anthropogenic chemicals has been intentionally released on such a large scale as pesticides. Once in the environment, they can spread through various pathways (surface runoff, surface water, infiltration), which are already being analyzed in detail by a broad monitoring system and research projects. An often overlooked and inadequately quantified process is airborne transport. Through this transport route, pesticides can be transported over large distances and end up far away from the original emission source.

To investigate pesticide concentrations, particulate matter filter samples (PM2.5) were collected continuously at the Taunus Observatory using a high-volume sampler. The measurement station is situated in the Taunus mountain range at an elevation of 826°m. The location is classified as a rural background station with no nearby urban or agricultural areas. The collected filters underwent extraction, enrichment, and analysis using a high-performance liquid chromatography system coupled to an ultra-high resolution (Orbitrap) mass spectrometer. Samples from April 2021 to May 2022 were analyzed in two-week increments. For a more detailed examination of diurnal cycles, two-week periods were analyzed with day and night resolution Additionally, backward trajectories were analyzed to identify potential sources.

By applying this technique, we successfully identified and quantified two fungicides (Pyrimethanil, Dimetomorph) and six different herbicides (e.g., Terbuthylazine, Prosulfocarb). The year-long data collection allowed the observation of seasonal variations in pesticide concentrations. The highest occurrences of pesticides were measured during spring, particularly in May. Pesticides used for winter crops showed highest concentrations in late autumn. The identified substances also included the herbicide Atrazine, which has been prohibited in Germany since 1991 and in the EU since 2002. Atrazine is typically used for corn and showed the typical patterns in its seasonality.

By applying this method, we were able to demonstrate that certain pesticides can be detected even at significant distances from potential sources. This makes it challenging to limit their occurrence and deposition to a specific area. Outstanding is the detection of Atrazine in aerosols, which has not been reported in Germany before.


How to cite: Saur, F. and Vogel, A. L.: Pesticides in Particulate Matter (PM2.5) at the Rural Background Station Taunus Observatory, Germany , EGU General Assembly 2024, Vienna, Austria, 14–19 Apr 2024, EGU24-6180, https://doi.org/10.5194/egusphere-egu24-6180, 2024.

EGU24-7441 | ECS | Orals | AS3.3

Molecular composition of secondary organic aerosol from α-pinene ozonolysis affected by relative humidity 

Hao Luo, Yindong Guo, Hongru Shen, Dan Dan Huang, Yijun Zhang, and Defeng Zhao

Biogenic volatile organic compounds (BVOC) can contribute a significant fraction to secondary organic aerosols (SOA) through atmospheric oxidation, which plays a critical role in climate change and human health. The ozonolysis of α-pinene, one of the most important BVOCs, is a canonical SOA system. At present, the effects of relative humidity (RH) on SOA composition from α-pinene+O3 reaction are still unclear. In this study, we report the SOA composition on molecular level formed in α-pinene+O3 reaction under various RH. The SOA components were measured by an Extractive ElectroSpray Ionization inlet coupled with a long Time-of-Flight Mass Spectrometer (EESI-TOF-MS). We observed RH-dependent SOA chemical composition, including larger contribution of monomer products with increasing RH, although the total O:C remained largely unchanged. The effect of RH may be attributed to the particle-phase reactions of SOA components. This study highlights the necessity of characterizing SOA composition on molecular level and of considering RH dependence of SOA chemical composition and physicochemical properties in atmospheric models.

How to cite: Luo, H., Guo, Y., Shen, H., Huang, D. D., Zhang, Y., and Zhao, D.: Molecular composition of secondary organic aerosol from α-pinene ozonolysis affected by relative humidity, EGU General Assembly 2024, Vienna, Austria, 14–19 Apr 2024, EGU24-7441, https://doi.org/10.5194/egusphere-egu24-7441, 2024.

EGU24-9842 | ECS | Orals | AS3.3

Phenomenology of organic aerosols light absorption in europe based on in situ surface observations  

Jordi Rovira, Gang Chen, Jesús Yus-Díez, Grisa Močnik, and Marco Pandolfi

Both chamber and field experiments have shown that a fraction of organic aerosols (OA), called brown carbon (BrC), can efficiently absorb UV-VIS radiation with important effects on radiation balance. However, the optical properties of BrC, and its climate effects, remain poorly understood because a variety of chemical compositions are involved and their fractions vary with source and formation process. We present a phenomenology of OA light absorption in Europe using Aethalometer (AE) data. AE data were used to calculate the black carbon (BC) and BrC contribution to the total measured absorption in the UV-VIS spectral range (babs,BC(l), babsBrC(l)). Fig. 1 shows the BrC absorption at 370 nm and shows that the BrC absorption was on average higher in urban than in rural sites.

Figure 1. Map of BrC absorption in rural and urban sites.

At 18 out of 41 sites, simultaneous ACSM (Aerosol Chemical Speciation Monitor) data were available allowing reporting the mass absorption cross-section (MAC), the imaginary refractive index (k), the k Angström Exponent (w) of OA particles and OA sources. We compared the experimental data the with Saleh’s classification, that groups BrC in four optical classes, namely very weakly (VW-BrC), weakly (W-BrC), moderately (M-BrC) and strongly (S-BrC) absorbing BrC. Preliminary results show that both MAC and k of POA sources were higher compared to SOA sources and that BBOA (biomass burning OA) followed by CCOA (coal combustion OA) and HOA (hydrocarbon-like OA) dominated the absorption by BrC.  Data reported indicate a relationship between w and k with higher w associated to less absorbing OA particles.

With this work we provide a robust experimental framework that can be used to better constrain the climate effect of OA particles represented in climate models. In our results we found that most of the measured ambient OA particles present from W to M absorption properties. Variations in OA k and w depend on the relative contribution of POA compared to SOA as also reflected by the higher k observed in winter compared to summer. Our results also demonstrate a strong variation of OA optical properties in Europe thus further confirming the complexity of OA absorption properties.

This work was supported by the FOCI Project (G.A. 101056783) and ARRS P1-0385. Action Cost COLOSSAL. We thank the COLOSSAL Team for providing OA sources and AE33 data.

Chen et al (2022). Env. Int. 166, 107325.

Nakao et al (2013). Atm. Env. 68, 273-277.

Canagaratna et al (2015). Atmos. Chem. Phys. 15, 253-272.

Saleh et al (2020). Curr. Pollution Rep. 6, 90–104.

How to cite: Rovira, J., Chen, G., Yus-Díez, J., Močnik, G., and Pandolfi, M.: Phenomenology of organic aerosols light absorption in europe based on in situ surface observations , EGU General Assembly 2024, Vienna, Austria, 14–19 Apr 2024, EGU24-9842, https://doi.org/10.5194/egusphere-egu24-9842, 2024.

EGU24-9871 | Posters on site | AS3.3

Fast and cost efficient analysis of organic molecular tracer compounds in PM for source apportionment studies 

Barend L van Drooge, Clara Jaén, and Carmen Bedia

A fast and cost-efficient off-line methodology was developed to analyze organic molecular tracer compounds in atmospheric particulate matter collected on quartz filter after high- or low-volume sampling in outdoor ambient air. The method allows the processing of 20 samples/h, and another hour per sample for analyze by GC-MS of more than 30 tracer compounds that are related to air pollution and major emission sources, such as biomass burning, plastics, personal care products, food cooking, soil dust, traffic, and secondary organic aerosol formation processes. These compounds can be used independently for source apportionment analysis, or by analyzed in combination with data from air quality, meteorology, or toxicity.

Overall, the developed methodology provides fast acquisition of data; saving time (85%) and consumables (99% solvents) in the analysis respect to conventional methods, which is very relevant for long term air pollution monitoring and large sample sets. Moreover, only a very small fraction of the whole HiVol-filter sample (<1 m3 eq.sample volume) is used for analysis, which offers the possibility of further analyses in these filters, such as toxicity tests.

Here present examples from several source apportionment studies in rural, background and urban traffic sites, relating results to toxicity.


References

van Drooge, et al. (2023). Determination of subpicogram levels of airborne polycyclic aromatic hydrocarbons for personal exposure monitoring assessment. Journal of Environmental Monitoring and Assessment, 195:368, https://doi.org/10.1007/s10661-023-10953-z

Jaén et al. (2021). Source apportionment and toxicity of PM in urban, sub-urban, and rural air quality network stations in Catalonia. Atmosphere 2021, 12, 744. https://doi.org/10.3390/atmos12060744

How to cite: van Drooge, B. L., Jaén, C., and Bedia, C.: Fast and cost efficient analysis of organic molecular tracer compounds in PM for source apportionment studies, EGU General Assembly 2024, Vienna, Austria, 14–19 Apr 2024, EGU24-9871, https://doi.org/10.5194/egusphere-egu24-9871, 2024.

EGU24-9884 | ECS | Orals | AS3.3

Vertical distribution of organic tracer compounds in atmospheric aerosols: analysis of low-volume samples from meteorological balloon flights 

Clara Jaén Flo, Isabel Díez Palet, Esther Marco Asensio, Joan Grimalt Obrador, Pilar Fernández Ramón, and Barend van Drooge

The evolution and intensity of air pollution episodes are significantly influenced by atmospheric conditions. In particular, stagnant conditions and thermal inversions often involve precautionary health warnings in populated areas. These conditions restrict the dispersion of pollutants leading to exacerbated air quality in the lower layer of the troposphere. Additionally, photochemical reactions contribute to qualitative and quantitative changes in aerosols, with secondary organic aerosols (SOA) formation processes that are not fully understood. This study aims to investigate the vertical distribution of particle-bound organic compounds and Black Carbon (BC) under both temperature inversions and standard ambient lapse rates.

Total suspended particles were simultaneously collected on filters at two different heights (1 m and 400 m) with tethered balloons equipped with low-volume air pumps and BC monitors for periods of 3-hours. Sampling campaigns were performed in industrial, sub-urban and rural background sites in different seasons during 2021 and 2022. Furthermore, sampling was conducted at two different elevations within the city of Barcelona.

Particle-bound organic molecular compounds were analyzed in the low-volume samples (<1 m³) including polycyclic aromatic hydrocarbons (PAHs) and their oxy and methyl derivatives, hopanes, biomass burning anydrosaccharides, fungal tracers, dicarboxylic acids, and secondary products of isoprene or α-pinene oxidation. After sample processing, polar compounds were analyzed with GC-MS while a high-resolution Q Exactive GC Orbitrap MS was used for the rest of compounds.

The high sensitivity and selectivity of the methodology allowed to identify and quantify a large number of organic compounds that were used as tracers to identify the contribution of the emission sources and secondary formation processes to PM. The data describes an increase of toxic exposure under temperature inversion episodes, particularly associated to primary combustion sources in the industrial and suburban sites in wintertime samples with steep vertical concentration gradients, especially before sunrise.

Conversely, vertical distribution of SOA products was not so evident. In general, these compounds were found at similar concentrations at both heights indicating a homogeneous distribution. However, in some occasions SOA was more abundant at height indicating a formation and/or an accumulation of secondary products in the residual layers.

With this work, we contribute to a better understanding of the changes in PM composition at molecular level at different altitudes to help to define effective strategies to mitigate health risks associated with high pollution episodes.

How to cite: Jaén Flo, C., Díez Palet, I., Marco Asensio, E., Grimalt Obrador, J., Fernández Ramón, P., and van Drooge, B.: Vertical distribution of organic tracer compounds in atmospheric aerosols: analysis of low-volume samples from meteorological balloon flights, EGU General Assembly 2024, Vienna, Austria, 14–19 Apr 2024, EGU24-9884, https://doi.org/10.5194/egusphere-egu24-9884, 2024.

EGU24-10108 | ECS | Orals | AS3.3

Model investigation on parameters driving the in-cloud organic acid formation at a tropical remote marine mountain site 

Erik Hans Hoffmann, Andreas Tilgner, Manuela van Pinxteren, and Hartmut Herrmann

During September/October 2017, a comprehensive field campaign (MarParCloud) was performed at the Cape Verde Atmospheric Observatory (CVAO) a marine remote background station in the tropics. There, cloud water measurements were performed at the Monte Verde and analyzed for inorganic and organic acids. The cloud water samples were anaylsed for the main inorganic compounds, but also for methane sulfonic and oxalic acid. To understand the origin of these acids, their potential formation pathways were investigated by means of a multiphase chemistry model. For the simulations, the detailed multiphase chemistry framework MCM-CAPRAM was coupled to the box model SPACCIM. A specific time period with long cloud events was selected for the model investigations. The modeled cloud liquid water content (LWC) was adjusted to fit to the measurements.

The simulation of multiphase DMS chemistry was achieved through the CAPRAM-DM1.0 module. Based on recently advanced mechanistic insights on DMS chemistry, the MSA formation pathway in the CAPRAM-DM1.0 module was extended. Default simulations with the original CAPRAM-DM1.0 module were considered as benchmark and newer mechanistic findings on DMS oxidation to produce MSA were included stepwise. At the end, the average modeled cloud water concentrations were compared with the average of the all measurement samples.

The comparisons reveal that the average modeled oxalic acid concentration is a factor of two lower than the measurements. Moreover, the simulations reveal several model and mechanistic limitations for the formation of MSA. At first, a realistic reproduction of the LWC is a critical point for the MSA formation, because of the dilution of oxidants. Second, the uptake of precursors is key for MSA. A high Henry’s Law (HA) constant of DMSO and especially MSIA results in a much stronger MSA formation. The current implementation of the HAconstant of DMSO, DMSO2 and MSIA in CAPRAM-DM1.0 results into an overestimation of the average MSA cloud water concentration by a factor of 28. By now, the HA constant of MSIA has yet not been determined experimentally. However, quantum chemical calculations by De Jonge et al. (2021) provide a HA constant of MSIA that is one order of magnitude lower. Applying the smaller HA constants of DMSO, DMSO2 and MSIA from De Jonge et al. (2021) leads still to an overestimation, but with a lower factor of 18. Detailed rate analyses were performed to investigate the most important formation pathways of MSA. The only important pathway is the aqueous-phase MSIA oxidation, but interestingly, the reaction with ozone does not always dominate, even model studies often describe it as the dominate one.

Additional sensitivity studies are ongoing focusing on more details of the cloud processing. Overall, the present studies highlight the need of further investigations on the aqueous-phase oxidation pathways of DMS to uncover the MSA formation in the troposphere.


References

Hoffmann, E. H. et al., P. Natl Acad. Sci. USA 113, 11776–11781 (2016).
Wollesen de Jonge, R. et al.,  Atmos. Chem. Phys. 21, 9955–9976 (2021).

How to cite: Hoffmann, E. H., Tilgner, A., van Pinxteren, M., and Herrmann, H.: Model investigation on parameters driving the in-cloud organic acid formation at a tropical remote marine mountain site, EGU General Assembly 2024, Vienna, Austria, 14–19 Apr 2024, EGU24-10108, https://doi.org/10.5194/egusphere-egu24-10108, 2024.

EGU24-10369 | ECS | Posters on site | AS3.3

Nucleation of jet engine oil vapours is a large source of aviation-related ultrafine particles 

Florian Ungeheuer, Lucía Caudillo, Florian Ditas, Mario Simon, Dominik van Pinxteren, Dogushan Kilic, Diana Rose, Stefan Jacobi, Andreas Kürten, Joachim Curtius, and Alexander L. Vogel

Various studies identified airports as a major source of ultrafine particles (UFPs – aerodynamic diameter <100 nm), whereby little is known about their chemical composition and formation processes [1] [2] [3] [4] [5]. In a previous work, we determined the organic chemical composition of aviation-related UFPs and identified jet engine oils as a major contributor [6].

Here, we show the nucleation and particle formation potential of jet oil vapors, supported by a quantitative analysis of the full spectrum of jet engine oil components in particles with diameters <56 nm. We used a common synthetic lubrication oil to analyse the jet oils gas-to-particle partitioning behavior using laboratory based thermodenuder-experiments and quantified the oil contribution to ambient UFPs originating from Frankfurt International Airport.

We sampled UFPs on aluminium-filters at an air quality monitoring station 4 km north of the Frankfurt Airport using a 13-stage cascade impactor system (Nano-MOUDI). Quantitative characterization of UFPs in the size ranges 10–18 nm, 18–32 nm and 32–56 nm was performed by standard addition combined with liquid chromatography (UHPLC), followed by heated electrospray ionization (HESI) and mass analysis using a high-resolution Orbitrap mass spectrometer (HRMS). In parallel to filter sampling, the particle size distribution was monitored to determine the size-resolved total particle mass.

Thermodenuder-experiments enable the monitoring of the gas-to-particle partitioning behavior of jet engine oils at different temperatures. We observed a fivefold increase in total particle number at 300 °C, with a significant increase in the number of particles with a mean diameter of ~12 nm compared to the same experiments performed at 20 °C.

Particle diameters of UFPs from other directions (e.g. winds originating from the city centre) are larger compared to the UFPs downwind of large airports [4].They are rather in the same size region as the newly formed oil particles in our laboratory experiment. Quantification of the jet oil compounds in ambient samples was achieved by standard-addition of purchased original standards to the native sample extracts. Besides two ester base materials, additives were also quantified, including two amines serving as stabilizers and an organophosphate used as wear inhibitor/metal deactivator. The two homologous ester series were quantified using one ester compound and cross-calibration. We characterized the Nano-MOUDI to determine loss factors and corrected the ambient jet oil contribution to the total particle mass for each UFP size stage accordingly.

Results indicate that aircraft emissions have a strong influence on the total mass of the 10-18 nm particles. The aircraft fraction decreases with larger particles (e.g. 18-56 nm), implying that jet oils form new particles in the cooling exhaust of aircraft engines.

[1] Habre, R., et al. (2018) Environ. Int., 118, 48–59.

[2] Ditas, F., Rose, D. & Jacobi, S. (2022) Hessian Agency for Nature Conservation, Environment and Geology.

[3] Fushimi, A., et al. (2019) Atmos. Chem. Phys., 19, 6389–6399.

[4] Stacey, B., (2019) Atmos. Environ., 198, 463–477.

[5] Rivas, I., et al. (2020) Environ. Int., 135, 105345.

[6] Ungeheuer, F., et al. (2021) Atmos. Chem. Phys., 21, 3763–3775.

How to cite: Ungeheuer, F., Caudillo, L., Ditas, F., Simon, M., van Pinxteren, D., Kilic, D., Rose, D., Jacobi, S., Kürten, A., Curtius, J., and Vogel, A. L.: Nucleation of jet engine oil vapours is a large source of aviation-related ultrafine particles, EGU General Assembly 2024, Vienna, Austria, 14–19 Apr 2024, EGU24-10369, https://doi.org/10.5194/egusphere-egu24-10369, 2024.

EGU24-11073 | Orals | AS3.3

Online CHARON PTR-ToF-MS measurements elucidate residential heating as the major contributor of wintertime organic aerosol in Fairbanks, Alaska 

Amna Ijaz, Brice Temime-Roussel, Brice Barret, Bekki Slimane, Nathalie Brett, Meeta Cesler-Maloney, Javier Fochesatto, Benjamin Chazeau, Joel Savarino, Kathy Law, William Simpson, and Barbara D'Anna

Fairbanks, central Alaska, is a sub-Arctic city that frequently suffers from non-attainment of national air quality standards in the wintertime due to the coincidence of weak atmospheric dispersion and increased local emissions but large uncertainties exist about aerosol sources and formation. We determined the general composition and mass concentrations of atmospheric sub-micron non-refractory particulate matter (NR-PM­1) and quantified the sources involved in its formation during a 6-week campaign in the urban centre of Fairbanks in January-February 2022. As part of the Alaskan Layered Pollution and Chemical Analysis campaign (ALPACA), we deployed a Chemical Analysis of Aerosol Online (CHARON) inlet coupled with a proton transfer reaction - time of flight mass spectrometer (PTR-ToF 6000 Ionicon Analytik) and high-resolution aerosol mass spectrometer (HR-ToF-AMS Aerodyne) to measure organic aerosol (OA) and NR-PM1, respectively, with high temporal resolution of ≤1 min. We performed positive matrix factorisation (PMF) of the measurements to apportion aerosol mass to potential sources. The ability of HR-ToF-AMS to measure inorganic species (ammonium, nitrates, sulphates, and chlorides) creates an opportunity to gain insights into their mixing with OA and chemical dynamics. Campaign-averages of OA measured with the two instruments agreed reasonably well (R2 = 0.60) with a regression slope of 0.46. Higher OA concentrations observed with the HR-ToF-AMS are attributable to the particle size-dependence of the CHARON inlet, since it is more sensitive to particles >150 nm; a regression slope approaching 1.0 was achieved for larger primary OA emissions from biomass burning. On the one hand, in line with known emission patterns in Fairbanks, PMF indicated residential heating (Res-H) to be the single largest source of OA here during the wintertime as per CHARON PTR-ToF-MS measurements. A large fraction of OA originated from the combustion of different types of wood (2.07 ± 2.47 µg/m3; 47.15 ± 20.15%) and fuel oil (0.64 ± 0.64 µg/m3; 16.20 ± 9.73%) as determined from molecular composition and temporal correlation with external tracers (e.g., trace gases and marker ions). On the other hand, using HR-ToF-AMS data, neither OA, nor the overall NR-PM1, could be delineated into multiple Res-H sources, and only a single Biomass Burning (BB)-OA related factor could be identified. With the HR-ToF-AMS data, hydrocarbon-like OA (HOA) also appeared as another important contributor to OA (2.08 ± 2.79 µg/m3; 38.07 ± 20.38%), other than BBOA (1.47 ± 1.81 µg/m3; 28.01 ± 18.91%). In addition, while HOA (or traffic), cooking, and BBOA emissions are almost completely (> 90% of mass) composed of organics, the PMF analysis revealed inorganic aerosol to be distributed across two secondary aerosol factors, i.e., sulphur-rich oxygenated OA and ammonium nitrate, as well as an acidic sulphate aerosol factor. The insights obtained here demonstrate that CHARON PTR-ToF-MS not only provides robust quantitative information but, when combined with a suitable complementary instrument, it generates more refined evidence-based understanding of the dominant sources of OA and processes forming NR-PM1 which are key to endorsing policy and citizen efforts for the prevention and control of air pollution in Fairbanks, and in the wider Arctic winter.


How to cite: Ijaz, A., Temime-Roussel, B., Barret, B., Slimane, B., Brett, N., Cesler-Maloney, M., Fochesatto, J., Chazeau, B., Savarino, J., Law, K., Simpson, W., and D'Anna, B.: Online CHARON PTR-ToF-MS measurements elucidate residential heating as the major contributor of wintertime organic aerosol in Fairbanks, Alaska, EGU General Assembly 2024, Vienna, Austria, 14–19 Apr 2024, EGU24-11073, https://doi.org/10.5194/egusphere-egu24-11073, 2024.

EGU24-11190 | Posters on site | AS3.3

Source apportionment of PM10 carbonaceous aerosol collected in Hungarian cities, using tracer analytical methods 

István Major, Zsófia Kertész, Anikó Angyal, Enikő Furu, Enikő Papp, Anikó Vasanits, Sándor Bán, Anita Molnár, Virág Gergely, and Mihály Molnár

The environmental and health-damaging effects of “high aerosol concentration” periods often represent an issue in Hungary, which is mainly due to the country's location (basin is within the Carpathians). The main sources of carbonaceous aerosol are already more or less known, but the numerical extent and temporal distribution of the contributions are still the subject of numerous investigations in the region. In these researches, isotopic analytical procedures are increasingly involved, which, in addition to traditional analytical methods, enable us to make more and more accurate source apportionment analyses. By means of the radiocarbon method, the modern and fossil fuel sources can unambiguously be separated, while levoglucosan can be used as tracer to distinguish the two largest modern sources i.e. biological emissions and anthropogenic wood burning. In the first half of 2015, a comprehensive PM10 collection campaign in five big cities (Budapest, Debrecen, Miskolc, Pécs, Nyíregyháza) was completed, financed by the Hungarian state. Its purpose was to identify the most relevant emission sources and quantify their contributions as accurately as possible. In the course of the analyses, mass concentration of the total, organic and elemental carbon (TC, OC, EC, respectively) of the collected samples were determined, in addition, the specific 14C activity and levoglucosan concentration of TC were also measured. Our studies clearly revealed the predominance of the anthropogenic wood burning source in the winter/heating period, but the contribution of biological sources ranged in a broader scale during the observation period. Contrarily, the contributions from fossil sources were relatively balanced for the same period.

How to cite: Major, I., Kertész, Z., Angyal, A., Furu, E., Papp, E., Vasanits, A., Bán, S., Molnár, A., Gergely, V., and Molnár, M.: Source apportionment of PM10 carbonaceous aerosol collected in Hungarian cities, using tracer analytical methods, EGU General Assembly 2024, Vienna, Austria, 14–19 Apr 2024, EGU24-11190, https://doi.org/10.5194/egusphere-egu24-11190, 2024.

EGU24-11833 | ECS | Posters on site | AS3.3

Size-resolved aerosol composition and source apportionment in Morocco: Contrasting urban and remote sites  

Nabil Deabji, Khanneh Wadinga Fomba, and Hartmut Herrmann

Aerosol particles are complex mixtures of organic and inorganic compounds suspended in the atmosphere that significantly impact the climate, human health, and the environment. Understanding their composition and sources is crucial for developing effective air pollution control policies. Although some studies have been conducted on the chemical composition of PM and the sources of PM in Moroccan urban areas, a knowledge gap exists regarding the organic composition and chemical processes across different-sized bins. A detailed study was conducted in September and October 2019 at two distinct sites in Morocco: Atlas Mohammed V (AMV) and the urban city of FEZ. Size-resolved aerosol samples were collected using a 5-stage Berner impactor. Analyses included PM mass, organic carbon (OC)/elemental carbon (EC), trace metals, water-soluble ionic species, and a broad range of organic species. The results show strong regional variations in PM mass, with FEZ (32 µg m-3) showing approximately three times the PM level of AMV (11 g m-3). Coarse particles within the 3.5-10 µm size range made up 35% of the PM mass at AMV and 32% at FEZ. The PM3.5/PM10 ratio at both sites was comparable, with an average of 0.65±0.037. However, the chemical composition analysis revealed a strong urban-remote contrast. FEZ showed higher concentrations of fine-mode pollutants such as OC, EC, and sulfates. At the same time, the remote AMV site exhibited higher coarse-mode OC and nitrates, suggesting different sources and formation processes influenced the PM composition at both sites. The organic compound profiling identified a dominance of alkanes (12±6.8 ng m-³) and PAHs (1.9±2.5 ng m-³), such as Benz(a)pyrene, Benzo(k)fluoranthene, Phenanthrene, and Retene, with the urban FEZ site revealing significantly higher concentrations, particularly in the 0.42-1.2 µm size range. In contrast, at AMV, these compounds were more evenly distributed across all particle sizes, reflecting the influence of both natural and anthropogenic sources on their abundances. According to the Positive Matrix Factorization (PMF) model, we identified four and six particle emission sources at AMV and FEZ, respectively. Mineral dust (36-55%) was the predominant component in the coarse mode at both sites, while road dust mixed with local pollutants was significant (up to 44%) in smaller particles (1.2-3.5 µm) in FEZ. At AMV, mixed anthropogenic emissions (21-45%) and secondary aerosols (26-61%) significantly impacted the ultra-fine and acceptable modes, while in FEZ, traffic exhaust (18-34%) and biomass burning (17-41%) dominated the fine mode. Diagnostic ratios of polycyclic aromatic hydrocarbons (PAHs) indicated a blend of fresh and aged particles at AMV, predominantly from petroleum and combustion sources with long-range anthropogenic influence. In contrast, FEZ showed a predominance of fresh emissions from traffic-related sources affecting all particle sizes. These results explore the chemical composition and source apportionment, highlighting the need to control anthropogenic traffic-related emissions to improve urban air quality in North Africa.

How to cite: Deabji, N., Fomba, K. W., and Herrmann, H.: Size-resolved aerosol composition and source apportionment in Morocco: Contrasting urban and remote sites , EGU General Assembly 2024, Vienna, Austria, 14–19 Apr 2024, EGU24-11833, https://doi.org/10.5194/egusphere-egu24-11833, 2024.

EGU24-11950 | Orals | AS3.3

New Particle Formation events over an eastern Mediterranean region – Influence of Secondary Organic Aerosols 

Ajith Thenoor Chandran, Eli Windwer, Zheng Fang, Chunlin Li, Sobhan Kumar Kompalli, Nursanto Farhan, Julian Fry, and Yinon Rudich

New Particle Formation (NPF) is a crucial process responsible for generating new aerosols in the atmosphere and contributing to nearly half of the cloud condensation nuclei concentration. NPF events have been frequently observed in various environments. Characterizing NPF events and identifying the key chemical species and the responsible mechanism is vital in advancing the knowledge regarding NPF events and their impact on climate and human health.

The Mediterranean region is a “hot spot” for climate change and is expected to undergo significant warming and drying in the 21st century. This semi-arid location is affected by continental, marine, and desert dust airmasses, and intense photochemistry during the dry and hot weather makes this region interesting for NPF. However, studies of NPF over the eastern Mediterranean region are limited and present a significant gap in the understanding of NPF. In this study, the aerosol number size distribution, particulate chemical composition, and gaseous pollutants in Rehovot (31°53"N 34°48"E, a semi-urban site in Israel) were collaboratively monitored from 29 April to 03 May 2021 and 03 May to 11 May 2023, during when a national bonfire festival happened. The present study employs a novel hybrid source apportionment to understand the relationship between particle size distribution and chemical composition.

The source apportionment of organic aerosols (OA) revealed 2 primary factors (Hydrocarbon-like OA and Biomass-burning OA) and 2 secondary factors (MO-OOA (more oxidized oxygenated OA) and LO-OOA (low oxidized oxygenated OA)).  Ultrafine particle burst/NPF events were observed during daytime (mostly well-defined nucleation events) and nighttime (without well-defined growth). The daytime events were associated with an enhancement in the sulfuric acid proxy concentrations (~ 3.8×10⁶ molecules cm-3), suggesting the role of gas-phase photochemistry. The results from Hybrid PMF analysis suggested the involvement of multiple components, including sulfate and MO-OOA, in the nucleation and subsequent particle growth during daytime. Interestingly, nighttime events were associated with the involvement of semi-volatile species (LO-OOA and nitrate) in the growth along with sulfate and more-oxidized organics. This study demonstrates the involvement of organic and inorganic secondary components in the ultrafine particle burst/NPF events observed over a semi-urban, semi-arid location.

How to cite: Thenoor Chandran, A., Windwer, E., Fang, Z., Li, C., Kompalli, S. K., Farhan, N., Fry, J., and Rudich, Y.: New Particle Formation events over an eastern Mediterranean region – Influence of Secondary Organic Aerosols, EGU General Assembly 2024, Vienna, Austria, 14–19 Apr 2024, EGU24-11950, https://doi.org/10.5194/egusphere-egu24-11950, 2024.

EGU24-12373 | ECS | Orals | AS3.3

Advances in the Vaporization Inlet for Aerosols (VIA) for Online Measurements of Particulate Highly Oxygenated Organic Molecules (HOM) 

Jian Zhao, Valter Mickwitz, Yuanyuan Luo, Ella Häkkinen, Frans Graeffe, Jiangyi Zhang, Hilkka Timonen, Manjula Canagaratna, Jordan Krechmer, Qi Zhang, Markku Kulmala, Juha Kangasluoma, Douglas Worsnop, and Mikael Ehn

Particulate matter significantly influences global climate and human health, necessitating accurate measurement techniques for understanding its composition. Many methods, both offline and online, have been employed over the years to achieve this goal. One of the most recent developments is the Vaporization Inlet for Aerosols (VIA) coupled to a nitrate Chemical Ionization Mass Spectrometer (NO3-CIMS). Despite advancements, a thorough understanding of the VIA–NO3-CIMS system remains incomplete.

In this work, we ran a series of tests to assess the impacts of different systems and sampling parameters on the detection efficiency of highly oxygenated organic molecules (HOM) in the VIA–NO3-CIMS. Our findings indicate that the current VIA system, including an activated carbon denuder and a vaporization tube, efficiently transmits particles (>90% for particles larger than 50 nm) while removing gaseous compounds (>97% for tested volatile organic compounds). One of the main differences between the VIA and traditional thermal desorption (TD) techniques is the very short residence time in the heating region, on the order of 0.1 s. This short residence time and the corresponding short contact with heated surfaces is likely one of the main reasons why relatively reactive or weakly bound, such as peroxides, were observable using the VIA. However, the VIA requires much higher temperatures to fully evaporate the aerosol components. For example, the evaporation temperature of ammonium sulfate particles using the VIA was found to be 100-150 oC higher than in typical TD systems.

Optimizing the VIA–NO3-CIMS interface to minimize gas-phase wall losses was critical. Introducing a dedicated sheath flow unit between the VIA and the NO3-CIMS markedly reduced wall losses, improving sensitivity compared to earlier VIA work. This unit also facilitated sample cooling and provided the NO3-CIMS with the necessary high flow (10 L min-1). Our results indicate that most organic molecules observable by the NO3-CIMS can evaporate and be transported efficiently in the VIA system, but upon contact with the hot walls of the VIA, the molecules are instantaneously lost. This loss potentially leads to fragmentation of products that are not observable by the NO3-CIMS.

Thermograms, obtained by scanning the VIA temperature, proved invaluable for both quantification purposes and estimating the volatility of the evaporating compounds. We developed a simple one-dimensional model to account for the evaporation of particles and the temperature-dependent wall losses of the evaporated molecules, allowing estimation of HOM concentration in organic particles. Finally, we applied this system to study four different monoterpenes, and compared HOM distribution between the gas and particle phase. Overall, our results provide much-needed insights into the key processes underlying the VIA–NO3-CIMS method. Although hardware improvements are needed to address certain limitations, the VIA–NO3-CIMS system emerges as a promising tool for fast online measurements of HOM in the particle phase, contributing to our understanding of particulate matter composition and its broader implications.

How to cite: Zhao, J., Mickwitz, V., Luo, Y., Häkkinen, E., Graeffe, F., Zhang, J., Timonen, H., Canagaratna, M., Krechmer, J., Zhang, Q., Kulmala, M., Kangasluoma, J., Worsnop, D., and Ehn, M.: Advances in the Vaporization Inlet for Aerosols (VIA) for Online Measurements of Particulate Highly Oxygenated Organic Molecules (HOM), EGU General Assembly 2024, Vienna, Austria, 14–19 Apr 2024, EGU24-12373, https://doi.org/10.5194/egusphere-egu24-12373, 2024.

EGU24-12439 | ECS | Posters on site | AS3.3

Secondary Organic Aerosol Generated from Biomass Burning Emitted Phenolic Compounds: Oxidative Potential, Reactive Oxygen Species and Cytotoxicity 

Zheng Fang, Alexandra Lai, Dongmei Cai, Chunlin Li, Raanan Carmieli, Jianmin Chen, Xinming Wang, and Yinon Rudich

Phenolic compounds are largely emitted from biomass burning (BB) and have significant potential to form SOA (Phc-SOA). However, the toxicological properties of Phc-SOA remain unclear. In this study, phenol and guaiacol were chosen as two representative phenolic gases in BB plumes, and the toxicological properties of their SOA generated under different photochemical ages and NOx levels were investigated. Across explored aging conditions, oxidative potentials (OP) of Phc-SOA measured by the dithiothreitol (DTT) assay were 41.3-83.9 pmol min-1 μg-1. OH-adducts of guaiacol (e.g., 2-methoxyhydroquinone) were identified as components of guaiacol SOA (GSOA) with high OP. The addition of nitro groups to 2,5-dimethyl-1,4-benzoquinone, a surrogate quinone compound in Phc-SOA, increased its OP. In pure water, H2O2 presented the main reactive oxygen species produced by Phc-SOA. The toxicity of both phenol SOA (PSOA) and GSOA in vitro in human alveolar epithelial cells decreased with aging in terms of both cell death and cellular ROS, possibly due to more ring-opening products with relatively low toxicity. The influence of NOx was consistent between cell death and cellular ROS for GSOA, but not for PSOA, indicating that cellular ROS production does not necessarily represent all processes contributing to cell death caused by PSOA.

How to cite: Fang, Z., Lai, A., Cai, D., Li, C., Carmieli, R., Chen, J., Wang, X., and Rudich, Y.: Secondary Organic Aerosol Generated from Biomass Burning Emitted Phenolic Compounds: Oxidative Potential, Reactive Oxygen Species and Cytotoxicity, EGU General Assembly 2024, Vienna, Austria, 14–19 Apr 2024, EGU24-12439, https://doi.org/10.5194/egusphere-egu24-12439, 2024.

EGU24-12881 | ECS | Orals | AS3.3 | Highlight

Thermal processes and secondary recycling regulate the atmospheric levels of the highly toxic polychlorinated naphthalenes in an urban Mediterranean site. 

Minas Iakovides, Sonmath Bhowmick, Iasonas Stavroulas, Giannis Iakovides, Michael Pikridas, George Biskos, Jean Sciare, and Nikos Mihalopoulos

Although production of legacy industrial-grade Persistent Organic Pollutants (POPs) has been prohibited since the early 00’s, residues are still present in all environmental compartments, whereas illicit usage is still documented at a global scale. Unauthorized disposal activities of Aroclor technical mixtures and illegal incineration of obsolete electronic equipment are also primary sources of significant environmental concern.

Island of Cyprus, situated at the easternmost side of the Mediterranean Basin, is surrounded by large urban and industrial areas and comprises a unique location for exploring air quality over the broader Eastern Mediterranean and Middle East (EMME) region. The present work extends previous reports on the occurrence and fate of a wide spectrum of highly toxic compounds in the atmosphere over Cyprus and explores comprehensively the atmospheric distribution of polychlorinated naphthalenes (PCNs) and polybrominated diphenyl ethers (PBDEs), both listed under the Stockholm Convention text.

Total (gaseous and particulate phase) concentrations of the scarcely monitored in EMME region PCNs were measured similar to urban locations. Contrarily, the corresponding levels of PBDEs were comparable to background areas, exhibiting a relative enrichment in congeners with intermediate degree of bromination. Regressions of logarithms of partial pressure against ambient temperature for PCNs revealed that secondary recycling from contaminated terrestrial surfaces regulates their atmospheric variability. Enthalpies of surface-air exchange (ΔHsa) for PCNs were significantly correlated to vaporization enthalpies (ΔHv) determined by chromatography, corroborating the presence of short-range revolatilization processes. Homologue concentration ratios of PCNs suggested inputs from thermal processes, whereas potential evaporation from Aroclor-contaminated surfaces cannot be excluded. An inverse pattern for PBDEs was observed. The corresponding regression slopes were shallow, implying long-range atmospheric transport, whereas ΔHsa were insignificantly correlated with ΔHv, suggesting that, unlike PCNs, volatilization sources of PBDEs are of minor importance.

We also evaluated gas/particle partitioning by utilizing a comprehensive range of traditional and novel partitioning models. Additionally, we constructed, separately for PCNs and PBDEs, temperature-dependent quantitative structure-property relationship (QSPR) models based on quantum-mechanical descriptors. Equilibrium-state models predicted well the gas/particle partitioning quotients (Kp) of PCNs, whereas steady-state models predicted better the partitioning behavior of PBDEs. Both empirical QSPR models exhibited equal performance in predicting Kp and can be used as reference for studies under similar temperature ranges around the globe.

Acknowledgements: The present work received funding from the European Union’s Horizon 2020 research and innovation program under grant agreement No. 856612 (EMME-CARE) and the Cyprus Government.

How to cite: Iakovides, M., Bhowmick, S., Stavroulas, I., Iakovides, G., Pikridas, M., Biskos, G., Sciare, J., and Mihalopoulos, N.: Thermal processes and secondary recycling regulate the atmospheric levels of the highly toxic polychlorinated naphthalenes in an urban Mediterranean site., EGU General Assembly 2024, Vienna, Austria, 14–19 Apr 2024, EGU24-12881, https://doi.org/10.5194/egusphere-egu24-12881, 2024.

EGU24-13347 | Orals | AS3.3 | Highlight

Which atmospheric processing of biomass burning organic aerosol produces the most singlet oxygen: photochemical aging or dilution? 

Claudia Sardena, Jun Zhang, Keighan J. Gemmell, David Bell, and Nadine Borduas-Dedekind

Atmospheric organic aerosols containing chromophores undergo excitation upon absorbing visible and UV light. These chromophores are integral components of brown carbon (BrC), predominantly originating from incomplete combustion sources such as forest fires, biomass burning, and cooking. When exposed to light BrC can act as photo-sensitizers, generating reactive oxygen species (ROS), including singlet oxygen (1O2). 1O2 is a competitive ROS species within atmospheric aerosols and can be produced in diverse environmental matrices, including cloud water, fog water, rainwater, and particulate matter extracts. However, the relative sources and sinks of 1O2 depend on the chromophores present in the biomass burning organic aerosols (BBOA), and the chemical composition of these chromophores evolves during atmospheric processing with unknown implications for 1O2 production. This study aims to quantify the impact of atmospheric aging, including dilution and photochemical processing, on the ability of BBOA to sensitize 1O2.

To assess this goal, we combusted different biomass samples, i.e. straw, cow dung, beechwood, and plastic in the PSI smog chamber. On quartz filters we collected the primary organic aerosols generated after the burning of each sample from a holding tank. Next, we aged the BBOA via two different pathways: UV aging and dilution. First, BBOA was collected after photooxidation treatment using a Potential Aerosol Mass (PAM) chamber. Second, the BBOA was passed through a heated diffusion dryer to simulate dilution of the plume. Our method involves extracting filters with acetonitrile to obtain the non-soluble fraction of BBOA, in which we expect to find the most effective sensitizers for 1O2. In these solvent extracts, we added furfuryl alcohol as a 1O2 probe and exposed the extracts to UVA light in a photochemical reactor. We measured the pseudo-first order kinetics of 1O2 to calculate singlet oxygen quantum yield and steady-state concentration.

The results show an increase in quantum yield when the photooxidation process occurs, i.e. of about 3% for beechwood samples. This outcome suggests that aged chromophores through indirect photochemistry are more effective sensitizers. Remarkably, we observed a decrease in quantum yield of BBOA due to dilution, of about 1% and 3% for straw and beechwood respectively. This result might imply that the most effective chromophores are volatile and partitioning to the gas phase during dilution, with important implications for evolving BBOA plumes. When changing the burning fuel, this trend always appeared showing a possible change in the quantity and quality of the chromophores present. Moreover, 1O2 quantum yield and steady-state concentrations differ within the type of fuel, such as beechwood showing higher values compared to straw, highlighting the importance of analyzing different biomass burning organic materials. Our experimental results offer insights into how different atmospheric processing can impact the production of 1O2, useful for the development of a global model that encompasses both chromophores and 1O2 production.

How to cite: Sardena, C., Zhang, J., Gemmell, K. J., Bell, D., and Borduas-Dedekind, N.: Which atmospheric processing of biomass burning organic aerosol produces the most singlet oxygen: photochemical aging or dilution?, EGU General Assembly 2024, Vienna, Austria, 14–19 Apr 2024, EGU24-13347, https://doi.org/10.5194/egusphere-egu24-13347, 2024.

EGU24-14154 | ECS | Posters on site | AS3.3

Characteristics of the Fluorescence of Water-Soluble Organic Matter in Atmospheric Aerosols under Different Environments in Japan 

Chenran Wei, Sonia Afsana, Yange Deng, Hikari Yai, Hiroaki Fujinari, and Michihiro Mochida

    The fluorescence characteristics of atmospheric aerosols are related to their chemical characteristics including the oxygenation state; hence they show differences based on their types and sources. Excitation-emission matrix (EEM) fluorescence spectroscopy is becoming an important method for analyzing the chromophores of water-soluble organic aerosols. Although a number of studies have reported the fluorescence characteristics of chromophores in atmospheric aerosols, the relationship betweentheir fluorescence characteristics and types is still unclear. In this study, the fluorescence characteristics of water-soluble components of atmospheric aerosols in different environments in Japan were studied as a means to understand their changes in characteristics and their relationship with aerosol types. The fluorescence was also analyzed for urban rainwater for comparison with aerosol.

    Atmospheric aerosol samples collected at urban (Nagoya), forest (Wakayama), remote (Okinawa)sites and rainwater samples collected at the urban site were subjected to the analysis of EEM for water-soluble extracts. The EEM of water-soluble organic matter from forest aerosol samples showed that the relative contribution of protein-like substances (PRLIS) to total analyzed fluorescence was on average higher than that of other samples. For marine aerosol samples, the intensity of fluorescence originated from humic-like substances (HULIS) containing highly oxygenated compounds (HOS) was on average 4.5 times higher than that originated from HULIS containing less oxygenated compounds (LOS), according to our definition of the quantification of the fluorescence intensity. In the case of forest aerosol samples, the difference in the intensity was smaller (3.4 times on average). This result suggests that the studiedremote aerosols were more aged, while forest aerosols were fresher. For forest aerosol samples, the temporal variation of the fluorescence within a day was obtained. The fluorescence index (FI), humidity index (HIX), and biological index (BIX) were also compared. The HIX-BIX plots showed different patterns for forest, remote and urban aerosol samples, which suggests that they had different degrees of aging and/ordifferent source types, and that this method is useful for the analysis of the characteristics of atmospheric organic aerosols. A parallel factor (PARAFAC) analysis was applied to EEMs, and it identified three different components including two different types of HULIS and one PRLIS. In Nagoya,the contribution by HOS was on average largest among three components in the case of both rainwater and aerosol samples, and the proportion of HOS component for aerosol samples was on average slightly higherthan that for rainwater samples. Although the difference may be affected by the presence ofcoexisting inorganic substances, further comparison may provide a clue to understand the relationship between aerosol and rain chromophores.

How to cite: Wei, C., Afsana, S., Deng, Y., Yai, H., Fujinari, H., and Mochida, M.: Characteristics of the Fluorescence of Water-Soluble Organic Matter in Atmospheric Aerosols under Different Environments in Japan, EGU General Assembly 2024, Vienna, Austria, 14–19 Apr 2024, EGU24-14154, https://doi.org/10.5194/egusphere-egu24-14154, 2024.

EGU24-16372 | Posters on site | AS3.3

Chemical characterisation and comparison of Isoprene Organosulphates in simulation chamber experiments and ambient aerosol samples in the Amazon rainforest 

Stefanie Hildmann, David Wasserzier, Lea Hopson, Leslie Kremper, Christopher Pöhlker, and Thorsten Hoffmann

In tropical forests, organic material accounts for a large fraction of particulate matter and the contribution can be as high as 90 % at the submicrometer scale, mainly through the formation of secondary organic aerosols (SOA) from the oxidation of biogenically released volatile organic compounds (VOCs). Despite the abundance of organic material and the important role these particles play in the rainforest boundary layer, the composition of submicrometer organic aerosols is poorly understood (Andreae et al., 2015; Hallquist et al., 2009).

Several different biogenic VOCs are released in tropical regions, but it is undisputed that isoprene is emitted in such large global quantities (600 Tg year-1) that the formation of SOA results in significant production of atmospheric particulate matter even at small yields (Chen et al., 2015; Liu et al., 2016).  NOx concentrations have a strong influence on SOA production, but SO2 also affects SOA composition.  Reactions of acidic sulphate aerosol with Isoprene derived oxidation products leads to the formation of organosulphates (OS) that provide information about mixtures of biogenic gases and anthropogenic pollutants. Due to the large variety of formation processes, the composition of SOA is very complex and varies constantly. To understand the formation and transformation processes, specific molecular marker compounds must be identified and quantified. Methyltetrol sulphates and methyltetrols are isoprene SOA markers that are formed from isoprene-derived epoxydiols (IEPOX). However, organosulphates have proved analytically challenging to quantify, due to lack of authentic standards and the complex sample matrix in which they are observed.

This study provides a suitable analytical tool for chemical characterisation of such isoprene derived organosulphates by combining high performance liquid chromatography (HPLC) with electrospray ionisation ultra-high resolution orbitrap mass spectrometry (ESI-UHR-Orbitrap-MS). Chamber simulation experiments  were performed to investigate isoprene OS formation by comparing different atmospheric reaction pathways and authentic standards were synthesised to enable complete identification of individual OS compounds. Marker compounds for aged isoprene derived organic aerosols could be assigned and quantified in ambient aerosol samples of the Amazon rainforest. Moreover, it could be shown that the lack of authentic standards has led to significant underestimation of isoprene derived OS concentrations in the past.


Andreae, M., Acevedo, O., et al. (2015), Atmos. Chem. Phys., 15(18), 10723-10776.

Chen, Q., et al. (2015), Atmos. Chem. Phys. 15(7), 3687-3701.

Hallquist, M., Wenger, J. C., et. al. (2009), Atmos. Chem. Phys., 9(14), 5155–5236.

Liu, Y., et al. (2016), PNAS, 113(22), 6125-6130.


How to cite: Hildmann, S., Wasserzier, D., Hopson, L., Kremper, L., Pöhlker, C., and Hoffmann, T.: Chemical characterisation and comparison of Isoprene Organosulphates in simulation chamber experiments and ambient aerosol samples in the Amazon rainforest, EGU General Assembly 2024, Vienna, Austria, 14–19 Apr 2024, EGU24-16372, https://doi.org/10.5194/egusphere-egu24-16372, 2024.

EGU24-17155 | ECS | Posters on site | AS3.3

Development of a non-targeted LC-UHRMS approach for organic aerosol analysis: first application to urban and biogenically influenced air masses 

Niklas Karbach, Pauline Pouyes, Emilie Perraudin, Eric Villenave, Alexander Vogel, and Thorsten Hoffmann

The analysis of filter samples of atmospheric organic aerosols provides information about atmospheric processes and the origin of aerosol particles. However, limiting analysis to a few target compounds ignores a large proportion of the compounds present on the filters. Since the availability of high-resolution mass spectrometers, non-target analysis addresses parts of this problem. However, such an analysis can be very time-consuming. Since it is hardly possible to analyze all individual compounds manually, an automated or semi-automated evaluation of the data is required.

This poster presents a method for the non-target analysis of atmospheric organic aerosol filter samples using UHPLC-Orbitrap-MS. The extracted filter samples are analyzed in a two-step process that provides maximum information. In the first step, a full-scan high resolution mass spectrum is measured, which is then analyzed with MZmine, capturing all compounds with their respective retention time and exact mass. Using this data, a second experiment is designed in which an isolated MS/MS spectrum (with stepped fragmentation energy) of all detected compounds is measured. With the MS/MS data of the measured compounds and a local database in combination with in-silico fragmentation, a reliable prediction of the chemical composition, functional groups and/or parts of the molecular structure is possible. The combination of these steps drastically improves the reliability of the prediction, as not only the exact mass of the molecule is considered, but also additional information about the fragmentation of the molecule is included. Python scripts automate the processes and create a comprehensible summary for each detected compound, minimizing the manual workload.

For this contribution, filters of the ACROSS campaign 2022 (Rambouillet Forest, France), where urban and biogenically influenced air masses are present, were analyzed in the manner described above and a brief summary of the results is given.

How to cite: Karbach, N., Pouyes, P., Perraudin, E., Villenave, E., Vogel, A., and Hoffmann, T.: Development of a non-targeted LC-UHRMS approach for organic aerosol analysis: first application to urban and biogenically influenced air masses, EGU General Assembly 2024, Vienna, Austria, 14–19 Apr 2024, EGU24-17155, https://doi.org/10.5194/egusphere-egu24-17155, 2024.

EGU24-18402 | Posters on site | AS3.3

Sensitivity of organic aerosol optical properties to improved representation of brown carbon in the EMAC model 

Sergey Gromov, Domenico Taraborrelli, and Andrea Pozzer

Brown Carbon (BrC) is a wide class of aerosol species whose optical properties span from near dark Black Carbon (BC) to transparent/reflective and Organic Carbon (OC), are potent in their impact on Earth's climate radiative forcing (RF) and air quality. To date, the uncertainties about their contributions are larger compared to that of BC/OC, trace gases and other factors  (IPCC, 2021, Chapter 6). This is to a considerable extent due to current Earth System Models (ESMs) lacking sufficient representation of BrC, whilst no consistent unified classification and framework for BrC implementation in ESMs has been developed yet. Here, we review such implementation options and offer an advanced implementation of the BrC in the atmospheric chemistry general circulation model EMAC (Pozzer et al., 2021).

EMAC includes all relevant processes (detailed aerosol physicochemistry, optical radiation calculation, online emission, etc.) for the comprehensive simulation of organic aerosol (OA). Our BrC intermediate-complexity implementation includes primary (e.g. biomass- or fossil-fuel burning) and secondary (e.g. oxidation of phenolic precursors) formation processes and includes “fresh” and “aged” mixture states defining final optical properties. Because most of available ambient measurements do not allow such differentiation, BrC categories are assigned refractive properties obtained chiefly in controlled lab experiments. The optical properties of OC and BC were adjusted to account for BrC presence and updated to recent recommendations. Ultimately, the new parameterization aims at more accurate reproduction of primary (POA) and secondary (SOA) organic aerosol optical properties and/under their atmospheric aging.

Our preliminary simulations with EMAC indicate that POA and SOA optical properties are sensitive to representation of the newly implemented BrC-contributed and updated OC/BC parts, compared at selected AERONET observational stations. Further sensitivities are associated with the primary/secondary BrC emission proportion varying with the source sector. The overall refractive index (RI) of BrC results in an intensified absorption of the C-inclusive aerosol than the simulated with the former OC/BC-only speciation. On a global scale, changes to the top-of-atmosphere global RF may reach non-negligible extra 0.45 W/m2 (upper limit of POA absorption efficiency), whereas up to 50% larger negative RF changes are obtained at the surface. Due to BC and selected BrC species intense absorption in the UV range, we also quantify the effects of using the new parameterisation on ozone photolytic formation and loss. In summary, our findings suggest that an improved representation of BrC indicates a prior underestimation of its contribution to th e OA light-absorbing efficiency, consequently affecting the simulated RF in EMAC. A wavelength-resolved analysis of refractive indices against observational data is planned for subsequent in-depth analyses.

This work was funded by the European Commission Horizon Europe project FOCI, Non-CO2 Forcers and Their Climate, Weather, Air Quality and Health Impacts (No. 101056783, see https://www.project-foci.eu).

References

Intergovernmental Panel on Climate Change (IPCC). (2023). Short-lived Climate Forcers. In: Climate Change 2021 – The Physical Science Basis, Cambridge UP, 817-922. doi:10.1017/9781009157896.008

Pozzer, A., Reifenberg, S. F., Kumar, V., et al. (2022). Simulation of organics in the atmosphere: evaluation of EMACv2.54 with the Mainz Organic Mechanism (MOM) coupled to the ORACLE (v1.0) submodel, Geosci. Model Dev. 15, 2673–2710. doi:10.5194/gmd-15-2673-2022

How to cite: Gromov, S., Taraborrelli, D., and Pozzer, A.: Sensitivity of organic aerosol optical properties to improved representation of brown carbon in the EMAC model, EGU General Assembly 2024, Vienna, Austria, 14–19 Apr 2024, EGU24-18402, https://doi.org/10.5194/egusphere-egu24-18402, 2024.

EGU24-18629 | ECS | Orals | AS3.3 | Highlight

The role of chemistry in fog formation in the Italian Po Valley 

Yvette Gramlich, Fredrik Mattsson, Liine Heikkinen, Sophie L. Haslett, Almuth Neuberger, Nora Zannoni, Angela Marinoni, Ilona Riipinen, Paul Zieger, Stefano Decesari, and Claudia Mohr

The Po Valley in northern Italy is a densely populated region, with a variety of anthropogenic emissions of primary aerosol particles and precursor gases from industrial, agricultural, and urban activities. Especially in the winter, the orographic and meteorological conditions in this region are favorable to result in pollution levels among the highest in Europe (Daellenbach et al., 2020). The combination of these high aerosol loadings with prevalent cold temperatures in winter cause the formation of fog. Efforts over the last decades led to an increased characterization and understanding of this fog (Fuzzi et al., 1992); however, from an aerosol perspective, this applies mainly to the physical characteristics of the fog while the role of the chemical composition of aerosols remains much less determined.

To address this lack in understanding the chemical characteristics, state-of-the-art chemical mass spectrometers measuring aerosol particles as well as trace gases were deployed during the Fog and Aerosol InteRAction Research Italy (FAIRARI) field campaign. The FAIRARI campaign covered the winter and spring 2022 in San Pietro Capofiume in the Po Valley in northern Italy with the overall aim to comprehensively investigate aerosol-fog interactions in this polluted environment by covering the entire size range, from gas molecules up to hydrometeors.

First results from the FAIRARI campaign on the bulk chemical composition measurements indicate no clear pattern in the difference in composition when comparing periods of fog with periods where no fog was formed. The bulk aerosol composition was dominated by nitrate and organics during both conditions. In contrast to the ambient aerosol particles, the aerosol particles left when drying the fog droplets show presence of organonitrates. In this presentation, we will dive into the molecular-level chemical composition of organic molecules present in the particulate and gas phase in fog episodes, as well as these organonitrates, potentially formed in the fog droplets.

Understanding the different phases and their composition will help to better determine potential sources driving fog formation in this region, which is relevant for both climate and health mitigations.


References

Daellenbach, K. R., Uzu, G., Jiang, J., Cassagnes, L.-E., Leni, Z., Vlachou, A., Stefenelli, G., Canonaco, F., Weber, S., Segers, A., Kuenen, J. J. P., Schaap, M., Favez, O., Albinet, A., Aksoyoglu, S., Dommen, J., Baltensperger, U., Geiser, M., El Haddad, I., Jaffrezo, J.-L., and Prévôt, A. S. H.: Sources of particulate-matter air pollution and its oxidative potential in Europe, Nature, 587, 414–419, https://doi.org/10.1038/s41586-020-2902-8, 2020.

Fuzzi, S., Facchini, M. C., Orsi, G., Lind, J. A., Wobrock, W., Kessel, M., Maser, R., Jaeschke, W., Enderle, K. H., Arends, B. G., Berner, A., Solly, I., Kruisz, C., Reischl, G., Pahl, S., Kaminski, U., Winkler, P., Ogren, J. A., Noone, K. J., Hallberg, A., Fierlinger-Oberlinninger, H., Puxbaum, H., Marzorati, A., Hansson, H.-C., Wiedensohler, A., Svenningsson, I. B., Martinsson, B. G., Schell, D., and Georgii, H. W.: The Po Valley Fog Experiment 1989., Tellus B, 44, 448–468, https://doi.org/10.1034/j.1600-0889.1992.t01-4-00002.x, 1992.

How to cite: Gramlich, Y., Mattsson, F., Heikkinen, L., Haslett, S. L., Neuberger, A., Zannoni, N., Marinoni, A., Riipinen, I., Zieger, P., Decesari, S., and Mohr, C.: The role of chemistry in fog formation in the Italian Po Valley, EGU General Assembly 2024, Vienna, Austria, 14–19 Apr 2024, EGU24-18629, https://doi.org/10.5194/egusphere-egu24-18629, 2024.

EGU24-19375 | Posters on site | AS3.3

Recent advances in understanding secondary organic aerosol formation from ozonolysis of Δ3-carene and other monoterpenes 

Marianne Glasius, Ditte Thomsen, Þuríður Nótt Björgvinsdóttir, Lotte Dyrholm Thomsen, Emil Mark Iversen, Jane Tygesen Skønager, Yuanyuan Luo, Linjie Li, Michael Priestley, Henrik B. Pedersen, Pontus Roldin, Jonas Elm, Mattias Hallquist, Mikael Ehn, and Merete Bilde

It is important to investigate formation, composition and properties of secondary organic aerosol (SOA) from monoterpenes in order to develop an accurate understanding of their atmospheric chemistry, impact on the aerosol budget and the effects of climate change. Δ3-Carene is one of the monoterpenes emitted in highest amounts in the boreal forest, yet only few studies have investigated the atmospheric chemistry and aerosol formation of Δ3-carene.

In this work, we have investigated aerosol formation and composition of SOA from ozonolysis of Δ3-carene at different concentration levels in the AURA atmospheric simulation chamber at Aarhus University, Denmark. At low concentrations of Δ3-carene (about 10 ppb), SOA formation shows minimal temperature dependence under dry conditions. This contrasts with results from studies of Δ3-carene at higher concentrations (about 50 ppb) and studies of the structurally quite similar monoterpene a-pinene. Furthermore, we observed increased particle nucleation at higher relative humidity (about 80% RH, 10°C). Chemical analysis of the SOA found a series of carboxylic acids, in line with previous studies, with different concentration profiles over time, depending on experiment temperature. In experiments with ozonolysis of mixtures of Δ3-carene and a-pinene, we were able to identify a mixed dimer composed of molecular units from each of the precursors.

How to cite: Glasius, M., Thomsen, D., Björgvinsdóttir, Þ. N., Thomsen, L. D., Iversen, E. M., Skønager, J. T., Luo, Y., Li, L., Priestley, M., Pedersen, H. B., Roldin, P., Elm, J., Hallquist, M., Ehn, M., and Bilde, M.: Recent advances in understanding secondary organic aerosol formation from ozonolysis of Δ3-carene and other monoterpenes, EGU General Assembly 2024, Vienna, Austria, 14–19 Apr 2024, EGU24-19375, https://doi.org/10.5194/egusphere-egu24-19375, 2024.

EGU24-19928 | ECS | Posters on site | AS3.3

Insights into air pollution sources in urban enviroments during winter  

Valentina Gluščić, Ivan Bešlić, Gordana Pehnec, and Ranka Godec

Fine particulate matter fraction (PM2.5) is a hazardous risk to human health due to its small size, complex chemical composition, and high specific surface area. Different carbonaceous compounds of which some have mutagenic and cancerogenic properties could bind to the PM2.5 surface and by inhalation penetrate the human body which further leads to the development of severe respiratory and cardiovascular illnesses, even premature death. According to the World Health Organization (WHO)  lower air quality due to elevated PM2.5 levels in rural and urban areas worldwide caused around 4.2 million premature deaths in 2019, while the European Environment Agency (EEA) reported around 238 000 of premature deaths in Europe in 2020. The goal of EEA's long-term action plans on zero air pollution considering PM2.5 levels until 2030 is to further lower these numbers by 55%. Due to its high specific surface area, PM2.5 is subjected to aerosol aging processes which can change the PM2.5 properties and further amplify its negative impact on the environment due to eutrophication and acidification.

Ambient PM2.5 could be directly emitted from its source as primary or could be produced as secondary from its gaseous pollutants. In an urban environment, anthropogenic sources such as vehicular emissions, industry processes, and fossil fuel combustion are considered predominant to elevate PM2.5 levels while the contribution of natural sources like dust resuspension and lightning as well as the long-range transport should not be neglected. The chemical composition of PM2.5 is mostly related to source characteristics e.g. its type, intensity, temporal, spatial, and/or seasonal distribution, while meteorological parameters such as relative humidity, temperature, wind velocity, and solar radiation index could contribute to PM2.5 gas-phase and aqueous-phase transformation processes.

This study aimed to assess the air pollution sources regarding PM2.5 chemical content due to its diverse impact on the environment and human health. Mass concentrations of PM2.5,  as well as, the mass concentrations of water-soluble inorganic and organic ions (Cl-, NO3-, SO42-, Na+, NH4+, K+, Mg2+, Ca2+, acetic (AA), formic (FA), oxalic (OX)) in its content were determined at five measuring sites in different part of Zagreb, capital of Croatia. Daily PM2.5 concentrations were measured by gravimetry and ion chromatography was used to determine water-soluble inorganic and organic ions. Results show that in urban environments mobile and stationary sources as well as primary and secondary sources show the same temporal distribution depending on the day of the week. The mobile and stationary sources both contribute to the overall air pollution in Zagreb at each location, regardless of the station classification. At all measuring sites the higher contribution of primary sources was obtained. Additionally, results indicated  that on certain days, secondary sources were found to be dominant in the northern and western parts of the city. This information highlights the importance of monitoring and regulating both primary and secondary sources of emissions to ensure a healthier environment for all.

How to cite: Gluščić, V., Bešlić, I., Pehnec, G., and Godec, R.: Insights into air pollution sources in urban enviroments during winter , EGU General Assembly 2024, Vienna, Austria, 14–19 Apr 2024, EGU24-19928, https://doi.org/10.5194/egusphere-egu24-19928, 2024.

EGU24-22330 | Posters on site | AS3.3

Modelling the Multiphase Chemistry of Biomass Burning Compounds with CAPRAM-BBM1.0 

Andreas Tilgner, Lin He, Erik Hans Hoffmann, Pauline Nibert, and Hartmut Herrmann

Biomass burning (BB) is an increasingly important contributor to air pollution on global, regional and local scales affecting air quality, public health and climate. Anhydrosugars (e.g., levoglucosan) and methoxyphenols (guaiacol, vanillin, etc.) are key tracer compounds emitted through biomass burning. Once emitted, they can undergo complex multiphase chemical processing in tropospheric aerosol particles and fog/cloud droplets. Their multiphase chemistry contributes to the formation and modification of the secondary organic aerosol (SOA) composition. However, the chemical multiphase processing of levoglucosan and methoxyphenols is not yet well understood and investigated by atmospheric chemistry models. A detailed multiphase oxidation mechanism has not been developed so far.
The present work aimed at a better understanding of the multiphase chemistry of BB tracers, such as levoglucosan and vanillin, by detailed process model studies with a new developed CAPRAM biomass burning module (CAPRAM-BBM1.0). This module was developed based on the kinetic data from measurements in our lab at TROPOS-ACD [1,2] and other literature studies as well as evaluated estimation methods [3]. CAPRAM-BBM1.0 includes 2881 processes (10 phase transfers and 2871 aqueous-phase reactions) and was coupled with the multiphase chemistry mechanism MCMv3.3.1/CAPRAM4.0 [3,4] and the extended CAPRAM aromatics module (CAPRAM-AM1.0) [5,6]. Afterwards, CAPRAM-BBM1.0 was applied in a multiphase chemistry process model for a winter/spring residential wood burning scenario in Europe [7,8].
The model results show that levoglucosan and vanillin are effectively oxidized under cloud conditions leading to concentration reductions of 75%/40% and 97%/94% after the third model day under spring/winter conditions. The chemistry of BB tracers contributes to the formation of BB-SOA and affects also the aqueous-phase budgets of key radical oxidants such as OH and NO3. Aqueous-phase oxidation of BB compounds contributes significantly to the aqSOA formation and aging. For example, a 38% higher organic mass is modelled for the spring case when CAPRAM-BBM1.0 is coupled to the core mechanism. Particularly, the formation of functionalized mono- and dicarboxylic acids is enhanced by a factor of 6.5 and 1.2 in the spring cases when chemistry of BB tracers is considered. Detailed chemical rate analyses show that the daytime oxidation by OH acts as the most important sink for BB tracers. Furthermore, the simulations reveal that in-cloud oxidations represent the main loss for methoxyphenols but their importance strongly depends on the respective Henry’s Law solubilities of the phenolic compounds. All in all, the present studies illustrated the potential role of the chemistry of BB compounds for the formation and processing of SOA.

[1] Hoffmann, D. et al. (2010), Environmental Science & Technology, 44(2), 694-699.,
[2] He, L. et al. (2019), The Journal of Physical Chemistry A, 123(36), 7828-7838.
[3] Bräuer P. et al. (2019), Atmospheric Chemistry and Physics, 19, 9209–9239.
[4] MCM, http://mcm.york.ac.uk/home.htt.
[5] Hoffmann, E. H. et al. (2018), Physical Chemistry Chemical Physics, 20(16), 10960-10977.
[6] Hoffmann, E. H. et al. (2019), ACS Earth and Space Chemistry, 3, 2452–2471.
[7] Poulain, L. et al. (2011), Atmospheric Chemistry and Physics, 11(24), 12697-12713.
[8] Wolke, R. et al. (2005), Atmospheric Environment, 39(23), 4375-4388

How to cite: Tilgner, A., He, L., Hoffmann, E. H., Nibert, P., and Herrmann, H.: Modelling the Multiphase Chemistry of Biomass Burning Compounds with CAPRAM-BBM1.0, EGU General Assembly 2024, Vienna, Austria, 14–19 Apr 2024, EGU24-22330, https://doi.org/10.5194/egusphere-egu24-22330, 2024.

EGU24-979 | ECS | PICO | AS3.4

Uncovering the Influence of Dust-Induced Aerosol Particles on Ecosystem Carbon Uptake 

Sachin Budakoti, Leena Khadke, Akash Verma, Sandipan Mukherjee, and Subimal Ghosh

Understanding the intricate relationship between dust-induced aerosols and ecosystem carbon uptake is essential to resolving the complexities of global carbon cycling. Aerosols play a crucial role in altering surface solar radiation, thereby influencing plant productivity. Despite their recognized role in modulating weather patterns, the precise mechanisms underlying aerosol-induced alterations in gross primary productivity (GPP) remain unclear. Previous studies suggest that aerosols may exert positive or negative impacts on ecosystem carbon uptake, subject to aerosol loading and cloud conditions. The present study uses Moderate Resolution Imaging Spectroradiometer (MODIS) AOD and GPP along with the European Centre for Medium-Range Weather Forecasts (ECMWF-ERA5) reanalysis datasets to investigate the effects of aerosol-induced radiation perturbation and eco-hydro-meteorological feedback on GPP in Himalayan ecosystems. We observe that the long-range transportation of dust-induced aerosol particles from the Middle East over Northern India is influencing air quality and weather patterns. It creates a thermal gradient that keeps surface temperatures lower than the top of the atmosphere. Consequently, the reduction in surface temperature and vapor pressure deficits contribute to variations in carbon uptake. We plan to examine multiple events where high aerosol loading contributes to extreme weather conditions like dust storms. Further, we will validate our results with flux tower measurements. Our findings show the significance of the interactions among aerosol pollution, climate change, and the global carbon cycle, which have unavoidable implications on weather patterns and direct impacts on human health and the tourism industry.

Keywords: Aerosol optical depth, Carbon Uptake, Dust, Himalayan ecosystems

How to cite: Budakoti, S., Khadke, L., Verma, A., Mukherjee, S., and Ghosh, S.: Uncovering the Influence of Dust-Induced Aerosol Particles on Ecosystem Carbon Uptake, EGU General Assembly 2024, Vienna, Austria, 14–19 Apr 2024, EGU24-979, https://doi.org/10.5194/egusphere-egu24-979, 2024.

Wet deposition of reactive nitrogen (Nr) induced by typhoons has significant eco-environmental impacts on the oceans, especially under the growing frequency of landfalling typhoons in East Asia. However, little is known about the mechanism of how anthropogenic activities influence the ocean ecosystem by interacting with landfalling typhoons. Based on the Nested Air Quality Prediction Modeling System, the Nr wet deposition induced by landfalling typhoon Hagupit 2020, and the ecological response, were explored. The Nr wet deposition over both the Yellow Sea and the Sea of Japan after landfall was found to have increased by up to 1000 times that of the pre-landfall ocean influenced by the typhoon. This high Nr wet deposition was mainly due to the “pumping effect” mechanism of the typhoon, which is strong uplifts of the typhoon rapidly carried surface air pollutants up to high altitudes from the land, following a large wet deposition through long-range transport towards downwind ocean, finally led to a high-concertation chlorophyll-a bloom. This study improves our understanding of Nr wet deposition induced by landfalling typhoons, and helps in the establishment of effective and active measures and to reveal marine ecology damaged by extremely strong convective weather systems

How to cite: Ge, B.: Enhanced nitrogen wet deposition induced by landfalling typhoon over East Asia: Mechanism and Implications, EGU General Assembly 2024, Vienna, Austria, 14–19 Apr 2024, EGU24-2728, https://doi.org/10.5194/egusphere-egu24-2728, 2024.

   Atmospheric water-soluble organic carbon (WSOC) is a critical component of airborne particulates, plays an important role in Earth’s energy balance, air quality, and human health. Until now, molecular composition and potential sources of WSOC in non-urban areas under different weather conditions are poorly understood in China. In this study, aerosol samples were collected at three sites in northern China representing remote (Erenhot), rural (Zhangbei), and urban (Jinan) environments during springtime. The WSOC components were analyzed by high-performance liquid chromatography coupled with high-resolution mass spectrometry. During normal days, the results showed that the numbers of assigned formulas of WSOC present the trend of urban > rural > remote sites. The CHO compounds were the most abundant formula category, followed by the CHON compounds at all three sites. The CHO compounds detected at the remote site Erenhot were dominated by oxidized unsaturated organic compounds and biomass-burning-related organic aerosol. The CHON compounds are majorly low-oxygenated-aliphatic species. All these results indicate primary anthropogenic emissions are significant sources at the remote site. However, higher contributions of highly oxygenated CHO and CHON compounds were observed at the site of Jinan, reflecting more insensitive secondary oxidation processes in the urban area. Reduced sulfur-containing species from the combustion of coal or diesel were abundant at Erenhot and Zhangbei, while the aliphatic organosulfates likely from traffic emission and nitrooxy-organosulfates from biogenetic sources were dominant at Jinan. Dust storms significantly changed the molecular composition of WSOC at Erenhot and Zhangbei. The dust-bounded WSOC was dominated by lignin-like species from plant debris, such as flavonoids. This type of organic species presents high volatility and viscosity and is likely an efficient ice-nucleating substance.

How to cite: Wen, H., Zhou, Y., and Wang, X.: Molecular characterization of atmospheric water-soluble organic carbon in contrasting remote, rural, and urban environments in northern China: Comparison of normal and dust days, EGU General Assembly 2024, Vienna, Austria, 14–19 Apr 2024, EGU24-3048, https://doi.org/10.5194/egusphere-egu24-3048, 2024.

Biogenic dimethylated sulfur compounds such as dimethylsulfide (DMS), methanethiol (MeSH), and dimethylsulfoniopropionate (DMSP) are ubiquitous in marine environments, playing pivotal roles in the global sulfur cycle and climate regulation. Atmospheric dust deposition exerts a significant impact on the Northwest Pacific ecosystem. However, its impact on these compounds in the upper ocean remains inadequately understood. This research examines the effects of atmospheric dust deposition, along with the subsequent influx of nutrients and Fe ions on the phytoplankton community and biogenic sulfur cycle in the Northwest Pacific, utilizing a ship-based incubation experiment. Our findings reveal that nutrient influx, stemming from both dust deposition and nutrient addition, has spurred phytoplankton growth, in which dust deposition also altered the structure of the algae community. These changes have consequently increased DMSP production per phytoplankton cell, leading to higher DMSP concentrations. The abundant nutrient has further amplified the DMSP cleavage pathway, a source of DMS, resulting in elevated DMS levels. Interestingly, the increase in DMSP has offset the reduced DMSP demethylation pathway, a source of MeSH, thus raising MeSH concentrations. While Fe ion addition did not directly boost phytoplankton biomass, it induced environmental oxidative stress, which in turn promoted cellular DMSP synthesis, enhancing both DMSP and subsequently DMS and MeSH production. Nevertheless, the swift oxidation of MeSH by active Fe ions led to a reduction in its concentration. This study elucidates the responses of phytoplankton and biogenic dimethylated sulfur compounds to atmospheric dust deposition, along with the subsequent influx of nutrients and Fe ions. These insights are crucial for accurately modeling the implications of such environmental changes on future climate dynamics.

How to cite: Xu, F., Zhang, H.-H., and Yang, G.-P.: Responses of production and concentrations of marine biogenic sulfur to atmospheric dust deposition in the Northwest Pacific, EGU General Assembly 2024, Vienna, Austria, 14–19 Apr 2024, EGU24-4962, https://doi.org/10.5194/egusphere-egu24-4962, 2024.

EGU24-5168 | ECS | PICO | AS3.4 | Highlight

Characteristics of ice nucleating particles in the marine atmosphere from the South China Sea to the eastern Indian Ocean 

Wei Hu, Peimin Duan, Mutong Niu, Rui Jin, Zhijun Wu, and Pingqing Fu

Marine aerosols can act as ice nucleating particles (INPs) and thus influence cloud microphysical properties, water cycle, and global climate. The low concentrations and high variability of INPs in the marine atmosphere lead to difficulties in their measurement and characterization and lack of observational data. In particular, there is a large gap on atmospheric INPs over tropical oceans, especially the Indian Ocean, which may cause large uncertainties in the simulation of atmospheric INPs, resulting in radiation flux errors and thus affecting the climate sensitivity in models. In order to characterize atmospheric INPs over tropical oceans, airborne total suspended particles (TSP) and rainwater samples were collected during a cruise from the South China Sea to the eastern Indian Ocean during April to June 2021. Using the ice nucleation detection device (TJU-INA) combined with multiple treatments, the levels of total INPs and INP compositions including organic, nanoscale (<0.22 mm), biological and bacterial INPs in TSP and rainwater samples were measured, and the sources and influencing factors of INPS were investigated.

Organic INPs dominated INPs (71.7%), and nanoscale INPs also accounted for a large fraction (57.6%) of INPs in marine aerosols during the cruise, with slightly higher proportions in marine areas closer to continents. The concentrations of total, nanoscale and organic INPs were higher in the South China Sea closer to the continent, straits, and the eastern Indian Ocean near Sri Lanka, while the concentrations were lower in the open areas of the eastern Indian Ocean. Carbonaceous components emitted from the continents strongly affected the levels of total and nanoscale INPs. Biological INPs were generally higher near the coast and lower in the open ocean. However, high wind speeds in the eastern Indian Ocean south of the equator likely produced more sea spray aerosols, resulting in higher concentrations of biological INPs than in other open ocean areas. Scavenging of airborne particles by wet deposition likely led to reduction in airborne INPs.

After conversion, the spatial distribution of the levels of INPs in rainwater were comparable to that of INPs in marine aerosols. Organic INPs were also dominant in rainwater, which were likely affected by marine biological activities. However, the proportion of nanoscale INPs in rainwater was only half that in aerosols, while INPs larger than 0.2 μm were more abundant in rainwater, maybe because rainfall removed larger particles more easily. Additionally, Cyanobacteria were probably important contributors to ice nucleation activity in rainwater.

How to cite: Hu, W., Duan, P., Niu, M., Jin, R., Wu, Z., and Fu, P.: Characteristics of ice nucleating particles in the marine atmosphere from the South China Sea to the eastern Indian Ocean, EGU General Assembly 2024, Vienna, Austria, 14–19 Apr 2024, EGU24-5168, https://doi.org/10.5194/egusphere-egu24-5168, 2024.

Aerosol-bound nitrogen (N) serves as a significant external source of N nutrients for marine ecosystems. However, the measurement of aerosol N in the marine atmosphere is challenging due to difficulties in field sample collection. Specifically, the assessment of organic nitrogen (ON) abundance in marine aerosols remains largely unexplored. In this study, marine aerosols were collected from various regions, including the China Seas (Region 1), the Northwest Pacific to Southern Arctic Ocean (Region 2), and the Southwest Pacific to Antarctic (Region 3). A newly developed method enabling the simultaneous detection of inorganic N (IN) and ON in filter-based aerosol samples has been employed to determine the total quantities of IN and ON. Additionally, the concentrations of organic and elemental carbon (OC/EC) and major ions were measured.

Over the China Seas, the average aerosol IN and ON levels exhibited the following rank: Bohai & Yellow Sea (3.87 and 0.61 μg N m-3) > East China Sea (1.50 and 0.27 μg N m-3) > South China Sea (0.52 and 0.18 μg N m-3). However, the average ratio of ON to total N (ON/TN) was higher in the South China Sea (27.1%) compared to the Bohai & Yellow Sea (16.1%) and East China Sea (16.0%). Notably, aerosol IN and ON showed a strong correlation with EC over the China Seas, particularly in the Bohai & Yellow Sea and East China Sea, indicating significant contributions of anthropogenic emissions to the marine aerosol N pool. In comparison, much lower aerosol N levels were observed in Region 2 and 3, with average IN concentrations of 0.064 and 0.021 μg N m-3, and average ON concentrations of 0.049 and 0.024 μg N m-3, respectively. On average, ON accounted for approximately half of the aerosol N in clean marine atmospheres, as observed in Region 2 and 3. Furthermore, the positive correlation between aerosol IN and ON with non-sea salt potassium (nss-K+) was observed in Region 2, but not in Region 3, suggesting a more prominent contribution of biomass burning emissions to marine aerosol N in the northern hemisphere compared to the southern hemisphere. Interestingly, aerosol ON exhibited a stronger correlation with secondary species such as nitrate (NO3-) and non-sea salt sulfate (nss-SO42-) than with sodium (Na+) in both Region 2 and 3, indicating that secondary formation might play a dominant role in contributing to marine aerosol ON, surpassing primary sea salt emissions. Future research efforts should focus on molecular characterizations to gain a better understanding of the sources and transformations of marine ON aerosols.

How to cite: Yu, X., Yu, J. Z., Zhou, Y., Shi, G., and Lai, S.: Abundance of Organic and Inorganic Nitrogen in Marine Aerosols over the China Seas and the Pacific Ocean from Cruises to the Arctic and the Antarctic, EGU General Assembly 2024, Vienna, Austria, 14–19 Apr 2024, EGU24-7585, https://doi.org/10.5194/egusphere-egu24-7585, 2024.

EGU24-8613 | ECS | PICO | AS3.4

Uptake of methylglyoxal on a diversity of natural mineral dusts and proxies: Heterogeneous kinetics and uptake mechanism 

Anais Lostier, Frederic Thevenet, and Manolis N Romanias

Atmospheric aerosols are drivers of climate. Their impact is direct by scattering or absorbing solar radiation, and indirect, by serving as cloud condensation and ice nuclei. Once released into the atmosphere, aerosols can interact and/or react with gas-phase species thereby initiating a process known as chemical aging. This process tends to modify their surfaces. Mineral dust constitutes a significant part of the global atmospheric aerosol mass budget, contributing to almost half of the yearly particle emissions. Dust particles can traverse considerable distances, impacting remote areas from their sources. Despite the pivotal role of mineral dust in the atmosphere, considerable uncertainties persist regarding their influence on climate and air quality. This uncertainty primarily stems from a limited understanding of the fate of dust in the atmosphere and the underlying chemical processes they induce.

The aim of this work is to explore the heterogeneous interaction of methylglyoxal (MGL) with natural mineral dust. MGL results from the oxidation of isoprene in the atmosphere and is regarded as a crucial precursor to secondary organic aerosols (SOA). Therefore, its atmospheric fate of significant consequence to Earth's climate. Uptake experiments were conducted in a Knudsen flow reactor, operating in the molecular flow regime, and coupled with a modulated molecular beam quadrupole mass spectrometer for real-time monitoring of gas-phase reactants and products. The uptake coefficients of MGL is determined on 29 different mineralogical origin surfaces, to elucidate the impact of chemical composition on the uptake efficiency of the dusts.  

The initial uptake coefficients, γ0,is determined to range from 0.05 to 0.67. These values are in the same order of magnitude than reactive gases in the atmosphere, indicating a high affinity between MGL and mineral dust. A correlation between γ0 and Al/Si ratio of natural dust sample is evidenced and discussed. Furthermore, focusing on natural Gobi desert dust, the impact of MGL concentration (0.1 to 2,200 ppb) on γqss is determined. γqss increases as MGL concentration is decreased. Results revealed that the heterogeneous loss of MGL on dusts is a major atmospheric sink comparable to its gas-phase oxidation or photolysis. In addition, MGL uptake mechanism is studied on Gobi dust using in-situ DRIFT (Diffuse Reflectance Infrared Fourier transform) spectroscopy, providing useful information on interaction mechanisms. These findings offer novel insights into the atmospheric fate of MGL, providing a more comprehensive understanding of its heterogeneous atmospheric fate.

How to cite: Lostier, A., Thevenet, F., and Romanias, M. N.: Uptake of methylglyoxal on a diversity of natural mineral dusts and proxies: Heterogeneous kinetics and uptake mechanism, EGU General Assembly 2024, Vienna, Austria, 14–19 Apr 2024, EGU24-8613, https://doi.org/10.5194/egusphere-egu24-8613, 2024.

EGU24-9051 | PICO | AS3.4 | Highlight

Ice Nucleation Activity of Atmospheric Asian Dust Particles 

Zhijun Wu, Jingchuan Chen, and Min Hu

Airborne mineral dust triggers ice formation in clouds and alters cloud microphysical properties by acting as ice-nucleating particles (INPs), potentially influencing weather and climate at regional and global scales. Asian dust is an important source of atmospheric INPs. However, the ice nucleation activity (INA) of Asian dust, especially its sensitivity to particle size and anthropogenic pollution aging, remains poorly understood. In this study, we investigated the immersion mode ice nucleation properties and particle chemical characterizations of collected size-resolved Asian dust samples, covering eight particle size classes ranging from 0.18 to 10.0 μm. We also examined the chemical modification of aged dust particles via particle chemistry and morphology analyses. The measured total INP concentrations in the immersion mode ranged from 10-2 to 102 L-1 in dust events at temperatures between -25 and -5 ℃. An explicit size dependence of both INP concentration and surface ice active density was observed. The nucleation efficiency of dust particles increased with increasing particle size, while the INP concentration first increased rapidly and then levelled, due to the significant decrease in the number concentration of larger particles. The mass fraction of Ca2+ in element Ca and the mean relative mass proportions of supermicron Ca2+ increased by 67.0% and 3.5-11.2% in aged Asian dust particles, respectively, suggesting the occurrence of heterogeneous reactions. On the other hand, the total INP concentrations and total ice nucleation active site densities were consistent between aged and normal dust particles (0.62-1.18 times) without a statistically significant difference. And the INP concentrations and surface active site densities of chemically aged supermicron dust (1.0-10.0 μm) in each particle size class were nearly equal to or slightly higher than those of normal Asian dust, which were 0.70-2.45 times and 0.64-4.34 times at -18 ℃, respectively. These results reveal that anthropogenic pollution does not notably change the INP concentrations and does not impair the INA of Asian dust. Our work provides direct observational evidence and clarifies the non-suppression effect of anthropogenic pollution on the INA of East Asian dust, advancing the understanding of the ice nucleation of airborne aged mineral dust.

How to cite: Wu, Z., Chen, J., and Hu, M.: Ice Nucleation Activity of Atmospheric Asian Dust Particles, EGU General Assembly 2024, Vienna, Austria, 14–19 Apr 2024, EGU24-9051, https://doi.org/10.5194/egusphere-egu24-9051, 2024.

EGU24-9444 | PICO | AS3.4

Impact of Dust Aerosols on Air Quality in Southern Xinjiang 

Bin Han, Peng Wang, Zhixuan Xin, Hao Yu, Wen Yang, and Zhipeng Bai

Dust aerosols, originating from wind erosion, desertification, and anthropogenic activities, ubiquitous in arid and semi-arid regions, profoundly influence radiation, clouds, precipitation, atmospheric chemistry, and biogeochemistry. This study investigates the impact of dust aerosols on air quality in the western region of China, mainly focusing on Xinjiang. As the largest provincial-level region in China, Xinjiang presents a diverse landscape ranging from vast deserts to mountainous terrains. The intricate interplay of geographical features, including the Taklamakan Desert and the Tianshan Mountains, contributes to the intricate transport pathways of dust aerosols. By selecting Xinjiang as the study area, we aim to capture the different impacts of dust aerosols on southern and northern Xinjiang. Simultaneously, we are committed to enhancing the accuracy of coarse dust aerosol (2.5 μm < D < 10 μm) simulations in the model. This research investigates the disparities in the impact of dust aerosols between northern and southern Xinjiang. Preliminary analyses suggest that the north and southern regions exhibit variations in dust aerosol concentrations, transport patterns, and associated air quality consequences. Based on hourly data of six conventional air pollutants from an automatic station in the oasis city at the edge of the Tarim Basin in 2016, as well as the analysis of 1664 PM2.5 and PM10 receptor samples from 14 different locations in the oasis city during different seasons, particularly in the dust and sandstorm season (March to May), the daily average concentrations of PM2.5 and PM10 ranged from 71 to 253 μg/m3 and 325 to 799 μg/m3, significantly exceeding those in the non-dust and non-heating season (20-59 μg/m3 and 87-196 μg/m3). During the dust and sandstorm season, dust emissions, primarily from natural sources, contribute to more than 60% of PM, highlighting their predominant role as significant contributors to PM concentrations. Therefore, enhancing the accuracy of simulating dust loa using models is crucial for understanding the impact of dust on air quality. Recent studies comparing global model simulations against measurements showed that most models underestimate coarse dust load in the atmosphere, and this underestimation can be associated with poorly resolved or poorly understood processes that result in too-little emission or too-fast deposition of these particles in the models. Therefore, we employ WRF-Chem to investigate the sensitivity of coarse mode particulate matter to size distribution and settling velocities based on existing dust simulation schemes. By comparing the simulation results with observational data to identify the optimal size distribution and settling velocities for effective coarse-mode dust simulation. Understanding the dynamics of dust aerosols in this region is crucial for comprehending their broader impacts on air quality and environmental health. And the regional differences are pivotal for implementing targeted air quality management strategies tailored to the specific challenges faced by each subregion.

How to cite: Han, B., Wang, P., Xin, Z., Yu, H., Yang, W., and Bai, Z.: Impact of Dust Aerosols on Air Quality in Southern Xinjiang, EGU General Assembly 2024, Vienna, Austria, 14–19 Apr 2024, EGU24-9444, https://doi.org/10.5194/egusphere-egu24-9444, 2024.

EGU24-15400 | ECS | PICO | AS3.4

Exploring aerosol size distributions from polar to tropical zones of the Atlantic Ocean 

Subha S Raj, Isabella Hrabe de Angelis, Sanja Basic, Hedy M. Aardema, Hans A. Slagter, Jens Weber, Maria Ll. Calleja, Matteo Krüger, Meinrat O. Andreae, Antonis Dragoneas, Björn Nillius, David Walter, Thomas Berkemeier, Gerald H. Haug, Ulrich Pöschl, Ralf Schiebel, and Christopher Pöhlker

Aerosols over the oceans significantly influence the composition of the Earth’s atmosphere and climate. Over the vast expanse of oceans, aerosols are emitted at high rates, primarily through wave breaking and bubble bursting. Additionally, secondary aerosol particles can be formed by gas-phase reactions. Particles emitted from shipping activities, long-range transport from continents, and potential downward transport from the upper troposphere can also contribute to aerosols in the marine boundary layer (MBL). Hence, marine aerosols represent a highly heterogeneous and complex mixture pivotal in regulating the global radiation budget.

This study explores aerosol number size distributions over the North Atlantic Ocean measured on the research vessel S/Y Eugen Seibold. The cruises conducted between June 2020 and September 2021 covered a broad geographic range from polar (~67° N) to tropical (~3° N) waters. Aerosols were sampled at approximately 13 m above the ocean surface using two sets of instrumentation covering particle sizes of 10 nm to 430 nm and 520 nm to 20 µm.

Three aerosol size modes, Aitken, accumulation, and coarse, were consistently identified throughout the dataset, aligning with prior research. Additionally, we observed an intermittently occurring nucleation mode and a bimodal coarse mode. While the presence of a nucleation mode suggests aerosol formation over the open ocean, it did not exhibit the typical banana-shaped contour plots usually observed during new particle formation and subsequent growth. Prior research indicates that ships may act as emitters in this size range, in addition to secondary formation from atmospheric gases.

Here, we describe and discuss particle number size distributions observed over the open ocean, raising questions about the formation and lifecycle of aerosol modes. Our goal is to track the behavior of nucleation, Aitken, accumulation and coarse modes in the MBL with high temporal resolution, spanning the latitudinal range of the northern Atlantic Ocean. A comprehensive dataset is prepared by incorporating surface ocean data retrieved on board and satellite observations to disentangle the natural and/or anthropogenic origins of aerosols responsible for the observed particle number size distributions in the MBL.

How to cite: S Raj, S., Hrabe de Angelis, I., Basic, S., M. Aardema, H., A. Slagter, H., Weber, J., Ll. Calleja, M., Krüger, M., O. Andreae, M., Dragoneas, A., Nillius, B., Walter, D., Berkemeier, T., H. Haug, G., Pöschl, U., Schiebel, R., and Pöhlker, C.: Exploring aerosol size distributions from polar to tropical zones of the Atlantic Ocean, EGU General Assembly 2024, Vienna, Austria, 14–19 Apr 2024, EGU24-15400, https://doi.org/10.5194/egusphere-egu24-15400, 2024.

EGU24-17863 | ECS | PICO | AS3.4

Molecular characterization of PM2.5 in Xi'an, Northwest China to reveal seasonal variation in sources of the organic fraction 

Linjie Li, Yijun Shang, Tingting Sun, Xiangrui Kong, Sen Wang, and Mattias Hallquist

Organic aerosols (OA) are an important component of fine particulate matter (PM2.5), constituting a substantial portion of its total mass. Seasonal ambient PM2.5 samples were collected in Xi’an from April 2018 to March 2019. In order to achieve a molecular-level understanding of the OA fraction, the samples were analyzed using an iodide chemical ionization mass spectrometer combined with a Filter Inlet for Gases and AEROsols (FIGAERO-CIMS). The sum of compounds identified by FIGAERO-CIMS represented 29% organic matter in PM2.5 on an annual average, including compounds containing CHO, CHON, CHOS, and CHONS. In the winter, the concentration of identified compounds notably surpasses levels observed in the other seasons. It was especially evident during a severe pollution episode in January 2019. The relative contribution of compounds containing only CHO, i.e., no sulfur or nitrogen, increases during summer which is likely due to enhanced photochemical oxidation. It was also indicated by a slightly elevated oxidation state being observed in summer compared to other seasons. The CHON compounds are most likely mainly consisting of nitro-aromatics, e.g., phenols-like compounds, where biomass burning and secondary formation are the dominant sources. Both biogenic and anthropogenic volatile organic compounds are contributing to sulfate-containing organic compounds in urban Xi’an.

How to cite: Li, L., Shang, Y., Sun, T., Kong, X., Wang, S., and Hallquist, M.: Molecular characterization of PM2.5 in Xi'an, Northwest China to reveal seasonal variation in sources of the organic fraction, EGU General Assembly 2024, Vienna, Austria, 14–19 Apr 2024, EGU24-17863, https://doi.org/10.5194/egusphere-egu24-17863, 2024.

EGU24-17901 | PICO | AS3.4 | Highlight

Hygroscopic Properties of Plateau Surface Salts: Insights from Chemical Composition and Isotope Signatures 

Xiangrui Kong, Yuxin Hao, Yuhe Qiu, Jun Li, Wanyu Liu, Lanxiadi Chen, Xiying Zhang, Mingjin Tang, Zhenchuan Niu, and Sen Wang

Evaporite salts from saline lakes and playas play active roles in the atmospheric cycles and the climate system, especially in the context of changing climate. This study investigates the chemical, isotopic, and hygroscopic characteristics of surface salt samples from two saline lakes, i.e., Mang’ai and Dalangtan (MA and DLT), in the Qaidam Basin. Samples from both lakes shared similar ionic compositions, with brines rich in Cl-, Mg2+, and Na+, and lakebed salts being primarily NaCl-based. Disparities in composition between MA and DLT crust salts were observed. Isotopic analyses revealed consistent δ34S values within samples from a single site, hinting at a common origin. The sulfur source for MA saline lake likely arises from nearby freshwater inflows and atmospheric deposits. The δ37Cl values varied by sample type, with solid samples typically exhibiting higher values than brines, attributed to 37Cl depletion during precipitation. On the hygroscopic properties, the ionic composition is identified as a key determinant. While brines started moisture absorption around 40% RH, lakebed salts commenced at 70% RH. The DLT playa salt, enriched in Na2SO4, demonstrated unique behavior, responding significantly only above 80% RH. The layered DLT samples showcased variable hygroscopic behaviors, particularly the early moisture uptake of the topmost layer, despite its ionic similarity to another layer, hinting at molecular or hydration disparities. In conclusion, this investigation unravels the multifaceted relationship between salt evaporites composition and their implications for atmospheric chemistry.

How to cite: Kong, X., Hao, Y., Qiu, Y., Li, J., Liu, W., Chen, L., Zhang, X., Tang, M., Niu, Z., and Wang, S.: Hygroscopic Properties of Plateau Surface Salts: Insights from Chemical Composition and Isotope Signatures, EGU General Assembly 2024, Vienna, Austria, 14–19 Apr 2024, EGU24-17901, https://doi.org/10.5194/egusphere-egu24-17901, 2024.

EGU24-19439 | ECS | PICO | AS3.4

On various effects of dust on the concentration of dissolved organic carbon in the sea 

Rianne van Kaam, Martin Kölling, Kai-Uwe Hinrichs, and Matthias Zabel

After input from rivers, the aeolian input of particles is probably the main source of nutrients in the ocean. Dust also plays an important role in the transport of organic material into the deep sea. However, little is known about the adsorption capacity of mineral dust for dissolved organic material (DOM). In this study, we investigate the effects of dust-seawater interaction on the carbon cycle. We collected dust samples in the form of silty crusts (grainsize < 63 µm) from the ephemeral rivers Kuiseb and Omaruru in Namibia, Southern Africa. To characterize the source material, we analysed for total organic carbon (TOC), specific organic compounds, 13C/12C isotope ratio, elemental composition and specific surface area. Sorption experiments were performed through time series and isotope analysis. We added different amounts of dust to a mixture of artificial seawater with DOM and 13C labelled DOM, both extracted from Spirulina algae and each in naturally occurring concentration. Experiments with a moderate amount of dust showed a decline in dissolved organic carbon (DOC) over time. This finding was also confirmed by analyses of 13C/12C isotope ratio on dust samples, before and after suspension in seawater DOM solution. Both results indicate that dust adsorbed a significant portion organic carbon from the Spirulina DOM solution. However, the net uptake of DOM on mineral particle surfaces depends on the ratio between DOM concentration and the amount of dust used. If dust already contains organic components, which was the case in our experiment, at least some of these organic compounds will dissolve in contact with seawater if the ratio between the amount of dust or primary organic material contained and the DOM concentration in the initial test solution exceeds a certain value. In this case, the input of dust represents a source of DOM in the near surface seawater. Our study reveals that terrestrial, mineral dust may act as both a sink and a source for DOM in surface waters of the ocean. Subsequent studies will have to clarify the extent of the impact of these effects on the carbon cycle. 

How to cite: van Kaam, R., Kölling, M., Hinrichs, K.-U., and Zabel, M.: On various effects of dust on the concentration of dissolved organic carbon in the sea, EGU General Assembly 2024, Vienna, Austria, 14–19 Apr 2024, EGU24-19439, https://doi.org/10.5194/egusphere-egu24-19439, 2024.

EGU24-19506 | PICO | AS3.4 | Highlight

The Long-Term Evolution of Dust-Related New Particle Formation Events under Emission Reduction in Beijing 

Dongjie Shang, Min Hu, Zhijun Wu, and Song Guo

In urban and remote atmospheres, new particle formation (NPF) events often occur after dust storms, which can have further impacts on regional and global climate. Additionally, the levels of gaseous precursors and condensation sink (CS) resulting from anthropogenic emissions can also influence the occurrence and intensity of NPF events. Over the past decade, China has implemented various air quality improvement actions, leading to significant changes in air pollutant emissions. However, there have been limited studies on the long-term evolution of NPF events caused by the synergy of dust storms and anthropogenic emissions.

This study aims to analyze the characteristics of dust-related NPF events in Beijing from 2009 to 2017 and compare them with non-dust NPF events. The results show that the formation rates of dust-related NPF events decreased due to the reduction of SO2 emissions. However, the growth rates remained stable, possibly due to the increasing oxidation capacity in Beijing. These findings contribute to a deeper understanding of the climate effects of natural dust under the influence of anthropogenic emission control measures.

How to cite: Shang, D., Hu, M., Wu, Z., and Guo, S.: The Long-Term Evolution of Dust-Related New Particle Formation Events under Emission Reduction in Beijing, EGU General Assembly 2024, Vienna, Austria, 14–19 Apr 2024, EGU24-19506, https://doi.org/10.5194/egusphere-egu24-19506, 2024.

EGU24-198 | ECS | Posters on site | AS3.8

Design and Validation of a portable sampler to monitor pollens at street level in the ambient environment 

Sachin Dhawan, Anand Kumar, Mukesh Khare, and Dalip Singh Mehta

In the ambient environment where gases and various particles coexist, pollen is a chief biological airborne particle among atmospheric bioaerosols. Despite its significance, pollen surveillance in many countries including India is overlooked as most of the air quality monitoring, predominantly targets PM2.5, PM10, or other gaseous pollutants. Pollens are not only vital for plant reproduction but they interact with various atmospheric elements, trigger allergies, influence genetic exchange and cause environmental shifts by fostering microorganism transmission. Despite their profound impacts, the epidemiological effects of pollens remain underexplored. Majority of the pollens aggravate diseases like asthma or COPD in human beings and, therefore the investigative studies on pollens become crucial for disease management. The sampling of pollens involves multiple parameters e.g., wind speed, turbulence, and orientation of sampler, affecting their concentrations. Suction-based impaction pollen samplers offer promising pollen sampling due to their adaptable cut points and high throughput. However, if such suction-based samplers are designed to match human breathing rates of 12-16 LPM and a D50 of 2 µm, the retrieval of pollens is efficiently optimized. In this work, a rectangular slit-based pollen sampler was designed after carrying out extensive numerical modelling for creating a 3D design of the sampler. Further, the Computational Fluid Dynamic (CFD) employing Poly-Hexcore volume meshing, and a k-w turbulence model combined with the Discrete Phase Model (DPM). was used to validate the design of the sampler., The DPM includes particle sizes ranging from 2 – 100 µm with simulations carried out in two regions i.e., solid (slide) and fluid (air). The slide's boundary condition was set as ‘trap’ since it was coated with a sampling medium to capture pollens. Further, inlet and outlet boundary conditions were set as ‘escape’. The efficiency of pollen collection as observed from the simulations, ranged between 60% - 100%, gauged through particle trajectory and streamlines. Pollen collection efficiency was found to increase when staggered inlet and outlet mass flow geometry were used. Moreover, the use of a trapping sampling medium restricted particle jump-off, altering the particle cut-off point towards smaller sizes. This shift, while enhancing capture efficiency, also influenced the particle size range the sampler can effectively trap. In summary, the pollen sampler designed in this work exhibited a better collection efficiency compared to traditional samplers and was also representative of the pollen inhalation rate of human beings. Further, field testing was also done for the sampler to see the presence of pollen in ambient air.

How to cite: Dhawan, S., Kumar, A., Khare, M., and Mehta, D. S.: Design and Validation of a portable sampler to monitor pollens at street level in the ambient environment, EGU General Assembly 2024, Vienna, Austria, 14–19 Apr 2024, EGU24-198, https://doi.org/10.5194/egusphere-egu24-198, 2024.

EGU24-265 | ECS | Orals | AS3.8 | Highlight

Long-range transport of Saharan dust to East Asia and their regional impacts 

Qiantao Liu, Zhongwei Huang, Zhiyuan Hu, Jianrong Bi, Jinsen Shi, Tian Zhou, and Qingqing Dong

Saharan dust accounts for about 50-60% of the total global dust and can affect regional climate, environment and ecosystems through direct and indirect effects. However, the long-range transport of Saharan dust to East Asia and the further specific effects on its weather and climate are still poorly understood. Using the satellite observations combined with the model simulations, the multiple reanalysis data and HYSPLIT trajectory analysis, we systematically study the long-range transport of Saharan dust to East Asia and further study the impact of Saharan dust on the direct radiative forcing, clouds and precipitation in East Asia. A quarter (24.3 ± 6.2%) of dust cases in East Asia were originated from the Sahara Desert. The long-range transported Saharan dust is usually located in the upper troposphere of East Asia. The total annual average amount of Saharan dust transported over East Asia is 33.05 ± 9.78 Tg/year. Saharan dust can be transported eastward throughout the year and contributes about 35.8% of the dust to the upper troposphere in northern China in spring, which is almost equivalent to the amount of dust lifted from the East Asian dust source. Furthermore, in terms of regional impact, Saharan dust has a cooling effect on the surface and the top of the atmosphere, and a heating effect on the atmosphere. During a rainfall event, Saharan dust reduces the cloud supercooled water path over the Taklimakan Desert by 13.3 g/m2 in 3 h, converting supercooled water clouds into ice clouds and increasing the cloud ice-water path. As a result, a large amount of dust that acts as ice nuclei induces rainfall in the hinterland of the Taklimakan Desert as high as 6.32 mm. This study provides a new perspective on the important role of Saharan dust over East Asia, contributes to a better understanding of its long-range transport properties over East Asia and the sources of dust aloft in East Asia, and elucidates the impact of long-range transported dust on regional direct radiative forcing, clouds, and precipitation to better assess the impact of dust on climate and environment.

How to cite: Liu, Q., Huang, Z., Hu, Z., Bi, J., Shi, J., Zhou, T., and Dong, Q.: Long-range transport of Saharan dust to East Asia and their regional impacts, EGU General Assembly 2024, Vienna, Austria, 14–19 Apr 2024, EGU24-265, https://doi.org/10.5194/egusphere-egu24-265, 2024.

EGU24-779 | ECS | Posters on site | AS3.8

Estimating pollen profiles and assessing relationships with meteorology, air pollutants and vegetation in three cities of India 

Arzoo Dhankhar, Sagnik Dey, Nicholas J Osborne, and Darsy Darssan

Estimating pollen profiles and assessing relationships with meteorology, air pollutants and vegetation in three cities of India

Arzoo Dhankhar1, Sagnik Dey2, Darsy Darssan3, Nicholas J Osborne3

1UQIDAR (University of Queensland, Australia- Indian Institute of Technology, Delhi, India)

2Indian Institute of Technology, Delhi

3School of Public Health, University of Queensland, Australia


Allergy, is, showing an increasing incidence over recent decades across the globe. Less emphasised is the impact of bioaerosols particularly ‘pollen’ on adverse respiratory health effects. India has some of the poorest air quality globally making it an important study area. Regular monitoring of airborne pollen is crucial to know the current prevalence and diversity of potential pollen allergens present in the air column. But most of the LIC and LMICs lack regular pollen monitoring both spatially and temporally.

In this study, we collected daily bi-hourly airborne pollen samples from three cities in India (Delhi, Rishikesh and Kolkata) for 5 weeks. These samples were collected using small portable pollen samplers (pollen sniffers). The pollen were counted using microscopy and the results were analysed. The study focused on assessing the relationships between daily pollen counts (total and grass), meteorological parameters (wind speed, relative humidity, temperature, rainfall), vegetation and air pollutants (PM2.5, PM10, NOx, SOx, O3).

Poaceae and Chenopodiaceae-Amaranthaceae families were found to be the dominant airborne pollen families at the Delhi site since it was the peak growing season for grasses and weeds. The overall range for total pollen was highest in Rishikesh (300-500 pollen counts) than in Delhi and Kolkata. Among meteorology, rain, temperature, and wind were significantly correlated with bihourly pollen counts with p value < 0.05. Since the cities chosen for the analysis differ in pollution levels, the insights provide a better understanding of pollution and pollen effects.  The study also reflects upon a less explored method of airborne pollen collection, further adding meteorology effects on pollen to the research database. The results will be used to develop prediction model for grass pollen using variables like vegetation and meteorology.

Further work will be assessing pollen counts with respiratory health outcomes. The study’s objective is to provide valuable insights that can benefit to the policy makers, health care workers, scientist community and potentially help in reducing health burden of the country along with providing quality life for susceptible citizens.

How to cite: Dhankhar, A., Dey, S., J Osborne, N., and Darssan, D.: Estimating pollen profiles and assessing relationships with meteorology, air pollutants and vegetation in three cities of India, EGU General Assembly 2024, Vienna, Austria, 14–19 Apr 2024, EGU24-779, https://doi.org/10.5194/egusphere-egu24-779, 2024.

EGU24-1412 | Posters on site | AS3.8

Roles of Mountains in Dust Storms  

Ashok Kumar Pokharel and Ashok Pokharel

A study of the dust emission, transport, and deposition is very important for understanding of the various health and social impacts on the local human population, biogeochemical cycle, and the global environmental change. The entry of dust into the atmosphere results from the occurrence of different scales of dust storms resulting from the multi-scale atmospheric processes ranging from the synoptic to near meso-scales of atmospheric motion. In this context, to find the causes of severe dust storms that occurred in the past over north-west Africa, central-north Africa, and Middle east we did a research work. In that study, significant roles of mountains (e.g., Atlas Mountains, Tibesti Mountains, and Sarwat Mountains) were found. For instances, there were a cross mountain flows that produced a leeside inversion layer, which facilitated for the imbalance of the exit region of the jet streak, prior to the large-scale dust storm; generation of terrain (i.e., mountains)-induced downslope winds in response to the transition of the atmospheric flow from a subcritical to supercritical state leading to dust storms; and generation of Kelvin waves supported by the mountains that were responsible for organizing the dust storms and wide distribution and transportation of dust away from the mountains. Regarding this, it is also hypothesized here that similar kinds of roles of mountains are also found in other geographical regions of the world, such as West/North/Northwest China and Mongolia where dust storms occur in the lee of the mountains, (i.e., Tien Shan/ Gobi Altai Mountains/ Khangai Mountains) and involve the long-range transport of atmospheric particulate matter originating from dryland areas. Such events are affecting large numbers of people and their environment especially in spring season because East Asia is the one of the most densely populated areas of the world. In this scenario, these kinds of studies will also be beneficial for analyses of roles of the synoptic features, and identification of their dynamical characteristics are important for evaluating different synoptic dust regimes and their development. So, for the current study, based on the severity of dust storms some cases of dust storms, which occurred in the lee of the respective mountains of China and Mongolia in the past, are considered.

Keywords: Mountains, Dust Storms, Jet streak, Atmosphere

How to cite: Pokharel, A. K. and Pokharel, A.: Roles of Mountains in Dust Storms , EGU General Assembly 2024, Vienna, Austria, 14–19 Apr 2024, EGU24-1412, https://doi.org/10.5194/egusphere-egu24-1412, 2024.

EGU24-2052 | Posters on site | AS3.8

Chemical Characterization of Atmospheric Bioaerosols 

Palina Bahdanovich, Kevin Axelrod, Andrey Khlystov, and Vera Samburova

Bioaerosols, or aerosol particles of biological origin, have been found to represent a significant mass fraction of atmospheric particulate matter (PM) and organic carbon (OC). These particles are larger in size (up to 100 µm) than most anthropogenic aerosols but are lighter and thus can be transported over long distances, affecting atmospheric processes and cloud physics (i.e., act as cloud condensation nuclei). Moreover, climate change is expected to increase pollen number concentrations (~21%) as well as pollen season length (+21 days) across North America. So far, only a few studies have been conducted on the chemical composition of bioaerosols and their behavior under atmospheric conditions. The goal of this research was to characterize the chemical composition of bioaerosols using multiple analytical techniques, such as Proton Nuclear Magnetic Resonance Spectroscopy (1H-NMR), Gas Chromatography-Mass Spectrometry (GC-MS), and Ultra-High Performance Liquid Chromatography-Mass Spectrometry (UPLC-MS), thereby advancing atmospheric aerosol chemistry. Various common bioaerosols, including pollen, algae, fungi, and bacteria, are analyzed, and characterized under controlled laboratory conditions. All samples are analyzed for their chemical composition: saccharides with GC-MS, amino acids and fatty acids with UPLC-MS, and functional groups with 1H-NMR spectroscopy. The present research is one of the first studies of detailed chemical characterization of bioaerosols with the 1H-NMR technique, where the 1H-NMR results are also compared with GC- and UPLC-MS quantitative analyses of individual bioaerosol species.

How to cite: Bahdanovich, P., Axelrod, K., Khlystov, A., and Samburova, V.: Chemical Characterization of Atmospheric Bioaerosols, EGU General Assembly 2024, Vienna, Austria, 14–19 Apr 2024, EGU24-2052, https://doi.org/10.5194/egusphere-egu24-2052, 2024.

EGU24-2273 | Posters on site | AS3.8 | Highlight

Declining trend of dust aerosols over central China observed with polarization lidar during 2010-2020 

Yun He, Dongzhe Jing, Fuchao Liu, and Zhenping Yin

East Asian desert is one of the most important dust sources that contribute approximately ~40% of the global annual dust emissions and ~88% of the dust over mainland China and adjacent seas, significantly impacting the regional environment and climate. In the past decade, the frequency of dust storm outbreaks has largely declined in the sources of Asian dust due to the improvement of natural conditions (i.e., weakened surface wind speed, enhanced precipitation, and soil water) and the promotion of vegetation cover caused by afforestation in North China. However, it is still rarely reported how the dust properties after long-range transport in the downstream regions respond to this downtrend. During 2010-2020, we have been conducting routine monitoring of height-resolved dust aerosols with a ground-based polarization lidar in Wuhan (30.5°N, 114.4°E), a mega city in central China. The dust optical depths (DOD) have decreased by 0.011 per year, accounting for ~22% of the decrease rate for local aerosol optical depths (AOD). The dust mass concentration and columnar mass density also have declined by 2.03 μg·m-3 and 1.97 mg·m-2 per year, respectively. During spring and winter, a mass of long-range transported dust plumes intrude into Wuhan, with seasonal mean DOD of 0.21 and 0.15, respectively. Dust aerosols in winter are generally located at lower altitudes than in spring, concentrating mainly below 1.0 km. Wintertime dust shows a slightly smaller particle depolarization ratio than spring (0.11 versus 0.14), indicating a weakened nonspherical shape caused by high-level moisture/polluted conditions during winter. The surface PM10 concentration presents a downtrend with a rate of -8.0 μg·m-3·yr-1. This study provides the climatology of dust properties over central China, supplementing our understanding of the feedback in the downstream regions to the reduction of dust emissions in the East Asia desert.

How to cite: He, Y., Jing, D., Liu, F., and Yin, Z.: Declining trend of dust aerosols over central China observed with polarization lidar during 2010-2020, EGU General Assembly 2024, Vienna, Austria, 14–19 Apr 2024, EGU24-2273, https://doi.org/10.5194/egusphere-egu24-2273, 2024.

EGU24-2447 | Posters on site | AS3.8

Long-term Aerosol Monitoring at the Western Arabian Peninsula and Red Sea Coast 

Illia Shevchenko, Georgiy Stenchikov, and Johann Engelbrecht

The Arabian Peninsula is one of the World’s largest dust source regions. It is also affected by natural and anthropogenic pollution of African, Asian, and European origin. As the Arabian Peninsula is highly under-sampled, we have since 2012 established and maintained aerosol monitoring sites at King Abdullah University of Science and Technology (KAUST), as well as in the North-Western part of the Arabian Peninsula, and the Red Sea coast. The sites incorporate the following instrumentation. Two CIMEL sun photometers operational since 2012 as a part of the NASA Aerosol Robotic NETwork (AERONET), providing aerosol optical depth (AOD) and aerosol parameters, reporting data to the NASA Goddard website (http://aeronet.gsfc.nasa.gov/cgi-bin/type_piece_of_map_opera_v2_new). The AOD distribution over the Red Sea is measured during KAUST Red Sea cruises using a hand-held sun photometer (Microtops II). The data are reported to the NASA Maritime Network (http://aeronet.gsfc.nasa.gov/new_web/maritime_aerosol_network.html). Vertical Distribution of aerosols is sampled using the Micro Pulse Lidar (MPL) operating as a part of the NASA MPLNET (http://kimura.gsfc.nasa.gov/site--‐page?site=Kaust). We measure aerosol deposition rates on a monthly basis using passive samplers in different several locations (KAUST, 2015-2023; Al Wajh Lagoon, 2021-2022; DUBA & Tabuk,2022 -2023) and conducted a mineralogical analysis of deposited aerosols by X-ray diffractometry (XRD) and measured particle size distributions using Mastersizer3000.

Our objective in this study is to conduct an in-depth analysis of the combined effects of natural and anthropogenic pollution on air quality, climate, and application of renewable energy across the Arabian Peninsula, providing a scientific foundation for model calibration in this region. Here we report on the data sets collected in 2012- 2023:

  • KAUST campus site: Six dust deposition samplers, AERONET, MPL
  • Al Wajh Lagoon site: Nine dust deposition samplers
  • Duba site: Two dust deposition samplers
  • Tabuk site: Two dust deposition samplers

In our group’s research at KAUST, these data sets, in combination with the available satellite observations, were integrated into the meteorology-chemistry-aerosol model, WRF-Chem, to quantify the aerosol environmental impacts and support environmental decision-making in the region.

How to cite: Shevchenko, I., Stenchikov, G., and Engelbrecht, J.: Long-term Aerosol Monitoring at the Western Arabian Peninsula and Red Sea Coast, EGU General Assembly 2024, Vienna, Austria, 14–19 Apr 2024, EGU24-2447, https://doi.org/10.5194/egusphere-egu24-2447, 2024.

In this paper, long-term temporal and spatial distribution characteristics of aerosols in arid and semi-arid regions of Eurasia (30° N - 60° N, 25° E - 90° E) from 2001 to 2021 were studied by combining Moderate−resolution Imaging Spectroradiometer (MODIS), Cloud−Aerosol Lidar and Infrared Pathfinder Satellite Observations (CALIPSO) (2007-2021) and Ozone Monitoring Instrument (OMI) observations.  Aerosol types over Eurasia were studied based on aerosol optical depth (AOD), Ångström exponent (AE), and aerosol single scattering albedo (SSA). The results show that the average AOD (obtained from MODIS) is high in the Taklimakan, Tar, Kizikom, and Syria deserts. Seasonal aerosol concentrations in Xinjiang, Iraq, Iran, Kazakhstan, Uzbekistan, and Turkmenistan were the highest in spring, the second-highest in summer, and the lowest in autumn and winter. Clean marine and mixed aerosols are the primary aerosol types in the Eurasia. The relative contribution of meteorological factors to dust optical depth (DOD) and its long-term variation have been quantified by stepwise regression model. The model results show that the contribution of humidity at 500 hPa (H500) to the change of DOD is 28%, the contribution of wind speed (WS) to the change of DOD is 19%, and the contribution of temperature (T) to the change of DOD is 12%.  The spatial distribution of the correlation coefficient between DOD and meteorological factors is higher under the bare surface compared to complex terrain. This result highlights the sensibility of meteorological factors on the distribution of DOD in the desert. The results presented in is paper are helpful for understanding the interaction between DOD and meteorological factors.

© 2014 xxxxxxxx. Hosting by Elsevier B.V. All rights reserved.

How to cite: Zhang, S. and Detlef, M.: Distribution of aerosol optical depth and possible factors influencing dust optical depth over arid and semi−arid Eurasia, EGU General Assembly 2024, Vienna, Austria, 14–19 Apr 2024, EGU24-2712, https://doi.org/10.5194/egusphere-egu24-2712, 2024.

EGU24-2775 | Posters on site | AS3.8

Large-scale Dust-Bioaerosol field observations in East Asia 

Zhongwei Huang, Qing Dong, Fanli Xue, Xinrong Yu, Qianqing Gu, Jianrong Bi, Jinsen Shi, Tian Zhou, and Jianping Huang

The long-range transport of bioaerosols by dust events significantly impacts ecological and meteorological networks of the atmosphere, biosphere and anthroposphere. Bioaerosols not only cause significant public health risks, but also act as efficient ice nuclei for inducing cloud formation and precipitation in the hydrological cycle. To establish risk management for bioaerosol impacts on the Earth system, a large-scale investigation of bioaerosols must be performed under different environmental conditions. For this purpose, a Dust-Bioaerosol (DuBi) field campaign was conducted, to investigate the distribution of bioaerosols by collecting ~ 950 samples at 39 sites across East Asia from 2016 to 2021. Concentrations and community structures of bioaerosols were further analyzed using fluorescence microscopic observations and high-throughput DNA sequencing, and these factors were compared to environmental factors, such as PM10 and aridity. The results indicated that microbial concentrations at dryland sites were statistically higher than those at humid sites, while the microbe to total particle ratio was statistically lower in drylands than in humid regions. Microbial cells per microgram of PM10 decreased when PM10 increased. The proportion of airborne particles at each site did not vary substantially with season. The richness and diversity of airborne bacteria were significantly higher in drylands than in semiarid regions, while the community structures were stable among all sampling sites. The DuBi field campaign helps a better understanding of bioaerosol characteristics variations along dust transport pathway in East Asia and the changes of bioaerosols under the trend of climate warming, supporting the efforts to reduce public health risks.

How to cite: Huang, Z., Dong, Q., Xue, F., Yu, X., Gu, Q., Bi, J., Shi, J., Zhou, T., and Huang, J.: Large-scale Dust-Bioaerosol field observations in East Asia, EGU General Assembly 2024, Vienna, Austria, 14–19 Apr 2024, EGU24-2775, https://doi.org/10.5194/egusphere-egu24-2775, 2024.

EGU24-3017 | ECS | Orals | AS3.8

Impact of mineral dust photocatalytic heterogeneous chemistry on the formation of the sulfate and nitrate: A modelling study over East Asia 

Xiao Li, Zechen Yu, Man Yue, Yaman Liu, Kan Huang, Xuguang Chi, Wei Nie, Aijun Ding, Xinyi Dong, and Minghuai Wang

Dust heterogeneous chemistry plays an important role in the atmosphere and has significant effects on climate and the environment. However, the traditional modelling method treats heterogeneous chemistry as pseudo-first-order reactions, which retains significant uncertainties, hindering the accurate prediction of secondary inorganic aerosols. In contrast, the actual dust heterogeneous chemistry involves complex multiphase reactions, including partition between gas- and dust-phase, and reactions on the dust surface. In this study, we implement a photocatalytic mechanism into the GEOS-Chem model and apply it to investigate the impact on atmospheric chemistry during a dust storm over East Asia during April 9-14th, 2018.With the photocatalytic heterogeneous chemistry (PHO), model simulation better reproduces observed sulfate and nitrate concentrations than those with the traditional pseudo-first-order mechanism (TDT) or without any dust heterogeneous chemistry at all (BASE). As validated against observations, normalized mean bias (NMB) in PHO reduces substantially compared to TDT, from -61.65% and 103.38% to -2.19% and 6.83% at Nanjing and Shanghai, respectively. The model also accurately simulates gaseous precursors such as SO2 and NO2, as evidenced by a decline in NMB from 103.38% and 81.80% to 6.83% and 6.64% at the two sites, respectively. Furthermore, our analysis indicates that the larger dry deposition velocity of dust-phase sulfate and higher sulfate concentrations simulated by PHO jointly lead to a significant increase in SO4 dry deposition flux, demonstrating that the dust heterogeneous chemical process facilitates the removal of aerosol pollutants during dust events. These findings reinforce the need for enhancing the representation of dust heterogeneous chemistry in atmospheric models, underlining the criticality of this factor in accurate predictive modelling and environmental impact studies.

How to cite: Li, X., Yu, Z., Yue, M., Liu, Y., Huang, K., Chi, X., Nie, W., Ding, A., Dong, X., and Wang, M.: Impact of mineral dust photocatalytic heterogeneous chemistry on the formation of the sulfate and nitrate: A modelling study over East Asia, EGU General Assembly 2024, Vienna, Austria, 14–19 Apr 2024, EGU24-3017, https://doi.org/10.5194/egusphere-egu24-3017, 2024.

EGU24-4224 | ECS | Orals | AS3.8

Simulating Atmospheric Dust With a Global Variable-Resolution Model: Model Description and Impacts of Mesh Refinement 

Jiawang Feng, Chun Zhao, Qiuyan Du, and Mingyue Xu

In this study, a global variable-resolution modeling framework of atmospheric dust and its radiative feedback is established and evaluated. In this model, atmospheric dust is simulated simultaneously with meteorological fields, and dust-radiation interactions are included. Five configurations of global mesh with refinement at different resolutions and over different regions are used to explore the impacts of regional refinement on modeling dust lifecycle at regional and global scales. The model reasonably produces the overall magnitudes and spatial variabilities of global dust metrics such as surface mass concentration, deposition, AOD, and radiative forcing compared to observations and previous modeling results. Two global variable-resolution simulations with mesh refinement over major deserts of North Africa (V16km-NA) and East Asia (V16km-EA) simulate less dust emissions and smaller dry deposition rates inside the refined regions due to the weakened near-surface wind speed caused by better resolved topographic complexity at higher resolution. The dust mass loadings over North Africa are close to each other between V16km-NA and the quasi-uniform resolution (~120km) (U120km), while over East Asia, V16km-EA simulates higher dust mass loading. Over the non-refined areas with the same resolution, the difference between global variable-resolution and uniform-resolution experiments also exists, which is partly related to their difference in dynamic time-step and the coefficient for horizontal diffusion. Refinement at convection-permitting resolution around the Tibetan Plateau (TP) simulates less dust due to its more efficient wet scavenging from resolved convective precipitation around the TP against coarse resolution.

How to cite: Feng, J., Zhao, C., Du, Q., and Xu, M.: Simulating Atmospheric Dust With a Global Variable-Resolution Model: Model Description and Impacts of Mesh Refinement, EGU General Assembly 2024, Vienna, Austria, 14–19 Apr 2024, EGU24-4224, https://doi.org/10.5194/egusphere-egu24-4224, 2024.

EGU24-4599 | ECS | Posters on site | AS3.8

Transboundary transport of central Asian dust to the Pamirs: measurements and modeling 

Qingqing Dong, Zhongwei Huang, Tian Zhou, Yufei Wang, Tianhe Wang, Jianrong Bi, Qiantao Liu, Zhengpeng Li, Wuren Li, Jinsen Shi, Ze Li, Wentao Liu, Zuorong Niu, and Xiaodong Song

Tajikistan is located in an arid and semi-arid region, with a dry climate and sparse precipitation and the sandstorms frequently occur in summer. The Shaartuz lidar site (68.0°E, 36.9°N, 274 masl) is located in a basin in southern Tajikistan. It is observed that the dust storms occur in this area are usually lifted to a height of 5-6 km above the ground, which is equivalent to the height of the Pamirs covered with ice and snow. With the effects of complex terrain, there is a possibility of the dust being transported to the Pamirs under the mid-latitude westerly belt. In this work, the two lidar systems located in Shaartuz and Taxian (75.2°E, 37.8°N, 3087 masl) which is in the southeast of the Pamirs are utilized to study the dust event in summer. The significant variations of dust optical properties and vertical distribution can be captured by the two lidar system during June 11th to 15th, 2023. The backward trajectory model and satellite observation are used to verify the transport path of the dust event. WRF-Chem also successfully simulated the transport process of the dust event, and analyzed the spatiotemporal evolution characteristics and the dust effects. These results will help us explore the characteristics of central Asian dust transboundary transport toward Pamirs and its regional climate effects.

How to cite: Dong, Q., Huang, Z., Zhou, T., Wang, Y., Wang, T., Bi, J., Liu, Q., Li, Z., Li, W., Shi, J., Li, Z., Liu, W., Niu, Z., and Song, X.: Transboundary transport of central Asian dust to the Pamirs: measurements and modeling, EGU General Assembly 2024, Vienna, Austria, 14–19 Apr 2024, EGU24-4599, https://doi.org/10.5194/egusphere-egu24-4599, 2024.

Atmospheric dust from the North Africa, the largest and most persistently active dust source over the world, spreads widely in the Northern Hemisphere and plays essential roles in the Earth environment evolution. During June 7th-24th 2020, an extremely strong dust occurred with its westward spreading modulated by the North Atlantic Oscillation (NAO), and its eastward spreading regulated by European blocking, ultimately resulting in the circum-global transport of African dust. The Mediterranean low pressure linked to the European blocking dipole was the key to facilitating the eastward transport of dust. This record-breaking African dust episode caused a notable diurnal precipitation decrease of 0.98 mm day-1 over northeastern India and decrease of 1.55 mm day-1 over central North America, which was ascribed to the effect of dust-induced radiative heating on large-scale circulation. It triggered Rossby wave train and caused an anomalous high pressure over northeastern India, which weakened the India summer monsoon and consequently inhibited the occurrence of precipitation. Dust-induced radiative heating also supported the stability in the anomalous warm high over North America, further repressing import of moisture from Atlantic. Ambient moisture and atmospheric instability also presented consistent variation over North America and India characterized as strengthen descending motion and sharply reduced moist convection. This study reports, for the first time, the strong modulation of regional circulation by circum-globally transported African dust especially in Asia and North America. The new aspects on the unexpected consequences to moisture convection indicate broader roles that the dust may play in the global climate change.

How to cite: Hongru, B., Siyu, C., and Daizhou, Z.: The Circum-global Transport of Massive African Dust and its Impacts on the Regional Circulation in Remote Atmosphere, EGU General Assembly 2024, Vienna, Austria, 14–19 Apr 2024, EGU24-5121, https://doi.org/10.5194/egusphere-egu24-5121, 2024.

EGU24-5224 | ECS | Orals | AS3.8

Increasing cross-border dust weather from Mongolia to China during 1987-2022 

Cuiui Shi, Yihao Ma, and Rui Mao

Mongolia and northern China have the largest dust weather frequency in Northeast Asia. Dust transport from Mongolia to China is an important cause of dust weather in northern China. In the two dust weather events in April 2023, Mongolia's cross-border transmission accounts for 42% and 62% of dust concentration in northern China respectively. However, there are few studies on the frequency change of cross-border dust weather from Mongolia to China in the past few decades. Based on the observational data, here we analyzed the variation of cross-border dust weather in China and Mongolia during 1987-2022. The result showed that the annual average of cross-border dust weather in China and Mongolia was about 7 times, mostly concentrated in spring. Cross-border dust weather accounts for 75% of the total dust weather in northern China. In addition, cross-border dust weather from Mongolia to China showed an increasing trend in the past 36 years, and the increase was more significant after 2000. The increase in cross-border dust weather from Mongolia to China was influenced by a combination of human activities and the natural environment. Reductions in vegetation cover and soil moisture in Mongolia over the past decades have provided favorable conditions for the dust emission, while changes in the polar front jet have provided the impetus for dust transport. This research contributes to a more comprehensive understanding of the dynamics of dust weather events in Northeast Asia, providing references for future mitigation strategies and environmental management.

How to cite: Shi, C., Ma, Y., and Mao, R.: Increasing cross-border dust weather from Mongolia to China during 1987-2022, EGU General Assembly 2024, Vienna, Austria, 14–19 Apr 2024, EGU24-5224, https://doi.org/10.5194/egusphere-egu24-5224, 2024.

A massive ecological restoration program has been implemented in northern China with the aim of protecting the Beijing-Tianjin-Hebei the metropolitan area of eastern China from dust events. However, some current studies have cast doubt on the efficacy of such ecological restoration projects, partly due to the constraint of available water in northern China, leading to poor survival rates of planted trees in semiarid regions (15%). In this study, using a logical framework combining statistical analysis, partial least-squares path model analysis, and a regional climate model (RegCM) simulation with multisource dust indicators, we found that there was a reduction of dust in northern China that was synchronous with the increase in vegetation growth after ecological restoration. In contrast to previous reports of a decrease in wind speed due to ecological restoration, this study found that the increase in vegetation had an insignificant impact on local wind speed (p = 0.30). Instead, ecological restoration mainly reduced the sand emission in the steppe areas by improving the soil conditions of the underlying surface and hence contributed 15% of the reduction of dust events in the BeijingTianjin-Hebei metropolitan area through dust transmission (p = 0.002). The effect of ecological restoration in the northern steppe on dust reduction in the northeastern metropolitan area of China should not be overstated.

How to cite: Zhou, C. and Feng, X.: The Regional Impact of Ecological Restoration in the Arid Steppe on Dust Reduction over the Metropolitan Area in Northeastern China, EGU General Assembly 2024, Vienna, Austria, 14–19 Apr 2024, EGU24-7325, https://doi.org/10.5194/egusphere-egu24-7325, 2024.

EGU24-8076 | Orals | AS3.8

Urban Air Quality in Doha: A Year-long Examination of Bioaerosols and Public Health Implications 

Kashif Rasool, Bilal Sajjad, Azhar Siddique, Khadeeja Abdul Jabbar, Shimaa El-Malaha, and Fares Almomani

This study provides a thorough examination of ambient air bioaerosols in Qatar, specifically delving into the environmental aspects of bacteria, fungi, and viral diversity. The main objective is to elucidate the public health implications related to airborne superbugs and viruses in Qatar's unique arid climate, focusing on the urban areas of Doha. Bioaerosol samples were meticulously collected from eight distinct urban sites in Qatar throughout the year, covering diverse climatic conditions. Employing advanced methodologies, such as classical microbiology and next-generation sequencing, the samples underwent analysis to identify a wide range of pathogens, including bacteria, fungi, and viruses. The results obtained during the spatial-seasonal characterization of bacterial and fungal concentration in ambient air throughout the year reveal that bacterial and fungal diversity was higher in the summer (hot-dry) and winter seasons, respectively. The highest average concentration of total ambient bacteria and fungi was observed to be 130 CFU/m3 during the summer (dry-hot) and 40 CFU/m3 during the winter season, respectively. Notably, high bacterial concentration occurred in 80% of locations during the summer (dry-hot) season, while for fungi, it was 70% of locations during winter seasons. Fungal concentration was reported to be low during the summer (humid-hot) season. Culturable bacterial and fungal species were identified through detailed biochemical and microscopic analysis. Health-significant microorganisms identified include bacteria (Pseudomonas, Pasteurella, Pantoea, Proteus, Myroides, Chryseobacterium, Yersinia, Ochrobactrum, Sphingomonas, Vibrio) and fungi (Alternaria, Aspergillus, Fusarium, Rhizopus, Penicillium). The study detected the strongest antibiotic resistance during the summer (humid-hot) season, with all samples exhibiting resistance to Metronidazole, a common treatment for bacterial vaginosis and other inflammatory diseases. The investigation also yielded significant findings in two additional crucial areas: (i) Antibiotic Resistance Genes (ARG): Identification of critical and high-priority antibiotic-resistant strains, such as Acinetobacter baumannii and Staphylococcus aureus, indicating a significant public health concern for urban air quality. Temporal and spatial variations in ARG profiles further emphasized the complexity of the issue. (ii) Viral Diversity: A comprehensive array of viruses, including zoonotic and plant viruses, were detected. The presence of human pathogens like Escherichia coli and Orthohepevirus A (Hepatitis E virus) highlighted the potential for airborne disease transmission. This study underscores the intricate interplay between human, animal, and environmental health in urban ecosystems, aligning with previous research findings. The results emphasize the critical need for integrated surveillance to comprehensively understand bioaerosol composition and associated public health risks, especially in the context of Qatar's distinctive climatic conditions, where dust storms can significantly influence bioaerosol dynamics. The study advocates for heightened awareness and proactive public health measures to mitigate the risks associated with airborne pathogens and antibiotic resistance, aligning with recommendations from various health experts.

How to cite: Rasool, K., Sajjad, B., Siddique, A., Abdul Jabbar, K., El-Malaha, S., and Almomani, F.: Urban Air Quality in Doha: A Year-long Examination of Bioaerosols and Public Health Implications, EGU General Assembly 2024, Vienna, Austria, 14–19 Apr 2024, EGU24-8076, https://doi.org/10.5194/egusphere-egu24-8076, 2024.

EGU24-8946 | Posters on site | AS3.8 | Highlight

Assessing fungal spore health impacts with real-time detection technologies 

Ian Crawford, Philippa Douglas, Sameirah Macchiarulo, and Emma Marczylo

Bioaerosols are ubiquitous airborne microorganisms comprised of bacteria, fungi, pollen, virus and their constituents. Fungi have been associated with negative health effects ranging in severity from allergic reactions to asthma and serious infection, where susceptible individuals are at greater risk of life-threatening health outcomes resulting from exposure. While airborne fungi are abundant, they are poorly characterized due to the low temporal resolution of traditional offline sampling methods, limiting our understanding of key emission drivers in critical micro-environments and their impacts on air quality.

There is a critical need to better characterize background fungal aerosol concentrations to build baselines to explore exposure assessment. Here we investigate the utility of emerging real-time detection methods in conjunction with offline sampling during a two-week pilot study to characterize the outdoor concentrations of key aeroallergenic fungi at high time resolution.

A Multiparameter Bioaerosol Spectrometer (MBS) was deployed at UKHSA Chilton alongside a Burkard sampler during August 2022; The MBS is a biofluorescence spectrometer that classifies and quantifies bioaerosols on a single particle basis via their autofluorescent signatures, allowing for fungal aerosol concentrations to be derived at 5-minute time resolution; Next Generation Sequencing (NGS) was performed on daily integrated Burkard samples to provide broader fungal compositional context. Meteorological data was also recorded.

Clear diurnal behaviour in Cladosporium- and Penicillium-like aerosol was observed with the MBS, with maximums occurring in the late afternoon and early morning respectively. These characteristic emission features would not be evident from sample integrations typical of offline sampling. Comparison to the NGS bioinformatics is ongoing.

We demonstrate for the first time the utility of a complimentary real-time and offline NGS dual approach to gain deeper insights into fungal spore emissions. We suggest that this approach shows promise for routine fungi monitoring to assess impacts on public health.

How to cite: Crawford, I., Douglas, P., Macchiarulo, S., and Marczylo, E.: Assessing fungal spore health impacts with real-time detection technologies, EGU General Assembly 2024, Vienna, Austria, 14–19 Apr 2024, EGU24-8946, https://doi.org/10.5194/egusphere-egu24-8946, 2024.

EGU24-9473 | ECS | Posters on site | AS3.8

Prediction of airborne allergenic pollen concentrations with machine learning   

Tetiana Vovk, Maciej Kryza, Szymon Tomczyk, Małgorzata Malkiewicz, Piotr Lipiński, and Małgorzata Werner

Over the past 30 years, the prevalence of allergies has increased continuously. Allergic rhinitis and asthma are among the most frequent non-communicable diseases and cause serious public health concerns worldwide, with the highest prevalence rates among children and adolescents. Moreover, experts assume that climate change will worsen the impact of allergies within the next decades. Therefore, it is essential to develop high quality methods and tools that can forecast allergenic pollen in the air to prevent sensitized against contact to high concentrations of aeroallergens. 

In this study we aim to develop a tool for prediction of pollen concentrations based on machine learning (ML) methods with the use of measured pollen concentrations and modelled meteorological parameters. We focus on the birch pollen, which is the most allergenic tree taxon in Central Europe. We use daily pollen concentration from Wrocław aerobiological station (south-west Poland) for years 2006 – 2022. Pollen grains were gathered with the use of the Burkard trap and counted following the recommendations of the International Association for Aerobiology. Meteorological data for the analysed period were provided with the Weather Research and Forecasting (WRF) model. We test different machine learning algorithms including: Random Forest,  xgBoost, Support Vector Regression (SVR) and Multilayer Perceptron (MLP). The algorithms are used to detect the days with pollen concentrations exceeding the threshold levels of 20, 75 and 90 pollen m-3, which correspond to the first symptoms, symptoms in all subjects and severe symptoms, respectively. 

For each ML algorithm, the whole data set was split into training and testing subsets in a proportion where the training set was ¾ of the data and the rest was the independent test set for the final model verification. Each model was checked during cross-validation for optimal hyperparameters. We test different parameters, including temporal variables and lagged predictors (e.g. pollen concentrations, air temperature, relative humidity, wind speed, solar radiation, planetary boundary height, rainfall – all derived with the mesoscale meteorological WRF model) to choose the most significant for prediction of pollen concentrations.  We also compare the performance of the different algorithms in terms of such error metrics as F1 score, ROC-AUC and PR-AUC. The results of the analysis will be applied to forecast pollen concentrations based on the automatic pollen detector, newly installed at the station, and weather forecasts. 

How to cite: Vovk, T., Kryza, M., Tomczyk, S., Malkiewicz, M., Lipiński, P., and Werner, M.: Prediction of airborne allergenic pollen concentrations with machine learning  , EGU General Assembly 2024, Vienna, Austria, 14–19 Apr 2024, EGU24-9473, https://doi.org/10.5194/egusphere-egu24-9473, 2024.

EGU24-10131 | Orals | AS3.8 | Highlight

Detection and characterization of airborne pollen using lidars in Finland 

Xiaoxia Shang, Maria Filioglou, Elina Giannakaki, Stephanie Bohlmann, and Mika Komppula

Pollen has various effects on human health and the environment. Studies show that lidar (light detection and ranging) can detect the presence of pollen in the atmosphere, and it is possible to track airborne pollen using the depolarization ratio in the absence of other depolarizing non-spherical particles (e.g. dust).

Since 2016, several pollen campaigns were performed at Vehmasmäki (62°44'N, 27°33'E, 190 m above sea level) site, a rural forest area located ~18 km from the Kuopio cite centre, in Eastern Finland. The clean air in Finland favours the pollen study. This station is operated by the Finnish Meteorological Institute, and is permanently equipped with a multi-wavelength Raman polarization lidar PollyXT, a Halo Photonics StreamLine Pro Doppler lidar, a Vaisala CL61 ceilometer, and multiple in situ instruments. All three lidars are equipped with polarization channels and enable the investigation of the optical properties at the wavelengths of 355, 532, 910 and 1565 nm. In addition, a Hirst-type Burkard pollen sampler was placed 4 meters above ground level near the lidars, which enabled the microscopic identification of pollen types and the number concentration.

During the pollination events, enhanced linear particle depolarization ratios (PDRs) were detected by lidars, suggesting the presence of non-spherical particles. A positive (negative) correlation was found between the pollen concentration (contribution of other aerosols) and PDRs. Depolarization ratios of pollen layers were measured at four wavelengths, allowing investigating its wavelength dependence. This could enable the distinction of pollen from other depolarizing aerosols. Results also highlight the suitability of the PDR at longer wavelengths for pollen detection. We have developed two pollen algorithms for characterizing the optical properties of pure pollen particles, based on PollyXT measurements. They were applied to evaluate the pollen depolarization ratio which is an essential parameter needed to separate pollen backscatter from the background aerosol backscatter. The algorithm was also applied for the aerosol classification, and identified different pollen types.

How to cite: Shang, X., Filioglou, M., Giannakaki, E., Bohlmann, S., and Komppula, M.: Detection and characterization of airborne pollen using lidars in Finland, EGU General Assembly 2024, Vienna, Austria, 14–19 Apr 2024, EGU24-10131, https://doi.org/10.5194/egusphere-egu24-10131, 2024.

EGU24-11309 | Posters on site | AS3.8 | Highlight

Bioaerosol and Atmospheric Simulation Chamber: first studies on bacteria viability versus NOx concentrations. 

Elena Gatta, Elena Abd El, Marco Brunoldi, Muhammad Irfan, Tommaso Isolabella, Dario Massabò, Federico Mazzei, Franco Parodi, Paolo Prati, and Virginia Vernocchi

Bioaerosol is generally defined as solid airborne particles of biological origin suspended in the gaseous medium ubiquitously with an aerodynamic diameter of up to 100 µm. They can either be naturally released from the biosphere to the atmosphere or are released due to human activities. Here, we present the results of several experiments, performed inside a confined and controlled artificial environment, such as the Atmospheric Simulation Chamber, providing valuable information on bio-aerosol viability, dispersion, and impact. At ChAMBRe (Chamber for Aerosol Modelling and Bio-aerosol Research), managed by INFN at the Physics Department of the University of Genoa, Italy, the research on bioaerosol is focused on the investigation of the airborne bacteria behavior in different atmospheric and air quality conditions (Massabò et al., 2018). A multi-step protocol was developed (Vernocchi et al, 2023) and thoroughly tested to cultivate a suitable bacteria population (E. coli, B. subtilis, B. licheniformis, and P. fluorescens). Then, bacteria are nebulized, and injected inside ChAMBRe, where they are exposed to different gas concentration values. The viability variation, due to the pollutant exposure inside ChAMBRe, was determined by monitoring the concentration of viable bacteria. The bacteria survival rate inside ChAMBRe is first evaluated by a set of baseline experiments (clean air condition) and successively exposing the bacterial strands to NO2 and NO concentration values up to 1200 ppb for both pollutants. A WIBS-NEO instrument measured bacteria total concentration inside ChAMBRe while the viable concentration was determined by active sampling on Petri dishes by an Andersen impactor and then counting the Colonies Forming Units (CFU). In addition, a liquid impinger was used to maintain the integrity of the microorganisms and their physiological state to investigate a sampling strategy to assess viability and simultaneously cultivability, taking into account the VBNC status (viable but not cultivable).  To this end, we present the results of impactor experiments and preliminary assessments with live and dead assays examined by fluorescence microscopy for quantitative and qualitative analysis.

References

Massabò, D., Danelli, S. G., Brotto, P., Comite, A., Costa, C., Di Cesare, A., Doussin, J. F., Ferraro, F., Formenti, P., Gatta, E., Negretti, L., Oliva, M., Parodi, F., Vezzulli, L., and Prati, P.: ChAMBRe: a new atmospheric simulation chamber for aerosol modelling and bio-aerosol research, Atmos. Meas. Tech., 11, 5885–5900, https://doi.org/10.5194/amt-11-5885-2018, 2018.

Vernocchi, V., Abd El, E., Brunoldi, M., Danelli, S. G., Gatta, E., Isolabella, T., Mazzei, F., Parodi, F., Prati, P., and Massabò, D. (2023) Atmos. Meas. Tech., 16, 5479–5493. https://doi.org/10.5194/amt-16-5479-2023, 2023.

How to cite: Gatta, E., Abd El, E., Brunoldi, M., Irfan, M., Isolabella, T., Massabò, D., Mazzei, F., Parodi, F., Prati, P., and Vernocchi, V.: Bioaerosol and Atmospheric Simulation Chamber: first studies on bacteria viability versus NOx concentrations., EGU General Assembly 2024, Vienna, Austria, 14–19 Apr 2024, EGU24-11309, https://doi.org/10.5194/egusphere-egu24-11309, 2024.

EGU24-12736 | Posters on site | AS3.8 | Highlight

Variation in fluorescent biological aerosol particles over the urban area during Asian dust events 

Teruya Maki, Itaru Sano, Hiroki Mizuno, Martin Gallagher, Hao Zhang, Ian Crawford, Congbo Song, and David Topping

Dust events over East Asia carry bioaerosols, such as bacteria, fungi, pollen, and plant-animal cell debris, as well as mineral and sea salt. The long-distance dispersion of bioaerosols have possibilities to damage human health due to pathogenic diseases and allergy induction. The microbial communities and biological components in bioaerosols have been investigated using offline analysis, such as DNA sequencing and chromatograph mass-spectrometry, but the contrast of offline databases are insufficiently used for establishing of bioaerosol models offline with chemical and physical database.

Recently, wideband integrated bioaerosol sensors (WIBSs), which detecting autofluorescence emitted from amino acids, proteins, and coenzymes, is focused as online analysis of bioaerosols. However, during the WIBSs monitoring, the interference from other types of fluorescent particles (e.g. polycyclic aromatic hydrocarbons) hardly identify the biological molecular species in bioaerosols. Here, for identifying the bioaerosol composition detected by the WIBSs, the bioaerosol surveys during Asian dust events at Osaka city, Japan, were performed by combining online (WIBS) and offline (DNA-sequencing and microscopic observation) techniques. The comparisons between online and offline data revealed that some types of fluorescent spectrum can determine the concentrations of pollen and fungal cells, which vary in correspondence to dust events as well as seasonal changes and wind directions.

How to cite: Maki, T., Sano, I., Mizuno, H., Gallagher, M., Zhang, H., Crawford, I., Song, C., and Topping, D.: Variation in fluorescent biological aerosol particles over the urban area during Asian dust events, EGU General Assembly 2024, Vienna, Austria, 14–19 Apr 2024, EGU24-12736, https://doi.org/10.5194/egusphere-egu24-12736, 2024.

Understanding the interaction between ozone and pollen is crucial, as it may influence pollen allergenicity and reproductive viability. This study investigates the kinetic uptake of ozone by pollen, and the its resulting modification, revealing significant variability among 12 tree pollen species.

Exposure of pollen to moderate ozone levels (130 – 150 ppb) in small air chambers facilitated the measurement of ozone uptake until total surface saturation. This yielded initial uptake coefficients (0.6 – 6.4 x 10⁻⁵) and total adsorbed ozone (9.4 – 2200 ng O3 per mg of pollen). Using this information, we calculate the number of reactive sites on pollen surfaces (1013 – 1016 sites cm-2) and observed rate coefficients (kobs) ranging from 10-15 – 10-17 cm3 sites-1 s-1. Notably, Ash pollen, similar in size to Birch pollen, exhibited 25 times greater ozone uptake, indicating a dependence on pollen type. Molecular modifications induced by ozone were explored using optical spectroscopy, identifying potential chemical markers and emphasizing molecular diversity among pollen species. Antioxidant molecules, like carotenoids in Ash, indicated a protective role for the pollen coat, suggesting that significant ozone uptake may not harm pollination.

Using a box model with plausible rates for pollen emission and deposition, we were able to calculate the extent of pollen modification by ozone in airborne pollen under environmentally relevant conditions. Depending on the pollen species, the extent of oxidation in airborne pollen ranged from 24% - 97%, and was highest in the late afternoon. Sensitivity analysis shows that the extent of oxidation is sensitive to uptake kinetics, ozone concentrations, and assumptions about mixing height. Under typical conditions, tree pollen grains are airborne for long enough that they will experience a significant proportion of the total potential modifications induced by ozone exposure.

How to cite: Murphy, J. G. and Simon, S.: Quantification of the kinetics of ozone uptake by tree pollen and the extent of modification, EGU General Assembly 2024, Vienna, Austria, 14–19 Apr 2024, EGU24-13333, https://doi.org/10.5194/egusphere-egu24-13333, 2024.

EGU24-13890 | Orals | AS3.8 | Highlight

 Simulations of pollen in North American and their influence on climate 

Allison Steiner, Yingxiao Zhang, Jordan Schnell, and Sarah Brooks

Pollen is one type of bioaerosol emitted in large quantities from many northern hemisphere vegetation types and has known impacts on human health and climate. A pollen emissions model accounting for 13 of the most prevalent types of pollen in North America is used to simulate emissions in the present day and the future and estimate concentrations with time.  Model simulations are evaluated with both ground-based pollen counts and remote sensing techniques to understand the seasonal timing of different pollen emission types and their relevance for climate.  Additionally, pollen grains can rupture and create smaller, subpollen particles that can influence cloud formation as cloud condensation nuclei and ice nucleating particles. Simulations indicate that the subpollen particles enhance cloud microphysical processes more than intact pollen grains by influencing the spatial extent and vertical structure of convective systems.  We evaluate the uncertainty of how estimated versus observed rupture rates and find that simulated SPP impacts are intensified when incorporating laboratory measured pollen rupture rates.


How to cite: Steiner, A., Zhang, Y., Schnell, J., and Brooks, S.:  Simulations of pollen in North American and their influence on climate, EGU General Assembly 2024, Vienna, Austria, 14–19 Apr 2024, EGU24-13890, https://doi.org/10.5194/egusphere-egu24-13890, 2024.

EGU24-15716 | ECS | Posters on site | AS3.8

Bioaerosol’s contribution to the atmospheric Phosphorus in Athens, Greece 

Kyriaki Papoutsidaki, Irini Tsiodra, Georgios Grivas, Aikaterini Bougiatioti, Konstantina Oikonomou, Faidra Aikaterini Kozonaki, Kalliopi Tavernaraki, Maria Tsagkaraki, Athanasios Nenes, Nikolaos Mihalopoulos, and Maria Kanakidou

Phosphorus (P) is a key macronutrient vital for all organisms, and it undergoes redistribution between terrestrial and oceanic systems through processes such as atmospheric emission, transport, transformation, and deposition. P is a limiting factor for primary productivity in the east Mediterranean Sea and the atmosphere is an important source of P for the marine ecosystems. Atmospheric P is present as both organic and inorganic species in dissolved and particulate forms and originates from both natural and anthropogenic sources. However, its sources remain uncertain since observational data show that the prevailing fraction of soluble, bioavailable, atmospheric P cannot be attributed to desert dust. Bioaerosols have been proposed as important carriers of nutrients and especially of bioavailable P to the marine ecosystems, potentially contributing to the missing sources of atmospheric P in the Mediterranean. In this study, a large number (234) of ambient PM2.5 24-h samples that were collected over a multi-yearlong sampling campaign (Dec. 2018 – Jul. 2021) conducted in Athens, one of the largest urban centres in south eastern Mediterranean, were analysed for total phosphorus (TP). In addition to P, chemical components, such as saccharides that are used as proxies of bioaerosols, but also organic carbon (OC), elemental carbon (EC), water-soluble OC, major inorganic anions and cations, elements of crustal origin and trace elements were determined. Preliminary results show the highest concentrations of TP and organic phosphorus (OP) in spring. Inorganic phosphorus exhibits similar levels throughout the seasons, with a small increase in spring. The observed concentrations of anhydro sugars were higher in winter and autumn than in summer due to biomass burning processes, while primary sugars and sugar alcohols indicative of bioaerosols increased throughout the growing season, peaking in spring as found also for total phosphorus concentrations. Positive Matrix Factorization analysis (PMF) is employed to identify the individual sources that affected the air samples and in particular P. Thus, the fraction of P in aerosols attributed to bioaerosol has been estimated. Aerosol sampling has been performed in the frame of the ERC PyroTRACH grant #726165. This work has been supported by the HFRI grant # 4050 BIOCAN.

How to cite: Papoutsidaki, K., Tsiodra, I., Grivas, G., Bougiatioti, A., Oikonomou, K., Kozonaki, F. A., Tavernaraki, K., Tsagkaraki, M., Nenes, A., Mihalopoulos, N., and Kanakidou, M.: Bioaerosol’s contribution to the atmospheric Phosphorus in Athens, Greece, EGU General Assembly 2024, Vienna, Austria, 14–19 Apr 2024, EGU24-15716, https://doi.org/10.5194/egusphere-egu24-15716, 2024.

EGU24-16338 | Orals | AS3.8

Using explainable machine learning to better understand source and process contributions to atmospheric bio-aerosol 

Hao Zhang, Congbo Song, David Topping, Ian Crawford, Martin Gallagher, Man Nin Chan, Hing Bun martin Lee, Sinan Xing, Tsin Hung Ng, and Amos Tai

The role of atmospheric bio-aerosols as determinants of environmental and human health outcomes is receiving more attention. However, a lack of fully evaluated end-to-end detection techniques hinders our understanding of identifying bioaerosol types and their environmental drivers, particularly in complex environments. In this study we mitigate these challenges through development of a novel machine learning framework that combines unsupervised deep learning and explainable machine learning techniques. The first step combines bidirectional long short-term memory autoencoder (Bilstm-AE) and a relatively new hierarchical, fast, clustering technique. Our results indicate that this approach outperforms other models, successfully distinguishing between fungal spores, non-biological aerosols, and pollen solely based on fluorescence information without the need for training data. Subsequently using automated machine learning and the SHapley Additive eXplanation (SHAP) method, we quantitatively discerned the environmental drivers of bioaerosol types. The variation of SHAP value indicated that the elevated pollen concentrations at night could be attributed to changes in its air mass composition and origins. More importantly, we find ambient evidence that pollen may break into smaller fragments when RH is over 90, leading to significant changes in its fluorescence spectrum and a rapid increase in its concentration. Overall we find that combining unsupervised deep learning and explainable machine learning could provide new insights into type-specific bioaerosols process.

How to cite: Zhang, H., Song, C., Topping, D., Crawford, I., Gallagher, M., Chan, M. N., Lee, H. B. M., Xing, S., Ng, T. H., and Tai, A.: Using explainable machine learning to better understand source and process contributions to atmospheric bio-aerosol, EGU General Assembly 2024, Vienna, Austria, 14–19 Apr 2024, EGU24-16338, https://doi.org/10.5194/egusphere-egu24-16338, 2024.

EGU24-16792 | Orals | AS3.8 | Highlight

Analysis of Dust Aerosols in the PMAp Satellite Climate Data Record  

Anu-Maija Sundström, Marie Doutriaux-Boucher, Federico Fierli, Soheila Jafariserajehlou, Lieven Clarisse, Simon Whitburn, Alessandra Cacciari, Dominika Czyzewska, Simone Mantovani, Mario Cavicchi, and Bertrand Fougnie

Satellites provide a powerful tool to monitor dust at global scale, both at near real time as well as over a longer time period. In this work we introduce a new satellite-based dataset on dust, that is derived from the  Polar Multi-sensor Aerosol optical properties product (PMAp) Climate Data Record (CDR). The first PMAp CDR was released by EUMETSAT in September 2022 (http://doi.org/10.15770/EUM_SEC_CLM_0053). It provides 13 years (2007-2019) of global observations on Aerosol Optical Depth (AOD) at 550 nm, and aerosol type, including dust. The PMAp aerosol properties are derived using multi-instrument approach, where simultaneous observations from the Global Ozone Monitoring Experiment-2 (GOME-2), Infrared Atmospheric Sounding Interferometer (IASI), and Advanced Very High Resolution Radiometer (AVHRR) onboard Metop-A and Metop-B satellites are exploited. The PMAp retrieval algorithm and the synergy concept  is described in detail by Grzegorski  et al. (2022).

Level 2 PMAp data provide pixel-level classification of aerosol types. Dust detection in the multi-instrument approach is based on IASI observations using method developed by Clarisse et al. (2013), while AOD at 550 nm is retrieved using GOME-2 measurements.  The PMAp aerosol type classification is used to extract dust-dominated pixels from the CDR dataset and to define dust-related AOD. Comparisons against ground-based AERONET observations over Sahara and the Saharan outflow area show a slight positive bias of about 0.02 for PMAp dust AOD at 550 nm, whereas the positive bias tends to increase at AERONET stations in the Asian continent.  Results also show that PMAp dust AOD generally catches well the dynamic variations of aerosol loading at the AERONET stations. To assess more broadly the spatial and temporal variation of the PMAp dust AOD at continental scale, comparisons against other existing satellite-based dust products, including IASI dust AOD provided by the Free University of Brussels (ULB) (Clarisse et al., 2019) and the ModIs Dust AeroSol (MIDAS) global dataset (Gkikas et al., 2021) will be carried out.  

Acknowledgements: This work is supported by EUMETSAT Copernicus User Guidance project. 

References:

Grzegorski, M., Poli, G., Cacciari, A., Jafariserajehlou, S., Holdak, A., Lang, R.,Vazquez-Navarro, M., Munro, R., and Fougnie, B.: Multi-Sensor Retrieval of Aerosol Optical Properties for Near-Real-Time Applications Using the Metop Series of Satellites: Concept, Detailed Description, and First Validation. Remote Sens. 2022, 14, 85. https://doi.org/10.3390/rs14010085.

Clarisse, L., Coheur, P.F., Prata, F., Hadji-Lazaro, J., Hurtmans, D., and Clerbaux, C.: A unified approach to infrared aerosol remote sensing and type specification. Atmos. Chem. Phys. 2013, 13, 2195–2221,https://doi.org/10.5194/acp-13-2195-2013.

Clarisse, L., Clerbaux, C., Franco, B., Hadji-Lazaro, J., Whitburn, S., Kopp, A. K., et al.: A decadal data set of global atmospheric dust retrieved from IASI satellite measurements. J. Geophys. Res., 2019, 124, 1618– 1647, https://doi.org/10.1029/2018JD029701.

Gkikas, A., Proestakis, E., Amiridis, V., Kazadzis, S., Di Tomaso, E., Tsekeri, A., Marinou, E., Hatzianastassiou, N., and Pérez García-Pando, C.: ModIs Dust AeroSol (MIDAS): a global fine-resolution dust optical depth data set, Atmos. Meas. Tech., 2021, 14, 309–334, https://doi.org/10.5194/amt-14-309-2021.

How to cite: Sundström, A.-M., Doutriaux-Boucher, M., Fierli, F., Jafariserajehlou, S., Clarisse, L., Whitburn, S., Cacciari, A., Czyzewska, D., Mantovani, S., Cavicchi, M., and Fougnie, B.: Analysis of Dust Aerosols in the PMAp Satellite Climate Data Record , EGU General Assembly 2024, Vienna, Austria, 14–19 Apr 2024, EGU24-16792, https://doi.org/10.5194/egusphere-egu24-16792, 2024.

EGU24-93 | ECS | PICO | AS3.9

Late Pleistocene East Asian monsoon intensity variations and driving mechanisms: Evidence from a multi-proxy analysis of loess deposits on an East China Sea island 

Zhigang Wang, Laurent Marquer, Yuanyu Cheng, Xiuxiu Ren, Hao Long, Shaofang Ren, Peng Qian, and Xiangmin Zheng

Shengshan Island (SSD), located in East China Sea, contains loess deposits that serve as an excellent carrier for recording environmental changes in the eastern subtropical region of China. Different from the continental Loess Plateau, SSD loess possesses distinctive characteristics due to its coastal location. Here we conducted the first pollen analysis to reconstruct vegetation dynamics in the SSD region during the middle to late Late Pleistocene period (75-40 ka). Biological indicators (i.e., total organic concentration and δ13Corg), along with geochemical proxies (i.e., quartz grain size, magnetic susceptibility, iron oxide ratios, clay minerals, and trace elements), were employed to reconstruct climatic dynamics in the SSD area. The study identified two stages in the evolution of the East Asian Monsoon. In Stage I (75-60 ka), various indicators (i.e., pollen concentration, Pinus concentration, magnetic susceptibility, C4 abundance, K/(I+Ch), Illite crystallinity, CII, Hm/Gt, quartz median grain size, Zr/Rb) increased, suggesting a strengthening of both winter and summer monsoons. In Stage II (60-40 ka), some indicators (i.e., pollen concentration, Pinus concentration, quartz median grain size, Zr/Rb) continued to increase while others (i.e., magnetic susceptibility, C4 abundance, K/(I+Ch), Illite crystallinity, CII, Hm/Gt) decreased, indicating a continued intensification of the winter monsoon but a weakening of the summer monsoon. Further, we explored the driving forces behind variations in monsoon intensity, analyzing changes in various δ18O proxies and sea-level fluctuations. The findings suggest that different mechanisms influence the winter and summer monsoons. Summer monsoon intensity is linked to changes in summer solar radiation at mid-latitudes in the Northern Hemisphere, while winter monsoon dynamic is affected by changes in ice volume and ice sheets. These insights contribute to our understanding of environmental changes related to the East Asian Monsoon, offering valuable perspectives on how these mechanisms could respond to future climate changes.

How to cite: Wang, Z., Marquer, L., Cheng, Y., Ren, X., Long, H., Ren, S., Qian, P., and Zheng, X.: Late Pleistocene East Asian monsoon intensity variations and driving mechanisms: Evidence from a multi-proxy analysis of loess deposits on an East China Sea island, EGU General Assembly 2024, Vienna, Austria, 14–19 Apr 2024, EGU24-93, https://doi.org/10.5194/egusphere-egu24-93, 2024.

EGU24-430 | ECS | PICO | AS3.9

West African dust load modeling and its impact on solar radiation forecast during the dry season 

Léo Clauzel, Sandrine Anquetin, Christophe Lavaysse, Guillaume Siour, Gilles Bergametti, Béatrice Marticorena, Christel Bouet, Rémy Lapere, and Jennie Thomas

The expected growth of solar photovoltaic (PV) production in West Africa over the coming decades poses challenges to the electrical network requiring accurate solar forecasts for both energy producers and power grid managers. Furthermore, solar radiation is affected by dust aerosols which play a significant role in West African meteorology, due to the proximity of this region to the Sahara desert, which is the world's largest source of mineral dust aerosols emissions.

In this general context, our research aims at identifying the impact of mineral dust on solar energy production. Thus, this study focuses on evaluating the influence of dust aerosols on solar radiation forecasts for the Zagtouli solar plant in Burkina Faso. 

Employing a coupled approach between a meteorological model (WRF) and a chemical transport model (CHIMERE), two dust events that are representative of the dry season are simulated in line with West African climatology. While one event is linked to dust emissions from the Bodélé plateau (Chad), the other is related to dust sources located within the South Atlas area.

The model undergoes rigorous assessment in regards to dust life cycle parameters (Aerosol Optical Depth (AOD), PM10, size distribution) and variables essential for solar energy production (Global Horizontal Irradiance (GHI), temperature) using in-situ measurements from long-term observatories (AERONET, INDAAF, AMMA-CATCH) and from the solar farm (GHI), satellite observations (AQUA/TERRA-MODIS, CALIPSO-CALIOP), and reanalysis data (CAMS). This evaluation shows a robust performance of the model.

In addition, sensitivity studies are implemented to evaluate the respective impacts of direct and indirect effects of dust aerosols on the amount of solar radiation available at the surface.

Overall, this study provides strong support for a modeling approach that couples meteorological processes with the dust life cycle to refine solar forecasts in the West African region.

How to cite: Clauzel, L., Anquetin, S., Lavaysse, C., Siour, G., Bergametti, G., Marticorena, B., Bouet, C., Lapere, R., and Thomas, J.: West African dust load modeling and its impact on solar radiation forecast during the dry season, EGU General Assembly 2024, Vienna, Austria, 14–19 Apr 2024, EGU24-430, https://doi.org/10.5194/egusphere-egu24-430, 2024.

EGU24-989 | ECS | PICO | AS3.9 | Highlight

Atmospheric radioisotopes in cryoconite from the Flade Isblink ice cap, NE Greenland 

Dylan Beard, Giovanni Baccolo, Caroline Clason, Geoffrey Millward, Edyta Łokas, Sally Rangecroft, Dariusz Sala, Przemysław Wachniew, and William Blake

Under climatic warming and increased melting, glaciers and ice caps are becoming secondary sources of contaminants deposited decades ago. Cryoconite, an organic-rich material found on the surface of many glaciers, is particularly efficient at accumulating airborne contaminants due to biogeochemical exchanges with the organic matter within cryoconite. Atmospherically derived radioactive isotopes, commonly referred to as fallout radionuclides, have now been found to accumulate in cryoconite globally. However, data from the polar regions, especially ice sheets and ice caps, is scarce. This study helps to address this regional gap in understanding fallout radionuclide accumulation in glacial settings. We present the first radioactivity dataset from cryoconite on a Greenlandic ice cap and assess the role of cryoconite in the distribution of radioactive species in the High Arctic. Forty-six cryoconite samples were collected from the Flade Isblink ice cap (NE Greenland) in August 2022. These samples were analysed via alpha and gamma spectrometry for atmospheric radionuclides, including 137Cs, 241Am, 210Pbexc., 207Bi, 7Be, and several plutonium isotopes. The results of this study confirm cryoconite's exceptional ability to accumulate fallout radionuclides, even in remote and relatively pristine regions such as Northern Greenland. The activities of radionuclides in cryoconite from Flade Isblink are among the highest reported across the High Arctic and the highest ever reported from Greenland. Flade Isblink's radioactivity source is compatible with the stratospheric reservoir established during atmospheric nuclear tests and with weapon-grade fissile fuel, likely originating from Novaya Zemlya. Our findings emphasise the necessity for continued research efforts on the release of legacy contaminants from glaciers, particularly given accelerated global warming and consequent glacier retreat.

How to cite: Beard, D., Baccolo, G., Clason, C., Millward, G., Łokas, E., Rangecroft, S., Sala, D., Wachniew, P., and Blake, W.: Atmospheric radioisotopes in cryoconite from the Flade Isblink ice cap, NE Greenland, EGU General Assembly 2024, Vienna, Austria, 14–19 Apr 2024, EGU24-989, https://doi.org/10.5194/egusphere-egu24-989, 2024.

EGU24-1776 | PICO | AS3.9 | Highlight

Assessment of the Impact of Coarse and Fine Dust on Solar Devices in the Middle East 

Suleiman Mostamandi, Georgiy Stenchikov, Ahmed Balawi, Illia Shevchenko, Dania Kabakebji, and Thomas Altmann

Dust in the Middle East (ME) significantly impacts regional climates and negatively affects the operation of solar farms in the ME region. Suspended dust particles attenuate downward short wave (SW) radiation, while dust deposited on the solar devices decreases effectiveness. This study theoretically assesses dust's attenuation and soiling effects on solar panels within the ME, employing a Weather Research Forecasting Model coupled with the aerosol-chemistry module, WRF-Chem, constrained by observed dust depositions. By analyzing the size distribution of dust deposition samples, we found that a major part of the deposited mass resulted from the deposition of dust particles with radii > 10 um. However, the models usually consider only particles with radii < 10 um.

We corrected this deficiency and conducted a year-long simulation using WRF-Chem. We found that the dust (primarily fine particles with radii < 3 m) reduces the downward SW radiation near the surface by 5-10%. Meanwhile, dust deposition (mostly coarse dust particles with radii > 6 m) imposes soiling losses of 12 to 36 % in different parts of the ME, assuming a weekly cleaning cycle.

Our findings unveil a complex interplay between dust size and its multifaceted impact on solar energy production. This novel insight could lead to optimized maintenance strategies and novel mitigation approaches tailored to the unique dust burden of the Middle East. Ultimately, this study aims to advance solar energy resource assessment and pave the way for enhanced photovoltaic efficiency in dust-prone regions.

How to cite: Mostamandi, S., Stenchikov, G., Balawi, A., Shevchenko, I., Kabakebji, D., and Altmann, T.: Assessment of the Impact of Coarse and Fine Dust on Solar Devices in the Middle East, EGU General Assembly 2024, Vienna, Austria, 14–19 Apr 2024, EGU24-1776, https://doi.org/10.5194/egusphere-egu24-1776, 2024.

EGU24-1827 | PICO | AS3.9

Investigation of the mineralogical composition of desert dust particles during a transboundary pollution episode in the UK and implications for health effects  

Stavros Solomos, Christina Mitsakou, Samuel Thompson, Helen Macintyre, Karen Exley, Stuart Aldridge, Christos Zerefos, Nikolaos S. Bartsotas, Christina Kalogeri, and Christos Spyrou

Toxicological and epidemiological studies have supported links between desert dust particles and health impacts, such as worsened asthma, hospitalization for respiratory infections, and seasonal allergic rhinitis. Airborne desert dust particles could serve as a medium for interacting with chemicals on their surfaces, potentially enhancing the bioreactivity of fine particles during episodes of dust storms. The role of the different mineralogical composition (e.g. quarz, iron, feldspars) on the biological effects of mineral dust remains to be determined. In this work we analyze the severe dust event that affected the UK on 15 and 16 March 2022 in terms of the synoptic situation leading to this event, the spatiotemporal distribution of the dust plumes over UK and the chemical/mineralogical composition of the particles. We employ the METAL-WRF model to investigate the atmospheric properties and the quantification of particle concentrations in ambient air but also in dry and wet depositions of dust. The METAL-WRF model includes prognostic fields for ten (10) minerals: illite, kaolinite, smectite, calcite, quartz, feldspar, hematite, gypsum, phosphorus and iron. We also investigate the health impacts linked to the desert dust transport on the population in UK regions. Our results are discussed across similar findings at more frequently dust-affected regions such as the Mediterranean.  

Acknowledgment This study is partially supported by the Hellenic Foundation for Research and Innovation project Mineralogy of Dust Emissions and Impacts on Environment and Health (MegDeth - HFRI no. 703) and the project Bioclimatic urban design for the sustainability and resilience of the urban environment in the context of climate change (BIOASTY)

How to cite: Solomos, S., Mitsakou, C., Thompson, S., Macintyre, H., Exley, K., Aldridge, S., Zerefos, C., Bartsotas, N. S., Kalogeri, C., and Spyrou, C.: Investigation of the mineralogical composition of desert dust particles during a transboundary pollution episode in the UK and implications for health effects , EGU General Assembly 2024, Vienna, Austria, 14–19 Apr 2024, EGU24-1827, https://doi.org/10.5194/egusphere-egu24-1827, 2024.

EGU24-2280 | ECS | PICO | AS3.9

Different orbital rhythms in loess grain-size records across the Chinese Loess Plateau 

Deai Zhao, Guoqiao Xiao, Qingzhen Hao, Shaohua Tian, Zhipeng Wu, Hao Lu, Gaowen Dai, Shuzhen Peng, Chunjv Huang, and Qiuzhen Yin

The thick loess-paleosol sequences on the Chinese Loess Plateau (CLP) are among the best terrestrial archives for the understanding of the global paleoenvironment and East Asian monsoon changes. In particular, orbital-scale variations characterized by major periodicities of ~100 kyr, ~40 kyr and ~20 kyr are recorded by various proxies in the loess, which is often suggested to reflect the orbital control on East Asian climate. However, whether these climate periods could be affected by the signals from the dust source areas remains unknown. Here we present the spectrum results of grain size records from the Baoji loess section spanning the past 400 ka in the southeastern part of the CLP, and compare with the previous results in the western CLP (to the west of the Liupanshan Mts.), including Gulang, Menyuan, Lanzhou, Linxia, Jingyuan loess sections, and loess sections in the eastern CLP (to the east of the Liupanshan Mts.), including Luochuan, Xifeng, Lantian, and Weinan sections. The results show that the dominant periods in different sections are spatially different, and the ~20-kyr precession cycle from the western CLP is significantly stronger than that in eastern CLP. Albeit dust accumulation rates in the Jingbian loess section from the eastern CLP are very high, the lack of precession signal suggests that high sedimentation rate is not the main factor for occurrence of precession cycle in grain size records. The results also suggest that the dust source areas for the eastern and western CLP are different, specifically, the loess deposits in western CLP were mainly sourced from the NE Tibetan Plateau, while the loess deposits in eastern CLP were significantly fed by the deserts to the north CLP (including deserts in Northern China and Southern Mongolia). As the dust production and transportation in NE Tibetan Plateau and the deserts to the north CLP were significantly driven by the ~20-kyr local summer insolation and the ~100-kyr ice age cycle, respectively, we argue that the climate cycle in loess grain size of the CLP indeed reflects the climate signals of their source areas, rather than the deposition areas. Our results suggest that caution should be taken when explaining the meaning of the loess grain size records.

How to cite: Zhao, D., Xiao, G., Hao, Q., Tian, S., Wu, Z., Lu, H., Dai, G., Peng, S., Huang, C., and Yin, Q.: Different orbital rhythms in loess grain-size records across the Chinese Loess Plateau, EGU General Assembly 2024, Vienna, Austria, 14–19 Apr 2024, EGU24-2280, https://doi.org/10.5194/egusphere-egu24-2280, 2024.

EGU24-3106 | PICO | AS3.9 | Highlight

African dust transport and deposition modelling verified through a successful citizen science campaign in Finland   

Outi Meinander, Rostislav Kouznetsov, Andreas Uppstu, Mikhail Sofiev, Anu Kaakinen, Johanna Salminen, Laura Rontu, Andre Welti, Diana Francis, Ana A. Piedehierro, Pasi Heikkilä, Enna Heikkinen, and Ari Laaksonen

On 21–23 February 2021, dust from a sand and dust storm (SDS) in northern Africa was transported to Finland, north of 60°N. The episode was predicted 5 days in advance by the Finnish Meteorological Institute (FMI) global operational SILAM forecast (silam.fmi.fi), and its key features (e.g., spatial distribution of wet and dry deposition amounts and particle sizes) were confirmed and detailed by a retrospective analysis. SILAM is among the dust forecast models included in the Word Meteorological Organization Sand and Dust Storm Warning Advisory and Assessment System WMO SDS-WAS.  

Dust deposition was observed on 23 February over a large area in the Southern and Central Finland from 60°N to >63.8°N. The ground was covered with snow making dust more easily detectable. The coloured snow caused people to contact FMI asking what is happening. FMI launched a citizen science campaign on Saharan dust with the help of social media, and people were asked to report their observations and to collect dust-containing snow and to extract the dust according to the guidelines. The campaign gained wide national interest in television, radio, newspapers and social media, and resulted in success in receiving citizen samples from 525 locations, with one to over ten samples in each.

The amounts of deposition calculated from the citizen samples were found to be up to 1.1 g/m2 and such maximum amounts per unit area agree with the SILAM calculations. The SILAM model and particle magnetic properties confirmed that dust came from a wide Sahara and Sahel area, from 5000 km away. The median diameters of the dust particles were in the modes of <10 µm and >20 µm. The mineral composition was dominated by quartz, feldspars, and soft phyllosilicates such as micas and clay minerals.

To extract dust from snow, Meinander et al. (2023) protocol recommends: 1. Collect snow samples within one week of the deposition event to minimize post-deposition changes. 2. Evaporate snow under 75oC to preserve the magnectic properties (particles should not be subjected to temperatures higher than 90oC). 3. Keep the remaining particles in the container in which the evaporation took place (e.g., a sheet of aluminium folio on a large oven tray and evaporating the snow in the oven) to best preserve all the particle sizes. 

Reference: Meinander, O., Kouznetsov, R., Uppstu, A. et al. African dust transport and deposition modelling verified through a citizen science campaign in Finland. Sci Rep 13, 21379 (2023). https://doi.org/10.1038/s41598-023-46321-7. 


How to cite: Meinander, O., Kouznetsov, R., Uppstu, A., Sofiev, M., Kaakinen, A., Salminen, J., Rontu, L., Welti, A., Francis, D., A. Piedehierro, A., Heikkilä, P., Heikkinen, E., and Laaksonen, A.: African dust transport and deposition modelling verified through a successful citizen science campaign in Finland  , EGU General Assembly 2024, Vienna, Austria, 14–19 Apr 2024, EGU24-3106, https://doi.org/10.5194/egusphere-egu24-3106, 2024.

Dust storms are severe and disastrous weather events that typically occur in arid and semi-arid desertification areas. The frequent occurrences of spring dust storms in East Asia in recent years have drawn widespread attention in the context of the significant achievements in ecological management and sand prevention. Identifying the source and transport of dust storms in East Asia is key to comprehending the ecological environment and climate. In this study, the MODIS annual product MCD12C1 is used as labels to classify the land cover of Landsat 8/9 images using the Random Forest method in order to obtain the dynamic distribution of dust source areas. The land cover results are processed to the WRF model to provide the meteorological field, after which a Lagrangian transport model FLEXPART-WRF is used to simulate the horizontal and vertical transport of particles from five dust source regions in East Asia during the March 22, 2023 dust storm event. The source apportionments for regions on the transmission path of different dust sources are revealed by an online tracer-tagged of air quality model NAQPMS. The results show that the total area of the East Asian dust source regions in March 2023 is 1.5×10⁶ km2. Cold high pressure from Siberia and the Mongolian cyclone are key synoptic situations for dust emission and transport from dust source areas. The Taklimakan Desert and the Tarim Basin mainly affect northwestern China. The Badain Jaran Desert and Horqin Sandy Land have a greater impact on northern China, with longer transmission distances, and can even affect southeast and Northeast China. The Gobi Desert affects northern China by influencing the dust source areas in Inner Mongolia. The vertical transport height is up to 500m from the ground. The PM2.5 source apportionments show that the Badain Jaran Desert contribution of Beijing-Tianjin-Hebei and its surrounding areas accounted for 45.5 %, while the Gobi Desert accounted for 1.4 %.

How to cite: Li, Y. and Wu, Q.: How dust sources affect downstream regions in East Asia during a dust storm event, EGU General Assembly 2024, Vienna, Austria, 14–19 Apr 2024, EGU24-3981, https://doi.org/10.5194/egusphere-egu24-3981, 2024.

EGU24-4003 | ECS | PICO | AS3.9

New insights into the atmospheric dust dynamics in the Carpathian and Wallachian Basin during MIS 1-MIS 2 

Zoran Perić, Helena Alexanderson, Slobodan Marković, Milica Radaković, Petar Krsmanović, and Cathal Ryan

Fine-grained windblown deposits, known as loess, in which fossil soils (palaeosols) are preserved, serve as excellent records of past climate. However, paleoclimate reconstruction studies on loess-palaeosol sequences (LPS) in Southeastern Europe have primarily focused on climate changes during the last one or two glacial-interglacial cycles. Surprisingly, little attention has been given to the climate of the current interglacial, the Holocene. This oversight may be attributed to the prevailing notion that, based on ice core and marine isotope records, the Holocene is considered a climatically stable period. Additionally, the scarcity of LPS with well-preserved Holocene loess has contributed to this lack of attention until now. Three recently discovered loess-palaeosol sequences in the Eastern Carpathian and the Wallachian Basins present fully preserved loess covering MIS 1-MIS 2 offering the potential to unveil new and detailed information about Holocene climate. In this study, we present initial results from two of these LPS: Kisiljevo (44°44′0'' N and 21°25′0'' E) in the Carpathian Basin, and Velika Vrbica (44°35’1.70’’N, 22°43’15.97’’E) in the Wallachian Basin. For both sequences, detailed optically stimulated luminescence (OSL) chronologies using 63-90 µm quartz have been constructed. Age models based on the OSL ages were constructed using the r.bacon software (Blaauw & Christen, 2011), following which dust accumulation rates (MAR) for the last approximately 30,000 years were calculated. The initial results from Kisiljevo reveal a significant loess accumulation during the Holocene, amounting to approximately 120 cm. The highest MARs were observed between 10 and 12 ka (10,000-8,000 BC) with a mean value of 148 g m2 a-1. A similar trend is evident at the Velika Vrbica LPS, where the average calculated MARs during the early Holocene (8 – 11.7 ka) were 189 g m2 a-1, showing a decreasing trend toward the later part of this period (3.1 – 8 ka) with average values reaching 132.1 m2 a-1. Interestingly, at this site, the mean MARs during Marine Isotope Stage 1 (MIS) were higher than during the cold, stadial MIS 2, where the recorded values averaged 177 g m2 a-1. These initial results suggest that the Holocene dust dynamics in this region was more variable than what generally accepted models suggest.

References: Blaauw & Christen (2011). Flexible paleoclimate age-depth models using an autoregressive gamma process. Bayesian Analysis, 6(3), 457–474.

How to cite: Perić, Z., Alexanderson, H., Marković, S., Radaković, M., Krsmanović, P., and Ryan, C.: New insights into the atmospheric dust dynamics in the Carpathian and Wallachian Basin during MIS 1-MIS 2, EGU General Assembly 2024, Vienna, Austria, 14–19 Apr 2024, EGU24-4003, https://doi.org/10.5194/egusphere-egu24-4003, 2024.

Colour is a fundamental morphological feature commonly documented during the description of loess layers and soils developed on loesses – both contemporary and fossil. These colours are typically identified directly in the field, matching specific hues from the Munsell Soil Colour Chart. However, this method is highly subjective, with accuracy hinging on the observer's expertise and weather conditions. Introducing digital spectrometers for colour analysis, conducted in the lab on powdered samples, enhances objectivity. This approach was applied to samples from the Middle-Upper Pleistocene loess-palaeosol sequences (L2-S1-L1-S0) in Ukraine's Dnieper basin.

The laboratory work aimed to pinpoint chromatic parameters that typify each loess layer, considering their distinct features and stratigraphic positions, as well as various soil horizons, each with unique degrees of pedogenic alteration. Key colour metrics included lightness (L*), redness (a*), yellowness (b*), chroma (c*), and the R-index. The resultant database of spectrophotometric data helps identify colour patterns characteristic of different sequence components.

Our analysis revealed considerable variation across all measured parameters, yet maintained the distinct coloration typical of loess and soils. We also created a digital colour record corresponding with the analogue Munsell scale, lending further objectivity to colour descriptions. Notably, digital colour identification often markedly differs from traditional, "analogue" methods. Applying RGB tuning, we devised models that realistically replicate colours observed in the field.

The documented chromatic parameters enable geological profile analysis in both vertical and spatial dimensions – following the Dnieper valley's sub-meridian and sub-latitudinal orientations across the river basin. These colour profiles mirror the diverse litho-, pedo-, and diagenetic processes across different genetic stages. Crucially, we identified diagnostic colour characteristics unique to primary loesses (L2 vs. L1), various soil types, their development stages (full-profile vs. reduced), and preservation forms (modern vs. ancient).

Thanks to the high resolution and sensitivity of our spectrophotometric analysis, we detected nuanced chromatic shifts, often abrupt. This revealed otherwise invisible erosional surfaces and concealed boundaries, shedding light on changes in loess lithology or the progression of pedogenic processes. The documented colour shifts illustrate the dynamic evolution of the natural environment, from loess accumulation (cold phases) to soil formation (warm periods).

It should be noted that primary loesses of varying ages, collected from different geological sites, which are primarily described as light yellow, show significant differences in the L*, a*, b*, c* parameters in light of spectrophotometric analyses. This variability aligns well with the findings of geochemical analyses.

Research carried out as part of the grant of National Science Centre, Poland as the project no. 2018/31/B/ST10/01507 entitled “Global, regional and local factors determining the palaeoclimatic and palaeoenvironmental record in the Ukrainian loess-soil sequences along the Dnieper River Valley - from the proximal areas to the distal periglacial zone”.

How to cite: Mroczek, P., Łanczont, M., and Komar, M.: Loess chromaticity as an environmental change recorder: spectrophotometric study of aeolian dust and its role in paleoclimate studies, EGU General Assembly 2024, Vienna, Austria, 14–19 Apr 2024, EGU24-4619, https://doi.org/10.5194/egusphere-egu24-4619, 2024.

EGU24-4749 | PICO | AS3.9 | Highlight

Recent developments in dust electrification research  

Keri Nicoll and R. Giles Harrison

Electrification of dust in the atmosphere is abundant, observed by helicopter blades glowing from corona discharge in dusty environments, and sparks from barbed wire fences during the US Dust Bowl.  Electrification of particles in blowing sand, dust devils and dust storms can result from contact charging/triboelectrification during dust generation or through its atmospheric transport, causing particles to accumulate large amounts of charge on their surface.  Strong electrostatic forces can affect the lofting of dust particles from the ground, as well as the transport of dust particles, however the details of such effects are still largely unexplored.  The charging of dust particles, and separation of the charge by mechanical processes yields large electric fields (E-fields, up to tens of kV m1).  Satellite remote sensing of dust is based on measurements of electromagnetic wave propagation, which can be attenuated by large electric fields, thereby the accuracy of dust measurements can be affected by electric fields arising from charge separation in dusty environments. Such E-fields are also expected to alter the orientation of dust particles, changing the effective optical depth of dust layers, existing calculations for which assume randomly oriented particles.

Although the existence of dust electrification has been known about for over a century, the details of the electrification mechanisms, and impact of dust electrification on particle behaviour are not yet fully understood.  This is partly due to a lack of observations of coincident space charge, E-field and particle measurements in dusty regions, particularly at altitudes above the surface.  This presentation will discuss recent research in understanding dust electrification processes, including surface observations of dust electrification in the United Arab Emirates (UAE), and measurements of charge in high altitude dust layers above the surface.

How to cite: Nicoll, K. and Harrison, R. G.: Recent developments in dust electrification research , EGU General Assembly 2024, Vienna, Austria, 14–19 Apr 2024, EGU24-4749, https://doi.org/10.5194/egusphere-egu24-4749, 2024.

EGU24-4799 | ECS | PICO | AS3.9

Modeling the Mercury Cycle in the Sea Ice Environment: A Buffer between the Polar Atmosphere and Ocean 

Shaojian Huang, Feiyue Wang, Tengfei Yuan, Zhengcheng Song, Peipei Wu, and Yanxu Zhang

Sea ice (including overlying snow) is a dynamic interface between the atmosphere and the ocean, influencing the mercury (Hg) cycling in polar oceans. However, a large-scale and process-based model for the Hg cycle in the sea ice environment is lacking, hampering our understanding of regional Hg budget and critical processes. Here, we develop a comprehensive model for the Hg cycle at the ocean–sea ice–atmosphere interface with constraints from observational polar cryospheric data. We find that seasonal patterns of average total Hg (THg) in snow are governed by snow thermodynamics and deposition, peaking in springtime (Arctic: 5.9 ng/L; Antarctic: 5.3 ng/L) and minimizing during ice formation (Arctic: 1.0 ng/L, Antarctic: 0.5 ng/L). Arctic and Antarctic sea ice exhibited THg concentration peaks in summer (0.25 ng/L) and spring (0.28 ng/L), respectively, governed by different snow Hg transmission pathways. Antarctic snow-ice formation facilitates Hg transfer to sea ice during spring, while in the Arctic, snow Hg is primarily moved through snowmelt. Overall, first-year sea ice acts as a buffer, receiving atmospheric Hg during ice growth and releasing it to the ocean in summer, influencing polar atmospheric and seawater Hg concentrations. Our model can assess climate change effects on polar Hg cycles and evaluate the Minamata Convention’s effectiveness for Arctic populations.

How to cite: Huang, S., Wang, F., Yuan, T., Song, Z., Wu, P., and Zhang, Y.: Modeling the Mercury Cycle in the Sea Ice Environment: A Buffer between the Polar Atmosphere and Ocean, EGU General Assembly 2024, Vienna, Austria, 14–19 Apr 2024, EGU24-4799, https://doi.org/10.5194/egusphere-egu24-4799, 2024.

EGU24-5430 | PICO | AS3.9

A near-global multiyear climate data record of the fine-mode and coarse-mode components of atmospheric pure-dust 

Emmanouil Proestakis, Antonis Gkikas, Thanasis Georgiou, Anna Kampouri, Eleni Drakaki, Claire L. Ryder, Franco Marenco, Eleni Marinou, and Vassilis Amiridis

Dust aerosols play a key role in the Earth’s radiation budget, in climate system, environmental conditions, and human health. However, the complex role of dust depends not only on the physical and chemical properties, but in addition to the particle size distribution, spanning from less than 0.1 μm to more than 100 μm in diameter. Larger mineral dust particles are more efficiently removed through dry deposition close to the source regions and act more efficiently as CCN and/or IN than fine-mode dust particles, whereas fine dust particles are more prominent to long-range transport, resulting to degradation of air-quality and induced negative disorders on human health.
Here, a new four-dimensional, multiyear, and near-global climate data record of the submicrometer and supermicrometer (in terms of diameter) components of atmospheric pure-dust, is presented. The separation of the two modes of dust is based on a combination of (1) the total pure-dust product provided by the ESA-LIVAS database and (2) the supermicrometer-mode component of pure-dust provided by the first-step of the two-step POLIPHON technique, developed in the framework of EARLINET. The submicrometer-mode component of pure-dust is extracted as the residual between the LIVAS total pure-dust and the supermicrometer-mode component of pure-dust. The decoupling scheme is applied to CALIPSO observations at 532nm. The final products consist of the submicrometer-mode and supermicrometer-mode of atmospheric pure-dust, of quality-assured profiles of backscatter coefficient at 532nm, extinction coefficient at 532nm, and mass concentration. The datasets are established primarily with the original L2 horizontal (5 km) and vertical (60 m) resolution of CALIOP along the CALIPSO orbit-path, and secondly in averaged profiles of seasonal-temporal resolution, 1o×1o spatial resolution, and with the original vertical resolution of CALIPSO, between 70oS and 70oN and covering more than 15-years of Earth Observation (06/2006-12/2021).
The climate data record is unique with respect to a wide range of potential applications, including climatological, time-series, and trend analysis over extensive geographical domains and temporal periods, validation of atmospheric dust models and reanalysis datasets, assimilation activities, and investigation of the role of airborne dust on radiation and air quality.

How to cite: Proestakis, E., Gkikas, A., Georgiou, T., Kampouri, A., Drakaki, E., Ryder, C. L., Marenco, F., Marinou, E., and Amiridis, V.: A near-global multiyear climate data record of the fine-mode and coarse-mode components of atmospheric pure-dust, EGU General Assembly 2024, Vienna, Austria, 14–19 Apr 2024, EGU24-5430, https://doi.org/10.5194/egusphere-egu24-5430, 2024.

EGU24-5573 | ECS | PICO | AS3.9

Stronger early-spring dust outbreaks across the Northern Hemispheric mid-latitudes in a warmer climate 

Yiting Wang, Yan Yu, Ji Nie, and Paul Ginoux

This research focuses on changes in early-spring dust emissions from Northern Hemispheric mid-latitudes, in the context of global warming. Our study was motivated by the abnormally early and strong dust storms across East Asia in March 2021 and March 2023. These two recent dust extremes opposed the decadal decline of East Asian dust activities. Past studies have attributed this dustiness decline to expanded vegetation cover and resultant weaker near-surface winds in April and May; while in March, dust source regions in the Northern Hemispheric mid-latitudes have been mainly covered by snow or frozen soil instead of vegetation. Inspired by the abnormally warm and snow-free conditions associated with both the 2021 and 2023 early-spring dust extremes, our study examines an alternative hypothesis on dust regimes over the Northern Hemispheric mid-latitudes: in a warmer climate, earlier snow melt may cause stronger early-spring dust outbreaks. Here, using multiple observational datasets and model simulations, we show a 10-35% increase in March dust emission across the East Asian, Central Asian and North American drylands, from the 1980s towards the end of the 21st century, bringing ~20% extra PM10 to Beijing and Denver. This hemispherical enhancement in early-spring dust emission is primarily caused by reduced snow cover in response to warming, and further promoted by dynamical coupling between snow, wind, and soil moisture changes. The increased amount of dust, a light absorbing aerosol, may in turn accelerate larger-scale snow melt when it deposits, thereby triggering positive feedbacks between snow melting, dust emission, and warming. Our findings call for adaptation to the anticipated stronger early-spring dust storms across the North Hemispheric mid-latitudes in the upcoming decades.

How to cite: Wang, Y., Yu, Y., Nie, J., and Ginoux, P.: Stronger early-spring dust outbreaks across the Northern Hemispheric mid-latitudes in a warmer climate, EGU General Assembly 2024, Vienna, Austria, 14–19 Apr 2024, EGU24-5573, https://doi.org/10.5194/egusphere-egu24-5573, 2024.

EGU24-6384 | PICO | AS3.9

Trade-offs of simplified versus comprehensive representation of mineralogy when studying dust impacts on Earth’s climate systems 

Paul Ginoux, Qianqian Song, María Gonçalves Ageitos, Ron L. Miller, Vincenzo Obiso, and Carlos Pérez García-Pando

The intensity and direction of dust impacts on Earth’s climate systems depend on mineral composition. For example, the presence or absence of a few percent of iron oxides in dust will determine if dust is warming or cooling the atmosphere. Similarly, feldspar will enhance ice cloud formation, while acid gases in the atmosphere will react on the surface of dust calcite limiting acid rain. Still, most climate models use a simplified representation of dust mineralogy. They assume a fixed composition at emission which stays invariant during transport and removal. Such simplification assumes spatially and temporally constant physical and chemical properties of dust, and appears to provide satisfactory results when comparing some properties with observations. The trade-off is their lack of spatial gradients, which will fail to induce circulation, cloud and precipitation changes. The two reasons to omit mineral variations are the uncertainty of current atlases of soil mineral composition in arid regions, and, more practically, an improved runtime efficiency. The former reason is losing ground with the recent launch (July 2022) of a dedicated mission (NASA/JPL EMIT) to retrieve global soil mineralogy of dust sources at high spatial resolution.

While the EMIT science team is finalizing a satisfactory global map of mineral composition of dust sources, we analyzed the interaction of dust mineralogy on radiation and its impact on the fast temperature response using different representations of mineral composition from detailed and spatially varying to simplified and globally uniform, assuming different hematite contents and methods to calculate optical properties.  

Our results show that resolving dust mineralogy reduces dust absorption, and results in improved agreement with observation-based single scattering albedo (SSA), radiative fluxes from CERES (the Clouds and the Earth’s Radiant Energy System), and land surface temperature from CRU (Climatic Research Unit), compared to the baseline bulk dust model version. It also results in distinct radiative impacts on Earth’s climate over North Africa. From our 19-year simulation, we will show that it leads to a reduction of over 50% in net downward radiation at top of atmosphere (TOA) across the Sahara and an approximately 20% reduction over the Sahel. We will explain how the surface temperature response affects the monsoon flow from the Gulf of Guinea.

Interestingly, we find similar results by simply fixing the hematite content of dust to a globally uniform value of 0.9% by volume. We will discuss the underlying reasons for such results and show that they may be unrelated to the distribution of soil mineralogy. Still, an accurate representation of soil mineralogy is necessary to better understand dust impacts on the Earth’s climate systems.

How to cite: Ginoux, P., Song, Q., Gonçalves Ageitos, M., Miller, R. L., Obiso, V., and Pérez García-Pando, C.: Trade-offs of simplified versus comprehensive representation of mineralogy when studying dust impacts on Earth’s climate systems, EGU General Assembly 2024, Vienna, Austria, 14–19 Apr 2024, EGU24-6384, https://doi.org/10.5194/egusphere-egu24-6384, 2024.

EGU24-7235 | ECS | PICO | AS3.9

Quantifying dust emission following wildfires on the global scale 

Xianglei Meng, Yan Yu, and Paul Ginoux

Wildfires can reduce vegetation cover and soil adhesivity, thus expanding bare grounds susceptible to wind erosion. Although in situ observations have confirmed dust emission following wildfires, a quantitative and mechanistic understanding of post-fire dust emissions is limited. Here, on the basis of satellite observations of active fires, aerosol abundance, vegetation cover and soil moisture from 2003 to 2020, we found that 91% and 54% of large wildfires are followed by reduced vegetation cover and enhanced dust emission, leaving intensive dust loadings for 1-25 days over normally dust-free regions. Furthermore, small wildfires, which naturally occur more widespread and frequently than large wildfires, lead to more considerable post-fire dust emissions, mostly global semi-arid regions. The occurrence and intensity of post-fire dust emission are regulated primarily by the extent of precedent wildfires and resultant vegetation anomalies, and modulated secondarily by pre-fire drought conditions. Despite the episodic nature of post-fire dust events, the amount of post-fire dust emission has shown an upward trend over the past two decades, especially over the Northern Hemispheric mid-latitudes, where droughts and wildfires are intensifying. These post-fire dust events impose greater socioeconomic and health impacts than dryland dust, due to the closer location of the former to populated areas. With an ongoing enhancement of extreme wildfires and concurrent droughts under global warming, our results emphasize the emerging importance of post-fire dust emissions on global and regional scales.

How to cite: Meng, X., Yu, Y., and Ginoux, P.: Quantifying dust emission following wildfires on the global scale, EGU General Assembly 2024, Vienna, Austria, 14–19 Apr 2024, EGU24-7235, https://doi.org/10.5194/egusphere-egu24-7235, 2024.

EGU24-7871 | ECS | PICO | AS3.9

Wind erosion in Western Sahel : Quantifying the impact of land use and land management 

Paul-Alain Raynal, Caroline Pierre, Béatrice Marticorena, Jean-Louis Rajot, Abdourahmane Tall, Issa Faye, Diouma Cor Fall, Bineta Amar, Antoine Couedel, Gatien Falconnier, Jean-Alain Civil, Olivier Roupsard, and Sidy Sow

It is currently estimated that around 15% of the global mineral dust load comes from the Sahel. In this area, rainfed agriculture and livestock grazing play a crucial role in the livelihood of its rapidly growing population. Cropland is likely to be a main source of anthropogenic dust emissions in this region, as this land use type can favor wind erosion if land management deprives the soil of vegetation cover.

Yet, in situ measurements of wind erosion fluxes are scarce in the Sahel, and usually monitor only one type of land use and an associated land management (eg. whether or not to harvest crop residues, intercropping, etc.). Thus, there is room to improve the assessment of the Sahelian anthropogenic contribution to the global dust load, especially through a regional modelling approach relying on field measurements.

In this study, we combined in situ measurements from Sahelian Senegal with a modelling approach to estimate the effect of the main Sahelian land uses on wind erosion. Furthermore, we monitored contrasting land management per land use, representative of the last decades (1960-2020). Here we present the results for one groundnut field over two years (2020-2021), four different fallowed fields over one year (2022/2023), four millet fields over one year (2023/2024). All 1ha-plots were located near the town of Bambey in central Senegal (Groundnut Basin). The observations included sand-traps monitoring (for each 1ha-plot, 5 masts of 5 « Modified Wilson And Cooke » or MWAC sand traps each; collected every 2 weeks), meteorological data (e.g., wind and temperature profiles, and rainfall; at 5-minutes resolution) and vegetation monitoring (aboveground biomass, surface cover, height; weekly to monthly).

For each land use and land management, we estimated the aerodynamic surface roughness length and the wind friction velocity to simulate the horizontal flux of aeolian sediments using a dedicated model (the Dust Production Model – DPM). We then combined the wind erosion model (DPM) with vegetation models (STEP for fallows and STICS for crops) to simulate the vegetation growth and the associated horizontal flux of aeolian sediment. These simulations are compared to the in situ monitoring from the sand traps. Finally, we used ERA5 meteorological time series from the ECMWF to simulate the horizontal flux for the 1960–2020 period over a typical plot from the study area, for different realistic scenarios of land uses and land management.

Our study revealed the variability of wind erosion horizontal flux for the main Sahelian land use types (400 kg/m/yr for bare soil, 200 kg/m/yr for cropland, less than 10kg/m/yr for fallows), as well as slighter differences related to land management for a same land use. These results help to understand the link between wind erosion and agropastoral practices in Sahelian conditions over multi-decadal periods of time.

How to cite: Raynal, P.-A., Pierre, C., Marticorena, B., Rajot, J.-L., Tall, A., Faye, I., Fall, D. C., Amar, B., Couedel, A., Falconnier, G., Civil, J.-A., Roupsard, O., and Sow, S.: Wind erosion in Western Sahel : Quantifying the impact of land use and land management, EGU General Assembly 2024, Vienna, Austria, 14–19 Apr 2024, EGU24-7871, https://doi.org/10.5194/egusphere-egu24-7871, 2024.

EGU24-8628 | PICO | AS3.9 | Highlight

Impact of Saharan mineral dust layers on cloud formation and cloud properties 

Silke Gross, Martin Wirth, and Florian Ewald

Mineral dust contributes strongly to the global aerosol load. The largest source region of mineral dust is the Sahara. But mineral dust cannot be treated as a regional phenomenon. Once lifted in the air, it can be transported thousands of kilometers over several days. The main transport pathway spans over the Atlantic Ocean from Africa towards the Caribbean; with its peak season during the summer months. But transatlantic dust transport can also happen during wintertime, however with less frequency. In addition, the dust particles can be transported northward over the Mediterranean and Europe. In rare events, it can even reach the Arctic region. All the way during transport the dust layer has an impact on the Earth’s radiation budget, by direct interaction with the incoming and outgoing radiation by scattering and absorption, and by indirect interaction as dust can impact cloud formation and cloud properties.

To study long-range transported Saharan dust as well as the dust’s impact on cloud formation and properties, airborne lidar measurements with the WALES lidar system onboard the German research aircraft HALO have been performed over the western sub-tropical North-Atlantic Ocean during NARVAL-II in August 2016 and EUREC4A in January/February 2020. We observed dust transport during the summertime in the clearly separated and well-defined Saharan Air Layer (SAL) as well as during wintertime, when dust transport happens at lower altitudes and the SAL is less separated. In addition, we were also able to capture an event of dust long-range transport into the Arctic during the HALO-(AC)3 campaign in spring 2022. From our measurements we could show, that small amount of water vapor embedded in the SAL has a strong impact on the atmospheric stability and thus also impacts the formation and properties of clouds during long-range transport. Additionally, dust particles are known to act as ice nuclei and with that lead to ice formation at different environmental conditions, changing the ice cloud’s microphysical properties.

In our presentation we will give an overview of the performed WALES measurements. We use these measurements to study dust long-range transport and its impact on the atmospheric stability, cloud formation and cloud properties.

How to cite: Gross, S., Wirth, M., and Ewald, F.: Impact of Saharan mineral dust layers on cloud formation and cloud properties, EGU General Assembly 2024, Vienna, Austria, 14–19 Apr 2024, EGU24-8628, https://doi.org/10.5194/egusphere-egu24-8628, 2024.

EGU24-8749 | ECS | PICO | AS3.9

Influence of aerosol deposition on snowpack evolution in simulations with the ORCHIDEE land surface model  

Sujith Krishnakumar, Samuel Albani, Martin Ménégoz, Catherine Ottlé, and Yves Balkanski

Simulating seasonal snow with state-of-the-art global general circulation models (GCMs) is still challenging. Snow provides fresh water to billions of people and plays an important role in the energy budget of the earth through albedo, which affects not only local but also remote and global climate/hydrological patterns. Therefore, changes in snow amount and length of the season are crucial when investigating climate variability.  One key aspect often overlooked in GCMs is the inclusion of Light Absorbing Particles (LAPs) in snow simulations. LAPs dramatically reduce snow albedo, particularly for visible solar radiation, leading to considerable implications for climate modeling. The intention is to lay the foundations for addressing the issues across different climate conditions through simulations, by adding the snow darkening effect to a multilayered intermediate complexity scheme within ORCHIDEE, the land surface model embedded in the IPSL Earth System Model.

LAPs are commonly deposited on the surface of fresh snow and progressively become embedded into deeper layers of the snowpack.  The LAP species taken into account include four log-normal modes of dust, soot, and organic carbons. These tracers allow for the movement of LAPs through different layers of the snowpack, adjusting with snow accumulation or melting. In order to simulate the movement of LAPs, ORCHIDEE has been enhanced with a tracer flow mechanism that carry LAPs from the top snow layer following deposition and move through various layers as snow thickens or flushes with meltwater flow. Our approach to snow albedo deviates from the default method in ORCHIDEE as a function of snow aging through an exponential decay function with dependence on the degree of water saturation and the occurrence of fresh snow deposition. Instead, it integrates the Warren and Wiscombe snow radiative transfer scheme with Kokhanovsky's single scatter properties of snow crystals and the optical properties of LAPs to compute the albedo of impure snow. This study conducted site-level offline ORCHIDEE simulations using observed atmospheric conditions and MERRA2 aerosol deposition data. The integration of LAPs and related processes has led to improved simulations of seasonal snow, achieving more realistic representations of snow albedo compared to pure snow. Our results also show that LAPs play an important role in determining the local snow season length.

How to cite: Krishnakumar, S., Albani, S., Ménégoz, M., Ottlé, C., and Balkanski, Y.: Influence of aerosol deposition on snowpack evolution in simulations with the ORCHIDEE land surface model , EGU General Assembly 2024, Vienna, Austria, 14–19 Apr 2024, EGU24-8749, https://doi.org/10.5194/egusphere-egu24-8749, 2024.

EGU24-8796 | PICO | AS3.9 | Highlight

Potential environmental impacts of natural and mining related dust in Greenland and Svalbard 

Jens Søndergaard, Christian Frigaard Rasmussen, Hanne Hvidtfeldt Christiansen, and Christian Juncher Jørgensen

Dispersion and deposition of mineral dust from natural or anthropogenic sources such as proglacial rivers, mines and haul roads can have both positive and negative effects on the environment, depending on the geochemical and mineralogical composition of the dust. Some elements in dust may act as nutrients for, for example, plants, lichens and soil communities, while other elements may act as pollutants with negative impacts on growth or reproduction or cause diseases in animals and plants.

To support the sustainable development of environmentally safe mining in sensitive Arctic land areas and reduce airborne environmental pollution, an improved understanding of processes leading to the dispersion of mineral dust in a changing Arctic is needed. This involves improved methods for monitoring dust emissions and dust deposition in a cold environment as well as analytical tools and methods to source trace and differentiate between natural and mining related dust. Accurate identification of individual dust sources subsequently makes it possible to mitigate emissions and target the regulation of mining activities towards these sources.

In this study, we present preliminary results from two new arctic dust monitoring stations in West Greenland and Svalbard. In Kangerlussuaq, West Greenland, mineral dust has been collected using a wide array of passive and active dust samplers, including a continuously operated high volume dust sampler at a weekly sampling frequency over 2022/2023. In Svalbard, mineral dust has been collected in Adventdalen using passive dust collectors in a transect along the haul road to the active coal mines. Samples have been collected on a weekly sampling frequency in the period September to November 2023 to investigate the temporal and spatial variations in dust deposition rates, as well as the impact of haul road traffic relative to the natural dust emissions and depositions.

How to cite: Søndergaard, J., Frigaard Rasmussen, C., Hvidtfeldt Christiansen, H., and Juncher Jørgensen, C.: Potential environmental impacts of natural and mining related dust in Greenland and Svalbard, EGU General Assembly 2024, Vienna, Austria, 14–19 Apr 2024, EGU24-8796, https://doi.org/10.5194/egusphere-egu24-8796, 2024.

EGU24-9570 | ECS | PICO | AS3.9

On the importance of Mongolian cyclones to East Asian dust storm activities 

Feifei Mu and Stephanie Fiedler

Desert-dust aerosols affect the climate, human health, and socio-ecomomic activities. In East Asia, the passage of Mongolian cyclones induce dust-emitting winds in the Gobi Desert. While cyclones are known as driver of dust outbreaks, the relative contribution of Mongolian cyclones to the total East Asian dust emission amount and the dust aerosol optical depth has not been quantified from a climatological perspective. To address this gap in knowledge, the present study systematically assesses the co-occurrence of Mongolian cyclones and dust aerosols in East Asia for 2001 to 2022. This study pairs output of the automated detection algorithm for extra-tropical cyclones in ERA5 re-analysis from the ETH Zürich with data for dust aerosols from multiple sources. Through the use of multiple dust data sets, we account for the substantial data uncertainty for dust aerosols in term of the spatial pattern and the absolute emission magnitudes, which can differ by an order of magnitude. The climatological analysis shows a high frequency and intensity for the occurrence of Mongolian cyclones in the lee of the Altai-Sayan Mountains (100Eo–125Eo and 37No–53No), favouring the seasonal dust activity in the Gobi Desert. The results highlight a tight constraint on the mean Mongolian cyclone contribution to the total dust emission amount of 39-47% in the spatial mean for spring based on data from MERRA-2 and Wu et. al. (2022), despite substantial differences in the absolute emission magnitudes. The dust-laden air from the Gobi Desert during such events typically moves southeastwards over China in the wake of the cyclones affecting the aerosol optical depth. For southern Mongolia and Northeastern China (105Eo–130Eo and 37No–52No), we estimate 34% (MERRA-2) to 43% (CAMS) of the dust aerosol optical depth (DOD) being associated with Mongolian cyclones. A decrease in dust emission fluxes and dust storm frequencies have been reported for Northern China in the past two decades and is thought to be connected to decreasing near-surface winds. Our results point to a negative trend in the dust emission flux and DOD associated with the occurrence of Mongolian cyclones. However, our results also point to the co-occurrence of particularly intense Mongolian cyclones, measured by the 99th percentile of the wind speed, with exceptionally strong dust storms in recent years, e.g., in March 2021, despite a mean negative trend in dust activity. Given the connection of Mongolian cyclone to high-impact dust storms in East Asia, the potential future development of such events should be addressed in future research.

How to cite: Mu, F. and Fiedler, S.: On the importance of Mongolian cyclones to East Asian dust storm activities, EGU General Assembly 2024, Vienna, Austria, 14–19 Apr 2024, EGU24-9570, https://doi.org/10.5194/egusphere-egu24-9570, 2024.

Water-soluble organic carbon (WSOC) and its brown carbon (BrC) components in the cryosphere have significant impact on the biogeochemistry cycling and snow/ice surface energy balance. In this study, snow samples were collected across regional area of northern Xinjiang, China to investigate the chemical composition, optical properties, and radiative forcing (RF) of WSOC. Based on the geographic differences and proximity of emission sources, the sampling sites were grouped as urban (U), remote (R), and soil-influenced (S) sites, for which WSOC concentrations were measured as 1968±953 ng g-1 (U), 885±328 ng g-1 (R), and 2082±1438 ng g-1 (S), respectively. The S sites showed the higher mass absorption coefficients at 365 nm (MAC365) of 0.94±0.31 m2 g-1 compared to those of U and R sites (0.39±0.11 m2 g-1 and 0.38±0.12 m2 g-1, respectively). Molecular-level characterization of WSOC using high-resolution mass spectrometry (HRMS) provided further insights into chemical differences among samples. Specifically, much more reduced S-containing species with high degree of unsaturation and aromaticity were identified in U samples, suggesting an anthropogenic source. Aliphatic/proteins-like species showed highest contribution in R samples, indicating their biogenic origin. The WSOC components from S samples showed high oxygenation and saturation levels. The WSOC-induced RF were estimated as 0.04 to 0.59 W m-2, which contribute up to 16% of that caused by BC, demonstrating the important influences of WSOC on the snow energy budget. Furthermore, the molecular composition and light-absorbing properties of BrC chromophores were unraveled by application of a high-performance liquid chromatography (HPLC) coupled to photodiode array (PDA) detector and HRMS. The chromophores were classified into five major types, i.e., (1) phenolic/lignin-derived compounds, (2) flavonoids, (3) nitroaromatics, (4) oxygenated aromatics, and (5) other chromophores. Identified chromophores account for ~23% – 64% of the total light absorption measured by the PDA detector in the wavelengths of 300 – 370 nm. In the representative U and R samples, oxygenated aromatics and nitroaromatics dominate the total absorbance. Phenolic/lignin-derived compounds are the most light-absorbing species in the S sample. Chromophores in two remote samples exhibit ultraviolet-visible features distinct from other samples, which are attributed to flavonoids. Identification of individual chromophores and quantitative analysis of their optical properties are helpful for elucidating the roles of BrC in snow radiative balance and photochemistry.

How to cite: Zhou, Y., Wang, X., and Laskin, A.: Molecular composition, optical properties, and radiative forcing of water-soluble brown carbon in seasonal snow samples from northern Xinjiang, China, EGU General Assembly 2024, Vienna, Austria, 14–19 Apr 2024, EGU24-9995, https://doi.org/10.5194/egusphere-egu24-9995, 2024.

EGU24-10547 | ECS | PICO | AS3.9

Development of a dusty cirrus calendar based on satellite data 

Samaneh Moradikian, Sanaz Moghim, and Gholam Ali Hoshyaripour

Mineral dust particles have the potential to serve as natural nuclei for cirrus cloud formation in the upper troposphere. Several studies demonstrate that dust aerosol plays a pivotal role in initiating cirrus clouds and forming extended optically thick cirrocumulus decks known as “dusty cirrus”. Despite this, our ability to accurately identify and predict these climatically significant clouds is still limited. In this work, we propose an algorithm to identify dusty cirrus clouds based on satellite data over the Aral Sea region between 2006 and 2021. The algorithm uses the CALIOP Vertical Feature Mask (VFM) to verify the coexistence of dust particles and cirrus clouds and determine the occurrence of dusty-cirrus. To enhance the accuracy of the algorithm, temperature obtained from an external source (the GEOS-5 data product supplied to CALIPSO) is also incorporated as a constraint for cirrus cloud identification. A random selection of identified dusty cirrus events (5% of the data, 90 events) is cross-validated against other data sources including cloud top temperature (MODIS), cloud top height (MODIS), and AOD (MODIS and VIIRS). The cross-validation confirms approximately 97% of the events to be associated with dusty-cirrus. This confirms that the developed algorithm can be used for developing a dusty cirrus calendar using available CALIOP data. This calendar reveals different facts about the dusty-cirrus occurrence in the study area. Out of the 4407 available samples, 2709 cirrus cloud events are identified, with approximately 65% (1790 events) of them being associated with dusty cirrus. The average values obtained for summer, fall, winter, and spring are 54%, 63%, 66% and 75%, respectively. Annual and seasonal trend analysis reveals different increasing rates for this region. Despite the important uncertainties, our analysis and results suggest that the proposed algorithm can be used for first-order identification and statistical analysis of dusty cirrus.

How to cite: Moradikian, S., Moghim, S., and Hoshyaripour, G. A.: Development of a dusty cirrus calendar based on satellite data, EGU General Assembly 2024, Vienna, Austria, 14–19 Apr 2024, EGU24-10547, https://doi.org/10.5194/egusphere-egu24-10547, 2024.

EGU24-11462 | ECS | PICO | AS3.9

Seasonal effects of wind-blown dust emissions on size-resolved aerosol acidity over the U.S 

Stylianos Kakavas, Evangelia Siouti, Athanasios Nenes, and Spyros Pandis

Wind-blown dust emitted by the Earth’s surface is one of the major sources of dust emissions especially in non-vegetated areas like deserts and can affect both climate and human health. Acidity is an important property of atmospheric aerosols impacting a series of related processes and can be affected by these emissions of alkaline dust. In this work, we use a wind-blown dust emissions model to quantify the wind-blown dust emissions over the continental United States during February and July 2017. The modeling domain covers a region of 4752 × 2952 km2 including northern Mexico and southern Canada with a horizontal grid resolution of 36 × 36 km. Then, the hybrid version of aerosol dynamics in PMCAMx (Particulate Matter Comprehensive Air-quality Model with Extensions) chemical transport model is used to simulate size-resolved aerosol acidity. In this version of PMCAMx for fine (PM1) particles, bulk equilibrium is assumed, while for larger particles a dynamic model is used to simulate the mass transfer to each size section. Two cases of simulations are performed. The first is the base case simulation and includes the wind-blown dust emissions for both months. The second one neglects these emissions in order to study their effects on aerosol acidity during a wintertime and a summertime period as a function of particle size and altitude.

How to cite: Kakavas, S., Siouti, E., Nenes, A., and Pandis, S.: Seasonal effects of wind-blown dust emissions on size-resolved aerosol acidity over the U.S, EGU General Assembly 2024, Vienna, Austria, 14–19 Apr 2024, EGU24-11462, https://doi.org/10.5194/egusphere-egu24-11462, 2024.

EGU24-11544 | ECS | PICO | AS3.9

Abundance of giant mineral dust particles: Insights from measured emitted dust size distributions during the J-WADI campaign 

Hannah Meyer, Andres Alastuey, Sylvain Dupont, Vicken Etyemezian, Jessica Girdwood, Cristina González-Flórez, Adolfo González-Romero, Tareq Hussein, Mark Irvine, Konrad Kandler, Peter Knippertz, Ottmar Möhler, George Nikolich, Xavier Querol, Chris Stopford, Franziska Vogel, Frederik Weis, Andreas Wieser, Carlos Pérez García-Pando, and Martina Klose

Gaining a precise understanding of the particle size distribution (PSD) of mineral dust at emission is critical to assess its climate impacts. Despite its importance, comprehensive measurements at dust sources remain scarce and usually neglect part of the super-coarse (particle diameter d between 10 and 62.5 μm) and the entire giant (d > 62.5 μm) particle size ranges. Measurements in those size ranges are particularly challenging due to expected relatively low number concentrations and low sampling efficiencies of instrument inlets.

This study aims to better constrain the abundance of super-coarse and giant dust at emission as part of the Jordan Wind erosion And Dust Investigation (J-WADI, https://www.imk-tro.kit.edu/11800.php) field campaign conducted north of Wadi Rum in Jordan in September 2022. The goal of J-WADI is to improve our fundamental understanding of the emission of desert dust, in particular its full-range size distribution and mineralogical composition.

To capture the dust PSD across the entire size spectrum, we deployed multiple aerosol spectrometers, including active, passive, and open-path devices, such that in combination, a size range from approximately 0.4 to 200 μm was covered. Here we investigate the variability of the PSD in the super-coarse and giant ranges from observed dust events, address instrumental uncertainties and the impact of different inlets on the resulting PSDs. Our preliminary results reveal a mass concentration peak at around 30 μm, potentially limited toward larger sizes by substantially reduced inlet efficiencies. Giant dust particles were generally detected during active dust emission starting from friction velocities larger than around 0.2 m s-1.

Based on our results, we will investigate the mechanisms facilitating super-coarse and giant dust particle emission and transport. Quantifying the conditions for and the amount of super-coarse and giant dust at emission will lay the foundation to incorporate its impacts in weather and climate models.

How to cite: Meyer, H., Alastuey, A., Dupont, S., Etyemezian, V., Girdwood, J., González-Flórez, C., González-Romero, A., Hussein, T., Irvine, M., Kandler, K., Knippertz, P., Möhler, O., Nikolich, G., Querol, X., Stopford, C., Vogel, F., Weis, F., Wieser, A., Pérez García-Pando, C., and Klose, M.: Abundance of giant mineral dust particles: Insights from measured emitted dust size distributions during the J-WADI campaign, EGU General Assembly 2024, Vienna, Austria, 14–19 Apr 2024, EGU24-11544, https://doi.org/10.5194/egusphere-egu24-11544, 2024.

EGU24-12203 | ECS | PICO | AS3.9

Black Carbon and Dust in the snow of Chilean Central Andes: From albedo reductions to radiative forcing 

Maria Florencia Ruggeri, Ximena Fadic, Gonzalo Barcaza, and Francisco Cereceda-Balic

The cryosphere, a vital component of the Earth's climate system, holds substantial importance in both the hydrological cycle and the energy balance. Current apprehension turns around alterations in the cryosphere linked to the reduction in Surface Snow Albedo (SSA).

The decrease in SSA is primarily attributed to the presence of light-absorbing particles (LAPs) and the growth of snow grain size (SGS). The quantitative assessment of these SSA reductions' climatic impact is reflected through their Radiative Forcing (RF), indicating the change they induce in the net radiative flux at the tropopause or the top of the atmosphere. LAPs, mainly composed of Black Carbon (BC) and Mineral Dust (MD), contribute to albedo reduction at visible wavelengths. BC originates from the incomplete combustion of fossil fuels and biomass, while MD primarily emanates from arid and semi-arid regions with low vegetation cover. Precise RF calculations resulting from SSA reductions gain significance, particularly in regions where snow cover governs freshwater availability. Chile exemplifies such a concern, possessing the largest portion of the Andean cryosphere, highly responsive to climate change. This has significant implications for water resources, impacting freshwater availability for Chile's residents and key economic activities.

To quantify the Radiative Forcing RF generated by LAPs in the Chilean Central Andes, snow samples were collected at Portillo, from 2017 to 2022. NUNATAK-1 is a portable, flexible, collaborative scientific platform belonging to the Centre for Environmental Technologies (CETAM-UTFSM), specially designed for research campaigns under extreme conditions, equipped with different automatic and real-time monitoring instruments to measure meteorology, net albedo, solar radiation, gases and aerosols, among others. The samples underwent analysis to determine BC and MD concentrations, following the methodologies outlined in Cereceda-Balic et al. (2022). Snow albedo was modeled using the SNow, ICe, and Aerosol Radiation (SNICAR). Evaluating the singular and combined effects of LAPs, snow albedo was simulated for four scenarios: clean snow (without LAPs), BC only, dust only, and BC + dust. RF represents the variance in absorption between LAP-influenced scenarios and clean snow. For RF calculation, measured solar irradiance specific to each sampling date at the designated site was used. BC concentrations ranged from 2.6 to 717.2 ng g-1, while MD concentrations varied between 1.6 and 181.3 mg kg-1, leading to SSA reductions of up to 21% relative to clean snow. Notably, it was observed that the absorption produced by BC and MD could be comparable, underscoring the significant role of MD in this semiarid location. Moreover, even with relatively moderate or low LAP concentrations in the snow, substantial RF values are generated, emphasizing the heightened climatic influence of LAPs in the region.

Acknowledgments: ANID-Fondecyt Projects 11220525 and 1221526, ANID ANILLO ACT210021, FOVI 230167.

How to cite: Ruggeri, M. F., Fadic, X., Barcaza, G., and Cereceda-Balic, F.: Black Carbon and Dust in the snow of Chilean Central Andes: From albedo reductions to radiative forcing, EGU General Assembly 2024, Vienna, Austria, 14–19 Apr 2024, EGU24-12203, https://doi.org/10.5194/egusphere-egu24-12203, 2024.

EGU24-12289 | ECS | PICO | AS3.9

Image-based nowcasting of dust storms by predicting SEVIRI desert dust RGB composites 

Kilian Hermes, John Marsham, Martina Klose, Franco Marenco, Melissa Brooks, and Massimo Bollasina

Dust storms are frequent high-impact weather phenomena that directly impact human life, e.g., by disrupting land and air traffic, posing health threats, and affecting energy delivery from solar-energy systems. Timely and precise prediction of these phenomena is crucial to mitigate negative impacts.

Currently operational numerical weather prediction (NWP) models struggle to reliably reproduce or resolve dynamics which lead to the formation of convective dust storms, making short-term forecasts based on observations (“nowcasts”) particularly valuable. Nowcasting can provide greater skill than NWP on short time-scales, can be frequently updated, and has the potential to predict phenomena that currently operational NWP models do not reproduce.  However, despite routine high frequency and high resolution observations from satellites, as of January 2024, no nowcast of dust storms is available.

In this study, we present an image-based nowcasting approach for dust storms using the SEVIRI desert dust RGB composite. We create nowcasts of this RGB composite for a large domain over North Africa by adapting established optical-flow-based methods as well as a machine learning approach based on a U-net. We show that our nowcasts can predict phenomena such as convectively generated dust storms (“haboobs”) which currently operational NWP may not reliably reproduce. Furthermore, we show that a machine learning model offers crucial advantages over optical-flow-based nowcasting tools for the application of predicting complete RGB images.

Our approach therefore provides a valuable tool that could be used in operational forecasting to improve the prediction of dust storms, and indeed other weather events. Due to the technical similarity of RGB composite imagery from geostationary satellites, this approach could also be adapted to nowcast other RGB composites, such as those for ash, or convective storms.

How to cite: Hermes, K., Marsham, J., Klose, M., Marenco, F., Brooks, M., and Bollasina, M.: Image-based nowcasting of dust storms by predicting SEVIRI desert dust RGB composites, EGU General Assembly 2024, Vienna, Austria, 14–19 Apr 2024, EGU24-12289, https://doi.org/10.5194/egusphere-egu24-12289, 2024.

Two billion tons of dust are annually transported in our atmosphere all around the world. High latitudes include active desert regions with at least 5 % production of the global atmospheric dust. Active High Latitude Dust (HLD) sources cover > 1,600,000 km2 and are located in both the Northern (Iceland, Alaska, Canada, Greenland, Svalbard, North Eurasia, and Scandinavia) and Southern (Antarctica, Patagonia, New Zealand) Hemispheres. Recent studies have shown that HLD travels several thousands of km inside the Arctic and > 3,500 km towards Europe. In Polar Regions, HLD was recognized as an important climate driver in the IPCC Special Report on the Ocean and Cryosphere in a Changing Climate in 2019. In situ HLD measurements are sparse, but there is increasing number of research groups investigating HLD and its impacts on climate in terms of effects on cryosphere, cloud properties and marine environment.

Long-term dust in situ measurements conducted in Arctic deserts of Iceland and Antarctic deserts of Eastern Antarctic Peninsula in 2018-2023 revealed some of the most severe dust storms in terms of particulate matter (PM) concentrations. While one-minute PM10 concentrations is Iceland exceeded 50,000 ugm-3, hourly PM10 means in James Ross Island, Antarctica exceeded 300 ugm-3 in 2021-22. The largest HLD field campaign was organized in Iceland in 2021 where 11 international institutions with > 70 instruments and 12 m tower conducted dust measurements (Barcelona Supercomputing Centre, Darmstadt, Berlin and Karlsruhe Universities, NASA, Czech University of Life sciences, Agricultural University of Iceland etc.). Additionally, examples of aerosol measurements from Svalbard and Greenland will be shown. There are newly two online models (DREAM, SILAM) providing daily operational dust forecasts of HLD. DREAM is first operational dust forecast for Icelandic dust available at the World Meteorological Organization Sand/Dust Storm Warning Advisory and Assessment System (WMO SDS-WAS). SILAM from the Finnish Meteorological Institute provides HLD forecast for both circumpolar regions. 

Icelandic dust has impacts on atmosphere, cryosphere, marine and terrestrial environments. It decreases albedo of both glacial ice/snow similarly as Black Carbon,  as well as albedo of mixed phase clouds via reduction in supercooled water content. There is also an evidence that volcanic dust particles scavenge efficiently SO2 and NO2 to form sulphites/sulfates and nitrous acid. High concentrations of volcanic dust and Eyjafjallajokull ash were associated with up to 20% decline in ozone concentrations in 2010. In marine environment, Icelandic dust with high total Fe content (10-13 wt%) and the initial Fe solubility of 0.08-0.6%, can impact primary productivity and nitrogen fixation in the N Atlantic Ocean, leading to additional carbon uptake.

Sand and dust storms, including HLD, were identified as a hazard that affects 11 of the 17 Sustainable Development Goals. HLD research community is growing and Icelandic Aerosol and Dust Association (IceDust) has > 110 members from 57 institutions in 22 countries (https://icedustblog.wordpress.com, including references to this abstract). IceDust became new member aerosol association of the European Aerosol Assembly in 2022. New UArctic Thematic Network on HLD was established in 2023.   

How to cite: Dagsson Waldhauserova, P., Meinander, O., and members, I.: High Latitude Dust (HLD) measurements in Iceland, Antarctica, Svalbard, and Greenland, including HLD impacts on climate and HLD networking, EGU General Assembly 2024, Vienna, Austria, 14–19 Apr 2024, EGU24-13103, https://doi.org/10.5194/egusphere-egu24-13103, 2024.

EGU24-13462 | ECS | PICO | AS3.9

Local anthropogenic factors contributing to constrasting glacier response in two mountain glaciers, located in Central Andes, Chile 

Felipe McCracken, María Florencia Ruggeri, Gonzalo Barcaza, Ximena Fadic, and Francisco Cereceda-Balic

Contrasting behaviour of neighbouring mountain glaciers, sharing similar mass balance gradients, have been observed, suggesting the influence of local anthropogenic factors altering the surface energy balance and then explaining larger down-wasting trends in glacier response. It is in this context that for this work the comparison of two contrasting glaciers was used to analyze these differences: considering the Paloma Norte Glacier (PNG), exposed to anthropogenic emissions from local mining activities, and the Yeso Glacier (YG), isolated of these sources. The objective of this research is to combine the remote analysis of light-absorbing particles, such as Black Carbon (BC), Organic Carbon (OC), as well as the estimation of area and albedo, together with the analysis of local climatic trends of each glacier according gridded data, in order to evaluate their differences and the influence of each of these parameters on the surface variation of each glacier.

We determined glacier shrinkage, interannual albedo reduction and black carbon estimates using satellite images over the last 22 years for the Paloma Norte and Yeso glaciers. The results show that in the range 2000-2022, the GPN experienced a 27.11% greater surface loss than the GY, 83.49% higher albedo change rates, and almost 23 times higher BC+OC concentrations compared to the GY. Furthermore, the multivariate regression analysis identified that the most influential parameters was BC-OC, which is consistent with the disparities in glacial retreat observed in this period.

These results are part of an ongoing research, where, in addition, it is intended to contrast these values with measured data at ground stations, where we will use the data from NUNATAK-1 (-32,844, -70,129) and 2 (- 33,665, -70,086) refuge laboratories in the Central Andes. NUNATAK-1 is a portable, flexible, collaborative scientific platform belonging to CETAM, specially designed for research campaigns under extreme conditions equipped with different automatic and real-time monitoring instruments to measure meteorology, net albedo, solar radiation, gases and aerosols, among others. Which are parameters that will also be used to compare with glacial ablation and radiative transfer models, to evaluate the scenarios of albedo change under a pristine environment and another under the scenario of aerosol deposition on the surfaces of the glaciers of interest. All the above mentioned is being carried out to determine to whether these differences are purely due to the orientation of each glacier or the local anthropogenic influence to which they are exposed, and thus decouple the natural effect of climate change from the local anthropogenic effect.

In summary, the results of this work will aim to guide decision-makers, to guarantee greater protection and awareness of the effects that local emissions may (or may not) have on the conservation of these important reservoirs of drinking water, which will allow for a decoupling of the influence and/or impact of local anthropogenic activity from the natural effect of climate change.

Acknowledgments: This research has been carried out with the financial support of CETAM-UTFSM, and the ANID projects: Fondecyt Initiation 11220525, Fondecyt Regular N° 1221526, ANID Anillo ACONCAGUA Project N°ACT210021 and FOVI230167.

How to cite: McCracken, F., Ruggeri, M. F., Barcaza, G., Fadic, X., and Cereceda-Balic, F.: Local anthropogenic factors contributing to constrasting glacier response in two mountain glaciers, located in Central Andes, Chile, EGU General Assembly 2024, Vienna, Austria, 14–19 Apr 2024, EGU24-13462, https://doi.org/10.5194/egusphere-egu24-13462, 2024.

EGU24-14539 | ECS | PICO | AS3.9

Exploring the effects of mineral dust acidification on oxidative potential and limiting nutrient solubility 

Andrea Baccarini, Carolina Molina, Christos Kaltsonoudis, Katerina Seitanide, Maria Georgopoulou, Ali Waseem, Georgia Argyropoulou, Adolfo Gonzalez-Romero, Xavier Querol, Carlos Pérez García-Pando, Dimitrios Papoulis, Satoshi Takahama, Kalliopi Violaki, Spyros N. Pandis, and Athanasios Nenes

Mineral dust aerosol particles are ubiquitous in the atmosphere; they contribute to more than half of the total atmospheric aerosol burden and have far-reaching impacts on biogeochemical cycles, air quality and Earth’s radiative budget. Much of the impact of dust is linked to its mild alkalinity and metal content, which directly influence atmospheric reactivity. However, metals and other trace nutrients (TN), such as phosphorous, are largely insoluble in freshly emitted dust and exhibit limited bioavailability for ecosystems upon deposition. The same metals can induce considerable oxidative stress upon inhalation, but mostly if in soluble form. Previous studies have found that atmospheric processing and, in particular, acidification of dust (caused by reactions with sulfuric, nitric, hydrochloric and organic acids) can promote TN solubility and increase the adverse health effects of population exposure to dust. Atmospheric processing also influences dust hygroscopicity and cloud-forming ability, directly affecting Earth’s radiative budget and deposition patterns.

Previous experiments investigating the effect of atmospheric processing on mineral dust properties were mainly conducted in bulk materials and samples. The dissolution kinetics of metals and TN remains poorly constrained under real atmospheric conditions. To address this issue, we have developed an atmospheric simulation chamber facility where mineral dust particles from a wide range of soils can be generated and aged by any mechanisms relevant to the atmosphere (e.g., acidification through photooxidation and/or nocturnal chemistry).

This study provides a detailed characterization of the chamber facility and explores how acidification alters the properties of mineral dust. In particular, we examine the effect of nitrate and sulfate aging on the solubility of TN and the oxidative potential (measured with a DTT assay) of the dust, under atmospherically relevant conditions. We conclude by relating these findings to field observations and discussing the implications for biogeochemical cycles and air quality.

How to cite: Baccarini, A., Molina, C., Kaltsonoudis, C., Seitanide, K., Georgopoulou, M., Waseem, A., Argyropoulou, G., Gonzalez-Romero, A., Querol, X., Pérez García-Pando, C., Papoulis, D., Takahama, S., Violaki, K., N. Pandis, S., and Nenes, A.: Exploring the effects of mineral dust acidification on oxidative potential and limiting nutrient solubility, EGU General Assembly 2024, Vienna, Austria, 14–19 Apr 2024, EGU24-14539, https://doi.org/10.5194/egusphere-egu24-14539, 2024.

EGU24-16299 | PICO | AS3.9 | Highlight

Diverse and high pollution of microplastics in seasonal snow across Northeastern China 

Xin Wang and Hanxuan Wen

Snow scavenging is recognized as one of the major sinks for atmospheric microplastics (MPs). However, little is known about the properties of MPs in large-scale surface snow. Using Nile Red staining and micro-Fourier transform infrared spectroscopy, we identified the shapes, sizes, and polymer components of MPs in seasonal snow across northeastern (NE) China, a major industrial area. The average concentration of MPs was (4.52 ± 3.05) × 104 MPs L−1 , and the highest contamination (6.65 ± 3.89) × 104 MPs L−1 was observed in Changbai Mountains, which was the highest concentration observed in surface snow to the extent of literature. The majority of snow MPs were smaller than 50 μm and composed primarily of fragments. Ethylene vinyl acetate and polyethylene were the dominant contributors to their chemical components. Investigation with positive matrix factorization revealed that the MPs were primarily generated by debris from packaging materials, followed by industrial and construction activities. In addition, the winter atmospheric circulation over the northwestern Siberian and Mongolian plateaus likely dominated the wide-range dispersion and deposition of the MPs across NE China. These results provide a first comprehensive perspective of MPs from sources to removal associated with snow in a large geographic region.

How to cite: Wang, X. and Wen, H.: Diverse and high pollution of microplastics in seasonal snow across Northeastern China, EGU General Assembly 2024, Vienna, Austria, 14–19 Apr 2024, EGU24-16299, https://doi.org/10.5194/egusphere-egu24-16299, 2024.

EGU24-16833 | ECS | PICO | AS3.9

Cumulative and relative impact of aerosol species on snowmelt runoff from the Hindu Kush Himalayan glaciers 

Sauvik Santra, Shubha Verma, and Shubham Patel

Himalayan glaciers are a significant contributor to the global supply of snowmelt water and serve as the primary source for major rivers in South Asia. In this study, we have evaluated the effect of aerosol species on glaciers in the Hindu Kush Himalayan (HKH) region and identified the glaciers most affected, as well as the relative and cumulative impact of different aerosol species, including black carbon (BC). We estimate the surface concentration of organic carbon (OC), sulfate (Sul), and dust aerosols in the HKH region. We also measured the concentration of these aerosol species in the snow of nine glaciers and investigated their influence on annual glacier runoff. Furthermore, we identified the source regions and sectors that are responsible for aerosol loading in the region. In this study, we combined free-running (freesimu) and constrained (constrsimu) aerosol simulations with an atmospheric general circulation model, an aerosol-snow radiative interaction model, and a novel hypsometric glacier energy mass balance model. The freesimu estimates of aerosol species concentrations were more accurate at high-altitude (HA) stations than at low-altitude (LA) stations. However, the constrsimu estimates performed significantly better at LA stations. A hotspot location of high concentration of aerosol species was identified near Manora Peak, located almost at a central location in the HKH region. Although the concentration of other aerosol species was 2 to 5 times higher than BC (< 70 μg kg-1), they caused significantly less reduction in snow albedo than BC over the HKH glaciers. The cumulative snow albedo reduction (SAR) due to all aerosol species, including BC, was estimated to be as much as 7 to 8% over the Gangotri and Chorabari glaciers, with Gangotri being one of the most important glaciers responsible for the formation of the Ganges River. The Pindari glacier was found to have the highest annual runoff increase (ARI) of all glaciers studied despite having a lower aerosol-induced SAR than the Gangotri and Chorabari glaciers. Five of the nine glaciers (Pindari, Sankalpa, Milam, Gangotri, and Chorabari) had ARI higher than 300 mm w.e. y-1 due to aerosol-induced SAR. Glaciers located in the HKH region were found to be two to three times more sensitive to SAR than cold Tibetan glaciers. This, combined with the recent increase in temperature due to global warming, paints a worrying picture for the future. Analysis of the fractional contribution of aerosol species revealed that BC aerosols, although having a less than 15% contribution to the total aerosol loading, contribute 55 to 70% of total aerosol-induced ARI, followed by dust (20 to 30\%), Sul and OC aerosols respectively. Analysis of region- and source-tagged simulation data revealed that the main sources of OC and Sul aerosols south of 30°N were biomass burning and open burning (for OC), and fossil fuel burning (for Sul) from the nearby Indo-Gangetic plain. For regions located north of 30°N and for dust aerosols, the main contributor was identified as long-range intercontinental transport from far-off regions of Africa and West Asia.

How to cite: Santra, S., Verma, S., and Patel, S.: Cumulative and relative impact of aerosol species on snowmelt runoff from the Hindu Kush Himalayan glaciers, EGU General Assembly 2024, Vienna, Austria, 14–19 Apr 2024, EGU24-16833, https://doi.org/10.5194/egusphere-egu24-16833, 2024.

EGU24-16834 | ECS | PICO | AS3.9

Characterisation of algal blooms on seasonal snowfields through a combination of field spectrometry, drone imagery and radiative transfer modeling at Hardangerjøkulen (Hardanger glacier), Southern Norway 

Lou-Anne Chevrollier, Adrien Wehrlé, Joseph M. Cook, Alexandre M. Anesio, Liane G. Benning, and Martyn Tranter

Pigmented microalgae bloom on glaciers and snowfields worldwide, contributing to carbon storage and enhanced surface melt through surface darkening. The darkening impact of snow algal blooms is being increasingly studied on terrestrial glaciers and ice sheets but less attention has been given to seasonal snowfields, despite their ecological and climatic relevance. Algal blooms are typically widespread but heterogeneously distributed and therefore high resolution airborne observations provide important insights to better understand the spatial patterns and impact of the blooms. Here, we present 130 field spectra colocated with low-cost and light-weight drone imagery acquired over 6 different snowfields in July and August 2023 around Hardangerjøkulen (Hardanger glacier), Southern Norway. We combine these high-resolution measurements with radiative transfer modeling to provide estimates of abundance, carbon storage and albedo impact of snow algal blooms on seasonal snowfields.

How to cite: Chevrollier, L.-A., Wehrlé, A., M. Cook, J., M. Anesio, A., G. Benning, L., and Tranter, M.: Characterisation of algal blooms on seasonal snowfields through a combination of field spectrometry, drone imagery and radiative transfer modeling at Hardangerjøkulen (Hardanger glacier), Southern Norway, EGU General Assembly 2024, Vienna, Austria, 14–19 Apr 2024, EGU24-16834, https://doi.org/10.5194/egusphere-egu24-16834, 2024.

EGU24-17044 | PICO | AS3.9

Inaugural dust and climate model simulations with the new EMIT global mineral abundance maps 

María Gonçalves Ageitos and the EMIT team

Minerals in dust shape the interaction of this ubiquitous aerosol with relevant components of the Earth system. Iron oxides absorb short-wave radiation, while quartz or k-feldspars act as efficient ice nuclei, contributing to the formation of mixed-phase clouds. In addition, iron and phosphorus containing minerals transport nutrients to terrestrial and marine ecosystems. Other minerals, like calcite, affect aerosols’ pH and intervene in atmospheric chemistry processes. Incorporating these complex effects into Earth System Models (ESM) has proven challenging due to our limited knowledge about the mineralogy of dust sources and its particle size distribution at emission.

The ongoing NASA Earth Surface Mineral Dust Source investigation (EMIT) project has produced a first version of a global mineral abundance map at an unprecedented resolution based on spaceborne imaging spectroscopy observations from the International Space Station. Using this new product, we have conducted multi-annual simulations with several ESMs that explicitly represent dust mineralogy. Our study characterizes the relevance of the new map in the ESM results by comparison with our previous baseline simulations. We conduct a thorough evaluation against a global mineral fraction compilation derived from concentration and deposition measurements. Our results are also compared against single scattering albedo (SSA) retrievals from dusty AERONET sites. Our focus is primarily iron oxides, hematite and goethite, which, together with particle size, control the dust SSA in the short-wave.

By providing a first set of simulations with the new EMIT mineral abundance maps and their evaluation, our work contributes to advancing the representation of this key aerosol within ESMs and to further assessing its significance within the global climate system.

How to cite: Gonçalves Ageitos, M. and the EMIT team: Inaugural dust and climate model simulations with the new EMIT global mineral abundance maps, EGU General Assembly 2024, Vienna, Austria, 14–19 Apr 2024, EGU24-17044, https://doi.org/10.5194/egusphere-egu24-17044, 2024.

EGU24-17082 | PICO | AS3.9

Underestimation of desert dust ingested by aircraft from the CAMS reanalysis compared to CALIOP retrievals 

Claire Ryder, Clement Bezier, Helen Dacre, Rory Clarkson, Vassilis Amiridis, Eleni Marinou, Emmanouil Proestakis, Zak Kipling, Angela Benedetti, Mark Parrington, Samuel Remy, and Mark Vaughan

Atmospheric mineral dust aerosol constitutes a threat to aircraft engines from deterioration of internal components. Here we fulfil an outstanding need to quantify engine dust ingestion at worldwide airports.  The vertical distribution of dust is of key importance since ascent/descent rates and engine power both vary with altitude and affect dust ingestion. We use representative jet engine power profile information combined with vertically and seasonally varying dust concentrations to calculate the ‘dust dose’ ingested by an engine over a single ascent or descent. Using the Copernicus Atmosphere Monitoring Service (CAMS) model reanalysis, we calculate climatological and seasonal dust dose at 10 airports for 2003-2019. Dust doses are mostly largest in summer for descent, with the largest at Delhi (6.6 g). Beijing’s largest dose occurs in spring (2.9 g). Holding patterns at altitudes coincident with peak dust concentrations can lead to substantial quantities of dust ingestion, resulting in a larger dose than the take-off, climb and taxi phases. We compare dust dose calculated from CAMS to spaceborne lidar observations from two dust datasets derived from the Cloud–Aerosol Lidar with Orthogonal Polarization (CALIOP). In general, seasonal and spatial patterns are similar between CAMS and CALIOP though large variations in dose magnitude are found, with CAMS producing lower doses by a mean factor of 2.4±0.5, particularly when peak dust concentration is very close to the surface. We show that mitigating action to reduce engine dust damage could be achieved, firstly by moving arrivals and departures to after sunset and secondly by altering the altitude of the holding pattern away from that of the local dust peak altitude, reducing dust dose by up to 44% or 41% respectively.

How to cite: Ryder, C., Bezier, C., Dacre, H., Clarkson, R., Amiridis, V., Marinou, E., Proestakis, E., Kipling, Z., Benedetti, A., Parrington, M., Remy, S., and Vaughan, M.: Underestimation of desert dust ingested by aircraft from the CAMS reanalysis compared to CALIOP retrievals, EGU General Assembly 2024, Vienna, Austria, 14–19 Apr 2024, EGU24-17082, https://doi.org/10.5194/egusphere-egu24-17082, 2024.

EGU24-17880 | PICO | AS3.9

Unveiling the provenance of dust in the EPICA Dronning Maud Land Ice Core (Antarctica) throughout the Last Deglaciation (7–27 kyr BP): A Quantitative Record Using a Novel Rare Earth Element Mixing Model 

Steeve Bonneville, Aubry Vanderstraeten, Laruelle Goulven, Sibylle Boxho, Bory Aloys, Gabrielli Paolo, Gili Stefania, and Nadine Mattielli

Antarctic ice cores have provided valuable insights into the intricate interplay between dust and climate dynamics in the Southern Hemisphere. However, until now, a continuous and quantitative record detailing the origin of dust during the last deglaciation is lacking. In this study, we utilized a novel database comprising 207 Rare Earth Element (REE) patterns obtained from dust and fine sediment/soil fractions collected from well-known potential source areas (PSA) in the Southern Hemisphere. By combining this comprehensive dataset of REE patterns, we developed a robust statistical model to best match the REE patterns measured in the Epica Dronning Maud Land (EDML) ice core in East Antarctica. Among the 398 samples analyzed in the EDML core, 386 have been un-mixed with statistical significance. When coupled with data on total atmospheric deposition, our findings enable the first quantification of the dust flux from the various PSA reaching the EDML region between 7,000 and 27,000 years before present (kyr BP). Our results unveil that, despite a substantial decrease in atmospheric deposition at the onset of deglaciation around 18,000 years ago, the dust composition remained relatively uniform throughout the Last Glacial Maximum (LGM, 18-27 kyr BP) and Heinrich Stadial 1 (HS1, between 14.7-18 kyr BP). During this period, approximately 68% of the total dust deposition was coming from Patagonian sources, with the remaining contributions originating from Australia (14-15%), Southern Africa (~9%), New Zealand (~3-4%), and Puna-Altiplano (~2-3%). A significant shift in dust provenance occurred around 14.5 kyr BP, marked by a drop in Patagonian contribution to below 50%, while low-latitude PSAs increased their contributions, accounting for 21-23% from Southern Africa, 13-21% from Australia, and ~4-10% from Puna-Altiplano. We propose that this shift is linked to enduring alterations in the hydrology of Patagonian rivers, including Atlantic-Pacific drainage reversals and the decline of braided planform, along with the sudden submersion of the Patagonian shelf. Indeed, between 15 and 14.0 kyr BP, the PAT shelf surface area was halved and by ∼13 kyr BP, it had shrunk by 70% from to its former maximum glacial expansion, with most of the PAT shelf south of 40°S submerged. The drastic reduction of the area subjected to aeolian deflation coupled with the reduction of fine sediment supply of eastern plains in PAT induced an overall decline in dust emission from Patagonian sources. Our finding emphasizes an important feedback between dust composition in Southern Hemisphere and eustatic sea level during the Last Glacial-Interglacial Transition. The early Holocene dust composition reveals heightened variability, with a prevalent contribution from Patagonia at ~50%. Post 11.5 kyr BP, as Puna-Altiplano experienced persistent aridity, our records demonstrate a noticeable increase in dust contribution. Leveraging a comprehensive coverage of both local and distal PSA, our statistical model, based on REE patterns, provides a straightforward and cost-effective method for tracing dust sources in ice cores.

How to cite: Bonneville, S., Vanderstraeten, A., Goulven, L., Boxho, S., Aloys, B., Paolo, G., Stefania, G., and Mattielli, N.: Unveiling the provenance of dust in the EPICA Dronning Maud Land Ice Core (Antarctica) throughout the Last Deglaciation (7–27 kyr BP): A Quantitative Record Using a Novel Rare Earth Element Mixing Model, EGU General Assembly 2024, Vienna, Austria, 14–19 Apr 2024, EGU24-17880, https://doi.org/10.5194/egusphere-egu24-17880, 2024.

EGU24-17990 | ECS | PICO | AS3.9

Impactor-Based Size Fractionation of Aerosol Particles over the Tropical Atlantic Ocean: Source Identification using Nd, Sr, and Pb Isotopes  

Oriol Teruel-Cabello, Leo Pena, Ester Garcia-Solsona, Eduardo Paredes, Isabel Cacho, Antoni Rosell-Melé, and Joan Villanueva

Airborne mineral dust is a significant constituent of the Earth's climate system that warrants detailed investigation to comprehend its impact on climate processes. This work presents a comprehensive multiproxy approach, utilizing Sr-Nd-Pb isotopes, to discern mineral dust source areas from North Africa, a region contributing approximately 55% of the global annual dust load. Our research not only focuses on identifying provenance but also explores the relationship between climate processes in source areas and aerosol properties at remote locations. We collected samples during three oceanographic campaigns in the tropical Atlantic Ocean conducted in 2020, 2021, and 2022, spanning late winter and entire spring periods. The interannual aspect allows us to capture variations, enhancing our understanding of dust emission and transport dynamics. The implementation of a sampling device that separates aerosol particles of different sizes allows for the detailed isotopic characterization of particles in each size range. Our results indicate the existence of diverse origin and transport patterns depending on the particle size. Differentiation based on particle size uncovers compelling insights into the dynamics of dust dispersion, revealing size-dependent variations in dust behavior. Notably, we observe distinctive pathways for the mass of elements at each size, elucidating the complex interplay between Nd, Sr, and Pb. 

How to cite: Teruel-Cabello, O., Pena, L., Garcia-Solsona, E., Paredes, E., Cacho, I., Rosell-Melé, A., and Villanueva, J.: Impactor-Based Size Fractionation of Aerosol Particles over the Tropical Atlantic Ocean: Source Identification using Nd, Sr, and Pb Isotopes , EGU General Assembly 2024, Vienna, Austria, 14–19 Apr 2024, EGU24-17990, https://doi.org/10.5194/egusphere-egu24-17990, 2024.

Vegetation fires represent a major, mostly anthropogenically-driven, component of the Earth system that are affecting different landscapes in multiple regions of the globe and are supposed to increase further in number and severity with the ongoing climate change. Measurements and conceptional model studies have already shown that the fire-induced disturbance of the near-surface wind patterns allow for the mobilization of soil dust particles and their injection into the atmosphere through the pyro-convective updrafts related to the fires. However, the dust emission schemes of the current generation of aerosol-climate models do not consider this fire-related emission pathway and focus on wind-driven dust emissions of mostly unvegetated landscapes such as deserts only. This can result in an underrepresentation of dust particles in the fire-affected regions with consequences regarding a correct representation of aerosol-atmosphere interactions such as the radiation budget.

Therefore, the present study aims to provide more insights concerning the importance of fire-driven dust emissions in the climate system. In order to achieve this, the process was implemented as a new emission pathway into the aerosol module HAM (Hamburg Aerosol Module) of the newly coupled aerosol-climate model ICON-HAM. Information about the behavior of the fire-affected wind fields and their potential to overcome typical emission thresholds have been used to set the dust emission fluxes in relation to data of the global fire activity, expressed by the fire radiative power (FRP), and to land-surface characteristics such as soil type and surface roughness.

Multi-year global simulations of ICON-HAM were analyzed to quantify the impacts of the additional dust emissions caused by the fire activity and their injection parameterization on a seasonal and continental scale. It was found that the strength of the fire-related dust emissions strongly depends on the region where the fire occurs, which is determined by the local soil-surface conditions and not only by the fire strength. However, the vegetation fires can lead to an increase of the atmospheric dust load even in regions far away from those commonly known as dust source areas, highlighting that fire-driven dust emissions can substantially contribute to the total aerosol load and in particular its composition within fire-prone regions or also within a fire-prone climate.

How to cite: Wagner, R. and Schepanski, K.: Fire-driven dust emissions – applying a newly developed parameterization scheme in a global aerosol-model, EGU General Assembly 2024, Vienna, Austria, 14–19 Apr 2024, EGU24-18339, https://doi.org/10.5194/egusphere-egu24-18339, 2024.

EGU24-18556 | PICO | AS3.9

EMIT Global Dust Source and Emission Mineral Abundance Maps for Dust and Climate Modeling 

Carlos Pérez García-Pando and the EMIT Team

Soil dust aerosols, comprised of diverse minerals with varying relative abundances, particle size distribution (PSD), shape, surface topography, and mixing state, exert a significant influence on climate. Despite this complexity, conventional Earth System Models tend to assume a globally uniform dust aerosol composition, overlooking well-documented regional variations in the mineralogy of their sources. Existing models addressing dust mineralogical variations often rely on mineral abundance maps extrapolated from an insufficient and non-uniform set of soil sample analyses, especially scarce in arid and semiarid regions.

This study introduces the first version of a series of global dust source and emission mineral abundance maps for dust and climate modelling built upon data from the Earth Surface Mineral Dust Source Investigation (EMIT) imaging spectrometer that is currently operational on the International Space Station (ISS). EMIT measures the spectral range from 0.38 to 2.50 microns through 285 contiguous spectral channels at a high spatial resolution of approximately 60 meters per pixel and ~77 km swath width. The EMIT ground system, utilizing Tetracorder, enables material identification and mapping on mineral spectra. EMIT provides quantitative maps for 10 critical minerals over dust sources pivotal for understanding interactions with the Earth System, with a specific emphasis on mapping iron oxides (hematite and goethite) to constrain the dust direct radiative effect.

Our study offers a comprehensive overview of the diverse methods explored, challenges faced, and key assumptions made to provide quantitative dust source mineralogy. Notably, addressing the absence of information on quartz and feldspar, whose absorption features extend beyond the measured spectral range, poses a significant challenge. Methodologies range from a model that linearly relates mineral abundance to absorption-feature band depth, to more advanced models solving the non-linear multiple scattering radiative transfer problem, providing abundances across a broader range of conditions.

Furthermore, the study provides insights into key assumptions guiding the derivation of mineral abundance maps for both clay and silt fractions of the soil. It also details methods rooted in brittle fragmentation theory, essential for estimating emitted size-resolved mineralogy, which is the critical input for Earth System Models.

This research contributes to advancing our understanding of soil dust aerosols, laying the foundation for improved climate models that account for nuanced regional variations in mineralogical composition.

How to cite: Pérez García-Pando, C. and the EMIT Team: EMIT Global Dust Source and Emission Mineral Abundance Maps for Dust and Climate Modeling, EGU General Assembly 2024, Vienna, Austria, 14–19 Apr 2024, EGU24-18556, https://doi.org/10.5194/egusphere-egu24-18556, 2024.

EGU24-18893 | ECS | PICO | AS3.9

Size segregation process along the soil-saltation-dust continuum: observations in southern Tunisia  

Rizewana Marécar, Béatrice Marticorena, Gilles Bergametti, Jean Louis Rajot, Christel Bouet, Servanne Chevaillier, Anais Féron, Bouthaina Khalfallah, Stéphane Alfaro, Mohamed Taieb Labiadh, Thierry Henry des Tureaux, Saad Sekrafi, and Mohsen Lifti

The particle size segregation processes occurring between the soil, the saltation layer and the dust layer close to the surface are not well described while they are key steps for a precise assessment of dust emission. Improving our understanding and quantifying the role of the processes acting in these three compartments should significantly enhance the consistency of dust emission models.

Data obtained during the WIND-O-V (WIND erOsion in presence of sparse Vegetation) field campaign that took place in spring 2017 in southern Tunisia have been analyzed. Eight saltation events of durations from 1 to 4 hours were sampled and corresponded to a range of wind friction velocities between 0.28 and 0.46 m s-1. The dispersed and non-dispersed size distributions of the soil and of the saltation fluxes were characterized and the micrometeorological conditions were also analyzed. Simultaneous measurements of size resolved saltation fluxes and size-resolved vertical dust fluxes were carried out. The combined analysis of size distributions of the parent-soil and of the horizontal and vertical fluxes reveals an enrichment of fine particles that increases with height. A consistent behavior is observed when comparing the particle size distribution of the saltation and of the vertical dust fluxes. Moreover, we observe changes in the size distributions from one event to another that are similar for the saltation and the dust fluxes. This strongly suggests that the processes controlling the saltation significantly affect the dust size distribution. The roles of the vertical transfer and of the micrometeorological conditions on the size distributions are also discussed.

How to cite: Marécar, R., Marticorena, B., Bergametti, G., Rajot, J. L., Bouet, C., Chevaillier, S., Féron, A., Khalfallah, B., Alfaro, S., Labiadh, M. T., Henry des Tureaux, T., Sekrafi, S., and Lifti, M.: Size segregation process along the soil-saltation-dust continuum: observations in southern Tunisia , EGU General Assembly 2024, Vienna, Austria, 14–19 Apr 2024, EGU24-18893, https://doi.org/10.5194/egusphere-egu24-18893, 2024.

EGU24-19326 | PICO | AS3.9

Why does it rain in the desert? The dust record in Tunisia. 

Anna Bird, Ian Millar, Doris Wagner, Kaja Fenn, Rachel Smedley, Barbara Mauz, Moez Mansoura, Michael Rogerson, Marc Luetscher, Mahjoor Lone, and Noureddine Elmejdoub

North Africa is one of the regions identified by UNESCO as experiencing severe water stress, and further drying could be devastating for region that is also insecure. Tropical semi-arid regions, such as North Africa are highly sensitive to climate change, and climate predictions for this area suggest that this region will experience drying in the next decades and centuries. This contrasts with findings from palaeo-studies which show that, during the Pleistocene, global warming often correlates to humid phases. This project uses speleotherm records with palaoedust (loess) archives to assess the climate record over humid and dry periods to improve our understanding of past climate change in the sensitive but under-represented central northern Africa region. This presentation will focus on findings from the most important loess deposit in northern Africa, at Matmata in Tunisia.

The loess sections within the Matmata Plateau have loess and soil horizons relating to a series of humid and arid phases during the Quaternary, a sequence that provides valuable insight into the origins and dynamics of desert deposits and the interplay between continental and maritime weather systems. Previous work, in the 1990s, on the Matmata loess has shown onset of loess deposition to be during a humid phase (~70 ka) with loess deposition continuing as the climate becomes more arid into the Upper Holocene. It is currently assumed that the source of this material is the Grand Erg Orient, based on a relatively old study (1987). However, new OSL data presented here shows that the onset of loess deposition was much older than previously thought (~300 ka), with the top of the sections dated at ~24 ka. It appears that deposition was not continuous with a large gap in the record from 143 – 45 ka. Gaps in sedimentation for the section older than ~140 ka are difficult to determine due to limited reliability of older OSL ages.

Provenance analysis has been undertaken on many of the dated samples to establish past transport directions. Detrital zircon U-Pb data suggest that there is dominant Algeria-type source with some input from the north. The amount of this input varies over time with samples older than 200 ka showing a larger input from the north. 87Sr/86Sr and 143Nd/144Nd isotopes from different grainsize fractions tell a similar story, with a dominant west African source.

How to cite: Bird, A., Millar, I., Wagner, D., Fenn, K., Smedley, R., Mauz, B., Mansoura, M., Rogerson, M., Luetscher, M., Lone, M., and Elmejdoub, N.: Why does it rain in the desert? The dust record in Tunisia., EGU General Assembly 2024, Vienna, Austria, 14–19 Apr 2024, EGU24-19326, https://doi.org/10.5194/egusphere-egu24-19326, 2024.

EGU24-20434 | ECS | PICO | AS3.9

Forcing factors behind primary productivity variabilities in Western Arabian Sea  since the Last Glacial Maximum: an important role of mineral dust supplies 

Alice Karsenti, Charlotte Skonieczny, Stéphanie Duchamp-Alphonse, Xinquan Zhou, Kara Labidi, Nicolas Musial, Ana Alves, Maxime Leblanc, Julius Nouet, Amélie Plautre, Sébastien Bertrand, Eva Moreno, Annachiara Bartolini, Catherine Kissel, and Franck Bassinot

Located in the Northwestern part of the Indian Ocean, the Arabian Sea (AS) is surrounded by vast arid regions (e.g. Arabian Peninsula, Pakistan, Iran), regularly swept by regional winds, that supply important amounts of mineral dust to the sea. This oceanic area is also under the influence of Indian monsoon surface winds that create a coastal upwelling off Somalia and Oman during summer and a convective mixing north of 15°N during winter. Consequently, mineral dust, coastal upwelling and convective mixing bring important amounts of nutrients to the euphotic zone, making the AS one of the most productive oceanic regions in the world. Although older studies usually highlight the coastal upwelling as a major factor behind primary productivity (PP) patterns in the AS, more recent studies have demonstrated that mineral dust inputs and convective mixing could have a significant influence on PP as well, at least since the Last Glacial Maximum (LGM). This time interval encompasses a glacial-interglacial transition with rapid fluctuations of ice sheet volume and atmospheric CO2 concentration, and represents therefore, a perfect case study to explore the impact of key Earth’s climate forcing mechanisms on the PP for both, past and future climate conditions. Yet, mineral dust component is still poorly documented by proxy data in the AS and direct reconstruction of PP are rare, which limit our understanding of how fertilization of the euphotic zone either by dust, coastal upwelling and/or convective mixing, impacts PP in the past. In this study, we combine high resolution bulk geochemical composition, detrital fraction grain-size distribution and clay mineralogy composition, together with coccoliths counting and carbon organic analyses from sediment cores MD00-2354 and MD00-2355, both retrieved on the Owen ridge. The aim is to reconstruct high-resolution mineral dust and PP patterns over the western part of the AS since the LGM. Both sites are located under the direct influence of dust plumes and among the seasonal latitudinal shift of monsoonal winds. They are therefore willing to register nutrient inputs from mineral dusts, winter convective mixing and/or summer coastal upwelling. Combined with previous paleoclimate records from the area, they will provide for the first time, an unprecedented overview of the forcing factors behind PP distribution in the past. Preliminary results show decreasing PP at both sites through the last 20 ka, suggesting a regional pattern of nutrient distribution in the western AS. Particularly, a strong correlation between PP and mineral dust signals reinforces the hypothesis of a key role of mineral dust on PP in the area. 

How to cite: Karsenti, A., Skonieczny, C., Duchamp-Alphonse, S., Zhou, X., Labidi, K., Musial, N., Alves, A., Leblanc, M., Nouet, J., Plautre, A., Bertrand, S., Moreno, E., Bartolini, A., Kissel, C., and Bassinot, F.: Forcing factors behind primary productivity variabilities in Western Arabian Sea  since the Last Glacial Maximum: an important role of mineral dust supplies, EGU General Assembly 2024, Vienna, Austria, 14–19 Apr 2024, EGU24-20434, https://doi.org/10.5194/egusphere-egu24-20434, 2024.

EGU24-20949 | PICO | AS3.9

Radiative Forcing Assessment of Black Carbon in Snow from the Antarctic Peninsula  

Francisco Cereceda-Balic, María Florencia Ruggeri, Gonzalo Barcaza, Ximena Fadic, and Hans Moosmüller

The pristine Antarctic environment, despite its remoteness, is not immune to the influence of anthropogenic
pollutants. This study focuses on quantifying the Radiative Forcing (RF) resulting from Black Carbon (BC)
concentrations in snow samples collected from various points on the Antarctic Peninsula during the austral summer
of 2023, aiming to assess the impact of BC on the snowpack albedo and, consequently, on the regional climate. To the
best of our knowledge, in most of the locations studied, BC concentrations in snow have never been measured before.
Snow samples were meticulously collected from different locations on the Antarctic Peninsula, covering a diverse
range of environments, including base surroundings, remote locations, and icebergs. This effort was undertaken as
part of the ECA59 campaign, funded by the Chilean Antarctic Institute (INACH). The sampling constituted the initial
phase of a project involving three distinct sampling periods. Specifically, the collection sites were situated in the
eastern sector of the peninsula, known for its minimal human presence and limited prior research, making it a
relatively unexplored region. BC concentrations in our snow samples were measured following the method described
in Cereceda-Balic et al. (2022, https://doi.org/10.1016/j.envres.2022.113756). To understand the BC RF, the SNICAR
(SNow, ICe, and Aerosol Radiation) model was employed to simulate snow albedo for measured BC concentrations.
This methodology allowed for an assessment of the potential BC-induced changes in albedo and the resulting RF. The
analysis revealed a significant range of BC concentrations in Antarctic snow samples, spanning from 2.4 to 1157 ng g-1. Simulating snow albedo using the SNICAR model indicated BC-induced albedo reductions of up to 20% relative to clean snow. The calculated BC-induced RF reached up to 38 W m-2, indicating a substantial climatic impact of BC in the Antarctic Peninsula region.

Our findings underscore the influence of BC on the radiative properties of snow in the Antarctic Peninsula. The diverse
BC concentrations observed here suggest varying sources and highlight the need for continued monitoring. The results
reveal the vulnerability of the Antarctic Peninsula to the impacts of anthropogenic pollutants, even in its seemingly
pristine surroundings. Acknowledging and addressing these influences is essential for assessing the broader
implications of climate change in polar regions. Continued research at these little-explored sites is crucial for refining
climate models and informing mitigation strategies to preserve the integrity of the Antarctic environment.


Acknowledgments: INACH Project RT_34-21, and ANID Project: Fondecyt Projects N°1221526 andN°11220525, ANILLO ACONCAGUA N°ACT210021, and FOVI230167

How to cite: Cereceda-Balic, F., Ruggeri, M. F., Barcaza, G., Fadic, X., and Moosmüller, H.: Radiative Forcing Assessment of Black Carbon in Snow from the Antarctic Peninsula , EGU General Assembly 2024, Vienna, Austria, 14–19 Apr 2024, EGU24-20949, https://doi.org/10.5194/egusphere-egu24-20949, 2024.

EGU24-22132 | ECS | PICO | AS3.9

Reading dust provenance record in Epica Dome C Ice Core (EDC) of Antarctica reveals a shift from Patagonian to African sources through the last deglaciation (2.9 – 33.7 kyr) 

Sibylle Boxho, Nadine Mattielli, Aubry Vanderstraeten, Goulven G. Laruelle, Aloys Bory, Paolo Gabrielli, Stefania Gili, and Steeve Bonneville

Epica Dome C (EDC) ice core is invaluable and highly-resolved record of Earth’s climate. Within the database of climate proxies in deep ice core, quantifying the contribution of the various sources of dust has been very challenging and, so far, no continuous record of dust provenance has been established. Here, we developed an algorithm that combines the REE patterns from a large database (from 207 sediments/soils in well-known Potential Source Areas - PSA - in the Southern Hemisphere) to fit the REE patterns measure in EDC data[1]. Complemented by Monte Carlo simulations to account for analytical uncertainties and by evaluation of goodness-of-fit, our model quantifies the respective contribution of the dust sources (regrouped by large PSA like Patagonia, Africa, S-E Australia, New Zealand and Puna-Altiplano) deposited in EDC ice core between 2.9 and 33.7 kyr at a centennial resolution.

Our provenance record reveals that a major shift in dust provenance occurred at ~14.5-kyr BP during which the contribution of Patagonia (PAT – the main supplier of dust of the Last Glacial Maximum -LGM) declined from   ̴55% to 35% (% of total dust deposition) while African dust (SAF) became more prevalent from   ̴20% during LGM to   ̴40% after 14.5 kyr BP. As a matter of fact, the main supplier of dust in EDC during the Holocene is Southern Africa. We ascribe this abrupt shift to (i) long-lasting changes in the hydrology and of Patagonian rivers and (ii) to a sudden acceleration of sea-level rise between 14 and 15 kyr BP that submerged vast swathes of Patagonian continental shelf, triggering a decline in PAT dust supply to Antarctica. In turn, this induced a steep increase – in relative term - of SAF dust contribution in EDC.

Importantly,our record for EDC is very much consistent with our previous results for Epica Dronning Maud Land (EDML)[2] ice core showing the exact same shift (PAT for SAF dust) between 14 and 15 kyr BP. Yet, compared to EDML, EDC record shows generally larger contribution for SAF and lower PAT dust which seems logical considering the respective localization of EDML and EDC. Our results for EDC thus confirms the relationship between dust composition and eustatic sea level and also highlight the importance of African dust deposition in the Southern Indian ocean and in the adjacent sector of the Southern Ocean since 14 kyr. Our tracing method using REE patterns offers a new, high-resolution tool for the reconstruction of atmospheric paleo-circulation and paleoclimate in the Southern Hemisphere.

[1]Gabrielli et al., (2010), Quaternary Science Review 29, 1-2.

[2]Vanderstraeten et al., (2023), Science of the Total Environment 881, 163450

How to cite: Boxho, S., Mattielli, N., Vanderstraeten, A., Laruelle, G. G., Bory, A., Gabrielli, P., Gili, S., and Bonneville, S.: Reading dust provenance record in Epica Dome C Ice Core (EDC) of Antarctica reveals a shift from Patagonian to African sources through the last deglaciation (2.9 – 33.7 kyr), EGU General Assembly 2024, Vienna, Austria, 14–19 Apr 2024, EGU24-22132, https://doi.org/10.5194/egusphere-egu24-22132, 2024.

EGU24-288 | ECS | Orals | AS3.10 | Highlight

Role of thin clouds in modulating the cloud radiative effect of marine low clouds 

Goutam Choudhury and Tom Goren

The cloud radiative effect (CRE) of low-level marine clouds has traditionally been expressed primarily as a linear function of the cloud cover. However, recent studies have revealed a substantial change in CRE even at a constant cloud cover. This change is attributed to variations in cloud morphology governed by the horizontal and vertical distribution of cloud water. A unique feature of these morphologies, especially for low marine clouds, is the occurrence of distinct quantities of optically thin clouds. Understanding the impact of these thin clouds on low-level marine CRE is crucial for two reasons. First, spaceborne studies indicate a prevalent occurrence of thin clouds in areas characterized by peak low-level cloud cover. Second, the relationship between thin clouds and CRE may differ from that of their optically thicker counterparts due to their semitransparency to incoming shortwave and outgoing longwave radiations. This study investigates the influence of thin clouds on the CRE of low-level clouds over the Southeast Pacific Ocean using six years of concurrent measurements from MODIS and CERES spaceborne sensors. The results show a substantial influence of thin clouds on the shortwave and longwave components of CRE, as well as the balance them. The findings emphasize the need for a more comprehensive representation of thin clouds and, therefore, cloud morphology in climate models.

How to cite: Choudhury, G. and Goren, T.: Role of thin clouds in modulating the cloud radiative effect of marine low clouds, EGU General Assembly 2024, Vienna, Austria, 14–19 Apr 2024, EGU24-288, https://doi.org/10.5194/egusphere-egu24-288, 2024.

EGU24-638 | ECS | Posters on site | AS3.10 | Highlight

Aerosols enhance winter fog lifetime over North India 

Arun Nair, Chandan Sarangi, and Yun Qian

Anthropogenic aerosols affect cloud properties and change their
lifetime, a phenomenon dubbed as aerosol-cloud interactions (ACi). Radiation fog is a
surface-level cloud formed due to night-time radiative cooling of the land surface. Each year,
north India experiences several prolonged fog events. These multi-day fog episodes can
affect surface visibility and air quality, affecting human health and the transportation sector.
From long-term observations, we find that the fog duration and foggy days are enhanced
during high aerosol loading periods over north India.
However, the mechanistic role of heavy aerosol pollution on the evolution, lifetime,
and frequency of North Indian fog episodes is still poorly understood. Using chemistry-
coupled regional model simulations, we find ACi leads to fog lifetime enhancement by
producing smaller droplets and reducing the droplet deposition rate. During the daytime, the
enhanced activation of aerosols into droplets prevents evaporation from the surface.
Interestingly, during this period, the aerosol radiative effect also helps produce conducive
surface conditions to delay fog dissipation. The unequivocal role of aerosol effects on the fog
lifetime over North India suggests the urgent need to regulate particulate pollution to reduce
long periods of fog.

How to cite: Nair, A., Sarangi, C., and Qian, Y.: Aerosols enhance winter fog lifetime over North India, EGU General Assembly 2024, Vienna, Austria, 14–19 Apr 2024, EGU24-638, https://doi.org/10.5194/egusphere-egu24-638, 2024.

EGU24-907 | ECS | Posters on site | AS3.10

Aerosol optical and radiative properties over Asia: Ground-based AERONET observations 

Kamran Ansari and Ramachandran Srikanthan

Aerosols continue to contribute the largest uncertainty in quantifying Earth’s climate change. The uncertainty associated with aerosol radiative forcing is found to be higher over Asia. The simulation and future projection of aerosol impact on climate may not be highly accurate over Asia due to rapid changes in aerosol emissions, limitations in simulating the observed aerosol trends, and the non-availability of regional distribution of columnar aerosol parameters based on high-quality observational datasets on a seasonal scale. For the first time, this comprehensive study examines the spatial and regional variations of aerosol columnar optical and physical properties (aerosol optical depth (AOD), fine mode fraction (FMF), and single scattering albedo (SSA)) and their associated radiative effects (aerosol radiative forcing (ARF) and heating rate (HR)) using high-quality Aerosol Robotic Network (AERONET) datasets on seasonal and annual scales over Asia. This study is performed over a total of 44 selected AERONET observational sites covering different regions of Asia, e.g., Central, South, South-East, and East Asia. AOD, ARF at the surface and in the atmosphere, and aerosol-induced atmospheric HR are observed to be the highest over South Asia, followed by South-East, East, and Central Asia in each season. SSA is found to be lower over South and Central Asia compared to South-East and East Asia. The combined influence of both fine anthropogenic aerosol emissions (e.g., carbonaceous aerosols) from biomass burning and fossil fuel combustion, and coarse mode dust aerosols from seasonal transport lead to higher AOD (0.6) and lower SSA (0.90), which overall result in higher ARF (~−70 Wm-2 at surface and 40 Wm-2 in atmosphere) and HR (0.80 Kday-1) over South Asia. South-East and East Asia are dominated by fine aerosols (higher FMF) due to higher contributions from forest fire and anthropogenic emissions, respectively, and relatively less dominance of dust aerosols compared to Central and South Asia. In addition, the seasonal aerosol optical and radiative parameters over Asia are also compared and contrasted with other regions of the globe, e.g., North America, South America, Europe, Africa, and Australia, where aerosol emissions are significantly different and mostly lower than in Asia. These findings provide observational constraints that are crucial for the improvement in model simulations for accurately assessing the radiative and climatic impacts of aerosols over a global aerosol hotspot region, Asia, where the uncertainty associated with aerosol radiative forcing is found to be higher. Details of the spatiotemporal variations in aerosol characteristics over Asia will be presented, compared and contrasted with the rest of the world, and inferences will be drawn. 

How to cite: Ansari, K. and Srikanthan, R.: Aerosol optical and radiative properties over Asia: Ground-based AERONET observations, EGU General Assembly 2024, Vienna, Austria, 14–19 Apr 2024, EGU24-907, https://doi.org/10.5194/egusphere-egu24-907, 2024.

EGU24-1229 | ECS | Orals | AS3.10 | Highlight

Absorbing aerosols can strongly enhance extrem precipitation 

Guy Dagan and Eshkol Eytan

Understanding the impact of anthropogenic aerosols on extreme precipitation is of both social and scientific significance. While anthropogenic absorbing aerosols are known to influence Earth's energy balance and atmospheric convection, their role in extreme events remains unclear. This study employs convective-resolving radiative-convective-equilibrium simulations to comprehensively investigate the impact of absorbing aerosols on extreme tropical precipitation. Our findings reveal an underappreciated mechanism whereby absorbing aerosols can, under certain conditions, significantly intensify extreme precipitation despite reducing the mean. Notably, we demonstrate that a mechanism previously observed in much warmer (hothouse) climates—where intense rainfall alternates with multi-day dry spells—can manifest under current realistic conditions due to the influence of absorbing aerosols. This mechanism operates when an aerosol perturbation shifts the lower tropospheric radiative heating rate to positive values, generating a strong inhibition layer. Our work underscores an additional potential effect of absorbing aerosols, with implications for climate change mitigation and disaster risk management.

How to cite: Dagan, G. and Eytan, E.: Absorbing aerosols can strongly enhance extrem precipitation, EGU General Assembly 2024, Vienna, Austria, 14–19 Apr 2024, EGU24-1229, https://doi.org/10.5194/egusphere-egu24-1229, 2024.

EGU24-1773 | ECS | Orals | AS3.10

Salting out, non‑ideality and synergism enhance surfactant efficiency in atmospheric aerosols 

Manuella El Haber, Corinne Ferronato, Ludovic Fine, Anne Girroir-Fendler, and Barbara Nozière

The surface tension of sub-micron aerosol particles is expected to affect their efficiency in becoming cloud droplets. Over the last years the role of surfactants in the activation of atmospheric aerosols into cloud droplets has received a growing interest. However, most of the investigations have focused on mixtures containing only one surfactant, while the composition of atmospheric aerosol is complex. Until now, there was little experimental information on the surface properties of mixtures of surfactants with other aerosol components. In this work pendant droplet tensiometry was used to determine the adsorption isotherms and cmc of aqueous mixtures of amphiphilic surfactants (SDS, Brij35, TritonX100, TritonX114, and CTAC) with inorganic salts (NaCl, (NH4)2SO4) and soluble organic acids (oxalic and glutaric acid). Interestingly, inorganic salts and organic acids systematically enhanced the efficiency of the surfactants by further lowering the surface tension and, in some cases, the CMC. Furthermore, all the mixtures studied were strongly non-ideal, some even displaying some synergism, thus demonstrating that the common assumption of ideality for aerosol mixtures is not valid. The molecular interactions between the mixture components were either in the bulk (salting out), in the mixed surface monolayer (synergy on the surface tension) or in the micelles (synergy on the CMC) and need to be included when describing such aerosol mixtures.

Figure 1: Evolution of the minimal surface tension for mixtures of amphiphilic surfactants and organic acids (left) and two amphiphilic surfactants (right).

How to cite: El Haber, M., Ferronato, C., Fine, L., Girroir-Fendler, A., and Nozière, B.: Salting out, non‑ideality and synergism enhance surfactant efficiency in atmospheric aerosols, EGU General Assembly 2024, Vienna, Austria, 14–19 Apr 2024, EGU24-1773, https://doi.org/10.5194/egusphere-egu24-1773, 2024.

EGU24-1828 | ECS | Orals | AS3.10

Long term changes in fog frequency at Swedish airports and its potential drivers 

Moa K. Sporre, Linda Hartman, Shubham Singh, and Johan Friberg

Fog can substantially impact air traffic by inhibiting or aggravating take-off or landing. This can result in large economical costs and even loss of human lives. In this study we investigate how fog frequency has changed at Swedish airports over time. The large north-south extent of Sweden with strong gradients in aerosol concentrations makes it an interesting study area for aerosol impact on fog. We base the study on visibility data from 14 airports. Most visibility data from the airports start in the 1970s but some stations have data before this and some have measurements that start in the 1980s. The visibility measurements are combined with data on air temperature, wind speed, wind direction, and air pressure from the airports. In the study we also include measurements aerosol proxies, namely SO2 in the air from 4 stations and SO42- in rainwater from 10 stations in Sweden. Moreover, emission data of SO2 from Europe from 1970 to present day has been analysed. 
The analysis shows that the fog frequency changes in Sweden vary with location of the airport. At four airports in southern Sweden, the fog frequency show a statistically significant decrease when comparing the periods before and after 1995. The most prominent changes has occurred at the airports close to Malmö and Gothenburg. The annual fog frequency for these stations changes from 5-6 % in the 1980s to 3-4 % in the 2010s with higher changes during winter. For the airports located further north there is no decrease in fog frequency. Some airports in the northern part of Sweden show a statistically significant increase in fog frequency, though the fog frequencies are lower there than in southern Sweden. 
We find that the fog frequency changes in Southern Sweden correlate well with changes in air of SO2, rainwater SO42- concentrations, which both show strong decreases since the 1970 and 1980s in southern Sweden. The changes in these concentrations are much weaker further north in Sweden. The fog frequency changes in southern Sweden thus seems to be driven by changes in the load of hygroscopic aerosol. The fog changes in northern Sweden correlate well with temperature, which is increasing at all airports. The rising temperatures in the north could contribute with more favorable conditions for fog formation at these airports where it previously was to cold for fog formation during parts of the year. Out results indicate that the work on air pollution mitigation in Europe over the past 50 years has reduced fog impact on air traffic in southern Sweden.    

How to cite: Sporre, M. K., Hartman, L., Singh, S., and Friberg, J.: Long term changes in fog frequency at Swedish airports and its potential drivers, EGU General Assembly 2024, Vienna, Austria, 14–19 Apr 2024, EGU24-1828, https://doi.org/10.5194/egusphere-egu24-1828, 2024.

EGU24-2062 | ECS | Orals | AS3.10

Interactions of warm cloud, precipitation, and local forcings over the Great Barrier Reef: Insights from convection-permitting simulations 

Wenhui Zhao, Yi Huang, Steven Siems, Michael Manton, and Daniel Harrison

The important role of warm clouds in regulating the regional energy balance and ocean temperature, that are directly linked to the thermal coral bleaching events, has been increasingly recognised over the Great Barrier Reef (GBR). These shallow clouds, however, are by their nature sensitive to perturbations in both their thermodynamic environment and microphysical background. In this study, we employ the Weather Research and Forecasting (WRF) model with a convection-permitting configuration at 1 km resolution to examine the interactions between the warm clouds and different local forcings over the GBR. A range of local forcings including local aerosol loading, coastal topography, and sea surface temperature (SST) is examined.

Our simulations show a strong response of cloud microphysical properties, including cloud droplet number concentration (CDNC), liquid water path (LWP), and precipitation to the changes in atmospheric aerosol population over the GBR. Higher CDNC and LWP correlated to increased aerosol number concentration leads to a rise in shortwave cloud radiative effect, though the magnitude is small, over both the mountains and upwind over the GBR. While cloud fraction shows little responses, a slight deepening of the simulated clouds is evident over the upwind region in correspondence to the increased aerosol number concentration. A downwind effect of aerosol loading on simulated cloud and precipitation properties is further noted. In consideration of the coastal topography, cloud fraction and accumulated precipitation are strongly sensitive to orographic forcing over the GBR. Orographic lifting and low-level convergence are found to be crucial in explaining the cloud and precipitation features over the coastal mountains downwind of the GBR. However, clouds over the upwind ocean are more strongly constrained by the trade wind inversion, whose properties are, in part, regulated by the coastal topography. Finally, on the scales considered in our study, the warm cloud fraction and the ensuant precipitation over the GBR show only a small response to the local SST forcing, with this response being tied to the simulated cloud type.

How to cite: Zhao, W., Huang, Y., Siems, S., Manton, M., and Harrison, D.: Interactions of warm cloud, precipitation, and local forcings over the Great Barrier Reef: Insights from convection-permitting simulations, EGU General Assembly 2024, Vienna, Austria, 14–19 Apr 2024, EGU24-2062, https://doi.org/10.5194/egusphere-egu24-2062, 2024.

EGU24-2079 | Posters on site | AS3.10

Weak Aerosol Hygroscopicity Measured over the Southern Tibetan Plateau: Implication for Cloud Activation 

Yuan Wang, Jiming Li, Fang Fang, and Ping Zhang

Cloud activation over the Tibetan Plateau (TP) plays a pivotal role in regional cloud-precipitation processes and, by extension, global climate. However, its characteristics remain elusive due to the absence of observations in the TP. Leveraging the Second Tibetan Plateau Scientific Expedition and Research Program, we conducted a ground in-situ aerosol-cloud-precipitation experiment in the southern TP (GACPE-STP) from August to October 2023, thereby unveiling, for the first time, the aerosol activation characteristics in this crucial region. Our findings reveal a discernibly weak aerosol activation capacity, with mean cloud condensation nuclei number concentration (NCCN) ranging from 24 to 483 cm-3 and activation fraction from 2% to 48% at the supersaturation (SS) range from 0.07% to 0.7%. Through multi-method measurements of aerosol hygroscopicity (k), including derivation from both dry and humidified particle number size distribution (PNSD) and scattering coefficients, along with calculations based on NCCN(SS) and dry PNSD, we consistently observe low hygroscopicity with mean values below 0.1. This contrasts starkly with the recommended continental k value of 0.3, a departure that may be linked to unique surface characteristics and local fuel-usage practices in the TP region. As the dry aerosol diameter (D) increases, k exhibits an initial rise followed by a decline, adhering to a Gaussian distribution. The resulting k(D) fitting serves as a parameterization for predicting cloud activation in this region. Notably, utilizing the recommended continental κ value of 0.3 leads to a significant overestimation of cloud droplet number concentration (77% to 426%), subsequently contributing to an overestimation of cloud optical thickness and an underestimation of cloud-rain autoconversion. This cascade effect results in a substantial overestimation of the aerosol indirect effects. Employing the k(D) parameterization can significantly enhance the precision of cloud activation predictions in this region. These findings peel back a layer of mystery surrounding cloud activation in the TP region. To construct a comprehensive understanding, we advocate for additional in-situ experiments, including ice nuclei measurements, crucial for a nuanced depiction of cloud activation in the TP region.

How to cite: Wang, Y., Li, J., Fang, F., and Zhang, P.: Weak Aerosol Hygroscopicity Measured over the Southern Tibetan Plateau: Implication for Cloud Activation, EGU General Assembly 2024, Vienna, Austria, 14–19 Apr 2024, EGU24-2079, https://doi.org/10.5194/egusphere-egu24-2079, 2024.

EGU24-2107 | ECS | Posters on site | AS3.10

The influence of submicron sized aerosol scavenging by snow in the Cb cloud 

Darko Savic, Vladan Vuckovic, and Dragana Vujovic

In this work we have investigated the effect of aerosol particles (APs) scavenging by snow in a cumulonimbus cloud. It was shown that APs in the atmosphere have a major impact on cloud formation, development and its products, climate, environment, public health, etc. The scavenging coefficients for various snow scavenging processes were calculated, analyzed and implemented in a three-dimensional, three-moment microphysical model in which all the number concentrations and the mixing ratios, were explicitly calculated for all hydrometeor categories. Analyzing the AP scavenging coefficients we concluded that Brownian/turbulent diffusion is the dominant process for smaller diameter aerosols, up to a point, where inertial interception overpowers. Impaction scavenging is by far the most dominant process of APs scavenging by snow for particles larger than ~0.5 µm in diameter, therefore it was neglected because most of the APs injected into the cloud are of the diameter <0.2 µm. Scavenging coefficient of snow is comparable to that of raindrops or even cloud droplets, which means that APs scavenging with snow should be included in the model. Two sets of numerical experiments were conducted: (1) APs were scavenged only by cloud and rainwater and (2) APs were scavenged by cloud and rainwater and snow. No ice nucleation processes were included. The results of 3D numerical simulations showed that snow contributes more to mass than the number of AP washouts, as it collects larger particles more efficiently. As snowflakes melt into raindrops, scavenging by snow becomes a significant mechanism for removing APs from the atmosphere. Approximately 29.3% and 7.2% of the total number and mass of APs, respectively, get deposited on the ground through precipitation during a 3-hour simulation when snow does not actively collect APs. When snow collection is included in the model, the total number and mass of APs precipitated on the ground increase by 10.7% and 56.9%, giving a total of 32.4% and 11.3%, respectively.

How to cite: Savic, D., Vuckovic, V., and Vujovic, D.: The influence of submicron sized aerosol scavenging by snow in the Cb cloud, EGU General Assembly 2024, Vienna, Austria, 14–19 Apr 2024, EGU24-2107, https://doi.org/10.5194/egusphere-egu24-2107, 2024.

Different cloud types have distinct radiative effects on the energy budget of the earth–atmosphere system. To better understand
the cloud radiative impacts, it is necessary to distinguish the effects of different cloud types, which can be achieved through
the cloud radar data that can provide cloud profiles for both day-to-day and diurnal variations. In this study, we use 6-year
high-temporal resolution data from the Ka-Band Zenith Radar (KAZR) at the Semi-Arid Climate and Environment Observa-
tory of Lanzhou University (SACOL) site to analyze the physical properties and radiative effects of main cloud types. The
three types of clouds that occur most frequently at the SACOL site are single-layer ice clouds, single-layer water clouds, and
double-layer clouds with the annual occurrence frequencies being 29.1%, 3.4%, and 8.3%, respectively. By using the Fu–Liou
radiative transfer model simulation, it is found that the distinct diurnal variations of both the occurrence frequency and their
macro- and micro-physical properties significantly affect the cloud-radiation. On annual mean, the single-layer ice clouds
have a positive radiative forcing of 7.4 W/m 2 to heat the system, which is a result of reflecting 12.9 W/m 2 shortwave (SW)
radiation and retaining 20.3 W/m 2 longwave (LW) radiation; while the single-layer water clouds and double-layer clouds
have much stronger SW cooling effect than LW warming effect, causing a net negative forcing of 8.5 W/m 2 . Although all
these clouds have an overall small cooling effect of 1.1 W/m 2 on the annual radiative energy budget, the significant differ-
ences of the diurnal and seasonal distributions for different type clouds can lead to distinct radiative forcing. Especially the
LW warming effect induced by the exclusive ice clouds in the cold season may have an important contribution to the rapid
winter warming over the semi-arid regions.

How to cite: Wang, M.: Radiative contributions of different cloud types to regional energy budget over the SACOL site, EGU General Assembly 2024, Vienna, Austria, 14–19 Apr 2024, EGU24-2679, https://doi.org/10.5194/egusphere-egu24-2679, 2024.

EGU24-2702 | ECS | Orals | AS3.10

Exploring the Influence of Turbulence on Droplet Size Growth and Precipitation in Warm Clouds 

Shri Vignesh, Ambedkar Sanket, Arya Narayanan Unni, Srikrishna Sahu, Sachin S. Gunthe, Swetaprovo Chaudhuri, Rama Govindarajan, and Raman I. Sujith

There has been significant progress in comprehending the role of characteristic properties of aerosol in cloud droplet formation over the past decade [1]; however, the growth of cloud droplets into rain droplets, initiating precipitation in warm clouds, is still not well understood [2]. Collision and coalescence among droplets are assumed to be responsible for the rapid growth of cloud droplets to rain droplets. Turbulence is believed to play a significant role in the growth of cloud droplets [2]. 

The influence of turbulence on droplet dynamics is nominally characterized by the Stokes number, which decides if the droplet either follows the streamlines or decorrelates from it. Due to their deviation from the streamlines, droplets can form clusters and caustics, thereby increasing the chance of collisions [3]. Thus, the size distribution of droplets can determine the influence of turbulence on droplet collisions. The cloud droplet size distribution depends on several parameters, such as the initial aerosol number concentration, aerosol properties, and the in-cloud supersaturation. Thus, investigating the influence of turbulence on a given droplet size distribution can facilitate a better scientific understanding of the onset of precipitation. 

In the present study, we experimentally investigated the influence of turbulence on different cloud droplet size distributions. We generated homogeneous isotropic turbulence of various intensities in a closed chamber and seeded it with droplets relevant to that observed in clouds originating under different environmental conditions. Using Phase Doppler particle analyzer (PDPA), we measured the droplet size distributions and analyzed the changes with turbulence intensity. Our experiments show significant growth for cloud droplet size distributions with a higher degree of polydispersity than slender droplet size distributions. We attribute this enhancement in collisions to the induced relative velocity between droplets of different Stokes numbers. We observed a positive trend between clustering and droplet size growth, thus indicating the role of clustering in enhancing collisions.

Acknowledgments: We thank Dr. Amit Kumar Patra and Dr. T. Narayana Rao for their valuable suggestions. We acknowledge the ISRO-IITM cell (No. SP/21-22/1197/AE/ISRO/002696) and  IoE initiative (SP22231222CPETWOCTSHOC) for funding this work. 

References:

[1] Gunthe, S.S., King, S.M., Rose, D., Chen, Q., Roldin, P., Farmer, D.K., Jimenez, J.L., Artaxo, P., Andreae, M.O., Martin, S.T. and Pöschl, U., 2009. Cloud condensation nuclei in pristine tropical rainforest air of Amazonia: size-resolved measurements and modeling of atmospheric aerosol composition and CCN activity. Atmospheric Chemistry and Physics, 9(19), pp.7551-7575.

[2] Devenish, B.J., Bartello, P., Brenguier, J.L., Collins, L.R., Grabowski, W.W., IJzermans, R.H.A., Malinowski, S.P., Reeks, M.W., Vassilicos, J.C., Wang, L.P. and Warhaft, Z., 2012. Droplet growth in warm turbulent clouds. Quarterly Journal of the Royal Meteorological Society, 138(667), pp.1401-1429.

[3] Ravichandran, S. and Govindarajan, R., 2015. Caustics and clustering in the vicinity of a vortex. Physics of Fluids, 27(3).

How to cite: Vignesh, S., Sanket, A., Narayanan Unni, A., Sahu, S., S. Gunthe, S., Chaudhuri, S., Govindarajan, R., and I. Sujith, R.: Exploring the Influence of Turbulence on Droplet Size Growth and Precipitation in Warm Clouds, EGU General Assembly 2024, Vienna, Austria, 14–19 Apr 2024, EGU24-2702, https://doi.org/10.5194/egusphere-egu24-2702, 2024.

Anthropogenic aerosols and their interactions with clouds play a crucial role in regulating the Earth's radiation balance and introduce significant uncertainties in climate change projection. The effective radiative forcing due to aerosol-cloud interactions (ERFaci) is particularly difficult to quantify, leading to uncertainties in model projections of cloud feedback and climate sensitivity. Analysis of CMIP6 model simulations indicate that models with a strongly-positive cloud feedback tend to be offset with strongly negative ACI, leading to similar projections of global mean temperatures during the historical period. However, because anthropogenic aerosol primarily occur in the Northern Hemisphere, the hemispheric asymmetry in warming (NH-SH) differs significantly between low and high ACI models, with observed trends being more consistent with low ACI (weak cloud feedback) models. However, recent satellite estimates of ERFaci based on cloud controlling factors (CCF) is more consistent with high ACI models.  We evaluate the CCF approach using a series of perfect model experiments. The magnitude of ERFaci depends on two factors: the amount of aerosol loading between the pre-industrial and present day, and the susceptibility of cloud albedo and cloud lifetime to that aerosol loading. By comparing observationally-constrained estimates of ERFaci with CMIP6 model simulations, we quantify the contributions of aerosol loading differences and cloud susceptibility to the inter-model spread. We find that explicitly accounting for the role of aerosol activation on cloud droplet formation is essential to obtaining accurate estimates of ERFaci, and when this is done, the satellite constrained estimates of ERFaci are more consistent with low ACI models.

How to cite: soden, B. and park, C.: Reconciling Top-Down and Bottom-Up Estimates of the Effective Radiative Forcing from Aerosol-Cloud Interactions, EGU General Assembly 2024, Vienna, Austria, 14–19 Apr 2024, EGU24-3278, https://doi.org/10.5194/egusphere-egu24-3278, 2024.

EGU24-3659 | Posters on site | AS3.10

The effects of ice nucleation parameterizations in GFDL climate model  

Huan Guo and Songmiao Fan
We incorporated a temperature, dust, and sea spray aerosol-dependent ice nucleation parameterization in the recently developed GFDL AM4-MG2 framework, and refer to this new configuration as AM4-MG2-new. The major difference of the ice nucleation parameterizations in AM4-MG2-new and AM4-MG2 is the inclusion of sea spray aerosol as ice nucleating particles (INPs). Then we conducted AMIP (Atmospheric Model Intercomparison Project) mode simulation with AM4-MG2-new. It turns out that AM4-MG2-new produces mean model climate comparable to AM4-MG2, for example, similar cloud radiative and precipitation fields, but different cloud water phase partitioning or supercooled cloud fractions, especially over the mid-high latitudes where mixed-phase clouds (clouds that consist of both liquid and ice) are prevalent. The cloud-phase feedback could in turn impact the estimate of climate sensitivity. The results suggest that ice nucleation parameterizations, which have large uncertainties, have important impacts on climate sensitivity.

How to cite: Guo, H. and Fan, S.: The effects of ice nucleation parameterizations in GFDL climate model , EGU General Assembly 2024, Vienna, Austria, 14–19 Apr 2024, EGU24-3659, https://doi.org/10.5194/egusphere-egu24-3659, 2024.

EGU24-3924 | ECS | Posters on site | AS3.10

Impact of biomass burning emission variability on precipitation over tropical oceans 

Xiaoyan Zhang, Xiyan Xu*, Gensuo Jia, and Yue Liang

Numerical simulations mostly constrain the total amount of biomass burning aerosols but rarely prescribe the realistic emission variability. Ignoring high heterogeneity of emission variability may lead to uncertainties in climate projections. Based on the Community Earth System Model version 2 Large Ensemble Community Project (CESM2-LE), we investigated the impact of interannual variability of biomass burning emissions on tropical precipitation and extremes. Our results revealed that global carbonaceous aerosol emission was 180-320 Tg over the period 1990-2020. Tropical regions (30°S-30°N) had the largest emission flux and variability. Higher interannual variability triggered increasing precipitation and extremes in tropics where spatial heterogeneity of precipitation anomalies can be detected. More precipitation and northward ITCZ shift occurred in central and western Pacific Oceans, while precipitation reduction together with southward ITCZ rain-belt over eastern Pacific and Atlantic Basins. The asymmetries were attributable to weakened Walker circulation and its uplifting branch tilted toward the Southern hemisphere. Correspondingly, nonlinear aerosol-cloud interactions increased (reduced) the total and high cloud cover over the southern central-western Pacific (eastern Pacific and Atlantic) Oceans. Convective activities were then strengthened (weakened) due to lower (higher) outgoing longwave radiation at top of atmosphere, which drove the cross-equatorial heat transport variations, and ultimately led to southward (northward) shift of ITCZ. Our results revealed the synergistic mechanisms between biomass burning emission variability, radiation and cloud characteristics, and large-scale circulation modes, thereby gaining new insights into the tropical hydrological cycle.

How to cite: Zhang, X., Xu*, X., Jia, G., and Liang, Y.: Impact of biomass burning emission variability on precipitation over tropical oceans, EGU General Assembly 2024, Vienna, Austria, 14–19 Apr 2024, EGU24-3924, https://doi.org/10.5194/egusphere-egu24-3924, 2024.

EGU24-4059 | Posters on site | AS3.10

Cloud Susceptibility to Aerosols: Comparing Cloud-Appearance vs. Cloud-Controlling Factors Regimes 

Yannian Zhu, Jihu Liu, Minghuai Wang, and Daniel Rosenfeld

Clouds can be classified into regimes by the cloud appearance or by the cloud meteorological controlling factors. The cloud appearance regimes inherently include adjustments to aerosol effects, such as transitions between closed and open cells. Therefore, aggregation of cloud susceptibilities to aerosols over the cloud-appearance regimes excludes much of the cloud adjustment component of the susceptibilities. In contrast, aggregating susceptibilities over regimes defined by cloud-controlling factors includes the full effects of cloud adjustments. Here we compared the susceptibilities of the two kinds of cloud regimes and demonstrated this effect. Overall, increasing cloud droplet number concentration (Nd) consistently leads to precipitation suppression, higher cloud fraction (CF), and reduced liquid water path (LWP), regardless of how the regime is defined. However, their susceptibilities to Ndaggregated over cloud-appearance regimes are significantly lower than those aggregated over cloud-controlling factors regimes, with lower-tropospheric stability (LTS) serving as an example to define cloud-controlling factors regimes. This underestimation is more pronounced for CF susceptibility, where the susceptibility for cloud appearance regimes is only 1/4 of the susceptibility for cloud controlling regimes. These findings imply that relying solely on cloud-appearance regimes may underestimate the effective radiative forcing produced by cloud adjustment (ERFaci). Nevertheless, the substantial variability in the magnitude of cloud adjustment across appearance regimes at similar LTS also suggests that a single cloud-controlling factor is not sufficient to fully separate cloud regimes to quantify cloud adjustment. Therefore, identifying a comprehensive set of cloud-controlling factors is essential for accurately quantifying cloud adjustments in future studies.

How to cite: Zhu, Y., Liu, J., Wang, M., and Rosenfeld, D.: Cloud Susceptibility to Aerosols: Comparing Cloud-Appearance vs. Cloud-Controlling Factors Regimes, EGU General Assembly 2024, Vienna, Austria, 14–19 Apr 2024, EGU24-4059, https://doi.org/10.5194/egusphere-egu24-4059, 2024.

EGU24-4329 | ECS | Posters virtual | AS3.10 | Highlight

Comparing ML retrieved and invisible ship tracks to probe the meteorological dependence of cloud susceptibility to aerosol 

Peter Manshausen, Duncan Watson-Parris, and Philip Stier

Aerosol-cloud interactions continue to resist reliable quantification, partly owing to their strong dependence on cloud and weather regimes. For a long time, opportunistic experiments such as ship tracks have been used to overcome issues of confounding. Recent advances leverage (i) Machine Learning (ML) to drastically enlarge ship track data bases, and (ii) ‘invisible ship tracks’, found by advecting ship emissions, to overcome selection biases in ship track studies. Here, we combine both approaches, to advance our understanding of how meteorology controls cloud responses to aerosol emissions. Firstly, we show that even though the ML dataset is much larger than previous hand-logged data sets, it still contains only a fraction of less than 1% of the cloud regions polluted by shipping. This means less than 1% of ship tracks are visible. Secondly, we find that this fraction varies strongly with location and season, with the Southern Hemisphere winter leading to most visible tracks in the Stratocumulus regions of the SE Pacific and SE Atlantic. Thirdly, we identify meteorological regimes favourable to the visibility of tracks, using ML methods such as Random Forests and Explainable AI, alongside traditional methodsThe regime favourable to visible tracks is defined by a stable lower troposphere and little vertical movement, low sea surface temperatures, high cloud cover, and low boundary layer heights. Lastly, we quantify the link between ship track visibility and albedo change in polluted clouds, establishing to what extent days with visible tracks are those when cloud albedo is most susceptible to aerosol. Building on this relationship, a predictive model like our Random Forest has applications in deliberate Marine Cloud Brightening by predicting the days that are most susceptible to aerosol perturbations.

How to cite: Manshausen, P., Watson-Parris, D., and Stier, P.: Comparing ML retrieved and invisible ship tracks to probe the meteorological dependence of cloud susceptibility to aerosol, EGU General Assembly 2024, Vienna, Austria, 14–19 Apr 2024, EGU24-4329, https://doi.org/10.5194/egusphere-egu24-4329, 2024.

EGU24-4358 | ECS | Orals | AS3.10

Ice-nucleating particles in springtime cold-air outbreaks associated with Arctic haze 

Erin Raif, Sarah Barr, Mark Tarn, James McQuaid, Martin Daily, Steven Abel, Paul Barrett, Keith Bower, Paul Field, Kenneth Carslaw, and Benjamin Murray

Concentrations of ice-nucleating particles (INPs) were measured in springtime cold-air outbreaks over the Norwegian and Barents Seas using filter samples taken on board the FAAM BAe-146 aircraft. These measurements of INP concentrations were comparable to the highest INP concentrations previously observed in the Arctic and were similar to typical terrestrial midlatitude INP concentrations. This is important because shallow cloud systems such as those in mid- to high-latitude cold-air outbreaks are highly sensitive to INPs and are a highly uncertain contributor to cloud feedbacks. 

To investigate the types of aerosol responsible for this high INP concentration, we used aerosol-size data from underwing optical probes to derive an active site density of the INP samples. By comparing to laboratory derived active site densities of different aerosol types, this suggested that sea spray was unlikely to be a dominant INP type and that there were likely to be strong biological and dust components to the INP population. Scanning electron microscopy with energy-dispersive spectroscopy used on selected filters revealed that sub-micron particles were dominantly sulphates and carbonaceous, while super-micron particles were dominantly mineral dust.

Samples taken above the cloud decks had greater active site densities than those below, and back-trajectory analysis and meteorological conditions suggested a lack of obvious local INP sources. We hypothesise that the high INP concentration is most likely to be associated with aged aerosol that has accumulated over the Arctic (Arctic Haze).  These high INP concentrations imply that these clouds may have a more negative cloud-phase feedback than their Southern Ocean equivalents.

How to cite: Raif, E., Barr, S., Tarn, M., McQuaid, J., Daily, M., Abel, S., Barrett, P., Bower, K., Field, P., Carslaw, K., and Murray, B.: Ice-nucleating particles in springtime cold-air outbreaks associated with Arctic haze, EGU General Assembly 2024, Vienna, Austria, 14–19 Apr 2024, EGU24-4358, https://doi.org/10.5194/egusphere-egu24-4358, 2024.

Sea spray aerosols (SSA) play a crucial role as a primary aerosol source on a global scale, exerting significant influence on the Earth's radiative balance. Variations in sea water composition and concentrations across different regions can introduce disparities in sea spray aerosol properties. This study focuses on investigating and comparing the hygroscopicity of artificial sea salt particles and nascent sea spray aerosols from offshore waters and open sea areas within the Pacific Ocean. An aerosol optical tweezer (AOT) system is developed to measure the diameter hygroscopic growth factor (GF) and the hygroscopicity parameter (κ) of both artificial sea salt and natural sea spray aerosol particles. Our findings indicate that the hygroscopic properties of supermicron sea spray aerosols from offshore waters and open sea areas are remarkably similar and can be effectively represented by artificial sea salt particles. Furthermore, through the application of the theoretical Zdanovskii, Stokes, and Robinson (ZSR) mixing rule, the calculated κ values reinforce the validity of our aerosol optical tweezer measurements. Hence, we propose that, for modeling supermicron sea spray aerosol particles produced in either offshore waters or open sea areas, the properties of artificial sea salt particles, rather than NaCl particles, serve as robust proxies for natural sea spray aerosols. To be specific, we recommend utilizing a κ value of 1.20, for modeling sea spray aerosol properties at a relative humidity of 90% (RH=90%). This empirically derived κ value, rooted in our study, can enhance the accuracy of climate models and contribute to a more precise understanding of aerosol-climate interactions.


How to cite: Qiu, J. and Zhao, C.: Hygroscopic Behavior of Sea Spray Aerosols in Offshore Waters and Open Sea Areas Investigated with Aerosol Optical Tweezers, EGU General Assembly 2024, Vienna, Austria, 14–19 Apr 2024, EGU24-4957, https://doi.org/10.5194/egusphere-egu24-4957, 2024.

EGU24-4997 | ECS | Posters on site | AS3.10

A Comprehensive Method to Unveiling Uncertainty in Multi-Factor Systems 

Bishuo He and Chunsheng Zhao

The accurate assessment of influencing factors in multi-factor systems is crucial, but current methodologies face challenges in evaluating uncertainty comprehensively. In aerosol radiative forcing, existing methods may lack completeness, potentially leading to erroneous conclusions. This study introduces a universally applicable method for precise sensitivity analysis of influencing factors in multi-factor systems. Two measurement dimensions for sensitivity analysis methods are established: accurately expressing sensitivity and quantifying sensitivity. Combined utilization of different methods allows for a comprehensive analysis. The proposed method can simultaneously express and quantify sensitivity, including the analysis of nonlinear components unaffected by the absence of factors. In a sensitivity analysis on aerosol optical parameters, the aerosol shell complex refractive index (CRI_shell) emerges as the most sensitive factor. Calculations reveal substantial variability (5% to 91%) in the proportion of nonlinear components resulting from factor interactions. This emphasizes the importance of employing methods resistant to nonlinear influences, as susceptible methods may introduce significant biases. The proposed sensitivity analysis facilitates factor importance assessment at three levels: primary and secondary factors, sensitivity ranking, and quantified sensitivity. This method exhibits universality and holds promising prospects for practical applications in the field. Results provide a valuable reference for future model parameter settings and routine observations.

How to cite: He, B. and Zhao, C.: A Comprehensive Method to Unveiling Uncertainty in Multi-Factor Systems, EGU General Assembly 2024, Vienna, Austria, 14–19 Apr 2024, EGU24-4997, https://doi.org/10.5194/egusphere-egu24-4997, 2024.

EGU24-5189 | Posters on site | AS3.10

Large-eddy simulations of the stratocumulus to cumulus transition in the Northeast Pacific using ICON 

Moritz Schnelke, Maike Ahlgrimm, and Anna Possner

The Northeast Pacific stratocumulus deck is one of the well-known subtropical semipermanent stratocumulus decks that transitions into shallow cumuli along the sea surface temperature gradient away from the Californian coast line. In this study we use observational data from the Marine ARM GPCI Investigation of Clouds (MAGIC) ship campaign to evaluate stratocumulus to cumulus transitions (SCTs) in idealised large-eddy simulations (LESs) with the ICOsahedral Nonhydrostatic Model (ICON). The simulations are conducted with a horizontal resolution of 50 m and a vertical resolution of at most 10 m in the lowest 3 km of the atmosphere. 
From previous studies of SCTs, including MAGIC and in particular Leg15A, it is well known that entrainment processes drive an important, and likely dominant role in forcing the transition. However, recent studies have shown that microphysical effects like sedimentation or precipitation can significantly alter the course of the SCT. Suppressed precipitation through a higher number of cloud droplets often leads to a delayed SCT. On the other hand, this is counteracted by the associated increase in entrainment, which benefits the transition. This raises the question of the mechanism of this interaction and the overall strength of microphysical effects. 
Here we present the evaluation of ICON LES and the characterisation of nine selected transitions from the MAGIC campaign, including the well analysed Leg15A. 

How to cite: Schnelke, M., Ahlgrimm, M., and Possner, A.: Large-eddy simulations of the stratocumulus to cumulus transition in the Northeast Pacific using ICON, EGU General Assembly 2024, Vienna, Austria, 14–19 Apr 2024, EGU24-5189, https://doi.org/10.5194/egusphere-egu24-5189, 2024.

This study investigates the relationship between aerosols and cloud properties in the South Asian monsoon over two decades, using satellite data. We conducted a 20-year analysis of aerosols and diverse cloud properties during the monsoon months. Precipitation patterns were categorized into high and low years based on anomalies. Significant correlations emerged between aerosol optical depth (AOD) and cloud properties, including cloud fraction, cloud droplet size, cloud top features, column-integrated water vapor, ice water path, and liquid water path. AOD and cloud fraction showed positive correlations, though not always translating to increased precipitation, underlining the role of cloud microphysics. AOD influenced cloud droplet size differently across regions, with some showing smaller droplets with higher AOD. Cloud height, temperature, and reflectivity were affected by AOD, indicating its influence on cloud properties through droplet concentration. Column-integrated water vapor positively correlated with AOD, implying aerosol involvement in water vapor condensation into cloud droplets. These findings uncover the intricate regional dynamics of aerosol-cloud interactions during the South Asian monsoon, offering valuable insights into the delicate relationships between aerosols, cloud properties, and precipitation variations across the diverse landscape of South Asia. This underscores the significance of considering regional variations in aerosol-cloud interactions when evaluating their impact on South Asian monsoon systems.

How to cite: Khattak, P., Cermak, J., Fatima, S. H., and Fuchs, J.: Spatiotemporal Impacts of Aerosols on Cloud Properties and Precipitation Patterns in South Asian Monsoon Region: Contrasting High and Low Precipitation Years., EGU General Assembly 2024, Vienna, Austria, 14–19 Apr 2024, EGU24-5454, https://doi.org/10.5194/egusphere-egu24-5454, 2024.

EGU24-5460 | Orals | AS3.10 | Highlight

Aerosol size distribution variability over the Southern Ocean: implications for cloud droplet number concentrations 

Julia Schmale, Athanasios Nenes, Iris Thurnherr, Silvia Henning, Christian Tatzelt, Andrea Baccarini, and Martin Gysel-Beer

The Southern Ocean is a key component of the climate system, where clouds especially matter. Therefore, it is important to correctly simulate clouds in climate models. Even though there has been substantial improvement, climate models still struggle in their representation of cloud microphysical properties.

In this study, based on data from the Antarctic Circumnavigation Expedition in 2026/17, we explore environmental factors, such as stable water isotopes in atmospheric water vapor, cyclones and boundary layer stability, that influence the abundance of aerosols and their size distribution, the most important variables for particles to act as cloud condensation nuclei (CCN), along a latitudinal gradient from 35°S to 75°S. Moreover, we use a cloud parcel model to estimate the cloud droplet number concentration and cloud maximum supersaturation (SS) based on the particles’ size distribution, hygroscopicity and measured updraft velocities.

Based on the latitudinal gradient of observed CCN, which features a distinct minimum around 60°S, and the carbon monoxide mixing ratios, which reach background levels south of 60°S indicating absence of anthropogenic influence, we compare aerosol properties north and south of this latitude. The northern aerosol population features two distinct Aitken modes, a nucleation mode and a mode with a Hoppel minimum around 60 nm. The presence of cyclones reduces the particle number concentrations over all diameters. We also observe a stronger Aitken mode presence in unstable boundary layer conditions, where downward mixing of freshly formed particles in the outflow of clouds in the free troposphere can occur. The southern population features only three modes, a nucleation mode and two distinct bimodal distributions with Hoppel minima around 70 nm. Only in stable boundary layer conditions an Aitken mode emerges in the 75th percentile that is larger in particle number than the accumulation mode, pointing towards a potential source of condensable vapors from the ocean surface that grow the Aitken mode, leading to observably higher kappa values. The Aitken mode is further associated with air masses with relatively less depletion in d18O, pointing towards a marine source further north.

The cloud droplet number concentration simulations feature the same latitudinal pattern as the measured CCN with the “dip” around 60°S. This is consistent with droplet observations from satellites. Interestingly, the simulated cloud maximum SS tends to increase with latitude, from roughly 0.27% at 40°S towards 0.43% at 75°S. To estimate the sensitivity of clouds towards available aerosol particles, we form the ratio of the particle number concentration larger than the observed Hoppel minimum over the simulated cloud droplet number concentrations. We find that clouds north and south of 60°S experience elevated sensitivity (ratio < 1) to aerosol concentrations in 23 % and 27 % of the time, respectively. This demonstrates that the Southern Ocean cloud regime is indeed sensitive to aerosol number and size distributions, which in turn are influenced by synoptic features (e.g., cyclones) and marine boundary layer stability. On the other hand, frequent occurrence of low SS, demonstrates that cloud formation is also often updraft limited.

How to cite: Schmale, J., Nenes, A., Thurnherr, I., Henning, S., Tatzelt, C., Baccarini, A., and Gysel-Beer, M.: Aerosol size distribution variability over the Southern Ocean: implications for cloud droplet number concentrations, EGU General Assembly 2024, Vienna, Austria, 14–19 Apr 2024, EGU24-5460, https://doi.org/10.5194/egusphere-egu24-5460, 2024.

EGU24-5996 | ECS | Orals | AS3.10

Coupled 3D radiation deepens cumulus clouds without changing the mean surface solar irradiance 

Mirjam Tijhuis, Bart van Stratum, and Chiel van Heerwaarden

Most atmospheric models consider radiative transfer only in the vertical direction (1D), as 3D radiative transfer calculations are too costly. Thereby, horizontal transfer of radiation is omitted, resulting in incorrect surface radiation fields. Previous work on 3D radiative effects mainly used uncoupled 3D radiative transfer. In our current work, we study the impact of coupled 3D radiative transfer on the development of clouds, and the resulting impact on the domain average surface solar irradiance.

We performed a series of realistic Large-Eddy simulations with MicroHH. We developed the option to use aerosol data from the CAMS global reanalysis to include the interactions between aerosols and radiation in our LES simulations. This makes sure our simulated radiation is in line with observations. To investigate the impact of 3D radiative transfer, we selected 12 days on which shallow cumulus clouds formed over Cabauw, the Netherlands. For each day, we performed simulations with 1D radiative transfer and with a coupled ray-tracer. The simulations with the coupled ray-tracer also include the results of uncoupled 1D radiative transfer. This allows us to compare the differences between 1D and 3D radiative transfer when the clouds are the same.  

In general, our simulations with coupled 3D radiative transfer have a higher domain average liquid water path compared to our simulations with coupled 1D radiative transfer. The cloud cover is similar in both simulations, but the cloud size is increased in the simulations with coupled 3D radiative transfer. For the domain average radiation, we find that 3D radiative transfer in general decreases the direct radiation and increases the diffuse radiation, but the net effect is on average less than 1 W m-2. We can explain the differences in radiation when we look separately at the direct and diffuse radiation, the uncoupled 3D effects, and the impact of the change in the clouds. The uncoupled effect of 3D radiative transfer is an increase in global radiation, which is counteracted by a decrease is global radiation caused by the change in clouds.

How to cite: Tijhuis, M., van Stratum, B., and van Heerwaarden, C.: Coupled 3D radiation deepens cumulus clouds without changing the mean surface solar irradiance, EGU General Assembly 2024, Vienna, Austria, 14–19 Apr 2024, EGU24-5996, https://doi.org/10.5194/egusphere-egu24-5996, 2024.

EGU24-6013 | Posters on site | AS3.10

Determining the influence of fluorescent primary biological aerosol particles on low-level Arctic clouds 

Paul Zieger, Gabriel Pereira Freitas, Ben Kopec, Kouji Adachi, Radovan Krejci, Dominic Heslin-Rees, Karl Espen Yttri, Alun Hubbard, and Jeffrey M. Welker

Mixed-phase clouds are integral to the Arctic climate system as they regulate the energy transport to and from the surface. Their ice content, which influences the cloud's optical and physical properties, is regulated by the presence of ice nucleating particles (INP).  Despite this, knowledge of the sources and concentrations of INP in the Arctic is notably lacking.  Here, we investigate the abundance and variability of fluorescent primary biological aerosol particles (fPBAP) within cloud residuals at a key site at 79° North over an entire year. fPBAP have been found to be active INP at warmer temperatures. Samples were continuously collected using a multiparameter bioaerosol spectrometer coupled to a ground-based counterflow virtual impactor inlet at the Zeppelin Observatory in Ny-Ålesund, Svalbard. We found that fPBAP concentrations within cloud residuals closely aligned with the expected concentration of high-temperature INP. Transmission electron microscopy confirmed the presence of fPBAP, likely bacteria, in the cloud residual samples. Seasonal analysis demonstrated a higher presence of fPBAP within cloud residuals over the summer, with water vapor isotope measurements revealing a connection between summer cloud formation and regionally sourced air masses. Low-level MPC were predominantly observed at the beginning and end of summer, possibly due to the presence of high-temperature INP. Our study - currently under interactive discussion* - provides observational evidence supporting the role of fPBAP in determining the phase of low-level Arctic clouds, with implications for the composition of respective cloud condensation nuclei sources in the future under rapid Arctic climate and environmental change.

*Pereira Freitas, G., Kopec, B., Adachi, K., Krejci, R., Heslin-Rees, D., Yttri, K. E., Hubbard, A., Welker, J. M., and Zieger, P. 2023: Contribution of fluorescent primary biological aerosol particles to low-level Arctic cloud residuals, EGUsphere [preprint], https://doi.org/10.5194/egusphere-2023-2600.

How to cite: Zieger, P., Pereira Freitas, G., Kopec, B., Adachi, K., Krejci, R., Heslin-Rees, D., Yttri, K. E., Hubbard, A., and Welker, J. M.: Determining the influence of fluorescent primary biological aerosol particles on low-level Arctic clouds, EGU General Assembly 2024, Vienna, Austria, 14–19 Apr 2024, EGU24-6013, https://doi.org/10.5194/egusphere-egu24-6013, 2024.

EGU24-6816 | ECS | Orals | AS3.10

Observations of ambient aerosol and warm cloud formation in a New Mexico summer deep-convection system 

Huihui Wu, Nicholas Marsden, Paul Connolly, Michael Flynn, Paul Williams, Graeme Nott, Kezhen Hu, Declan Finney, Navaneeth Thamban, Keith Bower, Alan Blyth, Thomas Choularton, Martin Gallagher, and Hugh Coe

Aerosol particles can affect the formation and properties of clouds by acting as cloud condensation nuclei (CCN) and ice nucleating particles (INP). The accurate representation of aerosol size distribution and composition along with cloud nucleating properties play an important role in describing aerosol-cloud interactions. The Deep Convective Microphysics Experiment (DCMEX) is a project aimed at improving the representation of microphysical processes in deep convective clouds. The DCMEX campaign (July to Aug 2022) was conducted using the UK FAAM (Facility for Airborne Atmospheric Measurements) BAe-146 Atmospheric Research Aircraft and characterized the aerosol-cloud system over the isolated Magdalena Mountain region in New Mexico. The aircraft was equipped with a range of online instruments to measure aerosol chemical composition (i.e., Aerosol Mass Spectrometry, AMS; Laser Ablation Aerosol Particle Time of Flight mass spectrometry, LAAPToF) and aerosol size distributions, as well as cloud microphysics.

A 6-days backward dispersion analysis of this region shows that the air source flow transferred from Northwest (NW, California coast) to Southeast (SE, Gulf of Mexico) during the campaign period. This air mass source change coincided with changes in meteorological parameters including such as enhancement of convection available potential energy (CAPE), decreased cloud-base height, and increased boundary layer humidity. The aerosol size distribution and chemical composition in out-of-cloud runs also show variations under different air mass source conditions. Larger sulphate and lower organic contributions were observed in the sub-micron (<1 μm) aerosol mass fraction in the SE airflow when compared to flow from the NW, with the organic components more oxidized. The LAAPToF single particle measurements (0.5-2.5 μm) indicate more aged sea salt in number fraction within the SE ocean flow. The calculated kappa values suggest more hygroscopic aerosols with the source transfer. Number size distributions indicate enhanced Aiken-mode particles when the air mass source changed.

A bin-microphysics model was employed to simulate the warm cloud development in this convective system. The simulation results show that both the change of aerosol characteristics and cloud-base conditions affect the warm cloud development, which follow the trends seen in the cloud microphysics observations. Initial cloud base conditions (i.e., initial temperature and relative humidity) mainly affected cloud properties by altering the water mixing ratios while aerosol characteristics mainly affected the initial cloud droplet number concentrations.

Next, we will combine these online aerosol measurements with detailed cloud microphysical measurements and offline INP analysis, to investigate the contributory effect of aerosols on primary ice formation in this deep-convection system and their relationship to secondary ice production processes.

How to cite: Wu, H., Marsden, N., Connolly, P., Flynn, M., Williams, P., Nott, G., Hu, K., Finney, D., Thamban, N., Bower, K., Blyth, A., Choularton, T., Gallagher, M., and Coe, H.: Observations of ambient aerosol and warm cloud formation in a New Mexico summer deep-convection system, EGU General Assembly 2024, Vienna, Austria, 14–19 Apr 2024, EGU24-6816, https://doi.org/10.5194/egusphere-egu24-6816, 2024.

EGU24-6913 | ECS | Posters on site | AS3.10

Hysteresis in water content of ultrafine glassy organic aerosols: Evidence from laboratory and modelling study 

Manqiu Cheng, Mikinori Kuwata, and Ying Li

Water content of aerosol particles is important for atmospheric impacts, such as radiative effects and chemical reactivity. Traditionally, crystalline inorganic aerosol particles such as NaCl were known to experience hysteresis in water content, meaning that hygroscopic growth depends on exposure history to water vapor. On the contrary, past laboratory studies for organic aerosol reported absence of hysteresis, especially for ultrafine size range. Here, we show that water contents for ultrafine organic aerosol particles have hysteresis at sub-0 °C. Hygroscopic growth of monodisperse ultrafine particles (diameter = 40, 100, and 200 nm) of sucrose and glucose were investigated for the temperature range of -21 °C to +23 °C. Hygroscopic growth of these particles did not exhibit any hysteresis process at +23 °C, consistent with literature. However, hygroscopic growth of these particles was different for hydration and dehydration experiments at sub-0 °C, demonstrating the occurrence of hysteresis. The lowest relative humidity (RH), at which the two modes of experiments provided the same water content, was defined as merge RH. Merge RH was approximately the same as that for the glass transition point, demonstrating that water diffusion in a highly viscous matrix of organic aerosols is the key for the occurrence of hysteresis. Employment of a kinetic multilayer model provided quantitative prediction of merge RH as a function of temperature, particle size, and residence time. Considering the temperature and RH range of Earth’s atmosphere, we hypothesize that hysteresis in organic aerosol ubiquitously occur in the upper troposphere.

How to cite: Cheng, M., Kuwata, M., and Li, Y.: Hysteresis in water content of ultrafine glassy organic aerosols: Evidence from laboratory and modelling study, EGU General Assembly 2024, Vienna, Austria, 14–19 Apr 2024, EGU24-6913, https://doi.org/10.5194/egusphere-egu24-6913, 2024.

The lifetime of clouds has an important influence on radiation balance, atmospheric matter cycling, and global precipitation patterns. However, current assessments of cloud lifetime rely on statistical methods, underscoring the need for effective observational techniques. Moreover, existing research predominantly centers on precipitation removal, neglecting the process of cloud dissipation.Utilizing optical tweezers-Raman spectroscopy technology and CCD real-time imaging, this study conducts experiments on the evaporation of individual suspended droplets with a series of concentration gradients. We establish a method for quantifying the evaporation time of microdroplets, and characterize their evaporation dynamics through the temporal variation of OH-stretching Raman peak. Our research reveals the substantial influence of droplet solute concentration on evaporation time, indicating that even minute variations in solute concentration within cloud droplets can induce profound disparities in their lifetime.Furthermore, alterations in environmental relative humidity also have an impact on the dissipation of cloud droplets. These findings hold critical scientific significance, enhancing our understanding of cloud lifetime and providing a scientific foundation for accurately simulating cloud generation and dissipation processes in numerical models.

How to cite: Guo, S. and Zhao, C.: Advancing Cloud Science: Exploring the Lifetime of Indiviual Cloud Droplets through Aerosol Optical Tweezers and Raman Spectroscopy, EGU General Assembly 2024, Vienna, Austria, 14–19 Apr 2024, EGU24-7092, https://doi.org/10.5194/egusphere-egu24-7092, 2024.

EGU24-7148 | ECS | Posters on site | AS3.10

Probing pH of Particle in HCO3-/CO32- System through Optical Tweezers Coupled with Raman Spectroscopy 

Chengyi Fan and Chunsheng Zhao

Acidity stands as a pivotal physicochemical parameter influencing aerosol particles, impacting their morphology and environmental interactions, such as phase separation and the formation of secondary organic aerosols. However, directly measuring particles pH remains a challenge, necessitating urgent exploration. This study utilizes optical tweezers to investigate and compare methods for measuring pH of particle. Initial steps involved preparing a solution with sodium carbonate and sodium bicarbonate system, followed by measurement of ion concentration calibration curves for HCO3- and CO32-. Droplets were then generated using an atomizer and prepared solution. A single-beam Gaussian optical tweezers captured individual particles and obtained their Raman spectra in conjunction with a Raman spectrometer. Four methods—Henderson-Hasselbalch equation, Debye-Hückel theory, specific ion interaction theory, and thermodynamic model—were then applied to calculate pH values based on HCO3-/CO32- conjugate acid/base pairs and ion concentration calibration curves. The experimental results demonstrated small error in each calculated pH value. Additionally, the study revealed a rapid decomposition process of HCO3- in droplets, possibly attributed to the high specific surface area of small droplets or the absence of CO2 in the optical tweezers chamber. The study also monitored the evolution of pH values in sodium bicarbonate particles over time. Furthermore, the study investigated difference in pH values calculated by the four calculation methods under different ion strengths and pH values. The study also measured the pH value of sodium carbonate particles in relation to relative humidity. Overall, the experimental outcomes were reasonable and validated the capability of optical tweezers in probing the pH of atmospheric particles, offering insights into the applicable conditions of different methods and directions for refining thermodynamic models.


How to cite: Fan, C. and Zhao, C.: Probing pH of Particle in HCO3-/CO32- System through Optical Tweezers Coupled with Raman Spectroscopy, EGU General Assembly 2024, Vienna, Austria, 14–19 Apr 2024, EGU24-7148, https://doi.org/10.5194/egusphere-egu24-7148, 2024.

EGU24-8451 | ECS | Posters on site | AS3.10

Comparison between model and observational cloud fraction adjustment using explainable machine learning 

Yichen Jia, Hendrik Andersen, and Jan Cermak

This ongoing study uses machine learning to quantify and compare observation- and global climate model-based sensitivities of cloud fraction (CF) for marine boundary layer clouds (MBLCs) to atmospheric aerosols. In addition, differences in the meteorological influence on these sensitivities between the model and observation are examined.

Aerosol-cloud interactions in MBLCs remain one of the most substantial sources of uncertainties in climate simulations. Recent studies have reported that climate forcing from an increase in low-level liquid cloud fraction due to aerosol perturbations may be dominant. However, the impact of ambient meteorological conditions on the aerosol influence on CF continues to pose challenges as their covariability and interactions obscure the quantification of the aerosol–CF relationship.

We established a data-driven framework based on cloud droplet number concentration (Nd, as a proxy for aerosol) and CF retrieved from Moderate Resolution Imaging Spectroradiometer (MODIS) and meteorological parameters from the European Centre for Medium-Range Weather Forecasts Reanalysis v.5 (ERA5). The eXtreme Gradient Boosting (XGBoost) machine learning is applied to the daily collocated MODIS-ERA5 data (2011-2019) from 60°N to 60°S to predict CF with Nd and meteorological predictors. The Nd–CF sensitivity and its dependence on meteorological factors are quantified by SHapley Additive exPlanation (SHAP) values and SHAP interaction values. We found that both CF sensitivities and their interactions with meteorology derived from the SHAP approach exhibit distinct and coherent regional characteristics.

The ongoing work is intended to implement an identical XGBoost-SHAP setup on outputs from the ICOsahedral Non-hydrostatic-Hamburg Aerosol Module (ICON–HAM) global atmospheric-aerosol model, and to compare the magnitudes and geographical patterns of the sensitivities and interactive effects derived from observations with those from ICON-HAM. Discrepancies may point to the physics parameterization schemes in ICON-HAM which may need further evaluation of their representativity with respect to relevant processes. This novel explainable machine learning framework can potentially provide insights into parameterization tuning and enhance our knowledge of the complex aerosol-cloud-climate system.

How to cite: Jia, Y., Andersen, H., and Cermak, J.: Comparison between model and observational cloud fraction adjustment using explainable machine learning, EGU General Assembly 2024, Vienna, Austria, 14–19 Apr 2024, EGU24-8451, https://doi.org/10.5194/egusphere-egu24-8451, 2024.

EGU24-8917 | Orals | AS3.10

Cloud drop activation of insoluble particles: impact of surface properties 

Ari Laaksonen, Linnea Mustonen, Ana A. Piedehierro, Yrjö Viisanen, and André Welti

A number of studies have reported experimental CCN activation properties of water insoluble particles, mainly various minerals and soots, during the past decade or so (e.g. Kumar et al., 2011; Lathem et al., 2011, Dalirian et al., 2018). A popular theoretical framework for interpreting the results is the FHH adsorption activation theory (Sorjamaa and Laaksonen, 2007), which is a combination of the two-parameter FHH adsorption isotherm model and the Kelvin equation. However, it has become clear that the FHH activation theory tends to overpredict critical supersaturations quite substantially when the FHH parameters are determined from experimental water adsorption isotherms (Laaksonen et al., 2016; Hatch et al., 2019). A possible reason for the discrepancy is surface roughness of the particles, not accounted for in the FHH adsorption activation theory (Laaksonen et al., 2016). One way to quantify the extent of the surface roughness is through the surface fractal dimension, which can be determined e.g. with the help of nitrogen adsorption measurements. We showed earlier (Laaksonen et al., 2016) that employing the surface fractal dimension within the FHH framework does seem to improve the theoretical predictions. However, our data for water and nitrogen adsorption measurements were obtained from literature sources, and therefore the surface properties of a given mineral species employed in the adsorption measurements and in the CCN experiments were not necessarily similar. Therefore, the uncertainty limits of the surface fractal dimension -corrected predictions were rather high. Here, we compare theoretical and experimental critical supersaturations for several metal oxide and mineral aerosols. The materials used in the water and nitrogen adsorption measurements are the same as those used in the CCN experiments, allowing us to improve the reliability of our conclusions regarding the quality of the theoretical predictions.   

Dalirian, M, Ylisirniö, A., Buchholz, A., Schlesinger, D., Ström, J., Virtanen, A. and Riipinen, I. (2018). Cloud droplet activation of black carbon particles coated with organic compounds of varying solubility.  Atmos. Chem. Phys. 18, 12477-12489.

Hatch, C.D., Tumminello, P.R., Cassingham, M.A., Greenaway, A.L., Meredith, R. and Christie, M.J. (2019). Technical note: Frenkel, Halsey and Hill analysis of water on clay minerals: toward closure between cloud condensation nuclei activity and water adsorption. Atmos. Chem. Phys. 19, 13581-13589.

Kumar, P, Sokolik, I.N. and A. Nenes, A (2011). Measurements of cloud condensation nuclei activity and droplet activation kinetics of fresh unprocessed regional dust samples and minerals. Atmos. Chem. Phys. 11, 3527–3541.

Laaksonen, A., Malila, J. and Nenes A (2016). Surface fractal dimension, water adsorption efficiency, and cloud nucleation activity of insoluble aerosol. Sci. Rep. 6, 25504.

Lathem, T., Kumar, P., Nenes, A., Dufek, J., Sokolik, I.N., Trail, M. and Russell, A. (2011). Hygroscopic properties of volcanic ash. Geophys. Res. Lett. 38, L11802.

Sorjamaa, R. and Laaksonen A. (2007). The effect of H2O adsorption on cloud drop activation of insoluble particles: a theoretical framework. Atmos. Chem. Phys. 7, 6175–6180.

How to cite: Laaksonen, A., Mustonen, L., Piedehierro, A. A., Viisanen, Y., and Welti, A.: Cloud drop activation of insoluble particles: impact of surface properties, EGU General Assembly 2024, Vienna, Austria, 14–19 Apr 2024, EGU24-8917, https://doi.org/10.5194/egusphere-egu24-8917, 2024.

This study employed the WRF-Chem-SBM model which couples spectral-bin cloud microphysics (SBM) and online aerosol module (MOSAIC) to investigate aerosol-cloud interactions in liquid-phase clouds over eastern China and its adjacent oceans. The results indicate that with an increase in aerosol number concentration (Na), cloud droplet number concentration (Nd) exhibits a trend of initially increasing and then decreasing, both over land and ocean. The difference lies in the stronger convective and land surface effects over land, leading to more intense activation, while over the ocean, weaker supersaturation and richer water vapor content result in weaker activation but more favorable conditions for cloud droplet growth. Cloud processes over land are more intense than over the ocean, but the cloud liquid water content (CLWC) in both regions shows a similar trend with the variation of Nd. In precipitating clouds with richer water content and stronger intracloud processes, as Nd increases, the cloud droplet effective radius decreases, and CLWC exhibits a gradual increase followed by a rapid decrease. In non-precipitating clouds with lower water content and weaker intracloud processes, the increase in Nd leads to a more gradual growth of CLWC, and the subsequent decrease in CLWC is also more subtle. Furthermore, this study discusses the impact of meteorological and aerosol conditions on aerosol activation and cloud development. Environments with a moderate Na are more conducive to aerosol activation, while in environments with low to moderate Na, CLWC exhibits faster growth. Compared to humidification, cooling has a more significant effect on aerosol activation and CLWC growth.

How to cite: Zhao, J., Ma, X., Quaas, J., and Jia, H.: Exploring aerosol-cloud interactions in liquid-phase clouds over eastern China and its adjacent ocean using the WRF-Chem-SBM model, EGU General Assembly 2024, Vienna, Austria, 14–19 Apr 2024, EGU24-9292, https://doi.org/10.5194/egusphere-egu24-9292, 2024.

EGU24-9408 | ECS | Posters on site | AS3.10

WRFChem Simulation of Aerosol perturbation on Outgoing Longwave Radiation over West Africa's Heterogeneous Landscapes 

Ayodeji Oluleye, Julius Akinyoola, Ezekiel Imole Gbode, and Mariano Mertens

Outgoing Longwave Radiation (OLR) across West Africa is characterized by significant variability as a consequence of the region's diverse landscape or landuse/landcover and the influence of various climatic drivers. This study revealed spatiotemporal patterns of OLR over West Africa, aiming to enhance our understanding through the assessment of the WRF-Chem model's ability to accurately capture these dynamic processes. CAMS reanalysis dataset was used to scrutinizing the model's performance on a regional scale. Two experiments were also conducted to investigate non-aerosol and aerosol perturbation on OLR variability in the region. 

Our findings revealed a distinctive spatial heterogeneity in OLR across West Africa, particularly during different seasons. Notably, during the June-July-August (JJA) period, the Guinea coast exhibited lower OLR values (160 – 195 W/m²) attributable to dense cloud cover, increased precipitation, and elevated water vapor content. In contrast, the Sahel and Sahara Desert regions displayed an average OLR value of 225 W/m², associated with lower humidity and precipitation levels. The December-January-February (DJF) and March-April-May (MAM) seasons revealed higher OLR values (255 W/m²) in the Sahel and Sahara Desert, attributed to clear skies and reduced humidity. The evaluation of the WRF-Chem model demonstrated its competency in reproducing observed data, evidenced by a positive correlation and relatively low Root Mean Square Error (RMSE). Variations in model performance across different data points and seasonal periods were indicated by the Standard Deviation. Trend analyses also indicated an increasing trend and variability in OLR values from February to August in the Guinea Coast and Sahara Desert, contrasting with a decreasing trend in the Sahel region. In a pristine atmosphere devoid of aerosol perturbation, OLR exhibited less variability and greater consistency from the Guinea coast to the Sahara Desert, with occasional extreme values noted in the latter. Conversely, periods of aerosol perturbation revealed a wider range of OLR values, signifying increased variability influenced by aerosol-induced alterations to the atmosphere's radiative balance and energy exchange.

The study concludes that the influence of aerosol perturbations emerges as a key factor, introducing heightened variability in OLR values, which holds implications for our understanding of radiative processes in this region.

How to cite: Oluleye, A., Akinyoola, J., Imole Gbode, E., and Mertens, M.: WRFChem Simulation of Aerosol perturbation on Outgoing Longwave Radiation over West Africa's Heterogeneous Landscapes, EGU General Assembly 2024, Vienna, Austria, 14–19 Apr 2024, EGU24-9408, https://doi.org/10.5194/egusphere-egu24-9408, 2024.

EGU24-9453 | Posters on site | AS3.10

Ice-nucleating particles over the Labrador Sea during the M-Phase campaigns 

Mark D. Tarn, Polly B. Foster, Sam J. Clarke, James B. McQuaid, Joseph Robinson, Erin N. Raif, Sarah L. Barr, Katherine H. Bastin, Kathleen A. Thompson, Zongbo Shi, Richard Cotton, Paul R. Field, Keith N. Bower, Martin W. Gallagher, Thomas Choularton, and Benjamin J. Murray

As the Earth warms, it is important to understand how a change in the ice:water ratio in mixed-phase clouds influences the cloud-phase feedback; a cooling effect caused by the change in albedo of the cloud. Ice-nucleating particles (INPs), aerosols that can trigger the freezing of liquid cloud droplets via heterogeneous nucleation, may regulate this cooling process by maintaining the ice contents in clouds, hence it is necessary to identify the types, sources, and concentrations of INPs to determine their contribution and better represent this in models. We undertook ship and aircraft-based INP measurement campaign in the Labrador Sea region, which features clouds that are susceptible to the effect of INPs, in 2022: (i) a cruise on the RRS Discovery, as part of a joint SEANA/M-Phase project in May-June, and (ii) a flight campaign on the FAAM BAe-146 aircraft as part of the M-Phase project in October-November that focused on northwesterly cold air outbreak (CAO) cloud systems.

During the SEANA/M-Phase ship cruise, real-time measurements of INP concentrations were taken using a Portable Ice Nucleation Experiment (PINE) expansion chamber alongside offline filter-based measurements and bulk seawater measurements. Preliminary results suggest that high INP concentrations correlated with air masses that had passed over the exposed (i.e. not snow- or ice-covered) coastline of Greenland, while lower concentrations correlated with air masses that had passed over the sea ice. These results suggest a high-latitude source of INPs not currently accounted for in models, the study of which could be crucial in understanding their influence on clouds in a changing climate.

Offline filter-based INP measurements during the FAAM aircraft campaign showed highly reproducible INP concentrations during CAO events (0.05 INP L−1 at −15 °C), with both much higher and much lower concentrations during non-CAO days. Further analysis will include further processing of the campaign data, including aerosol size distributions together with real-time INP data taken from a new online continuous flow diffusion chamber (CFDC), the Met Office Ice Nuclei Counter (INC), aboard the aircraft, together with aerosol composition analysis via scanning electron microscopy of filters, which will allow the types and sources of INPs in the Labrador Sea region to be established.

The M-Phase campaigns in the Labrador Sea have shed some light on INP properties in the region, and further processing of the data will allow determination of INP sources, activity, and relationship with aerosol size distributions. Better representation of INPs in models based on these findings will allow for reduced uncertainty in the cloud-phase feedback and its impact on climate predictions.

How to cite: Tarn, M. D., Foster, P. B., Clarke, S. J., McQuaid, J. B., Robinson, J., Raif, E. N., Barr, S. L., Bastin, K. H., Thompson, K. A., Shi, Z., Cotton, R., Field, P. R., Bower, K. N., Gallagher, M. W., Choularton, T., and Murray, B. J.: Ice-nucleating particles over the Labrador Sea during the M-Phase campaigns, EGU General Assembly 2024, Vienna, Austria, 14–19 Apr 2024, EGU24-9453, https://doi.org/10.5194/egusphere-egu24-9453, 2024.

EGU24-11095 | ECS | Orals | AS3.10

Surface climate response to the size and season of northern hemisphere, high latitude, effusive volcanic eruptions 

Tómas Zoëga, Trude Storelvmo, and Kirstin Krüger

Effusive volcanic eruptions are known to impact climate through the emission of sulphur dioxide and subsequent formation of sulphate aerosols. These aerosols affect radiative transfer in the atmosphere, both directly by scattering sunlight and indirectly through aerosol-cloud interactions. By scattering sunlight, the direct aerosol effect leads to surface cooling. Changes in cloud properties as a result aerosol-cloud interactions, on the other hand, lead to both reflection of sunlight and trapping of outgoing thermal emissions from the ground. Clouds, therefore, have the potential to either cause surface warming or cooling, depending on factors such as the cloud response to the volcanic aerosols and the availability of sunlight.

We perform a series of simulations using the Community Earth System Model with the Community Atmosphere Model (CESM2-CAM6) to simulate the climate impacts of northern hemisphere, high latitude, effusive volcanic eruptions. We construct a standard eruption scenario, using the 2014-15 Holuhraun eruption in Iceland as a reference. The Holuhraun eruption released up to 9.6 Tg SO2 over a period of six months, from September 2014 to February 2015, with the emission rate gradually decreasing over time. We apply several different magnitude scalings to this standard scenario and vary the timing of the eruption. This allows us to analyse the climate response as a function of both the eruption size and season.

For eruptions starting in winter, we find significant surface warming in our simulations as a result of trapping of outgoing thermal emissions in the absence of sunlight. This warming is mainly confined to the Arctic but also appears over parts of northern Eurasia and North-America, albeit to a lesser extent. This is consistent with our previous work on the Holuhraun eruption where we found evidence for winter surface warming over the Greenland Sea as a result of that eruption, both in model simulations and observations.

Conversely, we find surface cooling during summertime eruptions. The spatial distribution of the cooling pattern is different from the winter warming as the cooling predominantly occurs over the Eurasian and North-American continents and is hardly visible in the Arctic. Furthermore, based on preliminary results, whereas the Arctic winter warming is mainly due to aerosol-cloud interactions, the continental summer cooling stems mostly from the direct aerosol effect. Our results indicate a non-linear relationship between the surface air temperature response and the eruption size.

How to cite: Zoëga, T., Storelvmo, T., and Krüger, K.: Surface climate response to the size and season of northern hemisphere, high latitude, effusive volcanic eruptions, EGU General Assembly 2024, Vienna, Austria, 14–19 Apr 2024, EGU24-11095, https://doi.org/10.5194/egusphere-egu24-11095, 2024.

EGU24-11712 | ECS | Orals | AS3.10

A cloud-by-cloud approach for studying aerosol-cloud interaction in satellite observations  

Fani Alexandri, Felix Müller, Goutam Choudhury, Peggy Achtert, Torsten Seelig, and Matthias Tesche

Aerosol-cloud interactions are of central importance for understanding climate processes but remains the largest uncertainty associated with climate change. Hence, the effective radiative forcing (ERF) due to ACI and rapid adjustments (ERFaci) is still assessed only with medium confidence. An important part of this uncertainty originates from the difficulty of quantifying ACI using observations, especially for ice-containing clouds. In this study, we present a novel Cloud-by-Cloud (CxC) approach for studying ACI in satellite observations that merges properties of individual clouds that have been tracked from geostationary satellite observations with height-resolved concentrations of cloud condensation nuclei (nCCN) and ice nucleating particles (nINP) from polar-orbiting lidar data. This approach lays the foundations for better understanding of ACI through a thorough investigation of matched aerosol-cloud cases at cloud level. The methodology is applied to satellite observations over Central Europe and Northern Africa for several years, resulting in a bottom-up dataset of combining parameters that can be stratified accordingly for assessing the impact of changes in cloud-relevant aerosol concentrations on the surrounding quality assured liquid and ice-containing clouds. The first preliminary results of this novel CxC approach are promising and constitute a step forward in the quantification of ERFaci from space.

How to cite: Alexandri, F., Müller, F., Choudhury, G., Achtert, P., Seelig, T., and Tesche, M.: A cloud-by-cloud approach for studying aerosol-cloud interaction in satellite observations , EGU General Assembly 2024, Vienna, Austria, 14–19 Apr 2024, EGU24-11712, https://doi.org/10.5194/egusphere-egu24-11712, 2024.

The role of aerosol and aerosol-cloud interactions (ACI) in the Earth system is a major source of uncertainty in projections of Earth’s future climate and in interpreting how the climate has evolved in the past. The “Enabling Aerosol-cloud interactions at GLobal convection-permitting scalES (EAGLES)” project aims to achieve unprecedented realism in predictions of aerosol and ACI in the next-generation Earth system models. The effort includes improving the representation of aerosol and ACI processes with physics-based or data-driven methods, readying the parameterizations for kilometer-scale simulations, and constraining the model using process-oriented diagnostics based on both satellite and in-situ measurements. By combining process models, large-eddy simulations, and observational data from ARM, satellites, and other sources, stubborn model biases associated with resolution and physics have been addressed accordingly. We demonstrate that improved atmospheric simulations can be achieved with better physics, better integration with data, and better software. We also identify new opportunities for improvements.

How to cite: Ma, P.-L.: Enabling Aerosol-cloud interactions at GLobal convection-permitting scalES (EAGLES), EGU General Assembly 2024, Vienna, Austria, 14–19 Apr 2024, EGU24-12164, https://doi.org/10.5194/egusphere-egu24-12164, 2024.

EGU24-12184 | ECS | Posters on site | AS3.10 | Highlight

In-situ optical characterization of ice fog and diamond dust events at DOME-C, Antarctica 

Adrian Hamel, Massimo del Guasta, Emma Järvinen, and Martin Schnaiter

In-situ measurements of small atmospheric ice crystals (< 100 µm) on the Antarctic plateau are rare. Yet, small ice crystals are abundant in a region that often reaches cirrus temperatures even in the warmest season. The Particle Phase Discriminator (PPD-2K) was deployed on DOME-C, Antarctica during austral summer 2023/2024. It was used to characterize the microphysical and optical properties of individual ice fog and diamond dust ice crystals having sizes between approximately 10 and 100 µm. These properties included particle concentration, size distribution and spatial light scattering patterns in the forward direction that allow the analysis of the particle sphericity (particle phase), shape and crystal complexity.
The atmospheric ice crystals on the Antarctic plateau commonly appear in form of ice fogs that have an effect on the radiative budget. In this presentation an ice fog event occurring between 26.11.2023 and 27.11.2023 is analyzed in detail using additional data from LIDAR, temperature and humidity sensors operated at DOME-C. The results are compared to previous findings in Antarctica and to ice fog measurements with the same instrument in a polluted environment at Fairbanks, Alaska.

How to cite: Hamel, A., del Guasta, M., Järvinen, E., and Schnaiter, M.: In-situ optical characterization of ice fog and diamond dust events at DOME-C, Antarctica, EGU General Assembly 2024, Vienna, Austria, 14–19 Apr 2024, EGU24-12184, https://doi.org/10.5194/egusphere-egu24-12184, 2024.

EGU24-12776 | ECS | Posters on site | AS3.10

Study of cloud droplet formation and growth under turbulent conditions in LACIS-T 

Svetlana Melnik, Silvio Schmalfuß, Frank Stratmann, Mira Pöhlker, and Dennis Niedermeier

The study of cloud formation is a crucial aspect of understanding the Earth's weather and climate system. Cloud droplet formation, growth, and the resulting size distributions are influenced by various atmospheric conditions. Despite extensive research, the impact of turbulence on droplet formation and growth remains incompletely understood.

To address this knowledge gap, we investigated the effect of turbulent saturation fluctuations on these mentioned processes. The respective study was conducted using the turbulent Leipzig Aerosol Cloud Interaction Simulator (LACIS-T, Niedermeier et al., 2020) which is a closed-loop, moist-air wind tunnel. LACIS-T is an ideal facility for pursuing mechanistic understanding of these processes and interactions under well-defined and reproducible laboratory conditions.

In LACIS-T, by mixing of three conditioned air streams (i.e. two particle-free air streams, and one aerosol stream), it is possible to precisely adjust temperature and water vapor fields so as to achieve various (super)saturation levels. A passive or active grid are used to introduce turbulence.

In our study, we examined the growth of size-selected monodisperse NaCl particles under various conditions of saturation and temperature at different turbulence patterns. Results of the study provide new experimental insights into the effect of turbulence on cloud droplet formation, growth, and consequently, the shape of cloud droplet size distributions.

Niedermeier et al. (2020), Atmos. Meas. Tech., 13, 2015-2033, https://doi.org/10.5194/amt-13-2015-2020.

Keywords: Cloud droplet growth, Droplet size distribution, Turbulence, Saturation fluctuations

How to cite: Melnik, S., Schmalfuß, S., Stratmann, F., Pöhlker, M., and Niedermeier, D.: Study of cloud droplet formation and growth under turbulent conditions in LACIS-T, EGU General Assembly 2024, Vienna, Austria, 14–19 Apr 2024, EGU24-12776, https://doi.org/10.5194/egusphere-egu24-12776, 2024.

The estimation of cloud radiative forcing (RFaci), arising from aerosol-cloud interactions (also known as the first indirect effect), relies on approximating cloud albedo susceptibility (β) to changes in droplet concentration. β depends on both cloud albedo and droplet concentration, which are observable through satellite observations. Typically, satellite data is spatially aggregated to coarser resolutions, such as 1 × 1° scenes. However, at these spatial scales, cloud albedo tends to be heterogeneous, while the β approximation assumes homogeneity. This study demonstrates that the common practice of aggregating satellite data and neglecting cloud albedo heterogeneity results in an average overestimation of 10% in previous RFaci estimates.

How to cite: Goren, T., Sourdeval, O., Kretzschmar, J., and Quaas, J.: Spatial Aggregation of Satellite Observations Leads to an Overestimation of the Radiative Forcing due to Aerosol-Cloud Interactions, EGU General Assembly 2024, Vienna, Austria, 14–19 Apr 2024, EGU24-12779, https://doi.org/10.5194/egusphere-egu24-12779, 2024.

EGU24-12965 | Orals | AS3.10

Evaluating Droplet Size Distribution Evolution in Aerosol-constrained Simulations of Tropical Cumulus Congestus against Airborne Polarimetry Observations 

Bastiaan van Diedenhoven, McKenna Stanford, Ann Frindlind, Andrew Ackerman, Qian Xiao, Jian Wang, Otto Hasekamp, Snorre Stamnes, Brian Cairns, Andrzej Wasilewski, and Mikhail Alexandrov

The evolution of cumulus congestus within tropical oceanic and maritime environments is modulated by the interaction of convective dynamics, liquid- and ice-phase microphysical processes, aerosol loading, and entrainment of ambient environmental air. Characterizing this evolution requires robust observational constraints of aerosol properties and cloud macrophysics and microphysics. The NASA Cloud, Aerosol and Monsoon Processes Philippines Experiment (CAMP2Ex) field campaign in 2019 targeted growing cumulus congestus clouds using airborne in situ and remote sensing platforms. In situ aircraft microphysical measurements and retrievals from the Research Scanning Polarimeter (RSP) both show that cloud droplet number concentrations decrease and effective radius increases with increasing cloud top height, with droplet size distributions (DSDs) that broaden with height. These observed components are responsive to an active collision-coalescence process that produce millimeter-sized drops, onsetting warm-rain formation. Here, we present an analysis of CAMP2Ex RSP data showing the evolution of droplet number concentrations and DSDs with height and its variation with RSP-retrieved aerosol number concentrations. For one case study (RF14, 9/25/2019), we perform large eddy simulations (LES) at 100-m horizontal grid spacing using bin and bulk microphysics schemes. Detailed multi-modal, vertically resolved aerosol measurements from the Fast Integrated Mobility Spectrometer (FIMS) are used as input. The relative ability of the bulk and bin schemes to produce the observed DSD evolution, from activation to warm-rain production, is evaluated. Sensitivity experiments are performed to assess the roles of height-varying aerosol concentrations, rain-forming collision-coalescence, and entrainment in realizing observed droplet number concentration and effective radius profiles. Additionally, we share the prospect of detailed aerosol properties, droplet number concentrations, and DSDs, similar to as acquired by RSP, becoming available from polarimeters on NASA’s PACE satellite mission, launched in early 2024.

How to cite: van Diedenhoven, B., Stanford, M., Frindlind, A., Ackerman, A., Xiao, Q., Wang, J., Hasekamp, O., Stamnes, S., Cairns, B., Wasilewski, A., and Alexandrov, M.: Evaluating Droplet Size Distribution Evolution in Aerosol-constrained Simulations of Tropical Cumulus Congestus against Airborne Polarimetry Observations, EGU General Assembly 2024, Vienna, Austria, 14–19 Apr 2024, EGU24-12965, https://doi.org/10.5194/egusphere-egu24-12965, 2024.

EGU24-14768 | ECS | Posters on site | AS3.10

Cloud Condensation Nuclei (CCN) activity of sub-micron aerosols during the Southwest Monsoon over a pristine site in the Western Ghats, India 

Aishwarya Singh, Kavyashree Kalkura, Rameshchand Ka, Ravikrishna Raghunathan, Ulrich Poschl, Hang Su, James Allan, Gordon Mcfiggans, Meinrat Andreae, Scot Martin, Hugh Coe, Pengfei Liu, and Sachin Gunthe

Aerosols, with their direct and indirect effects impacting the climate, have been established to significantly perturb Earth's radiative budget and hydrological cycle. The climate impact of aerosols is complex and multifaceted, with various factors influencing the combined net effect. The intricacies of aerosol effects, mainly through aerosol-cloud interactions, necessitate precise measurements to reduce the uncertainty in forecasting future climate fluctuations1. Studying their characteristics in pristine settings can provide an enhanced scientific understanding of aerosol impact in background conditions, as opposed to polluted ones2. With this motivation, we conducted a comprehensive field measurement campaign during the second phase of the COVID-induced lockdown in Munnar, a relatively clean high-altitude site in the Western Ghats of India. Munnar is surrounded by lush tea plantations and extensive forest reserves, and tea production and tourism are the major human activities in the area. However, suspended tourist activities due to the pandemic and frequent precipitation during monsoon enabled us to study the ambient aerosol characteristics in near-natural conditions3. This study presents results from the size-resolved Cloud Condensation Nuclei (SR-CCN) measurements conducted along with aerosol size distribution and chemical composition at the Natural Aerosol and Bioaerosol High Altitude Laboratory (NABHA; 10.09 N, 77.06 E; 1605m asl) during the Southwest Monsoon season between June-October 2021. The median number concentration for 10–450nm particles was observed to be 533cm-3, with 357cm-3and 908cm-3 as first and third quartiles, respectively, similar to other pristine locations, such as Amazonia during the wet season4. The average non-refractory particulate matter (NR-PM1) concentration was 2.28±1.81 µg/m3 (mean ± one standard deviation). The SR-CCN measurements were carried out for set supersaturations between 0.1% and 0.85% for particles ranging between 20-350 nm in diameter. The critical dry diameter varied from 60 to 150nm for highest to lowest supersaturation, similar to previously reported studies elsewhere4,5. During the campaign, the efficiency spectra of CCN often reached unity despite organic aerosols dominating the submicron aerosol composition.

Further, hygroscopicity, a particle size and composition function, was investigated using the kappa-Köhler theory. The hygroscopicity parameter, kappa, derived from SR-CCN measurements(kCCN) varied between 0.26 and 0.57. kCCN did not exhibit much variation in the Aitken mode regime (60-80nm) but increased in the accumulation mode (100-160nm), suggesting higher hygroscopic fraction in larger (aged) particles. Assuming a linear mixing of organic and inorganic aerosols, chemically derived hygroscopicity (kchem) was comparable to kCCN, following similar diurnal variation. Further details will be presented.

References:

1.Lohmann, U. & Ferrachat, S. Impact of parametric uncertainties on the present-day climate and on the anthropogenic aerosol effect. AtmosChemPhys (2010).

2.Andreae, M. O. Aerosols Before Pollution. Science (2007).

3.Navasakthi, S., Pandey, A., Bhari, J. S. & Sharma, A. Significant variation in air quality in South Indian cities during COVID-19 lockdown and unlock phases. EnvironMonitAssess (2023).

4.Gunthe, S. S. et al. Cloud condensation nuclei in pristine tropical rainforest air of Amazonia: size-resolved measurements and modeling of atmospheric aerosol composition and CCN activity. AtmosChemPhys (2009).

5.Singh, A. et al. Rapid growth and high cloud-forming potential of anthropogenic sulfate aerosol in a thermal power plant plume during COVID lockdown in India. NPJClimAtmosSci (2023).

How to cite: Singh, A., Kalkura, K., Ka, R., Raghunathan, R., Poschl, U., Su, H., Allan, J., Mcfiggans, G., Andreae, M., Martin, S., Coe, H., Liu, P., and Gunthe, S.: Cloud Condensation Nuclei (CCN) activity of sub-micron aerosols during the Southwest Monsoon over a pristine site in the Western Ghats, India, EGU General Assembly 2024, Vienna, Austria, 14–19 Apr 2024, EGU24-14768, https://doi.org/10.5194/egusphere-egu24-14768, 2024.

EGU24-15150 | Orals | AS3.10

Using a global aerosol model to interpret satellite-derived aerosol-cloud interactions  

Harri Kokkola, Muhammed Irfan, Antti Lipponen, Silvia Calderon, and Antti Arola

Determining the susceptibilities of cloud properties to perturbations in aerosols has been a persisting challenge in climate research. For example, satellite-retrieved susceptibility of cloud droplet number concentration (CDNC) to changes in cloud condensation nuclei (CCN) varies regionally, also having opposite correlations over land and ocean. Over the oceans, the correlation between CCN and CDNC is positive and in many cases, with a proper regression method, the dlogCDNC/dlogCCN exceeds 1. On the other hand, over land, many studies have found a negative correlation. As our preliminary global climate model simulations give qualitatively similar results to satellite retrievals, we have used the model together with reanalysis data of aerosol, meteorological properties, and cloud properties to interpret how other parameters such as cloud activation updrafts and vertical mixing of aerosol affect the satellite derived CCN vs CDNC correlations. In this study, we focus on ocean regions determining how these different atmospheric properties affect the derived slope between CCN and CDNC. Our results indicate that as satellite derived CCN is a columnar value, does not properly represent the true variability of cloud base CCN. Thus, the mixing of aerosol as well as cloud activation updrafts cause biases in the satellite determined CCN vs CDNC correlations.

How to cite: Kokkola, H., Irfan, M., Lipponen, A., Calderon, S., and Arola, A.: Using a global aerosol model to interpret satellite-derived aerosol-cloud interactions , EGU General Assembly 2024, Vienna, Austria, 14–19 Apr 2024, EGU24-15150, https://doi.org/10.5194/egusphere-egu24-15150, 2024.

EGU24-15271 | Posters on site | AS3.10

Chemical characterization of sub-micrometer marine aerosol around the Ross Sea during CAIAC (2022-23 Antarctic summer) 

Matteo Rinaldi, Marco Paglione, Marco Rapuano, Diego Fellin, Stefano Decesari, Niccolò Losi, Luca Ferrero, and Angelo Lupi

Remote from most human influences, the Southern Ocean (SO) is one of the most pristine regions on Earth and a window to preindustrial atmospheric conditions (Hamilton, 2015). Currently, many unknowns remain about atmospheric and oceanographic processes in this region and their relations. This is largely due to the poor understanding of aerosol sources and processes in this region.

Sub-micrometer aerosol samples were collected onboard the Italian RV Laura Bassi cruising the Southern Ocean and the Ross Sea, in the framework of the PNRA (Programma Nazionale di Ricerca in Antartide) project CAIAC (oCean Atmosphere Interactions in the Antarctic regions and Convergence latitude). The aim is to characterize the marine aerosol chemical composition in different ecoregions, with a particular interest for organic aerosols and their formation processes in relation with the patterns of oceanic biological activity.

Samples were collected by a high volume sampler (TECORA, ECHO-HIVOL, 500 LMP) from mid-January to mid-February 2023, deploying a wind direction selection system to avoid ship contaminations. A total of 9 samples were collected. The samples have been analysed for their water-soluble Carbon and Nitrogen content by a C-N elemental analyzer (Shimadzu) and for the ionic composition (including low molecular weight acids and amines) by ion chromatography (Dionex). The characterization of the water-soluble organic fraction in terms of tracers and functional group abundance was performed by 1H NMR (Proton Nuclear Magnetic Resonance) spectroscopy (Decesari et al, 2020).

The samples show variable contributions in terms of primary and secondary components, mostly depending on back trajectory origin and wind speed, with a general predominance of secondary species. Sulfate resulted generally the most abundant aerosol component, while water soluble organic matter (WSOM) showed a non-negligible contribution from 5 to 14% of the analysed mass. NMR spectra show the complexity of the WSOM composition, even though all the spectra were dominated by the MSA signal, which contribution in terms of carbon to WSOM spans from 8 to 64%.

Analysis of organic aerosol sources is in progress by back-trajectory analysis and statistical analysis of the NMR spectra.


Acknowledgements: CAIAC (oCean Atmosphere Interactions in the Antarctic regions and Convergence latitude) PNRA project.


Decesari, S. et al. (2020), Atmos. Chem. Phys., 20, 4193–4207, https://doi.org/10.5194/acp-20-4193-2020

Hamilton, D. S. Weather 2015, 70 (9), 264– 8, DOI: 10.1002/wea.2540

How to cite: Rinaldi, M., Paglione, M., Rapuano, M., Fellin, D., Decesari, S., Losi, N., Ferrero, L., and Lupi, A.: Chemical characterization of sub-micrometer marine aerosol around the Ross Sea during CAIAC (2022-23 Antarctic summer), EGU General Assembly 2024, Vienna, Austria, 14–19 Apr 2024, EGU24-15271, https://doi.org/10.5194/egusphere-egu24-15271, 2024.

EGU24-15384 | ECS | Posters on site | AS3.10

A mesoscale model for aerosol-cloud interaction studies WRF-PMCAMx-UF with insights to secondary ice production 

Eemeli Holopainen, Paraskevi Georgakaki, David Patoulias, Georgia Sotiropoulou, Romanos Foskinis, Spyros Pandis, and Athanasios Nenes

The interaction between aerosols and clouds is a complex process and it causes large uncertainties in predicting the global climate. This interaction has been studied using chemical transport models (CTMs) as they simulate the distribution and composition of atmospheric aerosols. In this study, we developed a coupled version of the Weather Research and Forecasting (WRF) model with the PMCAMx-UF CTM (Skamarock et al., 2008; Patoulias et al. 2022). We did this by using prognostic cloud droplet number in the Morrison et al. 2009 cloud microphysics scheme of the WRF model. We calculated the prognostic cloud droplet number from the predicted aerosol fields of PMCAMx-UF using the Morales and Nenes 2014 activation scheme. In addition, we investigated the effects of prognostic cloud droplets to secondary ice production (SIP) in the WRF model. This involved the incorporation of various SIP processes, including Hallett-Mossop (HM), collisional fracturing and breakup (BR), droplet freezing and shattering (DS), and sublimational breakup of snow (SBS) and graupel (SBG), following the approaches outlined in Georgakaki et al. 2023. First we evaluated the impact of coupled WRF-PMCAMx-UF model with prognostic droplets to the same model with prescribed droplet number as well as the SEVIRI satellite observations. Secondly we evaluated the effects of adding SIP processes and prognostic droplets to non-SIP and prescribed droplet case and satellite observations. The results showed that using the combined model with prognostic droplets decreased the cloud droplet number concentration (CDNC) and liquid water content (LWC) when compared to the prescribed droplet simulation. This caused a more positive surface radiative forcing and thus a warming effect. In addition, the number of small particles decreased and large particle numbers increased when switching to prognostic droplets. Further, comparing to satellite observations, the prognostic droplet simulation performed better in terms of CDNC than the prescribed droplet simulation. Adding the SIP processes to the model increased the ice crystal number concentration (ICNC) as well as LWC in some areas. Compared to satellite observations, introducing SIP and prognostic droplets into the model performed slightly better in terms of CDNC as well as ice water path (IWP) than the non-SIP and prescribed droplet cases. Thus, a more realistic representation of CDNC as well as incorporation of SIP processes in the coupled model allows a more precise capture of evolving aerosol-cloud interactions in the atmosphere.

How to cite: Holopainen, E., Georgakaki, P., Patoulias, D., Sotiropoulou, G., Foskinis, R., Pandis, S., and Nenes, A.: A mesoscale model for aerosol-cloud interaction studies WRF-PMCAMx-UF with insights to secondary ice production, EGU General Assembly 2024, Vienna, Austria, 14–19 Apr 2024, EGU24-15384, https://doi.org/10.5194/egusphere-egu24-15384, 2024.

EGU24-15938 | Orals | AS3.10 | Highlight

Climate responses to regional aerosol emissions: Early multi-model results from RAMIP 

Laura Wilcox, Robert Allen, Bjørn Samset, Molly MacRae, Luke Fraser-Leach, Tsuyoshi Koshiro, Paul Kushner, Anna Lewinschal, Risto Makkonen, Joonas Merikanto, Declan O'Donnell, Naga Oshima, David Paynter, Steven Rumbold, Toshihiko Takemura, Kostas Tsigaridis, and Dan Westervelt

Anthropogenic aerosol emissions are expected to change rapidly over the coming decades, with complex geographical and seasonal patterns. This is expected to drive strong, spatially varying trends in temperature, hydroclimate, and extreme events, both near and far from emission sources. These changes are poorly constrained in current models, and very sparsely represented in climate risk assessments, partly because of a lack of dedicated emission pathways and multi-model investigations.

The Regional Aerosol Model Intercomparison Project (RAMIP) is designed to quantify and bound the role of regional aerosol emissions changes in near-term climate projections. RAMIP experiments are based on the SSPs commonly used in CMIP6 Endorsed MIPs, but are designed to explore sensitivities to aerosol type and location, and provide improved constraints on uncertainties driven by aerosol radiative forcing and the dynamical response to aerosol changes. The core experiments assess the effects of different aerosol emission pathways in East Asia, South Asia, Africa and the Middle East, and North America and Europe through 2051, using a multi-ensemble-member approach in a set of 10 Earth System Models.

Based on early output from a subset of participating RAMIP models, we highlight regions where current and future aerosol reductions may lead to changes in seasonal mean climate and the frequency and severity of extreme events. We will also show examples of how the near-future evolution of temperature and precipitation extremes in Europe and Asia may be influenced by local air quality policies, and those further afield.

How to cite: Wilcox, L., Allen, R., Samset, B., MacRae, M., Fraser-Leach, L., Koshiro, T., Kushner, P., Lewinschal, A., Makkonen, R., Merikanto, J., O'Donnell, D., Oshima, N., Paynter, D., Rumbold, S., Takemura, T., Tsigaridis, K., and Westervelt, D.: Climate responses to regional aerosol emissions: Early multi-model results from RAMIP, EGU General Assembly 2024, Vienna, Austria, 14–19 Apr 2024, EGU24-15938, https://doi.org/10.5194/egusphere-egu24-15938, 2024.

Marine stratocumulus clouds contribute a significant cooling effect to the Earth's climate, but their role in global climate change hasn't been well quantified. Aerosols from anthropogenic and natural sources alter the characteristics of stratocumulus clouds, although the extend of all cloud adjustments is not yet fully quantified. In particular the cloud fraction adjustment is associated with potentially large radiative forcings, but also high uncertainties.

We used cloud retrievals from the GOES-East satellite to explore cloud fraction adjustments in raining stratocumuli structures, and MERRA-2 aerosol reanalysis data as a proxy for the aerosol-dependent cloud droplet size.

We found that increases in aerosol loading coincide with both increases and decreases in cloud fraction relative to the climatological mean. Decreases in aerosol loading coincide with increases in the fraction of optically thin cloud features which were calculated for various maximum thresholds of optical depth.

For cloud covers with cloud fractions and optically thin cloud areas close to the climatological mean, increased aerosol loading tends to coincide with increases in both of these properties. This is not the case for cloud covers that differ significantly from the climatological mean.

A better understanding of the link between how cloud fraction and optical density respond to aerosol loading could help to improve our knowledge of the effects of aerosols on the radiative properties of stratocumuli.

How to cite: Vieira Fischer, F. and Possner, A.: Exploring cloud fraction adjustments in the South Pacific marine stratocumulus cloud deck using 3 years of GOES 16 retrievals, EGU General Assembly 2024, Vienna, Austria, 14–19 Apr 2024, EGU24-16133, https://doi.org/10.5194/egusphere-egu24-16133, 2024.

EGU24-16381 | Posters on site | AS3.10

Temperature dependence of cloud drop activation of insoluble particles 

Ana A. Piedehierro, André Welti, Yrjö Viisanen, and Ari Laaksonen

The critical supersaturation of cloud droplet activation by water-soluble aerosols increases at lower temperatures. This is due to the Kelvin effect, with the logarithm of the saturation ratio being inversely proportional to the absolute temperature and linearly proportional to the surface tensions and molecular volume of water. Less is known about the temperature dependence of critical supersaturation when the cloud condensation nuclei (CCN) are water-insoluble. 

The FHH activation theory describes the CCN activation of insoluble particles by combining the FHH (Frenkel-Halsey-Hill) adsorption isotherm and the Kelvin equation. The temperature dependence induced by the Kelvin term is inherently similar to that observed in water-soluble particles. However, the influence of the adsorption term on critical supersaturation as a function of temperature remains unclear. 

The typical temperature dependence of water vapour adsorption is such that an increase in the adsorption layer thickness is expected with decreasing temperature at a constant saturation ratio. Nevertheless, it is known that some adsorbent materials behave differently, adsorbing water vapour more efficiently at higher temperatures, while a third class of adsorbents shows no temperature dependence at all. In this study, we investigate the temperature dependencies of critical supersaturations for water-insoluble particle types that exhibit diverse temperature responses in adsorption measurements. We interpret the results in terms of the FHH adsorption activation model.

How to cite: Piedehierro, A. A., Welti, A., Viisanen, Y., and Laaksonen, A.: Temperature dependence of cloud drop activation of insoluble particles, EGU General Assembly 2024, Vienna, Austria, 14–19 Apr 2024, EGU24-16381, https://doi.org/10.5194/egusphere-egu24-16381, 2024.

EGU24-16865 | ECS | Orals | AS3.10

Observation of fluorescent primary biological particles at the North Pole: A case of inter-coupled system behaviour? 

Julia Asplund, Annica ML Ekman, Gabriel Freitas, Mats A. Granskog, Benjamin Heutte, Remy Lapere, Morven Muilwijk, Tuomas Naakka, Julia Schmale, Jennie Thomas, and Paul Zieger

Aerosol-cloud interactions remain among the most uncertain key parameters in the fast-changing Arctic climate system. Arctic clouds often consist of both liquid droplets and ice crystals, the abundance of which is constrained by the availability of ice nucleating particles (INP). We present observations of fluorescent primary biological aerosol particles (fPBAP), shown to be potent INP, obtained during the Arctic Ocean 2018 expedition onboard the Swedish icebreaker Oden in August- September of 2018, at the North Pole. The fPBAP were recorded on a single-particle level using a Multiparameter Bioaerosol Spectrometer, as a part of a complete setup for measuring physical and chemical aerosol properties.  Potential sources of fPBAP during an extended period of high concentrations are investigated using a combination of auxiliary measurements, trajectory analysis, remote sensing data, ocean biogeochemistry reanalysis data, and model experiments with WRF-Chem. Our evidence suggests that the observed case of increased fPBAP concentration at the North Pole was caused by transport of fPBAP enriched marine aerosol from a source within the Arctic region, but in open water south of the pack ice. We also highlight how future interdisciplinary efforts can be used more efficiently to improve the source mapping of Arctic fPBAP, which is needed to assess their overall climate-relevance in the polar regions.

How to cite: Asplund, J., Ekman, A. M., Freitas, G., Granskog, M. A., Heutte, B., Lapere, R., Muilwijk, M., Naakka, T., Schmale, J., Thomas, J., and Zieger, P.: Observation of fluorescent primary biological particles at the North Pole: A case of inter-coupled system behaviour?, EGU General Assembly 2024, Vienna, Austria, 14–19 Apr 2024, EGU24-16865, https://doi.org/10.5194/egusphere-egu24-16865, 2024.

In this work, a data set comprised of satellite observations and reanalysis data is used in explainable machine learning models to analyse the relationship between the cloud droplet number concentration (Nd), cloud liquid water path (LWP) and the fraction of precipitating clouds (PF) in 5 distinct marine stratocumulus (MSC) regions.

Aerosol--cloud--precipitation interactions (ACI) are a known major cause of uncertainties in simulations of the future climate. An improved understanding of the in-cloud feedback processes accompanying ACI could help in advancing their implementation in global climate models. This is especially the case for marine stratocumulus clouds which constitute the most common cloud type globally.

The machine learning framework applied here makes use of Shapley additive explanation (SHAP) values, allowing to isolate the impact of Nd from other confounding factors which proved to be very difficult in previous satellite based studies.

All examined MSC regions display a decrease of PF and an increase in LWP with increasing Nd, despite marked inter-regional differences in the distribution of Nd. The negative Nd-PF relationship is stronger in high LWP conditions, while the positive Nd-LWP relationship is amplified in precipitating clouds. While these results for the Nd-LWP relationship differ from the findings in recent satellite-based global analyses, they are consistent with previous studies using model simulations. The results presented here indicate that precipitation suppression plays an important role in MSC adjusting to aerosol-driven perturbations in Nd.

How to cite: Zipfel, L., Andersen, H., Cermak, J., and Grosvenor, D. P.: How cloud droplet number concentration impacts liquid water path and precipitation in marine stratocumulus clouds - a satellite-based analysis using explainable machine learning, EGU General Assembly 2024, Vienna, Austria, 14–19 Apr 2024, EGU24-16965, https://doi.org/10.5194/egusphere-egu24-16965, 2024.

EGU24-17179 | Orals | AS3.10

Ice nucleating properties of air filter and snow samples taken in the Central Arctic during MOSAiC 

Amélie Kirchgaessner, Markus Frey, Floor van den Heuvel, Tom Lachlan-Cope, Ananth Ranjithkumar, and Xin Yang

Arctic clouds are still poorly represented in climate models. An important reason for this is our lack of knowledge regarding the various sources of natural aerosol in the high Arctic. Recent field campaigns have provided evidence that over sea ice blowing snow can act as a source of sea salt aerosol (SSA). This source can account for the maximum in SSA that occurs in the Polar Regions during winter and spring. SSA can influence the regional climate through the indirect radiative effect, but also through the role it plays as nucleation particle in cloud formation. Its contribution to and potential as ice nucleating particle (INP) is still largely unknown though. 

 Here we will present offline samples of airborne aerosol taken in the Central Arctic during MOSAiC focussing on the transition period from winter to spring. The samples comprise of quasi-ciontinuous low-volume air filter samples taken in the British Antarctic Survey’s aerosol lab container on board of RV Polarstern, weekly snow samples from the ice floe, and filter samples taken by tethered balloon. These samples were analysed for their ice nucleating characteristics using a peltier cold stage and applying a machine learning algorithm to the images taken during the cooling process.

Initial results confirm an increased presence of INP in both the airborne and snow samples at the turn from winter to spring. 

How to cite: Kirchgaessner, A., Frey, M., van den Heuvel, F., Lachlan-Cope, T., Ranjithkumar, A., and Yang, X.: Ice nucleating properties of air filter and snow samples taken in the Central Arctic during MOSAiC, EGU General Assembly 2024, Vienna, Austria, 14–19 Apr 2024, EGU24-17179, https://doi.org/10.5194/egusphere-egu24-17179, 2024.

EGU24-17218 | ECS | Posters on site | AS3.10

Air mass history linked to the development of Arctic mixed-phase clouds 

Rebecca Murray-Watson and Ed Gryspeerdt

The development of clouds during marine cold-air outbreaks (MCAOs) represent a complex phenomenon, transitioning from stratocumulus decks near ice edges to cumuliform fields downwind. This change cloud morphology changes the radiative properties of the cloud, and therefore is of importance to the surface energy budget. Therefore, it is crucial to understand the factors which may drive transition to a broken cloud field. Previous in situ and modelling studies suggest the formation of ice may enhance precipitation and therefore accelerate break-up. However, little is known about the development of mixed-phase clouds in MCAOs. 

This study uses pseudo-Lagrangian trajectories and satellite data to analyze this mixed-phase cloud development. We observe a rapid transition from liquid to ice phases in MCAO clouds, contrasting with similar cloud formations outside MCAO conditions. These mixed-phase clouds initially form at temperatures below -20°C near ice edges but can dominate even at -13°C further into outbreaks. This temperature shift suggests a significant role for biological ice nucleating particles (INPs), which increase in prevalence as air masses age over marine environments. The study also notes the influence of the air mass's history over snow- and ice-covered surfaces, which may be low in INPs, on cloud evolution. This link helps explain seasonal variations in Arctic cloud development, both during and outside of MCAOs. Our findings emphasize the importance of understanding local marine aerosol sources and the broader INP distribution in the Arctic for accurate cloud phase modeling in the region. 

How to cite: Murray-Watson, R. and Gryspeerdt, E.: Air mass history linked to the development of Arctic mixed-phase clouds, EGU General Assembly 2024, Vienna, Austria, 14–19 Apr 2024, EGU24-17218, https://doi.org/10.5194/egusphere-egu24-17218, 2024.

EGU24-17439 | Orals | AS3.10

Atmospheric aerosol characterization at Princess Elisabeth station, East Antarctica and identifying source regions using backward trajectory modelling 

Alexander Mangold, Karen De Causmaecker, Quentin Laffineur, Preben Van Overmeiren, Charlotte Deramaix, Christophe Walgraeve, Nadine Mattielli, and Andy Delcloo

Atmospheric composition plays an important role in present and near-future climate change. Airborne particles exert direct and indirect radiative impacts and can serve as cloud condensation and ice nuclei, having therefore a strong influence on cloud formation and precipitation. Furthermore, a detailed understanding of present-day atmospheric transport pathways of particles from source to deposition in Antarctica remains essential.

Since 2010, the aerosol total number and size distribution, aerosol absorption coefficient and mass concentration of light-absorbing aerosols and the aerosol total scattering coefficient have been monitored at the Belgian research station Princess Elisabeth Antarctica (PEA). The station is situated in Dronning Maud Land, East Antarctica (71.95° S, 23.35° E, 1390 m asl). Besides these instruments, a cloud condensation nuclei counter was operated during three austral summers. Meteorological data come from an automatic weather station. In this work, we investigate the climatology of the particle properties with respect to the air mass origin. To that end, we used the FLEXTRA trajectory model to investigate transport pathways into Antarctica. The model was driven with ECMWF ERA-5 meteorological fields. 10-days 3D backward trajectories, starting from PEA, were calculated for the period 01/01/2010 to 31/12/2020, in 3-hour-intervals. A k-means cluster analysis has been done based on latitude, longitude and altitude, resulting in four clusters of air mass origin.

We will present results for the climatology of particle properties and the air mass origin. In addition, the backward trajectories have been combined with measured atmospheric particle properties and parameters like potential vorticity and exposure to sunshine duration, showing the distribution of the measured atmospheric particle properties between and within the air mass origin clusters. Some distinct features could be seen in the air mass origin clustering. Source regions from South America, Southern Africa and Australia, New Zealand were limited and the Southern Ocean was a main source region, as was the Antarctic continent itself. For each season, the dominating cluster represented mainly air masses of Antarctic continental origin with a large influence of upper tropospheric air. We will show further results of our analysis on air mass origin and atmospheric and particle properties, with respect to differentiations between seasons, clusters, continental and maritime origin and source altitude compartments.

How to cite: Mangold, A., De Causmaecker, K., Laffineur, Q., Van Overmeiren, P., Deramaix, C., Walgraeve, C., Mattielli, N., and Delcloo, A.: Atmospheric aerosol characterization at Princess Elisabeth station, East Antarctica and identifying source regions using backward trajectory modelling, EGU General Assembly 2024, Vienna, Austria, 14–19 Apr 2024, EGU24-17439, https://doi.org/10.5194/egusphere-egu24-17439, 2024.

EGU24-17504 | Posters on site | AS3.10

Cloud droplet formation characteristics at eleven locations throughout Greece during summer 2020 and 2021 

Kaori Kawana, Romanos Foskinis, Eemeli Holopainen, Alexandros Papayannis, Andreas Aktypis, Christos Kaltsonoudis, David Patoulias, Angeliki Matrali, Christina Vasilakopoulou, Evangelia Kostenidou, Kalliopi Florou, Nikos Kalivitis, Konstantinos Eleftheriadis, Constantini Samara, Mihalis Lazaridis, Nikolaos Mihalopoulos, Spyros Pandis, and Athanasios Nenes and the Observation Team

    Aerosol particles affect the climate system by directly absorbing and scattering solar radiation or by acting as cloud condensation nuclei (CCN) and modulating cloud radiative properties. Cloud particle activation is at the heart of these aerosol-cloud interactions, but it is important to quantify the degree to which aerosol (size distribution and composition) or dynamical aspects (vertical velocity) contribute to cloud droplet number concentration, as they determine in the end the cloud sensitivity to aerosol variations.

    In this study, we use a comprehensive dataset of number-size distributions and meteorological data observed at 11 sites throughout the E. Mediterranean (Greece) during the summers of 2020 and 2021 and use them as input into a state-of-the-art cloud activation parameterization to determine the potential activated cloud droplet number and maximum supersaturation. Remote sensing retrievals of droplet number complement the analysis and are used to evaluate the droplet number calculations carried out with the parameterization. We then examine the droplet formation characteristics of each region (urban, rural, remote, and mountain), determine when clouds are velocity- and aerosol-limited, link them to airmass origin, and discuss the implications for cloud formation in the region.

How to cite: Kawana, K., Foskinis, R., Holopainen, E., Papayannis, A., Aktypis, A., Kaltsonoudis, C., Patoulias, D., Matrali, A., Vasilakopoulou, C., Kostenidou, E., Florou, K., Kalivitis, N., Eleftheriadis, K., Samara, C., Lazaridis, M., Mihalopoulos, N., Pandis, S., and Nenes, A. and the Observation Team: Cloud droplet formation characteristics at eleven locations throughout Greece during summer 2020 and 2021, EGU General Assembly 2024, Vienna, Austria, 14–19 Apr 2024, EGU24-17504, https://doi.org/10.5194/egusphere-egu24-17504, 2024.

EGU24-17810 | ECS | Posters on site | AS3.10

An investigation of fog and low cloud life cycles and their interaction with biomass burning aerosols in the Namib 

Alexandre Mass, Hendrik Andersen, Jan Cermak, and Eva Pauli

In this contribution, a statistical model and several satellite products (SEVIRI, CALIPSO) are used to study the potential semi-direct effects of biomass burning aerosols (BBA) on the persistence of fog and low clouds (FLC) in the Namib during the biomass burning season.

Fog, which is the most relevant non-rainfall water source for plants and animals in the coastal parts of the Namib Desert, may become increasingly important for local ecosystems as regional climate simulations predict a warmer and drier climate for southern Africa in the future. Previous studies showed the role of BBA on cloud development over the ocean off the Namibian coast. The same processes are likely to influence Namib-region FLC formation and persistence as well. However, the potential effects of aerosols on FLC in the Namib Desert have yet to be investigated.

Using reanalysis products in combination with satellite data, a statistical model is built to predict FLC dissipation times in high and low BBA loading days. It is found that during this season, FLC dissipation times are positively correlated to BBA loading (higher aerosol loading coinciding with later FLC dissipation). By analyzing the contribution of the different predictors to the output of the statistical model, it is found that the positive correlation is mostly explained by the synoptic scale meteorology. Nevertheless, the synoptic scale circulation and aerosol loading are highly correlated in the region, thus some of the results could still be attributed to aerosol semi-direct effects. To definitively contrast aerosol effects from meteorology, modeling of aerosol-cloud interactions in the region could be promising.

How to cite: Mass, A., Andersen, H., Cermak, J., and Pauli, E.: An investigation of fog and low cloud life cycles and their interaction with biomass burning aerosols in the Namib, EGU General Assembly 2024, Vienna, Austria, 14–19 Apr 2024, EGU24-17810, https://doi.org/10.5194/egusphere-egu24-17810, 2024.

EGU24-17813 | ECS | Orals | AS3.10

Typical signatures of the transition zone of cumulus cloud shadows in solar radiation 

Jonas Witthuhn, Hartwig Deneke, and Heike Kalesse-Los

Investigating solar radiation and its variability due to clouds and aerosol is critical for efficient and reliable solar energy systems. During broken cloud conditions, reflections at cloud edges and changing aerosol properties in the vicinity of clouds affect the surface solar radiation significantly. In these situations, the distinction between clouds and clear skies with aerosol is not always well defined[1]. As seen from the surface, this region exists around cloud core shadows and is called the transition zone. Here, a unique dataset of observations from a dense pyranometer network is used to detect and investigate signatures of shortwave broadband transmittance in the transition zone.

The TROPOS pyranometer network consists of up to 100 individual stations. Data of one campaign is used for this study: 60 stations were distributed over an area of about 6 km² during the S2VSR[2] measurement campaign in 2023 at the ARM Southern Great Planes (SGP) site in Oklahoma, USA. The surface solar irradiance is measured at each station with a time resolution of 10 Hz. The transition zone is detected and characterized by applying a modified clear sky detection algorithm[3] to the data. An additional component of our analysis is the determination of the cloud motion. This vector is determined using the Farneback optical flow algorithm[4] on a cloud shadow mask calculated from the “Clouds Optically Gridded by Stereo” (COGS) product[5].

The study aims to quantify the small-scale effects of the transition zone on surface solar irradiance and potential photo-voltaic yield. This information is valuable for photo-voltaic site planning and provides scientifically relevant insights into the interaction between clouds, aerosol and solar radiation.


[1] e.g., Calbó et al. 2017, https://doi.org/10.1016/j.atmosres.2017.06.010

[2] https://www.arm.gov/research/campaigns/sgp2023s2vsr

[3] Bright et al. 2020, https://doi.org/10.1016/j.rser.2020.109706

[4] Farneback 2000, https://doi.org/10.1109/ICPR.2000.905291.

[5] Romps & Oktem et al. 2018, https://doi.org/10.1175/bams-d-18-0029.1

How to cite: Witthuhn, J., Deneke, H., and Kalesse-Los, H.: Typical signatures of the transition zone of cumulus cloud shadows in solar radiation, EGU General Assembly 2024, Vienna, Austria, 14–19 Apr 2024, EGU24-17813, https://doi.org/10.5194/egusphere-egu24-17813, 2024.

EGU24-18173 | Orals | AS3.10

The Shedding Light On Cloud Shadows project: measuring and simulating surface solar irradiance under broken clouds 

Chiel van Heerwaarden, Wouter Mol, Menno Veerman, Bart van Stratum, Mirjam Tijhuis, Bert Heusinkveld, Oscar Hartogensis, Jordi Vilà-Guerau de Arellano, and Mary-rose Mangan

This year marks the end of the Shedding Light On Cloud Shadows project (SLOCS, 2019-2024). SLOCS aims to understand temporal, spatial, and spectral variability in surface solar irradiance driven by individual clouds from field observations and 3D cloud-resolving large-eddy simulations. In this contribution, we would like to present the highlights of the project and the most important conclusions.

The reason for initiating SLOCS is that clouds trigger large fluctuations in solar surface irradiance, and therefore in surface heat fluxes, but there is still much to be learned about these fluctuations. The incoming radiation in shadows is almost an order of magnitude less than under clear sky, while peaks near clouds shadows can sometimes reach a 50% increase with respect to clear sky, due to scattering of sunlight on clouds. Performing cloud-resolving simulations with realistic surface solar irradiance patterns under broken clouds remains therefore a challenge, and current cloud-resolving models do not capture the radiation-cloud interactions well. 

The Shedding Light On Cloud Shadows (SLOCS) project addresses this challenge by i) performing spatial observations in a spatial grid fine enough (~50 m, 10 Hz) to capture individual clouds using a newly designed instrument, and ii) developing 3D radiative transfer models for cloud-resolving models with optimal balance between detail level and performance. The FESSTVaL, LIAISE, and CloudRoots campaigns provided unique opportunities to measure surface solar irradiance around cloud shadows in different climates. In the campaigns, we performed grid measurements of radiation, while benefiting from complementary boundary-layer and cloud observations.

The most important lessons learned from the field observations are:
1. Scales as small as meters and seconds contribute significantly to fluctuations in surface solar irradiance
2. All broken cloud patterns generate strong peaks, but the underlying mechanisms vary greatly amoung cloud types
3. Spectral variations (in colors of light) are mostly significant under cumulus clouds.

We used those observations to set up a series of cloud-resolving simulations with MicroHH and to evaluate two newly-developed radiative transfer solvers: i) a ray tracer fast enough to be coupled to our cloud-resolving model and ii) a solver that post-processes the outcome of a 1D two-stream solver to emulate 3D effects. Also, we studied the impact of periodic and open lateral boundary conditions. The most important conclusions are:

1. Capturing 3D interactions between clouds and radiation accurately leads to larger clouds with more liquid water compared to those in simulations with conventional 1D methods
2. Post-processing conventional 1D radiation computations allows for simulating surface solar irradiance fields with realistic probability density functions, but inaccurate cloud shadow shape and location.
3. Open lateral boundaries in large-eddy simulations are at least as important as correct radiation-cloud interactions in producing realistic cloud shadows in the range from hectometers to kilometers.

How to cite: van Heerwaarden, C., Mol, W., Veerman, M., van Stratum, B., Tijhuis, M., Heusinkveld, B., Hartogensis, O., Vilà-Guerau de Arellano, J., and Mangan, M.: The Shedding Light On Cloud Shadows project: measuring and simulating surface solar irradiance under broken clouds, EGU General Assembly 2024, Vienna, Austria, 14–19 Apr 2024, EGU24-18173, https://doi.org/10.5194/egusphere-egu24-18173, 2024.

EGU24-18214 | ECS | Posters on site | AS3.10

Leveraging surface observations and passive satellite retrievals of cloud properties: Applications to cloud type classification and cloud base height retrieval 

Julien Lenhardt, Johannes Quaas, Dino Sejdinovic, and Daniel Klocke

Clouds are key regulators of the Earth’s energy budget. Their microphysical and optical properties lead to vastly disparate radiative properties. Retrieving information about clouds is thus crucial to reduce uncerntainties in our estimation of climate change. In this study, we present a common approach to the retrieval of cloud type and cloud base height (CBH), two useful aspects to characterise clouds and their radiative effects.

We leverage surface observations of these two cloud characterictics from the network made available by the UK Met Office, linked to satellite retrievals of relevant cloud properties from the MODIS instrument, namely cloud top height, cloud optical thickness and cloud water path. Our approach relies on a convolutional auto-encoder (AE) to project a data cube (dimension of 3 channels, 128 km, 128 km), comprised of the aforementioned cloud properties, to a latent space of lower dimensionality. The latter is then used as predictor for the cloud characteristics of interest.

We demonstrate the skill of the developed method by applying it to CBH retrievals. We create a global dataset of retrieved CBH which exhibits accuracy and precision, in particular for low-level cloud bases, achieving a mean absolute error of 379 m and a standard deviation of the absolute error of 328 m. This is also compared to active satellite retrievals and other CBH retrieval methods. The second application focuses on cloud types, defined following the standards of the WMO. With our approach, we retrieve cloud type occurences at a global scale and are able to study their spatial and temporal patterns. We further use the developed method on km-scale global climate model outputs from the ICON model to help diagnostic cloud representation in this new generation of climate models. Lastly, the presented applications illustrate how fusing surface observations and satellite retrievals still constitutes a resourceful approach to study clouds and their properties.

How to cite: Lenhardt, J., Quaas, J., Sejdinovic, D., and Klocke, D.: Leveraging surface observations and passive satellite retrievals of cloud properties: Applications to cloud type classification and cloud base height retrieval, EGU General Assembly 2024, Vienna, Austria, 14–19 Apr 2024, EGU24-18214, https://doi.org/10.5194/egusphere-egu24-18214, 2024.

EGU24-19084 | ECS | Orals | AS3.10

Assessing Model simulation for central Arctic aerosol load by usingAEROSNOW dataset: Relevance for precipitation 

Basudev Swain, Vountas Marco, Deroubaix Adrien, Lelli Luca, Gunthe Sachin S., Bösch Hartmut, and Burrows John P.

The Arctic is currently warming rapidly, at a rate four times higher than the global average. This warming has significant consequences, leading to increased precipitation in the Arctic. Aerosols play a crucial role in cloud formation, cloud condensation nuclei (CCNs) and ice-nucleating particles (INPs), influencing rain and snowfall. However, uncertainties remain in the modelling of aerosols and their impact on precipitation due to a lack of high-resolution spatio-temporal observations. This is particularly the case in the central Arctic cryosphere due to the presence of extensive cold, bright snow and ice surfaces coupled with widespread cloud cover.

This study addresses the observational data gap and provides an opportunity to refine model simulations at different spatio-temporal scales. We achieve this by using total aerosol optical depth (AOD) datasets generated by the AEROSNOW algorithm over the extensive central Arctic cryosphere. AEROSNOW retrieves AOD data using top-of-atmosphere reflectance measurements obtained through the Advanced Along-Track Scanning Radiometer (AATSR) aboard the ENVISAT satellite, spanning from 2003 to 2011. AEROSNOW integrates an aerosol retrieval algorithm with a rigorous cloud masking scheme and intro-
duces a novel quality flagging methodology tailored for the central Arctic region (≥ 72°N).

Using the AEROSNOW retrieved dataset for the central Arctic, we evaluate different models participating in the sixth phase of the Coupled Model Intercomparison Project (CMIP6). Our results show significant differences in the spatio-temporal aerosol load and its annual and seasonal variations with precipitation. In particular, there is a decrease in aerosol loading that coincides with increased precipitation along the northern periphery of Alaska and the Bering Sea.

Significant discrepancies and variations of up to 6.2 mm/day in precipitation are observed between models, with higher aerosol loading leading to lower precipitation and vice versa. Furthermore, the spatially averaged multi-model mean overestimates aerosol concentrations in spring and underestimates them in summer compared to satellite observations. The CMIP6 models do not reproduce the seasonal variations in aerosol distribution seen with AEROSNOW, particularly an increase in aerosol loading during the summer coinciding with the sea ice retreat cycle. These discrepancies may be due to the lack of advanced natural aerosol formation mechanisms in the models, as a consequence of Arctic warming, and exposure to open
ocean emissions.

In summary, our study has led us to speculate that as model sophistication increases, modelled aerosol processes become increasingly uncertain. Ultimately, this investigation has the potential to elucidate the critical link between aerosols and the prevailing rain-dominated Arctic conditions under ongoing Arctic warming in future CMIP projects.

How to cite: Swain, B., Marco, V., Adrien, D., Luca, L., Sachin S., G., Hartmut, B., and John P., B.: Assessing Model simulation for central Arctic aerosol load by usingAEROSNOW dataset: Relevance for precipitation, EGU General Assembly 2024, Vienna, Austria, 14–19 Apr 2024, EGU24-19084, https://doi.org/10.5194/egusphere-egu24-19084, 2024.

EGU24-19429 | ECS | Posters on site | AS3.10

Local and long-range transported sources of natural aerosols in southern Greenlandic fjord systems 

Joanna Dyson, Nora Bergner, Lionel Favre, Benjamin Heutte, Julian Weng, Patrik Winiger, Athanasios Nenes, Kalliopi Violaki, and Julia Schmale

The Arctic is warming up to four times faster than the global average with fragile fjord ecosystems in the relatively warm Southern Greenland being especially sensitive to changes across various facets of the environment. With longer and warmer summer melt periods leading to increased glacial melt with marine and land-terminating glaciers slowly receding, the potential of sediments from newly exposed glacial outwash plains to be aerosolized increases. At the same time biological productivity in the ocean is changing. Hence, the composition and sources of atmospheric aerosols responsible for the formation of clouds in this region are evolving and we expect this to influence both the cloud condensation nuclei (CCN) and Ice Nucleating Particle (INP) populations. Given the complex terrain and mixture of ice, ocean and land in fjord systems, the dispersion of aerosols and gases originating at the surface is subject to lower atmosphere stability and dynamics before they can reach cloud level. 

In this presentation, we will show results from a comprehensive and extensive field campaign in the Kullajeq province of Southern Greenland in June-August 2023. We will present vertical aerosol size distributions, particle number concentrations and absorption measurements taken using a tethered balloon in addition to complementary ground based online aerosol measurements. Two key sources of aerosols will be discussed: near-daily local new particle formation (NPF), and long-range transported Canadian wildfire plumes. We will explore the following questions: Are aerosols from fjords and increased biological productivity the source of the frequent NPF observed in Narsaq, and how do aerosols from distant sources such as Canadian biomass burning effect the aerosol population in Southern Greenland?

How to cite: Dyson, J., Bergner, N., Favre, L., Heutte, B., Weng, J., Winiger, P., Nenes, A., Violaki, K., and Schmale, J.: Local and long-range transported sources of natural aerosols in southern Greenlandic fjord systems, EGU General Assembly 2024, Vienna, Austria, 14–19 Apr 2024, EGU24-19429, https://doi.org/10.5194/egusphere-egu24-19429, 2024.

EGU24-20480 | ECS | Posters on site | AS3.10

The sensitivity of cloud micro- and macrophysical properties to cloud microphysics parameterisations and simulation setup 

Maor Sela, Philipp Weiss, and Philip Stier

The climate impact and radiative effect of clouds and aerosols are significant. Both are among the most considerable sources of uncertainties in the climate system and in modelling the climate system. This arises not only from the fundamental uncertainty in cloud microphysics processes but also from their representation in models, and in particular in Cloud-Resolving Models (CRMs). CRMs are powerful tools for weather prediction, climate study, and investigating aerosol-cloud interactions at regional and global scales. However, they introduce a substantial degree of uncertainty due to model construction and parameterisation. To further investigate the sources of uncertainty in CRMs, we isolate two key aspects: the model's configuration (global and regional) and the employed cloud microphysics scheme (single- and double-moment schemes). Then, for each key aspect, we compare the simulated data to identify any discrepancies.
We present results from regional simulation with ICON-Sapphire in limited area mode. The region we focused on in this study is the Amazon basin, using a horizontal resolution of about 1.2 km and a time period of 8 days. First, we compare results obtained using both single- and double-moment bulk microphysics schemes, maintaining consistency in other simulation parameters. Then, we compare results obtained from both regional and global simulations utilising the single-moment bulk microphysics scheme, again maintaining consistency in other simulation parameters. 
We find that the double-moment cloud microphysics scheme yields increased ice levels and reduced precipitation rates compared to the single-moment cloud microphysics scheme. We also find that the Amazonian diurnal cycle of precipitation rate, ice, and liquid water paths is more pronounced in the global runs compared to the regional runs.
These results and other results that we will present may have implications on global radiation balance in global km-scale climate models.

How to cite: Sela, M., Weiss, P., and Stier, P.: The sensitivity of cloud micro- and macrophysical properties to cloud microphysics parameterisations and simulation setup, EGU General Assembly 2024, Vienna, Austria, 14–19 Apr 2024, EGU24-20480, https://doi.org/10.5194/egusphere-egu24-20480, 2024.

EGU24-20572 | Orals | AS3.10 | Highlight

Aerosol effects on convective clouds in global km-scale models – from idealised aerosol perturbations to explicit aerosol modelling 

Philip Stier, Philipp Weiss, Ross Herbert, and Maor Sela

Aerosol effects on convective clouds and climate mediated via radiative and microphysical perturbations remain highly uncertain. Microphysical perturbations are generally not included in current climate models due to the simplified representation of convective clouds in existing parameterisations. Progress has been made through regional cloud resolving modelling, however such simulations often neglect energy and water budget constraints and the coupling to larger scales.

The emergence of global km-scale climate models provides a significant opportunity to advance our understanding of aerosol-convection interactions. Here we present results from a hierarchy of global km-scale atmospheric model simulations using ICON, investigating aerosol effects on convective clouds. Idealised model simulations, in which aerosols are prescribed as fixed plumes of radiative properties, with an optional associated semi-empirical scaling of droplet number perturbations, provide fascinating insights into the physical processes underlying aerosol effects on convection and into the interaction of local perturbations with the larger scale dynamics – but neglect key aerosol-convection interactions. These simulations highlight the importance of the radiatively mediated pathway for tropical convective clouds, with significant impacts on the diurnal cycle of cloud properties and precipitation over the Amazon and the Congo basin – and interactions with the large-scale dynamics for perturbations over the Pacific warm pool region.

We contrast our results from idealised simulations with simulations including explicit aerosols, enabled by a novel reduced complexity aerosol scheme suitable for global km-scale models, HAM-Lite. Comparison of the idealised simulations with prescribed aerosol perturbations and the simulations with explicit aerosols, provides new insights into the complexity of aerosol-convection interactions. This study provides a testbed for a future global km-scale model intercomparison project focusing on aerosol effects as part of the GEWEX Aerosol Precipitation (GAP) initiative.

How to cite: Stier, P., Weiss, P., Herbert, R., and Sela, M.: Aerosol effects on convective clouds in global km-scale models – from idealised aerosol perturbations to explicit aerosol modelling, EGU General Assembly 2024, Vienna, Austria, 14–19 Apr 2024, EGU24-20572, https://doi.org/10.5194/egusphere-egu24-20572, 2024.

EGU24-21153 | Orals | AS3.10 | Highlight

Nonlinearity of the cloud response postpones climate penalty of mitigating air pollution in polluted regions 

Hailing Jia, Johannes Quaas, and Otto Hasekamp

Aerosol–cloud interactions contribute substantially to uncertainties in anthropogenic forcing, in which the sensitivity of cloud droplet number concentration (Nd) to aerosol plays a central role. Here we use satellite observations to show that the aerosol–Nd relation (in log–log space) is not linear as commonly assumed. Instead, the Nd sensitivity decreases at large aerosol concentrations due to the transition from aerosol-limited to updraft-limited regime, making the widely used linear method problematic. The similar nonlinear behavior is also observed in weekly cycles; specifically, polluted conditions exhibit a reduced amplitude of weekly cycles in Nd compared to clean conditions with similar aerosol perturbations.  A sigmoidal transition is shown to adequately fit the data. When using this revised relationship, the additional warming that arises from air pollution mitigation is delayed by two to three decades in heavily polluted locations, compared to the linear relationship. This cloud-mediated climate penalty will manifest markedly starting around 2025 in China and 2050 in India after applying the strongest air quality policy, underlining the urgency of mitigating greenhouse gas emissions.

How to cite: Jia, H., Quaas, J., and Hasekamp, O.: Nonlinearity of the cloud response postpones climate penalty of mitigating air pollution in polluted regions, EGU General Assembly 2024, Vienna, Austria, 14–19 Apr 2024, EGU24-21153, https://doi.org/10.5194/egusphere-egu24-21153, 2024.

EGU24-21392 | Orals | AS3.10

Cloud condensation nuclei concentrations derived from the CAMS reanalysis 

Karoline Block, Mahnoosh Haghighatnasab, Daniel G. Partridge, Philip Stier, and Johannes Quaas

Determining number concentrations of cloud condensation nuclei (CCN) is one of the first steps in the chain in analysis of cloud droplet formation, the direct microphysical link between aerosols and cloud droplets, and a process key for aerosol-cloud interactions (ACI). 

Here, we present a new CCN dataset (https://doi.org/10.26050/WDCC/QUAERERE_CCNCAMS_v1) which combines aerosol modeling with observations to better explore magnitude, source, temporal and spatial distribution of CCN numbers. The dataset features 3-D CCN number concentrations of global coverage for various supersaturations and aerosol species covering the years from 2003 to 2021 with daily frequency.

CCN are derived based on aerosol mass mixing ratios from the latest Copernicus Atmosphere Monitoring Service reanalysis (CAMSRA) in a diagnostic model that uses CAMSRA aerosol properties and a simplified kappa-Köhler framework which are suitable for global models. The emitted aerosols in CAMSRA are not only based on input from emission inventories using aerosol observations, they also have a strong tie to satellite-retrieved aerosol optical depth (AOD) as this is assimilated as a constraining factor in the reanalysis. Thus, this dataset is one of its kind as it offers lots of opportunities to be used for evaluation in models and in ACI studies.

We will illustrate the distribution and variability of such derived CCN, evaluate them with observations and have a look at some specific features this dataset provides.

Data description paper (preprint): https://essd.copernicus.org/preprints/essd-2023-172/

How to cite: Block, K., Haghighatnasab, M., Partridge, D. G., Stier, P., and Quaas, J.: Cloud condensation nuclei concentrations derived from the CAMS reanalysis, EGU General Assembly 2024, Vienna, Austria, 14–19 Apr 2024, EGU24-21392, https://doi.org/10.5194/egusphere-egu24-21392, 2024.

EGU24-21400 | Orals | AS3.10 | Highlight

A dynamical-systems perspective on aerosol-stratocumulus interactions 

Franziska Glassmeier and Benjamin Hernandez

The evolution of stratocumulus cloud decks is governed by three timescales: the large-scale evolution of the boundary layer, the mesoscale evolution of liquid water path and cloud fraction, and the microscale processes of cloud microphysics and aerosol-cloud interactions. Our quantitative understanding of aerosol-cloud-climate cooling is especially challenged by the mesoscale response of stratocumulus decks to aerosol perturbations. This response can on the one hand be muted because cloud adjustments partially compensate an initial effect, a feature known as buffering or resilience. On the other hand, stratocumulus may respond by drastic transitions between the closed- and open-cell morphologies or into the shallow-cumulus regime. We will conceptualize this behavior from the perspective of dynamical-systems theory. Our description can be visualized as a quasi-potential landscape. This landscape quantifies the resilience of mesoscale cloud states to perturbations and charts transition pathways. Building on this, we will explore implications for the quantification of adjustments, especially in cloud fraction.

How to cite: Glassmeier, F. and Hernandez, B.: A dynamical-systems perspective on aerosol-stratocumulus interactions, EGU General Assembly 2024, Vienna, Austria, 14–19 Apr 2024, EGU24-21400, https://doi.org/10.5194/egusphere-egu24-21400, 2024.

EGU24-832 | ECS | Posters on site | AS3.12

Aerosol-cloud interactions constrain climatic trends in rainfall and temperature of India 

chandan sarangi, Pradeep Rai, Sunny Kant, Arun Nair, Soumendra Kuiry, Eric Wilcox, and Ruby Leung

Aerosol-cloud interactions (ACI) is a key uncertainty in our ability to forecast future climate. Robust evidences of aerosol-induced modifications to the structure and lifetime of both, rain bearing and non-rain bearing clouds has emerged from satellite observations across the globe in last two decades. These observations were also substantiated by many process-level simulation studies using weather models at cloud resolving scales in last decade. Thus, the significance of ACI at process scale on short-term meteorological perturbations is well agreed. However, the role of aerosol-cloud interactions on trends at climate scale is not evident yet. For example, if cloud occurrence is increasing over India, it is not clear if there is any substantial role of ACI in comparison to other governing factors. Here, we will present our analysis on the association of ACI with the recent trends in clouds, temperature and rainfall over India using satellite observations and global climate model simulations.

First, we will discuss data analysis of simulations from CMIP5 models, to quantify the importance of ACI on extreme climate indices over Indian monsoon region. The climate models were grouped based on whether the models represent only aerosol-radiation interactions (REMADE) or the full suite of aerosol-radiation-cloud interactions (REMALL). Compared to REMADE, including all aerosol effects significantly improves the model skills in simulating the observed historical trends of all three climate indices over India. Specifically, AIE enhances dry days and reduces wet days in India in the historical period, consistent with the observed changes. However, by the middle and end of the 21st century, there is a relative decrease in dry days and an increase in wet days and precipitation intensity. Further, we will also illustrate unprecedented satellite evidences of aerosol induced positive trends in marine cloud occurrences and surface temperature during pre-monsoon over the Bay of Bengal (BOB) region. In last 15 years, increased aerosol emissions over North India have led to an increase in aerosol loading till 3 km over the BOB outflow region in monsoon onset period. The elevated aerosol loading stabilizes the lower troposphere over the region in recent years and leads the low-level cloud occurrences (below 3 km) to increase in recent years by ~20%. Incidentally, the sea surface over entire BOB is steadily warming under climate change except the pollution outflow region, suggesting potential contributing to the observed non-intuitive cooling trends in sea surface temperatures.

Our findings underscore the crucial role of ACI in trends and future projections of the Indian hydroclimate and emphasizes the crucial need for improved aerosol representations in coupled models for accurate predictions of regional climate change over South Asia.

How to cite: sarangi, C., Rai, P., Kant, S., Nair, A., Kuiry, S., Wilcox, E., and Leung, R.: Aerosol-cloud interactions constrain climatic trends in rainfall and temperature of India, EGU General Assembly 2024, Vienna, Austria, 14–19 Apr 2024, EGU24-832, https://doi.org/10.5194/egusphere-egu24-832, 2024.

Understanding the link between emissions, atmospheric chemistry and the Earth’s radiative budget remains a challenge in climate research. Such linkage arises from the fact some aerosols are produced chemically in the atmosphere. Unlike well-mixed greenhouse gases, anthropogenic aerosols are heterogeneously distributed because of localised emissions and the short atmospheric residence time. Over the historical period emissions of greenhouse gases, and near-term climate forcers (NTCFs) including aerosol precursors, O3 precursors and CH4 have broadly increased. We ask how changes in anthropogenic emissions over the historical period feed through aerosol and cloud radiative forcing.  This is important because a lack of understanding of regionally heterogeneous aerosol-climate effects is hampering our understanding of historical climate change. It also limits our confidence in future climate projections and the assessment of their impacts, as aerosol emissions are expected to decline in many regions over the coming decades.

Using the UK Earth System Model 1 (UKESM1), we investigate how sulfate aerosols form under emission and oxidant changes between 1850 and 2014. We analyse simulation output from the Aerosol Chemistry Model Intercomparison Project (AerChemMIP) atmosphere-only transient experiment which was designed to evaluate NTCF transient effective radiative forcing. These simulations target each NTCF thus suitable for isolating the effects of NTCF on the Earth system responses such as aerosol and cloud formation. First, we investigate the effect of emission location on oxidation, aiming to characterise regional sulfate aerosol formation. Two regions, Europe and Eastern Asia region, were chosen to allow comparison between two regions with different emission profiles in different periods. In the UKESM1, SO2 reacts with OH in the gas phase and O3 and H2O2 in the aqueous phase. We show that emissions location and timing determine oxidation tendency via the available oxidant and meteorological properties such as clouds. Both regions see up to 80% of total sulfate production via gas phase oxidation in summer when high OH and low cloud cover are observed. The opposite is true for wintertime when aqueous phase reactions with O3 and H2O2 form up to 90% of aerosol. Each region also shows distinct characteristics, for example, H2O2 oxidation in the European region is generally lower than that of the Eastern Asia region but it is more variable with bimodal features showing peaks in spring and autumn. Second, we investigate the effects of O3 precursors and CH4 on SO2 oxidation to quantify the regional contribution of NTCFs. Influence from O3 precursors is localised while CH4 affect SO2-OH oxidation on a more global scale. This work shows that the same amount of SO2 emitted at different regions does not form aerosol at the same amount or with the same aerosol size distribution.

We present an analysis of monthly changes of oxidants and emissions to sulfur oxidation, aerosol and cloud properties. Ultimately, this work contributes to the improvement of our process-level understanding of Earth system models that interactively simulate aerosol from precursors and aims to improve the accuracy of aerosol radiative forcing predictions.

How to cite: Sakulsupich, V., Griffiths, P., and Archibald, A.: Historical sulfate aerosol formation in earth system model with interactive-chemistry: interplay between emission location, seasonality, meteorology and available oxidants, EGU General Assembly 2024, Vienna, Austria, 14–19 Apr 2024, EGU24-1018, https://doi.org/10.5194/egusphere-egu24-1018, 2024.

High Mountain Asia (HMA) has experienced a spatial imbalance in water resources in recent decades, partly because of a dipolar pattern of precipitation changes known as South Drying–North Wetting. These changes can be influenced by both human activities and internal climate variability. Although climate projections indicate a future widespread wetting trend over HMA, the timing and mechanism of the transition from a dipolar to a monopolar pattern remain unknown. Here we demonstrate that the observed dipolar precipitation change in HMA during summer is primarily driven by westerly- and monsoon-associated precipitation patterns. The weakening of the Asian westerly jet, caused by the uneven emission of anthropogenic aerosols, favoured a dipolar precipitation trend from 1951 to 2020. Moreover, the phase transition of the Interdecadal Pacific Oscillation induces an out-of-phase precipitation change between the core region of the South Asian monsoon and southeastern HMA. Under medium- or high-emission scenarios, corresponding to a global warming of 0.6–1.1 °C compared with the present, the dipolar pattern is projected to shift to a monopolar wetting trend in the 2040s. This shift in precipitation patterns is mainly attributed to the intensified jet stream resulting from reduced emissions of anthropogenic aerosols. These findings underscore the importance of considering the impact of aerosol emission reduction in future social planning by policymakers.

How to cite: Jiang, J.: Precipitation regime changes in High Mountain Asia driven by cleaner air, EGU General Assembly 2024, Vienna, Austria, 14–19 Apr 2024, EGU24-1924, https://doi.org/10.5194/egusphere-egu24-1924, 2024.

EGU24-3279 | Posters on site | AS3.12

Observational Constrained Attribution of Regional Aerosol Simulation Biases in the AerChemMIP models 

Tianyi Fan, Xiaohong Liu, Chenglai Wu, and Yi Gao

     Regional aerosol simulation biases in climate models have been noted since the CMIP5 era. The biases can cause noticeable error in the radiative forcing estimations. In this research, we investigate the aerosol optical depth (AOD) biases over China from 2002 to 2015 in nine climate models that participate the Aerosol and Chemistry Model Intercomparison Project (AerChemMIP) of CMIP6. The AerChemMIP ensemble mean is high biased over four populated regions in winter and low biased in two populated regions compared to the MODIS satellite retrievals. The patterns of model biases were persistent over years. Large inter-model spread is found in the high AOD regions. We decompose AOD to the product of emission rate, lifetime and mass extinction coefficient such that the AOD biases can be attributed to the errors of each term and their cross error term. The error of each term is analyzed by first regressing to several observable predictors, such as precipitation, Angström exponent, and relative humidity, followed by constraining the predictors by observational or reanalysis data. The results show that error due to emission dominates for many models, followed by lifetime and MEC errors. Furthermore, we argue that for regional analysis, due to imbalance between emission and removal fluxes, the removal/emission ratio should be further constrained by observations. This study provides a diagnosis for climate models to improve their simulation in aerosol loading on regional scale by optimizing the modeling of meteorology as well as aerosol properties and life cycle. 

How to cite: Fan, T., Liu, X., Wu, C., and Gao, Y.: Observational Constrained Attribution of Regional Aerosol Simulation Biases in the AerChemMIP models, EGU General Assembly 2024, Vienna, Austria, 14–19 Apr 2024, EGU24-3279, https://doi.org/10.5194/egusphere-egu24-3279, 2024.

EGU24-3748 | ECS | Posters on site | AS3.12

Evaluation of CMIP6 model simulations of PM2.5 and its components over China 

Fangxuan Ren, Jintai Lin, Jamiu A. Adeniran, Jingxu Wang, Randall V. Martin, Aaron van Donkelaar, Melanie S. Hammer, Larry W. Horowitz, Steven T. Turnock, Naga Oshima, Jie Zhang, Susanne Bauer, Kostas Tsigaridis, Øyvind Seland, Pierre Nabat, David Neubauer, Gary Strand, Twan van Noije, Philippe Le Sager, and Toshihiko Takemura and the ACM Group

Earth system models (ESMs) participating in the latest Coupled Model Intercomparison Project Phase 6 (CMIP6) simulate various components of fine particulate matter (PM2.5) as major climate forcers. Yet the model performance for PM2.5 components remains little evaluated due in part to lack of observational data. Here, we evaluate near-surface concentrations of PM2.5 and its five main components over China as simulated by fourteen CMIP6 models, including organic carbon (OC, available in 14 models), black carbon (BC, 14 models), sulfate (14 models), nitrate (4 models), and ammonium (5 models). For this purpose, we collect observational data between 2000 and 2014 from a satellite-based dataset for total PM2.5 and from 2469 measurement records in the literature for PM2.5 components. Seven models output total PM2.5 concentrations, and they all underestimate the observed total PM2.5 over eastern China, with GFDL-ESM4 (–1.5%) and MPI-ESM-1-2-HAM (–1.1%) exhibiting the smallest biases averaged over the whole country. The other seven models, for which we recalculate total PM2.5 from the available components output, underestimate the total PM2.5 concentrations, partly because of the missing model representations of nitrate and ammonium. Concentrations of the five individual components are underestimated in almost all models, except that sulfate is overestimated in MPI-ESM-1-2-HAM by 12.6% and in MRI-ESM2-0 by 24.5%. The underestimation is the largest for OC (by –71.2% to –37.8% across the 14 models) and the smallest for BC (–47.9% to –12.1%). The multi-model mean (MMM) reproduces fairly well the observed spatial pattern for OC (R = 0.51), sulfate (R = 0.57), nitrate (R = 0.70) and ammonium (R = 0.75), yet the agreement is poorer for BC (R = 0.39). The varying performances of ESMs on total PM2.5 and its components have important implications for the modeled magnitude and spatial pattern of aerosol radiative forcing.

How to cite: Ren, F., Lin, J., Adeniran, J. A., Wang, J., Martin, R. V., van Donkelaar, A., Hammer, M. S., Horowitz, L. W., Turnock, S. T., Oshima, N., Zhang, J., Bauer, S., Tsigaridis, K., Seland, Ø., Nabat, P., Neubauer, D., Strand, G., van Noije, T., Le Sager, P., and Takemura, T. and the ACM Group: Evaluation of CMIP6 model simulations of PM2.5 and its components over China, EGU General Assembly 2024, Vienna, Austria, 14–19 Apr 2024, EGU24-3748, https://doi.org/10.5194/egusphere-egu24-3748, 2024.

Past decades witnessed strong spatial changes in the emissions of anthropogenic aerosols and their precursors resulting in a global redistribution of maxima in the anthropogenic aerosol optical depth. This study investigates the response of the circulation to the different anthropogenic aerosol patterns around the 1970s and 2000s with focus on the meridional heat transport. Our analysis uses 309 historical model experiments of the Coupled Model Intercomparison Project Phase 6 and 94 single-forcing experiments for anthropogenic aerosols from the Detection and Attribution Model Intercomparison Project (DAMIP). We substantially reduce the influence of internal variability by computing multi-model multi-realization means and additional averaging over time periods of 15 years. The results highlight the influence of anthropogenic aerosol radiative effects on the total northward heat transport. Around the 1970s, most anthropogenic aerosols were located over Europe, North America and the North Atlantic. At that time, the anthropogenic aerosol increase explains almost half of the total change in the summertime northward heat transport in the tropics compared to pre-industrial times. In polar regions, the anthropogenic aerosols around the 1970s counteracted the induced response of the northward heat transport to greenhouse gas forcing. It suggests that changes induced by the aerosol pattern until the 1970s delayed the increase in Arctic warming in CMIP6, later known as Arctic amplification. The later change in the anthropogenic aerosol pattern between the 1970s and the 2000s led to different hemispheric asymmetries in the anthropogenic aerosol optical depth and hence the reflected shortwave radiation. Due to the associated different regional radiative effect, the change in the summertime northward heat transport in the polar region is now qualitatively similar for anthropogenic aerosols and greenhouse gas forcings for the 2000s against the 1970s. Specifically, the heat transport to the Arctic during summer increases for the 2000s compared to the 1970s consistent with emergence of Arctic amplification in the late 1970s.   

How to cite: Varma, V. and Fiedler, S.: Response of the northward heat transport depends on regional anthropogenic aerosol effects in CMIP6, EGU General Assembly 2024, Vienna, Austria, 14–19 Apr 2024, EGU24-5070, https://doi.org/10.5194/egusphere-egu24-5070, 2024.

Reanalysis data show the summertime circulation in the Northern Hemisphere midlatitudes has weakened significantly in the satellite era. Recent work shows the circulation weakening is not significantly affected by Arctic Amplification and Arctic Sea ice loss, but did not examine the role of other anthropogenic forcings such as aerosols. Here we use Detection and Attribution Model Intercomparison Project (DAMIP) simulations, which capture the weakening trend in reanalysis data, to quantify the impact of anthropogenic forcing due to aerosols and greenhouse gases. The DAMIP simulations show aerosol forcing dominates the weakening of the circulation across the Eurasia-Pacific sector, including the Pacific jet and storm track. Aerosol and greenhouse gases contribute equally to weakening the Atlantic jet and storm track. We use an energetic framework to understand the impact of aerosols on the storm track. In particular we show aerosol forcing leads to an increasing surface shortwave radiation trend over Western Europe and a decreasing surface shortwave trend over South and East Asia. These shortwave trends induce a weakening trend of the equator-to-pole energy gradient that leads to a weaker downstream storm track. Overall, our results show aerosol forcing is a dominant factor in regional circulation trends during Northern Hemisphere summertime in the satellite era. They have important implications for interpreting summertime heatwave trends in the Northern Hemisphere midlatitudes during summertime.

How to cite: Shaw, T., Kang, J., and Sun, L.: Anthropogenic aerosol forcing has significantly weakened regional summertime storminess in the Northern Hemisphere in the satellite era, EGU General Assembly 2024, Vienna, Austria, 14–19 Apr 2024, EGU24-5265, https://doi.org/10.5194/egusphere-egu24-5265, 2024.

EGU24-7692 | ECS | Posters on site | AS3.12

Aligning experimental and model perspectives on atmospheric nanoparticle growth 

Dominik Stolzenburg, Runlong Cai, Sara Blichner, Jenni Kontkanen, Putian Zhou, Risto Makkonen, Veli-Matti Kerminen, Markku Kulmala, Ilona Riipinen, and Juha Kangasluoma

The process of new particle formation from gas-phase precursors holds significant importance in Earth's atmosphere and introduces a notable source of uncertainty in climate change predictions. The growth of freshly formed molecular clusters should in theory be crucial for the climate impact of new particle formation, influencing the survival probability of these particles exponentially and determining their ability to act as cloud condensation nuclei. However, defining the fundamental aspects of nanoparticle growth is intricate. It involves a complex interplay of condensational and reactive vapor uptake, aerosol coagulation, sink processes, and a diverse array of potential gaseous precursors. Observational nanoparticle growth rates, derived from the evolution of the particle-size distribution, portray growth as a collective phenomenon. However, models often interpret these rates at a single-particle level, integrating them into simplified size-distribution representations (Stolzenburg et al., 2023). dditionally, many models only consider a limited subset of condensable vapors, while recent experimental observations identify an increasing number of potential contributors to new particle growth.

Our objective here is to bridge the gap between experimental and modeling studies on nanoparticle growth. We compare three large-scale models (NorESM, ECHAM, and TM5) regarding their sensitivity to organic nanoparticle growth processes. Surprisingly, we find a much lower sensitivity than anticipated from box models. Through the inclusion of a sectional scheme into NorESM, we demonstrate that representing the complexity of size distribution dynamics leads to significantly different cloud condensation nuclei (CCN) levels. Furthermore, our results suggest that, on regional scales, sensitivity to organic growth is much higher. Inclusion of additional growth processes and/or a scaling of condensable vapor concentrations could yield a significantly altered climate response. In turn, comprehensive experimental observations from e.g. the open oceans are still lacking and we show that continental data exhibit surprisingly little variation in measured particle growth rates. The latter indicates limited sensitivity in current experimental approaches and potential unaccounted multi-phase chemistry in the growth process.

Consequently, we propose specific guidance for future research to address questions regarding the buffered climate response in large-scale models and the unexpectedly low variation observed in global growth measurements. We advocate for more sensitivity studies and improved model-measurement comparisons.

References:

Stolzenburg, D., Cai, R., Blichner, S. M., Kontkanen, J., Zhou, P., Makkonen, R., Kerminen, V.-M., Kulmala, M., and Kangasluoma, J.: Atmospheric nanoparticle growth, Rev. Mod. Phys., 95, 045002, https://doi.org/10.1103/RevModPhys.95.045002, 2023.


How to cite: Stolzenburg, D., Cai, R., Blichner, S., Kontkanen, J., Zhou, P., Makkonen, R., Kerminen, V.-M., Kulmala, M., Riipinen, I., and Kangasluoma, J.: Aligning experimental and model perspectives on atmospheric nanoparticle growth, EGU General Assembly 2024, Vienna, Austria, 14–19 Apr 2024, EGU24-7692, https://doi.org/10.5194/egusphere-egu24-7692, 2024.

EGU24-7782 | ECS | Orals | AS3.12

The Local and Remote Impacts of Asian Aerosol Forcings on the East Asian Winter Monsoon and ENSO 

Zixuan Jia, Massimo Bollasina, and Wenjun Zhang

The East Asian winter monsoon (EAWM) is a prominent feature of the northern hemisphere atmospheric circulation during boreal winter, which has a large influence on the weather and climate of the Asian-Pacific region. At interannual time scales, the strength of the EAWM is strongly influenced by the El Niño-Southern Oscillation (ENSO). With the increasing influence of human activities, the greenhouse gas-driven changes in the climate mean state and the interannual variability of the EAWM received widespread attention. However, the impact of anthropogenic aerosols has been considered only in a few studies, which may accelerate or counteract greenhouse gas-driven climatic changes over different regions. Using fixed sea surface temperature and atmosphere–ocean coupled simulations from the Precipitation Driver Response Model Intercomparison Project (PDRMIP), the local and remote impacts of Asian aerosol forcings on the broad East Asian-Pacific region are examined. Results indicate that increased sulfate concentrations over Asia by a factor of 10 strengthen the EAWM through the regional aerosol‐induced cooling first, then extend the EAWM circulation southeastward through the broader cooling over the Maritime Continent and the North Pacific. Remotely, the cooler Northern Hemisphere shifts the Intertropical Convergence Zone (ITCZ) toward the south, and the warmer sea surface temperature (SST) over the equatorial eastern Pacific leads to western-central equatorial Pacific westerly wind anomalies. These changes contribute to the increase in the ENSO’s amplitude, mainly through strengthening the Bjerknes or zonal wind feedback. Furthermore, in response to the increase in extreme El Niño and La Niña frequency, the interannual variability of the EAWM increases, with more extreme strong and weak EAWM years.

How to cite: Jia, Z., Bollasina, M., and Zhang, W.: The Local and Remote Impacts of Asian Aerosol Forcings on the East Asian Winter Monsoon and ENSO, EGU General Assembly 2024, Vienna, Austria, 14–19 Apr 2024, EGU24-7782, https://doi.org/10.5194/egusphere-egu24-7782, 2024.

Current and expected future aerosol emission changes are particularly strong in East and South Asia, where high population densities imply high potential climate risk. Hence, there is an urgent need for improved knowledge about the near-term influences of changes in aerosol emissions. Here we have developed a set of Systematic Regional Aerosol Perturbations (SyRAP) using the reduced complexity climate model FORTE 2.0 to explore the effects of aerosol-driven climate change. Results show that the increased Black Carbon(BC) concentrations over China and India lead to decreased local surface Temperature (Ts) and precipitation, with seasonal differences in the spatial distribution. Chinese (Indian) BC emissions also impact on Indian (Chinese) climate in specific seasons. The changes of shortwave radiation (SW) dominate the surface cooling and the lower tropospheric warming due to the absorption of BC. The reductions of column-intergrated diabatic cooling lead to the decreased local precipitation, while the changes in atmospheric circulation play an opposite role (weakened EAWM, enhanced EASM and ISM). The horizontal/vertical distributions of air temperature anomalies can induce the changes in cloud cover and atmospheric circulation, which further impact on the radiation flux and precipitation. Additionally, the increased surface albedo in winter is helpful to decrease Ts and precipitation.

How to cite: Luo, F.: Physical processes influencing the Asian climate due to the black carbon emissions over China and India, EGU General Assembly 2024, Vienna, Austria, 14–19 Apr 2024, EGU24-8099, https://doi.org/10.5194/egusphere-egu24-8099, 2024.

EGU24-12414 | ECS | Orals | AS3.12

The fast response of precipitation to historical black and sulfate aerosols in the GFDL ESM4 climate model 

Yanda zhang, Tom Knutson, Elena Shevliakova, and Daniel Westervelt

Aerosol effects on precipitation are crucial factors in climate change, yet they remain poorly understood, representing a large source of uncertainty in climate models. In the GFDL Earth System Model 4 (ESM4), simulated historical century-scale trends of global land precipitation demonstrate significant dry biases compared to observations, even with observed historical variations of sea surface temperature and sea ice concentrations (LongAMIP simulation). The biases manifest as overestimated decreasing precipitation trends over tropical-subtropical land and underestimated increases in higher latitudes. In this study, we investigate the “fast response” of precipitation to historical anthropogenic aerosol emissions and its contributions to the model trend biases, by conducting idealized ESM4 LongAMIP experiments with emissions of either black carbon (BC) sulfate (SO4) aerosol precursors set to near-pre-industrial levels (1850). Aerosol direct radiative effects emerge as critical drivers of excessive precipitation declines in some regions: (1) over East Asia, the negative SO4 effect and positive BC effect contribute to changes in historical precipitation and the associated model responses lead to the simulation bias. (2) For regions of Africa, the negative fast response to SO4 partially contributes to the overestimated precipitation decline. (3) Over west-central North America, the negative fast response to BC in the model contributes toward underestimating a modest observed increasing precipitation trend. However, over eastern North America and Northwest Eurasia, the fast responses of precipitation to aerosols cannot account for the opposite direction of model bias, indicating the dominant influence of other factors.

How to cite: zhang, Y., Knutson, T., Shevliakova, E., and Westervelt, D.: The fast response of precipitation to historical black and sulfate aerosols in the GFDL ESM4 climate model, EGU General Assembly 2024, Vienna, Austria, 14–19 Apr 2024, EGU24-12414, https://doi.org/10.5194/egusphere-egu24-12414, 2024.

EGU24-15079 | Posters on site | AS3.12

An uncertain future for anthropogenic aerosols in Africa, and their climate and health impacts 

Marianne T. Lund, Joe A. Amooli, Sourangsu Chowdhury, Ane N. Johansen, Bjørn H. Samset, and Daniel M. Westervelt

We explore the wide spread in projections of African mid-century anthropogenic air pollution levels, and associated health impacts, resulting from the large diversity in available future emission pathways for the region.

While emissions of aerosols and their precursors have declined in some regions, first in North America and Europe, more recently in China, many low- and middle-income countries, including much of Africa, are increasing their emissions and are projected to continue to do so with future industrialization, although the evolution depends in socioeconomic and technological factors. This is likely to drive changes in climate hazards as well as deterioration of air quality, increasing risks for under-resourced, vulnerable populations. The impacts of African aerosols on regional temperature, hydroclimate, and extreme events are, however, less well studied and quantified than for other historical emission hotspots. Moreover, very limited data availability and distinct regional characteristics of sources result in high uncertainties in estimates of African emissions. This uncertainty translates into future projections, which exhibit a striking spread in magnitudes and trends. For instance, available estimates for emissions of sulfur dioxide and black carbon in 2050 differ by up to 70% and 90% between the Shared Socioeconomic Pathways (SSPs) and scenarios developed for the UN Environmental Programme’s (UNEP) Integrated Assessment of Air Pollution and Climate Change in Africa.

Here we explore implications of this spread for downstream modeled quantities of relevance for climate and health impact assessments. We use emissions from 10 different pathways as input to the chemical transport model OsloCTM3 and simulate the distribution of anthropogenic aerosols across the African continent in 2050. The associated impact on premature mortality is calculated. Preliminary results show surface PM2.5 concentrations differing by up to a factor 2 between the highest and lowest scenario when averaged over the African continents, with markedly higher local spread. Sub-continental differences are substantial, pointing to the need to consider Africa in more geographical detail than often done.

How to cite: Lund, M. T., Amooli, J. A., Chowdhury, S., Johansen, A. N., Samset, B. H., and Westervelt, D. M.: An uncertain future for anthropogenic aerosols in Africa, and their climate and health impacts, EGU General Assembly 2024, Vienna, Austria, 14–19 Apr 2024, EGU24-15079, https://doi.org/10.5194/egusphere-egu24-15079, 2024.

EGU24-16012 | ECS | Posters on site | AS3.12

Apportionment of absorption in complex aerosols in South Africa 

Clarissa Baldo, Brigitte Language, Tommaso Isolabella, Virginia Vernocchi, Dario Massabò, Claudia Di Biagio, Pieter Van Zyl, Stuart Piketh, and Paola Formenti

South Africa, with its industrialised economy, faces unique air pollution challenges. Our study investigates aerosol composition and absorption in the Highveld region. Understanding aerosol absorption is critical as it affects climate, air quality, and public health. Aerosol absorption in the lower atmosphere affects the evolution of the boundary layer and the dispersion of pollutants, which in turn affects air quality and public health. Aerosol filter samples (PM10 fractions) were collected from residential, traffic, and industrial sites during the dry season. Chemical analyses, including X-ray fluorescence, thermo-optical analysis, and ion chromatography, were carried out to determine elemental species, carbonaceous species, and water-soluble ions, respectively. Based on this, a mass closure calculation was performed to define the contribution of five major aerosol components. The calculated aerosol mass concentrations were in good agreement with the measurements (Normalised Mean Bias, NMB < 7%). No significant variation in PM10 concentration was observed between site types. Mineral dust appeared to be the main contributor to PM10, varying from about 48%-60% at different sites, followed by organic matter (OM, 22%-35%), secondary inorganic aerosols (SIA, 9%-12%), elemental carbon (EC, 4%-7%), and sea salt (ss, 1%-2%).

Aerosol spectral absorption was obtained from multi-wavelength absorbance analysis (MWAA) measurements at 375, 407, 532, 635, and 850 nm. High absorption was measured in the following order: industrial> residential> traffic sites. The estimated absorption Ångström exponent (AAE) varied from 0.8 to 2 at different sites, indicating the contribution of several sources. At 850 nm absorption correlates well with EC as expected (r = 0.85). The obtained mass absorption efficiency (8 m2/g) is in line with expectations. Specific tracers were used to determine the contribution of the main absorbing aerosol components - black carbon (BC), brown organic carbon (BrC) from incomplete biomass combustion, and mineral dust - using correlations between estimated mass and measured absorption. Preliminary results indicate that although BC is the major contributor to absorption, accounting for 30%-60% absorption at 375 nm, followed by BrC 10%-50%, the contribution of the less absorbing but more abundant mineral dust is not negligible and can range from 2% to 50% in different samples. These results underline the complexity of aerosols in the region and their high absorption properties, and the need for a comprehensive understanding of its various components to accurately assess its impact.

How to cite: Baldo, C., Language, B., Isolabella, T., Vernocchi, V., Massabò, D., Di Biagio, C., Van Zyl, P., Piketh, S., and Formenti, P.: Apportionment of absorption in complex aerosols in South Africa, EGU General Assembly 2024, Vienna, Austria, 14–19 Apr 2024, EGU24-16012, https://doi.org/10.5194/egusphere-egu24-16012, 2024.

EGU24-18153 | ECS | Orals | AS3.12 | Highlight

Why climate models underestimate the exacerbated summer warming in Western Europe 

Dominik L. Schumacher, Jitendra Singh, Mathias Hauser, Erich M. Fischer, Martin Wild, and Sonia I. Seneviratne

Since 1980, mean summer temperatures in Western Europe have warmed three times faster than global mean temperatures. This strong warming of about 2.3 °C tends to be underestimated in model simulations, affecting both global and in particular regional climate models (RCMs). We demonstrate that the majority of global and regional climate model simulations exhibit weaker circulation-related warming contributions than observed, partly accounting for the discrepancy between observations and models. Crucially, most RCMs from the Coordinated Regional Downscaling Experiment (CORDEX) additionally underestimate the thermodynamic contribution to warming that occurs primarily in response to anthropogenic forcings. Because the driving global climate models of the CORDEX RCM simulations all provide at least sufficient, and typically even excessive global background warming, this partly compensates for the frequent lack of regional thermodynamic warming. We find that the main cause of the latter is the widespread use of constant aerosol concentrations in RCM simulations, such that the regional brightening and associated warming in Europe due to aerosol reductions in the past decades is not captured. 

We infer a summer warming underestimation of about 0.5 °C since 1980 when relying on RCMs with constant rather than evolving aerosols over Western Europe, although this depends on the GCM–RCM ensemble subset. Locally, in parts of Eastern Europe with stronger aerosol reductions than further west, the discrepancies can exceed 1 °C. The use of constant aerosol representations not only contributes to the summer warming discrepancy in Europe but also impacts other seasons except winter. At the timescales of heat extremes, the aerosol representation-inflicted mismatch manifests even more clearly: heatwave intensity changes since 1980 are already underestimated by RCMs with constant aerosols by about 1°C in western Europe, and the warming discrepancies grow even larger in projections, exceeding 2 °C in large parts of Europe and at the end of the ongoing century. Our work highlights the importance of representing all relevant external forcings and associated responses in RCM simulations, as the added value of high-resolution climate projections is questionable when the strong regional brightening and warming in Europe and other regions is by design omitted.

How to cite: Schumacher, D. L., Singh, J., Hauser, M., Fischer, E. M., Wild, M., and Seneviratne, S. I.: Why climate models underestimate the exacerbated summer warming in Western Europe, EGU General Assembly 2024, Vienna, Austria, 14–19 Apr 2024, EGU24-18153, https://doi.org/10.5194/egusphere-egu24-18153, 2024.

Current extremes within regional water cycles, extensive drought periods and torrential flooding, are   associated in literature and media to first indicators of greenhouse gas driven climate change. Indeed, they are among major threats to be expected from climate change model results. The main obvious physical process behind such global warming water cycle extremes, is the temperature dependent water vapor content of air (Clausius Clapeyron, 1834, CC) and it’s increase by ~ 7% per degree C. Naturally the water vapor input into the atmosphere via evapotranspiration is dependent on shortwave radiation reaching the surface, a process controlled partially by fine particles, partially by clouds. Here the ultrafine, invisible, fraction of the aerosols is becoming important.

Ultrafine particles (UFP) acting as cloud condensation nuclei (CCN) are the driving force behind cloud modification and changing rainfall patterns. However, the sources and budgets of anthropogenic primary and secondary particles were not well known. Based on airborne measurements we identified as a major contribution modern fossil fuel flue gas cleaning techniques to cause a doubling of global primary UFP number emissions. The subsequent enhancement of CCN numbers has several side effects. It’s changing the size of the cloud droplets and delays raindrop formation, suppressing certain types of rainfall and increasing the residence time of water vapor in the atmosphere. This additional latent energy reservoir is directly available for invigoration of rainfall extremes. Additionally it’s a further contribution to the column density of water vapor as a greenhouse gas and important for the infrared radiation budget. The localized but ubiquitous fossil fuel related UFP emissions and their role in the hydrological cycle, may thus contribute to regional or continental climate trends, such as increasing drought and flooding, observed within recent decades.

We discuss the impact of the ultrafine fraction on the hydrological cycle and its historical timeline. Ultrafine particles (UFP) initially don’t interact with radiation like fine ones. However, a significant increase of the ultrafine particle burden may serve similar to CC to more water vapor molecules, respectively more latent energy in the troposphere, especially in the altitude range of convective clouds. We also discuss the origin of the majority of UFP, whether a simple dependence of ultrafine particles on the atmospheric sulphur load is a reasonable and valid assumption and what should be taken additionally into account for future UFP szenarios.

Junkermann, W. & Hacker, J., 2022, Unprecedented levels of ultrafine particles, major sources, and the hydrological cycle, Nature Scientific Reports, 12:7410 https://doi.org/10.1038/s41598-022-11500-5

Junkermann, W. (2022). Ultrafine particle emissions in the Mediterranean region. In F. Dulac, S. Sauvage, & E. Hamonou (Eds.), Atmospheric chemistry in the Mediterranean region (Vol. 2, From air pollutant sources to impacts). Springer, 21 pp. https://doi.org/10.5445/IR/1000154173

How to cite: Junkermann, W. and Hacker, J.: Invisible, overlooked, climate relevant? Unprecedented levels of ultrafine particles and the hydrological cycle, EGU General Assembly 2024, Vienna, Austria, 14–19 Apr 2024, EGU24-20286, https://doi.org/10.5194/egusphere-egu24-20286, 2024.

EGU24-20552 | Posters on site | AS3.12

Concentrations of polychlorinated dibenzo-p-dioxins and dibenzofurans in Kuala Lumpur urban environment and their potential risk to human health 

Mohd Talib Latif, Sharifah Mazrah Syed Zain, Norfazrin Mohd Hanif, Md Firoz Khan, and Jivantiran Myilravanan

Polychlorinated dibenzo-p-dioxins (PCDDs) and polychlorinated dibenzofurans (PCDFs) are persistent organic pollutants that affect human health. This study aimed to quantify the concentrations of 17 PCDDs/PCDFs congeners in ambient air in the urban environment of Kuala Lumpur and their potential risk to humans. PM2.5 and TSP were collected on quartz microfibre using separate high-volume samplers, whereas the gaseous phase and passive samples were captured on polyurethane between December 2021 and October 2022. The results show the Ʃ17PCDD/PCDF concentration in ambient air is 736 ± 375 fg WHO-TEQ m-3, whereas PM2.5, TSP, and gaseous phase concentrations are 223 ± 161 fg WHO-TEQ m-3, 337 ± 213 fg WHO-TEQ m-3 and 507 ± 273 fg WHO-TEQ m-3, respectively. The hepta- and octa-group congeners dominated up to 80% of the Ʃ17PCDDs/PCDFs and are more likely to bind with the particle phase than the gaseous phase. The Ʃ17PCDDs/PCDFs displayed a significant difference between gaseous and particle concentrations (p <0.001). Exposure to the gaseous phase of Ʃ17PCDDs/PCDFs resulted in a greater inhalation lifetime cancer risk (1.58E06-5.28E-06). This study found that the toxic equivalent (TEQ) concentrations are dominant in the gaseous phase, while cancer risks from exposure to PCDDs/PCDFs in the air are tolerable in children and adults.

How to cite: Latif, M. T., Zain, S. M. S., Mohd Hanif, N., Khan, M. F., and Myilravanan, J.: Concentrations of polychlorinated dibenzo-p-dioxins and dibenzofurans in Kuala Lumpur urban environment and their potential risk to human health, EGU General Assembly 2024, Vienna, Austria, 14–19 Apr 2024, EGU24-20552, https://doi.org/10.5194/egusphere-egu24-20552, 2024.

EGU24-20722 | Posters on site | AS3.12

Enhanced aerosol-induced near-term Arctic warming due to remote regional aerosol perturbations in RAMIP 

Daniel Westervelt, Yanda Zhang, Joe Adabouk Amooli, Kostas Tsigaridis, Larissa Nazarenko, Bjørn Samset, Laura Wilcox, and Robert Allen

The climatic implications of regional aerosol and precursor emissions reductions implemented to protect human health are poorly understood. However, quantitative estimates of climate responses to emission perturbations are needed by the climate assessment and impacts community. The Regional Aerosol Model Intercomparison Project (RAMIP) project builds on recent CMIP5 and CMIP6-era studies to help address this knowledge gap. Briefly, RAMIP will use contrasting SSP aerosol emissions (SO2, BC, OC) scenarios (SSP3-7.0 and SSP1-2.6) to isolate the impact of realistic, near term aerosol changes on climate and air quality over rapidly developing regions of South Asia, East Asia, and Africa, and over North America and Europe. At least 9 CMIP6-generation global climate models are contributing to this new MIP, which uniquely focuses on specific regional aerosol emissions changes rather than simultaneous global changes. This presentation will specifically present the first results from several participating models in RAMIP, namely the NASA Goddard Institute for Space Studies (GISS) ModelE, UKESM, CESM2, and NorESM. All Tier 1 simulations of RAMIP are included, with 10 ensembles for each simulation. Initial analysis at the time of writing confirms the anticipated changes in aerosol optical depth, downwelling shortwave radiation, and aerosol mass concentration over each of the regions. The warming response to a decrease in SO2, BC, and OC is strongest in the US and Europe perturbation simulations, both globally and regionally, with Arctic warming up to 0.3 K due to a removal of US and European anthropogenic aerosol emissions alone; however, even emissions from regions more remote to the Arctic, such as South Asian aerosols, can significantly warm the Arctic up to 0.2 K. In most regions, temperatures are most sensitive to emissions perturbations within that region. Arctic warming is the most robust model response across the regional aerosol emissions perturbations. 

How to cite: Westervelt, D., Zhang, Y., Amooli, J. A., Tsigaridis, K., Nazarenko, L., Samset, B., Wilcox, L., and Allen, R.: Enhanced aerosol-induced near-term Arctic warming due to remote regional aerosol perturbations in RAMIP, EGU General Assembly 2024, Vienna, Austria, 14–19 Apr 2024, EGU24-20722, https://doi.org/10.5194/egusphere-egu24-20722, 2024.

EGU24-20840 | Orals | AS3.12

The Tables of Aerosol Optics (TAO) 

Gregory L. Schuster, Elisabeth Andrews, Eduard Chemyakin, Mian Chin, Jacek Chowdhary, Cheng Dang, Yevgeny Derimian, Arlindo da Silva, Fabrice Ducos, William Reed Espinosa, Philippe Lesueur, Richard Moore, Hans Moosmuller, Nobuhiro Moteki, Greema Regmi, Masanori Saito, Snorre Stamnes, Bastiaan van Diedenhoven, and Ping Yang

There is a need to quickly convert aerosol microphysical properties into optical properties for global modeling, data assimilation, and remote sensing applications. This is generally accomplished through look-up tables (LUTs) of aerosol mass extinction coefficients (MEC), mass absorption coefficients (MAC), asymmetry parameters, normalized phase functions, etc. Unfortunately, many scientists are using outdated LUTs that are based upon measurements and computational techniques first published by Shettle and Fenn (1979) and later updated by Hess et al. (1998). Thus, the computations in common use are still largely based upon Mie theory and in situ information that has not been updated during this century.

The Table of Aerosol Optics (TAO) is an open relational database (under construction) that expands upon existing LUTs by including recent measurements and new computational techniques for non-spherical particles (https://science.larc.nasa.gov/mira-wg/topics/tao/). The ‘open’ aspect of TAO is important, since the measurements and techniques of today will undoubtedly yield to different values in the future. This open architecture allows specialists to add new tables and gain exposure for their work and benefits modelers and remote sensing scientists by giving them easy access to computations that utilize the latest techniques. Quality is controlled by requiring methods to be peer-reviewed in the scientific literature.

Thus far, we have computed mass extinction coefficients, mass absorption coefficients, lidar ratios, etc., at 73 wavelengths ranging from 0.25-40 µm for black carbon (BC), brown carbon (BrC), non-absorbing organic carbon, and mineral dust. For mineral dust, we use hexahedra shapes and mineral mixtures of montmorillonite, illite, hematite, and goethite. The illite volume fraction varies from 0 to 59% to capture the range of real refractive indices found in AERONET climatologies; the sum of the hematite and goethite mass fractions are ~2%. Additional mixtures will be added as appropriate.

We have also computed optical properties for 22 size distributions of bare aggregated BC using the Multi-Sphere T-Matrix (MSTM) code (https://github.com/dmckwski/MSTM) at several remote sensing wavelengths. Our MSTM computations use aggregates of 20-nm spherules with particle-cluster growth. We obtained mass absorption coefficients (MACs) of 7.2-7.5 m2/g at a mid-visible wavelength (532 nm) when the BC fractal dimension was fixed at Df = 1.8 (i.e., fresh BC), consistent with values commonly recommended in literature reviews.

We will present the TAO vision and example results for several aerosol types. TAO is part of the Models, In situ, and Remote sensing of Aerosols (MIRA) working group. MIRA seeks to build collaboration, consistency, and openness amongst the aerosol disciplines. We seek community feedback from aerosol scientists regarding the construction and content of TAO, especially  in this early phase. Check out the MIRA webpage at https://science.larc.nasa.gov/mira-wg/ and subscribe to our mailing list at https://espo.nasa.gov/lists/listinfo/mira.

Hess et al. (1998): Optical properties of aerosols and clouds: The software package OPAC, BAMS, 79, 831–844.

Shettle and Fenn (1979): Tech. Rep. AFGL-TR-790214, Air Force Geophysics Laboratory, 1979.

How to cite: Schuster, G. L., Andrews, E., Chemyakin, E., Chin, M., Chowdhary, J., Dang, C., Derimian, Y., da Silva, A., Ducos, F., Espinosa, W. R., Lesueur, P., Moore, R., Moosmuller, H., Moteki, N., Regmi, G., Saito, M., Stamnes, S., van Diedenhoven, B., and Yang, P.: The Tables of Aerosol Optics (TAO), EGU General Assembly 2024, Vienna, Austria, 14–19 Apr 2024, EGU24-20840, https://doi.org/10.5194/egusphere-egu24-20840, 2024.

EGU24-20865 | Posters on site | AS3.12

Relational database construction for Table of Aerosol Optics 

Yevgeny Derimian, Fabrice Ducos, Philippe Lesueur, and Gregory L. Schuster

This effort is dedicated to construction of a relational database and an interactive web system that organizes and communicates aerosol optical and microphysical characteristics assembled in the Table of Aerosol Optics (TAO) community repository. The TAO project (https://science.larc.nasa.gov/mira-wg/topics/tao/) is an extension of historical efforts (e.g., Shettle and Fenn, 1979; d’Almeida et al., 1991; Koepke et al., 1997; Hess et al., 1998) on providing libraries of aerosol characteristics for applications in global chemical transport modeling and remote sensing. Aerosol characteristics such as size distribution, complex refractive index, shape, mixing state, extinction, absorption, single-scatter albedo, lidar ratio, etc. are provided for different aerosol types, wavelengths, be originated from laboratory measurements, in situ or remote sensing observations. Combination of aerosol characteristics, their origins, types, spectral domains, computational techniques used for single-scatter properties become quickly very complex and is expected to evolve in future. The open access and interactive principles of TAO implies increasing complexity of its database structure that requires involvement of dedicated computer science technics for its organization and management. The relational database conception, for instance, is widely used in many domains that require such data organization and naturally appropriates to TAO. The relational database consists in structuring the data in multiple tables, with so-called primary or foreign keys that relates between entity types, parameters and their value in unique or multiple connections. We therefore started development of tools for uploading of the TAO data into the format of relational database and creation of a web interface for an interactive communication with the community. This work is expected to be presented as complimentary to a more general presentation about the TAO project by G. L. Schuster and gather valuable feedbacks from modelers, in situ and remote sensing experts on the data needs, convenient exchange formats and potential applications.

How to cite: Derimian, Y., Ducos, F., Lesueur, P., and Schuster, G. L.: Relational database construction for Table of Aerosol Optics, EGU General Assembly 2024, Vienna, Austria, 14–19 Apr 2024, EGU24-20865, https://doi.org/10.5194/egusphere-egu24-20865, 2024.

EGU24-21847 | Orals | AS3.12 | Highlight

Climate responses to a rapid phaseout of sulfur in shipping emissions: A large ensemble study 

Duncan Watson-Parris, Bjørn H. Samset, Robert Allen, Massimo Bollasina, Annica Ekman, Carley Iles, Manoj Joshi, Anna Lewinschal, Marianne T. Lund, Joonas Merikanto, Kalle Nordling, Geeta Persad, Camilla W. Stjern, Dan Westervelt, Laura J. Wilcox, and Andrew Williams

In 2020, motivated by improving air quality in major ports and shipping lanes, the International Maritime Organization imposed strict new regulations on the sulfur content of shipping fuel. This led to a rapid reduction in the number of observed ship tracks (linear tracks of clouds brightened by aerosol perturbations; Watson-Parris et al. 2022), and presumably a commensurate reduction in anthropogenic aerosol forcing. The magnitude of this forcing, and the resulting temperature change, are uncertain however. The recent confirmation that 2023 was the hottest year on record can only partly be explained by the onset of the El Niño phase of the El Niño-Southern Oscillation (ENSO). Such warming, in addition to the sizable warming in NH ocean basins- geographically collocated with shipping- raise the question of how much shipping emissions changes might have contributed to this signal, and any extreme weather events associated with it.


In this study we aim to answer this question by utilizing a large ensemble of fully-coupled Community Earth System Model version 2 (CESM2) simulations with and without the shipping emissions changes. We leverage the CESM2 large ensemble and choose 20 simulations with varying ENSO conditions from which to branch off with shipping emissions reduced to 20% of their baseline value. These are integrated forward for another 20 years, while non-shipping emissions follow the SSP3-7.0 scenario, in order to robustly explore the transient climate response.

In this talk we will highlight the forced climate response, focusing on temperature (T), precipitation (P), and atmospheric circulation, both globally and in key regions such as the North Atlantic. Given the change in ENSO phase during 2023, we will also describe how this climate response is modulated by different ENSO conditions, the Atlantic Multidecadal Variability and other modes of climate variability. The underlying relevant climate processes, including cloud dynamics, radiative imbalances at the top of the atmosphere, and daily variability will be summarized to link our single model study to observed changes.

References:

[1] Watson-Parris, D., Christensen, M., Laurenson, A., Clewley, D., Gryspeerdt, E., Stier, P. “Shipping regulations lead to large reduction in cloud perturbations”. PNAS 119 (41) e2206885119: https://doi.org/10.1073/pnas.2206885119 (2022)

How to cite: Watson-Parris, D., Samset, B. H., Allen, R., Bollasina, M., Ekman, A., Iles, C., Joshi, M., Lewinschal, A., Lund, M. T., Merikanto, J., Nordling, K., Persad, G., Stjern, C. W., Westervelt, D., Wilcox, L. J., and Williams, A.: Climate responses to a rapid phaseout of sulfur in shipping emissions: A large ensemble study, EGU General Assembly 2024, Vienna, Austria, 14–19 Apr 2024, EGU24-21847, https://doi.org/10.5194/egusphere-egu24-21847, 2024.

EGU24-1919 | ECS | Posters on site | AS3.13

Easy Volcanic Aerosol version 2: progress toward an updated volcanic aerosol forcing generator 

Sujan Khanal, Matthew Toohey, Thomas Aubry, and Domenic Neufeld

The Easy Volcanic Aerosol (EVA) family of simple models offers an approach to the generation of stratospheric aerosol fields from estimates of volcanic emissions. EVA takes as input a time series of volcanic eruption data, including the mass of sulfur injected into the stratosphere and location of the eruptions, and outputs aerosol optical properties as a function of time, latitude, height and wavelength based on a simple box-model of stratospheric transport. These aerosol properties are tailored for use as volcanic aerosol forcing in climate models. They are also useful as general quantitative estimates of the impact of volcanic eruptions on climate. EVA version 1 was based on observations of the aerosol from the 1991 Mt. Pinatubo eruption, while EVA_H was parameterized to improve agreement with a range of smaller magnitude eruptions observed over the 1979-2015 period, taking account of the estimated injection height of the emitted sulfur. Here, we present progress in the development of EVA version 2, which improves the fidelity of its output based on various important updates. The model accounts for bi-modal particle size distributions, in line with in-situ observations of Pinatubo aerosol plume. It can also account for the uncertainty in aerosol forcing due to the uncertainty in measurements of the refractive index of sulfuric acid solution. Further updates include implementation of a new method for incorporating injection height and its impact on aerosol growth and evolution. Improvements in the fidelity of aerosol properties is balanced with the aim of simplicity, making EVA2 well-suited for idealized model experiments as well as reconstructions of past volcanic forcing. We compare the results of EVA2 with observational data sets and quantify the impact of updates on reconstructions of volcanic forcing over periods relevant to upcoming CMIP7 experiments.

How to cite: Khanal, S., Toohey, M., Aubry, T., and Neufeld, D.: Easy Volcanic Aerosol version 2: progress toward an updated volcanic aerosol forcing generator, EGU General Assembly 2024, Vienna, Austria, 14–19 Apr 2024, EGU24-1919, https://doi.org/10.5194/egusphere-egu24-1919, 2024.

EGU24-1987 | Orals | AS3.13

Atmosphere injection of sea salts during the 15 January 2022 submarine eruption of Hunga volcano, Tonga 

Mathieu Colombier, Ingrid A. Ukstins, Susann Tegtmeier, Bettina Scheu, Shane J. Cronin, Simon Thivet, Joali Paredes‑Mariño, Corrado Cimarelli, Kai-Uwe Hess, Taaniela Kula, Folauhola H. Latu’ila, and Donald B. Dingwell

The 15 January 2022 submarine eruption at Hunga volcano was the most explosive volcanic eruption in 140 years. It involved exceptional magma and seawater interaction throughout the entire submarine caldera collapse. The submarine volcanic jet breached the sea surface and formed a subaerial eruptive plume that transported volcanic ash, gas, sea salts and seawater up to ~ 57 km, reaching into the mesosphere. We document high concentrations of sea salts in volcanic ash collected shortly after deposition. We discuss the potential climatic consequences of large-scale injection of salts into the upper atmosphere during submarine eruptions. Sodium chloride in these volcanic plumes can reach extreme concentrations, and dehalogenation of chlorides and bromides poses the risk of long-term atmospheric and weather impact. We also discuss high concentrations of Ca-sulfates, originating from both seawater-ash interaction and gas scavenging of SO2 within ash aggregates. The discrepancy between the SO2 measured by satellites and values expected from degassing may be explained by a combination of such SO2 uptake and additional SO2 release to the sea via passive degassing prior to the eruption or with ejecta in submarine gravity currents. The balance between salt loading into the atmosphere versus deposition in ash aggregates is a key factor in understanding the atmospheric and climatic consequences of submarine eruptions.

How to cite: Colombier, M., Ukstins, I. A., Tegtmeier, S., Scheu, B., Cronin, S. J., Thivet, S., Paredes‑Mariño, J., Cimarelli, C., Hess, K.-U., Kula, T., Latu’ila, F. H., and Dingwell, D. B.: Atmosphere injection of sea salts during the 15 January 2022 submarine eruption of Hunga volcano, Tonga, EGU General Assembly 2024, Vienna, Austria, 14–19 Apr 2024, EGU24-1987, https://doi.org/10.5194/egusphere-egu24-1987, 2024.

EGU24-2141 | Posters on site | AS3.13

Modeling of Instantaneous and Adjusted Radiative Forcing of the 2022 Hunga Volcano Explosion.   

Georgiy Stenchikov, Alex Ukhov, and Sergey Osipov

We used the regional meteorology-chemistry model WRF-Chem with bin’s sulfate aerosol microphysics to study the climate impact of the Hunga volcano eruption on January 15, 2022. We conduct simulations in the 45S-10N latitude band with periodic boundary conditions in longitude and lateral boundary conditions prescribed from ERA-Interim reanalysis that constrain meteorological fields. The spectral nudging of the horizontal wind components in the stratosphere imposes the QBO.

To simulate the Hunga volcano eruption, we injected 150 Mt of water vapor (WV) and 0.45 Mt of SO2 into the middle stratosphere at 35 km. Because of the relatively high stratospheric temperature at that altitude, about 120 Mt of water was retained in the stratosphere. The volcanic water vapor cloud was cooled by thermal radiation and, therefore, descended to 25 km in about two weeks. Both the simulated mass of the remaining WV and the altitude of the volcanic “water” layer agree with observations. The zonal mean anomaly of volcanic WV mixing ratio averaged over the 30S-10N latitude belt at 25 km exceeded 10 ppmv for two weeks after the eruption. Still, it reduced to 3-4 ppmv in three months. The global water vapor instantaneous LW radiative forcing at the top of the atmosphere (TOA) appears negative, reaching -0.028 W/m2. At the surface, water vapor radiative forcing is two orders of magnitude smaller than at TOA.

Volcanic SO2 was oxidized in 3-4 weeks. Sulfate aerosol's effective radius grows to 0.4 mm a month after the eruption but decreases to 0.2 m in 3-4 months. The instantaneous globally averaged radiative forcing of volcanic sulfate aerosols is about one order of magnitude stronger than TOA’s water vapor forcing, reaching -0.15 W/m2 a month after the eruption at TOA and surface.

Sulfate aerosols absorb SW and LW radiation, warming the stratosphere, but the loss of heat by thermal emission of water vapor cools the stratosphere by 1K. This cooling decreases the outgoing LW flux at TOA and the downward LW flux at the tropopause. As a result, WV's adjusted global LW radiative forcing becomes positive at TOA, reaching 0.04 W/m2 at TOA and the tropopause. The clear-sky SW forcing is not affected by the stratospheric temperature adjustment. A comparison of water vapor radiative forcing calculated using broadband and line-by-line stand-alone radiative transfer models shows that the RRTM broadband model widely used in global and regional models overestimates the WV radiative forcing almost twice.

Thus, we found that sulfate aerosols dominate the radiative forcing generated by the Hunga volcano eruption for at least eight months after the explosion. By then, the sulfate aerosols and WV forcings decreased 3-5 times compared to their pick values. The direct Hunga aerosol radiative forcing is about 30 times smaller than that of the 1991 Pinatubo eruption. The direct WV radiative forcing at the surface is negligibly tiny all the time. It cannot activate the slow ocean feedback and, therefore, cannot cause long-term climate perturbations. However, strong stratospheric cooling, associated changes in stratospheric circulation, and ozone depletion might affect tropospheric climate indirectly.

How to cite: Stenchikov, G., Ukhov, A., and Osipov, S.: Modeling of Instantaneous and Adjusted Radiative Forcing of the 2022 Hunga Volcano Explosion.  , EGU General Assembly 2024, Vienna, Austria, 14–19 Apr 2024, EGU24-2141, https://doi.org/10.5194/egusphere-egu24-2141, 2024.

EGU24-3480 | ECS | Posters on site | AS3.13

High-resolution volcanic SO2 emissions in WACCM produce more realistic AODs 

Emma Axebrink, Johan Friberg, and Moa K. Sporre

Volcanic climate impact is strongly correlated with how high its effluents reach in the atmosphere. Volcanic SO2 injected into the stratosphere can have a residence time of several years, whereas injections in the troposphere only have a residence time of weeks.
We have performed simulations of the 2009 Sarychev eruption with the Community Earth System Model version 2 (CESM2), Whole Atmosphere Community Climate Model version 6 (WACCM6). We have compared the standard model dataset with two high-resolution datasets developed in our group to investigate the importance of utilizing highly vertically and horizontally resolved SO2 datasets. The default dataset M16 [1] used in WACCM has a vertical resolution of 1 km and is released in one latitude longitude gridbox. Our two high-vertical resolution datasets, S21-3D, and S21-1D, were created from the dataset of Sandvik et al. [2]. These datasets have a vertical resolution of 200 m, spanning from 7.6 to 18.6 km. S21-3D is distributed over several latitudes and longitudes, whereas S21-1D releases all SO2 in one latitude longitude gridbox to mimic the default dataset in WACCM.

The SO2 from S21-3D, and S21-1D is injected at a higher altitude than the M16, leading to a longer residence time for both the SO2 and the formed stratospheric aerosol. The S21-3D dataset has the highest stratospheric SO2 and SO4 concentrations of the three simulations and the concentrations peak later than the other two simulations. The results from the S21-1D dataset are similar to those from the S21-3D simulation but with slightly lower concentrations.

The simulated S21-3D AOD agrees with AOD from the space-borne lidar instrument CALIOP. In the simulation with the M16 dataset, the AOD is underestimated by >50%. The volcanic radiative forcing from the Sarychev eruption was 31% lower at the end of 2009 in the simulation with M16 compared to the simulation with S21-3D.

Our results show that the vertical resolution of SO2 injections substantially impacts the model’s ability to correctly simulate the climate effects of volcanic eruptions, especially if the SO2 is injected in the vicinity of the tropopause.

Future work will involve simulating a high vertically resolved dataset of SO2 of other volcanic eruptions since 2006.

References

[1] Mills, M. J., A. Schmidt, R. Easter, S. Solomon, D. E. Kinnison, S. J. Ghan, R. R. III Neely, D. R. Marsh, A. Conley, C. G. Bardeen, et al. (2016), Global volcanic aerosol properties derived from emissions, 1990–2014, using CESM1(WACCM), J. Geophys. Res. Atmos., 121, 2332–2348, doi:10.1002/2015JD024290.

[2] Sandvik, O. S., Friberg, J., Sporre, M. K., and Martinsson, B. G.: Methodology to obtain highly resolved SO2 vertical profiles for representation of volcanic emissions in climate models, Atmos. Meas. Tech., 14, 7153–7165, https://doi.org/10.5194/amt-14-7153-2021, 2021.

How to cite: Axebrink, E., Friberg, J., and Sporre, M. K.: High-resolution volcanic SO2 emissions in WACCM produce more realistic AODs, EGU General Assembly 2024, Vienna, Austria, 14–19 Apr 2024, EGU24-3480, https://doi.org/10.5194/egusphere-egu24-3480, 2024.

EGU24-3625 | Orals | AS3.13

A Significant Mode of Small, Tropospheric Particles in the Lower Stratosphere 

Charles Brock, Ming Lyu, Adam Ahern, Gregory Schill, Michael Lawler, Maya Abou-Ghanem, Daniel Murphy, Colin Gurganus, Troy Thornberry, Fred Moore, Eric Hintsa, Bradley Hall, and Geoff Dutton

The stratospheric aerosol layer plays an essential role in stratospheric chemical and radiative processes. Emissions of SO2 from small-to-midsized volcanic eruptions are typically introduced into the lower stratosphere, where a background aerosol already exists. The radiative and chemical consequences of these eruptive emissions depend in part upon the characteristics of these background particles, whose number originates from the troposphere. In-situ observations of sub-0.1 µm diameter particles in the upper troposphere/lower stratosphere are rare, but are of particular importance in understanding the contribution of upwelling ultrafine particles formed near the tropical tropopause and their subsequent evolution in the stratospheric (Brewer-Dobson) circulation.

In the  Stratospheric Aerosol processes, Budget and Radiative Effects (SABRE) mission from January to March 2023, we used three particle sizing instruments on the NASA WB-57 high-altitude aircraft to measure the size distribution of aerosol particles in the size range from 0.003 to ~4.0 μm in the lower stratosphere from middle to high latitudes at altitudes up to 19.6 km. The composition of individual aerosol particles >0.1 µm was also measured, along with O3, N2O, SF6 and OCS. Together, these measurements were used to investigate dynamical and chemical processes in the stratosphere that determine the evolution of the stratospheric aerosol as a function of stratospheric age up to several years. We observed a clear bimodal size distribution structure, with a small mode (< 0.1 μm diameter) originating from the troposphere and a larger mode (>0.2 µm diameter) originating from the photolysis of OCS (the classic Junge, or stratospheric, aerosol layer). These two modes evolve as a function of stratospheric age in a manner consistent with coagulation, condensation, and sedimentation. These are the first reported observations of the presence and evolution of this bimodal aerosol structure deep into the stratosphere. The small (tropospheric) particle mode provides a significant condensation sink at young stratospheric ages. SO2 from modest volcanic eruptions emitted into the lower stratosphere may condense on these smaller particles, reducing the amount of light scattering per unit mass. Proposed geoengineering efforts must also account for this tropospheric mode of particles. Models simulating aerosol processes in the stratosphere need to accurately represent tropospheric particles in the lower stratosphere and their evolution with stratospheric age.

How to cite: Brock, C., Lyu, M., Ahern, A., Schill, G., Lawler, M., Abou-Ghanem, M., Murphy, D., Gurganus, C., Thornberry, T., Moore, F., Hintsa, E., Hall, B., and Dutton, G.: A Significant Mode of Small, Tropospheric Particles in the Lower Stratosphere, EGU General Assembly 2024, Vienna, Austria, 14–19 Apr 2024, EGU24-3625, https://doi.org/10.5194/egusphere-egu24-3625, 2024.

EGU24-4234 | ECS | Posters on site | AS3.13

Combining Earth System Modeling and Machine Learning to Investigate Volcanic Sulfate Deposition in Polar Ice Cores 

Malcolm Maas, Kostas Tsigaridis, and Marcus Van Lier-Walqui

Volcanic eruptions emit large amounts of sulfur dioxide (SO2), water, and other chemicals into the atmosphere, both in the troposphere and the stratosphere. Most of the SO2 is converted to sulfate aerosol, which is eventually deposited following long-range transport. The deposits from large eruptions are potentially detectable in ice cores, but there are many cases in which sulfate layers have not been linked to their source volcanoes. As volcanoes can act as significant shocks to the global climate system, we are interested in locating these eruptions in order to increase understanding of the volcanic record. To narrow down the search, we performed 140 simulations of volcanic eruptions using the GISS ModelE Earth system model. We varied the latitude, longitude, Julian day, plume top, plume bottom, and injected SO2 and H2O amounts using a Latin hypercube sampling approach, and analyzed correlations between these parameters and sulfate depositions at ice core sites in Antarctica and Greenland. Using machine learning and parameter estimation, we generated probability distributions and maximum likelihood estimates for the parameters given sulfate deposition data, which can predict latitude with some skill. We find that the volcano latitude and SO2 content are best correlated with sulfate depositions at each pole, while longitude, Julian day, and H2O have small or insignificant effects. Plume altitude and thickness are important because they determine how much of the SO2 is injected into the stratosphere, which has implications for sulfur transport and lifetimes.

How to cite: Maas, M., Tsigaridis, K., and Van Lier-Walqui, M.: Combining Earth System Modeling and Machine Learning to Investigate Volcanic Sulfate Deposition in Polar Ice Cores, EGU General Assembly 2024, Vienna, Austria, 14–19 Apr 2024, EGU24-4234, https://doi.org/10.5194/egusphere-egu24-4234, 2024.

EGU24-4739 | Posters on site | AS3.13

SAGE II and SAGE III/ISS inference of the optical perturbations caused by volcanic eruptions 

Larry Thomason and Mahesh Kovilakam

An analysis of multiwavelength stratospheric aerosol extinction coefficient data from the Stratospheric Aerosol and Gas Experiment II and III/ISS instruments by Thomason et al. (2021) demonstrated a coherent relationship between the perturbation in extinction coefficient in an eruption’s main aerosol layer and the wavelength dependence of that perturbation. The relationship was observed to span multiple orders of magnitude in the aerosol extinction coefficient of stratospheric impact of volcanic events. Since that publication, the 2022 eruption by Hunga Tonga-Hunga Ha’apai is noted for several unique features including its intensity and altitude of the aerosol injection. It is also among the largest eruptions since the 1991 eruption by Mt. Pinatubo. In this paper, we show that this eruption fits well into the extinction coefficient/extinction coefficient ratio space found in the previous publication. In addition, while the previous publication was focused on the peak extinction coefficient following the eruption, herein we examine how well the spatial distribution of enhanced aerosol extinction follows the simple relationship between extinction coefficient and extinction coefficient for the by Hunga Tonga-Hunga Ha’apai  eruption and those previously examined.

Thomason, L. W., Kovilakam, M., Schmidt, A., von Savigny, C., Knepp, T., and Rieger, L.: Evidence for the predictability of changes in the stratospheric aerosol size following volcanic eruptions of diverse magnitudes using space-based instruments, Atmos. Chem. Phys., 21, 1143–1158, https://doi.org/10.5194/acp-21-1143-2021, 2021.

How to cite: Thomason, L. and Kovilakam, M.: SAGE II and SAGE III/ISS inference of the optical perturbations caused by volcanic eruptions, EGU General Assembly 2024, Vienna, Austria, 14–19 Apr 2024, EGU24-4739, https://doi.org/10.5194/egusphere-egu24-4739, 2024.

EGU24-6449 | ECS | Posters on site | AS3.13

How Volcanic Aerosols Globally Inhibit Precipitation 

Zachary McGraw and Lorenzo M. Polvani

Observations and models have indicated a reduction in global mean precipitation during the years following major volcanic eruptions, yet why this occurs has not been rigorously established. Here we apply an energy budget framework to identify the mechanisms behind reduced post-eruption precipitation. Volcanic aerosols alter the atmosphere’s energy balance, with a precipitation (latent heating) response being one pathway that returns the atmosphere towards equilibrium. Using global climate model simulations, we demonstrate that post-eruption precipitation reduction is primarily a consequence of Earth’s surface and troposphere cooling in response to reflection of sunlight by volcanic aerosols. Additionally, these aerosols directly add energy to the atmosphere by absorbing outgoing longwave radiation, which causes much of the precipitation decline in the first post-eruption year. We further identify mechanisms that limit the post-eruption decline, most prominently the influence of a warmer stratosphere. Lastly, we demonstrate that our results are robust across climate models.

How to cite: McGraw, Z. and Polvani, L. M.: How Volcanic Aerosols Globally Inhibit Precipitation, EGU General Assembly 2024, Vienna, Austria, 14–19 Apr 2024, EGU24-6449, https://doi.org/10.5194/egusphere-egu24-6449, 2024.

EGU24-7997 | ECS | Orals | AS3.13

Impact of Hunga Tonga Hunga Ha’apai eruption on the global stratospheric aerosol layer in comparison with other eruptions and extreme fire events of the past decade  

Corinna Kloss, Gwenaël Berthet, Pasquale Sellitto, Bernard Legras, Jean-Paul Vernier, Jean-Baptiste Renard, Fabrice Jégou, Paul Konopka, and Felix Plöger

Using a combination of satellite, ground-based and in-situ observations, we quantify and compare the impact of the most recent moderate volcanic eruptions and extreme fire events (volcanic eruptions: Ambae, Vanuatu in July 2018; Raikoke, Russia and Ulawun, New Guinea in June 2019; extreme fire events: Canadian fires 2017 and Australian fires 2019/2020) on the global stratospheric aerosol layer and climate.

A particular focus is set on the Hunga Tonga Hunga Ha’apai (Tonga islands) eruption of January 2022, which was exceptional especially in terms of water injection into the stratosphere. However, even the observed peak global average stratospheric aerosol optical depth exceeded that of the strongest stratospheric aerosol events of the last decade by a factor of more than 2.

Since the eruption, we performed multiple measurement campaigns with Optical Particle Counters (POPS and LOAC) to study the aerosol optical properties of the freshly injected plume and its long-term evolution in terms of microphysical properties. The fresh plume consisted mostly of small (<1 µm in size), sulfate particles; the aged stratospheric plume 9 months after the eruption started showing the formation of a second aerosol mode of larger particles (at around 1 µm). The results of an additional campaign in the Southern hemisphere (February/March 2024, 2 years after the eruption) will also be presented.

Furthermore, during regular balloon borne aerosol observations we found evidence of plume transport towards the Northern Hemisphere with in situ observations in Europe.

How to cite: Kloss, C., Berthet, G., Sellitto, P., Legras, B., Vernier, J.-P., Renard, J.-B., Jégou, F., Konopka, P., and Plöger, F.: Impact of Hunga Tonga Hunga Ha’apai eruption on the global stratospheric aerosol layer in comparison with other eruptions and extreme fire events of the past decade , EGU General Assembly 2024, Vienna, Austria, 14–19 Apr 2024, EGU24-7997, https://doi.org/10.5194/egusphere-egu24-7997, 2024.

EGU24-8370 | ECS | Orals | AS3.13 | Highlight

Impact of Hunga Tonga-Hunga Ha’apai water vapour on polar vortex dehydration and ozone depletion: Antarctic 2023 and Arctic 2024 

Xin Zhou, Saffron Heddell, Sandip Dhomse, Wuhu Feng, Graham Mann, Hugh Pumphrey, Brian Kerridge, Barry Latter, Richard Siddans, Lucy Ventress, Richard Querel, Penny Smale, Elizabeth Asher, Emrys Hall, Slimane Bekki, and Martyn Chipperfield

The January 2022 eruption of Hunga Tonga-Hunga Ha’apai (HTHH) injected a huge amount (~150 Tg) of water vapour (H2O) into the stratosphere, along with small amount of sulfur dioxide (SO2). Following slow transport in the meridional Brewer-Dobson circulation, the additional H2O is now distributed throughout the stratosphere. Here we use an off-line 3-D chemical transport model (CTM) to study the residence time of this excess H2O and its impact on polar ozone depletion. The model results are compared to satellite data from the Microwave Limb Sounder (MLS), the Ozone Monitoring Instrument (OMI), and Infrared Atmospheric Sounding Interferometer (IASI), and to balloon-borne measurements from Scott Base (77.8oS).

Simulations with the TOMCAT/SLIMCAT CTM successfully reproduce the spread of the injected H2O through late 2023 (at time of writing) as observed by MLS. Dehydration in the 2023 Antarctic polar vortex caused the first substantial (~20 Tg) removal of HTHH H2O from the stratosphere. The CTM indicates that this process will dominate removal of HTHH H2O for the coming years, giving an overall e-folding timescale of 4 years; around 25 Tg of the injected H2O is predicted to still remain in the stratosphere by 2030.

We have diagnosed the additional H2O chemical impacts on stratospheric ozone throughout the simulation, with a focus on the 2023 Antarctic ozone hole. Following relatively low Antarctic column ozone in midwinter 2023 due to transport effects, additional springtime depletion due to H2O-related chemistry was small and maximised at the vortex edge (10 DU in column). Effective dehydration in the core of the vortex limited the impact of the additional H2O.

We will also discuss the HTHH-H2O impacts on ozone depletion in the forthcoming 2024 springtime Arctic vortex. This will be the first Arctic winter with likely substantial HTHH enhancement of lower stratospheric H2O. As dehydration is rare in the Arctic, there is the possibility of differing impacts compared to the Antarctic through the persistence of the enhanced H2O at the pole.

How to cite: Zhou, X., Heddell, S., Dhomse, S., Feng, W., Mann, G., Pumphrey, H., Kerridge, B., Latter, B., Siddans, R., Ventress, L., Querel, R., Smale, P., Asher, E., Hall, E., Bekki, S., and Chipperfield, M.: Impact of Hunga Tonga-Hunga Ha’apai water vapour on polar vortex dehydration and ozone depletion: Antarctic 2023 and Arctic 2024, EGU General Assembly 2024, Vienna, Austria, 14–19 Apr 2024, EGU24-8370, https://doi.org/10.5194/egusphere-egu24-8370, 2024.

EGU24-9210 | Posters on site | AS3.13

Radiative forcing and stratospheric ozone changes due to recent volcanic eruptions and major forest fires 

Christoph Brühl, Jos Lelieveld, Landon Rieger, and Michelle Santee

The chemistry-climate model EMAC was used to simulate the period 2019 to 2023 with tropospheric meteorology slightly nudged to ERA5 data. Volcanic SO2 injections were derived from aerosol extinction observations by OSIRIS and OMPS-LP which were also used for evaluation of the simulated aerosol, which includes organic particles from major forest fires that can linger in the lower stratosphere for more than 2 years. Our simulations consider several hundred explosive volcanic eruptions. The simulations of ozone chemistry include enhanced surface area density and fast heterogeneous chlorine activation on organic particles and will be compared with AURA-MLS observations. The effects of the major water vapour injection by the eruption of Hunga Tonga in 2022 on radiative transfer and chemistry were also analysed (as a contribution to SSIRC Hunga Tonga). 
For example, in 2022 the Hunga Tonga eruption increased the depth of the calculated  Antarctic ozone hole by about 12 DU. The Australian bushfire emissions enhanced the aerosol surface area which deepened the 2020 ozone hole by about 7 DU, with the largest changes near the vortex edge. The smoke effect is expected to increase with updated heterogeneous chemistry.
The computed global instantaneous aerosol radiative forcing by Hunga Tonga at the top of the atmosphere was about -0.12 W/m2 in 2022. The injected water vapour by Hunga Tonga exerted a radiative forcing of about +0.04 W/m2 in the first four months after the eruption. By the end of 2022, it nearly vanished due to dynamical and chemical adjustments. The absorbing aerosol from the Australian and Canadian forest fire emissions changed the stratospheric aerosol forcing from -0.2 W/m2 to +0.3 W/m2 in January 2020, and in January 2022 the remaining effect was about 0.05 W/m2, reducing the negative forcing by the volcanoes. Continued interesting effects of the Hunga Tonga eruptions are expected for 2023, based on results from ongoing simulations.

How to cite: Brühl, C., Lelieveld, J., Rieger, L., and Santee, M.: Radiative forcing and stratospheric ozone changes due to recent volcanic eruptions and major forest fires, EGU General Assembly 2024, Vienna, Austria, 14–19 Apr 2024, EGU24-9210, https://doi.org/10.5194/egusphere-egu24-9210, 2024.

EGU24-9547 | ECS | Orals | AS3.13

Why does stratospheric aerosol forcing strongly cool the warm pool? 

Moritz Günther, Hauke Schmidt, Claudia Timmreck, and Matthew Toohey

Stratospheric aerosol forcing causes only a small global-mean temperature change compared to CO2 forcing of equal magnitude. It has been shown that the dampened temperature response to aerosol forcing originates from enhanced surface temperature change in the tropical Indian and Western Pacific Ocean, relative to the global mean. Due to the pronounced temperature change in this “warm pool” region, strong negative feedback processes are activated. These stabilizing processes strengthen the global mean radiative feedback and abate Earth’s global mean temperature response. In comparison, CO2 forcing has a smaller effect on warm pool temperatures and therefore produces relatively weak feedback, i.e. a strong temperature change.

However, it has remained unclear why stratospheric aerosol forcing affects warm pool temperatures more strongly than CO2 forcing. We address this problem using simulations of aerosol and CO2 forcing in MPI-ESM. At the top of the atmosphere (TOA), aerosol forcing is stronger in the warm pool than in the global mean, while CO2 forcing is relatively homogeneous, which could explain the different temperature patterns. However, we find that the forcing pattern at the TOA is not sufficient to explain the aerosols’ strong influence on warm pool temperatures. The effect can only be explained when taking into account the effective forcing pattern at the surface, which is substantially different from the effective forcing at the TOA. In the case of stratospheric aerosol forcing, the stratospheric heating causes an acceleration of the Brewer-Dobson circulation, which induces an enhanced energy transport from the tropics to the extratropics. Although the transport occurs in the stratosphere, it affects the troposphere and causes a strongly negative forcing at the surface of the tropics. In contrast, CO2 does not substantially affect the Brewer-Dobson circulation, and therefore the surface response is not amplified in the tropics.

Our results stress the importance of circulation adjustments for the climate response. In the case of stratospheric aerosol forcing, the troposphere is impacted by changes to the wave-driven stratospheric circulation. The accelerated Brewer-Dobson circulation affects the forcing pattern at the surface, and in consequence the pattern of surface temperatures and the climate feedback. Furthermore, we argue that the commonly used method of measuring effective forcing at the TOA is not sufficient for understanding the evolution of surface temperature patterns.

How to cite: Günther, M., Schmidt, H., Timmreck, C., and Toohey, M.: Why does stratospheric aerosol forcing strongly cool the warm pool?, EGU General Assembly 2024, Vienna, Austria, 14–19 Apr 2024, EGU24-9547, https://doi.org/10.5194/egusphere-egu24-9547, 2024.

EGU24-10614 | Posters on site | AS3.13

The Northern Hemisphere winter response to historic volcanic eruptions: How it looked like and how it may have looked like differently 

Ralf Hand, Eric Samakinwa, Jörg Franke, Laura Lipfert, and Stefan Brönnimann

In contrast to the radiative cooling that dominates atmospheric response to volcanoes in most regions, Northern Eurasia shows a warming signal when averaging the observed signal over several eruptions. Up to the current understanding this warming is likely caused by a positive NAO response leading to compensation of the radiative cooling through enhanced advection of mild air from the North Atlantic towards the continent. However, individual eruptions show remarkable differences when computing the response as the difference between the pre and post eruption states for each eruption separately. When only analyzing observations it is difficult to quantify the contributions of internal variability on the one hand and differences in the volcanic forcing on the other hand. Also the response mechanisms are potentially influenced by many different factors. e.g. the strength and the location of the eruption, the ocean state at the time of eruption and internal variability causing different pre-eruption states of the atmosphere. Therefore generalized statements on the volcanic response are difficult to make given the limited number of well-observed major eruptions. Ensemble climate model simulations can help to better understand the related processes by providing multiple realizations of the same historic eruptions and thereby providing a way to separate internal variability from forced signals. Here, we use ModE-Sim, a medium-size atmospheric model ensemble, and its companion dataset ModE-RA, a reanalysis product that uses ModE-Sim as an a-priori state before assimilating historic climate data from different sources. Our first results show that the commonly used practice of averaging about 15 observed eruptions may inherit high uncertainties when interpreting the volcanic winter response.

How to cite: Hand, R., Samakinwa, E., Franke, J., Lipfert, L., and Brönnimann, S.: The Northern Hemisphere winter response to historic volcanic eruptions: How it looked like and how it may have looked like differently, EGU General Assembly 2024, Vienna, Austria, 14–19 Apr 2024, EGU24-10614, https://doi.org/10.5194/egusphere-egu24-10614, 2024.

EGU24-10774 | Posters on site | AS3.13

Importance of early 19th century volcanic activity on long-term climate variability. 

Andrew Schurer, Andrew Ballinger, Andrea Dittus, Ed Hawkins, Richard Cornes, Elizabeth Kent, Colin Morice, Tim Osborn, Steven Rumbold, and Gabriele Hegerl

Typically, climate simulations covering the historical period start in 1850, with the first fifty years used as a baseline to represent a ‘pre-industrial' climate. The period immediately prior to 1850 is however of particular interest, as it had far more volcanic activity than any time during the subsequent historical period, and this is known to have caused large cooling of global temperatures. Exploring the climate of this period could help to better understand early anthropogenic warming, natural climate variability and anticipate the response to large future eruptions.

Here we will: (1) highlight the development of a new instrumental observation-based dataset (GloSAT) for temperature variations across the globe from 1781 to present; (2) discuss an ensemble of historical simulations with UKESM1 which were started in 1750, 100 years earlier than typical. These two sources of evidence will be used to identify the long-lasting impacts of the early 19th century volcanism and disentangle it from the response to other forcings and internal variations. Longer term effects of this period are also explored with significant differences found with historical simulations run using the same model initialised in 1850 lasting well into the 20th century. The implications of this discrepancy and the role of large volcanic eruptions on multi-decadal climate will be discussed. 

How to cite: Schurer, A., Ballinger, A., Dittus, A., Hawkins, E., Cornes, R., Kent, E., Morice, C., Osborn, T., Rumbold, S., and Hegerl, G.: Importance of early 19th century volcanic activity on long-term climate variability., EGU General Assembly 2024, Vienna, Austria, 14–19 Apr 2024, EGU24-10774, https://doi.org/10.5194/egusphere-egu24-10774, 2024.

EGU24-11045 | Posters on site | AS3.13

How the Hunga Tonga - Hunga Ha’apai water vapor cloud impacts its transport through the stratosphere: Dynamical and radiative effects 

Ulrike Niemeier, Sandra Wallis, Claudia Timmreck, Trang van Pham, and Christian von Savigny

The eruption of the Hunga Tonga - Hunga Ha'apai (HTHH) volcano on January 15, 2022 changed the water vapor content of the stratosphere. The eruption injected about 150 Tg of water vapor (H2O), roughly 10% of the background stratospheric H2O content, to altitudes above 50 km. Observations with the Aura Microwave Limb Sounder (MLS) detected the transport and distribution of the H2O cloud after the eruption. This provided a great opportunity to compare the simulated transport of the H2O cloud in the ICON-Seamless model with the MLS observation to see the performance of the stratospheric dynamics in this newly developed model. ICON-Seamless simulations were performed with NWP physics in a low horizontal resolution of about 160 km. A new vertical grid with 130 levels and a maximum grid size of 500 m in the stratosphere allowed the simulation of an internally generated QBO.

The simulated spatial evolution of the H2O cloud is very close to the MLS observations. In both, model and observation, the vertical transport of the H2O cloud had three phases: an initial subsidence phase, a stable phase, and a rising phase. Radiative cooling of H2O clearly affects the transport of the H2O cloud, as demonstrated with passive tracers. It is the main driver within the subsidence phase. The radiative cooling also counteracts the large-scale rising motion in the tropics, leading to the stable phase, and modulates the large-scale transport of the H2O cloud for about nine months. This holds for different QBO phases, where the H2O cloud differs mainly in its vertical extent.

How to cite: Niemeier, U., Wallis, S., Timmreck, C., van Pham, T., and von Savigny, C.: How the Hunga Tonga - Hunga Ha’apai water vapor cloud impacts its transport through the stratosphere: Dynamical and radiative effects, EGU General Assembly 2024, Vienna, Austria, 14–19 Apr 2024, EGU24-11045, https://doi.org/10.5194/egusphere-egu24-11045, 2024.

EGU24-11683 | ECS | Orals | AS3.13

Observed Impacts of the Hunga Tonga Eruption on Stratospheric Temperature 

Matthias Stocker, Andrea K. Steiner, Florian Ladstädter, Ulrich Foelsche, and William Randel

The massive eruption of the Hunga Tonga-Hunga Ha'apai (HTHH) volcano in 2022 not only set a record for plume height, transporting aerosols and water vapor up to an altitude of more than 50 km into the mesosphere, it also resulted in a substantial stratospheric aerosol optical depth perturbation and previously unobserved hydration of the stratosphere. These disturbances are expected to persist for several years, affecting stratospheric circulation, composition, and dynamics.

Our study investigates the stratospheric temperature signals of the HTHH eruption and their separation from the broader stratospheric variability. Using high-resolution satellite observations, we focus on the lower and middle stratosphere in the tropical and mid-latitudes for the period from January 2022 until June 2023. Within the early post eruption plume we find a pronounced temperature dipole structure that follows the vertical evolution of water vapor and aerosols. In addition, we find persistent long-lived cooling of up to -4 K in the middle tropical and subtropical stratosphere. The cooling pattern closely corresponds to the distribution of water vapor from the months post-eruption to mid-2023. We anticipate that this negative anomaly has implications for stratospheric circulation and composition, especially ozone levels.

Our results provide new insights into the localized temperature changes shortly after the eruption and the short-term stratospheric climate signals. We are confident that our results will be useful for testing simulation results against observational analyses in future modeling studies.

How to cite: Stocker, M., Steiner, A. K., Ladstädter, F., Foelsche, U., and Randel, W.: Observed Impacts of the Hunga Tonga Eruption on Stratospheric Temperature, EGU General Assembly 2024, Vienna, Austria, 14–19 Apr 2024, EGU24-11683, https://doi.org/10.5194/egusphere-egu24-11683, 2024.

EGU24-12589 | ECS | Posters on site | AS3.13

Stratospheric chlorine activation after the unprecedented water-rich Hunga Tonga eruption 

Jun Zhang, Peidong Wang, Douglas Kinnison, Susan Solomon, and Jian Guan

Following the eruption of Hunga Tonga–Hunga Ha’apai (HTHH) in January 2022, a significant reduction in stratospheric hydrochloric acid (HCl) was observed in the Southern Hemisphere mid-latitudes during the austral winter of 2022. This eruption injected sulfur dioxide and unprecedented amounts of water vapor into the stratosphere. The objective of this study is to comprehensively understand the substantial loss of HCl in the aftermath of HTHH. Satellite measurements from the Atmospheric Chemistry Experiment-Fourier Transform Spectrometer (ACE) and Microwave Limb Sounder (MLS), along with data from the global chemistry-climate model Whole Atmosphere Community Climate Model (WACCM), are employed for the analysis. We first compare the modeled 2022 anomalies of HCl and N2O with observations from ACE and MLS, and find noteworthy agreement between the model outputs and the measured data. We then utilize the observed tracer-tracer relations between N2O and HCl to distinguish HCl chemical processing from dynamical transport. The results indicate a significant role of chemical processing in the observed HCl reduction. The chemical changes in HCl derived from ACE and MLS align with the changes calculated from nudged model simulations, where dynamics are fixed to reanalysis. Further delving into the WACCM’s detailed chemistry, we examine individual chlorine gas-phase and heterogeneous reactions. Heterogeneous chemistry emerges as the primary driver for the chemical loss of HCl, with the reaction between HOBr and HCl on sulfate aerosols identified as the dominant loss process.

How to cite: Zhang, J., Wang, P., Kinnison, D., Solomon, S., and Guan, J.: Stratospheric chlorine activation after the unprecedented water-rich Hunga Tonga eruption, EGU General Assembly 2024, Vienna, Austria, 14–19 Apr 2024, EGU24-12589, https://doi.org/10.5194/egusphere-egu24-12589, 2024.

EGU24-12714 | ECS | Posters on site | AS3.13

Impacts of the Hunga Tonga-Hunga Ha'apai Eruption: Insights from the SOCOLv4 ESM about past and future 

Ales Kuchar, Timofei Sukhodolov, Gabriel Chiodo, Harald Rieder, Jessica Kult-Herdin, Andrea Stenke, and Eugene Rozanov

We utilized the Earth System model SOCOLv4 to assess the impacts of the Hunga Tonga-Hunga Ha’apai eruption comprehensively. To accurately estimate the model's performance in terms of water vapour and aerosol plume transport during the initial year, we conducted a multi-member ensemble of free-running simulations and additional simulations employing atmospheric dynamics specified to the ERA5 reanalysis data. These simulations were compared with satellite and reanalysis products. The free-running ensemble simulations with only SO2 (no additional H2O) emissions showed the importance of the two species interaction for the resulting sulphate aerosol evolution, in agreement with previous studies. Furthermore, our primary free-running ensemble simulations, comparing scenarios with and without the eruption event, unravelled a negative response in polar stratospheric ozone levels and temperature. Importantly, these changes were found to be coupled to polar vortex dynamics confirming a larger ozone hole during the austral winter and spring of 2023.

How to cite: Kuchar, A., Sukhodolov, T., Chiodo, G., Rieder, H., Kult-Herdin, J., Stenke, A., and Rozanov, E.: Impacts of the Hunga Tonga-Hunga Ha'apai Eruption: Insights from the SOCOLv4 ESM about past and future, EGU General Assembly 2024, Vienna, Austria, 14–19 Apr 2024, EGU24-12714, https://doi.org/10.5194/egusphere-egu24-12714, 2024.

EGU24-12893 | Orals | AS3.13 | Highlight

Reconstructing Stratospheric Aerosol Loadings from Extratropical Eruptions 

Andrea Burke, Michael Sigl, Jihong Cole-Dai, Helen Innes, Joe McConnell, Charlotte Pearson, and Patrick Sugden

Extratropical eruptions have been associated with major cooling in the Northern Hemisphere over the last 2000 years (Toohey et al., 2019; Burke et al., 2023).  However, our ability to reconstruct the stratospheric aerosol loading from these events is limited by uncertainties in the conversion of sulfate flux to the polar ice sheets into a stratospheric sulfur loading or aerosol optical depth. Current methods (e.g. Gao et al. 2007; Toohey and Sigl, 2017) assume that all of the ice core sulfate from these eruptions is deposited via the stratospheric overworld, but sulfur isotope evidence shows that a substantial proportion of ice core sulfate comes via lower altitudes. Here we evaluate the magnitude of this complication across many of the major extratropical eruptions over the last several thousand years, including eruptions from the Katmai/Novarupta, Aniakchak, and Okmok volcanoes, and investigate the implications of these findings for stratospheric aerosol forcing records currently used in climate models.


Burke, A., Innes, H.M., Crick, L., Anchukaitis, K.J., Byrne, M.P., Hutchison, W., McConnell, J.R., Moore, K.A., Rae, J.W., Sigl, M. and Wilson, R., 2023. High sensitivity of summer temperatures to stratospheric sulfur loading from volcanoes in the Northern Hemisphere. Proceedings of the National Academy of Sciences120(47), p.e2221810120.

Gao, C., Oman, L., Robock, A. and Stenchikov, G.L., 2007. Atmospheric volcanic loading derived from bipolar ice cores: Accounting for the spatial distribution of volcanic deposition. Journal of Geophysical Research: Atmospheres112(D9).

Toohey, M. and Sigl, M., 2017. Volcanic stratospheric sulfur injections and aerosol optical depth from 500 BCE to 1900 CE. Earth System Science Data9(2), pp.809-831.

Toohey, M., Krüger, K., Schmidt, H., Timmreck, C., Sigl, M., Stoffel, M. and Wilson, R., 2019. Disproportionately strong climate forcing from extratropical explosive volcanic eruptions. Nature Geoscience12(2), pp.100-107.

How to cite: Burke, A., Sigl, M., Cole-Dai, J., Innes, H., McConnell, J., Pearson, C., and Sugden, P.: Reconstructing Stratospheric Aerosol Loadings from Extratropical Eruptions, EGU General Assembly 2024, Vienna, Austria, 14–19 Apr 2024, EGU24-12893, https://doi.org/10.5194/egusphere-egu24-12893, 2024.

EGU24-13913 | Posters on site | AS3.13

Stratospheric residence time and the lifetime of volcanic stratospheric aerosols 

Matthew Toohey, Yue Jia, Sujan Khanal, and Susann Tegtmeier

The amount of time that volcanic aerosols spend in the stratosphere is one of the primary factors influencing the climate impact of volcanic eruptions. Descriptions of stratospheric aerosol persistence vary, with many works quoting an approximately 1-year residence time for aerosol from large tropical eruptions, but other references to 1-2 year “lifetimes”. We introduce a framework for describing the evolution of global stratospheric aerosol after major volcanic eruptions and assess its persistence, based on analysis of global satellite-based aerosol observations, tracer transport simulations and simple conceptual modeling. We show that stratospheric residence time, which is estimated through passive tracer pulse experiments and is one factor influencing the lifetime of stratospheric aerosols, is strongly dependent on the injection latitude and height, with an especially strong sensitivity to injection height in the first four kilometers above the tropical tropopause. Time series of simulated stratospheric tracer fraction are best described by a simple model which includes a lag between the injection and initiation of removal from the stratosphere. A simple model including lagged decay, as well as a timescale for sulfate aerosol production, produces a best fit to global observations of stratospheric aerosol after the 1991 eruption of Mt. Pinatubo consistent with a stratospheric lifetime of about 24 months. We estimate the potential impact of observational uncertainties on this lifetime estimate and find it likely that the lifetime of Pinatubo stratospheric aerosol is 20 months or greater. 

How to cite: Toohey, M., Jia, Y., Khanal, S., and Tegtmeier, S.: Stratospheric residence time and the lifetime of volcanic stratospheric aerosols, EGU General Assembly 2024, Vienna, Austria, 14–19 Apr 2024, EGU24-13913, https://doi.org/10.5194/egusphere-egu24-13913, 2024.

EGU24-17679 | Orals | AS3.13

Do the early nineteenth century eruptions strengthen evidence for volcanically-induced Eurasian winter warming? 

Timothy Osborn, Emily Wallis, Manoj Joshi, Michael Taylor, Ed Hawkins, Andrew Schurer, and Colin Morice

It is well-established that explosive volcanic eruptions typically lead to cooler surface temperatures in summer, but the picture in Northern Hemisphere winter is much more uncertain. Recent large, low-latitude eruptions have been followed by warm anomalies across Eurasia in winter and cold anomalies near Greenland, hypothesized to be part of a dynamical response to the volcanic forcing that drives a positive North Atlantic Oscillation (NAO). But the evidence for a dynamical, winter warming response is inconclusive because internal variability is large, many climate models do not simulate a dynamical response like this, and there are few such eruptions to study.

New datasets that allow additional eruptions from the early 19th century to be studied are therefore particularly valuable and we will present new analyses of the winters following four large eruptions in 1809, 1815, 1831 and 1835 (alongside four later eruptions in 1883, 1902, 1982 and 1991). This analysis is made possible by a new gridded instrumental dataset combining marine and land air temperatures from the 1780s onwards developed in the ongoing GloSAT project. It is supplemented by analysis of an ensemble of historically-forced simulations with UKESM1.1 initialised in 1750, also from the GloSAT project, and by two reanalyses (20CRv3 from 1806 and ModE-RA from 1421).

For the instrumental and reanalysis datasets, warming in Europe was found in the first post-eruption winter following six out of the eight cases studied, and in the second post-eruption winter in five. Similar results were found for cold anomalies near Greenland and for a positive winter NAO index.  The anomaly magnitudes for individual cases were mostly within the range of internal variability but the consistency of the response across eruptions and datasets was significant in comparison with non-volcanic winters. The UKESM1.1 simulations showed a significant response (with Eurasian winter warming, Greenland cooling and positive NAO) for only the largest eruption (Tambora), suggesting a response may require a minimum forcing strength to occur.

How to cite: Osborn, T., Wallis, E., Joshi, M., Taylor, M., Hawkins, E., Schurer, A., and Morice, C.: Do the early nineteenth century eruptions strengthen evidence for volcanically-induced Eurasian winter warming?, EGU General Assembly 2024, Vienna, Austria, 14–19 Apr 2024, EGU24-17679, https://doi.org/10.5194/egusphere-egu24-17679, 2024.

EGU24-19182 | Posters on site | AS3.13

Interactive and microphysical simulations of the stratospheric aerosol layer: Global size distribution variation after moderate volcanic enhancement  

Graham Mann, Sandip Dhomse, Masaru Yoshioka, Saffron Heddell, Rosalyn Hatcher, Grenville Lister, Ghassan Taha, Mahesh Kovilakam, Travis Knepp, Larry Thomason, and Margot Clyne

We present findings from a series of interactive stratospheric aerosol simulations of the Hunga-Tonga volcanic aerosol cloud with the UM-UKCA composition-climate model (Dhomse et al., 2020; Marshall et al., 2019; Dhomse et al., 2014).

The January 2022 Hunga eruption was the most explosive eruption in the satellite era (Wright et al., 2022), an upper portion of the volcanic aerosol plume at 30-40km (Taha et al., 2022), with the main detrainment initially at ~27-30km, a highly unusual steep descent of the plume seeing the aerosol layer form at ~22-26km (e.g. Kloss et al., 2022; Legras et al., 2022; Baron et al., 2023).

The eruption emitted only a modest 0.4-0.5Tg of SO2 to the stratosphere (Carn et al., 2022).   but generated the strongest stratospheric aerosol optical depth for 30 years (e.g. Khaykin et al., 2022; Taha et al., 2022; Bourassa et al., 2023)

The shallow underwater explosion also detrained ~150Tg of water vapour deep into the stratosphere (e.g. Millan et al., 2022), shown by Zhu et al. (2022) and Asher et al. (2023) to have accelerated SO2 oxidation and enhanced the growth of volcanic sulphate aerosol, the particles more readily reaching optically-active sizes.

The GLOMAP aerosol module within UM-UKCA model predicts the stratospheric sulphate aerosol particles that form heterogeneously around meteoric smoke particles, alongside the sulphate aerosol that nucleate homogeneously (see Brooke et al., 2017; Dhomse et al. (2020).   The model transports these two sulphate aerosol types in separate modes in the aerosol microphysics module, including with their microphysical interactions (coagulation and uptake of sulphuric acid).

For the major volcanic aerosol clouds in most previous UM-UKCA stratospheric aerosol publications, the meteoric-sulphuric aerosol have only a minor role on volcanic forcing (via modulated decay timescale). Here we explore the significance of the meteoric aerosol within SO2-only simulations of the Hunga-Tonga volcanic aerosol cloud’s global dispersion.

The long residence times for stratospheric aerosol particles within the tropical stratospheric reservoir means the stratospheric aerosol layer’s column burden enhancement after modest eruptions can be determined not only from the amount of volcanic SO2 emitted, but partly also reflects the residence time of the mix of stratospheric aerosol particles. 

We explore more generally the role of meteoric-sulphuric particles within moderate SO2 emission tropical stratosphere-injecting eruptions, exploring the transition from sheared volcanic plume to dispersed aerosol cloud, and how the additional volcanic aerosol particles combine with the two types of sulphuric acid particles in the background aerosol.

The series of UM-UKCA model experiments align with protocols for the Tonga-MIP multi-model experiment (Clyne et al., 2022), and explore how moderate volcanic enhancements to the stratospheric aerosol layer evolve in the transitional post-plume phase across months 2 to 4 after the eruption.

We analyse how the predicted size distributions of the two sulphate aerosol types progress after moderate volcanic eruptions, exploring simulated co-variations of particle size  with multi-wavelength aerosol extinction and sulphate mass. We compare also to satellite measurements after Hunga-Tonga and for other recent moderate stratosphere-injecting eruptions.

How to cite: Mann, G., Dhomse, S., Yoshioka, M., Heddell, S., Hatcher, R., Lister, G., Taha, G., Kovilakam, M., Knepp, T., Thomason, L., and Clyne, M.: Interactive and microphysical simulations of the stratospheric aerosol layer: Global size distribution variation after moderate volcanic enhancement , EGU General Assembly 2024, Vienna, Austria, 14–19 Apr 2024, EGU24-19182, https://doi.org/10.5194/egusphere-egu24-19182, 2024.

EGU24-19317 | ECS | Orals | AS3.13 | Highlight

Modelling the 10th century Eldgjá eruption in Iceland and revisiting evidence of its climatic and environmental impacts 

Herman Fuglestvedt, Imogen Gabriel, Michael Sigl, Þorvaldur Þórðarson, and Kirstin Krüger

The episodic eruption of Eldgjá in the 10th century stands as the largest basaltic flood lava eruption on Earth during the Common Era. The eruption released an estimated 200 Tg of sulphur dioxide into the atmosphere, a substantial emission that likely had severe impacts on the climate and environment. Various sources, including observations of haze over Europe, a minimum in tree ring temperature reconstructions, and suppressed flow of the Nile, suggest that the eruption had both regional and global effects.

Petrological evidence from Iceland quantifies the sulphur and halogen emissions from the eruption site, and subsequent deposition is recorded in high-resolution Greenland ice cores. Additionally, recent analyses of Greenland cryptotephra have shed light on the eruption’s date and duration (Hutchison et al., JGR under revision).

In combination, these constraints provide valuable information about the nature of the eruption, but they do not directly quantify its climate forcing or environmental effects. Furthermore, reconciling the petrological and ice core constraints with proxies of Eldgjá's impacts presents a puzzle.

To bridge this gap, we constructed a plausible volcanic forcing, combining the most recent and available volcanology and ice core records, and used a fully-coupled Earth system model to simulate the Eldgjá eruption. We simulate the volcanic aerosol and atmospheric composition changes resulting from long-lasting, stratospheric and tropospheric emissions of sulphur, chlorine, bromine, and fluorine in a pre-industrial Earth system.

Our results help improve our understanding of the climate effects of prolonged Icelandic eruptions, and offer clues about the potential effects of the Eldgjá eruption on the population and environment at the time. Finally, we discuss the model results with regard to uncertainties in the volcanic forcing, experimental set-up, and the available proxy data.

How to cite: Fuglestvedt, H., Gabriel, I., Sigl, M., Þórðarson, Þ., and Krüger, K.: Modelling the 10th century Eldgjá eruption in Iceland and revisiting evidence of its climatic and environmental impacts, EGU General Assembly 2024, Vienna, Austria, 14–19 Apr 2024, EGU24-19317, https://doi.org/10.5194/egusphere-egu24-19317, 2024.

EGU24-19841 | Posters on site | AS3.13

Variations in stratospheric aerosol layer and aerosol microphysical processes following the 2021 La Soufrière eruption: insights from in situ and satellite observations 

Yaowei Li, Corey Pedersen, John Dykema, Jean-Paul Vernier, Felix Wrana, Christian von Savigny, Sandro Vattioni, Amit Pandit, Andrea Stenke, Elizabeth Asher, Troy Thornberry, Michael Todt, ThaoPaul Bui, Jonathan Dean-Day, and Frank Keutsch

Stratospheric aerosol plays an important role in Earth's radiative budget and in heterogeneous chemistry. Volcanic eruptions modulate the stratospheric aerosol layer by injecting particles and particle precursors like sulfur dioxide (SO2) into the stratosphere. The eruption of La Soufrière in April 2021 resulted in two distinct enhanced aerosol layers in the tropical lower stratosphere. These layers emerged approximately 3–4 weeks after the eruption, specifically at altitudes of 18 km (∼400 K) and 21 km (∼490 K), as observed through CALIOP/CALIPSO measurements. The lower plumes dispersed to higher latitudes in the Northern Hemisphere, while the upper plume exhibited restricted poleward transport. From June to August 2021 and May to July 2022, the NASA ER-2 high-altitude aircraft and balloon-borne instruments extensively sampled the stratospheric aerosol layer over the continental United States during the Dynamics and Chemistry of the Summer Stratosphere (DCOTSS) mission. These in situ aerosol measurements provide detailed insights into the number concentration, size distribution, and spatiotemporal variations of particles within volcanic plumes. Notably, aerosol surface area density and number density in 2021 were enhanced by a factor of 2–4 between 380–500 K potential temperature compared to the 2022 DCOTSS observations, which were minimally influenced by volcanic activity. Within the volcanic plume, the observed aerosol number density exhibited significant meridional and zonal variations, while the mode and shape of aerosol size distributions did not vary. The La Soufrière eruption led to an increase in the number concentration of small particles (<400 nm), resulting in a smaller aerosol effective diameter during the summer of 2021 compared to the baseline conditions in the summer of 2022. Balloon-borne measurements also implied that particles within the upper plume were larger than those present in the lower plume, likely due to an extended processing time within the tropical reservoir. The variance in volcanic aerosol microphysical processes between the tropical reservoir and the midlatitude lower stratosphere, along with their consequent impact on changes in aerosol size, will be further discussed. We modeled the eruption with the SOCOL-AERv2 aerosol–chemistry–climate model. The modeled aerosol enhancement aligned well with DCOTSS observations. The modeled top-of-atmosphere 1-year global average radiative forcing was −0.08 W m−2 clear-sky and −0.04 W m−2 all-sky. The radiative effects were concentrated in the tropics and NH midlatitudes and diminished to near-baseline levels after 1 year.

How to cite: Li, Y., Pedersen, C., Dykema, J., Vernier, J.-P., Wrana, F., von Savigny, C., Vattioni, S., Pandit, A., Stenke, A., Asher, E., Thornberry, T., Todt, M., Bui, T., Dean-Day, J., and Keutsch, F.: Variations in stratospheric aerosol layer and aerosol microphysical processes following the 2021 La Soufrière eruption: insights from in situ and satellite observations, EGU General Assembly 2024, Vienna, Austria, 14–19 Apr 2024, EGU24-19841, https://doi.org/10.5194/egusphere-egu24-19841, 2024.

EGU24-20184 | ECS | Orals | AS3.13 | Highlight

Artificial Intelligence Detects Volcanic Fingerprints in Historical Climate Records 

Johannes Meuer, Claudia Timmreck, Shih-Wei Fang, and Christopher Kadow

Deciphering past climate variations, especially distinguishing between externally forced and inherent changes, is a major challenge. While proxy data from tree rings or ice cores can validate the occurrence of significant volcanic eruptions, linking the resulting temperature patterns to specific events or their geographic sources proves difficult. In this study, we present a neural network classifier capable of identifying the presence and hemispheric location of volcanic events. Trained on summer temperature anomalies from numerical climate simulations influenced by volcanoes, our classifier shows excellent accuracy over different magnitudes and locations of volcanic activity (hit rate >92%). The shift towards using an ensemble of observational (re-)analyses successfully detects volcanic eruptions in recent decades, showing a strong correlation between the neural network predictions and the observed aerosol optical depth field. Furthermore, our analysis uncovers traces of volcanic eruptions in 19th century climate data, identifying major events such as Tambora (1815) and Krakatau (1883), as well as smaller eruptions, thereby highlighting relevant climate signals. In addition, we identify a signature indicative of a northern extratropical eruption in 1809, establishing a link with the previously unidentified event of that year, despite continuing uncertainty about its exact location. 

How to cite: Meuer, J., Timmreck, C., Fang, S.-W., and Kadow, C.: Artificial Intelligence Detects Volcanic Fingerprints in Historical Climate Records, EGU General Assembly 2024, Vienna, Austria, 14–19 Apr 2024, EGU24-20184, https://doi.org/10.5194/egusphere-egu24-20184, 2024.

EGU24-485 | PICO | AS3.15

Future tropospheric ozone budget and distribution over East Asia under a net-zero scenario  

Xuewei Hou, Oliver Wild, Bin Zhu, and James Lee

Under future net-zero emission policies, reductions in emissions of ozone (O3) precursors are expected to alter the temporal and spatial distributions of tropospheric O3. In this study, we quantify changes in the tropospheric O3 budget and in the spatiotemporal distribution of surface O3 in east Asia and the contributions of regional emissions, intercontinental transport and climate change between the present day and 2060 under a net-zero scenario using the NCAR Community Earth System Model (CESM) with online tagging of O3 and its precursors. The results reveal that the global tropospheric O3 burden is likely to decrease by more than 20 %, from 316 Tg in the present day to 247 Tg in 2060, under a net-zero scenario. The burden of stratospheric O3 in the troposphere is expected to increase from 69 to 77 Tg. The mean lifetime of tropospheric O3 is expected to increase by 2 d (∼ 10 %). Changes in climate under a net-zero pathway are relatively small and only lead to small increases in tropospheric O3. Over eastern China, surface O3 increases in winter due to the weakened titration of O3 by NO associated with reduced anthropogenic NO emissions and due to enhanced stratospheric input. In summer, surface O3 decreases by more than 30 ppbv, and peak concentrations shift from July to May. Local contributions from anthropogenic emissions to surface O3 over east Asia are highest in summer but drop substantially, from 30 % to 14 %, under a net-zero scenario. The contribution of biogenic NO sources is enhanced and forms the dominant contributor to future surface O3, especially in summer (∼ 40 %). This enhanced contribution is mainly due to the increased O3 production efficiency under lower anthropogenic precursor emissions. Over eastern China, local anthropogenic contributions decrease from 50 % to 30 %. The decreases in surface O3 are strongly beneficial and are more than sufficient to counteract the increases in surface O3 observed in China over recent years. This study thus highlights the important co-benefits of net-zero policies that target climate change in addressing surface O3 pollution over east Asia.

How to cite: Hou, X., Wild, O., Zhu, B., and Lee, J.: Future tropospheric ozone budget and distribution over East Asia under a net-zero scenario , EGU General Assembly 2024, Vienna, Austria, 14–19 Apr 2024, EGU24-485, https://doi.org/10.5194/egusphere-egu24-485, 2024.

EGU24-2868 | ECS | PICO | AS3.15

Enhanced late spring ozone in southern China by early onset of the South China Sea summer monsoon 

Xiaorui Zhang, Xiao Lu, Fan Wang, Wen Zhou, Peng Wang, and Meng Gao

The onset of the South China Sea summer monsoon (SCSSM) profoundly impacts meteorological conditions over East Asia. However, whether the interannual variability in monsoon onset date impacts ozone (O3) pollution remains unclear. Here, we investigate the relationship between the early onset of SCSSM and late spring O3 in southern China. Our results show notable differences in surface O3 concentrations before and after SCSSM onset during early onset events in southern China. The enhanced O3 of 11.1 µg m-3 is supported by increased air temperature and solar radiation of 1.1 K and 30.9 W m-2 and reduced relative humidity of -5.7%. Both observation and model simulations confirm that O3-favorable meteorological conditions modulated by early SCSSM onset can be found in May. It increases the boundary layer height and biogenic emissions of volatile organic compounds, enhancing O3 by 10 µg m-3 over southern China. Chemical processes dominate such increases in O3 with enhanced chemical production of 0.27 Tg month-1. Descending motion in southern China vertically transports O3 to the surface by 0.10 Tg month-1, whereas horizontal advection reduces O3 concentration by 0.12 Tg month-1. The meteorological responses to colder sea surface temperature (SST) in the central equatorial Pacific are pronounced, leading to higher O3 concentrations over the Yangtze River Delta, while warmer SST in the Philippine Sea contributes O3 over the Pearl River Delta and eastern China. This study highlights the importance of SCSSM onset with respect to O3 in southern China, with promising applications in management of air pollution and agriculture.

How to cite: Zhang, X., Lu, X., Wang, F., Zhou, W., Wang, P., and Gao, M.: Enhanced late spring ozone in southern China by early onset of the South China Sea summer monsoon, EGU General Assembly 2024, Vienna, Austria, 14–19 Apr 2024, EGU24-2868, https://doi.org/10.5194/egusphere-egu24-2868, 2024.

EGU24-2869 | ECS | PICO | AS3.15

Amplified upward trend of the joint occurrences of heat and ozone extremes in China over 2013–2020 

Xiang Xiao, Yangyang Xu, Xiaorui Zhang, Fan Wang, Xiao Lu, Zongwei Cai, Guy Brasseur, and Meng Gao

Climate change and air pollution are two intimately interlinked global concerns. The frequency, intensity and duration of heatwaves are projected to increase globally under future climate change. A growing body of evidence indicates that health risks associated with the joint exposure to heatwaves and air pollution can be greater than that due to individual factors. However, the co-occurrences of heat and air pollution extremes in China remain less explored in the observational records. Here we investigate the spatial pattern and temporal trend of frequency, intensity, and duration of co-occurrences of heat and air pollution extremes using China’s nationwide observations of hourly PM2.5 and O3, and the ERA5 reanalysis dataset over 2013–2020. We identify a significant increase in the frequency of co-occurrence of wet-bulb temperature (Tw) and O3 exceedances (beyond a certain predefined threshold), mainly in the Beijing-Tianjin-Hebei (BTH) region (up by 4.7 days decade-1) and the Yangtze River Delta (YRD). In addition, we find that the increasing rate (compared to the average levels during the study period) of joint exceedance is larger than the rate of Tw and O3 itself. For example, Tw and O3 co-extremes increased by 7.0% in BTH, higher than the percentage increase of each at 0.9% and 5.5%, respectively. We identify same amplification for YRD. This ongoing upward trend in the joint occurrence of heat and O3 extremes should be recognized as an emerging environmental issue in China, given the potentially larger compounding impact to public health.

How to cite: Xiao, X., Xu, Y., Zhang, X., Wang, F., Lu, X., Cai, Z., Brasseur, G., and Gao, M.: Amplified upward trend of the joint occurrences of heat and ozone extremes in China over 2013–2020, EGU General Assembly 2024, Vienna, Austria, 14–19 Apr 2024, EGU24-2869, https://doi.org/10.5194/egusphere-egu24-2869, 2024.

The vertical representativeness of ambient air pollutant concentration measurements is addressed rarely though it is a very important aspect influencing the use and correct interpretation of measured values. Presently not much information on the vertical distribution of ambient ozone (O3) from sites representing relatively unpolluted rural areas is available. We explored the daily mean O3 concentrations measured at four heights above the ground (2, 8, 50 and 230 m) at the rural Central European site Košetice in 2015–2021. We aimed to explore in detail the O3 behaviour above the measuring point in close vicinity of the ground. We used the semiparametric GAM (generalised additive model) approach (with complexity or roughness-penalised splines implementation) to analyse the data with sufficient flexibility. Our models for both O3 concentration and O3 gradients used (additive) decomposition into annual trend and seasonality. Our results indicated consistently increasing O3 with increasing height above the ground. The vertical O3 concentration gradient in 2–230 m is not uniform, however, but changes substantially with increasing height and shows by far the highest dynamics near the ground between 2 and 8 m, differing in both the seasonal and annual aspects for all the air columns inspected. Study of O3 concentrations at one site at several different heights above the ground brings useful results complementing ground-based ambient air quality monitoring, provides a deeper insight into the 3D structure of the atmosphere and the pollution, and provides valuable information for environmental studies exploring processes above the ground (Hůnová et al., 2023).  Knowledge on vertical distribution of O3 concentrations near ground is for example an important input to ecological and environmental studies associating the air pollution with its impact on birds flying tens or hundred meters above the ground or impacts on tree canopies localised some tens of meters above the ground (Reif et al., 2023).

References:

Hůnová I., Brabec M., Malý M., 2023. Ambient ozone at a rural Central European site and its vertical concentration gradient close to the ground. Environmental Science and Pollution Research 30, 80014–80028. https://doi.org/10.1007/s11356-023-28016-8.

Reif J., Gamero A., Flousek J., Hůnová I., 2023. Ambient ozone – new threat to birds in mountain ecosystems? Science of the Total Environment 876, 162711. doi: 10.1016/j.scitotenv.2023.162711.


Acknowledgements:

Ozone concentration measurements at the tall tower used for the analysis were financially supported by the project ACTRIS-CZ LM2018122 and ACTRIS-CZ RI (CZ.02.1.01/0.0/0.0/16_013/0001315). This study was partially supported from the long-term strategic development financing of the Institute of Computer Science (Czech Republic RVO 67985807) and by the Czech Hydrometeorological Institute research project ʽDlouhodobá koncepce rozvoje výzkumné organizace (DKRVO) Český hydrometeorologický ústav’ financed by the Czech Ministry of the Environment.

How to cite: Hůnová, I., Brabec, M., and Malý, M.: Vertical concentration gradient of ambient ozone – insight into seven-year continuous measurements at a rural Central European site tall tower, EGU General Assembly 2024, Vienna, Austria, 14–19 Apr 2024, EGU24-2874, https://doi.org/10.5194/egusphere-egu24-2874, 2024.

EGU24-3240 | PICO | AS3.15 | Highlight

Co-occurrence of boreal smoke plumes and enhanced surface ozone across the central USA during summer 2023 

Owen Cooper, Kai-Lan Chang, and Brian McDonald

From May 20 through July 25, 2023, large boreal forest fire plumes were transported across the central and eastern United States of America. On many days the U.S. Environmental Protection Agency (EPA) air quality monitoring network detected co-located ozone and PM2.5 anomalies, which indicate a contribution from the smoke to surface ozone production. We apply a general additive mixed model (GAMM) to interpolate the observed ozone and PM2.5 observations onto daily maps of the continental United States.  Comparison to a recent baseline period with below-average wildfire activity (2014, 2016, 2019) allows for the identification of smoke events that contributed to enhanced surface ozone levels.

How to cite: Cooper, O., Chang, K.-L., and McDonald, B.: Co-occurrence of boreal smoke plumes and enhanced surface ozone across the central USA during summer 2023, EGU General Assembly 2024, Vienna, Austria, 14–19 Apr 2024, EGU24-3240, https://doi.org/10.5194/egusphere-egu24-3240, 2024.

We present a comprehensive regional analysis of trends and variability in daily maximum 8-hour average ozone across the contiguous United States over 1990-2023. At the first stage, we evaluate the trends based on various seasonal percentiles at all available monitoring sites. Secondly, the overall regional trends (Western and Eastern USA) are derived at various seasonal percentiles. Results show that consistent and strong negative trends can be found in the eastern USA at the 95th and 50th percentiles in spring, summer and fall since the early 2000s, while winter trends are increasing. The similar seasonal trends are found in the Western USA, but with weaker magnitudes of trends. Throughout the analysis implications of the correlations between heatwave frequency/intensity and ozone variability are discussed.

How to cite: Chang, K.-L. and Cooper, O. R.: Change point analysis of seasonal ozone trends and distribution across the United States, EGU General Assembly 2024, Vienna, Austria, 14–19 Apr 2024, EGU24-4182, https://doi.org/10.5194/egusphere-egu24-4182, 2024.

EGU24-5050 | PICO | AS3.15

The GOME-type Tropical Tropospheric Ozone Essential Climate Variable (GTTO-ECV) satellite data record between 1995 and 2023 

Klaus-Peter Heue, Diego Loyola, Melanie Coldewey-Egbers, Jeroen van Gent, Michel van Roozendael, and Daan Hubert

A tropospheric ozone Climate Data Record from 1995 until end 2023 has been generated within ESA’s Climate Change Initiative programme. The GOME-type Tropical Tropospheric Ozone Essential Climate Variable (GTTO-ECV) satellite data record combines data from GOME, SCIAMACHY, OMI, the three GOME-2 missions and TROPOMI. The retrieval is based on the Convective Cloud Differential technique, which limits the coverage to the tropical belt (20°S to 20°N). We generated two monthly mean data sets at 1° x 1° resolution: one corresponds to a tropospheric column up to 200 hPa as in the previous CCI data release (Heue et al., 2016), while the other is limited to 270 hPa this pressure level is used in the operational S5P data set. Besides a consistent reprocessing of the CCD data for individual sensors, we also updated the harmonising scheme. The mean bias as well as the mean annual cycle relative to the reference instrument (OMI) are used to correct for the differences between the sensors.

Heue et al (2016) inferred a mean tropospheric ozone trend of +0.7±0.1 DU/decade (1995-2015) from the previous GTTO-ECV version. Did the trend change with the extended and improved data set? The GTTO-ECV data record will be used to investigate the tropical mean trend as well as temporal and local changes in the trends or extreme events.

How to cite: Heue, K.-P., Loyola, D., Coldewey-Egbers, M., van Gent, J., van Roozendael, M., and Hubert, D.: The GOME-type Tropical Tropospheric Ozone Essential Climate Variable (GTTO-ECV) satellite data record between 1995 and 2023, EGU General Assembly 2024, Vienna, Austria, 14–19 Apr 2024, EGU24-5050, https://doi.org/10.5194/egusphere-egu24-5050, 2024.

EGU24-6893 | ECS | PICO | AS3.15

Ozone deposition measurements over wheat fields in the North China Plain 

Xiaoyi Zhang, Wanyun Xu, Weili Lin, Gen Zhang, Jinjian Geng, Li Zhou, Huarong Zhao, Guangsheng Zhou, and Xiaobin Xu

Ozone (O3) deposition contributes 20% to the annual global tropospheric O3 loss, affecting surface air quality,, the ecosystem and climate change. Limited by the instrument and method shortage, O3 deposition in China, experiencing significantly increasing O3 exposure, was less observed and investigated. Here, we conducted a comprehensive measurement of O3 deposition over the wheat canopy at a typical polluted agricultural site of North China Plain using a new relaxed eddy accumulation (REA-O3 flux) system. O3 deposition flux and velocity (Vd) were at the averages of -0.25±0.39 μg m-2 s-1 and 0.29±0.33 cm s-1, respectively. Daytime Vd (0.40±0.38 cm s-1) was obviously higher than in the nighttime (0.17±0.26 cm s-1). Vd played a decisive effect on the diel pattern of deposition flux, while O3 concentration determined the flux variability on the longer timescales. The temporal changes of Vd were mainly determined by crop growth during wheat growing season, with predominantly contribution of stomatal uptake. Both daytime and nighttime Vd exhibited significant increase with decreasing relative humidity, and increasing friction velocity and soil water content, enhanced by higher leaf area index. With rapid increase of soil moisture, simultaneous and following overall increments in Vd were detected, attributed that stomatal conductance increased and opening extended to the night, remarkably strengthening O3 stomatal uptake, and soil NO emission might be strengthened at moist condition, facilitating non-stomatal O3 removals at night. The study suggests the leading effects of crop growth on O3 deposition modulated by environmental condition and the non-negligible influences of nocturnal plant activities, and emphasizes the needs for O3 deposition observation over different surface and accurate evaluation of O3 agricultural impacts based on deposition fluxes.

How to cite: Zhang, X., Xu, W., Lin, W., Zhang, G., Geng, J., Zhou, L., Zhao, H., Zhou, G., and Xu, X.: Ozone deposition measurements over wheat fields in the North China Plain, EGU General Assembly 2024, Vienna, Austria, 14–19 Apr 2024, EGU24-6893, https://doi.org/10.5194/egusphere-egu24-6893, 2024.

EGU24-9759 | ECS | PICO | AS3.15 | Highlight

Long-term trends in urban ozone in Europe and the USA 

Beth Nelson, Will Drysdale, and James Lee

High emissions of NOx and anthropogenic VOCs from urban areas are a major source of tropospheric ozone production. Tropospheric ozone is a secondary air pollutant that is harmful to human health as well as crop and ecosystem productivity, and an important greenhouse gas. It is formed from the chemical processing of NOx and VOCs in a non-linear cycle, making ozone reduction strategies challenging. Urban centres across the world are developing at different rates and emitting different combinations and concentrations of chemical species, resulting in location specific drivers of urban ozone concentrations. Alongside this, different countries and cities have implemented a wide range of location specific air quality and climate change measures to reduce air pollution and greenhouse gas emissions. The diversity of these policies over the past few decades has further led to different outcomes for secondary pollutant formation across the globe.

As part of TOAR-II, long-term trends in urban ozone concentrations over the past 20 years across over 400 sites in Europe and the USA will be explored. This study utilises the TOAR database, accessed via the TOAR Data Portal, which collects hourly data of long-term surface air quality measurements from over 10,000 stations globally. Using ground-based data from air quality monitoring networks, seasonal trends in ozone and NO2 concentrations are explored alongside trends in peak ozone and MDA8.  Global 5-year trends in ozone and NO2 will also be examined, extending the analysis to include urban centres in China and South America. The period between 2018-2022 will be investigated, allowing us to take a closer look into the impact of COVID-19 in cities across the world. This study aims to assess trends in urban ozone and NO2 across Europe and the USA, and to explore how lockdowns and restrictions during the COVID-19 pandemic might reveal insights into a lower NOx emission future.

How to cite: Nelson, B., Drysdale, W., and Lee, J.: Long-term trends in urban ozone in Europe and the USA, EGU General Assembly 2024, Vienna, Austria, 14–19 Apr 2024, EGU24-9759, https://doi.org/10.5194/egusphere-egu24-9759, 2024.

EGU24-9865 | ECS | PICO | AS3.15 | Highlight

Effects of Heatwaves on European Ground Level Ozone Pollution in Recent Years 

Will Drysdale, Beth Nelson, Sam Wilson, and James Lee

Heatwaves are phenomena that are occurring with increasing frequency, a trend which is expected to continue over the coming century as the effects of climate change continue to be felt, as has been well documented in the IPCC’s AR6 synthesis report. Heatwaves are of direct concern to human health due to exposure to extreme heat, but also for their secondary impacts including those on air pollution. 

A heatwave describes a period of hot weather where the air temperature exceeds a climatological average for that region, for example the UK’s Met Office defines these based on the average temperature in a region for the 15th July 1991 - 2020. The meteorology surrounding heatwaves is usually characterised by stagnant conditions, allowing air pollutants to remain closer to their sources and allowing secondary pollutants to form there. Tropospheric ozone is one of these air pollutants, created through the reactions of nitrogen oxides and volatile organic compounds and is harmful to human health.

As a part of the World Meteorological Organisation’s Air Quality and Climate Bulletin (2023), we included a short report on the effects of the July 2022 heatwave on ozone concentrations measured across several hundred air quality monitoring stations which were located primarily in urban and rural background locations in Europe. Here we present an extended analysis examining heatwave events over the last decade and their contribution to the number of extreme ozone events experienced at these sites.

How to cite: Drysdale, W., Nelson, B., Wilson, S., and Lee, J.: Effects of Heatwaves on European Ground Level Ozone Pollution in Recent Years, EGU General Assembly 2024, Vienna, Austria, 14–19 Apr 2024, EGU24-9865, https://doi.org/10.5194/egusphere-egu24-9865, 2024.

EGU24-10612 | PICO | AS3.15

The contribution of transport emissions to ozone mixing ratios in 2015 and 2050 in the Shared Socioeconomic Pathways (SSPs) 

Mariano Mertens, Sabine Brinkop, Volker Grewe, Johannes Hendricks, Patrick Jöckel, Anna Lanteri, Sigrun Matthes, and Mattia Righi

The transport sector (i.e. aviation, land-based transport and shipping) is an important source of emissions of ozone precursors such as nitrogen oxides (NOx), volatile organic compounds (VOCs) and carbon monoxide (CO). The formation of ozone from these precursors is a highly non-linear process which depends strongly on atmospheric background conditions (i.e., emissions from other sectors and meteorological conditions) and on the amount of transport emissions. As the different transport sectors emit at different geographical locations under different background conditions, their impact on tropospheric ozone cannot be estimated simply by comparing the emission shares. Instead, model-based spatially resolving approaches are needed that include a detailed ozone source attribution. To do this, we quantified for the first time the contribution of each transport sector to tropospheric ozone in a consistent way using the EMAC global chemistry-climate model equipped with an ozone source apportionment technique (called TAGGING). We performed simulations for present-day (2015) and for 2050 under the Shared Socioeconomic Pathways (SSP) SSP1-1.9, SSP2-4.5 and SSP3-7.0 and analysed the contributions of land-based transport from different geographical regions, shipping, and aviation to ozone. Based on these calculated contributions, we quantify the ozone radiative forcing (RF) attributable to emissions from the transport sector.

For 2015, we estimate an ozone RF attributable to emissions from land-based transport, shipping and aviation of 121 mWm-2, 60 mWm-2, and 31 mWm-2,respectively. Compared to 2015, only SSP1-1.9 shows a strong decrease of ozone RF attributable to the entire transport sector in 2050. For the SSP2-4.5 scenario, we find similar RFs of the entire transport sector as for 2015, while the RFs in SSP3-7.0 increase compared to 2015.

How to cite: Mertens, M., Brinkop, S., Grewe, V., Hendricks, J., Jöckel, P., Lanteri, A., Matthes, S., and Righi, M.: The contribution of transport emissions to ozone mixing ratios in 2015 and 2050 in the Shared Socioeconomic Pathways (SSPs), EGU General Assembly 2024, Vienna, Austria, 14–19 Apr 2024, EGU24-10612, https://doi.org/10.5194/egusphere-egu24-10612, 2024.

The World Health Organization (WHO) estimates that air pollution is responsible for more than seven million premature deaths every year around the world. Above background concentrations, tropospheric ozone (O3) exerts negative effects on human health and vegetation. High ozone production occurs in conditions of strong sunlight and high temperature, as the acceleration of ozone formation is associated with high temperatures and photolysis. Therefore, it is a secondary pollutant that results from the reaction between nitrogen oxides (NOx) and volatile organic compounds (VOCs) released into the atmosphere from natural or anthropogenic activities. The combination of sunlight with non-methane hydrocarbons (NMHCs) and NOx (NO + NO2) from biomass burning can also contribute to an increase in tropospheric ozoneconcentration values. The main objective of this research is to study the tropospheric ozoneconcentration through the analysis of some precursors, between 2004 and 2022, over Portugal's mainland. In the present analysis, several predictors were selected, such as Surface Solar Radiation Downwards (SSRD), Fire Radiative Power (FRP), Temperature, Nitrogen Dioxide (NO2), and Time of the Year (TOY). The FRP data used has been delivered in near real-time, since 2004, by the EUMETSAT Land Surface Analysis Satellite Applications Facility (LSA-SAF). The SSRD, ozone concentration and the remaining variables were collected from the Copernicus Atmosphere Monitoring Service (CAMS) reanalysis. The SSRD data is obtained from the ERA5 database, while the other variables are from the EAC4 database. A stepwise regression was applied to selected predictors used to evaluate the influence of each on ozone concentration and two models to estimate mean and maximum ozone tropospheric concentration were proposed. To understand the synoptic atmospheric patterns linked to tropospheric ozone concentration, spatial patterns of geopotential 850 mb, sea mean level pressure, vertical velocity, air temperature, and wind speed were analyzed during days characterized by high and low ozone concentrations. The regression models proposed have been tested using the Monte Carlo procedure and both models show high accuracy and robustness. Results also show a relevant contribution of FRP to mean and maximum ozone concentrations, namely for the composite of days characterized by high ozone concentration. In the present context of climate change and considering the foreseen increase of fire activity and severity, the proposed models revealed to be a useful tool for estimating tropospheric ozone concentration during the recent extreme fire events and also for analyzing the potential impacts of those concentrations on health and ecosystems. 


Acknowledgements:

This study is partially supported by the European Union’s Horizon 2020 research project FirEUrisk (Grant Agreement no. 101003890), by the Portuguese Fundação para a Ciência e a Tecnologia (FCT) I.P./MCTES through national funds (PIDDAC) – UIDB/50019/2020- IDL,  DHEFEUS - 2022.09185.PTDC and by European Investment Funds by FEDER/COMPETE/POCI– Operacional Competitiveness and Internacionalization Programme, under Project POCI-01-0145-FEDER-006958 and National Funds by FCT - Portuguese Foundation for Science and Technology, under the project UID/AGR/04033/2020.

How to cite: Alonso, C., A. Santos, J., and Gouveia, C.: Analysis of tropospheric ozone predictors and their relationship with the occurrence of fires in mainland Portugal, EGU General Assembly 2024, Vienna, Austria, 14–19 Apr 2024, EGU24-10961, https://doi.org/10.5194/egusphere-egu24-10961, 2024.

EGU24-11737 | PICO | AS3.15 | Highlight

Surface Ozone Trends in South America: Unraveling the Influence of Precursor Shifts and Extreme Events 

Rodrigo Seguel, Lucas Castillo, Charlie Opazo, Néstor Rojas, Thiago Nogueira, María Cazorla, Mario Gavidia-Calderón, Laura Gallardo, René Garreaud, Tomás Carrasco, and Yasin Elshorbany

This work analyzes ground-level ozone trends in South America, an understudied region with scarce comprehensive trend estimates. We present an updated regional analysis and test a hypothesis proposing that the recent increase in ozone levels, particularly in urban environments, may be linked to intense wildfires induced by extreme meteorological events within a preexisting volatile organic compounds (VOC)-limited regime. Utilizing the quantile regression method, we estimate trends, quantify uncertainties, and identify change points. Short- and long-term exposure is assessed using the maximum daily 8-hour average and peak season metrics. Our findings reveal lower ozone levels in tropical cities (Bogotá and Quito), ranging between 39-43 ppbv for short-term and 26-27 for long-term exposure. In contrast, extratropical cities (Santiago and São Paulo) exhibit higher ozone levels, with short-term exposure at 61 ppbv and long-term exposures between 40-41 ppbv. Santiago (since 2017) and São Paulo (since 2008) show positive trends of 0.6 ppbv yr-1 and 0.2 ppbv yr-1, respectively, with very high certainty. We attribute these upward trends, or the absence of evidence of variation as observed in Bogotá and Quito, to the established VOC-limited regime. However, the higher increase in extreme percentile trends (≥ 90th) is linked to the impact of wildfires and biomass burning, particularly in southwestern South America, associated with extreme meteorological configurations.

How to cite: Seguel, R., Castillo, L., Opazo, C., Rojas, N., Nogueira, T., Cazorla, M., Gavidia-Calderón, M., Gallardo, L., Garreaud, R., Carrasco, T., and Elshorbany, Y.: Surface Ozone Trends in South America: Unraveling the Influence of Precursor Shifts and Extreme Events, EGU General Assembly 2024, Vienna, Austria, 14–19 Apr 2024, EGU24-11737, https://doi.org/10.5194/egusphere-egu24-11737, 2024.

EGU24-11946 | ECS | PICO | AS3.15

Assessing the effects of surface ozone on forest GPP: a vegetation model approach using JULES 

Inês Vieira, Félicien Meunier, Stephen Sitch, Flossie Brown, Carolina Duran Rojas, Giacomo Gerosa, Ivan Jansseans, Pascal Boeckx, Marijn Bauters, and Hans Verbeeck

Tropospheric Ozone (O3) is a secondary pollutant known for its positive radiative forcing and detrimental effects on air quality, human health, and ecosystems. In plants, O3 acts as a strong oxidant, affecting cellular and molecular processes, e.g. modifying rubisco activity, reducing stomatal conductance, and inducing early leaf senescence. This study aims to evaluate the effects of O3 on Gross Primary Production (GPP) at six forest sites: five European sites (Belgium, France, Finland and Italy) and one tropical site in the Congo Basin. We employed a modelling approach, contrasting simulations of GPP with and without the influence of O3 using the Joint UK Land Environment Simulator (JULES), a land surface model used to study soil-vegetation-atmosphere interactions. The JULES model was calibrated for each site, adjusting key parameters, using historical climate data and soil properties to align with each location's specific environmental and vegetation characteristics. Therefore, we forced the model using measurements of local tropospheric O3, CO2, and meteorological variables. We conducted two simulations for each site: one representing the existing O3 levels observed at each site and another under O3-free conditions. This comparative approach enabled us to isolate the specific effects of O3 on GPP to quantify this effect. Our findings reveal a difference in the sensitivity of the contrasting forest ecosystems to O3 exposure. The correlation values between modelled GPP with O3 and observed GPP vary between 0.786 in Castelporziano, Italy and 0.933 in Hyytiälä, Finland. Consequently, the European sites, encompassing a range of climatic and ecological conditions, displayed diverse responses to O3, and the GPP reduction varies along the different sites. The GPP reduction due to O3 exposure varied across sites, ranging from -1.52% in Hyytiälä, Finland, to -9.79% in Castelporziano, Italy. This study shows the necessity of long-term monitoring datasets combined with process-based models to understand better the O3 impacts at several ecosystems.

How to cite: Vieira, I., Meunier, F., Sitch, S., Brown, F., Duran Rojas, C., Gerosa, G., Jansseans, I., Boeckx, P., Bauters, M., and Verbeeck, H.: Assessing the effects of surface ozone on forest GPP: a vegetation model approach using JULES, EGU General Assembly 2024, Vienna, Austria, 14–19 Apr 2024, EGU24-11946, https://doi.org/10.5194/egusphere-egu24-11946, 2024.

EGU24-13411 | ECS | PICO | AS3.15

High levels and behavior of tropospheric ozone in the Andes Mountains, Central Chile 

Valeria Campos, Luis Díaz-Robles, Ximena Fadic, María Florencia Ruggeri, Fidel Vallejo, Gonzalo Barcaza, Joshua S. Fu, and Francisco Cereceda-Balic

Tropospheric ozone is generated by photochemical reactions by precursor pollutants, or it can also proceed from stratospheric intrusion. In addition to affecting the population's health, ozone exposure threatens biodiversity conservation and the production of food and forest products.

A prior study by this research group assessed public ozone monitoring stations across Chile, revealing that only stations near the Andes Mountains in central Chile exceed the national standard of 61 ppb. The highest concentrations were observed at Las Condes station (790 m.a.s.l.) and Los Andes station (830 m.a.s.l.).

In this context, the present study aimed to determine whether tropospheric ozone exists in high concentrations in the Andes Mountains range at higher altitudes and its behavior. For this reason, an ozone monitoring station was installed at the NUNATAK-1 refuge laboratory, located in Portillo (32.844ºS, 70.129ºW), east of the Los Andes station, at 3,000 m.a.s.l. The monitoring period for this study spanned from October 6, 2022, to October 18, 2023, with minute resolution using Thermo Scientific™ 49iQ Ozone Monitor, which employs a dual cell UV photometry (sample and reference) to measure the amount of ozone in the air from ppb levels up to 200 ppm, (detection limit: 0.50 ppb in 60 second averaging time; precision: ±1.0 ppb; response time: 20 seconds).

During the monitoring period, hourly averages of up to 80 ppb were observed, and the 99th percentile of the maximum daily 8-hour moving average was 61.56 ppb, exceeding the Chilean standard. The Portillo records were compared with Chile's most contaminated monitoring stations, Las Condes and Los Andes, using an ANOVA test, and a p-value ≤ 0.05 was obtained. Therefore, it is concluded that there are statistically significant differences between the stations. The LSD test further determined that Portillo exhibited a significantly higher average ozone concentration, with levels averaging 55% higher than those in Los Andes and 58% higher than those in Las Condes.

In the northern hemisphere, elevated tropospheric ozone levels have been observed in high-altitude regions, including the western US, western Europe, central Japan, central China, Himalayas, Greenland, southern Algeria, and Izaña. However, in the southern hemisphere, ozone in mountainous areas has not been studied as extensively due to poor data coverage. This study unveils ozone records spanning a year in the Andes Mountains, revealing even higher concentrations than those observed in urban areas in Chile. Therefore, tropospheric ozone could be harming the biodiversity of the Andes Mountain range in central Chile. Furthermore, ozone could adversely affect the health of climbers and hikers exploring the Andes Mountain range.

Subsequent studies should determine whether the tropospheric ozone recorded in the Andes Mountains range results from long-distance ozone or precursor pollutants transport from urban source regions, or ozone intrusion from the stratosphere. Photochemical modeling is recommended for a more comprehensive understanding and monitoring campaigns of the vertical ozone profile using radiosonde.

Acknowledgment to ANID Project: Anillo ACONCAGUA ACT210021, Fondecyt Regular 1221526, FOVI230167, and ANID National PhD Scholarship 21202033.

How to cite: Campos, V., Díaz-Robles, L., Fadic, X., Ruggeri, M. F., Vallejo, F., Barcaza, G., Fu, J. S., and Cereceda-Balic, F.: High levels and behavior of tropospheric ozone in the Andes Mountains, Central Chile, EGU General Assembly 2024, Vienna, Austria, 14–19 Apr 2024, EGU24-13411, https://doi.org/10.5194/egusphere-egu24-13411, 2024.

EGU24-13520 | ECS | PICO | AS3.15

Quantification and evaluation of TROPESS ozone trends 

Elyse Pennington, Jessica Neu, Kevin Bowman, Kazuyuki Miyazaki, and Gregory Osterman

We present an analysis of ozone data products retrieved from multiple satellite observations. Specifically, we highlight data from the TRopospheric Ozone and its Precursors from Earth System Sounding (TROPESS) project which is a NASA effort that provides retrievals of atmospheric ozone utilizing radiances from a variety of different satellite instruments. The multispectral retrievals of ozone utilize the Multi-Spectra, Multi-Species, Multi-Sensors Retrievals of Trace Gases (MUSES) retrieval framework to produce consistent estimations of ozone from different satellite radiances. TROPESS ozone data products are retrieved from the Atmospheric Infrared Sounder (AIRS), the Ozone Monitoring Instrument (OMI), the Cross-track Infrared Sounder (CrIS) instruments, and combinations of these satellites.

Trends in ozone are presented and evaluated using records dating from 2002 to the present. Trends are investigated globally and regionally, and validated against ozonesonde measurements. We find that the magnitude of ozone vertical profiles and columns agree between satellites to a high degree, but we are still investigating the trends seen in the different data sets. We investigate the causes of these differences between satellites, including instrument type and vertical sensitivity of the retrievals. We show ongoing work investigating comparisons between the TROPESS ozone data products, chemical reanalysis products using the MOMO-Chem framework, other satellite products, and ground-based observations, as well as trends in ozone precursors.

How to cite: Pennington, E., Neu, J., Bowman, K., Miyazaki, K., and Osterman, G.: Quantification and evaluation of TROPESS ozone trends, EGU General Assembly 2024, Vienna, Austria, 14–19 Apr 2024, EGU24-13520, https://doi.org/10.5194/egusphere-egu24-13520, 2024.

EGU24-13666 | PICO | AS3.15

Comparative analysis of tropospheric ozone concentrations at Union Glacier, Antarctica: long-term observations and recent measurements 

Luis Alonso Díaz Robles, Fidel Vallejo Gallardo, Valeria Campos Bravo, Ximena Fadic, Gonzalo Barcaza, Hans Moosmuller, and Francisco Cereceda-Balic

This study compares tropospheric ozone (O3) concentrations measured at Union Glacier (UG), Antarctica, in December 2023 with long-term trends and observations reported in recent literature. Ground-measurements for continuous gas and particulate matter monitoring were carried out at UG (West Antarctica), nearby the Estación Polar Conjunta Glaciar Unión (79° 46´S 82° 19´W). Union Glacier, which with ~2561 km2, is one of the largest outlet glaciers in the Ellsworth Mountains, flowing to the Ronne-Filchner Ice Shelf. Ozone concentrations were measured using an ETL-ONE multiparametric air quality monitoring station equipped with an UniTec SENS-IT O3 metal oxide sensor, which shows strong correlation with the Federal Reference Methods (FRMs) for O3, for both field (R2 ~ 0.72-0.83) and laboratory studies (R2 >0.80 ). During over one week of monitoring with 1-minute resolution, we observed high O3 levels at UG (mean: 45.8 ppb), significantly exceeding typical polar values. These findings are juxtaposed with analyses from various studies spanning over two decades, offering a broader context of O3 dynamics in polar regions.

Kumar et al. (2021) and Helmig et al. (2007) documented increasing surface O3 trends in Antarctica, associating them with climate issues and radiative processes. Our observations at UG align with these increasing trends but notably surpass the projected mean values, suggesting additional local or transient factors influencing O3 levels. As observed in our study, the possible intrusion of stratospheric O3 resonates with Yan Xia et al. (2023) findings, emphasizing the impact of stratospheric-tropospheric exchange, particularly during sudden stratospheric warming events.

Furthermore, the subtle yet persistent O3 increases noted by Law et al. (2023) in the Arctic provide a comparative baseline, highlighting the polar-specific atmospheric dynamics. Our data also contribute to understanding the complex interplay of O3 with nitrogen oxides (NOx), as discussed by Zhou et al. (2020), indicating that background NOx might play a crucial role in O3 variability.

In light of these comparative analyses, our study underscores the importance of continued and enhanced O3 monitoring in Antarctica to decipher the underlying mechanisms driving its distribution. These findings are particularly crucial for predicting future climate impacts and understanding the role of polar regions in global atmospheric chemistry. They advocate for a more nuanced understanding of polar O3 trends, factoring in localized events and broader climatic influences to elucidate the evolving narrative of tropospheric O3 in these remote regions.

Acknowledgment to INACH Project RT_34-21 and ANID Proyect: Anillo ACONCAGUA ACT210021, Fondecyt Regular 1221526 and FOVI230167.

References:

Helmig et al. (2007)

Kumar et al. (2021)

Law et al. (2023)

Yan Xia et al. (2023)

Zhou et al. (2020)

How to cite: Díaz Robles, L. A., Vallejo Gallardo, F., Campos Bravo, V., Fadic, X., Barcaza, G., Moosmuller, H., and Cereceda-Balic, F.: Comparative analysis of tropospheric ozone concentrations at Union Glacier, Antarctica: long-term observations and recent measurements, EGU General Assembly 2024, Vienna, Austria, 14–19 Apr 2024, EGU24-13666, https://doi.org/10.5194/egusphere-egu24-13666, 2024.

EGU24-14247 | PICO | AS3.15 | Highlight

Effects of Rising CO2 Concentration on Global Ozone Air Quality  

Kylie W. K. Cheng, Amos P. K. Tai, and Anthony Y. H. Wong

Surface ozone is a major air pollutant that harms not only human health but also crop and vegetation productivity. The continuously rising atmospheric CO2concentration can affect surface ozone levels through various vegetation-mediated ecophysiological pathways. These pathways include higher leaf densityfollowing CO2 fertilization, which can lead to increased biogenic volatile organic compound (BVOC) emissions and dry deposition, inhibition of BVOC emissions due to competitive biochemical effects in leaves, and lower stomatal conductance resulting in lower dry deposition. In this study, we implemented an ecophysiology module that explicitly links the computation of dry deposition velocity and isoprene emission to photosynthesis calculation in the GEOS-Chem global 3-D chemical transport model, and conducted model experiments to simulate the effects of rising CO2 levels on surface ozone pollution via CO2 fertilization, isoprene inhibition and stomatal closure under an atmospheric CO2 level projected by Representative Concentration Pathway (RCP) 8.5 scenarios in 2050, with 2010 as the base year for comparison. The effects of rising CO2 on enhancement in leaf area index (LAI) were simulated separately using a land surface model (Community Land Model, CLM). The simulated results indicate that the CO2-induced ecophysiological effects depend largely on the environmental regime and plant traits. The combination of all the CO2-induced ecophysiological responses lead to –3 to +5 ppbv of changes in surface ozone. While for the simulated results with the ecophysiology module implemented, the effects of all ecophysiological pathways result in an overall decrease in ozone levels by –0.047% in global tropospheric ozone burden, which corresponds to –2 to +2 ppbv of changes in surface ozone. In regions with low-NOx environment and dense vegetation, the effect of CO2 fertilization outweighs that of isoprene inhibition and stomatal closure, giving an overall decrease in ozone. In high-NOx environment like North America and Europe, the effect of isoprene inhibition offsets that of CO2 fertilization or stomatal closure. By comparing with the results, the impact of rising CO2 on ozone levels is found to beoverall modest due to the counteracting effects of different pathways, but can be regionally important for specific pathways, underscoring the necessity of comprehensively analysing the interplay between the atmosphere and biosphere when examining the influence of increasing CO2 on global atmospheric chemistry. 

How to cite: Cheng, K. W. K., Tai, A. P. K., and Wong, A. Y. H.: Effects of Rising CO2 Concentration on Global Ozone Air Quality , EGU General Assembly 2024, Vienna, Austria, 14–19 Apr 2024, EGU24-14247, https://doi.org/10.5194/egusphere-egu24-14247, 2024.

Land cover has significant impacts on local meteorology and biogenic volatile organic compounds (BVOCs) emissions, which in turn affects surface ozone air quality. The Guangdong-Hong Kong-Macau Greater Bay Area (GBA) is a hotspot of ozone air pollution, where BVOCs play an important role. The importance of BVOCs in ozone air pollution strengthens during heatwaves, and heatwaves have been increasing in frequency and intensity in the past two decades. Therefore, it is critical to have accurate BVOCs emissions in atmospheric chemistry models for simulating ozone air quality and supporting the design of efficient ozone air pollution control strategies. However, current BVOCs emissions derived from the outdated and coarse (0.25° x 0.3125° spatial resolution) Community Land Model version 4.5 (CLM4) plant functional types (PFT) map based on Moderate Resolution Imaging Spectroradiometer (MODIS) land cover dataset in 2000 is far from sufficient for producing an accurate BVOCs emission inventory in the GBA. What is more, the CLM4 BVOCs emissions do not consider the substantial land cover change in the GBA in the past two decades, thus incapable of simulating ozone responses to land cover change on a decadal timescale. In this study, we employ the 30m Finer Resolution Observation and Monitoring of Global Land Cover (FROM_GLC2017) map for simulating meteorology with the WRF model and deriving an updated BVOCs emission inventory with MEGAN for September 2017, during which time a one-week heatwave event happened in the GBA. The online two-way coupled regional meteorology-chemistry model WRF-GC v2.0 with the detailed Greater Bay Area anthropogenic emission inventory (GBA-EI) reproduces the MDA8 ozone during non-heatwaves (r = 0.71, NMB = 4.21%), but has significant low biases for MDA8 ozone during heatwaves (r = 0.26, NMB = 27.32%). We find that updating the land cover data from U.S. Geological Survey (USGS) and CLM4 to FROM_GLC2017 is promising to correct the biased low ozone during heatwaves. Compared with the original USGS land cover map, broadleaf evergreen tree forest cover, which has a high BVOCs yield and responds swiftly to temperature increase, increases by 37.29%. Concurrently, the cropland cover, which has a relatively low BVOCs yield, decreases by 44.62%. We will go on to investigate how land cover changes affect ozone trends in the GBA in the past two decades with the long-term FROM_GLC2017 land cover dataset.

How to cite: Zhang, J., Zhai, S., and Tai, A. P. K.: Responses of biogenic volatile organic compound emissions and surface ozone air pollution in the Greater Bay Area to heatwaves, EGU General Assembly 2024, Vienna, Austria, 14–19 Apr 2024, EGU24-15216, https://doi.org/10.5194/egusphere-egu24-15216, 2024.

Daily thresholds of meteorological factors relative to severe summer ozone pollution are determined in the North China Plain (NCP), the Fenhe River and Weihe River Plain (FWP), the Sichuan Basin (SCB), the Changjiang River Plain (CJR) and Pearl River Delta (PRD) by combing ozone concentrations at air quality monitoring stations and meteorological elements at weather stations. These regions share same daily thresholds, namely maximum temperature above 30 °C, relative humidity below 80%, rainfall below 10 mm and radiation in the scope of 17~27 MJ/m2 together with wind speed in the range of 0.5~3.0 m/s. The adverse meteorological frequency combining daily thresholds of wind speed and radiation shows individual trend and periodic characteristics in each region after conducting 10-year moving average, namely rising with 3~6 percentage points/decade in NCP (in June), FWP (in June, July and August) and CJR (in July) while decreasing with 2~3 percentage points in SCB in July and August. However, there are no apparent trends in PRD. Additionally, these frequencies are periodic with 8.3 years to 25 years. The frequencies are positively related to Western Pacific Subtropical High (WPSH) in NCP, FWP, CJR and PRD, while negatively relevant in SCB. The correlate coefficients between Southern Oscillation and the frequencies vary in regions and months. With cyclo-stationary empirical orthogonal function analysis, we also substantiate impacts of global warming, Pacific Decadal Oscillation, El-Nino and La-Nina on WPSH in two typical months. These would give us more insights on meteorological effects on ozone pollution and be helpful for its projection.

How to cite: Li, Y., Gao, Q., Gao, W., Du, W., and Rehfeld, K.: Thresholds of Meteorological Factors Conductive to Severe Summer Ozone Pollution in China and Relation of Occurrence Frequency with Large Scale Circulations, EGU General Assembly 2024, Vienna, Austria, 14–19 Apr 2024, EGU24-15699, https://doi.org/10.5194/egusphere-egu24-15699, 2024.

EGU24-17957 | ECS | PICO | AS3.15

Comparison of time-resolved continuous measurements of ozone precursor VOCs in Borna, Saxony (Germany)  

Max Hell, Dominik van Pinxteren, Susanne Bastian, and Hartmut Herrmann

Volatile organic compounds (VOCs) are, together with nitrogen oxides (NOx), important precursor substances from which ground-level ozone (O3) can be formed through complex reaction chains. As there are only low regulatory requirements for VOC measurements in the EU, VOCs are only sparsely recorded in the air quality monitoring networks in Germany and Europe, in contrast to ozone and nitrogen oxides. However, in order to determine trends, check the effectiveness of emission reduction strategies and the correctness of emission inventories, be able to allocate emission sources and better understand ozone formation and the spread of its precursors, it is necessary to carry out long-term measurements of ozone precursors with a higher temporal resolution.

To check their suitability for continuous time-resolved VOC monitoring especially in measurement networks, two commercially available online-GC systems were tested over a time-period of about 1 1/2 years at a station of the air quality monitoring network in Saxony, Germany. Comparing the raw concentrations obtained from these two automated systems, the parameters of the regression are ranging from a slope of 0.4 and an R² of 0.13 for ethene to a slope of 2 and a R² of 0.54 for toluene. Both instruments required a significant maintenance effort and due to a number of hardware and software issues, a data availability of 73-76 % was achieved. The biggest issue with the raw data quality arose from retention time shifts, especially for low boiling point compounds, leading to frequent misclassifications of chromatographic peaks. Time-consuming manual or semi-manual reprocessing of the raw data is mandatory to increase the data quality to a more acceptable level. With the reprocessed data, a slope of 1.6 and R² of 0.59 for ethene and a slope of 1.3 and R² of 0.85 for propane as best-case example can be reached.

Approximately 20 of the 61 calibrated compounds could be measured on a regular basis including BTX aromatics and small chain alkanes and alkenes. Concentrations are ranging from 0.03 ppb for most of the aromatics and longer chain alkanes and alkenes up to 2.2 ppb for C2 and C3 compounds. During the vegetation period, biogenic VOCs and especially isoprene show higher concentrations of up to 7.6 ppb. From the measured seasonal trends and diurnal and weekly patterns, influences from different emission sources such as local traffic, heating or vegetation can be obtained and first results will be presented. In addition, together with the respective photochemical ozone creation potential (POCP) values of the measured VOCs, the influence of regional precursor emissions on the ozone concentration can be determined.

How to cite: Hell, M., van Pinxteren, D., Bastian, S., and Herrmann, H.: Comparison of time-resolved continuous measurements of ozone precursor VOCs in Borna, Saxony (Germany) , EGU General Assembly 2024, Vienna, Austria, 14–19 Apr 2024, EGU24-17957, https://doi.org/10.5194/egusphere-egu24-17957, 2024.

EGU24-18035 | ECS | PICO | AS3.15

Characterization of VOC sources in a typical urban environment (Valencia) 

Daeun Jung, Enrique Mantilla, Esther Borrás, Teresa Vera, and Amalia Muñoz

Tropospheric ozone (O3) is a major concern in the atmosphere due to its adverse effects on human health and vegetation. O3 is a secondary pollutant, formed through complex photochemical processes from its precursors like nitrogen oxides (NOX) such as volatile organic compounds (VOCs). The Mediterranean coastline is particularly sensitive to human activities, under a climate with high insolation, under a climate with high solar radiation where a large part of the year prevails a regime of mesoscale winds (breezes) supported by a favourable orography. Large metropolitan areas, such as the city of Valencia, contribute to photochemistry with important emissions of NOX and VOCs to the atmosphere, especially traffic, which determines high levels of ozone in the surrounding areas. However, there are other sources that can also play a relevant role in atmospheric photochemistry, which are not well known and do not have a sufficiently detailed emission profile speciation. This study deals with the analysis of the VOCs associated with three types of common emission sources (gas stations, ports and car painting shops) in a Mediterranean city, in this case Valencia. This could lead to a significant improvement in the urban VOC speciation for emission inventories used in model simulations, especially for O3 in future studies.

10 passive samplers for VOCs were installed for two weeks during summertime when O3 levels are typically elevated (from 29 June to 13 July 2023). Four samplers were placed at two gas stations (two each), three in areas influenced by the Port of Valencia, and the remaining three in nearby three different car painting shops. The measured VOC levels were analysed through gas chromatography-mass spectrometry (GC-MS) and liquid chromatography-mass spectrometry (LC-MS). Additionally, for more precise temporal resolution, proton-transfer-reaction mass spectrometry (PTR-MS) was installed at a gas station in another Mediterranean city (Castellon) during July 2023.

As a result, the total VOC concentrations are generally high in car painting shops with an average of 52.4 µg m-3, followed by gas stations (44.0 µg m-3 as an average) and ports (26.4 µg m-3). Looking at the contribution of the functional groups, aldehydes are clearly the largest contributors for gas stations and ports (28.5% and 34.3%, respectively), while for car painting shops, the contribution of this group is comparable to aromatics (24.4% and 26.1%, respectively). Analysing the species, formaldehyde (aldehydes) is generally one of the main contributors for the three environments, accounting for 6.7%, 8.5%, and 5.3% of the total VOCs for gas stations, ports and car painting shops, respectively. 2-methylpentane (alkane) (5.3%) and acetone (ketone) (5.1%) are the second most important species for gas stations and ports, respectively, and the third one is acetaldehyde for both environments (4.6% and 4.9%, respectively). Meanwhile, butyl acetate (ester) and methylcyclohexane (aromatic) have also high levels for car painting shops (8.3% and 7.1%, respectively). These species, with the exception of acetone, have significant ozone formation potential, which could lead to elevated O3 levels in the western vicinity of the city.

How to cite: Jung, D., Mantilla, E., Borrás, E., Vera, T., and Muñoz, A.: Characterization of VOC sources in a typical urban environment (Valencia), EGU General Assembly 2024, Vienna, Austria, 14–19 Apr 2024, EGU24-18035, https://doi.org/10.5194/egusphere-egu24-18035, 2024.

EGU24-19159 | PICO | AS3.15

Tropospheric ozone global and regional distributions and trends from IASI 

Anne Boynard, Catherine Wespes, Juliette Hadji-Lazaro, Daniel Hurtmans, Pierre-François Coheur, Marie Doutriaux Boucher, Kevin Bowman, and Cathy Clerbaux

Tropospheric ozone (O3) is an important short-lived climate forcer and a critical secondary air pollutant, detrimental to human health and ecosystems. It is the dominant source of the hydroxyl radical OH that is highly reactive with organic and inorganic compounds. Global tropospheric O3 concentrations have been rising considerably since the pre-industrial period as a result of the increase in the anthropogenic emissions of O3 precursors. Assessing the long-term tropospheric O3 trends is critical for understanding the impact of human activity and climate change on atmospheric chemistry.

Since 2007, the IASI (Infrared Atmospheric Sounding Interferometer) instruments have been embarked on board the polar-orbiting meteorological satellites Metop-A, -B and -C. The European Organization for the Exploitation of Meteorological Satellites (EUTMETSAT) is currently reprocessing the IASI O3 dataset providing a homogeneous record of O3.

In this study, we aim to assess tropospheric ozone distributions and trends on the global and regional scales for the period 2008-2023 using the homogeneous IASI O3 dataset. Comparisons of the IASI data with the Cross-track Infrared Sounder (CrIS) satellite observations are also performed.

How to cite: Boynard, A., Wespes, C., Hadji-Lazaro, J., Hurtmans, D., Coheur, P.-F., Doutriaux Boucher, M., Bowman, K., and Clerbaux, C.: Tropospheric ozone global and regional distributions and trends from IASI, EGU General Assembly 2024, Vienna, Austria, 14–19 Apr 2024, EGU24-19159, https://doi.org/10.5194/egusphere-egu24-19159, 2024.

EGU24-20824 | PICO | AS3.15

Biomass burning influence on tropospheric ozone from recent airborne and ground-based field studies 

Steven Brown, Ilann Bourgeios, Wyndom Chace, Matthew Coggon, Andrew Langford, Jeff Peischl, Pamela Rickly, Michael Robinson, Christoph Senff, and Kristen Zuraski

Biomass burning emits large quantities of ozone precursors, nitrogen oxides (NOx) and volatile organic compounds (VOCs), to the lower atmosphere.  Recent analysis of ozone and tracers for biomass burning and urban emissions in the remote atmosphere shows that a larger fraction of tropospheric ozone may be attributable to biomass burning than global models predict.  At continental and regional scales, increasing trends in biomass burning emissions in North America are associated with enhanced ozone in U.S. cities.  Ozone production within smoke plumes leads to enhanced regional scale backgrounds, while interaction of aged smoke with urban NOx pollution may lead to increased rates of ozone production depending on the local NOx sensitivity regime.  Several recent airborne and ground-based field studies have investigated ozone in biomass burning influenced air.  The 2016-2018 Atmospheric Tomography Mission (ATom) sampled remote tropospheric biomass burning influence. The 2019 Fire Influence on Regional to Global Environments and Air Quality (FIREX-AQ) sampled wildfire smoke across the U.S. with multiple research aircraft.  The 2022 California Fire Dynamics Experiment (CalFiDE) conducted focused in-situ and remote sensing measurements in California and Oregon.  Ground-based measurements in Boulder, Colorado intercepted periods of smoke influence in the Northern Front Range urban area in 2020 and 2021.  Finally, the 2023 Atmospheric Emissions and Reactivity Observed from Megacities to Marine Areas (AEROMMA) campaign on the NASA DC-8 and the Coastal Urban Plume Dynamics Study (CUPiDS) on the NOAA Twin Otter observed long range smoke transported to U.S. urban areas and the associated impacts on ozone.  These studies provide a comprehensive analysis of the biomass burning influence on tropospheric ozone at all scales, from near field plume chemistry to the global remote troposphere, and from the continental background to local urban influence.

How to cite: Brown, S., Bourgeios, I., Chace, W., Coggon, M., Langford, A., Peischl, J., Rickly, P., Robinson, M., Senff, C., and Zuraski, K.: Biomass burning influence on tropospheric ozone from recent airborne and ground-based field studies, EGU General Assembly 2024, Vienna, Austria, 14–19 Apr 2024, EGU24-20824, https://doi.org/10.5194/egusphere-egu24-20824, 2024.

EGU24-900 | ECS | Posters on site | ST3.3

Identification of Two-Step Non-linear Interactions via Zonally Symmetric Waves during Major Sudden Stratospheric Warmings 

Gourav Mitra, Amitava Guharay, Fede Conte, and Jorge Chau

This study delved into atmospheric tides and their dynamics during two major boreal sudden stratospheric warmings (SSWs). Using meteor radar wind data, our investigation unveiled compelling indications of non-linear interactions between the semidiurnal solar tide and the quasi-20-day wave (Q20dw) in the high latitude mesosphere and lower thermosphere (MLT) during SSWs. Additionally, the diagnosis of zonal wavenumbers indicated potential non-linear interaction between the dominant semidiurnal migrating tide (SW2) and the zonally symmetric 20-day wave (20dw0) component, generating secondary waves. The study emphasized the significance of the non-linear interaction between the zonal wavenumber 2 component of the stationary planetary wave (SPW2) and the westward propagating 20-day wave (20dwW2) in the stratosphere, crucial in producing the 20dw0. The meteor radar wind spectra suggested that the excited 20dw0 possibly engages in non-linear interactions with SW2, further generating secondary waves in the MLT. Therefore, this study presents the observational evidence of a two-step non-linear interaction associated with zonally symmetric planetary waves during major SSWs.

How to cite: Mitra, G., Guharay, A., Conte, F., and Chau, J.: Identification of Two-Step Non-linear Interactions via Zonally Symmetric Waves during Major Sudden Stratospheric Warmings, EGU General Assembly 2024, Vienna, Austria, 14–19 Apr 2024, EGU24-900, https://doi.org/10.5194/egusphere-egu24-900, 2024.

EGU24-1861 | ECS | Posters on site | ST3.3

Behaviour Of Temperature During Wintertime Reversal Of Zonal Wind  

Sunil Kumar Ramatheerthan, Michal Kozubek, and Jan Laštovička

Climatologically, the wintertime-evolved stratospheric polar vortex comprises zonal wind, which is westerly. During extreme events like Sudden Stratospheric Warming (SSW), the polar vortex disrupts, showing easterly wind at stratospheric altitudes. Defining extreme events in the stratosphere, like SSW at a definite pressure scale, depends on the region explaining its effects. For instance, the standard definition of SSW is 10 hPa pressure suites primarily for the lower atmosphere. SSW's current definition is unsuitable for the upper atmosphere, especially the ionosphere. So, with this viewpoint, we study the fundamental behaviour of the zonal mean of temperature during the reversal of the zonal mean of zonal wind by using superposed epoch analysis. We use the MERRA2 dataset for this analysis. From MERRA-2, we analyse the zonal mean of temperature and zonal wind from 1980 – 2022 northern hemispheric winters. The analyses are done at 10 hPa, where the standard definition of SSW is defined, and at 1 hPa, 0.5 hPa and 0.1 hPa. Temperature behaviours at different reversal periods are studied at various latitudinal values, starting at 60oN and ending at 90oN. With this analysis, a more general picture of the temperature–wind relation can be understood, which will help to understand and define SSW in a much better way for upper atmospheric studies.

How to cite: Ramatheerthan, S. K., Kozubek, M., and Laštovička, J.: Behaviour Of Temperature During Wintertime Reversal Of Zonal Wind , EGU General Assembly 2024, Vienna, Austria, 14–19 Apr 2024, EGU24-1861, https://doi.org/10.5194/egusphere-egu24-1861, 2024.

EGU24-1897 | ECS | Orals | ST3.3

 Three-dimensional modeling of the O2(1Δ) dayglow  and implications for ozone in the middle atmosphere. 

Mouhamadou Diouf, Franck Lefevre, Alain Hauchecorne, and jean-loup Bertaux

Future space missions dedicated to measuring CO2 on a global scale can make advantageous use of the O2 band at 1.27 µm to retrieve the air column. The 1.27 µm band is close to the CO2 absorption bands at 1.6 and 2.0 µm, which allows a better transfer of the aerosol properties than with the usual O2 band at 0.76 µm. However, the 1.27 µm band is polluted by the spontaneous dayglow of the excited state O2(1Δ), which must be removed from the observed signal.

We investigate here our quantitative understanding of the O2(1Δ) dayglow with a chemistry-transport model. We show that the previously reported -13% deficit in O2(1∆) dayglow calculated with the same model is essentially due a -20 to -30% ozone deficit between 45-60 km. We find that this ozone deficit is due to excessively high temperatures (+15 K) of the meteorological analyses used to drive the model in the mesosphere.

The use of lower analyzed temperatures (ERA5), in better agreement with the observations, slows down the hydrogen-catalyzed and Chapman ozone loss cycles. This effect leads to an almost total elimination of the ozone and O2(1Δ) deficits in the lower mesosphere. Once integrated vertically to simulate a nadir measurement, the deficit in modeled O2(1Δ) brightness is reduced to -4±3%. This illustrates the need for accurate mesospheric temperatures for a priori estimations of the O2(1Δ) brightness in algorithms using the 1.27 µm band.

How to cite: Diouf, M., Lefevre, F., Hauchecorne, A., and Bertaux, J.:  Three-dimensional modeling of the O2(1Δ) dayglow  and implications for ozone in the middle atmosphere., EGU General Assembly 2024, Vienna, Austria, 14–19 Apr 2024, EGU24-1897, https://doi.org/10.5194/egusphere-egu24-1897, 2024.

EGU24-2764 | ECS | Orals | ST3.3

Observed responses of tides and gravity waves in the MLT region to the Madden-Julian Oscillation 

Xu Zhou, Xinan Yue, Libo Liu, Guiwan Chen, Xian Lu, You Yu, and Lianhuan Hu

This work analyzed the intraseasonal variability of non-migrating tides DE3 and gravity wave momentum fluxes (GWMF) in the mesosphere and lower thermosphere (MLT) region and discussed the possible connection with the tropospheric MJO. Based on the joint observations of the TIMED-TIDI satellite and the 120°E meridian meteor radar chain, we revealed a significant broad-band intra-seasonal signal in the DE3 amplitude around the equator with a clear seasonal dependence. The intraseasonal variability of DE3 in zonal winds (DE3-U) has a strong amplitude in boreal winter, up to 1-2 times the seasonal average, while the variability is usually within 20% during other seasons. The response of MLT DE3 tides to the MJO in different seasons was further discussed together with the MJO activity index. The results suggested that the DE3-U in boreal winter generally has a larger amplitude during MJO phases 4–6 (~10%–40%), while the amplitude is smaller for other MJO phases (~−10%–−40%). As for the GWMF estimation, the 12-year continuous observation of the Mohe meteor radar (53.5°N, 122.3°E) was analyzed. The results showed that intraseasonal GWMF variability is also prominent during boreal winter. Composite analysis for DJF season according to MJO phases revealed that the zonal GMWFs notably increased in MJO P4 by ~2–4 m2/s2, and a Monte Carlo test was designed to examine the statistical significance. The response in zonal winds differs from the GMWF response by two MJO phases (i.e., 1/2π). Additionally, time-lagged composites revealed the strengthened westward GWMF occurred ~25–35 days after MJO P4, coincident with the MJO impact on the polar vortex as previous works revealed. Overall, this work emphasized that the tropical sources (MJO) impress the intraseasonal signal from the troposphere to the MLT region, either tropics or extratropics.

How to cite: Zhou, X., Yue, X., Liu, L., Chen, G., Lu, X., Yu, Y., and Hu, L.: Observed responses of tides and gravity waves in the MLT region to the Madden-Julian Oscillation, EGU General Assembly 2024, Vienna, Austria, 14–19 Apr 2024, EGU24-2764, https://doi.org/10.5194/egusphere-egu24-2764, 2024.

EGU24-2910 | ECS | Orals | ST3.3

Quantifying the impact of variable solar forcing on Sudden Stratospheric Warmings (SSWs) 

Monali Borthakur and Miriam Sinnhuber

Sudden stratospheric warmings (SSWs) are characterised by the rise of polar stratospheric temperatures by several tens of kelvins. Here, we investigate the SSW of 2009 using the ECHAM/MESSy (EMAC) chemistry climate model. We study in particular how the SSWs are affected by variable solar forcing: EUV photo-ionisation that dominates the changes during high solar activity and geomagnetic storms. The warmings are preceded by a slowing then reversal of the westerly winds in the stratospheric polar vortex which then becomes easterly and it is also closely associated to polar vortex breakdown. 20 ensemble members are considered and different onset dates of the free running ensembles for the SSW event in January are tested to see the development of the polar vortex and its breakdown in the different ensemble members. Ionisation rates from the AISSTORM model are used in this case. And the results are compared with a geomagnetic storm (consisting of mostly electrons that are in the range of a few kilo-electron volts (keVs) to about 1 MeV) included on the day of the SSW, i.e., 25th of January. For the experiments considered here, the EUV photoionization was doubled and halved, and in both cases an increase in stratospheric temperature compared to the normal EUV was observed. Overall, effects of both EUV photoionization and particles on the temperature, wind fields, NOy and ozone in the middle atmosphere was observed. As ozone is one of the key species in radiative heating and cooling of the stratosphere, changes in its concentration can be linked to dynamical changes in the middle atmosphere.


How to cite: Borthakur, M. and Sinnhuber, M.: Quantifying the impact of variable solar forcing on Sudden Stratospheric Warmings (SSWs), EGU General Assembly 2024, Vienna, Austria, 14–19 Apr 2024, EGU24-2910, https://doi.org/10.5194/egusphere-egu24-2910, 2024.

EGU24-2912 | Orals | ST3.3 | Highlight

WACCM-X simulations with NAVGEM-HA meteorological analyses and SABER observations of mesosphere and lower thermosphere temperature  

Guiping Liu, Jeffrey Klenzing, Sarah McDonald, Fabrizio Sassi, and Douglas Rowland

Realistic modeling of the dynamics and variability in the mesosphere and lower thermosphere (MLT) is significant to understand the coupling of the whole atmosphere system. Here we present the simulations of the MLT temperatures at ~100 km altitude for one year during 2014 by Whole Atmosphere Community Climate Model with thermosphere-ionosphere extension (WACCM-X) constrained below ~90 km using meteorological analysis products of the high-altitude version of Navy Global Environmental Model (NAVGEM-HA). The model results are sampled at the same times and locations as the satellite observations from Thermosphere Ionosphere and Mesosphere Electric Dynamics/Sounding of the Atmosphere using Broadband Emission Radiometry (TIMED/SABER). Comparisons of the daily mean temperatures show that the observed and modeled values are correlated (correlation coefficient equals to ~0.5-0.7) at latitudes away from the equator. Both the observations and simulations reveal an annual variation at mid-latitudes with the temperature maximum in summer and minimum in winter, and at lower latitudes the semiannual variation becomes stronger having the temperature maximums at equinoxes and minimums during solstices. However, the temperatures observed are on average ~5-10 K (3-5%) smaller than the model and the observations show a larger variability across all latitudes between 50oS-50oN. The WACCM-X simulations with constrains by NAVGEM-HA meteorological analyses are overall consistent with the SABER observations though some differences are noticed. Whole atmosphere models with high altitude observation constrains would be useful to improve the numerical simulations of the MLT variability and the atmosphere and ionosphere coupling.

How to cite: Liu, G., Klenzing, J., McDonald, S., Sassi, F., and Rowland, D.: WACCM-X simulations with NAVGEM-HA meteorological analyses and SABER observations of mesosphere and lower thermosphere temperature , EGU General Assembly 2024, Vienna, Austria, 14–19 Apr 2024, EGU24-2912, https://doi.org/10.5194/egusphere-egu24-2912, 2024.

EGU24-3615 | Orals | ST3.3

Drivers for different behaviors in storm-time thermospheric O/N2 ratio and nitric oxide density 

Yongliang Zhang, Wenbin Wang, and Larry Paxton

Geomagnetic storms lead to significant depletion/enhancement in O/N2 column density and enhancement in nitric oxide (NO) in the thermosphere.  The O/N2 depletion is generally anti-correlated with NO enhancement on a global scale. However, the NO enhancement often extends beyond the equatorward edge of O/N2 depletion in latitude and/or the range of O/N2 depletion in longitude on a local scale. These behaviors are most likely driven by the storm-time equatorward wind that brings the O/N2 depleted and NO enhanced air from high to low latitudes, as well as zonal wind perturbations. On the other hand, the equatorward wind also depends on altitudes. Note that the peak NO density locates at an altitude around 110 km while the O/N2 column density is mostly contributed by local O andN2 density around 140 km and above. The different behaviors between NO and O/N2 are likely due to the altitude variations of the meridional winds during storms as revealed by TIEGCM simulations. The downward advection by vertical winds associated with storm-time meridional circulation perturbations may also contribute to the difference.

How to cite: Zhang, Y., Wang, W., and Paxton, L.: Drivers for different behaviors in storm-time thermospheric O/N2 ratio and nitric oxide density, EGU General Assembly 2024, Vienna, Austria, 14–19 Apr 2024, EGU24-3615, https://doi.org/10.5194/egusphere-egu24-3615, 2024.

EGU24-3860 | Orals | ST3.3

Satellite mega-constellations and spacecraft re-entry: Are we harming Earth’s atmosphere? 

Karl-Heinz Glassmeier and Leonard Schulz

Satellite mega-constellations are one of the main reasons for the current exponential growth of space flight. The increasingly large number of objects in orbit has already raised much concern about space debris and requires mitigation strategies. The common strategy for low Earth orbit (LEO) objects is to ensure their re-entry into Earth’s atmosphere, where they ablate and burn up, injecting material into the mesosphere and lower thermosphere. We discuss the significance of this anthropogenic injection compared to the natural one originating from meteoric sources, which provide a constant flow of cosmic dust and larger meteoroids into Earth’s atmosphere. Our comparison indicates that already in 2019 the anthropogenic mass injection has been significant (2.8%) compared to the natural injection. This number will rise in the future due to the ongoing implementation of satellite mega-constellations. More than 5,000 constellation satellites are in orbit right now with more than 100,000 proposed. Considering a worst-case scenario, the injection of metals could increase up to 90% and the aerosol injection up to 94% compared to the natural injection. As the material is mainly injected into mesosphere heights, possible influences on mesospheric and even stratospheric chemistry, with effects on the ozone layer, cloud formation or the climate are thinkable. Recent, first observations already confirmed the existence of spacecraft ablation remnants in stratospheric aerosol particles. This  emphasizes our theoretically conjectured significance of anthropogenic dust injection . However, further studies, including observations and modeling, are urgently required to further elucidate any atmospheric effects. Precautions need to be discussed now in order to protect our atmosphere from yet another human-made influence, that is space waste.

How to cite: Glassmeier, K.-H. and Schulz, L.: Satellite mega-constellations and spacecraft re-entry: Are we harming Earth’s atmosphere?, EGU General Assembly 2024, Vienna, Austria, 14–19 Apr 2024, EGU24-3860, https://doi.org/10.5194/egusphere-egu24-3860, 2024.

EGU24-4681 | Posters on site | ST3.3

Overview of the impact of climate change on the structure and dynamical properties of the stratosphere 

Juan A. Añel, Laura de la Torre, Aleš Kuchař, Rolando García, Marty M. Mlynczak, Celia Pérez Souto, and Petr Šácha

Climate change has a significant impact on the structure and properties of the Earth's atmosphere above the tropopause. The most noticeable effects include a decrease in temperature and density. However, it is difficult to establish trends for this region of the atmosphere, which includes the stratosphere and above. This is mainly due to the need for long-term datasets to ensure that the trends are robust and statistically significant. It is also necessary to consider the impact of solar influence when trying to quantify the role of anthropogenic emissions on various variables' trends.

In this study, we explore all these issues, including the effects of different metrics on quantification and trends such as differences in geopotential levels, temperature, density, and the width of the layers. To achieve this, we use a combination of reanalysis and satellite data. The results take into account global mean values and latitudinal differences. We observe a contraction and cooling of the stratosphere in all layers, but with some variations.

How to cite: Añel, J. A., de la Torre, L., Kuchař, A., García, R., Mlynczak, M. M., Pérez Souto, C., and Šácha, P.: Overview of the impact of climate change on the structure and dynamical properties of the stratosphere, EGU General Assembly 2024, Vienna, Austria, 14–19 Apr 2024, EGU24-4681, https://doi.org/10.5194/egusphere-egu24-4681, 2024.

Time series of mesosphere/lower thermosphere half-hourly winds over Collm (51.3°N, 13.0°E) have been obtained from 1984 – 2008 by low frequency (LF) spaced receiver measurements and from 2004 to date by VHR meteor radar Doppler wind observations in the height range 82 – 97 km.  From half-hourly differences of zonal and meridional winds, gravity wave (GW) proxies have been calculated that describe amplitude variations in the period range 1 – 3 hours. After applying corrections to account for instrumental differences, GW climatology and time series have been obtained. The mean GW activity in the upper mesosphere shows maximum amplitudes in summer, while in the lower thermosphere GWs maximize in winter. Positive/negative long-term trends are visible in winter/summer. Interannual and quasi-decadal variations of GW amplitudes are also visible, but these are intermittent.


How to cite: Jacobi, C., Karami, K., and Kuchar, A.: Long-term trends of mesosphere/lower thermosphere gravity wave proxies derived from combined LF spaced receiver and VHF Doppler wind observations, EGU General Assembly 2024, Vienna, Austria, 14–19 Apr 2024, EGU24-4692, https://doi.org/10.5194/egusphere-egu24-4692, 2024.

EGU24-4991 | Posters on site | ST3.3

Laboratory Studies Relevant to the Coupled OH Meinel and O2 Atmospheric Band Emissions 

Konstantinos Kalogerakis

The hydroxyl radical plays an important role in the photochemistry of the Earth's mesosphere. The OH Meinel band emission dominates the visible and near-infrared portion of the nightglow spectrum. A detailed knowledge of the rate constants and relevant pathways for OH(high v) vibrational relaxation by atomic and molecular oxygen is essential for understanding mesospheric OH emissions and extracting reliable chemical heating rates from atmospheric observations. We have developed laser-based experimental methodologies to study the complex collisional energy transfer processes involving the OH radical and other relevant atmospheric species. Our previous studies have indicated that the total removal rate constant for OH(v = 9) by atomic oxygen at room temperature is more than one order of magnitude larger than that for removal by molecular oxygen. Thus, O atoms are expected to significantly influence the intensity and vibrational distribution extracted from the mesospheric OH(v) Meinel band emissions. This is a progress report on our experimental studies investigating OH(v ≥ 5) + O vibrational relaxation and the implications for mesospheric nightglow.

This work is supported by the NASA Heliophysics Program under Grant 80NSSC23K0694 and the National Science Foundation (NSF) under Grants AGS-2009960 and AGS-2113888.

How to cite: Kalogerakis, K.: Laboratory Studies Relevant to the Coupled OH Meinel and O2 Atmospheric Band Emissions, EGU General Assembly 2024, Vienna, Austria, 14–19 Apr 2024, EGU24-4991, https://doi.org/10.5194/egusphere-egu24-4991, 2024.

For more than 60 years, field strength measurements of the broadcasting station, Allouis (Central France), have been received at Kühlungsborn (54° N, 12° E), Mecklenburg, Northern Germany. Beginning with the year 1959 these so-called indirect phase-height measurements of low frequency radio waves (with a frequency of about 162 kHz) are used to examine trends and the long-term oscillations over Western Europe. The advantages of this method are the low costs and the simplicity of operation. Results of the updated fifth release (R5, 1959-2019) of standard-phase heights (SPH) are presented.

The statistical analysis of the SPH series shows a significant overall trend with a decrease of 116 m per decade indicating a subsidence of the long-radio wave reflection height of about 700 m during R5. As expected the daily time series of SPH shows in its spectrum dominant modes which are typical for the solar cycle, ENSO and for QBO bands, indicating solar and lower atmospheric influences. Solar cycle and ENSO (-QBO)-like band-pass show a growing increase of SPH up to 1987, followed by a decrease afterwards.

For summer months during solar minimum years, without solar influences and without stratopause altitude trend, a thickness temperature trend of the mesosphere is significant with a trend value of -0.47 ± 0.43 K/ decade. The overall cooling of the intrinsic mesospheric temperature during 60 years of observation is in the order of 3 K. 

How to cite: Peters, D. H. W. and Mani, S.: More than 60 years of measurements of Standard-Phase-Heights over Western Europe – Trends and long-term oscillations of the mesosphere, EGU General Assembly 2024, Vienna, Austria, 14–19 Apr 2024, EGU24-5620, https://doi.org/10.5194/egusphere-egu24-5620, 2024.

EGU24-7694 | Posters on site | ST3.3

The nature of mesopause jumps as simulated with the nudged KMCM model 

Urs Schaefer-Rolffs, Christoph Zülicke, and Franz-Josef Lübken

Mesopause jumps are a phenomenon that is only observed in the southern summer MLT region. The mesopause is lifted by several kilometers within a few days and then later returns to its original altitude accompanied by strong cooling. Lidar and radar measurements indicate that these jumps are the result of a late breakdown of the polar jet, which occurs frequently in the southern hemisphere. Although the basic mechanism is known, no successful simulations of such mesopause jumps have yet been performed.

In my talk, I will present a case study using the Kühlungsborn Mechanistic general Circulation Model (KMCM) in which nudging is applied. I will compare measurements of the austral summers 2010/11, 2011/12 and 2012/13 obtained with lidars and radars over the Davis station in Antarctica at 69°S with simulations performed with the KMCM. Mesopause jumps were detected in the first two summers, while no jump occurred in the last summer.

In general, our simulations show that the KMCM with nudging is able to reproduce mesopause jumps. In November and December, the simulations agree quite well with the observations, and we can better understand the role of gravity waves in the mechanism of mesopause jumps. In January and February, however, the simulations seem to be too active, as the agreement with the observations is less good.

How to cite: Schaefer-Rolffs, U., Zülicke, C., and Lübken, F.-J.: The nature of mesopause jumps as simulated with the nudged KMCM model, EGU General Assembly 2024, Vienna, Austria, 14–19 Apr 2024, EGU24-7694, https://doi.org/10.5194/egusphere-egu24-7694, 2024.

EGU24-8574 | Posters on site | ST3.3

The future of nuctilucent clouds 

Franz-Josef Lübken, Gerd Baumgarten, Mykhaylo Grygalashvyly, and Ashique Vellalassery

Noctilucent clouds (NLC) consist of water ice particles which appear in the summer mesopause region at middle and polar latitudes. They owe there existence to extremely low temperatures present in this part of the atmosphere. We have applied the background model LIMA (Leibniz Institute Model
of the Atmosphere) and a microphysical model MIMAS (Mesospheric Ice Microphysics And tranSport model) to study the long term historical development of NLC. More recently, we extended these studies including future climate change predictions by modifying the concentration of carbon dioxide and methane. Carbon dioxide leads to a cooling of nearly the entire middle atmosphere (fostering the conditions for the presence of NLC), whereas methane is nearly completely converted to water vapor in the mesosphere leading to larger and more abundent ice particles, i. e., to brighter and more frequent NLC. In this study we present model simulations of the future development of NLC. We investigate typical NLC parameters, such as mean particle radius, ice number densities, and backscatter coefficients, and their relationship to background conditions (temperature, water vapor). It turns out that ice particle parameters (size, backscatter) are nearly entirely determined by the amount of water vapor, whereas the (geometric) altitude of NLC is mainly given by a shrinking of the atmosphere (due to cooling) below NLC altitudes. The effective transport of water vapor known as `freeze drying' leads to a significant enhancement (nearly doubling) of water vapor at NLC heights within this century.

How to cite: Lübken, F.-J., Baumgarten, G., Grygalashvyly, M., and Vellalassery, A.: The future of nuctilucent clouds, EGU General Assembly 2024, Vienna, Austria, 14–19 Apr 2024, EGU24-8574, https://doi.org/10.5194/egusphere-egu24-8574, 2024.

The chemical composition of Earth's lower thermosphere around an altitude of 180 km remains a largely uncharted territory. This altitude marks a critical transition region, where the atmosphere shifts from being dense and collision-dominated to a regime of free molecular flow. In this region, the altitude profiles of the present chemical species demonstrate their steepest gradients, a phenomenon crucial for understanding the dynamic interplay between the lower thermosphere and the mesosphere. Despite its importance, this region remains poorly explored due to limited in situ observations. Our focus is on the deployment of a highly miniaturized mass spectrometer, specifically designed for a CubeSat platform where it will be accommodated within 1U. This advanced instrumentation is designed to measure in situ all species present in this part of the atmosphere. Thanks to its novel ion source design, it is capable of measuring atoms, molecules, radicals, and isotopes, with exceptional sensitivity, dynamic range, mass range, and mass resolution even at the hyper-velocities of spacecraft during these measurements. The core of our discussion revolves around the expected data quality and performance capabilities of this mass spectrometer, particularly its operation at the perigee in the lower thermosphere. The data obtained from this innovative approach are expected to shed light on the complex dynamics at play in this scarcely studied region. We anticipate that these findings will significantly contribute to the scientific community’s understanding of the lower thermosphere, its coupling with the mesosphere, and the exosphere, filling a crucial gap in our current knowledge and potentially paving the way for future research in both atmospheric science and comparative planetology.

How to cite: Fausch, R. and Wurz, P.: Towards in situ measurements of the chemical composition of Earth’s lower thermosphere, EGU General Assembly 2024, Vienna, Austria, 14–19 Apr 2024, EGU24-8857, https://doi.org/10.5194/egusphere-egu24-8857, 2024.

EGU24-9229 | Posters on site | ST3.3

A novel gravity wave transport parametrization for global chemistry climate models: description and validation  

Wuhu Feng, Maria-Vittoria Guarino, Chester S. Gardner, Bernd Funke, Maya Garcıa-Comas, Manuel Lopez-Puertas, Marcin Kupilas, Daniel R. Marsh, and John M.C. Plane

The gravity wave drag parametrization of the Whole Atmosphere Community Climate Model (WACCM) in the NCAR Community Earth System Model version 2 (CESM2) has been modified to include the wave-driven atmospheric vertical mixing caused by propagating, non-breaking, gravity waves. The strength of this atmospheric mixing is represented in the model via the “effective wave diffusivity” coefficient (Kwave).  Using Kwave, a new total dynamical diffusivity (KDyn) is defined. KDyn represents the vertical mixing of the atmosphere by both breaking (dissipating) and vertically propagating (non-dissipating) gravity waves. Here we show that, when the new diffusivity is used, the downward fluxes of Fe and Na between 80 and 100 km are largely increased. Larger meteoric ablation injection rates of these metals (within a factor 2 of measurements) which were reduced by a factor of 5 in the WACCM, can now be used in the developed WACCM version, which produce Na and Fe layers in good agreement with lidar observations. Mesospheric CO2 is also significantly impacted, with the largest CO2 concentration increase occurring between 80-90 km, where model-observations agreement improves. However, in regions where the model overestimates CO2 concentration, the new parametrization exacerbates the model bias. The mesospheric cooling simulated by the new parametrization, while needed, is currently too strong almost everywhere. The summer mesopause in both hemispheres becomes too cold by about 30K compared to observations, but it shifts upward, partially correcting the WACCM low summer mesopause.

Our results highlight the far-reaching implications and the necessity of representing vertically propagating gravity waves in climate models. This novel method of modelling gravity waves contributes to growing evidence that it is time to move away from dissipative-only gravity wave parametrizations.

How to cite: Feng, W., Guarino, M.-V., Gardner, C. S., Funke, B., Garcıa-Comas, M., Lopez-Puertas, M., Kupilas, M., Marsh, D. R., and Plane, J. M. C.: A novel gravity wave transport parametrization for global chemistry climate models: description and validation , EGU General Assembly 2024, Vienna, Austria, 14–19 Apr 2024, EGU24-9229, https://doi.org/10.5194/egusphere-egu24-9229, 2024.

EGU24-9230 | ECS | Orals | ST3.3

Small-scale waves, big implications: a regionally refined perspective with the Whole Atmosphere Community Climate Model 

Marcin Kupilas, Chester Gardner, Wuhu Feng, Maria Vittoria Guarino, Daniel Marsh, and John Plane

State-of-the-art global chemistry-climate models such as WACCM cannot practically resolve the small-scale gravity waves (GWs) that are important in the mesosphere and lower thermosphere (MLT, ≈ 70-120km). A solution is the use of parametrizations that represent subgrid dissipating GWs (see e.g. Garcia et al., 2007). To reproduce key MLT features such as mesospheric jet reversals, pole-to-pole circulation and the summer mesopause, models rely on such schemes (McLandress, 1997; Holton & Alexander, 2000), though more development is needed. For example, WACCM tends to underestimate observed mesospheric densities of O, O3 and NO, and overestimate observed densities of the Na and Fe layers produced from cosmic dust ablation. Increasing evidence suggests a reason for this is a missing vertical transport from subgrid propagating GWs, and a solution has recently been achieved when these effects were included in the WACCM GW scheme (Guarino et al., 2023). In the current work, we resolve subgrid waves natively using WACCM with Regional Refinement (WACCM-RR). WACCM-RR provides the unprecedented opportunity to model the global climate up to altitudes of 140 km, and resolve individual regions down to as far as 1/32° at a low computational cost compared to global high resolution models. Trends from a model using a 1/8° grid over the Continental US  (1° elsewhere), when compared to a global 1° model, are consistent with comparisons of standard WACCM models, to models using our updated GW scheme. For example, mesospheric densities of O, O3 and CO2 are increased, as predicted. A surprising contrast is a globally warmer atmosphere, likely due to sensitivity of the meridional circulation to GW activity in the refined region. The results point to the applicability of WACCM-RR for detailed investigations of wave-transport processes, and their impact on MLT dynamics and composition. We point out remaining questions and challenges.

How to cite: Kupilas, M., Gardner, C., Feng, W., Guarino, M. V., Marsh, D., and Plane, J.: Small-scale waves, big implications: a regionally refined perspective with the Whole Atmosphere Community Climate Model, EGU General Assembly 2024, Vienna, Austria, 14–19 Apr 2024, EGU24-9230, https://doi.org/10.5194/egusphere-egu24-9230, 2024.

EGU24-9572 | ECS | Posters on site | ST3.3

Global scale gravity wave observations and analysis with the ESA Earth Explorer 11 candidate CAIRT 

Sebastian Rhode, Manfred Ern, Peter Preusse, Jörn Ungermann, Inna Polichtchouk, Kaoru Sato, Shingo Watanabe, Wolfgang Woiwode, and Martin Riese

The ESA Earth Explorer 11 Candidate CAIRT is a prime candidate for reliably observing gravity wave (GW) activity throughout the middle atmosphere up to the MLT region from about 15 km to 90 km altitude. A horizontally panning spectrometer with limb viewing geometry allows for the measurement of 3-dimensional temperature fields with high vertical resolution that can be used to quantify the global GW distributions and spectra as well as individual GW events. The detected horizontal spectrum of GWs would cover scales of about 100 km and above. Here, we show how the temperature retrieved by CAIRT can be utilized for characterizing GW parameters such as wave vector, amplitude, and phase. This wave-based approach allows for a precise estimation of the GW momentum flux (GWMF) and its development and distribution in the middle atmosphere, e.g., during an SSW event. The vertical resolution of the data is high enough for estimating the GW drag, shedding light on the role of GWs during global-scale dynamic phenomena. In addition, we show the applicability of using ray tracing the estimated GWs along the orbit tracks, which provides a means for increased horizontal coverage and better representation of GW drag due to accounting for horizontal propagation of the GWs.

How to cite: Rhode, S., Ern, M., Preusse, P., Ungermann, J., Polichtchouk, I., Sato, K., Watanabe, S., Woiwode, W., and Riese, M.: Global scale gravity wave observations and analysis with the ESA Earth Explorer 11 candidate CAIRT, EGU General Assembly 2024, Vienna, Austria, 14–19 Apr 2024, EGU24-9572, https://doi.org/10.5194/egusphere-egu24-9572, 2024.

EGU24-10171 | Orals | ST3.3

EPP-climate link by reactive nitrogen polar winter descent revisited: MIPAS v8 reprocessing and future benefits by the EE11 candidate mission CAIRT 

Stefan Bender, Bernd Funke, Manuel Lopez Puertas, Maya Garcia-Comas, Gabriele Stiller, Thomas von Clarmann, Michael Höpfner, Björn-Martin Sinnhuber, Miriam Sinnhuber, Quentin Errera, Gabriele Poli, and Jörn Ungermann

Polar winter descent of reactive nitrogen (NOy) produced by energetic particle precipitation (EPP) in the mesosphere and lower thermosphere affects polar stratospheric ozone by catalytic reactions. This, in turn, may have implications for regional climate via radiative and dynamical feedbacks. NOy observations taken by the MIPAS/Envisat instrument during 2002--2012 have provided observational constraints on the solar-activity modulated variability of stratospheric EPP-NOy amounts. These constraints have allowed to formulate a chemical upper boundary condition for climate models in the context of solar forcing recommendations for CMIP6. Recently, a reprocessed MIPAS version 8 dataset has been released. Compared to the previous version, we assess what impact the changes in this new data version have on the EPP-NOy quantification, and on the formulation of chemical upper boundary conditions for climate models.

The Earth Explorer 11 candidate “Changing Atmosphere Infra-Red Tomography” (CAIRT) will observe the altitude region from about 5 km to 115 km with an across-track resolution of 30 to 50 km within a 500 km wide field of view. This instrument will provide NOy and dynamical tracer observations from the upper troposphere to the lower thermosphere with unprecedented spatial resolution. Given that neither MIPAS nor any of the current instruments observes the lower thermosphere at this spatial resolution, we will assess the potential of this mission to advance our understanding of the EPP-climate link in the future.

How to cite: Bender, S., Funke, B., Lopez Puertas, M., Garcia-Comas, M., Stiller, G., von Clarmann, T., Höpfner, M., Sinnhuber, B.-M., Sinnhuber, M., Errera, Q., Poli, G., and Ungermann, J.: EPP-climate link by reactive nitrogen polar winter descent revisited: MIPAS v8 reprocessing and future benefits by the EE11 candidate mission CAIRT, EGU General Assembly 2024, Vienna, Austria, 14–19 Apr 2024, EGU24-10171, https://doi.org/10.5194/egusphere-egu24-10171, 2024.

EGU24-11840 | ECS | Posters on site | ST3.3 | Highlight

Impact of Terrestrial Weather on the MLTI Region as Examined from Satellite Constellations and Model Run 

Sovit Khadka, Federico Gasperini, Jens Oberheide, and Martin Mlynczak

The mesosphere, lower thermosphere, and ionosphere (MLTI) region of the Earth’s atmosphere connects the Sun and the lower atmosphere, displaying various physical and electrodynamical processes. This transition region exhibits intermittent, daily, seasonal, annual, and solar cycle variability and that can be probed in-situ or remotely to gain insights into the impact of solar as well as terrestrial weather. This study presents the response of the MLTI system to the global-scale waves (GSWs) in terms of the spatial and temporal variations of temperature, plasma, and neutral density from the simultaneous observations by the multi-satellite constellations. Comparisons of these with model results can provide an opportunity to monitor evolutions, variations, and coupling of their GSW structures in the MLTI region. The temperature, plasma, and neutral density variations were diagnosed concurrently from the Thermosphere, Ionosphere, Mesosphere, Energetics and Dynamics (TIMED)‐Sounding of the Atmosphere using Broadband Emission Radiometry (SABER), Defense Meteorological Satellite Program (DMSP), Constellation Observing System for Meteorology, Ionosphere and Climate 2 (COSMIC-2) observations, and Swarm-C satellite constellations, respectively, during 2020-2021 for solar minimum and geomagnetic quiet conditions. Additionally, for the first time, we used an updated version of the Climatological Tidal Model of the Thermosphere (CTMT) to analyze the vertical-temporal-latitudinal tidal structures of temperature and density. The updated CTMT uses solar flux dependent Hough Mode Extensions (HMEs), includes a more extensive collection of TIMED Doppler Interferometer (TIDI) data, compiles SABER V2.08, restructures ion drag and dissipation, and provides tidal components for individual years. We extract the wavenumber (WN) patterns along longitudes in the form of temperature, neutral and electron densities from satellites data, assuming a fixed local time. We then examine tidal components from the new version of CTMT to determine modeling evidence for the variation and coupling of the GSWs under similar conditions. Thereby, we compare the reconstructed WN structures from tidal components obtained from the updated CTMT with the evaluated GSW patterns from the satellite-borne dataset. Using satellite observations and new CTMT approaches, we investigate the impact of terrestrial weather and possible factors that trigger variability, interaction, and coupling processes mediated by GSWs to the MLTI system within ±45o latitudes.

How to cite: Khadka, S., Gasperini, F., Oberheide, J., and Mlynczak, M.: Impact of Terrestrial Weather on the MLTI Region as Examined from Satellite Constellations and Model Run, EGU General Assembly 2024, Vienna, Austria, 14–19 Apr 2024, EGU24-11840, https://doi.org/10.5194/egusphere-egu24-11840, 2024.

EGU24-12716 | Posters on site | ST3.3

New Routine for Calculating the non-LTE CO2 15 μm Cooling of Mesosphere and Lower themosphere in GCMs 

Alexander Kutepov and Artem Feofilov

The 15 μm CO2 radiative cooling h has significant impact on the energy budget of mesosphere and lower thermosphere (MLT).  Exact calculations of h are critically important for adequate modeling the pressure and temperature distributions in MLT by General Circulation Models (GCMs). Large errors of current routines calculating h significantly influence pressure and temperature distributions in MLT obtained by GCMs. In this study we analyze the errors of the most widely used parameterization of h by Fomichev et al, (1998) and show, that very large errors this parameterization has for temperature profiles disturbed by waves (up to 25 K/Day at mesopause region) are caused by a very approximate solution of the non-local thermodynamic equilibrium (non-LTE) problem. These errors may not be removed in the framework of the parameterization approach, as the revised version of the Fomichev-98 algorithm presented by Lopez-Puertas et al, (2023), shows (see Kutepov, 2023).

Instead of developing a new parameterization we present (Kutepov and Feofilov, 2023) for the first time the routine for exact calculating the non-LTE h of MLT in GCMs. The routine is an optimized version of the ALI-ARMS (for Accelerated Lambda Iterations for Atmospheric Radiation and Molecular spectra) non-LTE research code (Feofilov and Kutepov, 2012). It delivers h for day and night conditions with an error (for the current CO2 density) not exceeding 1 K/Day even for strong temperature disturbances. The routine uses the ALI and the Opacity Distribution Function (ODF) techniques adopted from the modeling of stellar atmospheres, and is about 1000 faster than the standard matrix/line-by-line non-LTE solution algorithms. It has an interface for feed-backs from the model, is ready for implementation, may use any quenching rate coefficient of the CO22 )+O(3P) reaction, handles large variations of O(3P), and allows the user to vary the number of vibrational levels and bands to find a balance between the calculation speed and accuracy. The routine can handle the broad variation of CO2 both below and above the current volume mixing ratio, up to 4000 ppmv. This allows using this routine for modeling the Earth’s ancient atmospheres and the climate changes caused by increasing CO2. The routine may be downloaded from https://doi.org/10.5281/zenodo.8005028.

Reference

López-Puertas, M., at al. An improved and extended parameterization of the CO2 15 μm cooling in the middle/upper atmosphere,https://doi.org/10.5194/egusphere-2023-2424. Preprint. Discussion started: 6 November 2023, 2023.

Feofilov, A. G. and Kutepov, A. A. Infrared Radiation in the Mesosphere and Lower Thermosphere: Energetic Effects and Remote Sensing, Surveys in Geophysics, 33, 1231–1280, https://doi.org/10.1007/s10712-012-9204-0, 2012.

Fomichev, V. I., et al. Matrix parameterization of the 15 µm CO2 band cooling in the middle and upper atmosphere for variable CO2 concentration, Journal of Geophysical Research: Atmospheres, 103, 11 505–11 528, 475 https://doi.org/10.1029/98jd00799, 1998.

Kutepov, A. A, and Feofilov A. G. New Routine NLTE15μmCool-E v1.0 for Calculating thenon-LTE CO2 15 μm Cooling in GCMs of Earth’s atmosphere, Geophysical Model Development (discussion), https://doi.org/10.5194/gmd-2023-115, 2023.

Kutepov, A. A., 'Comment on “An improved and extended parameterization … by Lopez-Puertas et al, 2023, https://egusphere.copernicus.org/preprints/2023/egusphere-2023-2424/egusphere-2023-2424-CC1-supplement.pdf, 2023.

How to cite: Kutepov, A. and Feofilov, A.: New Routine for Calculating the non-LTE CO2 15 μm Cooling of Mesosphere and Lower themosphere in GCMs, EGU General Assembly 2024, Vienna, Austria, 14–19 Apr 2024, EGU24-12716, https://doi.org/10.5194/egusphere-egu24-12716, 2024.

EGU24-12721 | ECS | Orals | ST3.3 | Highlight

It's Not Easy Being Green: Quantitative Modeling of STEVE's Picket Fence Emissions Driven by Local Parallel Electric Fields 

Claire Gasque, Reza Janalizadeh, Brian Harding, Megan Gillies, and Justin Yonker

The vibrant green streaks of the 'picket fence' typically appear below a STEVE arc in the subauroral sky, at lower latitudes than the auroral oval. Recent studies suggest that, despite its aurora-like appearance, the picket fence may not be driven by magnetospheric particle precipitation but instead by local electric fields parallel to Earth's magnetic field. In this study, we investigate this hypothesis by quantitatively comparing observed picket fence optical spectra with emissions generated in a kinetic model driven by parallel electric fields in a realistic neutral atmosphere. We find that sufficiently large parallel electric fields can reproduce the observed ratio of N2 first positive to oxygen green line emissions, without producing N2+ first negative emissions. We find that, at a typical picket fence altitude of 110 km, parallel electric fields between 40 and 70 Td (~80 to 150 mV/m at 110 km) result in calculated spectral features consistent with observed ones, providing a benchmark for future observational and modeling studies. Additionally, we review studies which have identified similar features to the picket fence in the aurora, suggesting that a similar mechanism may be at work there. Since visible and ultraviolet auroral emissions are increasingly used to infer magnetospheric activity, it is important to better understand and quantify potential sources of emission beyond particle precipitation.

How to cite: Gasque, C., Janalizadeh, R., Harding, B., Gillies, M., and Yonker, J.: It's Not Easy Being Green: Quantitative Modeling of STEVE's Picket Fence Emissions Driven by Local Parallel Electric Fields, EGU General Assembly 2024, Vienna, Austria, 14–19 Apr 2024, EGU24-12721, https://doi.org/10.5194/egusphere-egu24-12721, 2024.

Lightning-ionosphere interactions are well documented in the form of observations of fantastic optical emissions such as sprites and elves.  In order to better understand electromagnetic heating of the lower ionosphere (∼60-100 km altitude), a mesospheric photo-chemistry model is employed to interpret lightning-ionosphere interactions. The LIMA atmospheric chemistry model implements >150 chemical reactions, as do similar atmospheric chemistry models, such as WACCM, but the LIMA model has had success modeling so-called Long Recovery Events. Due to the large number of reactions and chemical species involved, however, it can be difficult to identify specific cause and effect mechanisms for the event of interest. This paper presents a simplified mesospheric chemistry model that accurately reproduces lightning-ionosphere interactions predicted by the full 167-reaction LIMA model (it maintains the accuracy of the full LIMA model for electron density, electron temperature, electrical conductivity, and electromagnetic field intensity as a function of time and space throughout the heating process).

How to cite: Moore, R. and Santos, J.: Lightning-Ionosphere Interactions: An Accurate, Simplified Nighttime Mesospheric Photochemistry Model, EGU General Assembly 2024, Vienna, Austria, 14–19 Apr 2024, EGU24-14619, https://doi.org/10.5194/egusphere-egu24-14619, 2024.

EGU24-15169 | ECS | Orals | ST3.3

Exceptional bright OH airglow night at Cerro Paranal, Chile, with high wave activity and sudden brightness depletion 

Patrick Hannawald, Carsten Schmidt, Sabine Wüst, Alain Smette, and Michael Bittner

The dynamics in the atmosphere, especially the upper mesosphere and mesopause are significantly driven by atmospheric gravity waves. OH airglow offers an unique possibility to observe atmospheric dynamics in this altitude region with a high spatio-temporal resolution simultaneously using imager and spectrometer systems. Especially, characteristics of gravity waves as well as features like wave breaking and wave-wave interaction can be observed. Spectroscopic observations allow observing rotational temperature changes. Thus, both instrument types complement each other very well.

Since November 2022 two airglow imagers (FAIM) and one airglow spectrometer (GRIPS) with high temporal resolution (1 image every 2 seconds, 1 spectrum every 15 seconds) started routine observations during each night in cooperation with and at ESO’s Very Large Telescope (VLT) in the Atacama Desert at Cerro Paranal, Chile (24.6°S, 70.4°W).

During the night from 31st July to 1st August 2023 we observed an exceptional bright night that is much brighter than any other we observed so far: a single wave front propagates from West to East with an observed phase speed of about 60m/s. After the passing of the wave front the OH intensity decreases by around 50% within only one hour. Pronounced wave activity of small-scale waves is observed especially before the passing of the event. Similar events in literature are often stated as “wall events”, but seem to occur very rarely in the extent observed.

We present and interpret the wall event and discuss the observed phenomenon and its causes using data from multiple instruments and data sources.

How to cite: Hannawald, P., Schmidt, C., Wüst, S., Smette, A., and Bittner, M.: Exceptional bright OH airglow night at Cerro Paranal, Chile, with high wave activity and sudden brightness depletion, EGU General Assembly 2024, Vienna, Austria, 14–19 Apr 2024, EGU24-15169, https://doi.org/10.5194/egusphere-egu24-15169, 2024.

EGU24-15654 | Posters on site | ST3.3

Comparison of different stratospheric parameters from reanalysis and satellite data 

Laura de la Torre, Juan A. Añel, Petr Šácha, Aleš Kuchař, Rolando García, and Martin G. Mlynczak

In this study we compare various stratospheric parameters obtained from reanalysis and satellite data. The data from ERA5.1, MERRA2, JRA55, and JRA3Q reanalysis, as well as from the MLS and SABER satellite instruments are used to assess the agreement between reanalysis and satellite data in the stratospheric layer. In particular, the geopotential height of the tropopause and stratopause, as well as the stratospheric thickness, are computed and compared. The results show that the most significant discrepancies are observed in the tropics (30ºS to 30ºN) and the global mean, where negative correlations with satellite data are found. The correlations in the southern hemisphere extratropics are lower than those in the northern hemisphere extratropics. Moreover, the stratospheric thickness, a priori expected to be well-correlated with the stratospheric temperature, not always behaves this way.

How to cite: de la Torre, L., Añel, J. A., Šácha, P., Kuchař, A., García, R., and Mlynczak, M. G.: Comparison of different stratospheric parameters from reanalysis and satellite data, EGU General Assembly 2024, Vienna, Austria, 14–19 Apr 2024, EGU24-15654, https://doi.org/10.5194/egusphere-egu24-15654, 2024.

Atomic oxygen is one of the main species in the mesosphere and lower thermosphere (MLT) of the Earth’s atmosphere. Thus, atomic oxygen and the local temperature plays an important role for the energy balance in the MLT region. By remote sensing of the emission from the atomic oxygen fine-structure transitions at 2.06 THz and the 4.74 THz, atomic oxygen concentration profiles and neutral temperature profiles of the atmosphere can be derived.  By resolving the line profile, heterodyne spectroscopy enables access to layers of the atmosphere for which the oxygen line is saturated. The first spectrally resolved measurements of the 4.74-THz line of atomic oxygen in the atmosphere were performed with the heterodyne spectrometer GREAT on board of the airborne astronomic observatory SOFIA [1]. Based on the experiences from GREAT, the heterodyne spectrometer OSAS-B was developed as a balloon-borne instrument dedicated to the measurement of atomic oxygen in Earth’s atmosphere [2].

In this study, we investigate the feasibility of a satellite-borne heterodyne spectrometer for the retrieval of atomic oxygen concentration and temperature in the MLT. Compared to airborne observations, a satellite instrument has the advantage of a limb observation geometry which facilitates the retrieval. A satellite instrument also has the advantage of a fast and almost global coverage.

For investigating the feasibility of such an instrument, we use the vertical density and temperature profiles provided by the NRLMSIS 2.0 atmosphere model to simulate 2.06 THz and 4.74 THz emission spectra as measured by a satellite. We then apply retrieval algorithms for the atomic oxygen concentration and temperature and compare the retrieved profiles to the reference, i.e. the original NRLMSIS 2.0 profiles. We consider the scenario of a satellite in a circular orbit at an altitude of 500 km and an inclination of 8°. The emission spectra are simulated using radiative transfer under the assumption of local thermodynamic equilibrium.

By considering two separate heterodyne receivers with sensitivity of 11,000 K and 25,000 K noise temperature for the 2.06 THz and 4.74 THz lines, respectively, and data accumulated over 100 seconds of measurement time, corresponding to a ground track of 700 km, we can retrieve a vertical temperature profile from 100 km altitude to 300 km altitude with 5 % relative uncertainties and an atomic oxygen concentration profile from 120 km to 300 km with 5 % relative uncertainties. From 100 km to 120 km the uncertainty in the atomic oxygen concentration is higher and within 25 %.

[1] Richter, H. et al. Commun Earth Environ 2,19 (2021), doi: 10.1038/s43247-020-00084-5

[2] Wienold, M. et al. 48th IRMMW-THz, Montreal, Canada (2023), doi: 10.1109/IRMMW-THz57677.2023.10299165

How to cite: Hansen, P. B., Wienold, M., and Hübers, H.-W.: Feasibility study of a satellite-borne terahertz heterodyne spectrometer for the retrieval of atomic oxygen and temperature in the Earth's atmosphere, EGU General Assembly 2024, Vienna, Austria, 14–19 Apr 2024, EGU24-15735, https://doi.org/10.5194/egusphere-egu24-15735, 2024.

EGU24-16986 | Orals | ST3.3 | Highlight

Gravity Waves and Turbulence indicating multistep vertical coupling near the Polar Vortex Edge 

Gerd Baumgarten, Eframir Franco-Diaz, Jens Fiedler, Michael Gerding, Ralph Latteck, Mohammed Mossad, Toralf Renkwitz, Irina Strelnikova, Boris Strelnikov, and Robin Wing

Throughout the winter, extreme circumpolar wind patterns are found in the altitude range of 30 to 70 km, reaching wind speeds up to 500 km/h. The circumpolar wind patterns form the Stratospheric Polar Vortex. In the Northern Hemisphere, weather extremes are known to be linked to distortions of the Polar Vortex. Recently, studies using observations and modelling have indicated that the extreme winds at the Polar Vortex Edge also play a crucial role in multistep upward coupling through gravity waves. Variations in the wind profiles affect gravity wave propagation and lead to wave generation and breakdown. Direct measurements of the mean winds and waves at the Polar Vortex Edge are rare and technically challenging. We use lidar and radar instruments to measure temperature, wind, and the occurrence of layered phenomena over northern Norway (ALOMAR, 69°N) and northern Germany (Kühlungsborn, 54°N). Using more than 10 years of measurements, we have collected a unique dataset, which contains measurements both inside and outside the Polar Vortex.

These observations are used to explore upward- and downward-propagating gravity waves in the complex dynamical setting near the Polar Vortex Edge. These unique wave-vortex interactions play a role in coupling layers above and below, and link large-scale flow to turbulence, frequently observed as layered phenomena, such as Polar Mesosphere Winter Echoes. The link between waves, turbulence, and the polar vortex will be discussed using observations and model data.


How to cite: Baumgarten, G., Franco-Diaz, E., Fiedler, J., Gerding, M., Latteck, R., Mossad, M., Renkwitz, T., Strelnikova, I., Strelnikov, B., and Wing, R.: Gravity Waves and Turbulence indicating multistep vertical coupling near the Polar Vortex Edge, EGU General Assembly 2024, Vienna, Austria, 14–19 Apr 2024, EGU24-16986, https://doi.org/10.5194/egusphere-egu24-16986, 2024.

The circulation in the Mesosphere / Lower Thermosphere (MLT) region is strongly influenced by atmospheric gravity waves that propagate upward from the lower atmosphere. So far, most global models of the MLT have to parameterize gravity waves, given horizontal model resolution on the order of 100 km. It becomes increasingly clear that the simplified approximations of gravity wave parameterizations, including their inability to simulate gravity wave generation within the middle atmosphere, are a cause for biases in the simulation of MLT circulation, holding back scientific progress in understanding, predicting and projecting MLT circulation.

In this study, the extended German Weather and Climate model UA-ICON is used to demonstrate the effects of moving from a coarse model resolution to a gravity-wave permitting resolution on the simulation of the mean state of the MLT and its predictability. An episode of austral winter to spring is simulated with two UA-ICON set-ups, one with about 160 km horizontal grid spacing and 120 vertical levels from the ground to 150 km height (“coarse resolution”), and one with about 20 km horizontal grid spacing and 250 vertical levels (“high resolution”). The high-resolution set-up is able to resolve gravity waves with horizontal wave length up to about 200 km. Resolving gravity waves is essential to simulate the mean state of MLT circulation in austral winter: while in the coarse resolution model, zonal mean winds around 100 km height are easterly, the high-resolution model version simulates westerlies in this region, in agreement with observations. It is shown that wave forcing by resolved waves with horizontal scales below 2000 km, which are only resolved in the high-resolution model version, impose an eastward force on the zonal mean winds, and thus are essential to maintain the westerly winds. Next to the mean state, the two model set-ups are utilized to demonstrate the effects of resolving gravity waves on estimations of the intrinsic predictability of the MLT region: experiments with imposed small perturbations in the initial conditions show that error growth in the MLT region is substantially faster in the high-resolution simulation with resolved gravity waves compared to the coarse resolution simulation. Thus, the intrinsic predictability time-scale, after which the MLT becomes intrinsically unpredictable, is vastly overestimated by a factor of 3-4 in simulations that do not resolve gravity waves. Overall, this work stresses the importance of exploring high-resolution simulations of the MLT in order to make progress on our understanding of MLT dynamics.

How to cite: Garny, H.: Predictability and mean state of the MLT: Importance of resolving gravity waves, EGU General Assembly 2024, Vienna, Austria, 14–19 Apr 2024, EGU24-17136, https://doi.org/10.5194/egusphere-egu24-17136, 2024.

EGU24-20214 | Orals | ST3.3 | Highlight

The Changing-Atmosphere Infra-Red Tomography Explorer (CAIRT) Earth Explorer 11 candidate mission 

Bernd Funke, Martyn Chipperfield, Quentin Errera, Felix Friedl-Vallon, Sophie Godin-Beekmann, Michael Hoepfner, Alex Hoffmann, Alizee Malavart, Scott Osprey, Inna Polichtchouk, Peter Preusse, Piera Raspollini, Björn-Martin Sinnhuber, Pekka Verronen, and Kaley Walker

The Changing-Atmosphere Infra-Red Tomography Explorer (CAIRT) is currently in Phase A as one of two final candidates for ESA’s Earth Explorer 11. As a Fourier transform infrared limb imager, CAIRT will observe simultaneously from the middle troposphere to the lower thermosphere at high spectral resolution and with unprecedented horizontal and vertical resolution. With this, CAIRT will provide critical information on (a) atmospheric gravity waves, circulation and mixing, (b) coupling with the upper atmosphere, solar variability and space weather and, (c) aerosols and pollutants in the upper troposphere and  lower stratosphere. In this presentation we will give an overview of CAIRT’s science goals and the expected mission performance, based on latest results from feasibility studies performed during Phase 0. 

How to cite: Funke, B., Chipperfield, M., Errera, Q., Friedl-Vallon, F., Godin-Beekmann, S., Hoepfner, M., Hoffmann, A., Malavart, A., Osprey, S., Polichtchouk, I., Preusse, P., Raspollini, P., Sinnhuber, B.-M., Verronen, P., and Walker, K.: The Changing-Atmosphere Infra-Red Tomography Explorer (CAIRT) Earth Explorer 11 candidate mission, EGU General Assembly 2024, Vienna, Austria, 14–19 Apr 2024, EGU24-20214, https://doi.org/10.5194/egusphere-egu24-20214, 2024.

EGU24-21520 | Orals | ST3.3 | Highlight

Long-term changes in gravity wave activity in the middle atmosphere from satellite and ground-based observations 

Neil Hindley, Lars Hoffmann, Tracy Moffat-Griffin, Phoebe Noble, and Corwin Wright
Atmospheric gravity waves (GWs) are one of the most important drivers of the circulation of the middle and upper atmosphere. Usually generated in the lower atmosphere and propagating upwards through the atmospheric layers, the aggregated forcing of these waves drives circulations in the middle atmosphere that are far from that expected under radiative equilibrium. Circulations in the mesosphere and lower thermosphere (MLT) and above, especially in polar regions, have shown extreme sensitivity to GW parameterisations in recent high-top modelling simulations and can exhibit significant and limiting biases compared to observations. This uncertainty in the role of GW dynamics between models has made predictions of how these high-altitude circulations are expected to respond to a changing climate very challenging. This is confounded by a relative scarcity of global observations of GW activity in the middle and upper atmosphere with which to understand these connections over climate timescales. Since the early 2000s, satellite and ground-based instrumentation has provided an unprecedented observational view of middle atmospheric dynamics and composition, especially for the study of GWs. However, due to different instrument capabilities and limited hardware lifetimes, examining long term trends of GW properties observationally has been challenging due to the need to re-establish baselines. Here we examine results from some of the longest known single-instrument records of GW activity in the middle and upper atmosphere spanning more than two decades. We explore changes in GW amplitudes, wavelengths and directional momentum flux in the stratosphere from a 22-year climatology derived from global 3-D satellite observations from the AIRS/Aqua, the longest single-instrument climatology of this type. We also explore changes in wind, temperature and large-scale GW activity in the polar MLT from nearly 20 years of single-station meteor wind radar observations in the Arctic and Antarctic. We compare these trends to equivalent analysis of other long-term satellite GW datasets and resolved GW activity in ERA5 stratospheric reanalysis. Finally, we discuss limitations and best practise for considering observed trends in GW observations, such as how changes in circulation can affect GW propagation and their apparent sensitivity to satellite remote sensing techniques.

How to cite: Hindley, N., Hoffmann, L., Moffat-Griffin, T., Noble, P., and Wright, C.: Long-term changes in gravity wave activity in the middle atmosphere from satellite and ground-based observations, EGU General Assembly 2024, Vienna, Austria, 14–19 Apr 2024, EGU24-21520, https://doi.org/10.5194/egusphere-egu24-21520, 2024.

EGU24-21525 | ECS | Posters on site | ST3.3

Advective transport between the stratosphere and mesosphere 

Radek Zajíček, Petr Šácha, Petr Pišoft, and Jiří Mikšovský

The Brewer-Dobson circulation (BDC) characterizes the large-scale meridional overturning mass circulation influencing the composition of the whole middle atmosphere. The BDC consists of two separate parts - a shallow branch in the lower stratosphere and a deep branch higher in the middle atmosphere. The BDC is analytically usually defined as consisting of a diffusive part and an advective residual mean. Climate model simulations robustly show that the advective BDC part accelerates due to greenhouse gas-induced climate change and this acceleration strongly influences middle atmospheric chemistry and physics in climate model projections. A prominent quantity that is being studied as a proxy for advective BDC changes is the net tropical upwellling, commonly at the tropopause level or in the lower stratosphere. The upper branch of the BDC received considerably less research attention than its shallow part, although it features important atmospheric mechanisms. It couples the stratosphere and mesosphere and is responsible for a large portion of interhemispheric transport in the middle atmosphere. Aiming to fill this gap, we present a multi-model study of climatology and trends in advective mass transport across the vertically shifting stratopause. Results based on ensembles of 7 CCMI models include decomposition of long-term changes in cross-stratopause transport into individual terms such as acceleration of the residual circulation itself, vertical shift of the stratopause, changes in width of the upwelling region and changes in the shape of the stratopause.

How to cite: Zajíček, R., Šácha, P., Pišoft, P., and Mikšovský, J.: Advective transport between the stratosphere and mesosphere, EGU General Assembly 2024, Vienna, Austria, 14–19 Apr 2024, EGU24-21525, https://doi.org/10.5194/egusphere-egu24-21525, 2024.

EGU24-303 | ECS | Posters on site | AS3.18

Near-surface meteorology changes driven by aerosol effects during the April 2020 wildfires in the Chornobyl Exclusion Zone, Ukraine 

Mykhailo Savenets, Alexander Mahura, Roman Nuterman, and Tuukka Petäjä

Wildfires, while disastrous for ecosystems, also contribute significantly to pollution impacting human health. They also affect meteorological conditions at both local and regional scales by emitting aerosols into the atmosphere, which have both direct and indirect effects. In Ukraine, forest fires are common in the spring, coinciding with the season of agricultural open burning.

The wildfire episode in April 2020 was among the most severe and especially difficult to extinguish because of its origin and spreading in the abandoned Chornobyl Exclusion Zone (CEZ). Applying the seamless online-integrated Enviro-HIRLAM modeling system, we aimed to study aerosol contamination and how its elevated levels affected regional near-surface meteorology. To achieve this, the model was run in 4 modes: reference (REF) run and runs to simulate direct (DAE), indirect (IDAE) and combined (COMB) aerosol effects. These runs were performed at 15 km horizontal resolution (covering large European territory to consider atmospheric circulation) with downscaling to 5 (focusing on Ukraine) and 2 km (focusing on the CEZ).

Elevated black and organic carbon content accounted for 80% of all aerosol species with the prevailing mass concentration in the accumulation mode in the CEZ. The observed meteorology, driven by aerosol effects, was more intensified in these synoptic conditions, and especially at the edges of the fronts. When aerosol effects were included, the wind speed changed up to ±4 m/s and caused spatial shifts in patterns of cloudiness and precipitation. Moreover, verification showed better results for modelling with IDAE, whereas DAE effects can overestimate changes in near-surface meteorology. This aerosol composition led to noticeable cooling and drying effects. The 2-m air temperature decreased by 3℃ and a specific humidity dropped by 1 g/kg at a local scale. However, these effects varied with atmospheric conditions. In particular, when fronts, especially cold fronts, passed through the CEZ, stronger changes in meteorological parameters were observed as expected. As presence of aerosols influences a humidity regime in the boundary layer (including formation and development of cloudiness and precipitation), the spatial positioning of modeled fronts may be shifted leading to changes of opposite signs.

This study was supported by the grant of HPC-Europa3 Transnational Access Programme for projects “Integrated modelling for assessment of potential pollution regional atmospheric transport as result of accidental wildfires” (IMA-WFires, HPC17TRLGW) & “Research and development for integrated meteorology – atmospheric composition multi-scales and – processes modelling” (Enviro-PEEX(Plus) on ECMWF; SPFIMAHU-2021). The CSC – IT Center for Science Computing (Finland) is acknowledged for computational resources.

How to cite: Savenets, M., Mahura, A., Nuterman, R., and Petäjä, T.: Near-surface meteorology changes driven by aerosol effects during the April 2020 wildfires in the Chornobyl Exclusion Zone, Ukraine, EGU General Assembly 2024, Vienna, Austria, 14–19 Apr 2024, EGU24-303, https://doi.org/10.5194/egusphere-egu24-303, 2024.

This study examines the impact of aerosol-radiation interation on subseasonal prediction using the Unified Forecast System (UFS) coupled to an ocean and an aerosol component. The aerosol component is from the current NOAA operational GEFS-Aerosols model, which includes the GOCART aerosol modules, simulating sulfate, dust, black carbon, organic carbon, and sea-salt aerosols. The modeled aerosol optical depth (AOD) is compared to reanalysis from Modern-Era Retrospective analysis for Research and Applications, Version 2 (MERRA2) and observations from Moderate Resolution Imaging Spectro-radiometer (MODIS) satellite. Despite AOD bias primarily in dust and sea salt, good AOD agreement is achieved. The simulated radiative forcing (RF) from the total aerosol at the top of the atmosphere is approximately -2.5 W/m2 or -16 W/m2 per unit AOD globally. This is consistent with previous studies.

In parallel simulations, the dynamic prognostic aerosols are replaced with modeled climatological aerosol concentrations in the UFS. While regional differences in RF are noticeable in some special events between these twin experiments, the resulting RF, surface temperature, precipitation and geopotential height at 500 hPa, show similarity over multi-years in subseasonal applications. This suggests that replacing the costly chemistry module with the modeled aerosol concentration climatology is a possible alternative in the subseasonal applications.

How to cite: Sun, S., Grell, G., Zhang, L., Henderson, J., and Li, H.: Simulating aerosol-radiation effect on subseasonal prediction in a coupled Unified Forecast System and CCPP-Chem: prescribed aerosol climatology versus dynamic aerosol model, EGU General Assembly 2024, Vienna, Austria, 14–19 Apr 2024, EGU24-4896, https://doi.org/10.5194/egusphere-egu24-4896, 2024.

EGU24-6827 | Posters on site | AS3.18 | Highlight

Predicting Fire Aerosols and their Impact on Subseasonal to Seasonal Weather Forecasts in NOAA’s Global Aerosol Forecast Systems 

Li Zhang, Georg Grell, Partha Bhattacharjee, Shan Sun, Anders Jensen, Jordan Schnell, Haiqin Li, Yunyao Li, Barry Baker, Judy Henderson, Ravan Ahmadov, Ligia Bernardet, Daniel Tong, Ziheng Sun, Li Pan, Bing Fu, Raffaele Montuoro, Jian He, Rebecca Schwantes, and Siyuan Wang and the NOAA team

Recognizing the uncertainties associated with fire emission, a crucial factor influencing the fire aerosol prediction, we have initiated studies to improve fire emission for subseasonal to seasonal (S2S) forecasts. Two global aerosol/chemistry forecast models are currently under development and have been fully coupled with the Unified Forecast System (UFS), encompassing ocean, sea ice, wave and land surface components for S2S forecasts at NOAA. One is UFS-Aerosols: the second-generation UFS coupled aerosol system, which embeds NASA’s 2nd-generation GOCART model in a National Unified Operational Prediction Capability (NUOPC) infrastructure, has been collaboratively developed by NOAA and NASA since 2021. It is planned to be implemented into the Global Ensemble Forecast System (GEFS) v13.0 for ensemble prototype 5 (EP5) experiments early this year. The other one is UFS-Chem: an innovative community model of chemistry online coupled with UFS, developed collaboratively between NOAA Oceanic and Atmospheric Research (OAR) laboratories and NCAR. The aerosol component implemented into UFS-Chem is based on the current operational GEFS-Aerosols v12.3 and utilizes the Common Community Physics Package (CCPP) infrastructure with updates to wet deposition, dust and fire emission, etc. Both these two global aerosols forecast models include the direct and semi-direct radiative feedback from online aerosols prediction. Various global fire emission data, as well as their ensemble product, are employed to quantify the uncertainties associated with fire aerosol prediction. The capabilities of UFS-Aerosols and UFS-Chem in medium-range and S2S predictions of fire aerosol are assessed and compared using observations from reanalysis data, ground-based measurements, and satellite data. Additionally, preliminary blending and machine learning methods have been developed to predict fire emission and improve the S2S prediction. 

How to cite: Zhang, L., Grell, G., Bhattacharjee, P., Sun, S., Jensen, A., Schnell, J., Li, H., Li, Y., Baker, B., Henderson, J., Ahmadov, R., Bernardet, L., Tong, D., Sun, Z., Pan, L., Fu, B., Montuoro, R., He, J., Schwantes, R., and Wang, S. and the NOAA team: Predicting Fire Aerosols and their Impact on Subseasonal to Seasonal Weather Forecasts in NOAA’s Global Aerosol Forecast Systems, EGU General Assembly 2024, Vienna, Austria, 14–19 Apr 2024, EGU24-6827, https://doi.org/10.5194/egusphere-egu24-6827, 2024.

EGU24-6971 | Orals | AS3.18

The Impacts of Aerosol-physics Interactions on Numerical Weather Prediction in NOAA’s  Global Unified Forecast System (UFS) 

Haiqin Li, Georg Grell, Saulo Freitas, Li Zhang, and Ravan Ahmadov

A physics suite, which includes the aerosol-aware double moment Thompson-Eidhammer microphysics scheme (TH-E MP), the scale-aware and aerosol-aware Community Convective Cloud (C3) parameterization, and the MYNN-EDMF boundary layer and shallow cloud scheme, is under development at NOAA. We recently implemented a simple approach to improve the aerosol representation in the UFS. Sea salt, dust, biomass burning, and anthropogenic aerosol emissions have been embedded as CCPP-compliant subroutines. The prognostic emissions of sea-salt, and organic carbon are combined to represent the “water friendly” aerosol emission, while the prognostic emissions of dust are used to represent “ice friendly” aerosol emission for TH-E MP. With this implementation, we previously examined the aerosol indirect feedback when using the TH-E scheme in the global UFS forecast with C768 (~13km) horizontal resolution and 127 vertical levels. There are significant cloud-radiation responses to the aerosol differences, and the severely positive precipitation bias over Europe and North America was significantly alleviated when applying this aerosol emission method for indirect feedback. Here we add the indirect feedback using the C3 convective parameterization. C3 is a new collaborative development which adds several features from the currently operational SAS scheme to the Grell-Freitas parameterization. This study indicates that aerosol-physics interactions using a very simple and computationally highly efficient approach have significant impacts on the numerical weather prediction in the global UFS applications.

How to cite: Li, H., Grell, G., Freitas, S., Zhang, L., and Ahmadov, R.: The Impacts of Aerosol-physics Interactions on Numerical Weather Prediction in NOAA’s  Global Unified Forecast System (UFS), EGU General Assembly 2024, Vienna, Austria, 14–19 Apr 2024, EGU24-6971, https://doi.org/10.5194/egusphere-egu24-6971, 2024.

EGU24-8447 | Posters on site | AS3.18 | Highlight

Evaluation of the Copernicus Atmosphere Monitoring Service Cy48R1 upgrade of June 2023 

Henk Eskes and Thanos Tsikerdekis and the CAMS global developers and validation team

The Copernicus Atmosphere Monitoring Service (CAMS) is providing daily analyses and forecasts of the composition of the atmosphere, including the reactive gases such as ozone, CO, NO2, HCHO, SO2, aerosol species and greenhouse gases. The global CAMS analysis system (IFS-COMPO) is based on the ECMWF Integrated Forecast System (IFS) for numerical weather prediction (NWP), and assimilates a large number of composition satellite products on top of the meteorological observations ingested in IFS. 

The global CAMS system is regularly upgraded, and the upgrades are simultaneous with the upgrades of NWP-IFS. The upgrade to Cy48R1, operational since 27 June 2023, introduced a large number of code changes and improvements, both for COMPO and for NWP. The COMPO innovations include the introduction of full stratospheric chemistry, a major update of the emissions, of the aerosol model, including the representation of secondary organic aerosol, several updates of the dust life cycle and optics, and inorganic chemistry in the troposphere. Concering data assimilation, the assimilation of VIIRS AOD and TROPOMI CO were implemented in 2023. 

The CAMS Cy48R1 upgrade was evaluated using a large number of independent measurement datasets, including surface in situ, surface remote sensing, routine aircraft and balloon and satellite observations. In our contribution we present the validation results for Cy48R1. The new cycle is compared with the previous operational system (Cy47R3), with the independent observations as reference. Results are provided for the period October 2022 to June 2023 for which daily forecasts from both cycles are available. 

Major improvements in skill are found for the ozone profile in the lower-middle stratosphere and for stratospheric NO2 due to the inclusion of full stratospheric chemistry. Stratospheric trace gases compare well with ACE-FTS observations between 10-200 hPa, with larger deviations between 1-10 hPa. The impact of the updated emissions is especially visible over East Asia and is beneficial for the trace gases O3, NO2, and SO2. The CO column assimilation is now anchored by IASI instead of MOPITT which is beneficial for most of the CO comparisons, and the assimilation of TROPOMI CO data improves the model CO field in the troposphere. In general the aerosol optical depth has improved globally, but the dust evaluation shows more mixed results. 

In summary, 83% of the evaluation datasets show a neutral or improved performance of Cy48R1 compared to the previous operational CAMS system, while 17% indicate a (slight) degradation, which shows the overall success of this upgrade. 

This presentation summarises the results achieved by a large consortium of scientists working on CAMS, including the ECMWF staff, the developers of the global CAMS modelling system, the data assimilation team at ECMWF, and the CAMS validation teams. We acknowledge their contributions to this work.

How to cite: Eskes, H. and Tsikerdekis, T. and the CAMS global developers and validation team: Evaluation of the Copernicus Atmosphere Monitoring Service Cy48R1 upgrade of June 2023, EGU General Assembly 2024, Vienna, Austria, 14–19 Apr 2024, EGU24-8447, https://doi.org/10.5194/egusphere-egu24-8447, 2024.

EGU24-9296 | Orals | AS3.18

Satellite data assimilation at regional scale using the Chimere model 

Gaël Descombes, Augustin Colette, and Anthony Ung

The quantity and accuracy of satellite data is constantly growing up for air quality monitoring. They are already widely used to perform better forecast and analysis for global modeling. Even if, high resolution modeling at regional scale has been relying on surface observation for a long time, we will focus on data assimilation over Europe looking especially for satellite data assimilation.In this study, the Chemistry model transport CHIMERE is associated to the Data Assimilation Research Testbed (DART from the National Center Atmospheric Research) to simulate recent events of pollution using for the Sentinel 5P data. Preliminary results coming from the CAMs EvOlution (CAMEO) project will be presented for the Sentinel 5P data. Special emphasis will be made on the regional set-up of the Adjustment Ensemble Kalman Filter (AEKF) ensemble data assimilation system used and future developments

How to cite: Descombes, G., Colette, A., and Ung, A.: Satellite data assimilation at regional scale using the Chimere model, EGU General Assembly 2024, Vienna, Austria, 14–19 Apr 2024, EGU24-9296, https://doi.org/10.5194/egusphere-egu24-9296, 2024.

EGU24-10683 | Orals | AS3.18

An online parameterization of biogenic VOC emission fluxes in the Integrated Forecasting System for atmospheric composition 

Vincent Huijnen, Katerina Sindelarova, Miró van der Worp, Jason Williams, and Samuel Rémy


Biogenic volatile organic compounds (BVOCs) are important contributors to atmospheric chemistry and act as precursors of secondary organic aerosol, formaldehyde (HCHO) and carbon monoxide. In presence of high NOx the emitted isoprene may also contribute significantly to the production of tropospheric ozone. As such, having a good handle on BVOC emissions is important for global air quality analyses and forecasts, as produced operationally as part of the Copernicus Atmosphere Monitoring Service (CAMS). Currently, analyses and forecasts as generated using ECMWF’s Integrated Forecasting System for atmospheric composition (IFS-COMPO), use offline monthly datasets for biogenic emissions based on CAMS-GLOB-BIO. However, this approach lacks the ability to capture the daily variability in biogenic VOC emissions, while also the near-real time forecasts have to rely on climatological emissions.

This has motivated the implementation of an online parameterization for the description of BVOC emissions based on the MEGAN scheme, as part of the ECLand module. Having the BVOC emissions as an integral part of the IFS allows the use of the latest parameterization of soil and vegetation properties, together with accurate description of meteorological quantities, which are both important drivers with respect to biogenic emissions. Also, the resulting emissions can be directly used in the atmospheric chemistry module, which has recently been updated with respect to isoprene chemistry. This also enables an indirect evaluation of the emissions using TROPOMI observations of HCHO.

In this contribution we present the current status of the implementation of the online biogenic VOC emissions module into the IFS and provide a first assessment by comparing these emissions to a reference CAMS-GLOB-BIO dataset. Also we evaluate the resulting isoprene emissions in terms of HCHO columns using TROPOMI retrievals, along with its impact on surface ozone and secondary organic aerosol. We highlight uncertainties in different aspects along the parameterization and evaluation chain.


How to cite: Huijnen, V., Sindelarova, K., van der Worp, M., Williams, J., and Rémy, S.: An online parameterization of biogenic VOC emission fluxes in the Integrated Forecasting System for atmospheric composition, EGU General Assembly 2024, Vienna, Austria, 14–19 Apr 2024, EGU24-10683, https://doi.org/10.5194/egusphere-egu24-10683, 2024.

EGU24-11188 | ECS | Posters on site | AS3.18

Optimization of the calculation of the photodissociation rates in the stratosphere in the BASCOE module of the IFS-COMPO 

Daniele Minganti, Simon Chabrillat, Christine Bingen, Vincent Huijnen, Samuel Remy, Swen Metzger, Jason Williams, and Johannes Flemming

The Integrated Forecasting System (IFS-COMPO) at ECMWF is the global model used by the Copernicus Atmosphere Monitoring Service (CAMS) to provide forecasts and analyses of atmospheric composition, including greenhouse gases, aerosols and reactive gases. Within CAMS, the default configuration of IFS-COMPO relies on the CB05 chemistry scheme for the troposphere and the Belgian Assimilation System for Chemical ObsErvations (BASCOE) module for the stratospheric chemistry.

Currently, the photodissociation rates (Js) in IFS-COMPO can be computed with two methods: Joffline (computationally efficient but inaccurate) and Jonline (more accurate but computationally very expensive). In this work, we implement and evaluate an optimized method for the calculations of the Js in the stratosphere that is as accurate as Jonline and as computationally efficient as Joffline. This method (Jvint) computes the Js using Jonline but on a coarser stratospheric vertical grid (L23) compared to the native vertical grid and will be available in the future cycle 49R1.

We compare three IFS-COMPO simulations using the Jvint, Jonline and Joffline methods with the BASCOE Reanalysis of Aura MLS version 3 (BRAM3) for ozone and with observations from the TROPOspheric Monitoring Instrument (TROPOMI) for nitrous dioxide (NO2). For ozone, the Jvint method significantly reduces the bias with respect to BRAM3 compared to the Joffline method in the upper stratosphere. In the mid-lower stratosphere, however, the Jvint configuration delivers slightly larger bias with respect to BRAM3 when compared to the Joffline method, especially over the Arctic. This bias is consistent with the results from the Jonline method and with the bias reduction in the upper stratosphere. For NO2, the Jvint method also reduces the bias with respect to TROPOMI stratospheric columns compared to the Joffline method at all latitudes.


Concerning the computational cost, it increases in the Jvint method compared to the Joffline method by 5% in December, 16% in July and 12% in November, while the Jonline method is two to three times as computationally expensive compared to Joffline. In addition, the Jvint method improves the seasonal variations of the ozone and NO2 columns compared to the Joffline method, and the differences between the Jvint and Jonline methods are insignificant for most of the stratospheric regions.

We demonstrate the capability of the Jvint method to deliver improved stratospheric columns for ozone and NO2 compared to the Joffline method and significantly reduce the computational cost compared to the Jonline method. The Jvint configuration also includes the time-dependence of the solar flux, ensuring a physically consistent representation of the stratospheric photochemistry.

How to cite: Minganti, D., Chabrillat, S., Bingen, C., Huijnen, V., Remy, S., Metzger, S., Williams, J., and Flemming, J.: Optimization of the calculation of the photodissociation rates in the stratosphere in the BASCOE module of the IFS-COMPO, EGU General Assembly 2024, Vienna, Austria, 14–19 Apr 2024, EGU24-11188, https://doi.org/10.5194/egusphere-egu24-11188, 2024.

EGU24-11437 | Posters on site | AS3.18

The impact of AOD assimilation on surface PM analysis and forecast with the global CAMS system.  

Johannes Flemming, Melanie Ades, Enza Di Tomaso, Antje Inness, Vincent Huijnen, Luke Jones, Zoi Paschalidi, Miha Razinger, and Samuel Remy

Surface air pollution is a major hazard for society because of its negative impact on human health, crops yield and on other aspects of the economy. Monitoring the air quality with in-situ instruments is routinely carried out in many countries. These air quality networks have limited coverage. They  are often very sparse or are not even present in many parts of the world, that suffer from the worst air quality.  Satellite observations of atmospheric composition provide the unique prospect to contribute to a more spatially complete monitoring of surface air pollution. However, among several other limitations, only vertically integrated measures of the pollution concentration can usually be retrieved from satellites, and not the surface concentration.  The relation between total column information and surface concentrations depends on the shape of the vertical profile. The correlation may be especially poor in the case of lofted air pollution plumes originating from long range transport.   

Data driven methods (machine learning, statistic etc.) are used to infer surface concentrations from satellite observations based on in-situ surface observations. An alternative approach is data assimilation of satellite retrievals in an atmospheric model, a method which has been developed for numerical weather forecasting.  The global forecasting system of atmospheric composition of the Copernicus Atmosphere Monitoring Service (CAMS) applies 4D-VAR data assimilation to satellite retrievals of Aerosol optical depth (AOD), Ozone, Carbon Monoxide and Nitrogen Dioxide (NO2) to correct the model initial conditions and consequently also the PM2.5 and PM10 surface concentrations.  In our presentation, we will give an overview of the usefulness of atmospheric composition (AC) satellite data assimilation for monitoring of surface air quality with the global CAMS system. We will specifically show to what extent AOD assimilation improves the analysis and forecast of surface PM2.5 for different regions and at different temporal and spatial scales. In particular we will discuss the correlation between AOD and PM2.5 in the observations and in the model. We will also discuss the influence of the model performance and aspects of the data assimilation procedure on the impact of AC satellite data assimilation on surface concentrations.

How to cite: Flemming, J., Ades, M., Di Tomaso, E., Inness, A., Huijnen, V., Jones, L., Paschalidi, Z., Razinger, M., and Remy, S.: The impact of AOD assimilation on surface PM analysis and forecast with the global CAMS system. , EGU General Assembly 2024, Vienna, Austria, 14–19 Apr 2024, EGU24-11437, https://doi.org/10.5194/egusphere-egu24-11437, 2024.

EGU24-12250 | Posters on site | AS3.18

Improved representation of aerosol acidity in the ECMWF IFS-COMPO 49R1 through the integration of EQSAM4Clim. 

Samuel Remy, Swen Metzger, Vincent Huijnen, Jason Williams, and Johannes Flemming

The atmospheric composition forecasting system used to produce the CAMS forecasts of global aerosol and trace gases distributions, IFS-COMPO, undergoes periodic upgrades. In this presentation we describe the development of the future operational cycle 49R1, and focus on the implementation of the thermodynamical model EQSAM4Clim version 12 for describing gas-aerosol partitioning processes for nitrate and ammonium and for providing diagnostic aerosol, cloud and precipitation pH values at global scale. This information on aerosol acidity influences tropospheric chemistry processes associated with aqueous phase chemistry and wet deposition. The other updates to cycle 49R1 include modifications to the description of Desert Dust, Sea-salt aerosols, Carbonaceous aerosols and the size description for the calculation of aerosol optics.


The implementation of EQSAM4Clim significantly improves the partitioning of reactive nitrogen compounds decreasing surface concentrations of both nitrate and ammonium, which reduces PM2.5 biases for Europe, U.S. and China, especially during summertime. For aerosol optical depth there is generally a decrease in the simulated biases for wintertime, and for some regions an increase in the bias for summertime. Improvements in the simulated Ångström exponent is noted for almost all regions, resulting in generally a good agreement with observations.


 The diagnostic aerosol and precipitation pH calculated by EQSAM4Clim have been compared against results from previous simulations (for aerosol pH) and against ground observations (for precipitation pH), with the temporal distribution in the annual mean values showing good agreement against the regional observational datasets. The use of aerosol acidity only has a relatively smaller impact on the aqueous-phase production of sulphate when compared to the changes in gas-to-particle partitioning brought by the use of EQSAM4Clim.


Metzger, S., Rémy, S., Williams, J. E., Huijnen, V., and Flemming, J.: A revised parameterization for aerosol, cloud and precipitation pH for use in chemical forecasting systems (EQSAM4Clim-v12), EGUsphere [preprint], https://doi.org/10.5194/egusphere-2023-2930, 2023.

How to cite: Remy, S., Metzger, S., Huijnen, V., Williams, J., and Flemming, J.: Improved representation of aerosol acidity in the ECMWF IFS-COMPO 49R1 through the integration of EQSAM4Clim., EGU General Assembly 2024, Vienna, Austria, 14–19 Apr 2024, EGU24-12250, https://doi.org/10.5194/egusphere-egu24-12250, 2024.

EGU24-12625 | Orals | AS3.18

Unifying Atmospheric Composition in the Unified Forecasting System Through UFS-Chem Development 

Rebecca Schwantes, Barry Baker, Ravan Ahmadov, Larry Horowitz, Lori Bruhwiler, Jian He, Zachary Moon, Jordan Schnell, Andrew Schuh, Li Zhang, Arthur Mizzi, Georg Grell, Vaishali Naik, David Fillmore, Matthew Dawson, Mary Barth, Havala Pye, Benjamin Murphy, Ligia Bernardet, and Brian McDonald and the UFS-Chem Developers

NOAA’s Unified Forecasting System (UFS) is a community-based Earth modeling system that plans to provide a framework to efficiently incorporate research advances into NOAA’s operational forecasts. Currently, chemistry related code for different applications including weather, climate, air quality, and smoke and dust forecasting is incorporated into the UFS through different methods. This non-unified framework is inefficient, difficult for developers to maintain, and not conducive for adding capabilities within the UFS for research applications. Through this work, we plan to unify atmospheric chemistry and composition within the UFS by creating CATChem or the Configurable ATmospheric Chemistry module (https://catchem.readthedocs.io/). CATChem will be flexible such that users can select the correct level of chemical complexity for their research or operational application. CATChem will include the following processes: passive tracers, chemical kinetics, aerosols, photolysis, wet deposition, dry deposition, connections to emissions, and connection to physics schemes. We will link CATChem to the UFS to create UFS-Chem or the Unified Forecasting System with chemistry. When possible, we will use tools already developed or being developed by the research community like the Model Independent Chemistry Module (MICM), which is a component of the MUlti-Scale Infrastructure for Chemistry and Aerosols (MUSICA), led by NCAR.

We will also add enhanced research capabilities into UFS-Chem, which will include: 

  • Options to use gas and aerosol chemical mechanisms of varying complexity.
  • Options for passive tracers, i.e. long lived greenhouse gases, which will also allow benchmark verification of mass conservation across UFS-Chem.
  • Ability to easily couple different mechanisms to different physics options. 
  • Development of a more flexible emissions processing system.
  • Interfacing with state-of-science atmospheric composition data assimilation capabilities. 
  • Further investment of model evaluation tools like MELODIES-MONET (https://melodies-monet.readthedocs.io) that efficiently compare model results against a variety of observations.

UFS-Chem will increase efficiency in code development, reduce costs for code maintenance, reduce time and effort for transitions to operations, and enhance collaborations with the research community. Continued engagement with the atmospheric chemistry and carbon cycle research communities are critical to ensure that research advances are efficiently and promptly included within the UFS, so that NOAA continues to provide state-of-the-art forecasts and monitoring of atmospheric composition to inform key societal challenges and policy. Here we present plans for UFS-Chem development and results for the first version of the global UFS configuration that includes full gas-phase tropospheric and stratospheric chemistry, which has been made possible through CATChem development.

How to cite: Schwantes, R., Baker, B., Ahmadov, R., Horowitz, L., Bruhwiler, L., He, J., Moon, Z., Schnell, J., Schuh, A., Zhang, L., Mizzi, A., Grell, G., Naik, V., Fillmore, D., Dawson, M., Barth, M., Pye, H., Murphy, B., Bernardet, L., and McDonald, B. and the UFS-Chem Developers: Unifying Atmospheric Composition in the Unified Forecasting System Through UFS-Chem Development, EGU General Assembly 2024, Vienna, Austria, 14–19 Apr 2024, EGU24-12625, https://doi.org/10.5194/egusphere-egu24-12625, 2024.

EGU24-12702 | Posters on site | AS3.18 | Highlight

Forecasting smoke and dust in NOAA’s next-generation high-resolution coupled numerical weather prediction model 

Ravan Ahmadov, Haiqin Li, Johana Romero-Alvarez, Jordan Schnell, Sudheer Bhimireddy, Eric James, Ka Yee Wong, Ming Hu, Jacob Carley, Partha Bhattacharjee, Barry Baker, Georg Grell, Chuanyu Xu, Shobha Kondragunta, Fangjun Li, Samuel Trahan, and Margaret Marvin

NOAA’s Global Systems Laboratory (GSL), in collaboration with other laboratories, is developing and testing a new high-resolution weather model known as the Rapid-Refresh Forecasting System (RRFS). This model, which uses the Finite Volume Cubed-Sphere Dynamical Core, features a grid covering all of North and Central America at 3 km horizontal resolution, with 65 vertical layers. 

The RRFS is initialized every hour through assimilation of the latest weather observations. It incorporates primary aerosol emissions from wildland fires and dust sources. The coupled RRFS-Smoke-Dust (RRFS-SD) model simulates 3D concentrations of smoke, fine and coarse dust aerosol species concurrently with the meteorology, and includes the aerosol radiative feedback. Hourly fire radiative power data from the Regional ABI and VIIRS fire Emissions (RAVE) product is ingested into RRFS to estimate biomass burning emissions and fire heat fluxes. Windblown dust emissions are parameterized by using the FENGSHA scheme. An experimental version of the RRFS-SD model is being tested by NOAA Environmental Modeling Center (EMC) in real time:  https://rapidrefresh.noaa.gov/RRFS-SD/

We will present an evaluation of the RRFS-SD model  for several fire and dust case studies. Ground and aircraft-based in-situ and remote sensing data are extensively utilized to evaluate the model simulations of meteorology, smoke and dust fields. Additionally, we will present the radiative feedback of smoke and dust on the meteorological simulations in RRFS. The challenges and uncertainties affecting the smoke and dust forecasting will be discussed as well. 

How to cite: Ahmadov, R., Li, H., Romero-Alvarez, J., Schnell, J., Bhimireddy, S., James, E., Wong, K. Y., Hu, M., Carley, J., Bhattacharjee, P., Baker, B., Grell, G., Xu, C., Kondragunta, S., Li, F., Trahan, S., and Marvin, M.: Forecasting smoke and dust in NOAA’s next-generation high-resolution coupled numerical weather prediction model, EGU General Assembly 2024, Vienna, Austria, 14–19 Apr 2024, EGU24-12702, https://doi.org/10.5194/egusphere-egu24-12702, 2024.

EGU24-12780 | Orals | AS3.18

Coupling of stratospheric aerosol and chemistry in IFS-COMPO: use of online aerosol information in the stratospheric heterogeneous chemistry 

Christine Bingen, Samuel Rémy, Simon Chabrillat, Daniele Minganti, Quentin Errera, Vincent Huijnen, Swen Metzger, Jason Williams, and Johannes Flemming

ECMWF’s Integrated Forecasting System, extended with modules for atmospheric composition (IFS-COMPO) is used to provide global forecasts and analyses of the atmospheric composition in the framework of the Copernicus Atmosphere Monitoring Service (CAMS). In the last years intensive work has been dedicated to an improved representation of stratospheric composition in IFS-COMPO. Progresses concern both chemistry through the implementation and use of BASCOE in IFS-COMPO since cycle 48R1, and the extension of IFS-AER to also represent stratospheric sulfate and the associated processes, planned for cycle 49R1. In cycle 49R1, IFS-COMPO will have the capacity to forecast different aerosol parameters of importance for the stratospheric heterogeneous chemistry, such as the surface area density (SAD).

The BASCOE module considers full stratospheric chemistry including heterogeneous reactions on the surfaces of polar stratospheric clouds (PSC) that control the extent and depth of ozone depletion events. To date BASCOE makes use of a combination of fixed information (particle number concentration, modal radius and the standard deviation of the aerosol particle size distribution), using a prescribed monthly SAD dataset to describe the aerosol contribution to stratospheric heterogeneous chemical processes. Here we present a further coupling of IFS-AER with BASCOE whereby online aerosol information from IFS-AER is used as an input to the BASCOE heterogeneous chemistry routines.

Two possible coupling mechanisms have been implemented and tested for different test cases representative for high volcanic load (Pinatubo period), moderate volcanic load (2008-2009 period), and low, “background” aerosol load (1997-1998 period). Making use of different reference datasets like GloSSAC (for aerosols) and the BRAM-MLS reanalysis (for ozone and ozone-depleting chemical species), we evaluate the impact of these new coupling mechanisms between IFS-AER and BASCOE on aerosol transport and microphysics during the considered periods, and on simulated stratospheric atmospheric composition, focusing on several ozone-depletion events (“ozone holes”) in both Antarctic and Arctic winter.

How to cite: Bingen, C., Rémy, S., Chabrillat, S., Minganti, D., Errera, Q., Huijnen, V., Metzger, S., Williams, J., and Flemming, J.: Coupling of stratospheric aerosol and chemistry in IFS-COMPO: use of online aerosol information in the stratospheric heterogeneous chemistry, EGU General Assembly 2024, Vienna, Austria, 14–19 Apr 2024, EGU24-12780, https://doi.org/10.5194/egusphere-egu24-12780, 2024.

EGU24-12973 | Posters on site | AS3.18

Uncertainty and Impact of Aerosol-Cloud Interaction in the Unified Forecast System 

Fanglin Yang and Anning Cheng

NOAA is collaborating with the US weather and climate science community to develop the fully coupled Unified Forecast System (UFS) for both research and operations across different temporal and spatial scales.  Active development and evaluation are underway to improve the representation of aerosols and its interaction with radiation and clouds in UFS applications.  Aerosols, acting as cloud condensation nuclei and ice nuclei,  affect cloud droplet number concentration and size, cloud lifetime and consequently cloud radiative properties.   Up to now, the impact of aerosols on clouds has not been included in UFS global applications for operation.  In this study we activate the interactions of aerosols with clouds in the Thompson double moment microphysics scheme used by the UFS-based  Global Forecast System (GFS) application.  MERRA2 aerosol climatologies instead of prognostic aerosols are employed for this study to reduce the complexity and uncertainty in aerosol prediction itself.  GFS free forecasts at the 13-km horizontal resolution for the summer of 2020 were conducted to investigate the uncertainty of the representation of aerosol-cloud interaction and the associated impact on GFS medium-range weather forecasts.   The experiment with aerosol-cloud interaction produced an overall larger number concentration of cloud droplets and cloud liquid mixing ratio, and larger number concentration of cloud ice and ice mixing ratio in the low-middle troposphere, but less above the upper troposphere.  The relationships between aerosol optical depth and cloud droplet number concentration were analyzed and compared with MODIS retrievals. In addition, the relationships between aerosol loading and optical properties with liquid water path, shortwave and long wave radiation were examined.  CCPP single column model was also used to help understand the uncertainty of aerosol-cloud interaction algorithms employed by the UFS.  

How to cite: Yang, F. and Cheng, A.: Uncertainty and Impact of Aerosol-Cloud Interaction in the Unified Forecast System, EGU General Assembly 2024, Vienna, Austria, 14–19 Apr 2024, EGU24-12973, https://doi.org/10.5194/egusphere-egu24-12973, 2024.

EGU24-13049 | Orals | AS3.18

Advancing NOAA's Global Ensemble Forecast System (GEFS) through the Integration of Prognostic Aerosols 

Raffaele Montuoro, Bing Fu, Neil Barton, Partha Bhattacharjee, Li Pan, Barry Baker, Kate Zhang, Jeffery McQueen, Avichal Mehra, Fanglin Yang, Ivanka Stajner, Gregory Frost, Vijay Tallapragada, and Yuejian Zhu

Ongoing efforts at the National Oceanic and Atmospheric Administration (NOAA), National Weather Service (NWS) are aimed at increasing the realism of the physical processes represented in both global and regional operational numerical weather prediction systems. These efforts include enhancing the description of atmospheric composition and its impact on the atmosphere by incorporating prognostic aerosols and aerosol radiative feedback in each member of the NOAA Global Ensemble Forecast System (GEFS).

Modern Earth system prototypes, built upon the community-based Unified Forecast System (UFS) framework and coupling atmosphere, land, ocean, sea ice, waves, and prognostic aerosols components are being developed and evaluated at the Environmental Modeling Center (EMC) in the process of identifying candidates for the planned operational upgrade of GEFS to version 13.

Prognostic aerosols are integrated in GEFS through the coupled UFS-Aerosols component, developed at EMC in collaboration with the National Aeronautics and Space Administration (NASA) Global Modeling and Assimilation Office (GMAO). UFS-Aerosols embeds NASA's 2nd-generation Goddard Chemistry Aerosol Radiation and Transport (GOCART) model and incorporates updates to the dust scheme and anthropogenic and biogenic emissions from NOAA’s Air Resources Laboratory (ARL), along with wildfire emissions provided by NOAA's National Environmental Satellite, Data, and Information Service (NESDIS).

The impact of radiative feedback from prognostic aerosols on atmospheric predictions in preliminary experiments with GEFS version 13 prototypes will be reviewed. 

How to cite: Montuoro, R., Fu, B., Barton, N., Bhattacharjee, P., Pan, L., Baker, B., Zhang, K., McQueen, J., Mehra, A., Yang, F., Stajner, I., Frost, G., Tallapragada, V., and Zhu, Y.: Advancing NOAA's Global Ensemble Forecast System (GEFS) through the Integration of Prognostic Aerosols, EGU General Assembly 2024, Vienna, Austria, 14–19 Apr 2024, EGU24-13049, https://doi.org/10.5194/egusphere-egu24-13049, 2024.

EGU24-17068 | ECS | Orals | AS3.18

Prognostic Ozone For ICON: Enabling UV Forecasts 

Valentin Hanft, Roland Ruhnke, Axel Seifert, and Peter Braesicke

Stratospheric ozone (O3) absorbs biologically harmful solar ultraviolet (UV) radiation, mainly in the UV-B and UV-C spectral range. At the surface, enhanced UV radiation poses a well documented hazard to human health. In order to quantify the amount of UV radiation and to make warnings easily understandable, the World Health Organization (WHO) has defined an UV Index[1]. It is calculated using a weighted integral of the incoming solar irradiance at surface level between 250 and 400 nanometers and scaling the result to values that generally range between 1 to 10, surpassing 10 for excessive UV exposure.

Implementing UV Index forecasts in numerical weather prediction (NWP) models allows to alert the public in time if special care for sun protection needs to be taken. The German Weather Service (DWD) uses its NWP model ICON (ICOsahedral Nonhydrostatic Model)[2] to offer such a forecast for Germany[3] using external data such as ozone forecasts by the Royal Netherlands Meteorological Institute (KNMI) and radiation lookup tables[4].

Here, we extend the capability of ICON such as to provide a self-consistent UV Index forecasts that do not require external/auxiliary data. For this, we use ICON-ART[5],[6] with a linearized prognostic (stratospheric) ozone scheme (LINOZ)[7] and couple the prognostic ozone (and other model variables) to the atmospheric radiation scheme Solar-J[8]. To validate this new ICON-ART setup, we study the model performance in a selected reference time frame in comparison to CERES[9] satellite data and find generally a good agreement. This is an indication for the suitability of the model system to forecast the UV Index.

References:

[1] World Health Organization. Global solar uv index : a practical guide,2002.

[2] Günther Zängl et al.. The icon (icosahedral non-hydrostatic) modelling framework of dwd and mpi-m: Description of the non-hydrostatic dynamical core. Quarterly Journal of the Royal Meteorological Society, 2015.

[3] https://kunden.dwd.de/uvi/index.jsp.

[4] Henning Staiger and Peter Koepke. Uv index forecasting on a global scale. Meteorologische Zeitschrift, 2005.

[5] D. Rieger et al.. Icon–art 1.0 – a new online-coupled model system from the global to regional scale. Geoscientific Model Development, 2015.

[6] J. Schröter et al.. Icon-art 2.1: a flexible tracer framework and its application for composition studies in numerical weather forecasting and climate simulations. Geoscientific Model Development, 2018.

[7] C. A. McLinden et al. Stratospheric ozone in 3-d models: A simple chemistry and the cross-tropopause flux. Journal of Geophysical Research: Atmospheres, 2000

[8] J. Hsu, M. J. Prather et al.. A radiative transfer module for calculating photolysis rates and solar heating in climate models: Solar-j v7.5. Geoscientific Model Development, 2017.

[9] NASA/LARC/SD/ASDC. (2017). CERES and GEO-Enhanced TOA, Clouds and Aerosols 1-Hourly Terra-Aqua Edition4A [Data set]. NASA Langley Atmospheric Science Data Center DAAC. https://doi.org/10.5067/TERRA+AQUA/CERES/SYN1DEG-1HOUR_L3.004A

How to cite: Hanft, V., Ruhnke, R., Seifert, A., and Braesicke, P.: Prognostic Ozone For ICON: Enabling UV Forecasts, EGU General Assembly 2024, Vienna, Austria, 14–19 Apr 2024, EGU24-17068, https://doi.org/10.5194/egusphere-egu24-17068, 2024.

EGU24-17697 | Orals | AS3.18

Implementing the first indirect radiative effect of aerosols in the ECMWF model 

Paolo Andreozzi, Mark Fielding, Richard Forbes, and Robin Hogan

For many years, aerosol-cloud-radiation interactions (ACI) have been incorporated in climate models, due to the high sensitivity of the Earth’s climate to changes in cloud microphysical properties. Despite this, such representations are still fraught with uncertainty, strongly limiting the capacity of such models to precisely predict climate change. For numerical weather prediction (NWP), the impact of ACI on forecast skill is controversial, though regional radiative fluxes can be affected significantly. Their representation in NWP models has therefore usually been neglected. We will present early results from an ongoing investigation to calculate the number of droplets (Nd) in liquid-phase clouds online from global aerosol fields in the ECMWF global Integrated Forecasting System (IFS), i.e. the first indirect radiative effect of aerosols. Our ACI scheme uses a lookup table, produced from offline cloud parcel model simulations, to estimate the number of aerosol particles activated into cloud droplets. This approach allows the effect of large sea salt to suppress the activation of sulfate aerosols to be included. We will then constrain the representation of ACI by verifying weather forecast against available satellite and station-based observations. Ultimately, the impact of such simulated processes on the model can be assessed in different configurations of the IFS, spanning from the NWP medium range (10-15 days) to seasonal forecasts to climate projections. We will show how such a computationally inexpensive approach can effectively increase realism of the simulated liquid-phase cloud microphysics in the model, resulting in improved representation of global and regional top-of-the-atmosphere radiative fluxes. We can apply the same approach both to the climatological and prognostic aerosol representations supported by the IFS (the latter being used operationally for air quality forecasts by the Copernicus Atmospheric Monitoring Service, CAMS), allowing sensitive comparison between different configurations of the model. We will conclude by showing advantages of the new ACI scheme when aerosols are prognostic variables, and how such experiments could inform our work towards introducing ACI into the operational IFS forecasts, where currently a climatological representation of aerosols is used.

How to cite: Andreozzi, P., Fielding, M., Forbes, R., and Hogan, R.: Implementing the first indirect radiative effect of aerosols in the ECMWF model, EGU General Assembly 2024, Vienna, Austria, 14–19 Apr 2024, EGU24-17697, https://doi.org/10.5194/egusphere-egu24-17697, 2024.

EGU24-17895 | ECS | Posters on site | AS3.18

A case study of aerosol effects impact on key meteorological characteristics in Ukraine during heat wave event in July-August 2010 

Larysa Pysarenko, Alexander Mahura, Roman Nuterman, and Svitlana Krakovska

Aerosol effects play a significant role in Earth’s radiative balance, cloud formation and thus redistribution and change of meteorological characteristics. This study focuses on the case of heat wave event during July-August 2010 accompanied with wildfires, modeled using the seamless online-integrated Enviro-HIRLAM modeling system. We used reference (REF) run and running modes to simulate direct (DAE), indirect (IDAE) and combined (DAE+IDAE) aerosol effects. These runs fulfilled for domain at 15 km horizontal resolution (includes European territory), with downscaling to 5 km (includes the territory of Ukraine).

During the heat wave event, aerosol effects caused the overall 2-m air temperature nighttime cooling and daytime warming being stronger for DAE. Locally, there were observed reversed dependencies reaching up to 5℃ differences compared to REF runs. Specific humidity changes were consistent with air temperature fluctuations showing a decrease at night and increase during midday hours without heterogeneous spatial distribution. IDAE effects caused homogeneously distributed slight decrease in 2-m air temperature, with no sharp changes in specific humidity. At midday, homogeneity disappeared for 2-m air temperature, whereas aerosol effects had no significant impact on specific humidity. DAE+IDAE caused mostly warming effect during night time, with local increase and decrease for specific humidity. For all running modes, there were no significant changes in grid-scale precipitation driven by aerosol effects.

Occasionally, the heat wave event was accompanied with weather fronts. In comparison to anticyclonic synoptic conditions, the role of aerosol effects significantly increased during these weather fronts passage. In the case of a cold front, DAE showed a decrease in 2-m air temperature by -1,2℃ following the cold front areas, and warming on some distance up to +1,4℃ at midnight.

IDAE effects resulted in significant warming before front and cooling after it. Specific humidity falls after cold front up to -4 g/m3. DAE+IDAE affected 2-m air temperature rise before cold front and cooling after during midday. Specific humidity changes unevenly and increases after cold front. Grid-scale precipitation amounts decreased during the cold front passage due to the impact of aerosol effects for all running modes.

This study was supported by the grant of HPC-Europa3 Transnational Access Programme for projects “Integrated Modelling and Analysis of Influence of Land Cover Changes on Regional Weather Conditions/ Patterns” (MALAWE, HPC17ENAVF) & “Research and development for integrated meteorology – atmospheric composition multi-scales and – processes modelling” (Enviro-PEEX(Plus) on ECMWF; SPFIMAHU-2021). The CSC – IT Center for Science Computing (Finland) is acknowledged for computational resources.

How to cite: Pysarenko, L., Mahura, A., Nuterman, R., and Krakovska, S.: A case study of aerosol effects impact on key meteorological characteristics in Ukraine during heat wave event in July-August 2010, EGU General Assembly 2024, Vienna, Austria, 14–19 Apr 2024, EGU24-17895, https://doi.org/10.5194/egusphere-egu24-17895, 2024.

EGU24-18181 | ECS | Posters on site | AS3.18

Initial steps towards an inversion system for biogenic isoprene emissions in CAMS: Verification using HALO mini-DOAS and TROPOMI observations and simplified chemistry 

Flora Kluge, Johannes Flemming, Vincent Huijnen, Antje Inness, Christopher Kelly, Jean-François Müller, Glenn-Michael Oomen, Klaus Pfeilsticker, Trissevgeni Stavrakou, Roberto Ribas, Meike Rotermund, Ben Weyland, and Miró Van der Worp

We report on an extensive analysis of CAMS (Copernicus Atmospheric Monitoring Service) formaldehyde (HCHO) simulations in different tropospheric regions, seasons, altitudes and air masses using a comprehensive data set of airborne measured HCHO vertical column densities and mixing ratios. The observations are derived from measurements of the HALO mini-DOAS instrument operated from aboard the German research aircraft DLR HALO during six international research missions in the years 2017 to 2019. In addition, measurements over the South American tropical rain forest in 2014 are included, as this region is of particular interest in the analysis of global biogenic emissions. The analysis of airborne measured and CAMS CY48R1 simulated HCHO vertical profiles shows an overestimation of planetary boundary layer HCHO over the Amazon rain forest by the model on average by 70%. Restricting the comparison to measurements outside of identified anthropogenic emission events (e.g. biomass burning plumes) increases this overestimation of boundary layer HCHO to a factor of five. This finding is further investigated by additionally also including vertical column density measurements of the mini-DOAS instrument to the analysis. This allows the comparison of simulated and airborne derived HCHO with respective TROPOMI satellite observations (for all airborne measurements from May 2018 onwards), hence enabling a comprehensive assessment of tropospheric HCHO. The above findings are included in ongoing research of work package 2.3 of the Horizon Europe CAMEO (CAMS EvOlution) project, which aims to develop an inversion of biogenic emissions within ECMWF’s Integrated Forecasting System (IFS). As a first step towards a successful implementation of HCHO assimilation and inversion capability within the IFS, a simplified HCHO chemistry scheme has been developed and is currently analyzed with a particular focus on its impact on other atmospheric reactive trace gases, such as isoprene and ozone, and on aerosols.

How to cite: Kluge, F., Flemming, J., Huijnen, V., Inness, A., Kelly, C., Müller, J.-F., Oomen, G.-M., Pfeilsticker, K., Stavrakou, T., Ribas, R., Rotermund, M., Weyland, B., and Van der Worp, M.: Initial steps towards an inversion system for biogenic isoprene emissions in CAMS: Verification using HALO mini-DOAS and TROPOMI observations and simplified chemistry, EGU General Assembly 2024, Vienna, Austria, 14–19 Apr 2024, EGU24-18181, https://doi.org/10.5194/egusphere-egu24-18181, 2024.

In addition to dynamic and thermodynamic processes, aerosols' chemical and aerodynamic characteristics play a significant role in cloud microphysics and convective development. The region surrounding Manaus, located in the Northern region of Brazil, constitutes a unique environment worldwide for studying the impact of anthropogenic and biogenic emissions on aerosol concentration and, consequently, cloud microphysics. This study investigates chemical-aerosol-cloud interactions during the wet season, employing the Weather Research and Forecasting model with coupled chemistry (WRF-Chem) version 3.9.1.1 and observed data from the GoAmazon2014/5 experiment. The model was configured with a 3 km grid, utilizing the Regional Atmospheric Chemistry Mechanism (RACM) for gas-phase chemistry, and adopting the Modal Aerosol Dynamics Model for Europe (MADE) with parameterization for Secondary Organic Aerosol (SOA) production based on the Volatility Basis Set (VBS) approach for aerosol treatment. The Abdul-Razzak and Ghan option was employed to relate aerosol properties to the 2-moment Morrison cloud microphysics parameterization. The model is initialized with ERA5 and Copernicus Atmosphere Monitoring Service (CAMS) data, incorporating anthropogenic emissions from a regional inventory and biogenic emissions using the Model of Emissions of Gases and Aerosols from Nature (MEGAN). Results indicate that the model effectively represents meteorology and chemistry in the Manaus region. The fully coupled model successfully reproduces plume dispersion and aging. The aerosol concentration peak in the accumulation mode is observed approximately 100 km from Manaus, returning to background concentrations beyond 300 km. The increase in aerosol concentrations is associated with the formation of biogenic and anthropogenic Secondary Organic Aerosol (SOA) and sulfate-derived aerosols with mass peaks at 4, 100, and 1.4 times the background concentration. This aerosol concentration increase significantly correlates with Cloud Condensation Nuclei (CCN) concentration at 0.5% supersaturation. Despite the elevated aerosol concentration in the plume and higher CCN concentration, the CCN/aerosol ratio decreases to 0.02, in contrast to 0.3 in the background region. The distinct chemical and aerodynamic characteristics of aerosols in the background and urban plume regions modulate the Droplet Number Concentration (DNC), Liquid Water Content (LWC), and Effective Radius (Re). Clouds in the plume exhibit higher DNC and LWC, and lower Re. Approximately 40% of clouds in the plume have LWC above 2.5 g/m³, compared to only 10% in background regions. The average Re is 8 and 13 μm in the plume and background regions, respectively. Sensitivity simulations also show that both anthropogenic and biogenic emissions influence cloud processes in the Amazon region. Our results suggest that a more accurate representation of aerosols, often simplified in numerical models, is necessary for enhanced weather and climate modeling.

How to cite: Herdies, D., Reis, A., Nascimento, J., and Vara-Vela, A.: Impact of the Manaus Plume on the Amazon Green Ocean Atmosphere: Aerosol-Cloud Interaction during the Wet Season with fully coupled online chemistry in the WRF model, EGU General Assembly 2024, Vienna, Austria, 14–19 Apr 2024, EGU24-19415, https://doi.org/10.5194/egusphere-egu24-19415, 2024.

EGU24-19784 | Posters on site | AS3.18

Speciated aerosol water diagnostics in the global Copernicus Atmospheric Monitoring Service (CAMS) Integrated Forecast System (IFS-COMPO) 

Swen Metzger, Samuel Rémy, Jason E. Williams, Vincent Huijnen, Christine Bingen, Daniele Minganti, Simon Chabrillat, and Johannes Flemming

The ECMWF’s Integrated Forecasting System (IFS-COMPO) is the European global atmospheric model used to provide global analyses and forecasts of atmospheric composition, including aerosols as well as reactive trace gases and greenhouse gases in both the troposphere and stratosphere within the framework of the Copernicus Atmosphere Monitoring Service (CAMS).

Recently the Equilibrium Simplified Aerosol Model for Climate version 12 (EQSAM4Clim-v12) has been implemented in IFS-COMPO and will be used in cycle 49R1 to compute the inorganic gas/aerosol equilibrium partitioning involving major ammonium, sulphate and nitrate compounds, i.e., NH3/NH4+, H2SO4/HSO4-/SO42- and HNO3/NO3-, as well as the non-volatile mineral cations Ca2+, Mg2+, Na+, and K+. The composition and aerosol water mass (AW) is calculated by EQSAM4Clim through the neutralization of anions by cations, which yields numerous salt compounds. In EQSAM4Clim, all salt compounds (except CaSO4) can partition between the liquid and solid aerosol phase, depending on temperature (T), relative humidity (RH), AW and the T-dependent RH of Deliquescence of (a) single solute compound solutions (RHD) and (b) of mixed salt solutions (MRHD).

The possibility to store the speciated AW from each EQSAM4Clim salt compound has been implemented in IFS-COMPO in an experimental version. Additionally, the associated compound’s growth factors (GF) and various aerosol properties have been added to the IFS-COMPO output diagnostics. Here, we show that results related to the speciated AW and GFs as computed by EQSAM4Clim-v12 in IFS-COMPO based on RHD compare well with the corresponding lookup table values of IFS-COMPO that are currently used operationally. The speciated aerosol water diagnostics based on MRHD will be used to improve the aerosol optical depth (AOD) calculations. Differences between an AW and GF based AOD coupling will be discussed.

How to cite: Metzger, S., Rémy, S., Williams, J. E., Huijnen, V., Bingen, C., Minganti, D., Chabrillat, S., and Flemming, J.: Speciated aerosol water diagnostics in the global Copernicus Atmospheric Monitoring Service (CAMS) Integrated Forecast System (IFS-COMPO), EGU General Assembly 2024, Vienna, Austria, 14–19 Apr 2024, EGU24-19784, https://doi.org/10.5194/egusphere-egu24-19784, 2024.

EGU24-20883 | ECS | Orals | AS3.18

Quantifying the impact of aerosols on the predictive skill of subseasonal global atmospheric simulations 

Ariane Frassoni, Frederic Vitart, Angela Benedetti, and Andrea Molod

Subseasonal forecasts have been fundamental in bridging the gap between numerical weather predictions and seasonal forecasts, offering a wide range of products and services, particularly within the intraseasonal timescale. Despite the unprecedented opportunities to provide relevant information on key climate characteristics within the Subseasonal to Seasonal (S2S) timescale, there remains room for improvement in the predictive skill of S2S forecasts.

One potential avenue for enhancement is the numerical representation of two-way aerosol-climate interactions. Atmospheric aerosols play a crucial role as climate forcing due to their interactions with radiation (direct effect) and influences on cloud life cycle and precipitation (indirect effect).

Recognizing the significance of atmospheric composition in enhancing weather and climate prediction capabilities for the global climate system, the World Climate Research Programme Core Project Earth System Modeling and Observations-Working Group on Numerical Experimentation (WGNE), the WCRP and World Weather Research Programme (WWRP) S2S Steering Group (S2S-SG) and the Global Atmosphere Watch Programme Scientific Advisory Group on Applications (SAG APPs) have collaboratively led the WGNE Aerosol Project. This initiative aims to gain a deeper understanding of the role of aerosols in the predictive skill of models within the S2S timescale.

The WGNE Aerosol Project involves operational meteorological centers worldwide, contributing their state-of-the-art climate-chemistry-aerosol-cloud-radiation coupled modeling systems. Modeling groups participants contributed with an ensemble of retrospective predictions (hindcasts) considering distinct model configurations, taking into account the feedback between radiation/microphysics parametrization and aerosols. No-feedback between radiation/microphysics and aerosols experiments were considered as reference experiments. These reference experiments serve as a baseline to evaluate and understand the impact of incorporating feedback mechanisms in the modeling systems.

We propose to assess the performance of the WGNE Aerosol project modeling contributions, specifically focusing on the global domain within the S2S timescale. This work will present the results of the assessment, focusing on the main atmospheric variables near the surface, and aerosol optical depth from both deterministic and probabilistic perspectives, using common statistical metrics.

The WGNE Aerosol Project offers an opportunity to comprehend the feedback represented in current climate-chemistry-aerosol-cloud-radiation coupled systems and their impact on predicting climate variability, air quality, and extreme meteorological events within the S2S timescale. Moreover, it aims to identify the uncertainties associated with model predictions of feedback, providing insights for future developments and addressing the complexities of coupled modeling systems that impact predictive skill within the S2S timescale.

How to cite: Frassoni, A., Vitart, F., Benedetti, A., and Molod, A.: Quantifying the impact of aerosols on the predictive skill of subseasonal global atmospheric simulations, EGU General Assembly 2024, Vienna, Austria, 14–19 Apr 2024, EGU24-20883, https://doi.org/10.5194/egusphere-egu24-20883, 2024.

EGU24-21289 | Posters on site | AS3.18

Analytical Propagation of Emission Uncertainties into CAMS Policy Products 

Lewis Blake, Peter Wind, Hilde Fagerli, Alvaro Valdebenito, Ingrid Super, and Jeroen Kuenen

We present a methodology and first results for analytical propagation of emissions uncertainties
through the EMEP MSC-W chemical transport model (CTM) and an application of these uncertainty
estimates to policy products provided by the Copernicus Atmosphere Monitoring Service
(CAMS) for European cities. CTMs are widely employed in atmospheric modeling to simulate
the transport and transformation of pollutants, but uncertainties in emission estimates can
significantly impact the accuracy of air quality predictions. Our study systematically analyzes
the propagation of uncertainties arising from emissions. The emissions’ uncertainties are consistent
with the CAMS regional emissions product and are calculated using detailed, countryspecific
uncertainty estimates in activity data and generic emission factor uncertainties. The
uncertainties are calculated per source sector and country. The Local Fractions/Sensibilities [1]
methodology available in the EMEP MSC-W model is a tool that allows computation of sourcereceptor
relationships more efficiently. In conjunction with analytical methods for uncertainty
propagation, we deliver air quality predictions with uncertainty estimates at a fraction of the
computational cost and with increased traceability compared to modern surrogate modeling
techniques. In our study we focus on PM2.5 and PM10, and first results will be presented for the
impact of emission uncertainties on forecasted PM concentrations in European cities, as well as
uncertainties in contributions from different source sectors and countries. By integrating emission
uncertainty propagation, our study aims to provide decision-makers with a more accurate
assessment of the reliability of CAMS policy products under various atmospheric conditions
and in the future provide these estimates as part of their operational delivery.


References

[1] P. Wind, B. Rolstad Denby, and M. Gauss, “Local fractions – a method for the calculation
of local source contributions to air pollution, illustrated by examples using the emep
msc-w model (rv4 33),” Geoscientific Model Development, vol. 13, no. 3, pp. 1623–1634,
2020. [Online]. Available: https://gmd.copernicus.org/articles/13/1623/2020/

How to cite: Blake, L., Wind, P., Fagerli, H., Valdebenito, A., Super, I., and Kuenen, J.: Analytical Propagation of Emission Uncertainties into CAMS Policy Products, EGU General Assembly 2024, Vienna, Austria, 14–19 Apr 2024, EGU24-21289, https://doi.org/10.5194/egusphere-egu24-21289, 2024.

  Burning firework is a traditional custom in China during Chinese Spring festival period, and the smoke plums releasing from firework burning are responsible for high concentrations of particles (especially trace metals) and gases. In this work,results from in-situ measurements of chemical components of PM2.5 aerosols and trace gases during three successive spring festival campaigns (2016-2018) are reported. The campaigns were carried out at a regional background station, SORPES, located in the western part of the Yangtze River Delta in eastern China. 

Table 1. Median value of selected trace metals, PM2.5 mass, organic carbon, elemental carbon, ions and trace gas concentration during firework events (FW) and background (BG) periods in three campaigns.

   2016 2017 2018
  FW BG FW BG FW BG
ug/m3            
PM2.5 63 54 40 63 59 43
OC 12 7.7 6.5 7.8 4.7 4.4
EC 3.4 2.7 1.8 2.8 2.4 2.7
K 3.1 0.8 1.0 0.5 1.2 0.2
Cl 1.2 1.6 1.0 1.0
1.5
0.8
SO4 11 12 9.2 12 12 7.3
ng/m3            
Sr 60 8.2 16 5.5 35 7.4
Ba 137 14 33 11 87 17
Cu 26 10 9.4 6.1 50 37
As 36 23 11 15 13 11
Pb 139 83 60 75 60 46
Zn 90 109 70 127 73 84
Fe 338 369 150 265 174 318
V 2.3 0.8 1.9 2.2 0.7 0.6
CO(ppm) 0.83 0.53 0.48 0.64 0.56 0.55
SO2(ppb)     2.0 3.6 1.4 2.5

Sr/PM(‰)

1.03 0.2 1.01 0.11 0.98 0.2


Median concentrations of selected PM2.5 chemical species and trace metals are summarized in Table1. Clear elevations of Sr, Ba, Cu, K and Cl were observed during firework event period than background period, while no clear elevation were found for other species. Time series illustrated in Fig.1 suggested that in our case, Sr followed by Ba were recognised as the best fireworks tracers because their concentration were very high during firework episode and comparable with the detection limits of instrument during the background period. Similar founding was also observed in Spain (Moreno et al., 2010). The higher Sr/PM2.5 ratio (Table 1) suggest higher contribution of firework emission pollution to PM2.5 during firework events compare to background period (5 to 10 times).

Figure 1. Time series of Sr and Ba during three campaigns in 2016-2018.

  Extremely high enrichment factor was determined for Sr, Ba, Cu, Zn and Pb, suggests that they have anthropogenic origin. Mass concentrations of the trace elements and OC, EC data were input into EPA PMF5.0 model to elucidate the possible dominant source. The results suggest that the dominant sources in three campaigns were firework, coal burning, industry, and traffic. Further analysis on PMF and back trajectory statistics are still need to be done.        


How to cite: Chi, X., Wang, L., and Zhu, C.: Effect of fireworks events on urban background PM2.5 composition:  measurement of trace elements at SORPES during spring festival periods 2016-2018, EGU General Assembly 2024, Vienna, Austria, 14–19 Apr 2024, EGU24-2199, https://doi.org/10.5194/egusphere-egu24-2199, 2024.

EGU24-2540 | PICO | AS3.19

Study of atmospheric CO and CH4 trends and their response on global climate changes based on experimental data and model simulations 

Vadim Rakitin, Andrey Skorokhod, Yury Shtabkin, Natalia Kirillova, and Eugenia Fedorova

Based on the analysis of orbital measurements and GEOS-Chem model calculations with different anthropogenic and wild-fires emission scenarios, a study of trends in the total content of CO and CH4 in different periods and seasons of 2003-2023 for the Eurasia domain, -20°E - 180°E, 0°N - 80°N. A response of CO trends to climate change was estimated. Data from the orbital AIRS instrument and ground-based spectrometers were used as experimental information to assess atmospheric composition trends.
A good agreement has been established between estimates obtained from the orbital data and from simulations. However, certain regional features of the discrepancies have been identified and are associated with the inaccuracy of specifying the spatial distribution and integral power of anthropogenic CO, CH4 and another species emission and their trends for Russia, South-East Asia and other regions of Eurasia. These emission uncertainties affect the accuracy of model calculations.
In general, according to average annual estimates, CO TC trends over entire Eurasia for 2000-2023 was slightly negative (~ 0.5-1.2 %/year depending on the region); however, after approximately 2008 the downward trend slowed down, and in some areas the CO TC began to rise.
Thus, a positive change in CO TC trends after about 2008 was established. In the entire domain under study, this change was about 2–3%/year, according both experimental and model estimates. In autumn months of 2008-2023 the increase in CO TC was established over almost the entire Eurasia, including Arctic regions and Europe. This growth (at least in Europe) cannot be explained by either anthropogenic emissions or releases from wild-fires. A possible reason for this rising may be the formation of additional CO from methane, the increase in concentrations of which began around the same time (after 2007), and change in the source/sink ratio for CO.
Additionally, to assess the parameters of correspondence between orbital and ground-based measurements, we have compared the trend estimates using only synchronous orbital and ground-based CO and CH4 observations and obtained the drift of the difference between them.
The study was supported by Russian Science Foundation under grant №20-17-00200.

How to cite: Rakitin, V., Skorokhod, A., Shtabkin, Y., Kirillova, N., and Fedorova, E.: Study of atmospheric CO and CH4 trends and their response on global climate changes based on experimental data and model simulations, EGU General Assembly 2024, Vienna, Austria, 14–19 Apr 2024, EGU24-2540, https://doi.org/10.5194/egusphere-egu24-2540, 2024.

EGU24-2565 | PICO | AS3.19

Long-Term Tendencies and Variability of CO content in the Atmosphereof the Moscow Megapolis 

Natalia Kirillova, Vadim Rakitin, Andrey Skorokhod, Anatoly Dzhola, Arseny Shilkin, and Eugeniya Fedorova

This report presents the results of a comprehensive analysis of spectroscopic long-term data sets on CO total content (CO TC) at stations of the A.M. Obukhov Institute of Atmospheric Physics, Russian Academy of Sciences (IAP RAS), in Moscow and Moscow oblast. The long-term variability of CO TC and meteorological parameters in atmospheric boundary layer were investigated. A decrease in the average TC CO annual values in 2000–2023 was found for Moscow (–2.23 ± 0.36%/year) and for Zvenigorod Scientific Station (ZSS) (‒1.12 ± 0.33%/year). The CO trend characteristics in both sites in different seasons and periods are demonstrated and discussed.

After about 2007–2008, the rate of CO TC reduction decreased at both sites. In 2008–2023 at the ZSS no significant changes in CO TC in the summer and autumn months were found: trend was near zero (-0.04±0.81%/year). An increase in the wind speed in the atmospheric boundary layer of Moscow in different periods of 2008–2022 at a rate of 0.66±0.55%/year has been determined. At the same time, no statistically significant changes in wind speed were found in Kaluga oblast (0.12±0.56%/year). The results indicate the influence of the climatic (meteorological) factor on air quality in Moscow.

Study was supported by Russian Science Foundation, Project No 20-17-00200.

How to cite: Kirillova, N., Rakitin, V., Skorokhod, A., Dzhola, A., Shilkin, A., and Fedorova, E.: Long-Term Tendencies and Variability of CO content in the Atmosphereof the Moscow Megapolis, EGU General Assembly 2024, Vienna, Austria, 14–19 Apr 2024, EGU24-2565, https://doi.org/10.5194/egusphere-egu24-2565, 2024.

EGU24-2568 | PICO | AS3.19

Near-surface ozone variability in the Karadag nature reserve 

Evgenia Fedorova, Vladimir Lapchenko, Nikolai Elansky, Vadim Rakitin, and Nastya Vasileva

The work presents the results of a study of a near-surface ozone concentration variability in the Crimea at the background environmental monitoring station in the Karadag Nature Reserve (44°55 north latitude, 35°14 east longitude; 180 m above sea level) for 2012-2021 years with a more detailed analysis of the last six years from 2016 to 2021 years. Ozone measurements at the station are carried out using an APOA-370 gas analyzer (HORIBA, Japan) with an error of no more than 15 μg/m3.

A significantly high-level air pollution of а near-surface ozone was revealed in the observation region, despite the absence of nearby sources of industrial emissions. The maximum hourly average concentration of ozone, equal to 195 µg/m3, was observed on 25.08.2018

To interpret the results obtained, determine the nature of ozone pollution, its relationship with carbon monoxide, and the influence of transboundary and downward transport on ozone concentrations, observations data from the AIRS (Atmospheric InfraRed Sounder, Level 3, v.6 resolution 1°x1°, “ascending only”) orbital spectrometer were used.

The relationship of near-surface ozone concentration and meteorological parameters was investigated. Wind directions leading to increased levels of near-surface ozone pollution are established. Intra-annual variations of near-surface ozone concentration are analyzed. Factors causing the local summer minimum of surface ozone level in some years are established.

Using NOAA HYSPLIT trajectory model and ERA5 reanalysis, a spatial analysis of the atmospheric circulation pattern in the region was carried out. The recurrence of episodes of exceeding the ozone concentration 100 µg/m3 during more than 8 hours (WHO recommendation, further in the text - the standard) was estimated. The frequency of exceeding this standard is about 5% of all measurements for the time-period of 2016–2021. Possible causes of these episodes were determined and discussed. The mechanisms of long-range transport and its contribution to the near-surface ozone regime in the area of the station have been established in different seasons.

Thus, trajectory analysis showed that for cases where the standard is exceeded in the spring, the movement of air masses occurs over the surface of Black Sea under cyclonic circulation processes. The analysis showed that polluted air masses were formed mainly over central Ukraine, Turkey, Romania and Bulgaria. In the summer months, atmospheric transport over the land surface from the eastern direction (Ukraine, southern Russia) predominates.

Annual trends of near-surface ozone concentration in the period 2012-2021 years are estimated as statistically insignificant.

Study was supported by Russian Science Foundation, Project No 20-17-00200.

How to cite: Fedorova, E., Lapchenko, V., Elansky, N., Rakitin, V., and Vasileva, N.: Near-surface ozone variability in the Karadag nature reserve, EGU General Assembly 2024, Vienna, Austria, 14–19 Apr 2024, EGU24-2568, https://doi.org/10.5194/egusphere-egu24-2568, 2024.

EGU24-2653 | ECS | PICO | AS3.19

Multi‐year variations of submicron aerosol composition and sources in Ireland 

Lu Lei, Kirsten Fossum, Chunshui Lin, Darius Ceburnis, Aqeel Afzal, Teresa Spohn, Emmanuel Chevassus, Colin O'Dowd, and Jurgita Ovadnevaite

The air quality in Ireland was once significantly deteriorated by air pollutants emitted from domestic coal combustion activities in the 1980s. Thanks to the smoky coal ban which was put into force in 1990, the air pollution in Ireland has been improved gradually and surely. However, extreme air pollutions with the mass concentration of submicron aerosols (PM1) exceeding 300 μg m-3 were still observed sporadically during cold months, which were mainly related to domestic solid fuel combustion, and the disproportionate impacts from so-called “low-carbon” and “carbon-neutral” solid fuels (e.g., peat and wood). Moreover, due to the increasing wood stove advertisements and significant fuel price increase caused by Ukrainian-Russian war, the emissions from local solid fuel combustion activities could greatly impair the air quality in Ireland in the future. Since the situation is changing year to year, it’s very critical to conduct continuous field aerosol measurements and have a deeper insight into the medium/long-term variations for more targeted and effective regulations in the future. In this study, based on the parallel real-time measurements of submicron aerosol species at three representative sites over Ireland, the multi-year variations of aerosol chemical composition and source emissions have been analyzed.

The air quality in Dublin has been improved gradually since 2016, with the annual average mass concentration of PM1 decreased from 8.0 μg m-3 in 2016 to 4.1 μg m-3  in 2022, and the total number of days when PM1 concentration exceeds the WHO recommendation value (15 μg m-3) has decreased to 11 days in 2022. Specifically, the extreme air pollutions have been reduced significantly, e.g., the maximum hourly PM1 concentration has decreased to 77 μg m-3 in 2022 compared to 317 μg m-3 in 2016.  The high PM1 concentrations in Dublin were more related to local emissions, especially domestic solid fuel burning, characterized by large contributions from primary organic aerosols. While long-range transport also plays an important role with high fractions of inorganics especially Nitrate (NO3). The chemical composition of PM1 in Dublin was similar over the years, i.e., dominated by Organics (Org) and then followed by NO3 or sulfate (SO4). However, it’s worrisome to find that the mass concentration of SO4 has been increasing since 2021 and showed higher contribution to PM1 especially during cold months, indicating that the sharply increasing fuel prices recently may have led to a change in fuel usage, possibly with more coal and solid fuel combustion in households. This could indicate severe air pollution episodes that need further and more effective regulations in the near future to ensure good enough air quality.  


How to cite: Lei, L., Fossum, K., Lin, C., Ceburnis, D., Afzal, A., Spohn, T., Chevassus, E., O'Dowd, C., and Ovadnevaite, J.: Multi‐year variations of submicron aerosol composition and sources in Ireland, EGU General Assembly 2024, Vienna, Austria, 14–19 Apr 2024, EGU24-2653, https://doi.org/10.5194/egusphere-egu24-2653, 2024.

EGU24-2664 | ECS | PICO | AS3.19

The Iteration Method for Air Density Retrieval in The Stellar Occultation Measurement 

Zheng Li, Xiaocheng Wu, Junfeng Yang, Cui Tu, Xiong Hu, and Zhaoai Yan

The stellar occultation technique detects Earth’s atmospheric components by measuring the absorption of the stellar spectrum. In this paper, A method of air density retrieval using stellar occultation transmission data in oxygen absorption A band is studied. In this method, the average single-band transmission in oxygen A-band is used to calculate the effective optical depth of each layer of atmosphere by using the peeling onion algorithm. Then, the effective optical depth of each layer and prior atmospheric temperature data are used to obtain the oxygen number density profile by using the retrieval method. Finally, the stable proportion of oxygen in the atmosphere is taken into account. By introducing the iterative algorithm of atmospheric static equilibrium and ideal gas state equation, the accuracy of air density retrieval is improved under the condition of deviation of prior temperature. The results of simulation retrieval are presented in this paper. This method overcomes the negative influence of prior temperature deviation on the retrieval accuracy, and provides a new method and theoretical basis for stellar occultation detection and air density detection.

How to cite: Li, Z., Wu, X., Yang, J., Tu, C., Hu, X., and Yan, Z.: The Iteration Method for Air Density Retrieval in The Stellar Occultation Measurement, EGU General Assembly 2024, Vienna, Austria, 14–19 Apr 2024, EGU24-2664, https://doi.org/10.5194/egusphere-egu24-2664, 2024.

EGU24-3668 | PICO | AS3.19 | Highlight

Source investigation and risk assessment of air toxics in an environmental justice community  

Hsin-Cheng Hsieh, Chieh-Heng Wang, Chih-Chung Chang, and Jia-Lin Wang

Toxic volatile organic compounds (VOCs) are part of the hazardous air pollutants (HAPs) or air toxics that affect public health. An approach comprising both online and offline measurement techniques was conducted in a community near an industrial complex for method evaluation and risk assessment. During a month-long field test in this environmental justice community, the instrument of thermal desorption (TD) - gas chromatography-mass spectrometry (GCMS) targeting 86 air toxics was intercompared with two other techniques: direct inlet mass spectrometry (proton transfer reaction quadrupole mass spectrometry or PTR-QMS) and flask sampling for evaluating method suitability. TD-GCMS gathering hourly data was deemed the most suitable online device for source investigation and health risk assessment due to its superior accuracy, species coverage, and data continuity.

The sensitive detection of plumes as spikes near real-time by TD-GCMS established a strong link between source and receptor, which has proven to be effective for tracing the origins of the plumes. Compared to online measurements, random flask sampling tends to miss most of the emission plumes. The concentration spikes in the TD-GCMS data were further aimed for backward trajectory analysis to guide offline sampling in suspected source areas to confirm emission origins.

Although both the online PTR-QMS and TD-GCMS were effective in detecting non-chlorinated species, TD-GCMS proved to be more versatile in detecting both chlorinated and non-chlorinated air toxics with irreplaceable accuracy pivotal for robust hazard assessment resulting from the acute effects, chronic effects, and cancer risks induced by long-term exposure to ambient air toxics.

How to cite: Hsieh, H.-C., Wang, C.-H., Chang, C.-C., and Wang, J.-L.: Source investigation and risk assessment of air toxics in an environmental justice community , EGU General Assembly 2024, Vienna, Austria, 14–19 Apr 2024, EGU24-3668, https://doi.org/10.5194/egusphere-egu24-3668, 2024.

Biomass burning has been identified as a major cause of poor regional air quality and the dominant source of particulate matter (PM) in the Amazon basin. In this study, we analyse the impact of the upper-level jet on PM2.5 (PM with an aerodynamic diameter ≤ 2.5 μm) concentrations in tropical South America (SA) from December to February during the period 2003-2022, using the Copernicus Atmosphere Monitoring Service (CAMS) and ERA5 reanalyses. Furthermore, we investigate the response of air pollutants to the joint modulation of the upper-level jet and El Niño-Southern Oscillation (ENSO). First, a climatological analysis shows that PM in the region is largely composed of organic matter and black carbon, with the highest concentrations and temporal variability in Colombia and northeastern Brazil. Regarding the link with the upper-level circulation, we find that PM2.5 concentrations in northeastern Brazil are reduced on days when the subtropical jet (STJ) is absent, due to increased convection and precipitation over the region. This improvement in air quality is independent of the ENSO phase. Conversely, a prominent STJ inhibits convection and contributes to dry conditions that favour increased biomass burning and elevated pollutant concentrations in the lower troposphere. At a 3-day persistence of these STJ conditions, there is a 90% probability of exceeding the World Health Organisation threshold of 15 μg m-3. In addition, the co-occurrence of a prominent STJ with an El Niño phase acts synergistically to increase pollutant concentrations, as both reduce precipitation in northeastern Brazil. In combination with La Niña, this upper-level pattern does not modulate PM2.5 concentrations because the wet conditions favoured by this ENSO phase prevail, reducing biomass burning. This study provides new insights into the modulation of air quality by the upper-level atmospheric circulation in tropical SA. The results have the potential to improve short-term predictability and can serve as a first step towards the development of a warning system.

How to cite: Ordóñez, C., Collazo, S., and García-Herrera, R.: Impact of Upper-Level Atmospheric Circulation and El Niño-Southern Oscillation Phases on Particulate Matter Concentrations in Tropical South America, EGU General Assembly 2024, Vienna, Austria, 14–19 Apr 2024, EGU24-5307, https://doi.org/10.5194/egusphere-egu24-5307, 2024.

EGU24-5436 | ECS | PICO | AS3.19

Understanding the role of emissions in future air-quality scenarios over Central Europe 

Alvaro Patricio Prieto Perez, Peter Huszar, and Jan Karlicky

Air quality depends on emissions, but climate and meteorology also play a role in it. To understand better the contribution of each of these factors, we have to study the evolution of air pollution by varying these drivers. In this study, we are investigating the role that changes in emissions play in air-quality following the RCP4.5 and RCP8.5 scenarios for the 2026-2035 and 2046-2055 decades. We assume that the changes of climate conditions are negligible in comparison to changes in emissions, thus isolating the contribution of emission changes in future air pollution. To carry out the study, a simulation with present-day (2010-2019 decade) emissions and meteorology was performed, and another four simulations with future emissions are being carried out at the moment. The emission input for 2010-2019 was compiled using the Flexible Universal Processor for Modeling Emissions (http://www.fume-ep.org/), and the two future decades were created by applying scaling factors on the present-day emissions based on the mentioned RCPs. The simulations are being performed both by the Weather Research and Forecast with online chemistry version 4.0.3 (WRF-Chem) model and the Comprehensive Air-quality Model with Extensions (CAMx) version 7.20. The present-day simulation is being validated by studying several pollutants (such as NO2, O3, SO2, CO, PM10 and PM2.5) and meteorological variables and comparing them with observational data.

How to cite: Prieto Perez, A. P., Huszar, P., and Karlicky, J.: Understanding the role of emissions in future air-quality scenarios over Central Europe, EGU General Assembly 2024, Vienna, Austria, 14–19 Apr 2024, EGU24-5436, https://doi.org/10.5194/egusphere-egu24-5436, 2024.

EGU24-6831 | ECS | PICO | AS3.19

Observing the Ammonia Daily Cycle over Agricultural Areas in Asia Using Combined Satellite Measurements 

Adriana Iorga, Jeremy Harrison, and David Moore

Ammonia (NH3) is one of the most important nitrogen gas species and pollutants in the lower troposphere because of the wide usage of nitrogen-based fertilisers in agriculture. Most of the ammonia present in the atmosphere originates from anthropogenic sources, agriculture being the dominant one [1]. Ammonia enters the atmosphere through volatilisation from agricultural soils where fertilisers and/or manure have been spread [2]. Ammonia is a highly unstable gas, reacting chemically with acids to form fine particulate matter (PM2.5), therefore playing an important role in secondary aerosol formation [3]. Wet and dry deposition of ammonia on soils and water bodies is detrimental to ecosystem biodiversity as it leads to acidification of the environment [4]. Therefore, observations of ammonia are essential for establishing air quality and environmental regulations for agricultural practices.

The remote sensing of ammonia presents numerous challenges because ammonia concentrations rapidly change over time and space due to the short life-time of the gas, which ranges from a few hours up to a day [5]. Studying the ammonia diurnal cycle provides valuable information on its sources, surface exchange, deposition and transport processes, and the impact on these by weather and surface conditions; all these are crucial for improving atmospheric models.

The ammonia daily cycle over the Indo-Gangetic Plain in India has been studied using combined satellite observations from the Infrared Atmospheric Sounding Interferometer (IASI) and the Cross-track Infrared Sounder (CrIS) instruments during different months in 2022. By studying the evolution of the ammonia total column concentrations at different satellite overpass times over several days, changes in the ammonia daily cycle can be observed between different seasons. The study makes use of optimal estimation-based retrieval methods developed at the University of Leicester.


References:

[1] Clarisse L. et al (2009), Nature Geoscience, 479-483

[2] Van Damme M. et al (2021), Environ. Res. Lett., 16 055017

[3] Erisman, J. W. et al (2007), Environ. Pollut., 150, 140– 149

[4] Krupa S. V. et al (2003), Environ. Pollut., 124, 179-221 

[5] Dammers E. et al (2019), Atmos. Chem. Phys., 12261–12293

How to cite: Iorga, A., Harrison, J., and Moore, D.: Observing the Ammonia Daily Cycle over Agricultural Areas in Asia Using Combined Satellite Measurements, EGU General Assembly 2024, Vienna, Austria, 14–19 Apr 2024, EGU24-6831, https://doi.org/10.5194/egusphere-egu24-6831, 2024.

EGU24-9742 | ECS | PICO | AS3.19

Infrared emission spectroscopy for trace gas retrievals in the Arctic 

Lukas Heizmann, Mathias Palm, Justus Notholt, and Matthias Buschmann

The solar absorption spectroscopy has been established as a powerful tool to monitor the trace gas composition of the atmosphere and is used in world wide networks such as TCCON (Total Carbon Column Observing Network) and NDACC (Network for Detection of Atmospheric Composition Change). The solar absorption measurements have the disadvantage that in Arctic regions there are no measurements possible during polar night leading to significant gaps in the data record. To fill those gaps we deploy a Bruker Vertex 80 spectrometer in emission geometry at the AWIPEV station in Ny-Ålesund, Svalbard. For highest possible resolution of 0.08 cm⁻¹, one-sided interferograms are recorded. Total power calibration procedures with two reference black bodies developed for double-sided interferograms (having lower resolution) are adjusted to obtain radiometrically calibrated zenith viewing emission spectra. The optimal estimation method is used to retrieve atmospheric water vapor and methane for cloud-free scenes. Results are compared to radiosondes and TCCON measurements. We investigate in detail the influence of black body emissivity and temperature uncertainty as quality check of our setup. The importance of spectral resolution is tested to prepare our retrieval to work with other instruments such as the 1 cm⁻¹ resolution E-AERI deployed during the MOSAiC campaign.

How to cite: Heizmann, L., Palm, M., Notholt, J., and Buschmann, M.: Infrared emission spectroscopy for trace gas retrievals in the Arctic, EGU General Assembly 2024, Vienna, Austria, 14–19 Apr 2024, EGU24-9742, https://doi.org/10.5194/egusphere-egu24-9742, 2024.

EGU24-9756 | PICO | AS3.19

Trans-regional pollution between different areas within South – Eastern Romania is very strong 

Bianca Mihalache, Sabina Stefan, and Gabriela Iorga

High levels of atmospheric pollution degrade air quality, affect the climate and have significant impacts on human health. The climate maps show that the region of South-Eastern Romania (SERO) has started to be to be affected by significant climate changes. Therefore, the spatial variations of the trace gases (NO2, CO, SO2, and O3) by investigating their levels and variations in the atmosphere both from ground based measurements, but also from remote sensing in different areas of this region need to be investigated. The selected sites (urban, suburban and rural types) are subject to different sources of pollution and represent well the pollution spread over a larger area within SERO region. A database (2019-2021) was created for each site considering the ground-based data retrieved from Romanian National Air Quality Network, the remote-sensing data retrieved from the Sentinel 5P TROPOMI instrument and also, for one of the sites studied, we used the data available from Pandonia Global Network Pandora instrument. The meteorological parameters were extracted from the European Centre for Medium-Range Weather Forecasts (ECMWF) Era5 single level products and pressure level products.

During the observation period, univariate and bivariate LISA cluster maps indicate the spatial and temporal behavior is linked to local and regional pollution sources, social behavior and the level of economic development. Trans-regional pollution between different areas within SERO region was found to be very strong. Moreover, the statistical analysis of studied trace gasses (NO2, CO, SO2, and O3) in the areas with lowest concentrations and highest concentrations confirmed the need to take in consideration more factors than just pollution sources (such as traffic, industry type, agricultural and biomass burning activities etc.). Results show that the complexity of atmospheric pollution is related to more than just the identification of pollution sources. It implies the necessity to take into account additional metadata. They also highlights important information on the distribution and variation of selected trace gases, with the potential to help the policy makers in addressing measures to reduce these pollutants.

Acknowledgment: BM work was supported by the University of Bucharest, PhD research grant. The partial support from NO Grants 2014-2021, under Project EEA-RO-NO-2019-0423, contract no 31/01.09.2020 is also acknowledged. We thank R.V. Chiritescu for providing LISA maps.

How to cite: Mihalache, B., Stefan, S., and Iorga, G.: Trans-regional pollution between different areas within South – Eastern Romania is very strong, EGU General Assembly 2024, Vienna, Austria, 14–19 Apr 2024, EGU24-9756, https://doi.org/10.5194/egusphere-egu24-9756, 2024.

After completion of the robot installation on the International Space Station (ISS) in early March 2017 as an external hosted science payload, the Stratospheric Aerosol and Gas Experiment (SAGE) III became the newest member to the family of space-based solar occultation instruments operated by NASA to investigate the Earth’s upper atmosphere since the late 1970s. One of three identical instruments, the SAGE III/ISS mission was revived in the early 2010s with a primary objective to monitor the vertical distribution of aerosol, ozone and other trace gases to enhance understanding of ozone recovery and climate change processes in the upper atmosphere. The 51.6-degree inclined orbit of the ISS is well-suited for solar occultation and provides near-global observations on a monthly basis with coverage of low and mid-latitudes similar to that of the SAGE II mission, which operated over two decades – outliving its platform.  International commitment to continuing ISS as a science outpost throughout this decade enables SAGE III to serve as a bridge to future stratospheric composition missions.

The nominal science products, derived from sampling spectra covering 290nm to 1030nm and a photo-diode near 1550 nm, include high resolution vertical profiles of ozone, nitrogen dioxide and water vapor, along with multi-wavelength aerosol extinction. Although in the visible portion of the spectrum the brightness of the Sun is a million times that of the full Moon, the SAGE III instrument design covers this large dynamic range, performing lunar occultations on a routine basis to augment the solar products. The standard lunar products include ozone and nitrogen trioxide. Routine observations began June 2017 and continue to the present. This has enabled observations of significant perturbations of the stratosphere induced by multiple episodic terrestrial events - wildfires (two of which were record setting) and volcanic eruptions - and dynamical forcings such as phase changes of the Quasi-Biennial Oscillation (QBO).  Here is presented stratospheric variability as represented in the standard SAGE III/ISS data products since 2017.  The stability of observations afforded by the solar occultation technique is superb for quantifying long-term changes in stratospheric composition.  Thus, comparisons with variability recorded by previous SAGE missions are also shown. 

How to cite: Flittner, D., Roell, M., Manion, R., and Leavor, K.: Stratospheric composition variability observed from the International Space Station (ISS) by the Stratospheric Aerosol and Gas Experiment III (SAGE III/ISS), EGU General Assembly 2024, Vienna, Austria, 14–19 Apr 2024, EGU24-14152, https://doi.org/10.5194/egusphere-egu24-14152, 2024.

EGU24-14286 | PICO | AS3.19

Assessing stratospheric aerosols contamination due to space activities 

Jeremie Lasue, Anni Määttänen, Michael Zolensky, François Ravetta, and Augustin Grunewald

The life cycle of a spacecraft starts and ends in the atmosphere: it interacts with the atmosphere right after the launch and during the atmospheric reentry when it usually mostly ablates. Both phases induce emissions of gases and solid particles, providing a source of these components in the middle atmosphere. Little is known about the exact nature, composition and effects of these emissions on the atmosphere and climate, but their impact is expected to rise as more and more orbiting satellites are launched. Ever since the years 2000, the number of space rockets launched per year has increased by a factor 3 globally. At the same time, the number of satellites launched in orbit around the Earth per year has been multiplied by about 30. One may wonder whether changes in the anthropogenic material injected in the terrestrial stratosphere can be detected and what its influence may be. 

In order to study the cosmic dust particles arriving on Earth, the NASA Johnson Space Center (JSC) has been systematically collecting solid dust particles from the Earth’s stratosphere by aircraft equipped with dedicated particle collectors since 1981. So far, 25 catalogs have been published, covering campaigns of collection from 1981 to 2020, with a total of 5071 solid particles that have been preliminary characterized and curated. In this work, we use the preliminary classification of the dust particles. Based on SEM images and X-ray EDS composition the collected dust is separated into four groups: C (Cosmic), TCN (Terrestrial Contaminant Natural), TCA (Terrestrial Contaminant Artificial) and AOS (Aluminum Oxide Sphere). The AOS being mostly generated by solid rocket propellant, they also belong to the TCA class. Our analysis of the data published indicates that from 1980 to 2009 the cosmic dust particles typically represent on average 40% of the collection with TCA and TCN corresponding to about 30% each. In the recent years, the TCA fraction has doubled to about 60% of the collection (2010-2020). This increase in anthropogenic particles is likely due to the overall human space activity and its recent increase. We will present the properties of the solid stratospheric dust particles collected and their evolution with time.

Future work will be dedicated to better classify the natural and anthropogenic particles collected and described in the existing databases. We will use numerical modelling to produce quantitative estimates of the injected mass, the lifetime of particles in the middle atmosphere (stratosphere) and the relative abundance of the anthropogenic particles with respect to the stratospheric background particle population.

How to cite: Lasue, J., Määttänen, A., Zolensky, M., Ravetta, F., and Grunewald, A.: Assessing stratospheric aerosols contamination due to space activities, EGU General Assembly 2024, Vienna, Austria, 14–19 Apr 2024, EGU24-14286, https://doi.org/10.5194/egusphere-egu24-14286, 2024.

EGU24-14910 | PICO | AS3.19

Variability of Total Column CO2, CH4 and CO in the Eastern Mediterranean And Middle East (EMME) Region: Insights from the TCCON Nicosia and AirCore 

Constantina Rousogenous, Christof Petri, Thorsten Warneke, Pierre-Yves Quéhé, Thomas Laemmel, Michel Ramonet, Justus Notholt, Jean-Daniel Paris, Michail Vrekousis, and Jean Sciare

At the crossroads of Europe, Africa, and Asia, the island of Cyprus receives long-range and regional pollution from various anthropogenic and natural sources. To assess the variability and amounts of greenhouse gases (GHG) in the region, we have set up, in 2019, a new Total Carbon Column Observing Network (TCCON) site, the TCCON Nicosia, at The Cyprus Institute. Herewith, we present the first time series of columnar amounts of the main GHGs in the region (Xgas; X stands for total column average dry-air mole fractions), namely carbon dioxide (XCO2), methane (XCH4), nitrous oxide (XN2O), carbon monoxide (XCO) and hydrogen fluoride (XHF). To evaluate the performance of TCCON, an AirCore campaign was conducted in Cyprus in June 2020, providing independent in-situ vertical profiles of CO2, CH4 and CO extending up to the stratosphere. The recent observations of XGHG data, together with the results of the AirCore, are presented. The observed variability in the columnar time series and its possible drivers are discussed.

How to cite: Rousogenous, C., Petri, C., Warneke, T., Quéhé, P.-Y., Laemmel, T., Ramonet, M., Notholt, J., Paris, J.-D., Vrekousis, M., and Sciare, J.: Variability of Total Column CO2, CH4 and CO in the Eastern Mediterranean And Middle East (EMME) Region: Insights from the TCCON Nicosia and AirCore, EGU General Assembly 2024, Vienna, Austria, 14–19 Apr 2024, EGU24-14910, https://doi.org/10.5194/egusphere-egu24-14910, 2024.

EGU24-16374 | PICO | AS3.19

TFMM: Advancing Air Quality Insights and Collaboration within the EMEP Framework   

Joanna Struzewska and Lorenzo Labrador

The Task Force on Measurements and Modelling (TFMM), established in 1999, operates within the framework of the Cooperative Programme for Monitoring and Evaluation of the Long-range Transmission of Air Pollutants in Europe (EMEP). TFMM serves as a platform for the Parties of the United Nations Economic Commission for Europe’s (UNECE) Convention on Long-range Transboundary Air Pollution to exchange knowledge, share experiences, and develop recommendations on air quality issues.   

TFMM offers a valuable opportunity for the Parties and EMEP Centres to engage in discussions regarding the performance of measurements and models. The focus is on getting improvements in methodologies, considering their diverse applications such as national assessments of air quality, evaluation of transboundary fluxes and their impact on air quality, trend analyses, and more.   

Previous initiatives have encompassed comprehensive measurement campaigns and collaborative modelling exercises, contributing to the understanding of atmospheric processes across national borders.   

In the upcoming 2024-2025 work plan a key focus will be a targeted measurement campaign.  Additionally, TFMM aims to conduct a comprehensive modelling exercise specifically geared towards the studying the impact of volatile organic compounds (VOCs) on ozone formation under heatwave conditions. In parallel, the work involves the exploration of the representation of aerosol chemical composition in air quality models.    

Being a hub for collaborative efforts and scientific advancements within the EMEP framework, TFMM extends an open invitation to the scientific community and academia to actively join the TFMM experts’ community.  

How to cite: Struzewska, J. and Labrador, L.: TFMM: Advancing Air Quality Insights and Collaboration within the EMEP Framework  , EGU General Assembly 2024, Vienna, Austria, 14–19 Apr 2024, EGU24-16374, https://doi.org/10.5194/egusphere-egu24-16374, 2024.

EGU24-17788 | PICO | AS3.19

The effect of atmospheric acidity on the reactive nitrogen cycle in Switzerland 

Athanasios Nenes, Andrea Baccarini, and Ali Waseem

Anthropogenic activity has caused a dramatic decrease in biodiversity with an estimated 100-1000 fold larger extinction rate compared to the natural background. This biodiversity loss has profound effects on the functioning and stability of ecosystems and consequent adverse societal and economic impacts. Increased deposition of reactive nitrogen (Nr) is one of the major drivers of biodiversity loss, alongside land-use change, biotic exchange, and climate change. The large increase in the input of anthropogenic Nr to the environment is mainly due to combustion, industrial and agricultural processes. The Nr excess is also responsible for degraded soil quality and groundwater pollution.

Emissions of nitrogen oxides (NOx) and ammonia (NH3) are the primary sources of atmospheric Nr, while nitric acid (HNO3) and NH3 drive most of Nr deposition (more than 90% globally). The cycling of N species in the atmosphere is modulated by aerosol acidity, as it drives the partitioning of each species between the gas and particle phase. In particular, the fraction of HNO3 partitioning to the condensed phase decreases with acidity, whereas NH3 has the opposite behavior. Changes in environmental conditions, namely temperature (T) and relative humidity (RH), directly affect aerosol acidity (e.g., a higher RH increases the aerosol water content and decreases the overall acidity – while T has a strong effect in the partitioning constant). Given the large difference in deposition velocity between gas and particles, it is essential to constrain atmospheric acidity to characterize the atmospheric deposition of Nr accurately.

In our study, we used data from the Swiss National Air Pollution Monitoring Network and the ISORROPIA-Lite model to examine aerosol acidity trends over several years, focusing on two Swiss sites: Payerne (agricultural) and Rigi (prealpine). In Payerne, winter brings increased nitrate but reduced acidity due to higher liquid water content. At Rigi, ammonia and sulfate concentrations peak in late spring and summer, about three times higher than in winter, influenced by nearby farming and atmospheric conditions. Despite these variations, aerosol pH at Rigi remains consistently around 3 to 3.5, balanced by the parallel seasonality of ammonia and sulfate. Over the past 14 years, sulfate levels have halved at both sites, as a result of successful emission reduction policies. However, aerosol acidity has remained largely unaffected due to the buffering capacity of ammonia.

Furthermore, we assessed aerosol sensitivity to changes in ammonia and nitrate, along with their deposition patterns. We find that aerosols remain sensitive to both ammonia and nitrate levels throughout the year, although their deposition regimes vary. For instance, in Payerne, nitrate deposition is rapid in summer but slows down in winter. At Rigi, similar patterns are observed for nitrate, with deposition slowing down on about 50% of winter days. Ammonia deposition is consistently fast at both sites, but it slows down for 10-20% of winter days in Rigi.

We conclude by exploring the consequences of these trends for nitrogen emission control strategies and the impact of energy transitions and future climate scenarios on Switzerland's nitrogen cycle, air quality and policy effectiveness.

How to cite: Nenes, A., Baccarini, A., and Waseem, A.: The effect of atmospheric acidity on the reactive nitrogen cycle in Switzerland, EGU General Assembly 2024, Vienna, Austria, 14–19 Apr 2024, EGU24-17788, https://doi.org/10.5194/egusphere-egu24-17788, 2024.

EGU24-18503 | PICO | AS3.19

Impact of new retrieval settings on time-series and diurnal variation of retrieved ammonia total columns by ground-based remote sensing (OASIS observatory) over Greater Paris 

Pascale Chelin, Rebecca D. Kutzner, Juliette Brochet, Sylvain Caville, Mokhtar Ray, Xavier Landsheere, Juan Cuesta, Guillaume Siour, Yelva Roustan, Frank Hase, and Claude Camy-Peyret

Ammonia (NH3) has direct adverse effects on ecosystems and environment regarding the eutrophication and acidification of soils and water (Cape et al., 2009; Krupa, 2003). As the main alkaline molecule in the atmosphere, NH3 is also a gaseous precursor of other major secondary pollutants, such as inorganic fine particles: sulphate and ammonium nitrate particles (Seinfeld, and Pandis, 2006), which are very harmful to public health. Ammonia is an atmospheric pollutant mainly emitted by agricultural activities (e.g 80% of the emissions worldwide and 95% of the emissions in Europe) (Génermont et al., 2018; Skorupka and Nosalewicz, 2021) with part from traffic that is highly uncertain in urban areas (Cao et al., 2021). Ammonia emissions are projected to increase in the future due to population growth, rise in food demand and climate change.

Despite its environmental impacts, ammonia is one of the least documented precursors of PM2.5 in France which is strongly related to the crucial lack of routine ammonia observations. One of the scientific reasons comes from the difficulty to measure atmospheric ammonia in situ due to its polar, sticky, volatile, and highly water-soluble nature (von Bobrutzki et al., 2010) resulting in strong interactions with sampling systems, recently well documented during the French AMICA* campaign.

An innovative and very promising alternative for monitoring atmospheric ammonia is infrared remote sensing, from the ground or from space. The first multiyear time series of atmospheric NH3 ground-based measurements over a European megacity (Paris) was performed using Observations of the Atmosphere by Solar absorption Infrared Spectroscopy (OASIS) FTIR observatory, based on the NDACC stations’ methodology, and located in the Paris suburbs (France) (Tournadre et al., 2020). In this presentation, we test different a priori profiles and retrieval methods in order to investigate the robustness of the NH3-OASIS retrievals. We show the potential of the observatory to assess diurnal variability of ammonia focusing on spring pollution events such as in March 2012 (Kutzner et al., 2021) and compare the measured NH3-OASIS total columns to simulations from the CAMS data assimilation system (Inness et al., 2019).


*: AMICA consortium : Analysis of Multi-Instrumental Concentrations of Ammonia

References

Cape, J. N., et al., Environmental Pollution, 2009, 157(3), 1033–1037, https://doi.org/10.1016/j.envpol.2008.09.049

Krupa, S. V., Environmental Pollution, 2003, 124, Issue 2, 179–221, https://doi.org/10.1016/S0269-7491(02)00434-7

Seinfeld, J. H. and Pandis, S. N.: Atmospheric Chemistry and Physics: from Air Pollution to Climate Change, third ed., John Wiley & Sons, New York, 1121 pp., 2016

Génermont, S., et al., Data in Brief, 2018, 21, 1119–1124 https://doi.org/10.1016/j.dib.2018.09.119

Skorupka, M., and Nosalewicz, A., Agriculture, 2021, 11(9). https://doi.org/10.3390/agriculture11090822

Cao H., et al., Environmental Science & Technology Letters, 2022 9 (1), 3-9 https://doi.org/10.1021/acs.estlett.1c00730

von Bobrutzki, et al., Atmos. Meas. Tech., 2010, 3, 91–112, https://doi.org/10.5194/amt-3-91-2010

Tournadre, B., et al., Atmos. Meas. Tech., 13, 3923–3937, https://doi.org/10.5194/amt-13-3923-2020, 2020.

Kutzner, R. D., et al., Atmos. Chem. Phys., 21, 12091–12111, https://doi.org/10.5194/acp-21-12091-2021, 2021.

Inness, A., et al., Atmos. Chem. Phys., 19, 3515–3556, https://doi.org/10.5194/acp-19-3515-2019, 2019.

How to cite: Chelin, P., Kutzner, R. D., Brochet, J., Caville, S., Ray, M., Landsheere, X., Cuesta, J., Siour, G., Roustan, Y., Hase, F., and Camy-Peyret, C.: Impact of new retrieval settings on time-series and diurnal variation of retrieved ammonia total columns by ground-based remote sensing (OASIS observatory) over Greater Paris, EGU General Assembly 2024, Vienna, Austria, 14–19 Apr 2024, EGU24-18503, https://doi.org/10.5194/egusphere-egu24-18503, 2024.

Ethane-based chlorofluorocarbons and hydrochlorofluorocarbons can have multiple isomers that are difficult to separate using gas chromatography with detection by electron capture (GC-ECD) or even mass spectrometry (GC-MS). Examples include CFC-113 and CFC-113a; CFC-114 and CFC-114a; CFC-112 and CFC-112a; and HCFC-124 and HCFC-124a.  As a result, atmospheric histories reported in the past by most laboratories for the more abundant isomer can represent an ill-defined combination of both chemicals.  This is especially true for CFC-113 over the past decade, as mole fractions of CFC-113a have increased rapidly during that time and the contribution of this isomer to our understanding of atmospheric changes measured ostensibly for CFC-113 has not been known. Being able to accurately and routinely determine atmospheric abundances for each of these isomers separately from one another is important as these isomers have different environmental impacts (ozone-depleting potentials and global warming potentials) and different sources likely contribute to their emissions.  Here we demonstrate a technique for quantifying the abundances of co-eluting isomers using GC-MS even when ions unique to the different isomers are unavailable.  Initial results for CFC-113 and 113a will be presented that allow a reassessment of the atmospheric decline and global emission rate of CFC-113 over the past decade, and they confirm the rapid increases in the atmospheric abundance of CFC-113a.  Co-variations between the measured CFC-113a atmospheric mole fractions and other gases are observed at particular sites (e.g., Mauna Loa, Hawaii) that help identify regions where CFC-113a emissions are currently substantial, contributing to its rapid global increase.

How to cite: Montzka, S., Vimont, I., Hall, B., and Clingan, S.: Making atmospheric measurements of difficult-to-separate isomers of CFCs routine: a case study of CFC-113 and CFC-113a that refines our understanding of recent atmospheric changes for both of these chemicals., EGU General Assembly 2024, Vienna, Austria, 14–19 Apr 2024, EGU24-19613, https://doi.org/10.5194/egusphere-egu24-19613, 2024.

EGU24-19728 | ECS | PICO | AS3.19

Ten-year air masses contribution study and potential source of specific components in Paris 

Hao Fu, Yao Té, Christof Janssen, Pascal Jeseck, Corinne Boursier, Patrick Marie-Jeanne, and Christian Rouille

The European megacity of Paris with 11 million habitants provides a unique research platform for atmospheric science. Since 2011, our group has continuously operated a high-resolution Fourier-transform infrared spectrometer (FTS-Paris) for the study of atmospheric composition above Paris. The measurements cover alternatively the near-infrared spectral domain related to the TCCON[1] network (since 2014) and the thermal infrared related to NDACC-IRWG[2] network. So far, there has been limited research into the origins of air masses over Paris. However, understanding the dynamics of the air masses over Paris is crucial for comprehending and studying the city’s atmospheric composition. Consequently, we have studied the seasonal variability of the air mass passing through Paris in the period 2011 to 2020 by using the Hybrid Single-Particle Lagrangian Integrated Trajectory (Hysplit) model. Furthermore, we combined our NDACC-IRWG measurement data with simulated trajectories from Hysplit to investigate the characteristics of the potential source of the specific trace gases by applying Weighted Potential Source Contribution Function (WPSCF). The results illustrated that the air masses above Paris were predominantly contributed from the west the north, while the eastern sector, despite its minor contribution, emerged as a significant source of the specific trace gases from the WPSCF results.


[1] Total Carbon Column Observation Network

[2]Network for Detection of Atmospheric Composition Change – Infrared Working Group

How to cite: Fu, H., Té, Y., Janssen, C., Jeseck, P., Boursier, C., Marie-Jeanne, P., and Rouille, C.: Ten-year air masses contribution study and potential source of specific components in Paris, EGU General Assembly 2024, Vienna, Austria, 14–19 Apr 2024, EGU24-19728, https://doi.org/10.5194/egusphere-egu24-19728, 2024.

EGU24-19818 | PICO | AS3.19

The 5-year trend of PM1 and PM2.5 mass concentrations and their carbon content at an urban background site in Zagreb, Croatia 

Ranka Godec, Martina Šilović Hujić, Valentina Gluščić, and Gordana Pehnec

Fine particulate matter, such as PM2.5 and PM1, is a harmful air pollutant from natural and human sources. It impacts the climate and causes respiratory issues. It's classified as a Group 1 carcinogen, and it's the most harmful form of air pollution, causing heart and lung disease and premature death. Aerosols' composition and toxicity vary depending on their source and atmospheric chemistry. The carbon fraction of particulate matter, consisting of both elemental and organic carbon, may cause adverse health effects due to its reductive potential and organic species. It also contributes to global warming due to its radiative properties. Carbonaceous material is a substantial part of particulate matter, with primary organic carbon coming from incomplete combustion and degradation of carbon-containing products. Secondary organic carbon forms through the condensation of organic carbon gases from organic material combustion, fuel evaporation, or natural volatile organic compounds emission.

The objective of this study was to identify and compare the concentrations of elemental carbon (EC) and organic carbon (OC) in PM2.5 and PM1 particles during different seasons and years in order to detect any potential trends of individual pollutants in PM at a single site in Zagreb. Continuous monitoring of mass concentrations of PM1 and PM2.5 particles, along with their carbon content, was carried out for a period of five years, starting from January 1st, 2018, and ending on December 31st, 2022, at an urban background site located in the northern part of Zagreb. Daily samples of PM1 and PM2.5 particle fractions were gathered on pre-fired quartz fiber. Their mass concentrations were determined gravimetrically, while carbon content was analyzed for OC, TC, WSOC, and EC. This was done using the thermal-optical transmittance method, following the EUSAAR_2 protocol. The measurements taken over 5 years showed that the concentration of carbon species in PM1 and PM2.5 varied seasonally. The concentration of carbon pollutants was observed to be higher during cold periods, while it was lower during warmer periods of the 5-year campaign. A weak downward trend in PM1, PM2.5, and OC mass concentrations was observed during the studied period, while EC mass concentrations showed a slight increasing trend.


ACKNOWLEDGEMENTS: These measurements were conducted within the internal scientific project of the Institute for Medical Research and Occupational Health “Organic content of PM1 particle fraction” (PI: R. Godec). The results of this research were obtained using the facilities and equipment funded within the European Regional Development Fund project KK.01.1.1.02.0007 "Research and Education Centre of Environmental Health and Radiation Protection – Reconstruction and Expansion of the Institute for Medical Research and Occupational Health".

How to cite: Godec, R., Šilović Hujić, M., Gluščić, V., and Pehnec, G.: The 5-year trend of PM1 and PM2.5 mass concentrations and their carbon content at an urban background site in Zagreb, Croatia, EGU General Assembly 2024, Vienna, Austria, 14–19 Apr 2024, EGU24-19818, https://doi.org/10.5194/egusphere-egu24-19818, 2024.

EGU24-20001 | PICO | AS3.19

Analysis of UKESM1-StratTrop CCMI2022 experiments with a focus on ozone trends 

Paul Griffiths, James Keeble, and Luke Abraham

The transport of ozone from the stratosphere to the troposphere is a key contributor to the tropospheric ozone budget. It is estimated that the stratosphere-to-troposphere flux of ozone (STT) leads to ~500 Tg of ozone transported into the troposphere each year, which is comparable to the net chemical production of ozone within the troposphere. 

We will present an analysis of the tropospheric ozone budget in the CCMI2022 experiments performed with UKESM-StratTrop, a whole atmosphere chemistry-climate model. 

We focus on the specified dynamics experiments covering 1982-2018, during which there was significant ozone depletion.  We intercompare the ozone budget from the derived using the complementary approaches of Ox and Oy species, and use idealised tracers to examine in detail the role of stratosphere-to-troposphere transport on tropospheric composition.  Where possible, these model simulations are compared with in-situ calculation of ozone production and loss rates derived from observations.

How to cite: Griffiths, P., Keeble, J., and Abraham, L.: Analysis of UKESM1-StratTrop CCMI2022 experiments with a focus on ozone trends, EGU General Assembly 2024, Vienna, Austria, 14–19 Apr 2024, EGU24-20001, https://doi.org/10.5194/egusphere-egu24-20001, 2024.

EGU24-287 | ECS | Posters on site | AS3.20

Effect of National Clean Air Programme on radiative forcing over India 

Diljit Kumar Nayak, Gazala Habib, and Sri Harsha Kota

Alarmingly high particulate matter (PM) levels are frequently blamed for India's poor air quality. As a result, the government has developed a few measures to regulate PM in the nation. For instance, the National Clean Air Plan (NCAP) was introduced in 2019 with the goal of bringing down PM concentrations in non-attainment cities (NAC) by 40% by 2026. This study endeavors to evaluate the accuracy of emission inventories in replicating the satellite observed AOD for the Indian region, and to identify the most suitable emission inventory among the available options for the common baseline year of 2015. Four databases (three global and one regional) that furnish emission estimates for air pollutants in India, which include EDGARv5, REASv3.2, ECLIPSE V6b and SMOGv1 were analysed.Simulations were conducted for different seasons using WRF-Chem V3.8.1. The key finding of the study is that SMOG emerged as the best performing emission inventory among all databases across all seasons, with an average Root Mean Square Error (RMSE) of 0.41 for the entire year. The simulations were performed with emissions projected for the years 2019 and 2026 from the best emission inventory obtained and fixing the Land use Land Cover (LULC) and meteorology. A decrease of 52.15 W/m2 in surface radiative forcing was observed across the Eastern India for the simulation period. This study provides valuable insights to India's regulatory bodies, highlighting the need to prioritize on source specific emission reduction to effectively combat the alarming increase in radiative imbalance which drives the climate change.

How to cite: Nayak, D. K., Habib, G., and Kota, S. H.: Effect of National Clean Air Programme on radiative forcing over India, EGU General Assembly 2024, Vienna, Austria, 14–19 Apr 2024, EGU24-287, https://doi.org/10.5194/egusphere-egu24-287, 2024.

EGU24-398 | ECS | Orals | AS3.20

Effects of Elevated Ozone Concentrations on Evergreen Shrubs in Delhi, India 

Pratibha Anand, Sri Harsha Kota, and Usha Mina

Tropospheric ozone (O3), a potent greenhouse gas and secondary air pollutant, stands out as a major photochemical pollutant, posing a considerable threat to plant life. Prolonged exposure to this gas triggers adverse changes in various plant parameters, hindering growth, and hastening senescence. This makes increasing ambient O3 concentrations an urgent environmental concern. An essential aspect of addressing this issue lies in comprehending the mechanisms underlying O3 resistance in plants, particularly for fostering sustainable urban greening in polluted environments. Certain indicative plant parameters, including morphological characteristics, and biochemical and antioxidant capacity, play pivotal roles in regulating the variation in O3 resistance. However, the specific contributions of each trait remain somewhat elusive and understudied. Moreover, O3 resistance exhibits significant variability within and across plant species, influenced by factors such as the timing of O3 exposure and the plant's developmental stage. The present study delves into the nuances of O3 sensitivity among four evergreen shrub species—Bougainvillea glabra, Buxus sempervirens, Duranta goldiana, and Ficus panda—that are commonly chosen for roadside plantations in Delhi. The selected species were exposed to elevated ozone concentrations, in a controlled fashion, in Open-Top Chambers (OTCs) for an entire growing season. The study examined changes in photosynthetic pigments (total chlorophyll, carotenoid), antioxidant capacity (ascorbic acid), and lipid peroxidation. The findings revealed significant discernible impacts of ozone fumigation alongside ambient air concentration. Compared to control samples (ambient air exposure conditions), under elevated ozone treatment, chlorophyll content and total carotenoid levels decreased substantially, while the ascorbic acid content and lipid peroxidation levels increased. Species that underwent the highest decrease in chlorophyll (C) content are the species that experienced the lowest increase in ascorbic acid (AA) levels, and vice versa (i.e., B. sempervirens [C-34.27%, AA+20.83%], D. goldiana [C-25%, AA+35.95%], F. panda [C-23.85%, AA+54.12%], and B. glabra [C-18%, AA+55.27%]). Based on the parametric changes observed in the considered species, it can be concluded that B. glabra is the most appropriate species (followed by F. panda) for systematic urban plantation in areas with high O3 concentrations as it exhibited the highest tolerance. This research contributes valuable insights for selecting suitable plant species in ozone-polluted areas, facilitating environmentally conscious decision-making for the establishment of resilient and sustainable urban green spaces.

How to cite: Anand, P., Kota, S. H., and Mina, U.: Effects of Elevated Ozone Concentrations on Evergreen Shrubs in Delhi, India, EGU General Assembly 2024, Vienna, Austria, 14–19 Apr 2024, EGU24-398, https://doi.org/10.5194/egusphere-egu24-398, 2024.

EGU24-1134 | ECS | Orals | AS3.20 | Highlight

Secondary Effects of Oil and Gas End-Use on Summertime Air Pollutants in the Eastern US 

Karn Vohra, Eloise Marais, Ploy Achakulwisut, Gongda Lu, Jamie Kelly, Colby Francoeur, Colin Harkins, and Brian McDonald

Oil and gas account for more than two-thirds of energy consumed in the US. The high-temperature combustion from this use yields large quantities of nitrogen oxides (NOx) that modulate the oxidative fate of isoprene, a precursor of health-hazardous air pollutants ozone, formaldehyde, and fine particulate matter (PM2.5). The COVID-19 pandemic and resulting lockdowns provided a unique opportunity to examine changes in ozone and PM2.5 linked to dramatic reduction in vehicle emissions. These occurred mostly in early spring when photochemistry is weak, biogenic emissions of isoprene are nascent, and ozone is titrated by vehicular nitric oxide (NO) emissions. Here, we use the 3D chemical transport model GEOS-Chem nested over contiguous US at a spatial resolution of 0.25º × 0.3125º (~28 km latitude × ~27 km longitude) to examine the complex influence of all oil and gas consumption or end-use activities on summertime (June-August) air pollutants in the eastern US where large cities, roadways and seasonal isoprene emission hotspots coincide. The model is driven with air pollutant precursor emissions for end-use activities from the US EPA National Emissions Inventory (NEI) for non-mobile sources and from the Fuel-based Inventory for Vehicular Emissions (FIVE) for mobile sources. We find that in the eastern US, end-use activities account for most NOx (59% of NO and 57% of nitrogen dioxide, NO2) and most (63% or 0.28 µg m-3) aerosol-phase nitrate. As ammonia, predominantly from agricultural activity, buffers aerosol acidity, end-use activities also indirectly contribute to 21% (0.10 µg m-3) of aerosol-phase ammonium. The influence on aerosol sulfate is negligible. NO from oil and gas end-use activities also modulates the proportion of isoprene that oxidizes via the NO and HO2 pathways that in turn affects yields of formaldehyde and other reactive oxygenated volatile organic compounds (VOCs) as well as isoprene secondary organic aerosol (SOA) precursors. NOx from oil and gas end-use activities enhances formaldehyde abundance by 0.3 ppb by increasing the proportion of isoprene reacting via the NO oxidation pathway that yields formaldehyde (and other oxygenated VOCs) promptly and in higher yields than the competing HO2 (low-NOx) oxidation pathway. This influence on reactive VOCs also adds 8 ppb of maximum daily mean 8-hour ozone, the metric used to assess the impact of ozone on health. Suppression of the HO2 oxidation pathway and isoprene SOA precursors only decreases SOA by 0.02 µg m-3. The net contribution of oil and gas end-use activities to PM2.5 is 1.2 µg m-3 or 12% of eastern US summertime mean PM2.5. Our results suggest multiple, substantial improvements to summertime air quality by ending reliance on oil and gas.

How to cite: Vohra, K., Marais, E., Achakulwisut, P., Lu, G., Kelly, J., Francoeur, C., Harkins, C., and McDonald, B.: Secondary Effects of Oil and Gas End-Use on Summertime Air Pollutants in the Eastern US, EGU General Assembly 2024, Vienna, Austria, 14–19 Apr 2024, EGU24-1134, https://doi.org/10.5194/egusphere-egu24-1134, 2024.

EGU24-2370 | Posters on site | AS3.20

Main findings from Chinese team of the DFG-NSFC Sino-German AirChanges project 

Hongliang Zhang, Yele Sun, Hongli Wang, and Peng Wang

The DFG-NSFC project titled ”Air pollution over China and the unwanted effects of mitigation strategies” aims to understand why ozone is increasing in response to air pollution mitigation strategies. In the project, the established Sino-German collaboration of atmospheric scientists proposed to analyze the key factors that have driven surface ozone concentrations in response to the imposed emission control measures. After three-year hard work, the project is coming to an end and more than 10 papers were published supported by the project. This presentation aims to summarize the outcomes from the Chinese team, including Fudan University, Institute of Atmospheric Physics, Chinese Academy of Sciences, and Shanghai Academy of Environmental Sciences.

How to cite: Zhang, H., Sun, Y., Wang, H., and Wang, P.: Main findings from Chinese team of the DFG-NSFC Sino-German AirChanges project, EGU General Assembly 2024, Vienna, Austria, 14–19 Apr 2024, EGU24-2370, https://doi.org/10.5194/egusphere-egu24-2370, 2024.

EGU24-2667 | Orals | AS3.20

Trends of trace gases and aerosol over 2003-2023 at Mount Tai, northern China 

Likun Xue, Tao Wang, Jian Gao, Jianmin Chen, Yujiao Zhu, Liang Wen, Hongyong Li, Lei Sun, Tianshu Chen, Lingxiao Yang, Yong Zhao, Zhaoxin Guo, and Wenxing Wang

China has been experiencing fast-paced urbanization and industrialization as well as stringent air pollution control in the past decades, which are expected to cause drastic changes in the anthropogenic emissions of primary air pollutants (e.g., SO2, NOx and VOCs). Long-term observations are fundamental to the assessment of response of atmospheric composition to the changing anthropogenic emissions, which are, however, very limited in China. Here we integrated the observational data of trace gases and aerosol obtained during 2003-2023 at Mount Tai – the peak of the North China Plain (1534 m above sea level), a highly polluted region of China. The data were analyzed to understand the long-term changes of a variety of trace gases and aerosol properties such as ozone (O3), PM2.5 composition, particle number and size distribution, new particle formation and growth parameters, and O3 depleting substances (ODS). Surface O3 concentrations showed a significant increasing trend in summertime with a rate of ~2 ppbv yr-1, despite the persistent decrease in NOx emissions since 2012, and can be attributed to the increasing VOCs and O3 production efficiency. Sharp reduction in SO2 emissions have resulted in significant decrease of sulfate in PM2.5, whilst nitrate showed a strong increasing trend. A multi-phase chemical box model illustrated that the reduced SO2 and sulfate enhanced nitrate formation by lessening the aerosol acidity and facilitating the partitioning of HNO3 to the particle phase. The apparent formation rate of new particles in spring has increased at Mt. Tai, while the particle growth rate significantly decreased. The contributions of new particles to the cloud condensation nuclei (CCN) were also decreasing. The ODS regulated by the Montreal Protocol (MP) showed a significant downward trend, but the MP-controlled and unregulated halocarbon species showed overall upward trends. We will also present the results about the impacts of COVID lockdown on the regional air quality as observed at Mt. Tai.

How to cite: Xue, L., Wang, T., Gao, J., Chen, J., Zhu, Y., Wen, L., Li, H., Sun, L., Chen, T., Yang, L., Zhao, Y., Guo, Z., and Wang, W.: Trends of trace gases and aerosol over 2003-2023 at Mount Tai, northern China, EGU General Assembly 2024, Vienna, Austria, 14–19 Apr 2024, EGU24-2667, https://doi.org/10.5194/egusphere-egu24-2667, 2024.

EGU24-2732 | ECS | Orals | AS3.20

Trends and drivers of aerosol vertical distribution over China from 2013 to 2020: Insights from integrated observations and modeling 

Xi Chen, Ke Li, Ting Yang, Zhenjiang Yang, Xueqing Wang, Bin Zhu, Lei Chen, Yang Yang, Zifa Wang, and Hong Liao

Understanding aerosol vertical distribution is of great importance to climate change and air quality management, but there is a dearth of systematical analysis for aerosol vertical distribution amid rapid emission decline after 2013 in China. Here, the GEOS-Chem model and multiple-sourced observations were applied to quantify the changes of aerosol vertical distributions in response to clean air actions. In 2013–2020, the MODIS aerosol optical depth (AOD) presented extensive decreasing trends by −7.9 %/yr to −4.2 %/yr in summer and −6.1 %/yr to −5.8%/yr in winter in polluted regions. Vertically, the aerosol extinction coefficient (AEC) from CALIPSO decreased by −8.0 %/yr to -5.5 %/yr below ~1 km, but the trends weakened significantly with increasing altitude. Compared with available measurements, the model can reasonably reproduce 2013–2020 trends and seasonality in AOD and vertical AECs. Model simulations confirm that emission reduction was the dominant driver of the 2013–2020 decline in AOD, while the effect of meteorology varied seasonally, with contributions ranging from −2% to 13% in summer and −67% to −2% in winter. Vertical distributions of emission-driven AEC trends strongly depended on emission reductions, local planetary boundary layer height, and relative humidity. For aerosol components, sulfate accounted for ~50% of the AOD decline during summer, followed by ammonium and organic aerosol, while in winter the contribution of organic aerosol doubled (24%–35%), and nitrate exhibited a weak increasing trend. Chemical production and meteorological conditions primarily drove the nitrate contribution, but emission reduction and hygroscopicity were decisive for other components. This work highlights the importance of integrating observational and modeling efforts to better understand rapid changes in aerosol vertical distribution over China.

How to cite: Chen, X., Li, K., Yang, T., Yang, Z., Wang, X., Zhu, B., Chen, L., Yang, Y., Wang, Z., and Liao, H.: Trends and drivers of aerosol vertical distribution over China from 2013 to 2020: Insights from integrated observations and modeling, EGU General Assembly 2024, Vienna, Austria, 14–19 Apr 2024, EGU24-2732, https://doi.org/10.5194/egusphere-egu24-2732, 2024.

EGU24-3001 | ECS | Posters on site | AS3.20

Responses of ecosystem productivity to anthropogenic ozone and aerosols at 2060 under different emission scenarios 

Xinyi Zhou, Xu Yue, and Chenguang Tian

Anthropogenic emissions contribute a significant percentage to surface ozone (O3) and aerosols globally. The rate of plant photosynthesis, which represents the capability of terrestrial ecosystems to sequester carbon dioxide (CO2), is significantly affected by anthropogenic air pollutants. While the changes in anthropogenic emissions perturb atmospheric components, their consequent impacts on ecosystem productivity in the future climate remain unclear. Here, we apply a fully coupled climate-vegetation-chemistry model, ModelE2-YIBs, to explore the effects of O3 and aerosols from anthropogenic emissions on global gross primary productivity (GPP) under both present-day and different future emission scenarios at 2060. At the present day, anthropogenic air pollutants induce a GPP loss of -1.67 Pg[C] (-4%) in boreal summer with the contributions of -2.18 Pg[C] by O3 and +0.52 Pg[C] by aerosols. At 2060, the detrimental effect of air pollutants on GPP is exacerbated to -1.85 Pg[C] under a high emissions scenario but alleviated to -0.59 Pg[C] under a low emission scenario. The mitigated GPP loss in the latter scenario is owing to the effective control of anthropogenic emissions that on average reduces surface O3 concentrations by 8.14 ppbv globally relative to 2010. Although the CO2 fertilization effect is weaker in the low emission scenario, the strong decline in air pollutants brings additional GPP gains compared to the high scenario. Regionally, such GPP amelioration is close to or even outweighs the CO2 fertilization effect in eastern China and U.S., suggesting that the deep cut of anthropogenic emissions can effectively promote future ecosystem productivity through the reduction of O3 and aerosols over the nowadays polluted regions.

How to cite: Zhou, X., Yue, X., and Tian, C.: Responses of ecosystem productivity to anthropogenic ozone and aerosols at 2060 under different emission scenarios, EGU General Assembly 2024, Vienna, Austria, 14–19 Apr 2024, EGU24-3001, https://doi.org/10.5194/egusphere-egu24-3001, 2024.

In addition to causing atmospheric pollution, anthropogenic emissions also have impacts on ecosystems through atmospheric deposition, e.g., acidification and eutrophication owing to acid deposition (i.e., sulfur and nitrogen deposition). China currently has the globally highest acid deposition, yet research on its status, impacts, causes, and controls is lacking. Here, we compiled data and calculated critical loads regarding acid deposition. The results showed that the abatement measures in China have achieved a sharp decline in the emissions of acidifying pollutants and a continuous recovery of precipitation pH, despite the drastic growth of the economy and energy consumption. However, the risk of ecological acidification and eutrophication showed no significant decrease. With similar emission reductions, the decline in areas at risk of acidification in China (7.0%) lags behind Europe (20%) or the USA (15%). This was because, unlike Europe and the USA, China's abatement strategies primarily target air quality improvement rather than mitigating ecological impacts. Given that the area with the risk of eutrophication induced by nitrogen deposition remained at 13% of the country even under the scenario of achieving the dual targets of air quality and carbon dioxide mitigation in 2035, we explored an enhanced ammonia abatement pathway. With a further 27% reduction in ammonia by 2035, China could largely eliminate the impacts of acid deposition. This research serves as a valuable reference for China's future acid deposition control and for other nations facing similar challenge.

How to cite: Yu, Q.: Atmospheric deposition and its impacts in China over the last four decades and beyond, EGU General Assembly 2024, Vienna, Austria, 14–19 Apr 2024, EGU24-3034, https://doi.org/10.5194/egusphere-egu24-3034, 2024.

In many parts of the world, ambient O3 levels have increased despite regulatory efforts to improve O3 air quality. The unexpectedly increasing O3 levels are largely attributed to a lack of understanding about O3 chemical regimes. The O3 mitigation strategies related to precursor gas emission controls have not adequately considered the O3 chemical regimes (NOx-limited or VOC-limited conditions). This study develops a novel approach to identifying the spatiotemporal variations of O3 chemical regimes collectively using ground and satellite data to support the decision-making of precursor gas emission controls. Using ground NO2 and O3 concentrations measured in both the Seoul Metropolitan Area (SMA) of the Republic of Korea and the LA County of California, U.S. for May 2018-April 2021, a mixed effects model is employed to generate daily relationships between NO2 and O3 concentrations. Positive and negative relationships between NO2 and O3 concentrations provide strong evidence of NOx-limited and VOC-limited conditions, respectively. Satellite data on TROPOspheric Monitoring Instrument (TROPOMI) HCHO/NO2 ratios represent relative NOx-sensitivity or VOC-sensitivity (i.e., higher and lower ratios indicating increasing NOx-sensitivity and VOC-sensitivity, respectively). The modeling and satellite approaches are complementary to each other because (1) the model does not account for VOC concentrations due to a lack of VOC measurements and (2) TROPOMI HCHO/NO2 alone does not provide the threshold level of separating NOx-limited from VOC-limited conditions. The monthly slopes of NO2 concentrations against O3 concentrations are highly correlated with monthly TROPOMI HCHO/NO2 both in the SMA (0.75) and LA County (0.87). Threshold levels distinguishing NOx- from VOC-limited conditions are defined by the TROPOMI HCHO/NO2 values when the NO2 slopes are equal to 0. In the SMA and LA County, the threshold levels are 3.0 (95% CI= 2.6-3.4) and 1.4 (95% CI= 1.3-1.6), respectively. During the study period, the O3 chemical regime is mostly VOC-limited in the SMA (35 out of 36 months), meaning that NOx emission controls can worsen O3 air quality until the O3 chemical regime reaches NOx-limited conditions. In the SMA, VOC emission controls can help reduce the O3 levels. On the other hand, in LA County, the O3 chemical regimes transition from VOC-limited to NOx-limited conditions during the warm seasons and vice versa during the cool seasons, depending on the seasonality of NOx and VOC emissions. The O3 mitigation strategies in LA County can be the most effective with season-specific emission controls. This study offers a novel method for determining the most effective strategy of precursor gas emission controls and informing decision-making to enhance O3 air quality.

How to cite: Lee, H. J.: Developing a novel decision support tool for improving O3 air quality through strategic precursor gas emission controls, EGU General Assembly 2024, Vienna, Austria, 14–19 Apr 2024, EGU24-5074, https://doi.org/10.5194/egusphere-egu24-5074, 2024.

EGU24-5485 | ECS | Posters on site | AS3.20

The Analysis of Changes in Particulate Matter Concentrations in East Asia before and after COVID-19 

Eun-Seong Son, HyeunSoo Kim, Peel-Soo Jeong, Kyung-Hui Wang, Seung-Hee Han, and Hui-young Yun

The COVID-19 pandemic commenced at the end of 2019, inducing a substantial decline in human activities across various sectors, encompassing industry, economy, tourism, and daily life globally. This resulted in a reduction in anthropogenic pollutant emissions.

The concentration of fine particulate matter in the atmosphere incorporates influences from both artificial and natural emission sources. East Asia is also notable for experiencing frequent occurrences of yellow dust.

Nonetheless, studies conducted by Bae et al. (2023) and Zhang et al. (2020) reported that PM10 concentrations in Korea and China decreased by more than 30% following the emergence of COVID-19. This phenomenon has been commonly observed worldwide.

This study delves into whether air quality is deteriorating again now that the pandemic has subsided. It examines long-term changes in air quality in East Asia, covering the Pre-COVID-19 and Post-COVID-19 periods, utilizing measurement data. To enhance reliability, the data were obtained from a nationally operated atmospheric measurement station. In addition to PM10, changes in the concentration of gaseous pollutants such as NO2 and SO2 were also analyzed.

In instances where changes in air quality occurred, an analysis was conducted to determine whether these changes correlated with human activities. The study explored whether yearly and seasonal weather changes acted as variables and whether air quality fluctuations in urban and rural areas exhibited disparities. Statistical methods such as regression analysis were employed.

This study analyzes the impact of human activities on the concentration of fine particulate matter in East Asia and offers implications for the direction of national policies aimed at improving air quality.

Reference:

Minah Bae, Yoon-Hee Kang, Eunhye Kim, Segi Kim, Soontae Kim (2023), A multifaceted approach to explain short- and long-term PM2.5 concentration changes in Northeast Asia in the month of January during 2016–2021, Science of the Total Environment, Volume 880, https://doi.org/10.1016/j.scitotenv.2023.163309

Zhang, J., Cu i, K., Wang, Y.F., Wu , J.L., Hu ang, W.S., Wan, S., and Xu, K. (2020), Temporal variations in the air quality index and the impact of the COVID-19 event on air quality in western China, erosol and Air Quality Research, Vol. 20, No. 7, pp. 1552-1568. https://doi.org/10.4209/aaqr.2020.06.0297

Acknowledgments:

This research was supported by Particulate Matter Management Specialized Graduate Program through the Korea Environmental Industry & Technology Institute (KEITI) funded by the Ministry of Environment (MOE)

How to cite: Son, E.-S., Kim, H., Jeong, P.-S., Wang, K.-H., Han, S.-H., and Yun, H.: The Analysis of Changes in Particulate Matter Concentrations in East Asia before and after COVID-19, EGU General Assembly 2024, Vienna, Austria, 14–19 Apr 2024, EGU24-5485, https://doi.org/10.5194/egusphere-egu24-5485, 2024.

EGU24-7141 | ECS | Orals | AS3.20

Deep learning-derived anthropogenic and meteorological drivers of surface ozone change in China 

Min Wang, Xiaokang Chen, Tai-Long He, Zhe Jiang, Jane Liu, Hong Liao, Dylan Jones, and Yanan Shen

Urban air pollution continues to pose a significant health threat, despite regulations to control emissions. Here we present a comparative analysis of the anthropogenic and meteorological drivers of surface ozone (O3) change in China by integrating deep learning (DL) and chemical transport model (CTM) methods. The DL method suggests volatile organic compound (VOC)-limited regimes in urban areas over northern inland China in contrast to strong nitrogen oxides (NOx)-limited regimes in GEOS-Chem simulations. Sensitivity analysis indicates that the inconsistent O3 responses are partially caused by the inaccurate representation of O3 precursor concentrations at the locations of urban air quality stations in the simulations. The DL method exhibits possible weakened anthropogenic contributions to surface O3 rise in the North China Plain, for example, 1.53 and 0.54 ppb/y in 2015-2019 and 2019-2021, respectively. Similarly, GEOS-Chem simulations suggest an accelerated decrease in surface O3 concentrations driven by the decline in nitrogen dioxide (NO2) concentrations. Furthermore, both DL and GEOS-Chem models suggest the reverse of meteorological contributions to the observed O3 change in the North China Plain in 2019-2021, which is mainly resulted from the reversed changes in meteorological variables in surface air temperature and relative humidity. This work highlights the importance of DL as a supplement to CTM-based analysis. The derived O3 drivers are helpful for making effective regulatory policies to control O3 pollution in China.

How to cite: Wang, M., Chen, X., He, T.-L., Jiang, Z., Liu, J., Liao, H., Jones, D., and Shen, Y.: Deep learning-derived anthropogenic and meteorological drivers of surface ozone change in China, EGU General Assembly 2024, Vienna, Austria, 14–19 Apr 2024, EGU24-7141, https://doi.org/10.5194/egusphere-egu24-7141, 2024.

EGU24-7384 | ECS | Posters on site | AS3.20

Effects of efforts to reduce air pollutants such as PM2.5 on increasing surface ozone concentrations 

Peel-Soo Jeong, Kyung-Hui Wang, Eun-Seong Son, Hyeun-Soo Kim, Seung-Hee Han, and Hui-young Yun

Global climate change and increased air pollutant emissions in East Asia have led to an increase in tropospheric ozone concentrations, especially in South Korea.

In order to reduce both particulate matter (PM2.5) and ozone concentrations in Korea, efforts to reduce emissions of precursors (NO2, VOCs) and particulate matter have been implemented, and as a result, the concentration of particulate matter has been continuously reduced. However, contrary to expectations, ozone concentrations have continued to increase, and the trend is that both the annual average concentration as well as the number and duration of high concentration ozone events are increasing.

Factors affecting tropospheric ozone production are very diverse and complex, including climate change, emission characteristics of precursors (NOx, VOCs) and resulting changes in atmospheric chemical species, changes in chemical reactions due to changes in atmospheric aerosols, natural source VOCs, long-range transport of ozone and precursors, geography and topography, and differences in ozone production characteristics between countries, cities, and regions.

While there are global influences such as climate change and long-distance transport of high ozone concentrations from neighboring countries that are responsible for the increase in ozone concentrations in Korea, there is also evidence from various observations that suggests that due to the non-linear relationship between ozone production and its precursors, air pollutant reduction efforts are contributing to the increase in ozone concentrations by changing the local atmospheric chemical composition.

The study analyzes changes in ozone precursor emissions, atmospheric chemical composition, and aerosol concentrations resulting from efforts to reduce various air pollutants, including particulate matter and ozone, and ultimately provides insight into how air pollution mitigation efforts are contributing to increased ozone concentrations.

The insights are expected to clarify existing understanding of the limiting conditions and chemical reactors for NOx and VOCs involved in ozone formation in urban areas, and to provide evidence and ideas for further understanding.


Acknowledgments

This research was supported by Particulate Matter Management Specialized Graduate Program through the Korea Environmental Industry & Technology Institute(KEITI) funded by the Ministry of Environment(MOE)

How to cite: Jeong, P.-S., Wang, K.-H., Son, E.-S., Kim, H.-S., Han, S.-H., and Yun, H.: Effects of efforts to reduce air pollutants such as PM2.5 on increasing surface ozone concentrations, EGU General Assembly 2024, Vienna, Austria, 14–19 Apr 2024, EGU24-7384, https://doi.org/10.5194/egusphere-egu24-7384, 2024.

EGU24-7775 | ECS | Orals | AS3.20

PM2.5 and nitrogen deposition mitigation under agricultural ammonia emission reduction in Beijing-Tianjin-Hebei region, China 

Lu Li, Lin Zhang, Xuejun Liu, Yixin Guo, Jiayu Xu, Xingpei Ye, Danyang Li, and Zehui Liu

Ammonia emissions in China mainly came from agricultural activities. Excess emissions could lead to degraded air quality and excess nitrogen deposition. Therefore, it is essential to improve air quality and nitrogen deposition through agricultural ammonia reduction measures. On the basis of the existing research, this study established an Agricultural Management Technology-Ammonia emission assessment platform with 51 measures of fertilizer application and 53 measures of livestock farming derived from a literature review and adopted the Monte Carlo method to apply this platform to Beijing-Tianjing-Heibei (BTH) region where active agricultural activities occur. An updated agricultural ammonia emission inventory at 3-km resolution in BTH region was used in this study. 

We find that ammonia emissions from livestock farming could be reduced by 79-151Gg (30%-57%) and from fertilizer application by 58-163Gg (18%-51%) in BTH region in 2019. We applied two reduction scenarios that could achieve average and maximum ammonia emission reduction based on the Monte Carlo results, and evaluated the resulting improvements of air quality and deposition using the GCHP model with a resolution of 10km × 10km in BTH region.

The results show that the baseline of PM2.5 concentration, NHX and NOy deposition in BTH region in 2019 is 27-61 µg/m3, 8-57 Gg N/month and 3-51 Gg N/month. Under two ammonia emission reduction scenarios, PM2.5 concentration and NHx deposition would, respectively, reduce 1.38-3.89 µg/m3, 3-14 Gg N/month while NOy deposition would increase 0.5-2 Gg N/month. Our research shows that agricultural ammonia has great emission reduction potential that would benefit to the reduction of nitrogen pollution.

How to cite: Li, L., Zhang, L., Liu, X., Guo, Y., Xu, J., Ye, X., Li, D., and Liu, Z.: PM2.5 and nitrogen deposition mitigation under agricultural ammonia emission reduction in Beijing-Tianjin-Hebei region, China, EGU General Assembly 2024, Vienna, Austria, 14–19 Apr 2024, EGU24-7775, https://doi.org/10.5194/egusphere-egu24-7775, 2024.

The formation of secondary organic aerosols (SOA) is inextricably linked to the photo-oxidation of aromatic hydrocarbons. However, models still exhibit biases in representing the mass and chemical composition of SOA. We implemented a box model coupled with a near-explicit photochemical mechanism, the Master Chemical Mechanism (MCMv3.3.1) to simulate a series of chamber studies and access model biases in simulating SOA from representative aromatic hydrocarbons. The box model underpredicted SOA yields of toluene and xylenes by 4.7–100%, which could be improved by adjusting the saturation vapor pressure (SVP) of their oxidation products. After updating the SVP values, the mass concentration of TX SOA in the Yangtze River Delta region during summer was doubled, and there was also an approximated 3% enhancement in the total SOA. In comparison to a lumped mechanism used for simulating TX SOA, MCM predicted similar mass concentrations but exhibited different volatility distributions and oxidation states.

How to cite: Li, J., Lu, H., Huang, Q., Ying, Q., Qin, M., and Hu, J.: Simulation of Regional Secondary Organic Aerosol Formation From Monocyclic Aromatic Hydrocarbons using a Near-Explicit Chemical Mechanism Constrained by Chamber Experiments , EGU General Assembly 2024, Vienna, Austria, 14–19 Apr 2024, EGU24-9640, https://doi.org/10.5194/egusphere-egu24-9640, 2024.

Regional transport plays a crucial role in the pollution of fine particulate matter (PM2.5) over the Yangtze River Delta region (YRD). A practical joint regional emission control strategy requires quantitative assessment of the contribution of regional transport. In this study, the contribution of inter-city transport to PM2.5 among the 41 cities in the YRD region were quantitatively estimated using a source-oriented chemical transport model, and then the relationship between the cumulative contribution of regional transport and the distance was examined using the Michaelis-Menten equation. The results show that the Michaelis-Menten equation is suitable to represent the relationship between the cumulative contribution and transport distance. The coefficient of determination (r2) of the fittings is greater than 0.9 in 71% of the cases in the six subregions and four seasons in YRD. Two key parameters in the Michaelis-Menten equation K1, indicating the maximum contribution of regional transport, and K2, indicating the distance to which the regional transport contribution reach half the maximum contribution, show substantial regional and seasonal variations. The average K1 is 73.6%, with lower values observed in the northern part of the YRD and higher values in central Jiangsu. K2 is larger in northern Jiangsu, as well as central and southern Zhejiang. The local contribution in autumn and winter is lower than that in spring and summer in the northern part of the YRD. Particularly in northern Jiangsu, the local contribution reaches 90.4% in summer but drops to 53.0% in autumn and winter, illustrating significant impacts of regional transport to PM2.5 in autumn and winter in this area. K2 is larger on polluted days, compared to clean days, indicating greater contributions from regional transport to PM2.5 in YRD. The results can serve as a scientific foundation for implementing regional joint prevention and control measures in the YRD region.

How to cite: Hu, J., Gong, K., and Xie, X.: Seasonal quantification of the inter-city transport of PM2.5 in the Yangtze River Delta region of China based on a source-oriented chemical transport model and the Michaelis-Menten equation, EGU General Assembly 2024, Vienna, Austria, 14–19 Apr 2024, EGU24-10550, https://doi.org/10.5194/egusphere-egu24-10550, 2024.

EGU24-11502 | Orals | AS3.20

Aviation NOx emissions and their increasing impact on global surface air quality 

Sebastian Eastham, Guillaume Chossière, Raymond Speth, Daniel Jacob, and Steven Barrett

Although the impacts of aviation NOx on local air quality are well-researched, the effects on climate and global air quality are disputed. With the aviation sector under pressure to reduce its contributions to climate change, some studies have suggested that fuel efficiency be prioritized over reductions in aviation NOx emissions. As a result, while emissions of NOx have declined rapidly in other sectors, the amount of NOx emitted per kilogram of aviation fuel burned is estimated to have increased by 17% between 1990 and 2018 with corresponding - and continuing - growth in environmental impact. We use a global atmospheric chemistry-transport model to simulate, at high resolution, the global air quality impacts of aviation, finding that emissions of cruise altitude NOx specifically are associated with the majority of aviation's air quality impacts. Contrary to prior work we find that global simulation at high resolution (~50 km) results in an increase in the simulated impacts relative to simulations at low resolution (~400 km), and that - subject to the choice of epidemiological data source - aviation-attributable ozone may be responsible for global health impacts comparable in magnitude to the total national health burden of US combustion emissions. This presentation will explore the atmospheric mechanisms behind these effects, degree to which model resolution does or does not affect the simulated impacts, the implications for future aviation NOx regulation, and the dominant sources of uncertainty in the result.

How to cite: Eastham, S., Chossière, G., Speth, R., Jacob, D., and Barrett, S.: Aviation NOx emissions and their increasing impact on global surface air quality, EGU General Assembly 2024, Vienna, Austria, 14–19 Apr 2024, EGU24-11502, https://doi.org/10.5194/egusphere-egu24-11502, 2024.

EGU24-11532 | Orals | AS3.20

Response of natural dust to removal of anthropogenic emissions over South Asia 

David Stevenson, Prerita Agarwal, Mathew Heal, and Rahul Zaveri

We use the regional chemistry transport model WRF-Chem (v4.2.1) to analyse the sensitivity of surface dust across Northern India to various emissions' sources. We use idealised model experiments that switch off individual sources in an attempt to apportion dust aerosol concentrations to anthropogenic, biomass-burning, and natural dust sources. However, these experiments show significant non-linear interactions between sources, making simple apportionment difficult. Across the natural dust-dominated western part of the domain, we find that switching off anthropogenic emissions results in an increase in dust. Alternatively, this can be considered in the opposite sense: the presence of anthropogenic pollutants reduces surface dust aerosol concentrations by almost 50 % on average. We diagnose the processes responsible for this somewhat surprising result. Heterogeneous chemical reactions between dust and nitric acid (HNO3) shorten the dust’s lifetime, increasing the sink for natural dust as HNO3 is enhanced by anthropogenic NOx emissions. The modelled dust lifetime is enhanced by nearly 4 hours when anthropogenic precursor emissions are excluded. The model shows a strong anticorrelation between dust and HNO3, related to the preferential uptake of HNO3 by dust particles over a broad relative humidity range (10 – 90 %). The strong non-linear response of dust loading to idealised emissions changes shows considerable regional variation. The effect of these dust-pollution interactions on dust lifetime suggest that dust concentrations will increase as anthropogenic NOx emissions reduce, making control of particulate pollution harder, particularly in regions with high natural dust sources.

How to cite: Stevenson, D., Agarwal, P., Heal, M., and Zaveri, R.: Response of natural dust to removal of anthropogenic emissions over South Asia, EGU General Assembly 2024, Vienna, Austria, 14–19 Apr 2024, EGU24-11532, https://doi.org/10.5194/egusphere-egu24-11532, 2024.

EGU24-11559 | ECS | Posters on site | AS3.20

Quantifying the Influence of Supersonic Aviation Emissions on Global Surface Air Quality 

Lucas Oh, Sebastian Eastham, and Steven Barrett

Studies of supersonic aviation to date have focused on the potential for stratospheric ozone depletion and climate change, due to the high altitude release of both nitrogen oxides (NOx) and water vapor. However, the impact of these high-altitude emissions on surface air quality is underexplored. We quantify the effects of emissions from a total of 35 compartments, dividing the altitude range from 8 to 22 km into 2 km intervals across nine compartments, and segmenting latitude into five compartments without differentiating by longitude. Using global atmospheric chemistry-transport modeling, 1 Tg of NOx emitted at 20-22 km, a typical cruising altitude for a supersonic aircraft, and 30-60 N° results in an addition 0.39 Gg of surface PM2.5. This is 8.4 times greater than the change in surface PM2.5 resulting from 1 Tg of NOx emitted at subsonic altitudes (8-10 km). We also find that NOx emitted at typical supersonic cruise altitudes results in a decrease in surface ozone, compared to an increase when NOx is emitted at subsonic cruise altitudes. Emissions of sulfur oxides (SOx) also cause qualitatively different impacts on surface air quality, again magnified when emitted at higher altitudes. We also assess the mechanism of why these changes occur, providing a comprehensive understanding of the high-altitude emissions impact on surface air quality. This research is not only applicable to policy-making decisions regarding supersonic aviation but also indicates the need for additional research into the global air quality impacts of other high altitude emissions such as those from launch vehicles.

How to cite: Oh, L., Eastham, S., and Barrett, S.: Quantifying the Influence of Supersonic Aviation Emissions on Global Surface Air Quality, EGU General Assembly 2024, Vienna, Austria, 14–19 Apr 2024, EGU24-11559, https://doi.org/10.5194/egusphere-egu24-11559, 2024.

EGU24-13092 | ECS | Posters on site | AS3.20

Investigating the impact of emission reductions and traffic sector emissions on ambient PAH and nitrated PAH concentrations 

Jun Meng, Elisabeth Galarneau, Deyong Wen, Kenjiro Toyota, and Junhua Zhang

Polycyclic aromatic hydrocarbons (PAHs) pose a health risk as hazardous air pollutants, with nitrated PAHs (nitro-PAHs) being notably more toxic. However, limited research has explored how spatial PAH and nitro-PAH concentrations have evolve over time and the specific impact of traffic emissions on ambient PAH and nitro-PAH levels.

This study investigates the effects of decreasing anthropogenic emissions and traffic-related emissions on both PAH and nitro-PAH concentrations using a high-resolution regional chemical transport model. The research introduces a new nitro-PAH species, 2-Nitrofluoranthene (2-NFLT), into the Global Environmental Multiscale model – Modelling Air quality and CHemistry (GEM-MACH), enhancing our understanding of regional air quality trends. By simulating 2-NFLT concentrations for varying emission levels over three decades, we aim to identify the changes in 2-NFLT concentrations compared to primary PAH concentrations. Additionally, we quantify the contribution from traffic sector to ambient PAH concentrations by conducting sensitivity simulations under a traffic-free scenario.

This work underscores the significance of fine spatial resolution in nitro-PAH modeling and provides critical insights into the co-benefits of reducing primary PAH and NOX emissions over the past two decades. The findings have implications for informing policies aimed at improving air quality and safeguarding public health.

How to cite: Meng, J., Galarneau, E., Wen, D., Toyota, K., and Zhang, J.: Investigating the impact of emission reductions and traffic sector emissions on ambient PAH and nitrated PAH concentrations, EGU General Assembly 2024, Vienna, Austria, 14–19 Apr 2024, EGU24-13092, https://doi.org/10.5194/egusphere-egu24-13092, 2024.

EGU24-13518 | ECS | Posters on site | AS3.20 | Highlight

Atmosphere aerosol over Ukraine and Kyiv city under Russian invasion  

Yuliia Yukhymchuk, Xuanyi Wei, Vassyl Danylevsky, Gennadi Milinevsky, Philippe Goloub, Ihor Fesianov, and Ivan Syniavskyi

We investigate the impact of the Russian invasion and military activities on aerosol parameters in the atmosphere over Kyiv and Ukraine using data from the AERONET Kyiv station, the AirVisual network, and the MERRA-2 reanalysis. We examined the annual impact of the war on aerosol characteristics (Angstrom exponent, aerosol optical depth, fine particle fraction, aerosol absorption optical depth, complex refractive index) and PM2.5 specifically within the Kyiv city, using in situ observations from the AERONET and AirVisual networks. After the invasion, there was a short surge in PM2.5 contamination. We also investigated the levels of SO2, SO4, PM2.5 and black carbon before and at the onset of the full-scale invasion across Ukraine. The temporary improvement in air quality in Kyiv city is associated with a decrease in traffic load. AERONET observations reveal changes in the annual dynamics of the Ångström Exponent, with lower values observed in 2022 and a decrease in the fine aerosol fraction. Analysis of the aerosol complex refractive index indicates a shift in the dominant aerosol type present in the atmosphere. The AirVisual network data indicate no abnormal increases in PM2.5 concentrations during 2022 and early 2023, although elevated values were observed due to military activities and fires. The comparison of the state and properties of aerosol contamination before and after Russia's invasion shows a significant increase in the black carbon concentration in both the eastern and western parts of Ukraine.

How to cite: Yukhymchuk, Y., Wei, X., Danylevsky, V., Milinevsky, G., Goloub, P., Fesianov, I., and Syniavskyi, I.: Atmosphere aerosol over Ukraine and Kyiv city under Russian invasion , EGU General Assembly 2024, Vienna, Austria, 14–19 Apr 2024, EGU24-13518, https://doi.org/10.5194/egusphere-egu24-13518, 2024.

EGU24-14264 | Posters on site | AS3.20

Characteristics of PM2.5 distribution and its Hot Spot using Scanning LiDAR  

Gahye Lee, Dasom Lee, Seongmin Kim, jeong-min Park, Kwanchul Kim, Sangcheol Kim, Youndae Jung, and Ilkwon Yang

Over recent decades, air quality has become major concern over the Korean peninsula. Because of the growing concern, the Korean government regulated air pollutants management policies and developed the technologies for improving air quality. Thus, the long-term trends of PM10 emissions are gradually decreased. However, industrial complexes including various industries are concentrated and distributed with insufficient prevention management for air pollutant emission facilities. In addition, these facilities are emitted high concentrations of PM2.5 and the emissions are dispersed nearby residential areas, which can have a direct adverse effect on the environment and health. Therefore, it is judged that efficient management of the emission of air pollutants in industrial complex areas is necessary. So this study to identify major and illegal emission sources in industrial complexes and propose management measures.
In this study, we investigated that the characteristics of the concentration of PM2.5 from the industrial complex in Siheung-si, Gyeonggi-do are using Scanning LiDAR for analyzing spatiotemporal distribution and identifing Hot Spots. We were analyzed hourly, daily, and monthly average of PM10 and PM2.5 concentrations based on scanning LiDAR measurement datasets. Distributions of Hot Spots in PM2.5 were selected and visualized using the GIS Heat map technique. The result showed that the concentration of hourly averaged PM2.5 gradually increased from 08:00 to work. And from 09:00 to 13:00, the high concentration phenomenon appeared. And the concentration increased again from 15 to 17:00, and then the concentration gradually decreased from 18:00. Heat map showed that a total of 7 Hot Spots from A to G were identified within the Scanning LiDAR observation area. Moreover, it was found that high-concentration of PM2.5 was emitted in the three areas of E, F, and G. The three main emission sources were classified into manufacturing industries such as food manufacturing and metal steel factory. Therefore, it can be used as basic data for efficient emission sources and hotspot management improving air quality.

Acknowledgment: This research was supported by a grant (2023-MOIS-20024324) of Ministry-Cooperation R&D Program of Disaster-Safety funded by Ministry of Interior and Safety (MOIS, Korea) and Metropolitan Environment Management Office in Gyeonggi-do Province, Korea.

How to cite: Lee, G., Lee, D., Kim, S., Park, J., Kim, K., Kim, S., Jung, Y., and Yang, I.: Characteristics of PM2.5 distribution and its Hot Spot using Scanning LiDAR , EGU General Assembly 2024, Vienna, Austria, 14–19 Apr 2024, EGU24-14264, https://doi.org/10.5194/egusphere-egu24-14264, 2024.

EGU24-14646 | Orals | AS3.20 | Highlight

Combating air pollution significantly reduced air mercury concentrations in China 

Xinbin Feng, Xuewu Fu, and Hui Zhang

Long-term observations of atmospheric mercury are important for the evaluation of the effectiveness of the Minamata Convention on Mercury. We continuously measured gaseous elemental mercury (GEM) concentrations at four remote sites in China for more than ten years, i.e., Mt. Waliguan (100.90° E, 36.29° N) during 2008-2022, Mt. Changbai (128.11° E, 42.40° N) during 2008-2022, Mt. Ailao (101.02° E, 2453° N) during 2011-2022, and Mt. Damei (121.57° E, 29.63° N) during 2011-2022. Our observations showed that GEM concentrations in China increased slightly during 2008-2013, and then the GEM concentrations decreased significantly after 2013. The mean GEM concentrations at the four Chinese sites during 2022 were 1.51 ± 0.35 ng m-3, which is close to mean concentrations observed in Europe, North America, the Arctic, and the free troposphere in Pacific Ocean during 2021 (Individual means: 1.14 to 1.51 ng m-3, overall mean: 1.34 ± 0.11 ng m-3, n = 13). During 2013-2022, GEM concentrations in China decreased by 35%, which was much higher than the decreasing rates observed in Europe (9%), North America (10%), the Arctic (6%), and the free troposphere in Pacific Ocean (9%) during 2013-2021. The declines in in GEM concentrations in China since 2013 matches well with the decreasing anthropogenic Hg emission in China estimated by Chinese anthropogenic Hg emission inventory, indicating the reduction in anthropogenic Hg emissions in China was the major driver for the GEM declines.

How to cite: Feng, X., Fu, X., and Zhang, H.: Combating air pollution significantly reduced air mercury concentrations in China, EGU General Assembly 2024, Vienna, Austria, 14–19 Apr 2024, EGU24-14646, https://doi.org/10.5194/egusphere-egu24-14646, 2024.

EGU24-15311 | ECS | Orals | AS3.20

Estimating the impact of mobility scenarios on urban air quality - a regional scale analysis 

Lya Lugon, Chloé Kemgne, Valentine Le Vot, Nicolas Mauchard, Bérénice Vu Quang, Chaopeng Wang, Jérémy Vigneron, Fabrice Dugay, Olivier Sanchez, and Karine Sartelet

Atmospheric pollution is pointed out by the World Health Organization as the responsible for approximately 7 million premature deaths per year, and different approaches are investigated worldwide to reduce the high concentrations observed in urban areas. Regional-scale concentrations are influenced by different sources of pollutants, such as residences, industries and road traffic. Particularly road traffic is one of the important sources of regulated and emerging pollutants, including fine and ultra-fine particles, nitrogen dioxide and black carbon. Nevertheless, the traffic emission rate of each pollutant depends on the vehicle characteristics: the vehicle type, fuel and the vehicle manufacturing year. Urban mobility is, then, a key aspect to determine the total amount of traffic emissions, and choices related to the available modes of transport in a city may have an important role in urban air quality. This study investigates the influence of five extreme mobility scenarios on pollutant emissions and concentrations in urban air quality. In each scenario very strong limitations on road traffic are adopted: (i) a limited electrification of private and commercial vehicles and a shift to soft mobility, (ii) a significant increase in the number of users per car and reduced use of private cars car, (iii) a total electrification of the fleet (Paris-region target for 2030), (iv) limits on private vehicles circulation in specific areas, and (v) the implementation of all these measures simultaneously. For this, the regional-scale model CHIMERE is employed to calculate the concentrations of multi-pollutants with a 1 km x 1 km spatial resolution. A special focus is given to the emerging pollutants black carbon and ultra-fine particles. In this study CHIMERE is coupled with the chemical module SSH-aerosol, which enables the representation of aerosol dynamics with the state-of-art modules available in the literature. Simulations are performed in Paris during summer 2022. This study shows the potentialities of an air-quality modeling approach to understand trends in concentrations according to scenarios aiming to reduce population exposure to atmospheric pollution. 

How to cite: Lugon, L., Kemgne, C., Le Vot, V., Mauchard, N., Vu Quang, B., Wang, C., Vigneron, J., Dugay, F., Sanchez, O., and Sartelet, K.: Estimating the impact of mobility scenarios on urban air quality - a regional scale analysis, EGU General Assembly 2024, Vienna, Austria, 14–19 Apr 2024, EGU24-15311, https://doi.org/10.5194/egusphere-egu24-15311, 2024.

EGU24-15992 | ECS | Posters on site | AS3.20

Chemical composition and morphological analysis of two-layered attic dust samples from a former industrial area (Ózd city, Hungary): insights into historical environmental contamination 

Mona Maghsoudlou, Davaakhuu Tserendorj, Gorkhmaz Abbaszade, Nelson Salazar, Péter Völgyesi, and Csaba Szabó

Studying the chemical composition and physical properties of undisturbed attic dust provides valuable insights into historical environmental contamination, indicating the impact of various anthropogenic and natural sources on long-term air pollution in urban environments. Ózd, a former industrial city in Hungary, played a significant role for iron and steel works between 1835 and 1990, operated iron and steel factory in the city center. As a consequence of the collapse of the old political and economic system, the industrial structure of the city was restructured in the early 1990s. We collected attic dust samples from a building within the territory of former iron factory which is operating as a small horsebox factory during the past ~25 years. Distinct stratum was observed during sample collection, resulting in the identification of two layers: the upper layer and the lower layers, characterized by different color appearances and amounts of dust.

In this study, we analyzed bulk samples to determine their elemental compositions, such as major, and trace elements including the rare earth and high field-strength elements (REE+Y and HFSE). The elemental contents of attic dust samples were analyzed using quadrupole-based ICP-MS after aqua regia digestion. Scanning electron microscope (SEM) was used to determine morphological properties, chemical composition, shape, and size of attic dust particles. The major elements, such as Ca, Mg, Na, K, and S, are at least two times higher in the lower layer, whereas Al and Fe showed the same concentrations in both layers, pointing on potential historical industrial influences on environmental contamination. Among the trace elements, Ti, Cr and Mn concentration show higher, whereas V, Co, and Ni concentrations show lower values than those in the upper layer. Metal(oid)s like W, Mo, Ag, Cd, Hg, Pb, and Bi have higher concentrations in the lower layer compared to those of Cu, Zn, Sn, and Sb, whereas the As concentration was the same in the two layers. In contrast, HFS and REE+Y showed highly unusual patterns for both layers. SEM (scanning electron microscope) image analyses highlighted the prevalence of highly oxidized particles, particularly iron oxides, predominantly observed in the upper layer. By establishing a relation between the two attic dust layers, notable differences in elemental composition became evident highlighting the impact of past industrial activities on the environmental pollutants, making a shift in the amount and type of chemical composition after the shutdown of the system. 

How to cite: Maghsoudlou, M., Tserendorj, D., Abbaszade, G., Salazar, N., Völgyesi, P., and Szabó, C.: Chemical composition and morphological analysis of two-layered attic dust samples from a former industrial area (Ózd city, Hungary): insights into historical environmental contamination, EGU General Assembly 2024, Vienna, Austria, 14–19 Apr 2024, EGU24-15992, https://doi.org/10.5194/egusphere-egu24-15992, 2024.

EGU24-16035 | Orals | AS3.20

Obscured Contribution of Oxygenated Intermediate-Volatility Organic Compounds to Secondary Organic Aerosol Formation from Gasoline Vehicle Emissions 

Dan Dan Huang, Qingyao Hu, Xiao He, Rujin Huang, Xiang Ding, Yingge Ma, Xinwei Feng, Shengao Jing, Yingjie Li, Jun Lu, Yaqin Gao, Xu Shi, Chunlei Qian, Chao Yan, Shuhui Zhu, Shengrong Lou, Hongli Wang, Qingyan Fu, Qingyan Fu, and Cheng Huang

Secondary organic aerosol (SOA) formation from gasoline vehicles spanning a wide range in emission types was investigated using an oxidation flow reactor (OFR) by conducting chassis dynamometer tests. Aided by advanced mass spectrometric techniques, SOA precursors, including volatile organic compounds (VOCs), intermediate/semi-volatile organic compounds (I/SVOCs), were comprehensively characterized. The reconstructed SOA produced from the speciated VOCs and I/SVOCs can explain 69% of SOA measured downstream of OFR upon 0.5-3 days’ OH exposure. While VOCs can only explain 10% of total SOA production, contribution from I/SVOCs is 59%. We also found that oxygenated I/SVOCs (O–I/SVOCs, e.g., benzylic or aliphatic aldehydes and ketones), as an obscured source, accounted for 16% of total nonmethane organic gas (NMOG) emission and 20% of SOA production. More importantly, with the improvement in emission standards, the NMOG was effectively mitigated by 35% from China 4 to China 6, which is predominantly attributed to the decrease of VOCs. Real-time measurements of different NMOG components as well as SOA production further revealed that the current emission control measures, such as three-way catalytic converters (TWCs), are effective in reducing the “light” SOA precursors (i.e., single ring aromatics), but not for the I/SVOC emissions, indicating that the catalyst are selective upon reacting with different exhaust components. Our results highlight the neglected contribution from I/SVOCs, especially O-I/SVOCs to SOA formation and the urgent need in further investigation in their origins, i.e., incomplete combustion, lubricating oil, which requires improvements in real-time molecular-level characterization of I/SVOC molecules and in turn will benefit the future design of control measures.

How to cite: Huang, D. D., Hu, Q., He, X., Huang, R., Ding, X., Ma, Y., Feng, X., Jing, S., Li, Y., Lu, J., Gao, Y., Shi, X., Qian, C., Yan, C., Zhu, S., Lou, S., Wang, H., Fu, Q., Fu, Q., and Huang, C.: Obscured Contribution of Oxygenated Intermediate-Volatility Organic Compounds to Secondary Organic Aerosol Formation from Gasoline Vehicle Emissions, EGU General Assembly 2024, Vienna, Austria, 14–19 Apr 2024, EGU24-16035, https://doi.org/10.5194/egusphere-egu24-16035, 2024.

Restrictions on economic activities during the COVID-19 pandemic lockdown period provided a once-in-a-lifetime opportunity for many countries including India to witness the improvement in air quality that can be achieved with a reduction in anthropogenic activities. Many previous studies have reported about the sudden drop in pollution levels across India as an immediate reflex of these economic restrictions or “lockdown”. However, there exist several shortcomings in most of these studies. Firstly, most studies focused only on the lockdown phases and ignored to document the recovery of pollution levels during the unlock phases. Secondly, many studies considered the reduction in emission sources only within India due to lockdown and ignored the reduction in activities in the neighboring counties. Thirdly, many studies could not separate the impact of emission reductions and changing meteorology throughout lockdown phases on the improvement in observed air quality. In the present study, we examine the impacts of changing emissions of air pollutants and meteorology during the entire lockdown and unlock phases of COVID-19 period (February 24 – June 30, 2020) on the air quality over India using the COvid-19 adjustmeNt Factors fOR eMissions (CONFORM) data and Weather Research and Forecasting model coupled to Chemistry (WRF-Chem) model.

We performed systematically designed model simulations to understand and isolate the effects of changing emissions of air pollutants and meteorology on the air quality levels during the COVID-19 period. In one case, we consider business as usual and another one we adjusted anthropogenic emissions using CONFORM data. To quantify and isolate the impact of changing meteorology during the same period, we performed additional simulations for the last five years that is from 2015 to 2019. All simulations are performed for a nested model domain having an inner domain horizontal resolution of 9Km x 9Km and centre around Bilaspur, Chhattisgarh, using 6-hourly ERA-5 reanalysis data. Model simulations are evaluated using available in-situ measurements and remote sensing data from various satellite observations.

Results from our emission-restricted simulations show that immediately before and after the imposition of the lockdown, particulate matter concentration decreased by ~36%, compared to a 20% decrease during the same periods in the last five years. Movement and Industrial restrictions and reductions in Power Production led to a significant decrease in surface distribution of NOx (NO+NO2) over different Indian metro cities (Kolkata ~52%, Delhi ~67%). Highly populated and polluted Northern and Western Indian states show distinct spatial variations, with the more critical decrease in CO (~21%), PM2.5 (~27%), and SO2 (~17%) pollutant levels. A significant reduction of NOx to VOCs in VOC-limited urban locations shows a marginal increase in the O3 distribution over Central and South India. We observed that, although there was an initial improvement in air quality due to strict activity restrictions during the first phase of the lockdown, most Indian megacities still failed to achieve the national standard of air pollutants. More results with greater details will be presented.

How to cite: Nandi, I., Ganguly, D., and Dey, S.: Assessing the impacts of emission reduction and meteorology change on India’s air quality during COVID-19 lockdown using the WRF-Chem model, EGU General Assembly 2024, Vienna, Austria, 14–19 Apr 2024, EGU24-19479, https://doi.org/10.5194/egusphere-egu24-19479, 2024.

EGU24-19864 | Orals | AS3.20 | Highlight

Emerging atmospheric pollutants in southern Europe- trends and changes over the past two decades 

Nikos Kalivitis, Maria Kanakidou, Nikos Gialesakis, Marios Chatziparaschos, and Nikos Mihalopoulos

Over the past decades, air pollution mitigation measures have been applied extensively in Europe with a direct impact on the particulate matter (PM) load and composition. The Mediterranean atmospheric aerosol burden is not only characterized by emissions from anthropogenic sources but is also strongly influenced by the arid areas of North Africa and the Middle East, the marine environment, and atmospheric transformation. Here, we analyse data from various databases to investigate the evolution of unregulated particulate pollutants, namely ultrafine particles (UFP), desert dust (DD) and black carbon (BC) in the Eastern Mediterranean region over the last 20 years. Ground-based (AERONET) and satellite-based (MODIS/Terra) remote sensing observations, reanalysis products (MERRA-2) and in-situ observations (Finokalia environmental research station - finokalia.chemistry.uoc.gr) were used to investigate the variability and the trends of atmospheric aerosols.

A decrease in the AOT was observed during the studied period, which was also reflected in the ground-based PM10 measurements. In addition to the decrease in sulfate content observed as a result of EU regulations, the AOT of dust was found to be decreasing as well. At the same time a statistically significant increase in the Ångström exponent was observed for all datasets, suggesting that the overall size of aerosols in the eastern Mediterranean is decreasing.  Ground-based measurements of submicron atmospheric aerosol number concentrations showed an increase in total aerosol number, which was more pronounced for the UFP. At the same time, an increase in the absorption coefficient of aerosol particles was observed, indicating an increase in the BC content, which could contribute to the increase in UFP concentrations. Overall, it was found that despite the apparent decrease in aerosol constituents in terms of particulate matter due to the regulations applied in Europe over the last decades, pollutants such as BC and UFP, which are hazardous to human health and may influence climate at the regional scale, appear to be increasing and new approaches are required for effective clean air strategies.

How to cite: Kalivitis, N., Kanakidou, M., Gialesakis, N., Chatziparaschos, M., and Mihalopoulos, N.: Emerging atmospheric pollutants in southern Europe- trends and changes over the past two decades, EGU General Assembly 2024, Vienna, Austria, 14–19 Apr 2024, EGU24-19864, https://doi.org/10.5194/egusphere-egu24-19864, 2024.

EGU24-20239 | ECS | Posters on site | AS3.20

Assessing the impact of aerosol radiative effects on Air quality over India 

Arshitha Anand K A, Dilip Ganguly, and Sagnik Dey

Aerosol–radiation interaction (ARI) not only affects the climate of our earth, but it also provides feedback to air quality and PM2.5 concentrations near the surface by influencing the stability of the planetary boundary layer and modulating the actinic flux required for several photochemical reactions which are part of the lifecycle of various secondary air pollutants. Additionally, modification of photolysis due to scattering or absorbing solar radiation by aerosols (aerosol–photolysis interaction (API) can alter the atmospheric oxidizing capacity and impact PM2.5  pollution levels by affecting secondary aerosol formation. Most studies in the past have focussed on understanding the effects of ARI on climate but, the consequence of combined and separate impact of ARI and API on regional air quality and its feedback on the climate remains largely unknown.

Here we used the WRF-Chem model to understand and quantify the contributions of API on the regional air quality of north India.  We performed three simulations of the month of May 2018 over the Indian region: (1) BASE, the base simulation coupled with the aerosol and radiation interactions; (2) NOARI, same as the BASE case but without the effect of ARI. and (3) NOAPI, same as the BASE case but without the effect of API. The impacts of API and ARI are investigated by analyzing the differences in model outputs.

Firstly, we evaluated model performance over the study region. We validated the simulated variables, namely, 2m temperature, PBL height, wind, AOD, surface O3, and PM2.5, using available ground-based observations, satellite data, and reanalysis datasets. The validation results show that the modelled 2m temperature showed better agreement with observations among all the variables. The model also captures the spatial distribution in AOD over our study region reasonably well and is comparable with various observations showing the highest values over the Indo-Gangetic Plain (IGP). We further find that although the model overestimates the simulation of O3 and PM2.5 concentrations, it can accurately replicate the distinctive diurnal patterns in both these variables as noted in ground-based observations. Our results show that due to ARI, the concentration of surface O3, showed enhancements, while PM2.5 concentration mostly showed a reduction. The decrease in PM2.5 concentration was highly related to stabilization induced by meteorological variables and primary aerosol concentration increases. On the other hand, due to API, the photolysis rate of NO2 increased at the surface. The spatial distribution of O3 and OH is consistent with that of the photolysis rate. Pronounced enhancement in photolysis rates due to API inevitably increase the abundance of the atmospheric oxidants. Thus, we observed an opposite effect of ARI and API on PM2.5, shows a regional decrease and increase respectively. Our study emphasizes the need to avoid any unintended consequences of emission reduction strategies for climate change mitigation and clean air goals on air quality. More results with greater details will be presented.


How to cite: Anand K A, A., Ganguly, D., and Dey, S.: Assessing the impact of aerosol radiative effects on Air quality over India, EGU General Assembly 2024, Vienna, Austria, 14–19 Apr 2024, EGU24-20239, https://doi.org/10.5194/egusphere-egu24-20239, 2024.

EGU24-411 | ECS | Posters on site | AS3.21

Evaluating Two-Dimensional Horizontal Grids in a Deterministic Air Pollution Model: Estimating the Impact on Outputs, Inputs, and ANN-CHIMERE 

Houria Bouzghiba, Amine Ajdour, Mendyl Abderrahmane, and Gábor Géczi

Air pollution, especially from ozone and particulate matter, significantly contributes to environmental and health problems. Monitoring complexity and high costs have made modeling a parallel approach to surveillance. Models such as CHIMERE are essential in combining weather conditions, emissions, boundaries, and various physical processes, including transport and spatial resolution. This study introduces three methodologies to assess the influence of a two-dimensional horizontal grid in the Eulerian atmospheric transport model. It explores the impact on outputs, inputs, and model fitting. The first approach analyzes the resolution effect on CHIMERE outputs, focusing on O3. The second approach investigates various effects on inputs, including temperature (T), wind speed (WS), Planetary Boundary Layer Height (PBLH), Land Use and Land Cover (LULC), and Emissions (E). The third approach created a straightforward, strong, and precise ANN-CHIMERE adjustment model to evaluate the impact of spatial resolution in this context. The outcomes are verified through ozone measurement data collected in Agadir and Casablanca, Morocco, during various periods in 2016 and 2021.The results show that a higher horizontal grid improves the probability of good predictions. The impact of input data accuracy on high resolution can be concluded, providing insights into the limitations of CHIMERE in predicting output data. The new ANN-CHIMERE adjustment model delivers superior outcomes at high resolution, exhibiting an enhanced correlation coefficient and a significant reduction in the RMSE. In the future, the proposed approaches can be applied for spatial resolution optimization, maintaining the accuracy of the results and the computation time. It can also be adopted as an adjustment process of the inputs and outputs of deterministic air pollution models.

How to cite: Bouzghiba, H., Ajdour, A., Abderrahmane, M., and Géczi, G.: Evaluating Two-Dimensional Horizontal Grids in a Deterministic Air Pollution Model: Estimating the Impact on Outputs, Inputs, and ANN-CHIMERE, EGU General Assembly 2024, Vienna, Austria, 14–19 Apr 2024, EGU24-411, https://doi.org/10.5194/egusphere-egu24-411, 2024.

EGU24-2812 | Orals | AS3.21

PM2.5 source allocation in 708 European cities: a modelling study 

Stefano Zauli Sajani, Philippe Thunis, Enrico Pisoni, Bertrand Bessagnet, Fabio Monforti-Ferrario, Alexander De Meij, Ferenc Pekar, and Elisabetta Vignati

Ambient fine particulate matter (PM2.5) represents the world's greatest environmental health risk factor and most EU citizens are still exposed to PM2.5 levels above WHO guidelines. Shaping effective urban air quality plans requires the knowledge of pollutants’ origin in terms of different spatial scales, emission sectors and precursors involved in their formation.

Here we present a comprehensive PM2.5 source allocation assessment carried out with the SHERPA model in 708 urban areas in Europe. Urban sources show a significant impact on local PM2.5 levels (an average of 22% of local concentrations). With regard to emission sectors, the residential sector’s contribution is greater than 50% in most cities in Northern Italy and Eastern Europe while the average contribution across all cities is 27%. The average contribution from industry, agriculture and road transport is 18%, 17% and 14%, respectively. High contributions from shipping and natural sources (>50%) are found in some Mediterranean cities exposed to southerly winds.  

Urban areas can be clustered in three main categories: a) where emissions from the residential sector and primary PM2.5 precursors dominate (northern Italy and Eastern Europe); b) where shipping and natural emissions are the main source and dust and SOx are the main precursors (Southern Europe); and c) where secondary PM2.5 (>70%) dominates with comparable contribution from agriculture, industry, and transport and NOx and NH3 are the precursors (Central Europe and UK).

Secondary pollution accounts for more than half of PM2.5 concentrations in almost all cities with large areas of Germany and Netherlands showing secondary contribution higher than 70%. In these areas NOx and NH3 as precursors and the agriculture and industry sectors are the most important sources of PM2.5.

This source allocation assessment of PM2.5 emissions in all medium to large urban areas in Europe highlights how crucial it is to reduce the emissions of the residential sector in most EU cities.    

How to cite: Zauli Sajani, S., Thunis, P., Pisoni, E., Bessagnet, B., Monforti-Ferrario, F., De Meij, A., Pekar, F., and Vignati, E.: PM2.5 source allocation in 708 European cities: a modelling study, EGU General Assembly 2024, Vienna, Austria, 14–19 Apr 2024, EGU24-2812, https://doi.org/10.5194/egusphere-egu24-2812, 2024.

EGU24-3576 | ECS | Orals | AS3.21

Improved assessment of OVOC sources and sinks over Reunion Island through WRF-Chem model evaluation against PTR-MS data and satellite retrievals 

Catalina Poraicu, Jean-François Müller, Trissevgeni Stavrakou, Crist Amelynck, Bert Verreyken, Niels Schoon, Camille Mouchel-Vallon, Pierre Tulet, and Jérôme Brioude

Oxygenated volatile organic (OVOCs) are important compounds in atmospheric processes. They have been seen to contribute largely to ROx and ozone formation and in remote marine regions, they contribute to diminishing the oxidative capacity of the atmosphere by reacting with OH. OVOCs are directly emitted from biogenic sources and are produced from the oxidation of hydrocarbons in the atmosphere. However, their budget remains poorly understood, due to incomplete representation of photochemical OVOC production and uncertainties in terrestrial emissions and ocean/atmosphere exchanges.

In this work, we compared model simulations with OVOC remote high-altitude measurements conducted in 2019 at Reunion Island, a subtropical French territory in the Indian Ocean. We exploit a 2-year high-temporal resolution dataset of mass spectrometry (PTR-MS) measurements of OVOC compounds at a remote high-altitude tropical site, the Maïdo Observatory (2155m asl) on Reunion Island. More precisely, the Weather Research and Forecasting model coupled with Chemistry (WRF-Chem) is used to provide an updated evaluation of the budget of OVOCs over Reunion Island, based on the PTR-MS dataset complemented with meteorological measurements and satellite (TROPOMI) retrievals of relevant compounds. The model is configured to include two domains centred on Reunion Island. The finest resolution (2.5km) in the nested domain is needed to resolve the complex orography of the island and the spatially heterogeneous distribution of reactive species. For computational reasons, the focus is on two one-month simulations in January and July 2019, allowing analysis of seasonal differences and their impacts on model performance and chemical budget.

The WRF-simulated meteorology is first evaluated against meteorological measurements at a remote site (Maïdo) and two urban sites (Saint Denis and Saint Pierre). A high-resolution (1km2) anthropogenic emission inventory for Reunion is implemented, complemented with information from global inventories. Biogenic VOC emissions (primarily isoprene) are calculated on-line using the MEGAN algorithm and amended high-resolution distributions of standard emission factors and plant functional types (PFTs). The MOZART chemical mechanism is adopted with updates to the chemistry. The chemical simulations are evaluated against (1) NO2 and HCHO vertical columns from TROPOMI, (2) the PTR-MS OVOC dataset at Maïdo, (3) an FTIR column dataset, also at Maïdo, and (4) network air quality measurements at several sites. Those comparisons will provide new constraints on the emissions of NOx and VOCs, and will result in recommendations for further refinements. This work will lead to a better appraisal of OVOC sources and sinks over the island. The main unknowns and potential issues will be discussed.

How to cite: Poraicu, C., Müller, J.-F., Stavrakou, T., Amelynck, C., Verreyken, B., Schoon, N., Mouchel-Vallon, C., Tulet, P., and Brioude, J.: Improved assessment of OVOC sources and sinks over Reunion Island through WRF-Chem model evaluation against PTR-MS data and satellite retrievals, EGU General Assembly 2024, Vienna, Austria, 14–19 Apr 2024, EGU24-3576, https://doi.org/10.5194/egusphere-egu24-3576, 2024.

EGU24-3607 | Posters on site | AS3.21

Numerical simulation of IL-8-based relative inflammation potentials of aerosol particles from vehicle exhaust and non-exhaust emission sources in Japan 

Mizuo Kajino, Satoko Kayaba, Yasuhiro Ishihara, Yoko Iwamoto, Tomoaki Okuda, and Hiroshi Okochi

Spatial distributions of interleukin-8 (IL-8)-based relative inflammation potentials (IP) of PM2.5 from vehicle exhaust and non-exhaust emission sources in Japan are derived using the meteorology–chemistry model (NHM-Chem) and laboratory experiments. In this study, IP is first defined as multiplying PM2.5 from different emission sectors by supernatant IL-8 concentrations released using PM2.5 samples, normalized to that of particle-free controls. The simulated IP of primary exhaust particles IP(E) accounts for 3%–30% of the total vehicle IP (exhaust + non-exhaust, primary + secondary), IP(V), which is low in densely populated regions (3%–15%) and high (5%–30%) in less populated regions, because there are fewer exhaust PM2.5 emitters (diesel trucks) in more populated regions. The contribution of IP(V) to IP of the total environmental PM2.5, IP(A), varied substantially in space by approximately 3–5 times (the contributions are greater in larger cities as there is more traffic). In our estimates, IP(V) is approximately one and two orders of magnitude higher than IP(E) and IP(T), the IP of fresh tire wear particles (TWPs), respectively. IP(T) has a minor contribution to IP(V) and IP(A). Recently, however, aged TWPs have been reported to be toxic; thus, the aging process of TWPs needs to be considered in the future.

How to cite: Kajino, M., Kayaba, S., Ishihara, Y., Iwamoto, Y., Okuda, T., and Okochi, H.: Numerical simulation of IL-8-based relative inflammation potentials of aerosol particles from vehicle exhaust and non-exhaust emission sources in Japan, EGU General Assembly 2024, Vienna, Austria, 14–19 Apr 2024, EGU24-3607, https://doi.org/10.5194/egusphere-egu24-3607, 2024.

EGU24-4615 | ECS | Posters on site | AS3.21

Meteorology-soil nitrogen emission coupled modelling in China: development and evaluation  

Chuanhua Ren, Xin Huang, Tengyu Liu, Yu Song, Xuejun Liu, and Aijun Ding

Volatilization of reactive nitrogen (Nr) gases like HONO, NH3 and NOx from fertilizer application and soil is an important pathway of nitrogen losses in agricultural ecosystems and deteriorate air pollution by contributing to ozone and PM2.5. The volatilization of Nr gases highly depends on environmental and meteorological conditions, however, this phenomenon is poorly described in current emission inventory and atmospheric models. Here, we develop a dynamic soil nitrogen emission model capable of calculating NH3 and HONO emission rate interactively with time- and spatial-varying meteorological and soil conditions. The NH3 flux parameterization relies on several meteorological factors and anthropogenic activity including fertilizer application, livestock waste, traffic, residential and industrial sectors.  HONO emission scheme considers soil temperature and moisture as well as the type of underlying surface. The model is then embedded into a regional WRF-Chem model and is evaluated against field measurements of Nr emission flux and ambient concentration. The evaluation shows a substantial improvement in the model performance of NH3 flux and ambient HONO concentration in China.  Compared with normal simulations using fixed emission inventory input, this model features superior capability in simulating NH3 emission flux and concentration during planting seasons and drastic weather changes like frontal activities and precipitation. Such advances in emission quantification also improve the model performance of secondary inorganic aerosol on synoptic scales. While more laboratory and field measurements are still needed for better parameterization of soil nitrogen volatilization, the seamless coupling of soil emission with meteorology provides a better understanding of NH3 and HONO emission evolution and its contribution to atmospheric chemistry. 

How to cite: Ren, C., Huang, X., Liu, T., Song, Y., Liu, X., and Ding, A.: Meteorology-soil nitrogen emission coupled modelling in China: development and evaluation , EGU General Assembly 2024, Vienna, Austria, 14–19 Apr 2024, EGU24-4615, https://doi.org/10.5194/egusphere-egu24-4615, 2024.

Reactive nitrogen (Nr) cycle in the atmosphere has an important affection on terrestrial ecosystems, which has not been fully understood and its response to the future emissions control strategy is not clear. Taking the Yangtze River Delta (YRD) as an example, we explored the regional Nr cycle (emissions, concentrations, and depositions) and its source apportionment in the atmosphere in January (winter) and July (summer) 2015 and projected its changes under emissions control by 2030 using the CMAQ model. We examined the characteristics of Nr cycle and found that Nr suspends in the air mainly as NO, NO2, and NH3 gases and deposits to the earth’s surface mainly as HNO3, NH3, NO3-, and NH4+. Due to the higher NOx than NH3 emissions, oxidized nitrogen (OXN) but not reduced nitrogen (RDN) is the major component in Nr concentration and deposition, especially in January. Nr concentration and deposition show an inverse correlation, with a high concentration in January and low in July but the opposite for deposition. We further apportioned the regional Nr sources for both concentration and deposition using the Integrated Source Apportionment Method (ISAM) incorporated in the CMAQ model. It shows that local emissions are the major contributors and this characteristic is more significant in concentration than deposition, for RDN than OXN species, and in July than in January. The contribution from North China (NC) is important for Nr in YRD, especially in January. In addition, we revealed the response of Nr concentration and deposition to the emission control to achieve the target of carbon peak in the year 2030. After the emission reduction, the relative responses of OXN concentration and deposition are generally about 100% to the reduction of NOx emissions (~50%), while the relative responses of RDN concentration are higher than 100% and the relative responses of RDN deposition are significantly lower than 100% to the reduction of NH3 emissions (~22%). Consequently, RDN will become the major component in Nr deposition. The smaller reduction of RDN wet deposition than sulfur wet deposition and OXN wet deposition will raise the pH of precipitation and help alleviate the acid rain problem, especially in July.

How to cite: Shen, A., Liu, Y., and Fan, Q.: Modeling regional nitrogen cycle in the atmosphere: present situation and its response to the future emissions control strategy, EGU General Assembly 2024, Vienna, Austria, 14–19 Apr 2024, EGU24-4819, https://doi.org/10.5194/egusphere-egu24-4819, 2024.

EGU24-5120 | Posters on site | AS3.21

Probabilistic hazard modelling of the natural gas emission of Mefite d’Ansanto, Southern Italy 

Fabio Dioguardi, Giovanni Chiodini, and Antonio Costa

The emission of gas species dangerous for human health and life is a widespread source of hazard in various natural contexts. These mainly include volcanic areas but also non-volcanic geological contexts. A notable example of the latter occurrence is the Mefite d’Ansanto area in the Southern Apennines in Italy. Here, significant emissions of carbon dioxide (CO2) occur at rates that make this the largest non-volcanic CO2 gas emission in Italy and probably of the Earth. Given the morphology of the area, in certain meteorological conditions a cold gas stream forms in the valleys surrounding the emission zone, which proved to be potentially lethal for humans and animals in the past. In this study we present a gas hazard modelling study that considers the main specie, that is CO2, and the potential effect of the most dangerous, which is hydrogen sulphide (H2S). For these purposes we used VIGIL, a tool that manages the workflow of gas dispersion simulations specifically optimised for probabilistic hazard applications. We produced maps of CO2 and H2S concentration and persistence at various exceedance probabilities considering the gas emission rates and their possible range of variation defined in previous studies.

How to cite: Dioguardi, F., Chiodini, G., and Costa, A.: Probabilistic hazard modelling of the natural gas emission of Mefite d’Ansanto, Southern Italy, EGU General Assembly 2024, Vienna, Austria, 14–19 Apr 2024, EGU24-5120, https://doi.org/10.5194/egusphere-egu24-5120, 2024.

EGU24-5230 | ECS | Orals | AS3.21

Comparing EMEP4PL and uEMEP models performance for PM2.5 and NOx for Poland  

Kinga Wisniewska, Małgorzata Werner, Maciej Kryza, Bruce R. Denby, and Hilde Fagerli

Nowadays, environmental studies emphasize that the advancement of atmospheric transport models will persist as a significant challenge in environmental modeling for the forthcoming decades. The obtained results are increasingly instrumental in air pollution epidemiology, health burden assessment, and evaluating exposure to air pollution. In this work we have run the regional EMEP4PL atmospheric transport model, with 4km x 4km resolution with high-resolution uEMEP model (250m x 250m) for the area of Poland. The models were run for the entire year of 2022. For the first time, these two models were run using a consistent, high-resolution national emission inventory. We have analyzed two pollutants harmful to population health: PM2.5 and NOx, and qualitatively compared the differences in spatial distribution of pollutant concentrations calculated by uEMEP and EMEP4PL. The uEMEP model shows higher concentrations for the emission hot spot areas, which are averaged out in the coarse-resolution EMEP4PL model. This is observed for both PM2.5 and NOx and is noticeable especially for the areas with large spatial gradient of emission (e.g. large cities or along the main roads). The results were also compared with available measurements of PM2.5 and NOx from the national air quality network operated by Chief Inspectorate for Environmental Protection (CIEP). For PM2.5, we have additionally used the measurements from the national air quality network operated by Chief Inspectorate for Environmental Protection (CIEP) and from the low-cost sensors network established within the LIFE-Mappingair project. The results show that the uEMEP model concentrationsresults are closer to the measurements for both networks. For NOx, uEMEP is also closer to the measurements, and the differences between the uEMEP and EMEP4PL performance are larger if compared to the PM2.5.

How to cite: Wisniewska, K., Werner, M., Kryza, M., Denby, B. R., and Fagerli, H.: Comparing EMEP4PL and uEMEP models performance for PM2.5 and NOx for Poland , EGU General Assembly 2024, Vienna, Austria, 14–19 Apr 2024, EGU24-5230, https://doi.org/10.5194/egusphere-egu24-5230, 2024.

EGU24-5270 | Posters on site | AS3.21

The impact of the re-emission of road dust by vehicles passages on particulate matter concentrations – a case study with EMEP MSC-W 

Aleksandra Walkowicz, Grzegorz Jeleniewicz, Maciej Kryza, Anahita Sattari, Joanna Strużewska, and Małgorzata Werner

In most European countries road transport is the main contributor to airborne particulate matter (PM, PM2.5 and PM10) concentrations. PM from traffic is classified by the method of emission into three groups: 1) an exhaust or tail-pipe component, 2) a non-exhaust component due to the abrasion of tires and brakes and of the road surface, and 3) a non-exhaust component related to the re-emission of road dust by vehicles passages (resuspension). Considering the reduction of the exhaust emissions related to the strict regulations on the cars as well as coming stricter World Health Organisation (WHO) recommendations for PM10 and PM2.5 concentrations the role of non-exhaust emission is enhancing. Therefore the aim of this study is to estimate the impact of the re-emission of road dust on PM2.5 and PM10 concentrations.

We used the EMEP MSC-W chemical transport model to calculate air pollution concentrations. The model was run two times for southern Poland for the year 2019. For the first run we had no changes to the emission inventories, which were provided from two databases (no resuspension included):

1) the EMEP[gr1]  emissions data at 0.1o x 0.1o spatial resolution for Europe, and 2) emissions from the National Centre for Emissions Management, Institute of Environmental Protection - National Research Institute for Poland (0.005o x 0.005o). For the second run, PM emissions from the resuspension was added to the road transport sector. Road resuspension emissions were estimated using the VEIN model. We analysed the results in terms on annual mean and daily PM concentrations and exceedances of  EU limit and WHO recommended values.


Acknowledgement: The study was supported by the LIFE Remy [No: LIFE20 PRE/IT/000004 ], LIFE-MAPPINGAIR/PL [No: LIFE17 GIE/PL/000631] and the Polish National Science Centre project [No: UMO-2021/43/B/ST10/01189].

How to cite: Walkowicz, A., Jeleniewicz, G., Kryza, M., Sattari, A., Strużewska, J., and Werner, M.: The impact of the re-emission of road dust by vehicles passages on particulate matter concentrations – a case study with EMEP MSC-W, EGU General Assembly 2024, Vienna, Austria, 14–19 Apr 2024, EGU24-5270, https://doi.org/10.5194/egusphere-egu24-5270, 2024.

EGU24-5408 | Orals | AS3.21

The search for the best airborne pollen monitoring locations 

Willem W. Verstraeten, Nicolas Bruffaerts, Rostislav Kouznetsov, Mikhail Sofiev, and Andy Delcloo

In Europe a quarter of the adult population and a third of all children suffer from allergenic airborne pollen thereby decreasing the quality of life. In order to ease the pollen induced symptoms mitigation measures can be applied. This, however, requires timely information on forthcoming pollen episodes derived from early warning systems. These systems can substantially be improved when pollen observations from strategically well-chosen pollen monitoring stations are assimilated.

Here we explore the network quality (i) and network coverage (ii) of the current five pollen monitoring stations in Belgium. As reference dataset we use the spatio-temporal distributions of daily surface airborne birch and grass pollen levels as produced by the operational early warning system for pollen on the website of the Royal Meteorological Institute of Belgium. This system implements the SILAM model (System for Integrated modeLling of Atmospheric coMposition) and ECMWF meteorological data.

The ability of the network to reproduce the concentration field over the region of interest is quantified by the RMSE computed from the reference concentration field and the interpolated concentration field for each day of the pollen season. In the first step, time series of the current daily pollen observations in the network are interpolated over space by applying the radial-based function. This results in the daily interpolated concentration fields which we compare with the spatially distributed daily reference data.

For evaluating the network coverage of the current five monitoring stations we perform a footprint-based analysis. Footprints relate directly to the fraction of air reaching the monitoring device. By applying pollen emission point sources in the five stations into SILAM that is run in the backward mode (three days back), we can investigate the travelling trajectory of the captured birch and grass pollen in the air observed at the network stations. Nine pollen seasons (2013-2021) were analyzed using ECMWF ERA5 meteorology.

First results on the network quality for birch pollen show that over a period of nine pollen seasons more than 60% of the daily RMSE values derived from the interpolated daily concentrations are less than their mean value. This is an indication that the interpolated network performs well compared to the spatio-temporal reference dataset derived from SILAM. For the 2013 birch pollen season more than 80% is reached. In contrast, this is only ~40% for 2020. The applied time scale is of great importance, since at smaller time scales (days, hours) network configurations may degrade faster than on larger time steps (weeks, months, seasons).

The footprint-based analysis shows that on average the coverage of the monitoring stations for birch pollen is quite good. There are, however, large differences during the 2013-2022 seasons which might be due to the typical large inter-seasonal variation in birch pollen production. For grass pollen, the average coverage is better, and the inter-seasonal variation much lower.

How to cite: Verstraeten, W. W., Bruffaerts, N., Kouznetsov, R., Sofiev, M., and Delcloo, A.: The search for the best airborne pollen monitoring locations, EGU General Assembly 2024, Vienna, Austria, 14–19 Apr 2024, EGU24-5408, https://doi.org/10.5194/egusphere-egu24-5408, 2024.

EGU24-6190 | Orals | AS3.21

Gridded Post-Processing Air Quality Predictions based of the Community Multi-scale Air Quality (CMAQ) Model 

Stefano Alessandrini, Scott Meech, Rajesh Kumar, Ju Hye Kim, Jared Lee, Irina Djalalova, and James Wilczak

We present the outcomes of our 2-year endeavor as part of the NOAA Joint Technology Transfer Initiative (JTTI). This project aimed to enhance the operational air quality forecasts over the United States generated by the National Air Quality Forecasting Capability (NAQFC) at NOAA/NCEP. We focused on applying machine learning (ML) post-processing techniques to refine forecasts from the Community Multi-scale Air Quality (CMAQ) model.

In particular, our efforts concentrated on extending the analog ensemble (AnEn) model, currently utilized at NAQFC, from its existing point-based application to encompass 2D gridded predictions. This approach, known for its success in weather prediction systems for various meteorological parameters, has also been applied in predicting ozone and fine particulate matter (PM2.5) concentrations at surface monitoring sites within the Environmental Protection Agency (EPA) AirNow network.


The AnEn methodology effectively mitigates systematic and random errors present in CMAQ model forecasts, as highlighted in previous studies (Djalalova et al., 2015; Delle Monache et al., 2020). Furthermore, the AnEn method has demonstrated its proficiency in providing accurate and dependable probabilistic wind speed predictions (Alessandrini et al., 2019).


The foundation of the AnEn technique relies on a training dataset comprised of predictions from the CMAQ model and corresponding observational data for the specific quantity of interest (e.g., O3 or PM2.5). This dataset is used to generate ensemble predictions for future time points based on historical observations. The ensemble construction involves selecting past CMAQ forecasts (referred to as analogs) that best match the current deterministic CMAQ forecast. This matching process considers variables including the pollutant concentration and correlated meteorological parameters such as wind, temperature, and relative humidity. 

Our study involved an initial application of the AnEn technique to correct CMAQ PM2.5 and ozone surface-gridded concentrations. This was accomplished by combining historical gridded chemical reanalysis data from the Copernicus Atmosphere Monitoring Service (CAMS) Near-Real-Time model with measurements obtained from AirNow monitoring stations. The CAMS analysis integrates satellite-derived data on various atmospheric components and is employed with the ECMWF's Integrated Forecasting System (IFS). The resulting 2D gridded CAMS analysis fields are produced every 12 hours with a spatial resolution of approximately 40 km.

The AnEn method necessitates a continuous training dataset comprising hourly observed chemical concentrations. We utilized each 12-hour CAMS analysis along with the subsequent 11 forecast hours to fulfill this requirement, creating a consistent sequence of hourly gridded observations or pseudo-observations. Through the Satellite-Enhanced Data Interpolation technique (SEDI) (Dinku et al., 2015), we merged CAMS surface PM2.5 and ozone fields with corresponding observations from the AirNow network. This technique corrects biases present in CAMS data and short-term forecasts while retaining the accuracy of AirNow measurements at their respective station locations. 

Our presentation encompasses multiple phases of validation and verification. Initially, we validated the SEDI-corrected CAMS concentrations against AirNow PM2.5 and ozone measurements obtained from stations not part of the SEDI correction process. Subsequently, we assess the performance of the entire forecasting system over the contiguous United States within the 0-72 hour lead time range. This evaluation employs standardized verification metrics applicable to both deterministic and probabilistic forecasts.

How to cite: Alessandrini, S., Meech, S., Kumar, R., Kim, J. H., Lee, J., Djalalova, I., and Wilczak, J.: Gridded Post-Processing Air Quality Predictions based of the Community Multi-scale Air Quality (CMAQ) Model, EGU General Assembly 2024, Vienna, Austria, 14–19 Apr 2024, EGU24-6190, https://doi.org/10.5194/egusphere-egu24-6190, 2024.

EGU24-6529 | Posters on site | AS3.21

Sources of PM2.5- and ozone-related health impacts in Europe and their response to emission changes 

Yixuan Gu, Daven Henze, M. Omar Nawaz, and Ulrich Wagner

The deterioration of air quality is a global concern, contributing to millions of premature deaths annually worldwide. In Europe alone, hundreds of thousands of lives are cut short every year due to the effects of air pollution. This alarming reality underscores the need to comprehensively understand the cause of regional air pollution and find cost-effective solutions to mitigate the consequences of air pollution on public health. We have recently established an improved decision support tool to characterize high-resolution sensitivity of PM2.5- and ozone-related health impacts to different species emissions in Europe by incorporating the satellite-derived surface PM2.5 concentration products into the GEOS-Chem adjoint model. In 2015, the total PM2.5- and ozone-related premature deaths are estimated to be 449,813 (257,846–722,138) and 25,432 (7,356–53,160), respectively. The anthropogenic emissions of nitrogen oxides (NOx), ammonia, and organic carbon contributed most to the PM2.5-related health damages, making up 29.6%, 23.2%, and 16.8%, respectively of all domestic anthropogenic contributions. Residential, agricultural, and ground transport emissions are calculated to be the largest sectoral sources of PM2.5-related health risks, accounting for 23.5%, 23.0%, and 19.4%, respectively, of total anthropogenic contributions within Europe. The ozone-related health impacts are mostly associated with the contributions from NOx emissions. A 20% decrease in anthropogenic emissions can help to avoid 1576 (467–3,252) premature deaths from respiratory diseases. Within these benefits, contributions from emissions of NOx, volatile organic compounds (VOCs), and CO help to avoid 1105 (328–2,300), 381 (113–770), and 99 (29–200) premature deaths, respectively. During 2005–2015, emission controls reduced PM2.5-related health damages in nearly all European countries, resulting in 63,538 (46,092–91,082) fewer PM2.5-related premature deaths. However, our calculation suggests that efforts to reduce air pollution from key sectors in some countries can be offset by the lack of emissions control in others. The emission changes also lead to general increases in the marginal ozone-related health benefit per unit of NOx emission reduction. Increasing marginal health benefits imply that more costly regulations of NOx emissions are economically justified even as total anthropogenic emission are declining. International cooperation will thus be important for effectively tackling air pollution and reducing corresponding detrimental effects on public health in Europe.

How to cite: Gu, Y., Henze, D., Nawaz, M. O., and Wagner, U.: Sources of PM2.5- and ozone-related health impacts in Europe and their response to emission changes, EGU General Assembly 2024, Vienna, Austria, 14–19 Apr 2024, EGU24-6529, https://doi.org/10.5194/egusphere-egu24-6529, 2024.

EGU24-6741 | Orals | AS3.21

An ensemble investigation of the causes for regional air-quality model critical load exceedances prediction variability in European and North American domains using diagnostics from Phase 4 of the Air Quality Model Evaluation International Initiative 

Paul Makar, Philip Cheung, Christian Hogrefe, Akingunola Ayodeji, Ummugulsum Alyuz-Ozdemir, Jesse Bash, Michael Bell, Roberto Bellasio, Roberto Bianconi, Tim Butler, Hazel Cathcart, Olivia Clifton, Amanda Cole, Alma Hodzic, Iannis Kioutsioukis, Kranenburg Richard, Aurelia Lupascu, Jason A. Lynch, John-Kester Momoh, and JuanLuis Perez-Camanyo and the Remaining AQMEII4 Critical Load and Modelling Team Members

We summarize tentative findings from multi air quality model ensembles for the years 2009 and 2010 in Europe (EU), and 2010 and 2016 in North America (NA), under AQMEII-4.  The model predictions of sulphur and nitrogen deposition were used to estimate exceedances of critical loads for acidification and eutrophication, to show the extent to which the ensemble members agree in the magnitude and the trend of ecologically meaningful impacts.  Model exceedance variability was analyzed using AQMEII-4 diagnostics.  Evaluation against concentration and wet deposition observations, coupled with these diagnostics, identified specific process representations as the causes for variability between model predictions and for reduced model performance. 

All models predicted reductions in ecosystem acidification impacts in North America between the years 2010 and 2016, in accord with SO2 emissions reduction legislation which started in 2010 (SO2 SIP) However, all models in EU and NA domains had net negative biases for wet deposition of sulphur and nitrogen relative to observations.  The wet S deposition average mean bias for the NA ensemble was -0.17 eq ha-1 d-1, and for the EU ensemble -1.15 eq ha-1 d-1.  The NA daily wet deposition average mean bias for NH4+ was -0.37 eq ha-1d-1; EU -1.19 eq ha-1 d-1.  The daily NA wet NO3- deposition average mean bias was -0.24 eq ha-1d-1; EU -0.69 eq ha-1 d-1.  The members of the ensemble diverged (factor of 10) in their North American predictions for Ndep and consequently their eutrophication exceedances. The models with the highest eutrophication predictions also predicted the highest levels of gas-phase ammonia dry deposition (standard deviation of ammonia dry deposition flux across ensemble members was larger than the ensemble average).  These models also had negative biases of predicted ammonia concentrations; average mean biases of -0.63 (satellite NH3) and -0.85 ppbv (surface NH3) compared to ensemble averages of -0.30 and -0.34 ppbv.  Diagnostics showed that these differences resulted from the manner in which bidirectional ammonia fluxes were parameterized within these models.  The second largest source of NA eutrophication prediction variability were models with positive biases in particulate ammonium and nitrate concentrations, and higher particle nitrogen deposition levels ( particle ammonium concentration bias +0.35 ug m-3; ensemble bias +0.15 ug m-3).   We believe two factors may have led to these latter overestimates:  higher levels of fine mode particle nitrate formation compared to other models (due to the use of an inorganic heterogeneous chemistry algorithm which did not take base cation chemistry into account), and updates to particle dry deposition velocities carried out in the absence of concurrent updates to wet scavenging algorithms. 

The relative importance of dry gas, dry particulate, and wet deposition towards total sulphur and nitrogen deposition totals differed between EU and North American domains, though all models had negative biases in wet deposition as noted above.  Parallel and subsequent work suggests that multiphase hydrometeor scavenging may improve model wet deposition performance. 

An increased research focus is recommended for four model processes: multiphase hydrometeor scavenging, ammonia bidirectional fluxes, base cation chemistry and emissions, and particle dry deposition. 

How to cite: Makar, P., Cheung, P., Hogrefe, C., Ayodeji, A., Alyuz-Ozdemir, U., Bash, J., Bell, M., Bellasio, R., Bianconi, R., Butler, T., Cathcart, H., Clifton, O., Cole, A., Hodzic, A., Kioutsioukis, I., Richard, K., Lupascu, A., Lynch, J. A., Momoh, J.-K., and Perez-Camanyo, J. and the Remaining AQMEII4 Critical Load and Modelling Team Members: An ensemble investigation of the causes for regional air-quality model critical load exceedances prediction variability in European and North American domains using diagnostics from Phase 4 of the Air Quality Model Evaluation International Initiative, EGU General Assembly 2024, Vienna, Austria, 14–19 Apr 2024, EGU24-6741, https://doi.org/10.5194/egusphere-egu24-6741, 2024.

EGU24-6766 | ECS | Orals | AS3.21

Evaluating the Impact of Resolving Hourly Anthropogenic Emissions on Air Pollutant Simulations in the United States Using the MUSICAv0 Model 

Madankui Tao, Arlene M. Fiore, Louisa K. Emmons, Gabriele G. Pfister, Duseong S. Jo, and Wenfu Tang

The capacity of chemical transport models to accurately simulate air pollutant concentrations and their diurnal changes is essential for pollution source attribution and exposure risk assessment. The Community Earth System Model (CESM) incorporates full chemistry from the Community Atmosphere Model (CAM-chem) and horizontal mesh refinement through the spectral element (SE) dynamical core, offering an innovative framework to study air pollution impacts at various spatial scales with globally consistent dynamics and chemistry. We use this CAM-chem-SE configuration featuring a ∼14km×14km refined grid for the contiguous United States (CONUS) within a 1°×1° global horizontal mesh, referred to as the Multi-Scale Infrastructure for Chemistry and Aerosols version 0 (MUSICAv0). Our analysis compares the standard MUSICAv0 CAMS-GLOB-ANT v5.17 emissions with the 2017 U.S. National Emissions Inventory (NEI) and examines the effects of replacing monthly with hourly anthropogenic emissions on simulated trace gas concentrations and their diurnal variations for July 2018. The study examines three scenarios: ‘base’ with global monthly CAMS emissions; ‘monthlyNEI,' which replaces monthly NEI over the CONUS but retains CAMS elsewhere; and ‘hourlyNEI,' which uses hourly instead of monthly NEI over CONUS. We divide the CONUS domain into West Coast, Mountain, Midwest, Southwest, Southeast, and Northeast for model evaluation. July daily averages from the ‘base’ model simulations (0:00 to 23:00, local time) compared with State and Local Air Monitoring Stations (SLAMS) measurements show high model biases in surface nitrogen dioxide (NO2) concentrations of 23-40% (1-3 ppb) in all but the Mountain region where a low bias of -18% (-1 ppb) occurs, and in surface ozone (O3) of 11-28% (6-13 ppb); and low biases of -21 to -80% (10-60 ppb) in surface carbon monoxide (CO). Modeled tropospheric vertical column densities (VCDTrop) of formaldehyde (HCHO) and NO2, calculated using TROPOspheric Monitoring Instrument (TROPOMI) satellite retrieval averaging kernels at 1:30 PM local time, show HCHO overestimates of 14-24% and NO2 underestimates of 35-52% across the six regions. Integrating NEI emissions (‘monthlyNEI’ and ‘hourlyNEI’ cases) enhances agreement with observations by improving spatial correlations and reducing model mean biases for NO2, O3, and CO surface simulations compared to the ‘base’ case. However, improvements in the ‘monthlyNEI’ and ‘hourlyNEI’ cases are region-specific; for instance, ‘monthlyNEI’ shows a lower model O3 bias on the West Coast but a higher bias in the Northeast than ‘hourlyNEI.' Likewise, the high bias in modeled HCHO VCDTrop compared with TROPOMI is reduced by approximately 1-3% compared to the ‘base’ case, but the low bias in NO2 VCDTrop worsens by 10-20%. Subsequent work will assess diurnal variations in MUSICAv0-simulated trace gas concentrations, comparing them across the three scenarios and with observational data.

How to cite: Tao, M., Fiore, A. M., Emmons, L. K., Pfister, G. G., Jo, D. S., and Tang, W.: Evaluating the Impact of Resolving Hourly Anthropogenic Emissions on Air Pollutant Simulations in the United States Using the MUSICAv0 Model, EGU General Assembly 2024, Vienna, Austria, 14–19 Apr 2024, EGU24-6766, https://doi.org/10.5194/egusphere-egu24-6766, 2024.

EGU24-6906 | ECS | Posters on site | AS3.21

Process analysis of Contribution to High Concentration PM2.5 

HyeunSoo Kim, Peel-Soo Jeong, Eun-Seong Son, Seung-Hee Han, Kyung-Hui Wang, and Hui-young Yun

To prevent the occurrence of high concentrations of PM2.5, Korea has implemented policies to reduce domestic emissions, such as seasonal fine dust control systems and restrictions on the operation of old diesel vehicles, and has established intensive measurement stations by region to analyze and monitor the ionic composition of major substances such as PM2.5 and PM1, which are used for policy formulation and research.

The secondary reaction precursors of PM2.5 are nitrate, sulfate, and ammonium, and the contribution of these precursors varies depending on geographical characteristics and emission source characteristics. According to previous studies, the contribution of OA in Seoul was 27%, nitrate 42%, ammonium 21%, sulfate 8%, and other 2%, while the contribution of OA in Seosan was 40%, nitrate 29%, ammonium 15%, sulfate 12%, and other 4%.(Kim et al, 2022)

PM2.5 is a representative secondary phase pollutant along with ozone, which is highly influenced by meteorological factors such as humidity, wind speed, and wind direction, and its concentration changes due to the combination of particulate matter and gaseous matter, so it is important to predict it. In general, chemical transport models such as CMAQ (Community Multi-scale Air Quality) and CAMx (Comprehensive Air quality Model with extensions) are mainly used to prediction PM2.5, and in recent years, LSTM models using machine learning have also been utilized.

In this study, we analyze the hourly concentration of PM2.5 in Korea in 2019, analyze the physicochemical characteristics of PM2.5 concentrations to identify the causes of high concentration episodes, and identify the effects of topography characteristics on PM2.5. To analyze the causes of high PM2.5 concentrations in high concentration episodes, we first analyze the physicochemical contribution through the Process Analysis (PA) tool of CMAQ. In addition, to identify the causes of high concentrations by region, we analyze the effects of topography characteristics on PM2.5 using the National Oceanic and Atmospheric Administration (NOAA) Hybrid Single-particle Lagrangian Integrated Trajectory (HYSPLIT) model, which is a reverse trajectory model, to evaluate the causes of high concentrations.

Reference:

N.K. Kim, Y.P. Kim, Y.S. Ghim, M.J. Song, C.H. Kim, K.S. Jang, K.Y. Lee, H.J. Shin, J.S. Jung, Z. Wu, A. Matsuki, N. Tang, Y. Sadanaga, S. Kato, A. Natsagdorj, S. Tseren-Ochir, B. Baldorj, C.K. Song, J.Y. Lee, Spatial distribution of PM2.5 chemical components during winter at five sites in Northeast Asia: High temporal resolution measurement study, Atmospheric Environment, Volume 290, 1 December 2022, 119359
https://doi.org/10.1016/j.atmosenv.2022.119359

Acknowledgments
This research was supported by Particulate Matter Management Specialized Graduate Program through the Korea Environmental Industry & Technology Institute(KEITI) funded by the Ministry of Environment(MOE)

How to cite: Kim, H., Jeong, P.-S., Son, E.-S., Han, S.-H., Wang, K.-H., and Yun, H.: Process analysis of Contribution to High Concentration PM2.5, EGU General Assembly 2024, Vienna, Austria, 14–19 Apr 2024, EGU24-6906, https://doi.org/10.5194/egusphere-egu24-6906, 2024.

EGU24-7993 | Orals | AS3.21

Sources and seasonality of black carbon in Europe 

Sabine Eckhardt, Rona Thompson, Nikolaos Evangeliou, Ignacio Pisso, Massimo Cassiani, Karl Espen Yttri, and Stephen M. Platt

Black Carbon, emitted during incomplete combustion, is harmful to human health and also an important climate forcer with a dominating warming component. When deposited on snow it decreases albedo and leads to early melting, while in the atmosphere it can absorb radiation and lead to warming. The emission sources are both anthropogenic and natural. In winter anthropogenic sources, like domestic burning are important, while during summertime black carbon from wild fires plays a major role.

Black carbon concentrations are derived from observations of the aerosol absorption coefficient and then converted to an equivalent black carbon concentration and recorded at over 20 sites in Europe. However, the measurements on these sites are not homogeneous, as different mass absorption coefficients should be applied depending on location and season. For the years 2017-2022 we obtained a unified dataset of hourly black carbon concentrations for Europe. 

A statistical method (a non negative matrix factorization based on different wavelengths) is used to split the observed black carbon into a fraction originating from fossil fuel and from biomass burning sources. The Lagrangian transport model FLEXPART is used in combination with the ECLIPSE and GFED emission inventories to model BC concentrations for the European sites and analyse the source regions for each source type.

By comparing the observations and modelled concentrations  we are able to assess the correctness of the emission inventories, and using statistical optimization we can provide an updated emission estimate. We will present the sources and their seasonality and point to weaknesses in the emission inventories.

How to cite: Eckhardt, S., Thompson, R., Evangeliou, N., Pisso, I., Cassiani, M., Yttri, K. E., and Platt, S. M.: Sources and seasonality of black carbon in Europe, EGU General Assembly 2024, Vienna, Austria, 14–19 Apr 2024, EGU24-7993, https://doi.org/10.5194/egusphere-egu24-7993, 2024.

EGU24-8040 | ECS | Posters on site | AS3.21

Assessing the nonlinearity and cost effectiveness of PM2.5 in response to emission changes in North China with the adjoint method 

Ni Lu, Lin Zhang, Xiaolin Wang, Yixin Guo, Xingpei Ye, Zehui Liu, Danyang Li, Jiayu Xu, and Daven Henze

While great efforts have been made to China’s clean air actions since 2013 and effectively mitigated PM2.5 pollution, the emission-concentration relationships and cost-effectiveness may have changed substantially and are poorly constrained. Large emission reductions during the COVID-19 lockdown period in early 2020 did not similarly alleviate PM2.5 pollution in North China, reflecting a distinct nonlinear chemical response of PM2.5 formation to emission changes. At the same time, strengthened emissions standards and elimination of outdated industrial capacities have replaced the existing technologies and increased the cost of pollution control. Here we apply emission-concentration relationships for PM2.5 diagnosed using the adjoint approach to quantitatively assess how chemical nonlinearity affects PM2.5 over Beijing in February 2020 in response to two emission reduction scenarios: the COVID-19 lockdown and 2013-2017 emission controls, and further evaluate the marginal cost and benefit of possible technological alternatives. We find that, in the absence of chemical nonlinearity, the COVID-19 lockdown would decrease PM2.5 in Beijing by 10.6 μg m-3, and the 2013-2017 emission controls resulted in a larger decrease of 54.2 μg m-3 because of greater reductions of SO2 and primary aerosol emissions. Chemical nonlinearity offset the decrease for Beijing PM2.5 by 4.7 μg m-3 in lockdown, which was mainly attributed to enhanced sensitivity of aerosol nitrateto NOx emissions, but enhanced the efficiency of 2013-2017 emission controls by 12.5 μg m-3 due to the weakened heterogeneous reaction of sulfate. For further PM2.5 mitigation, emission reductions in ammonia by urea substitution and primary PM2.5 with electrostatic precipitator have high PM2.5 reduction potential and cost effectiveness. Such chemical nonlinearity and cost optimization are important to estimate and consider when designing or assessing air pollution control strategies.


How to cite: Lu, N., Zhang, L., Wang, X., Guo, Y., Ye, X., Liu, Z., Li, D., Xu, J., and Henze, D.: Assessing the nonlinearity and cost effectiveness of PM2.5 in response to emission changes in North China with the adjoint method, EGU General Assembly 2024, Vienna, Austria, 14–19 Apr 2024, EGU24-8040, https://doi.org/10.5194/egusphere-egu24-8040, 2024.

EGU24-8499 | Posters on site | AS3.21

Country-to-country exchanges of PM2.5 related mortality over the Mediterranean 

Dimitris Akritidis and Andrea Pozzer

Fine particulate matter (PM2.5) is detrimental to human health. Long term exposure to ambient PM2.5 is associated with excess mortality from respiratory, cardiovascular, and other non-communicable diseases. The mixture of anthropogenic and natural aerosols, as well as the prevailing atmospheric conditions, make the broader Mediterranean region one of the most polluted areas around the world. The national anthropogenic emissions and demographics, as well as the atmospheric pollution transport pathways shape the import and export of PM2.5 and associated mortality in a country level. Here, we perform an assessment of the anthropogenic PM2.5 related excess mortality exchanges between countries of the broader Mediterranean region using the chemistry general circulation model EMAC (ECHAM5/MESSy for Atmospheric Chemistry) and the GBD (Global Burden of Disease) 2019 methodology for the mortality calculations. The EMAC simulations are carried out in a T106 horizontal resolution (equivalent to 1.1 x 1.1 degree at the equator) for the year 2015, nudged towards the ERA5 dynamics, and following a zero-out approach (turn-off) for the CEDS (Community Emissions Data System, 2020-v1) anthropogenic emissions of each country. The results indicate that the hot spot countries of anthropogenic PM2.5 related mortality import and export are mainly driven by the countries’ population and emissions, respectively, and their relative location.       

DA acknowledges support for enhancing the operation of the National Network for Climate Change (CLIMPACT), National Development Program, General Secretariat of Research and Innovation (2023ΝΑ11900001 - Ν. 5201588). AP acknowledges the European Commission Horizon Europe project FOCI (grant agreement No 101056783).

How to cite: Akritidis, D. and Pozzer, A.: Country-to-country exchanges of PM2.5 related mortality over the Mediterranean, EGU General Assembly 2024, Vienna, Austria, 14–19 Apr 2024, EGU24-8499, https://doi.org/10.5194/egusphere-egu24-8499, 2024.

EGU24-8844 | ECS | Orals | AS3.21 | Highlight

TOPAS-CH4: a service for methane monitoring, source attribution and emission reduction over Europe 

Riccardo Nanni, Hugo Dernier van der Gon, Arjo Segers, Martijn Schaap, and Janot Tokaya

Methane (CH4) is the second-largest contributor to the anthropogenic greenhouse effect, and have been the focus of recent climate summits and global commitments towards emission reductions. To mitigate and study the impact of anthropogenic CH4 emissions, the European Union started AVENGERS, a research and innovation project funded under the Horizon Europe, with 13 Partners from 6 countries, whose objective is to reconcile reported greenhouse gasses (GHGs) emissions with independent information from atmospheric observations using top-down methods and process-based models, and thereby reduce the most important uncertainties of national emission inventories.

Here, we present TOPAS-CH4, an operational service developed by TNO as part of the AVENGERS project, following the example of a previous TNO source apportionment tool for particulate matter. This online public service provides users with the relevant daily information on CH4 concentrations over the EU countries, and how much different sources contribute to these observed  concentrations. TOPAS CH4 is based on the chemical transport model, LOTOS-EUROS, that runs daily to simulate source-labelled CH4 concentrations over Europe. The predicted CH4 concentrations are compared with the Integrated Carbon Observation System (ICOS) observations on a daily basis, showing that LOTOS-EUROS is able to realistically simulate the CH4 volume mixing ratios. Furthermore, the simulated CH4 concentrations are labelled per sector and country of emission, providing the users more insights about which European sectors and countries are mostly responsible for the additional CH4 concentrations above the background for a specific region. This information can be used to identify mitigation targets and, on the longer term, monitor changes in source contributions following successful abatement. We also show the comparison results for specific ICOS stations where the LOTOS-EUROS well matches the reported concentrations, as well as, locations where the model still performs poorly, finally providing some insights on how to improve the current simulation model.

How to cite: Nanni, R., Dernier van der Gon, H., Segers, A., Schaap, M., and Tokaya, J.: TOPAS-CH4: a service for methane monitoring, source attribution and emission reduction over Europe, EGU General Assembly 2024, Vienna, Austria, 14–19 Apr 2024, EGU24-8844, https://doi.org/10.5194/egusphere-egu24-8844, 2024.

EGU24-8920 | Orals | AS3.21 | Highlight

Economic Impacts of Air Pollution on Health in the Arctic Council Countries 

Shilpa Rao, Jørgen Brandt, Zbigniew Klimont, Ulas Im, Pontus Roldin, and Simon Wilson

Introduction

Ambient air pollution is a key factor for mortality and morbidity in the Arctic countries. It ranks among the 10 leading risk factors for premature death in Arctic Council Member and Observer countries.  There are large economic implications of these health impacts including losses in labor productivity. Arctic Council countries (USA, Canada, Russia and Nordic countries) have affirmed their support to collectively bring black carbon emissions down by 25-33% by 2025 from 2013 levels.   In this study, we investigate the health and economic implications of improved air quality actions in the Arctic.

Methods

We use the ECLIPSEv6b Current Air Quality Legislation (CLE) and the Maximum Feasible Reduction (MFR) Sustainable Development Scenario (SDS) scenario to examine a range of development of PM2.5, and ozone related air quality concentrations for 2020, 2030 and 2050 for the Nordic countries. We estimate the mortality and morbidity impacts of these scenarios using the Economic Valuation (EVA) model and use national estimates to verify these numbers. We further calculate the economic costs related to health effects of air pollution using the EVA model and estimates of number of premature deaths or years of life lost due to the exposure in each population. We also calculate the direct costs of illnesses (health care costs like hospitalizations and medications), direct non-health care costs (such as social services and childcare), and indirect costs (such as productivity losses).

Results

For Arctic Council Member countries, adhering to current legislation to reduce PM2.5 and ozone would avoid an estimated 66,000 premature deaths in 2030 compared to 2015. In the more ambitious Maximum Feasible Reduction scenario, an estimated 97,000 premature deaths would be avoided in 2030.    We observe that hospital admissions due to cardiovascular and respiratory diseases (CHA and RHA) are 193183 in 2020 in the Arctic countries. The CLE scenario does not lead to a huge change in these numbers, but the MFR and SDS scenarios results in a huge decrease in these cases (33% decrease in CHA and RHA in 2030). The reductions stabilize over time and in 2050, reductions are the same as 2030. We also measure the morbidity in terms of work loss days and restricted activity days. We find that nearly 200 million workdays are lost or restricted due to air pollution in 2020 and the MF-SDS scenario yields significant reductions to nearly 132 million days due to enhanced policies on air pollution. The costs of illness and productivity days decline significantly across the scenarios.

Conclusions

Strengthening air pollution legislations to the technically feasible level and phasing out fossil fuel use leads to a decrease in mortality by 35-50 % in 2050 and a decline in morbidity by 30-40% in the Arctic Council countries. The monetary related benefits in these countries are estimated at 250-750 billion euro in 2050. These benefits likely exceed the costs associated with these actions. Actions on reducing air pollution and fossil fuels are valuable input in supporting the currently proposed European Green Deal, revision of EU air quality legislation and the setting of a zero-pollution objectives for air quality.

How to cite: Rao, S., Brandt, J., Klimont, Z., Im, U., Roldin, P., and Wilson, S.: Economic Impacts of Air Pollution on Health in the Arctic Council Countries, EGU General Assembly 2024, Vienna, Austria, 14–19 Apr 2024, EGU24-8920, https://doi.org/10.5194/egusphere-egu24-8920, 2024.

EGU24-9649 | ECS | Orals | AS3.21

Considerable impacts of meteorological field choices on tropospheric ozone simulations by a global chemistry transport model 

Kun Qu, Nikos Daskalakis, Maria Kanakidou, and Mihalis Vrekoussis

The meteorological field serves as a vital input for chemical transport models (CTMs) to simulate tropospheric ozone pollution. For global CTMs, it is often directly provided by reanalysis meteorology datasets. Different choices of meteorological fields are likely to yield varied ozone levels and contributions of ozone-related processes, e.g., transport, chemical production/loss and dry deposition, to the variations of ozone pollution. However, relevant comparisons are seldom reported. Here we investigate the impact of meteorological field choices on the results of tropospheric ozone simulations performed by the TM4-ECPL global model. Two generations of meteorological reanalysis products from the European Centre for Medium-Range Weather Forecasts (ECMWF), ERA-Interim and ERA5, are selected as input meteorological fields to drive the model for this comparative study. Results show that when driven by ERA5 meteorology, the model generates considerably higher mean mixing ratios of tropospheric ozone for the period of 2013-2017 compared to ERA-Interim-based results. This outcome is particularly pronounced in the high-latitude areas of both hemispheres and near the surface (by 5-10 ppbV). The model results by using both meteorological fields are validated against air quality monitoring data from over 10,000 sites and ozonesonde measurements globally. When using ERA5, the overestimation of near-ground Ox (ozone + NO2) levels by the model becomes more notable than using ERA-Interim (increases from 6% to 25%). However, the underestimation of ozone levels in the middle and high troposphere is reduced. Both simulations can well reproduce the annual trends of near-surface ozone pollution, indicating a more important role of ozone precursor emissions in driving ozone changes. Furthermore, through sensitivity simulations and budget analysis, we delve into the reasons behind the considerably higher ozone levels in the ERA5-driven simulation. 

How to cite: Qu, K., Daskalakis, N., Kanakidou, M., and Vrekoussis, M.: Considerable impacts of meteorological field choices on tropospheric ozone simulations by a global chemistry transport model, EGU General Assembly 2024, Vienna, Austria, 14–19 Apr 2024, EGU24-9649, https://doi.org/10.5194/egusphere-egu24-9649, 2024.

EGU24-10044 | ECS | Orals | AS3.21

Impact of NOx emissions from lightning on mid-tropospheric ozone concentrations in the North Hemisphere: a modelling study 

Sanhita Ghosh, Sylvain Mailler, Laurent Menut, and Arineh Cholakian

The present study assesses the impact of the nitrogen oxides emissions from lightning (LiNOx) on mid-tropospheric ozone concentrations using simulations with the CHIMERE model, through a detailed evaluation of simulated tropospheric ozone (O3) with respect to observations. LiNOx emissions have been implemented in the model (CHIMERE v2020r1). The chemistry-transport model CHIMERE is coupled online with the Weather Research and Forecasting (WRF) meteorological model. Two simulations have been carried out for year 2018, (i) including LiNOx emissions and (ii) without LiNOx emissions, in CHIMERE to examine the impact of LiNOx on the pollutant concentration in comparison to that without LiNOx emissions. In this study the simulations are performed over the northern hemisphere at a horizontal resolution of 100 km x 100 km.

The experiments show an increase in surface-level O3 by 4-8 ppbv over most part of northern hemisphere, while a large increase by 10-20 ppbv is observed over parts of south America and Africa due to inclusion of LiNOx. The increase in simulated O3 is high (10-20 ppbv) at middle troposphere in comparison to surface and upper troposphere. We have compared the model outputs to radiosonde measurements (World Ozone and Ultraviolet Radiation Data Centre), showing that including the NOx emissions from lightning substantially improves the realism of model simulations, significantly reducing bias and error when compared to measurements. This is particularly true in the middle troposphere. These results show that, for hemispheric or global studies, it is very important to include a realistic representation of lightning NOx emissions, because they critically influence ozone concentrations, but also the concentrations of OH, and therefore the lifetime of many greenhouse and trace gases such as methane.

How to cite: Ghosh, S., Mailler, S., Menut, L., and Cholakian, A.: Impact of NOx emissions from lightning on mid-tropospheric ozone concentrations in the North Hemisphere: a modelling study, EGU General Assembly 2024, Vienna, Austria, 14–19 Apr 2024, EGU24-10044, https://doi.org/10.5194/egusphere-egu24-10044, 2024.

EGU24-10056 | ECS | Orals | AS3.21

 Air Emission Inventory and AI- based Air Quality Forecasting Models for Developing Countries: A Case Study of Ho Chi Minh City, Vietnam 

Quoc Bang Ho, Khue Hoang Ngoc Vu, Tam Thoai Nguyen, and Ricardo Simon Carbajo

Outdoor air pollution damages the climate and causes many diseases, including cardiovascular diseases, respiratory infections, and lung damage. Understating of air pollution sources and accurate hourly forecasting of air pollution concentrations is thus of significant importance for public health, helping the citizens to plan the measures to alleviate the harmful effects of air pollution on health. This study conducts air emision inventory (EI), analyses and discusses the temporal characteristics of air pollutants at different locations in Ho Chi Minh City (HCMC), Vietnam - an economic center and a megacity in a developing country with a population of 8.99 million people and more than 8 million of private vehicles.

A combination of bottom-up and top-down approaches was employed to conduct air pollution EI, in which EMISENS model was utilized to generate the EI for road traffic sources. The results showed that the motorcycles were the main reasons of emission in HCMC, contributing 90% of CO, 68% of non-methane volatile organic compounds (NMVOC), 63% of CH4, 41% of SO2, 29% of NOx, and 18% of patriculate matter (PM2.5).

We developed several AI-based one-shot multi-step PM2.5 forecasting models, with both an hourly forecast granularity (1h to 24h) and a 24-hour rolling mean. These Machine Learning algorithms include Stochastic Gradient Descent Regressor, hybrid 1D CNN-LSTM, eXtreme Gradient Boosting Regressor, and Prophet. We collected the data from six monitoring stations installed by the HealthyAir project partners at different locations in HCMC, including traffic, residential and industrial areas in the city. In addition, we developed a suitable model training protocol using data from a short period to address the non-stationarity of PM2.5 time series. Our proposed PM2.5 forecasting models achieve state-of-the-art accuracy and will be deployed in our HealthyAir mobile app to warn HCMC citizens of air pollution issues in the city. 

How to cite: Ho, Q. B., Vu, K. H. N., Nguyen, T. T., and Carbajo, R. S.:  Air Emission Inventory and AI- based Air Quality Forecasting Models for Developing Countries: A Case Study of Ho Chi Minh City, Vietnam, EGU General Assembly 2024, Vienna, Austria, 14–19 Apr 2024, EGU24-10056, https://doi.org/10.5194/egusphere-egu24-10056, 2024.

EGU24-10233 | ECS | Posters on site | AS3.21

Evaluating the Impact of Aggregation Scales and Campaign Durations on Land-Use Regression Models for Air Pollution Estimation with Mobile NO2 Monitoring 

Tian Tian, Marco Helbich, Zhendong Yuan, Jules Kerckhoffs, and Roel Vermeulen

Background: It is common practice in land-use regressions for air pollutant predictions to aggregate mobile measurements into road segments of predefined lengths (e.g., 50 m or 100 m) or raster cell sizes (e.g., 10 m or 25 m) in an ad hoc manner. However, the selection of the segment lengths and cell sizes is arbitrary and possibly affects the prediction accuracy which, in turn, may lead to heterogeneous results in studies using these air pollution surfaces.  

Aims: We aimed to 1) assess how different aggregation approaches (i.e., segments and cells) affect the accuracy of air pollution predictions from land-use regression models based on mobile measurements, and 2) assess the impact of various aggregation scales and measurement durations on the accuracy of depicting long-term air pollution concentrations.  

Methods: We utilized around 5.6 million mobile nitrogen dioxide (NO2) measurements in Amsterdam, the Netherlands, from May 2019 to February 2020. The mobile measurements were collected across five distinct campaigns of 10, 20, 30, 50, and 70 days. We aggregated mobile measurements from each duration into road segments and cells with varying spatial resolutions (i.e., 25 m, 50 m, 100 m, 150 m, 200 m). A stepwise linear regression (SLR) and a random forest (RF) were trained for each aggregated dataset. Furthermore, 80 long-term stationary NO2 measurements were employed to validate the LUR models.

Results: First, in LUR model training. RF consistently outperformed the SLR across all spatial scales and measurement durations. The performance of cell-based LUR models fluctuated more than segment-based models across different scales. The explained variance in the RF-based LUR models decreased with increasing cell sizes (e.g., decreased from 61% to 48%). Conversely, the stepwise LUR models explained larger parts of the variance with increasing cell sizes (e.g., increased from 19% to 31%). Second, in the long-term validation with stationary NO2 measurements, the prediction accuracy varied across different scales, but no clear trend was observable. The segment-based LUR models were less sensitive to changes in the spatial scale than cell-based LUR models. Moreover, our results showed that the duration of the mobile measurements campaign is vital, with longer-duration campaigns (e.g., 50 days and 70 days) producing more accurate predictions than shorter ones (e.g., 10 days and 20 days).  

Conclusion: By examining the effects of different spatial and temporal aggregation schemes on LUR models, we found that using different-sized segments leads to less variance in the results for model training and long-term air pollution predictions than cells. Our results suggest that a segment-based approach is more robust and should be used to predict air pollution concentrations.

How to cite: Tian, T., Helbich, M., Yuan, Z., Kerckhoffs, J., and Vermeulen, R.: Evaluating the Impact of Aggregation Scales and Campaign Durations on Land-Use Regression Models for Air Pollution Estimation with Mobile NO2 Monitoring, EGU General Assembly 2024, Vienna, Austria, 14–19 Apr 2024, EGU24-10233, https://doi.org/10.5194/egusphere-egu24-10233, 2024.

EGU24-10495 | ECS | Orals | AS3.21

Hyperlocal Air Pollution Mapping: A Scalable Transfer Learning LUR Approach for Mobile Monitoring 

Zhendong Yuan, Jules Kerckhoffs, Hao Li, Gerard Hoek, and Roel Vermeulen

Many epidemiological studies have traditionally leveraged European maps derived from fixed-site measurements to investigate health effects, primarily emphasizing inter-city variations. Recently, mobile monitoring has been demonstrated to refine the spatial resolution focusing on intra-city variations. Nevertheless, efficiently scaling mobile monitoring campaigns to cover a large spatial area remains challenging.

Tackling this challenge, we explored the transferability of mobile measurements across three European cities. We propose to adapt the traditional land use regression (LUR) models with unsupervised transfer learning algorithms. These models, named CORrelation ALignment (Coral) and its adapted form, inverse distance-weighted Coral (IDW_Coral), aim to estimate air pollution levels in Amsterdam. They rely solely on data from mobile monitoring campaigns in Copenhagen and Rotterdam, bypassing the need for local Amsterdam data itself. The first 30 collection days of mobile campaigns in Copenhagen and Rotterdam were used as the source data (training inputs). By harmonizing the feature space, Coral is designed to minimize the domain difference between the source and target areas. IDW_Coral integrates single Coral models following general geographic principles. Their performance was validated against external routine measurements and compared with a reference LUR model (AMS_SLR), fitted by sequentially increasing amounts of mobile measurements collected in Amsterdam for nitrogen dioxide (NO2). The proposed models were also compared with our previously published mixed-effect models using all Amsterdam mobile measurements for NO2 and Ultra Fine Particles (UFP).

For nitrogen dioxide (NO2), IDW_Coral achieved a balanced performance with an R2 of 0.35.  This accounts for 67% of the accuracy of a locally fitted Amsterdam model (AMS_SLR, R2 = 0.52), developed using comprehensive mobile monitoring over 160 days in Amsterdam. The difference in absolute errors between the two models was marginal (0.75 for MAE and 0.66 µg/m3 for RMSE). The R2 of IDW_Coral matches that of AMS_SLR based on 25 days of data collection, implying that a minimum of 25 days is required to gather city-specific insights through mobile monitoring. If this condition isn't met, IDW_Coral presents a more cost-effective alternative. IDW_Coral correlated strongly (Spearman correlation of 0.72 for NO2 and 0.76 for UFP) with mixed-effect models fitted with all Amsterdam mobile measurements.

Leveraging Tobler's first law of Geography, our IDW_Coral method proficiently delineates hyperlocal air pollution in areas not directly observed. Further improvements in accuracy and applicability can be achieved by expanding mobile-monitored areas. Requiring no direct measurements in the target area, IDW_Coral has the potential for application across Europe, promising substantial savings in collection efforts.

How to cite: Yuan, Z., Kerckhoffs, J., Li, H., Hoek, G., and Vermeulen, R.: Hyperlocal Air Pollution Mapping: A Scalable Transfer Learning LUR Approach for Mobile Monitoring, EGU General Assembly 2024, Vienna, Austria, 14–19 Apr 2024, EGU24-10495, https://doi.org/10.5194/egusphere-egu24-10495, 2024.

EGU24-10505 | Orals | AS3.21

NOAA’s Next-Generation Air Quality Predictions for the United States 

Ivanka Stajner and the Disaster Relief Supplemental Appropriations Act 2022 Fire 2 project team

NOAA is developing the next generation air quality (AQ) prediction system for the United States (U.S.) and global aerosol predictions within the Unified Forecast System (UFS) framework to better represent and forecast impacts of wildfires on AQ and impacts of aerosols globally on weather from hourly to subseasonal scales. A new regional UFS weather model is online coupled with chemistry represented by the EPA’s Community Multiscale AQ (CMAQ) modeling system with Carbon Bond VI and AERO6 mechanisms to form this new UFS-AQM system. Wildfire emissions are specified by satellite-observed  hourly Regional Hourly Advanced Baseline Imager (ABI) and Visible Infrared Imaging Radiometer Suite (VIIRS) Emissions (RAVE). Anthropogenic emissions are based on U.S. EPA’s National Emissions Inventories over the contiguous 48 U.S. states and global inventories elsewhere. Lateral boundary conditions for aerosols are provided by NOAA’s Global Ensemble Forecast System which includes the Goddard Chemistry Aerosol Radiation and Transport (GOCART) module. A bias correction post-processing procedure is included in UFS-AQM to improve prediction accuracy. Testing is performed over a large regional domain covering the U.S., and evaluation is done in near-real time and for retrospective periods. Recent examples indicate much improved representation of impacts of wildfires on AQ predictions, especially during Quebec fires in the summer of 2023. 


Some of the planned refinements for UFS-AQM include better representation of plume rise for wildfire smoke and for point source emissions, increased resolution consistent with the Rapid Refresh Forecast System (RRFS), which is under development, and using aerosol lateral boundary conditions from a 6-way coupled atmosphere - ocean -  land - sea-ice - waves - aerosols global UFS system, also under development. Due to challenging computational requirements for UFS-AQM at high resolution, a machine learning emulator is being developed to improve computational efficiency for prediction of chemical transformations and tracer transport. Of most interest for this session, data assimilation capabilities are being developed to constrain initial conditions for pollutant concentrations in UFS-AQM. Observations being assimilated include fine particulate matter (PM2.5) observations from AirNow, VIIRS Aerosol Optical Depth (AOD) retrievals and TROPOspheric Monitoring Instrument (TROPOMI) NO2 retrievals.

How to cite: Stajner, I. and the Disaster Relief Supplemental Appropriations Act 2022 Fire 2 project team: NOAA’s Next-Generation Air Quality Predictions for the United States, EGU General Assembly 2024, Vienna, Austria, 14–19 Apr 2024, EGU24-10505, https://doi.org/10.5194/egusphere-egu24-10505, 2024.

EGU24-10559 | ECS | Posters on site | AS3.21

Drivers of the 2016 particulate matter pollution episode  over northern India 

Prerita Agarwal, David S. Stevenson, and Mathew R. Heal

Intense episodes of fine particulate matter (PM2.5) pollution often overwhelm large areas of the  Indo-Gangetic Plain (IGP) in northern India during the post-monsoon season, a time when crop residue burning is at its peak. We conduct idealised emission sensitivity experiments using the WRF-Chem model to investigate the leading causes and spatiotemporal extent of one such extreme episode from 31 0ct - 8 Nov 2016, when hourly PM2.5 levels exceeded 500 µg m–3across much of the IGP on several days. We utilise the anthropogenic emissions from EDGARv5.0 and the latest FINNv2.5 for fire emissions and evaluate modelled and observed ambient PM2.5 and black carbon  (BC) concentrations across the IGP. The model captured the PM2.5 and BC peaks during the latter half of the episode and underestimated on other days. We find that biomass burning (BB) emissions during this episode have the strongest effect across the source regions in the upper (NW) IGP, followed by Delhi (middle IGP), where it contributes 50 - 80 % to 24-h mean PM2.5. Complete elimination of BB emissions decreases PM2.5 concentrations by 400 µg m–3  (80 - 90 %) in the upper IGP and by 280 µg m–3  (40 - 80 %) across the middle IGP during this episode. Contributions from the BB source to daily varying BC concentrations are 80-90 %, 40 - 85 % and 10 - 60 % across upper, middle and lower IGP, respectively. BB emissions dominantly contribute to daily mean secondary organic aerosols (80 %), primary organic aerosols (90 %), dust (60 %), and nitrate (50 %) components of PM2.5 across the upper and middle IGP. In comparison, the anthropogenic share of these compounds was nearly one-third everywhere except across the lower IGP. The buildup of the episode across the middle IGP was facilitated by prolonged atmospheric stratification and stagnation, causing BB-derived BC and PM2.5 to be trapped in the lowest 1 km. Our work emphasises the need for rigorous policy interventions during post-monsoon to reduce agricultural crop burning, together with targeted anthropogenic emissions control across the IGP, to minimise such extreme episodes in the future. 

How to cite: Agarwal, P., S. Stevenson, D., and R. Heal, M.: Drivers of the 2016 particulate matter pollution episode  over northern India, EGU General Assembly 2024, Vienna, Austria, 14–19 Apr 2024, EGU24-10559, https://doi.org/10.5194/egusphere-egu24-10559, 2024.

EGU24-11179 | Orals | AS3.21

Next generation atmospheric chemistry modeling with the Multiscale Infrastructure for Chemistry and Aerosols (MUSICA) 

Gabriele Pfister, Mary Barth, Louisa Emmons, Matthew Dawson, Wenfu Tang, Warren Smith, Francis Vitt, and Bill Skamarock

This presentation gives an overview of the Multiscale Infrastructure for Chemistry and Aerosols (MUSICA), which is taking a fundamentally new approach to modeling and will become the next-generation community infrastructure for research on atmospheric chemistry and aerosols. MUSICA will move atmospheric chemistry modeling towards a unification of the range of scales inherent in the Earth System, allowing for the exploration of the couplings across space, time and ecosystems in a consistent manner. It follows modern software standards and is designed to be able to connect to any atmosphere model. Its capability to unify various spatio-temporal scales, coupling to other Earth System components, and process-level modularization will allow advances on topics ranging from fundamental atmospheric chemistry research to air quality to climate and couplings between ecosystems. 

Two versions of MUSICA are currently available, both a configuration of the Community Earth System Model (CESM) using the Community Atmosphere Model (CAM) coupled with tropospheric and stratospheric chemistry. Both versions enable global simulations with regional refinement capability. MUSICAv0 uses a hydrostatic Spectral Element dynamical core and is suitable for scales of ~5 km or higher whereas MUSICAv1 uses the non-hydrostatic Model Prediction Across Scales (MPAS) dynamical core enabling studies of regions at local scales (<5 km grid spacing). 

We will present the status of MUSICA and its partner projects including MusicBox, which is a chemical box model, and MELODIES-MONET, which is a model evaluation framework. We will also provide examples of a range of research and forecasting applications. MUSICA is being developed collaboratively by the National Science Foundation (NSF) National Center for Atmospheric Research (NCAR) and university and government researchers. The community is encouraged to participate and collaborate in MUSICA development and applications. Various resources for users including wiki pages and online tutorials are provided on the MUSICA homepage (https://www2.acom.ucar.edu/sections/multi-scale-infrastructure-chemistry-modeling-musica). 

How to cite: Pfister, G., Barth, M., Emmons, L., Dawson, M., Tang, W., Smith, W., Vitt, F., and Skamarock, B.: Next generation atmospheric chemistry modeling with the Multiscale Infrastructure for Chemistry and Aerosols (MUSICA), EGU General Assembly 2024, Vienna, Austria, 14–19 Apr 2024, EGU24-11179, https://doi.org/10.5194/egusphere-egu24-11179, 2024.

EGU24-11789 | ECS | Posters virtual | AS3.21

Temporal and spatial dynamics of NOx, SOx and PM emissions from European power plants under different energy transition scenarios 

Patrick Draheim, Jan Buschmann, Thomas Pregger, and Patrick Jochem

Lowering the use of fossil fuels not only mitigates climate effects by decreasing the emission of greenhouse gases, but also reduces the release of harmful air pollutants into the atmosphere. Thus, the transition to a carbon-free energy system in the upcoming years could potentially have a major impact on lower air pollutant emissions, leading to better air quality and less harmful impacts on human health and ecosystems.

Currently, emissions from power plants in the energy supply sector (e.g. coal or oil) contribute strongly to total air pollutant emissions in Europe. Among others, especially emissions of sulphur oxides (SOx), nitrogen oxides (NOx) and particulate matter (PM) are highly relevant regarding air quality issues. In order to be able to make informed statements about the impact of the European energy transition and the phase-out of fossil fuels on air quality, providing detailed information on the temporal and spatial character of air pollutant emissions in the future are required. However, the future projection of air pollutant emissions from power plants poses a major challenge because it is influenced by various factors like the pace of renewable energy rollout, power line capacities and the phase-out of fossil power plants.

This work aims to provide estimates of NOx, SOx and PM emissions from power plants in Europe for the year 2030 and to analyse the temporal and spatial dynamics of these emissions in differing energy transition scenarios compared to current emission characteristics.

The energy system model framework REMix is used to model activities of power plants in 2030. It considers the effects of power line capacities, renewable energy capacity increase, consumption patterns and the future power plant fleet of European countries in order to simulate power plant activities in high spatial and temporal resolution. The corresponding emission projections are based on current emission factors of power plants, e.g. from emission reports and information on installed flue gas cleaning systems, and are modelled considering the implementation of European emission standards for power plants in 2030.

The results show that ambitious scenarios for the energy transition cause significant changes in the spatial and temporal occurrence of the considered air pollutant emissions compared to the current emission characteristics of power plants in Europe.

How to cite: Draheim, P., Buschmann, J., Pregger, T., and Jochem, P.: Temporal and spatial dynamics of NOx, SOx and PM emissions from European power plants under different energy transition scenarios, EGU General Assembly 2024, Vienna, Austria, 14–19 Apr 2024, EGU24-11789, https://doi.org/10.5194/egusphere-egu24-11789, 2024.

EGU24-11810 | ECS | Orals | AS3.21

Simulation of atmospheric organic aerosol with the 2D volatility basis during the SPRUCE-22 field campaign 

Petro Uruci, Ksakousti Skyllakou, Angeliki Matrali, Damianos Pavlidis, Christos Kaltsonoudis, and Spyros Pandis

Organic aerosol (OA) constitutes a major fraction of the sub-micrometer atmospheric particulate matter and is either emitted directly into the atmosphere as primary organic aerosol (POA) or formed by the partitioning onto pre-existent particles of low vapor pressure products of the oxidation of volatile, intermediate volatility, and semivolatile organic compounds (VOCs, IVOCs, and SVOCs respectively) as secondary organic aerosol (SOA). The oxidation of these compounds results in thousands of mostly unspecified oxygenated products making our understanding of SOA formation mechanisms incomplete. The volatility basis set (VBS) is a framework that has been designed to simplify these oxidation systems and to allow SOA simulation in chemical transport models (CTMs). The VBS describes the evolution of OA using a set of surrogate species with effective saturation concentrations that vary by 1 order of magnitude (referred to as 1D-VBS). This framework was extended by a second dimension (2D-VBS) to include the oxidation state (2D-VBS), which is important to quantify the degree of oxidation. Three main reasons led to this extension. First, the disadvantage of the 1D-VBS is that compounds with similar saturation concentrations can have different properties and reactivities. Second, the available measuring techniques have increasing capabilities, and they can provide detailed information about the composition of ambient and smog chamber OA (e.g., oxidation state). Third, CTMs often have difficulties in reproducing field observations.

In this work, different parametrization schemes on the 2D-VBS framework were evaluated using measurements collected in the SPRUCE-22 field campaign in a remote forest area of the eastern Mediterranean site (Pertouli, Greece) in the summer of 2022. Field measurements suggested that most of the OA in the site was highly processed secondary anthropogenic and biogenic OA and also aged biomass burning OA.  The results of the default version of the model indicated both underprediction of the total OA level and its oxygen-to-carbon ratio (O:C). A series of hypotheses are tested involving the chemical aging of atmospheric OA to close the gap between the measurements and model predictions.  

How to cite: Uruci, P., Skyllakou, K., Matrali, A., Pavlidis, D., Kaltsonoudis, C., and Pandis, S.: Simulation of atmospheric organic aerosol with the 2D volatility basis during the SPRUCE-22 field campaign, EGU General Assembly 2024, Vienna, Austria, 14–19 Apr 2024, EGU24-11810, https://doi.org/10.5194/egusphere-egu24-11810, 2024.

EGU24-11860 | ECS | Posters on site | AS3.21

A modelling investigation of foliage pH and its impact on the dry deposition flux of SO2 and NO2 

Stefan Miller, Paul Makar, Katherine Hayden, and Sepehr Fathi

The dry deposition of atmospheric pollutants (i.e., particulate matter, gases) has profound impacts on human and ecosystem health.  In regions of vegetation, a large fraction of particulate matter is deposited onto plant foliage, where it may undergo deliquescence to form a thin water layer on the leaf surface, altering the leaf surface pH.  Presently, gas-phase deposition algorithms used in air-quality models tend to ignore variations in the foliage pH and assume a constant neutral leaf of pH 6.68.  This constant pH is then used to determine the effective Henry’s law constants, which in turn influences the deposition velocity of atmospheric gases such as SO2 and NO2.  We use the GEM-MACH air-quality model to investigate and contrast the use of a neutral foliage pH versus a ‘dynamic’ foliage pH on the dry deposition of SO2 and NO2 in the Athabasca Oil Sands region.  In this work, the surface foliage pH in GEM-MACH is dynamically determined using HETP (Miller et al., 2023) by considering the accumulated deposition of anion and cation species to leaf surfaces (i.e., deposited precursor species such as sulfate, nitrate, ammonium, sodium, chloride, potassium, calcium and magnesium).  Processes such as precipitation, nutrient leeching, and epicuticular wax encapsulation are also considered in these simulations since these processes may impact the leaf surface chemistry after dry deposition has occurred. The results show that near the Athabasca Oil Sands sources, the large amount of base cation deposition has a profound impact on the predicted foliage surface pH where it often exceeds 7.0 (in contrast to the pH within the plant cells, for example).  The result of this elevated foliage surface pH is an increase in the dry deposition flux of SO2 and NO2 by a factor of 2 to 10 close to the sources, relative to using a foliage pH of 6.68.  Downwind of the sources, the foliage pH is often near neutral to moderately acidic, leading to decreased dry deposition of SO2 and NO2..  Together, these changes in pH result in an exponential decrease in the dry deposition fluxes with increasing distance from the Oil Sands sources.

References 

Miller, S. J., Makar, P. A., and Lee, C. J.: HETerogeneous vectorized or Parallel (HETPv1.0): An updated inorganic heterogeneous chemistry solver for metastable state NH4+–Na+–Ca2+–K+–Mg2+–SO42––NO3–Cl based on ISORROPIA II, Geosci. Model Dev. Discuss. [preprint], https://doi.org/10.5194/gmd-2023-159, in review, 2023.

How to cite: Miller, S., Makar, P., Hayden, K., and Fathi, S.: A modelling investigation of foliage pH and its impact on the dry deposition flux of SO2 and NO2, EGU General Assembly 2024, Vienna, Austria, 14–19 Apr 2024, EGU24-11860, https://doi.org/10.5194/egusphere-egu24-11860, 2024.

EGU24-12389 | ECS | Posters on site | AS3.21 | Highlight

Assessing the impact of forest fires on human health in Europe 

Sourangsu Chowdhury, Risto Hänninen, Mikhail Sofiev, and Kristin Aunan

Long term exposure to ambient PM2.5 (particulate matter less than 2.5 µm in diameter) is associated with multiple health outcomes, including morbidity and mortality from respiratory, cardiovascular and cerebrovascular diseases, among other non communicable diseases and is the largest environmental health risk in Europe. While much attention globally has centered on reducing anthropogenic sources of ambient PM2.5 and other air pollutants, the significance of forest fires, capable of inducing extreme air pollution, was largely underestimated until recently, lacking credible mitigation strategies. Forest fires release various hazardous pollutants like black carbon and organic aerosols, potentially posing greater health risks compared to other sources of pollution. Our study delves into the escalating importance of forest fires as contributors to PM2.5 exposure in Europe across a thirty-year period (1990-2019), utilizing simulations from a global meso-scale dispersion model. Additionally, we evaluate the health impact resulting from PM2.5 due to forest fires, examining how this burden has changed over three decades in relation to shifts in mortality rates, demographics, forest fires, and PM2.5 exposure. Our calculations indicate a decrease in the additional number of deaths caused by exposure to ambient PM2.5 throughout Europe, dropping by 10,000 deaths annually. This decline is observed from 0.57 million deaths (with 95% confidence intervals between 0.44 - 0.75 million) in 1990 to 0.28 million deaths (ranging from 0.19 – 0.42 million) within the specified time frame.Through our sensitivity analyses, wherein we considered PM2.5 from forest fires as more hazardous compared to other sources, we found an increased relative contribution of forest fires to excess deaths. These results emphasize the urgent requirement for improved mitigation and adaptation strategies, along with the implementation of more sustainable forest management policies. 

How to cite: Chowdhury, S., Hänninen, R., Sofiev, M., and Aunan, K.: Assessing the impact of forest fires on human health in Europe, EGU General Assembly 2024, Vienna, Austria, 14–19 Apr 2024, EGU24-12389, https://doi.org/10.5194/egusphere-egu24-12389, 2024.

EGU24-12966 | ECS | Orals | AS3.21

Impacts of combustion-generated water on in-plume aqueous-phase chemistry 

Sepehr Fathi, Paul Makar, Wanmin Gong, and Alexandru Lupu

In this work within-plume aqueous-phase chemistry is explored utilizing air quality modelling and a plume rise algorithm which includes the effects of combustion-generated water, latent heat release, and in-plume cloud droplet formation. Effluents emitted from high temperature industrial stacks usually contain large amounts of combustion-generated water in gaseous phase (vapour), resulting in high relative humidity within the emitted parcels that make up the plume. As the plume rises in the atmosphere due to buoyancy and cools, the water vapour can condense into droplets, and result in a significant amount of in-plume liquid water. The combined effects of high relative humidity and the presence of liquid-phase water can potentially impact the rate of oxidation of emitted pollutants due to aqueous-phase chemistry within cloud droplets contained within the plume parcel.  Examples include the conversion rates of sulfur dioxide to particulate sulfate and nitrogen dioxide to particulate nitrate. Accounting for in-plume aqueous-phase chemistry can be instrumental in addressing the past discrepancies between predicted and observed levels of secondary aerosols and other gaseous tracers. This work utilizes the Moist-Plume-Rise algorithm (Fathi et al., 2024, under review), which incorporates the thermodynamic effects of combustion-generated water.  The algorithm determines the final height reached by buoyant plumes while keeping track of within-plume water content (vapour, condensed, ice) as it rises. Here, the effect of aqueous phase chemistry taking place within the rising parcel’s condensed water is examined.  The newly developed model feature makes use of information on in-plume water content such as mixing ratio and physical phase over time to perform aqueous-phase chemistry calculations based on the already existing model cloud chemistry modules.  These aqueous-phase chemistry processes and other processes traditionally associated with cloud processing of gases and aerosols can potentially alter the makeup of combustion-source effluents emitted from industrial stacks before they reach neutral buoyancy and are dispersed in the atmosphere. 

How to cite: Fathi, S., Makar, P., Gong, W., and Lupu, A.: Impacts of combustion-generated water on in-plume aqueous-phase chemistry, EGU General Assembly 2024, Vienna, Austria, 14–19 Apr 2024, EGU24-12966, https://doi.org/10.5194/egusphere-egu24-12966, 2024.

Winter atmospheric aerosols, marked by formation under dynamic and complex conditions due to distinct environments, haze events and regional transportation, is greatly challenging to investigate. To address this, we employed XGBoost models integrated with SHapley Additive exPlanations (SHAP) to explore the meteorological and chemical drivers, as well as the impact of transportation, on aerosol characteristics.

We conducted measurements using a high-resolution time-of-flight aerosol mass spectrometer (HR-ToF-AMS) during the 2018 winter (Jan 17th to Feb 22nd) in urban Seoul, Korea. Our analysis included various PM components (nitrate, sulfate, chloride, ammonium, and organics) and sources of organic aerosols (OA), such as more-oxidized oxygenated OA (MO-OOA), less-oxidized OOA (LO-OOA), cooking OA (COA), hydrocarbon-like OA (HOA), and biomass burning OA (BBOA), using positive matrix factorization (PMF). The models demonstrated high predictive accuracy (R>0.90) for all species and sources.

Notably, nitrate formation was found to be significantly influenced by CO concentration and relative humidity (RH), highlighting the role of local sources and aqueous-phase formation. For sulfate, RH was identified as the dominant factor. Organic components, constituting 42.4% of total PM mass, were analyzed for their diverse sources. Temperature and RH were the major drivers for MO-OOA (O/C=0.94) formation, with a critical temperature threshold near 0 °C identified for differentiating formation conditions. Specifically, temperature above the ice point and high RH significantly enhanced MO-OOA formation, and it is likely related to the availability of liquid water for aqueous-phase oxidations to occur. LO-OOA (O/C=0.77) was controlled by CO concentration, suggesting its local formed feature being the same line with nitrate.

Primary OAs, HOA (O/C=0.09) and BBOA (O/C=0.39) were dominated combustion sources (CO concentration), while BBOA (O/C=0.39) was closely linked to temperature. Interestingly, BLH showed a greater impact on COA (O/C=0.20) ,likely due to accumulation during early shrinkage of the boundary layer in winter.

This novel approach effectively identified distinct drivers of aerosol formation and emission features in winter, offering new insights compared to traditional methods. However, the models showed limitation in defining the strong influence of transportation impacts from upwind areas, as found in various research, possibly due to constraints in cluster ID input, which could not distinguish high and low loading clusters. The limitation indicates an area for further investigation.

How to cite: Hu, Q. and Kim, H.: Understanding of the Wintertime Atmospheric Aerosol Properties with Explainable Machine Learning, EGU General Assembly 2024, Vienna, Austria, 14–19 Apr 2024, EGU24-14032, https://doi.org/10.5194/egusphere-egu24-14032, 2024.

EGU24-14244 | ECS | Posters on site | AS3.21

Modeling simulation of aerosol light absorption: the impact of mixing state and aging process 

Huiyun Du, Jie Li, and Xueshun Chen

Black carbon has an important effect on global climate change. Uncertainty surrounding the absorption property of BC-containing aerosols still exists. In this study, the optical property of PM2.5 in Beijing in November 2018 was investigated using Mie theory based on observed and simulated PM2.5. The results showed that the  absorption coefficient under uniform internal mixing is the highest, followed by core-shell mixing and calculation for external mixing is the lowest. The calculated BC absorption at 630 nm under a mixed mixing state (fraction of internal mixing constraint by observation) was reasonably close to the measured mean value. The simulations of the NAQPMS reproduced the temporal distribution of PM2.5 and its components in Beijing well. Under the same mixing state, the absorption coefficient can be highly impacted by the simulation of PM2.5 components. The aging process of BC can be reproduced by advanced microphysical module (APM) in NAQPMS. Then the fraction of aged BC can be used as a proxy for internal mixing proportion, and the absorption coefficient was reasonably reproduced. This study will provide a reference for the three-dimensional model simulation of black carbon aerosol radiation effect.

How to cite: Du, H., Li, J., and Chen, X.: Modeling simulation of aerosol light absorption: the impact of mixing state and aging process, EGU General Assembly 2024, Vienna, Austria, 14–19 Apr 2024, EGU24-14244, https://doi.org/10.5194/egusphere-egu24-14244, 2024.

The Weather Research and Forecasting model with solar extensions (WRF-Solar) has demonstrated potential and reliability in employing an aerosol-aware microphysics scheme as a moderate-cost alternative for aerosol-cloud-radiation and solar power simulations. However, it has not been integrated with any aerosol model due to computational cost considerations. In this study, we fully couple the Thompson and Eidhammer aerosol-aware microphysics scheme with the Goddard Chemistry Aerosol Radiation and Transport (GOCART) model, incorporating online aerosol-cloud-radiation interactions into the WRF-Solar model. We then evaluate its performance on shortwave radiation in China in March 2021. The results show a general improvement in the model's Aerosol Optical Depth performance across most areas in China, thereby enhancing the simulation of clear-sky global horizontal irradiance (GHI). The most significant enhancement is observed in northern regions, with reductions of 24% in RMSE and 44% in BIAS. Subsequently, cloud properties and all-sky GHI are examined, revealing improvements in almost all areas except Tibet, with the most notable improvement in the Western region (56.18% reduction in BIAS for all-sky GHI). The observed underestimations in northwest areas are attributed to the overestimations of dust. This study not only provides better GHI forecasting results but also deepens the understanding of aerosol-cloud-radiation interactions in climate prediction

How to cite: Wang, S., Huang, G., and Dai, T.: Improving the Aerosol-cloud-radiation Interactions in WRF-Chem-Solar and its preliminary application in China, EGU General Assembly 2024, Vienna, Austria, 14–19 Apr 2024, EGU24-14350, https://doi.org/10.5194/egusphere-egu24-14350, 2024.

EGU24-14383 | ECS | Posters virtual | AS3.21

Organic carbon health burden in the Indo-Gangetic Plain: Exposures, risks, and mitigation 

Vidya a., Kanishtha Dubey, and Shubha Verma

Organic carbon (OC) aerosols are complex carbon-containing particles suspended in the atmosphere. OC accounts for a large fraction of atmospheric aerosol and significantly affects air quality, atmospheric chemistry, human health, and climate forcing. This study focuses on assessing the specific influence of OC aerosols on public health within the Indo-Gangetic Plain (IGP). The assessment was done with an efficiently modeled OC distribution in a fine-resolved chemistry-transport model, CHIMERE, using the Weather Research and Forecasting (WRF) model as the meteorological driver in the offline mode. Simulations are carried out at a horizontal resolution of 0.1×0.1 over the IGP domain (20oN to 30.9oN and 75oE to 89.3oE). The health assessment was done for the seasonal mean of winter (January, February, November and December) OC concentration.

Higher OC concentrations were consistently observed across diverse area types in the IGP: Megacity (Kolkata and Delhi), Urban (Agra, Varanasi, Kanpur), and Semiurban (Kharagpur). Wintertime OC concentrations were significantly higher than the established Theoretical Threshold Limit (TTL) of 16 μg m-3. OC all-day (daytime) concentrations exceeded 60 (30) μg m-3, which is about 4 (2) times the TTL, in urban and megacity areas. Over 95% of the populations in semi-urban, urban, and megacity areas are exposed to OC concentrations above the threshold, with rural and semi-rural populations also experiencing substantial exposure. Relative risk (RR) and Cardiovascular Mortality (CVM) associated with OC exposure during the winter months were assessed to evaluate the health impacts. RR values consistently exceed one across the IGP, indicating potential health risks associated with wintertime OC exposure. The burden of CVM attributable to OC is estimated to encompass approximately 2,00,000 annual deaths across the entire IGP. The CVM attributable to OC in comparison to both PM2.5 and BC was found to be about 1.5 times higher over Agra and Kanpur. This underscores the need for immediate policy interventions to address elevated OC concentrations in the IGP, especially in high-risk areas like Agra and Kanpur, mitigating the significant burden of CVM associated with wintertime OC exposure.


How to cite: a., V., Dubey, K., and Verma, S.: Organic carbon health burden in the Indo-Gangetic Plain: Exposures, risks, and mitigation, EGU General Assembly 2024, Vienna, Austria, 14–19 Apr 2024, EGU24-14383, https://doi.org/10.5194/egusphere-egu24-14383, 2024.

EGU24-14453 | ECS | Posters on site | AS3.21

CFD simulation of smoke plumes emitted from an urban fire accident 

Alejandra Gonzalez-Perez, Woo-Sok Moon, and Jae-Jin Kim

The increasing occurrence of urban fires and their uncontrollable nature significantly impacts health, the environment, and infrastructure. Individual large-scale fires have the potential to emerge as significant sources, given their notable contribution to the total atmospheric emissions within a city. In this study, the smoke plume resulting from an actual building fire was simulated over an 8-hour particle emission period using a computational fluid dynamic (CFD) model. The emission parameters were estimated, taking into account the dimensions of the burned area and the materials involved. Initial and boundary conditions were established based on data from the local meteorological observation stations, and the estimated emissions were validated by comparing the simulated concentrations of particles with those measured at local atmospheric monitoring stations. The CFD model used in this study simulated the smoke plume dispersion and potential heat release every hour during the fire, analyzing its behavior in diverse wind conditions in a building congested area.

Acknowledgments

This research was supported by Particulate Matter Management Specialized Graduate Program through the Korea Environmental Industry & Technology Institute (KEITI) funded by the Ministry of Environment (MOE).

How to cite: Gonzalez-Perez, A., Moon, W.-S., and Kim, J.-J.: CFD simulation of smoke plumes emitted from an urban fire accident, EGU General Assembly 2024, Vienna, Austria, 14–19 Apr 2024, EGU24-14453, https://doi.org/10.5194/egusphere-egu24-14453, 2024.

EGU24-14876 | Posters on site | AS3.21

A comparative analysis of source apportionment of PM2.5 in Baengnyeong-do and Seoul metropolitan area using receptor model 

Jinseok Han, Huejun Song, Kyoungchan Kim, Chunsang Lee, Dayeong Choi, Hungsoo Joo, Junyong Ahn, and Seokjun Seo

Because PM2.5 causes high-risk diseases, various research and policies are being implemented in these days. Identification of emission sources is the fundamental research and it should be continued. In this study, we attempted to compare and analyze the emission source contribution and PM2.5 characteristics for Baengnyeong-do (background area) and Seoul (the capital area) in Korea. PMF receptor model and back-trajectory analysis were used using the PM2.5 and its components data collected by the Atmospheric Environment Research Institute during 2020 to 2021. In the results of PMF model, 9 pollution sources (secondary sulfate, secondary nitrate, vehicles, biomass burning, dust, industry, sea salt, coal combustion, oil combustion) were estimated in both Baengnyeong-do and Seoul. Secondary aerosol, vehicles and biomass burning showed the high contributions to PM2.5 pollutions at both receptor sites. In the backtrajectory analysis, we found the air mass for long-range transport from China to Seoul via Baengnyeong-do. As a result of PM2.5 characteristics, nitrate concentrations in Seoul were higher than those in Baengnyeong-do. Therefore, mitigation of nitrate pollution and the control of NOx emission sources including should be necessary in the metropolitan.

Acknowledgments:

This research was supported by Particulate Matter Management Specialized Graduate Program through the Korea Environmental Industry & Technology Institute (KEITI) funded by the Ministry of Environment (MOE)

How to cite: Han, J., Song, H., Kim, K., Lee, C., Choi, D., Joo, H., Ahn, J., and Seo, S.: A comparative analysis of source apportionment of PM2.5 in Baengnyeong-do and Seoul metropolitan area using receptor model, EGU General Assembly 2024, Vienna, Austria, 14–19 Apr 2024, EGU24-14876, https://doi.org/10.5194/egusphere-egu24-14876, 2024.

EGU24-15397 | ECS | Orals | AS3.21

The spatio-temporal variability of particulate pollution through modelling: new insigths from a dense network of micro-sensors in urban environment 

Sarah Marion, Nadège Martiny, Julita Dudek, Mathieu Boilleaut, Marie Ristori, and Anaïs Detournay

Current high-resolution models generally present a relatively flat signal that poorly represents the spatial and temporal variability of particulate pollution at the scale of a city. This study is based on the SIRANE model, an urban air quality model that enables to simulate the dispersion of atmospheric pollutants according to the city geometry at a 10-meter spatial resolution. The model outputs provided by the ATMO Bourgogne - Franche - Comté air quality monitoring agency are actually post-processed based on a physical equation defined for the PM10 (d < 10 μm) and PM2.5 (d < 2.5 μm) pollutants and based on mass concentration levels measured by 4 micro-sensors deployed in representative sites in Dijon for the year 2021.

This study first aims at verifying if the equations established could be applied to another period, taking into account any differences in atmospheric circulation. The second objective is to test if the integration of more measurement stations enables to significantly refine the physical equations and improve the SIRANE maps correction. More generally, we would like to evaluate to what extent micro-sensors can improve the information provided by high-resolution models and when with respect to the particle season.

The work is conducted in three steps: first, apply the physical equations to 2022 and 2023 SIRANE maps and compare the outputs with reference stations; second, analyse measurements from the micro-sensors implemented in Dijon in Summer 2023; third, use this dataset to select new representative traffic, background and intermediate sites in order to refine the physical equations and quantify the added value.

The first results are encouraging as the SIRANE corrected maps based on the first 4 representative micro-stations in Dijon enable a more realistic spatial variability in the city, illustrated by a clear pollution gradient from the city centre to the suburbs (with a greater range between concentration levels and a higher number of classes), and a less flat season cycle with more realistic PM levels in Winter everywhere in the city.

How to cite: Marion, S., Martiny, N., Dudek, J., Boilleaut, M., Ristori, M., and Detournay, A.: The spatio-temporal variability of particulate pollution through modelling: new insigths from a dense network of micro-sensors in urban environment, EGU General Assembly 2024, Vienna, Austria, 14–19 Apr 2024, EGU24-15397, https://doi.org/10.5194/egusphere-egu24-15397, 2024.

EGU24-15441 | Posters on site | AS3.21

Impact of different emission inventory on the modelled concentrations chemistry transport models over Europe 

Jan Karlický, Anahí Villaba-Pradas, Peter Huszár, Natália Machado Crespo, Shruti Verma, and Tomáš Halenka

While the impacts of CO2 and other well mixed greenhouse gases on continental to global scales are well understood, there are still gaps and uncertainties connected to the non-CO2 forcers. One of the main goals of FOCI project is to improve our understanding of non-CO2 forcers on climate, weather, air quality and health, such as short-lived gases and aerosols. To assess the long-term impact of these gases, we need first to find and understand uncertainties in simulations given by different emission sources.

In this study, we performed a set of simulations on 27 km domain over Europe with RegCM-Chem and WRF-Chem models with emission inputs based on different emission inventories, namely CAMS, EDGAR and EMEP. We analyzed differences in resulting tropospheric ozone, NO2 and aerosol concentrations in selected time periods of 2015. We found significant differences in results that emerge from using different emission inputs.

How to cite: Karlický, J., Villaba-Pradas, A., Huszár, P., Machado Crespo, N., Verma, S., and Halenka, T.: Impact of different emission inventory on the modelled concentrations chemistry transport models over Europe, EGU General Assembly 2024, Vienna, Austria, 14–19 Apr 2024, EGU24-15441, https://doi.org/10.5194/egusphere-egu24-15441, 2024.

EGU24-15704 | ECS | Posters on site | AS3.21

Assessing Atmospheric Mercury Dynamics: A Comparative Analysis of Current Anthropogenic Emission Inventories and their Implications for Concentration and Deposition in India 

Chakradhar Reddy Malasani, Basudev Swain, Ankit Patel, Yaswanth Pulipati, Amit Sharma, Marco Vountas, Pengfei Liu, and Sachin S. Gunthe

Anthropogenic mercury emissions pose significant risks to both human health and ecosystems, particularly when transformed into methylmercury. India stands as the second-largest contributor to mercury emissions, estimated at 144.7 tonnes of Hg/year, with uncertainties ranging from 75 to 330 Mg/year 1. India ratified the Minamata Convention in 2018, committing to address and mitigate mercury pollution2. Knowledge of Indian specific characteristics of mercury emission sources is essential for implementing effective mitigation strategies. However, India currently lacks a national emission inventory, with only limited estimates available3.

This research explores the impact of different anthropogenic emission inventories (AMAP/UNEP-2010, EDGAR, STREETS, AMAP/UNEP-2015) on mercury concentration and deposition patterns in India. We employ nested simulations of the chemical transport model GEOS-Chem over India for the year 2013-15. The current study also investigates the impact of grid resolution and meteorology on spatial distribution of Hg concentrations and deposition using MERRA-2 and GEOS-FP meterological datasets. Additionally, the study delves into the seasonal variations of Hg concentration and deposition across different regions of India, analysing their correlation with various meteorological parameters (such as rainfall). These findings are crucial for gaining insights into the dynamics of the mercury cycle in the environment. Furthur results will be presented.

References:

1.AMAP/UNEP (2013) Technical background report for the global mercury assessment 2013. Arctic Monitoring and Assessment Programme/UNEP Chemicals Branch, Oslo/Geneva

2.UNEP. Parties and Signatories Minamata Convention on Mercury. https://www.mercuryconvention.org/en/parties (accessed 2024-01-09)

3.Sharma, B. M., Bharat, G. K., Šebková, K., & Scheringer, M. (2019). Implementation of the Minamata Convention to manage mercury pollution in India: challenges and opportunities. Environmental Sciences Europe, 31, 1-12.

How to cite: Malasani, C. R., Swain, B., Patel, A., Pulipati, Y., Sharma, A., Vountas, M., Liu, P., and Gunthe, S. S.: Assessing Atmospheric Mercury Dynamics: A Comparative Analysis of Current Anthropogenic Emission Inventories and their Implications for Concentration and Deposition in India, EGU General Assembly 2024, Vienna, Austria, 14–19 Apr 2024, EGU24-15704, https://doi.org/10.5194/egusphere-egu24-15704, 2024.

EGU24-15899 | Orals | AS3.21

Investigating processes affecting wintertime air pollution variability and estimating contributions of power plant emissions relative to the surface in the stratified Arctic boundary layer  

Natalie Brett, Kathy S. Law, Stephen R. Arnold, Brice Barrett, Elsa Dieudonné, Gilberto J. Fochesatto, Jean-Christophe Raut, Tatsuo Onishi, Roman Pohorsky, Andrea Baccarini, Julia Schmale, Joël Savarino, Sarah Albertin, Slimane Bekki, Barbara D'Anna, Brice Temime-Roussel, William Simpson, Meeta Cesler-Maloney, Stefano Decesari, and Antonio Donateo and the ISAC, Italy, EPA-Alaska and ADEC

The Arctic is warming rapidly compared to the global average. As Arctic warming continues, urbanisation and industrial activities are predicted to increase, along with complex climate and ecosystem feedbacks. Therefore, local sources of air pollutants are expected to play an increasingly significant role in Arctic environmental changes in the coming years. Poor air quality is already a growing public health issue in Arctic and sub-Arctic cities. During wintertime, stable meteorological conditions and the persistence of strong surface-based temperature inversions suppress the dispersion of pollutants, which accumulate due to enhanced emissions linked to high energy demands. Fairbanks, in central Alaska, is an example of a sub-Arctic city that suffers from acute wintertime pollution episodes. The city’s topography (situated in a basin), strong stratification of the Arctic boundary layer (ABL), and high emissions, primarily from domestic heating at the surface, and power plant stacks aloft, are known to contribute to the problem. However, interactions between vertical stratification of the ABL and dispersal of pollutants from surface and elevated sources are poorly quantified due to a lack of observations and complexities of the ABL structure and dynamics. To address these uncertainties, comprehensive atmospheric composition and meteorological measurements were collected at the surface, and vertical profiles were obtained using a tethered balloon during the international ALPACA (Alaskan Layered Pollution and Chemical Analysis) field campaign in January and February 2022.

Here, we explore the contribution of power plants and surface emission sources to pollution concentrations in the Fairbanks region. We use the FLEXPART-Weather Research and Forecasting (WRF) Lagrangian particle dispersion model, driven by meteorological fields from US Environmental Protection Agency (EPA) WRF simulations including data assimilation of meteorological observations, to simulate the evolution of selected emission tracers. Hourly power plant and sector-based surface EPA emissions at 1.3km resolution during ALPACA 2022 are included in the model runs. A novel model parameterisation of power plant plume injection heights accounts for the ABL structure, notably surface-based and elevated temperature inversions. Model results are evaluated against available observations from ALPACA 2022, and sensitivity to, for example, emissions and vertical mixing is explored. The simulation of pollution plume altitudes is significantly improved when ABL stratification is taken into account in the plume rise parameterisation since inversion layers can trap plumes. Variability in modelled surface pollutant concentrations is predominantly driven by meteorology, and the ability of the model to capture surface-based temperature inversions (as low as 10m). A cold-temperature dependence for NOx vehicle emissions, currently missing from the EPA emission inventory, is required to reproduce the magnitude of observed NOx surface concentrations at low temperatures below 0°C and needs to be considered in future emission inventories in the Arctic, and potentially in other wintertime environments. Finally, using the most realistic simulation, we estimate the contribution of power plant emissions to surface pollution in the Fairbanks region, addressing an important policy question. The results indicate preferential areas for downward transport of pollution from aloft and larger contributions to surface pollution under less stable meteorological conditions.

How to cite: Brett, N., Law, K. S., Arnold, S. R., Barrett, B., Dieudonné, E., Fochesatto, G. J., Raut, J.-C., Onishi, T., Pohorsky, R., Baccarini, A., Schmale, J., Savarino, J., Albertin, S., Bekki, S., D'Anna, B., Temime-Roussel, B., Simpson, W., Cesler-Maloney, M., Decesari, S., and Donateo, A. and the ISAC, Italy, EPA-Alaska and ADEC: Investigating processes affecting wintertime air pollution variability and estimating contributions of power plant emissions relative to the surface in the stratified Arctic boundary layer , EGU General Assembly 2024, Vienna, Austria, 14–19 Apr 2024, EGU24-15899, https://doi.org/10.5194/egusphere-egu24-15899, 2024.

EGU24-16114 | ECS | Orals | AS3.21

Spatiotemporal assessment and evaluation of aromatic VOC emissions: a case study for Spain 

Kevin Oliveira, Marc Guevara, Oriol Jorba, Hervé Petetin, Dene Bowdalo, Carles Tena Medina, Gilbert Montane Pinto, Franco López, and Carlos Pérez García-Pando

Volatile organic compounds (VOCs) significantly contribute to air pollution, pose serious health hazards to humans, and influence ozone formation and secondary organic aerosol production. Anthropogenic sources include various human-driven activities, such as solvent use, traffic and fuel evaporation, industrial emissions, and biomass burning. Despite their importance, the uncertainties associated with representing VOCs in atmospheric emission inventories are considerably higher than other reported air pollutants. This work presents a spatiotemporal assessment and evaluation of benzene, toluene, and xylene (BTX) emissions and concentrations in Spain. We run the High-Elective Resolution Modelling Emission System (HERMESv3) model to produce gridded bottom-up emissions of BTX and use it as input in the Multiscale Online Nonhydrostatic AtmospheRe CHemistry model (MONARCH) chemical transport model to simulate surface concentrations across Spain. The modelling results were then evaluated against official ground-based observation data for the year 2019. The intercomparison between modelled and officially reported observed levels allows for identifying sources of uncertainty in the anthropogenic emission inputs, which we further explored through specific sensitivity test runs. The largest levels of observed benzene and xylene were found in industrial sites near coke ovens, refineries and car manufacturing facilities, where the air quality modelling results show large underestimations. Official emissions reported for these facilities were replaced by alternative estimates, allowing heterogeneous improvement of the model's performance and highlighting that uncertainties representing industrial emission processes remain. For toluene, consistent overestimations in background stations were mainly related to uncertainties in the spatial disaggregation of emissions from industrial use solvent activities, mainly from wood paint applications. Observed benzene levels in Barcelona's urban traffic areas were five times larger than the ones observed in Madrid. MONARCH failed to reproduce the observed gradient between the two cities due to uncertainties in estimating emissions from motorcycles and mopeds. Our results are constrained by the spatial and temporal coverage of available BTX observations, posing a key challenge in evaluating the spatial distribution of modelled levels and associated emissions.

How to cite: Oliveira, K., Guevara, M., Jorba, O., Petetin, H., Bowdalo, D., Tena Medina, C., Montane Pinto, G., López, F., and Pérez García-Pando, C.: Spatiotemporal assessment and evaluation of aromatic VOC emissions: a case study for Spain, EGU General Assembly 2024, Vienna, Austria, 14–19 Apr 2024, EGU24-16114, https://doi.org/10.5194/egusphere-egu24-16114, 2024.

EGU24-16252 | Posters on site | AS3.21

Canadian wildfires of Summer 2023:  high smoke episodes over Central Europe - observations and GEM-AQ model results. 

Maciej Jefimow, Ainur Nagmarova, Joanna Struzewska, and Aleksander Norowski

           In 2023, Canada faced the threat of wildfires, a recurring environmental challenge exacerbated by factors such as climate change and dry conditions. The wildfires likely posed significant challenges to various regions, leading to evacuations, property damage, and adverse effects on air quality. Government agencies and firefighting teams were likely mobilized to contain the spread of the fires and protect affected communities.      Copernicus Atmosphere Monitoring Service (CAMS) provides products related to emissions from wildfires (PMWF – particular matter from wildfires). Based on CAMS data specific periods were selected. The GEM-AQ model, which is a part of the CAMS ensemble, was run on a global grid to reproduce the hemispheric transport of smoke plum. Model results were compared against satellite measurement (TROPOMI – aerosol index and aerosol layer height) and with available in-situ observations (PolandAOD network). We will present the evolution of transport episodes over Poland as well as the analysis of the model performance in terms of timing and height of the aerosol plume observed.  

How to cite: Jefimow, M., Nagmarova, A., Struzewska, J., and Norowski, A.: Canadian wildfires of Summer 2023:  high smoke episodes over Central Europe - observations and GEM-AQ model results., EGU General Assembly 2024, Vienna, Austria, 14–19 Apr 2024, EGU24-16252, https://doi.org/10.5194/egusphere-egu24-16252, 2024.

EGU24-17670 | ECS | Orals | AS3.21

Towards a super-simplified OH chemistry for ICON-ART 

Philipp Dietz, Valentin Hanft, Tim Reimus, Stefan Versick, Roland Ruhnke, and Peter Braesicke

Monitoring greenhouse gas (GHG) emissions is essential to face global warming and climate change. The ITMS project (“Integriertes Treibhausgas Monitoringsystem”, in English “integrated GHG monitoring system”)[1], is designed to establish at the German Meteorological Service (DWD) an operational GHG data assimilation service based on the model system ICON-ART[2] to enable Germany to operationally monitor the sources and sinks of three important GHGs: carbon dioxide (CO2), methane (CH4) and nitrous oxide (N2O).

In the first phase of the ITMS project DWD together with the Karlsruhe Institute of Technology (KIT) and other partners are focusing on the emission, distribution and depletion of methane. In the troposphere, methane is mainly depleted by the chemical reaction with the OH-radical. Tropospheric OH is created mostly by the photolytic destruction of ozone (O3) and thus its abundance depends on the available solar radiation and the ozone concentration (i.a.). The calculation of this chemical system is computationally expensive. Therefore a simplified calculation of the OH chemistry has to be included in the ICON-ART forward model.

Here, we present the current state of a super-simplified OH-chemistry for ICON-ART, a data-driven approach based on Minschwaner et al., 2011[3]. The OH concentration is hereby estimated based on the solar zenith angle (SZA) at the respective grid cell, as well as two parameters which are trained priorly on existing OH and SZA data.

[1] www.itms-germany.de

[2] Schröter, J., Rieger, D., Stassen, C., Vogel, H., Weimer, M., Werchner, S., Förstner, J., Prill, F., Reinert, D., Zängl, G., Giorgetta, M., Ruhnke, R., Vogel, B., and Braesicke, P.: ICON-ART 2.1: a flexible tracer framework and its application for composition studies in numerical weather forecasting and climate simulations, Geosci. Model Dev., 11, 4043–4068, https://doi.org/10.5194/gmd-11-4043-2018, 2018.

[3] Minschwaner, K., Manney, G. L., Wang, S. H., and Harwood, R. S.: Hydroxyl in the stratosphere and mesosphere – Part 1: Diurnal variability, Atmos. Chem. Phys., 11, 955–962, https://doi.org/10.5194/acp-11-955-2011, 2011.

How to cite: Dietz, P., Hanft, V., Reimus, T., Versick, S., Ruhnke, R., and Braesicke, P.: Towards a super-simplified OH chemistry for ICON-ART, EGU General Assembly 2024, Vienna, Austria, 14–19 Apr 2024, EGU24-17670, https://doi.org/10.5194/egusphere-egu24-17670, 2024.

EGU24-18415 | Orals | AS3.21

Improving SO2 emissions from the point sources over the Middle East using satellite observations and inverse modeling. 

Alexander Ukhov, Ibrahim Hoteit, and Georgiy Stenchikov

The Middle East faces important challenges from severe air pollution, marked by natural factors from frequent dust storms and human-induced emissions, notably SO2 from power and desalination plants. These emissions significantly degrade air quality and contribute to sulfate aerosol formation, impacting climate and cloud formation. Accurate SO2 emissions representation in this challenging environment is crucial. We aim to enhance the current SO2 emission inventory by integrating satellite SO2 observations and the FLEXPART-WRF model, driven by meteorological data from the WRF 10km resolution model run in 2016. In particular, we adapted the WRF-Chem’s code for simulating the major SO2 sinks (in cloud scavenging, dry and wet deposition, SO2 oxidation by OH and H2O2) into the FLEXPART-WRF model. It allowed us to exclude the “background” SO2 column loadings caused by the spatially distributed emissions and to invert the SO2 emissions from the strong point sources on a daily basis. The improved SO2 emission inventory is open to the community.

How to cite: Ukhov, A., Hoteit, I., and Stenchikov, G.: Improving SO2 emissions from the point sources over the Middle East using satellite observations and inverse modeling., EGU General Assembly 2024, Vienna, Austria, 14–19 Apr 2024, EGU24-18415, https://doi.org/10.5194/egusphere-egu24-18415, 2024.

EGU24-18439 | Orals | AS3.21

Air Quality Modeling for Policy Support in Poland – system overview and recent results 

Pawel Durka, Jacek W. Kaminski, Joanna Struzewska, Grzegorz Jeleniewicz, Aleksander Norowski, Aneta Gienibor, Marcin Kawka, Wojciech Baginski, and Lech Lobocki

The role of air quality modelling as a supporting tool for providing information to citizens and policymakers is becoming more significant, as shown in recent research studies and the enhancement of modelling applications in a proposal for the new Ambient Air Quality Directive.

Starting in 2018, the Institute of Environmental Protection – National Research Institute (IEP-NRI) is legislated to provide modelling in support of air quality policy for Poland. This support covers modelling and its analysis required for annual air quality assessment (46 zones, including 30 urban areas), the impact of transboundary transport analysis on pollution concentrations in Poland, representativeness of monitoring stations, 5-year assessment for the purpose of zone classifications, modelled scenarios for National Air Quality Improvement Plan. An operational air quality forecast for 72 hours is also modelled every day and is being used for public information, as well as eventual air quality alerts. All simulations are calculated with the GEM-AQ model (Kaminski et al., 2008), configuration and resolution are fit for purpose and depend on application - concerning the European Commission Joint Research Centre (JRC) Forum for Air Quality Modeling (FAIRMODE) guidelines and evaluation methods. Most of the analyses cover the modelling of at least primary pollutants (NO2, SO2, O3, PM10, PM2.5) and are based on a high-resolution Central Emission Database made by The National Centre for Emissions Management (KOBiZE) for Poland. Results and analysis are provided to the State Inspectorate of Environmental Protection, Ministry of Environment and Climate and published on IEP-NRI web pages.

We will present the configuration and solutions of the modelling system built in IEP-NRI, as well as the most recent results. The strengths of the described approach work in progress, and further development plans will be shown and discussed.

How to cite: Durka, P., Kaminski, J. W., Struzewska, J., Jeleniewicz, G., Norowski, A., Gienibor, A., Kawka, M., Baginski, W., and Lobocki, L.: Air Quality Modeling for Policy Support in Poland – system overview and recent results, EGU General Assembly 2024, Vienna, Austria, 14–19 Apr 2024, EGU24-18439, https://doi.org/10.5194/egusphere-egu24-18439, 2024.

EGU24-18442 | Posters on site | AS3.21

Health implications of model uncertainties related to carbonaceous aerosols 

Niki Paisi, Joni Kushta, Andrea Pozzer, and Jos Lelieveld

Exposure to fine particulate matter (PM2.5) leads to increased morbidity and excess mortality. Air quality models are powerful tools for air pollutants simulation and are useful for health impact applications. The impact of each PM2.5 component on human health is probably unequal due to the specific toxicity of each specie. Specifically, carbonaceous aerosols (e.g., black carbon and organic aerosols), which are emitted from combustion related sources have been widely assessed for their oxidative capacity and toxicity. The accuracy of air quality modeling is highly dependent on the input data and the representation of meteorology. Due to their complex formation pathways, organic aerosols have been consistently underestimated by several air quality models. Therefore, health impact studies that focus on these aerosols might underestimate their estimated health effect. In this study, the Weather Research and Forecasting Model, coupled with chemistry (WRF-Chem) is used to simulate PM2.5 and the carbonaceous species over Europe. We evaluate the model for its ability to represent accurate exposure levels of PM2.5 with a focus on organic aerosols, and how their modeling uncertainties can influence excess mortality estimates. We take into account the potentially increased contribution of carbonaceous aerosols to excess mortality through several assumptions on their specific toxicity.


How to cite: Paisi, N., Kushta, J., Pozzer, A., and Lelieveld, J.: Health implications of model uncertainties related to carbonaceous aerosols, EGU General Assembly 2024, Vienna, Austria, 14–19 Apr 2024, EGU24-18442, https://doi.org/10.5194/egusphere-egu24-18442, 2024.

EGU24-18620 | ECS | Posters virtual | AS3.21

Modelling of Haze Episode over Delhi Region using a Chemistry-Transport Model: Contribution of Emission and Meteorology 

Valasani Srilekha, Shubha Verma, Rhitamvar Ray, and Kuldeep Salvi

Haze episodes are often shrouded over Delhi-NCR and most of the Northern Indo-Gangetic Plain during the Post-Monsoon and Winter seasons, posing a huge negative burden on human health, the environment, and the economy. The combined influence of local emissions, meteorology, regional transport, and topography results in the complex chemical mechanism, which is difficult to predict based on observational studies, emphasizing the necessity of modelling the episodic haze in a chemistry-transport model. The present study adopted Weather Research and Forecasting (WRF) model, coupled with the CHIMERE chemistry-transport model, to simulate the haze event that happened in November 2019 over Delhi, to understand the chemical mechanism involved and to quantify the contribution of emissions and meteorology towards the increase of PM2.5 concentration. Temporal variations of the modelled PM2.5, air quality and meteorology variables are in good agreement with the observed data. Correlation coefficients (R) between simulated and observed values were larger than 0.7, and the normalized mean biases (NMB) were within ± 30%. The evaluations indicate that WRF-CHIMERE is able to capture the trends of haze events. Major fraction of PM2.5 during the haze was comprised of Organic Matter (OM) followed by secondary inorganic aerosols. It was also found that although OM was high in concentration, the rate of increase of nitrates was higher than OM, indicating an important role of inorganic aerosols in high PM2.5 concentration. In addition, sensitivity simulations revealed that anthropogenic emissions had a significant contribution for high particulates during the episode. Therefore, adopting the anthropogenic source emissions control startegy could be an effective control measure for reducing the severity of PM2.5 pollution over Delhi region.

How to cite: Srilekha, V., Verma, S., Ray, R., and Salvi, K.: Modelling of Haze Episode over Delhi Region using a Chemistry-Transport Model: Contribution of Emission and Meteorology, EGU General Assembly 2024, Vienna, Austria, 14–19 Apr 2024, EGU24-18620, https://doi.org/10.5194/egusphere-egu24-18620, 2024.

EGU24-18801 | ECS | Orals | AS3.21

Effects of biogenic emissions on an extreme event of tropospheric ozone pollution over southwestern Europe (Iberian Peninsula) 

Leandro Cristian Segado Moreno, Francisco Sánchez-Jiménez, Eloisa Raluy-López, Juan Pedro Montávez, and Pedro Jiménez-Guerrero

Biogenic emissions are those emitted by natural sources such as plants, trees and soil. The main biogenic volatile organic compounds (BVOCs) involved in these emissions are isoprene and monoterpenes, which can undergo photochemical reactions in the atmosphere and contribute to the formation of tropospheric ozone. Warmer temperatures and increased solar radiation can intensify emission rates. On the other hand, different BVOCs may respond differently to water stress. For example, isoprene emissions have been observed to decrease under water stress conditions, while emissions of some monoterpenes may increase. Therefore, the study of biogenic emissions is essential for understanding the Earth's atmosphere, especially in the context of climate change and air quality. To understand the interactions between biogenic emissions and near-surface ozone, advanced atmospheric models are required.

This study presents a series of meteorology-chemistry online coupled simulations using the Weather Research and Forecasting model coupled with Chemistry (WRF-Chem) to investigate the sensitivity of surface ozone concentration to changes in biogenic emissions during an extreme ozone concentration event (12-15 July 2022) over the Iberian Peninsula. Biogenic emissions are introduced into WRF-Chem using the Model of Emissions of Gases and Aerosols from Nature (MEGAN) version 2.04. The experiments consist in varying the biogenic emissions by perturbing parameters related to the emission rates and the type and amount of vegetation.

Preliminary results show that the inclusion of biogenic emissions can increase the near-surface ozone concentrations by up to 30% in some locations. Although we do not obtain a much better performance of the model in representing the observed ozone series, the observed extreme values can be better explained when biogenic emissions are considered. Therefore, it is fundamental to consider both natural and anthropogenic sources when addressing ozone pollution.


Acknowledgements: Project PID2020-115693RB-I00 funded by MCIN/ AEI /10.13039/501100011033

How to cite: Segado Moreno, L. C., Sánchez-Jiménez, F., Raluy-López, E., Montávez, J. P., and Jiménez-Guerrero, P.: Effects of biogenic emissions on an extreme event of tropospheric ozone pollution over southwestern Europe (Iberian Peninsula), EGU General Assembly 2024, Vienna, Austria, 14–19 Apr 2024, EGU24-18801, https://doi.org/10.5194/egusphere-egu24-18801, 2024.

EGU24-19753 | Orals | AS3.21

Insights into China's Air Quality: WRF-Chem and SHERPA Analysis for Effective Air Quality Solutions 

Jiayu Xu, Alain Clappier, Lin Zhang, Philippe Thunis, Enrico Pisoni, and Xingpei Ye

Air quality in China has been significantly improved over the past decade. However, many areas still face challenges with air pollutants such as PM2.5 and ozone. More than a quarter of the 339 cities regularly exceed the Chinese air quality standards and all of them exceed the latest World Health Organization guidelines, despite compliance efforts in reducing sulfur dioxide (SO2), nitrogen oxides (NOx), and carbon emissions. Continuous and deep improvements in air quality need a more in-depth quantitative assessment to understand the spatial scales (urban, regional, and national) of air pollution sources and to clarify the sequence of precursors and emission sectors that contribute to these pollutants. Here we combine the WRF-Chem model sensitivity simulations and the Screening for High Emission Reduction Potentials for Air quality (SHERPA) tool to address these challenges, particularly focusing on PM2.5. We first assess the chemical regimes of secondary inorganic aerosols (SIA) formation by simulating emission reduction scenarios for three main precursors (SO2, NOx, NH3). We find that NH3 predominantly controls SIA formation over 60% of China during cold seasons and NOx- or SO2-senesitive grids only dominate in four warm months (April to July). The spatial distributions of the chemical regimes throughout the year show a distinct demarcation between eastern NH3-NOx-controlled area and western NH3-SO2(-NOx)-controlled area. Sichuan Basin and Henan Province, however, are NOx-sensitive throughout the year. We then train the source-receptor relationships in SHERPA using the baseline and sensitivity simulation outputs of WRF-Chem. SHERPA can well reproduce the responses of PM2.5 concentrations to the emission changes of all precursors in China. Our results show that for yearly average PM2.5, local actions of precursor emission reduction at the urban scale are effective for most cities and mitigations in agricultural sector are important. Our study stresses the essential role of NH3 to further PM2.5 mitigation strategies of whole China.

How to cite: Xu, J., Clappier, A., Zhang, L., Thunis, P., Pisoni, E., and Ye, X.: Insights into China's Air Quality: WRF-Chem and SHERPA Analysis for Effective Air Quality Solutions, EGU General Assembly 2024, Vienna, Austria, 14–19 Apr 2024, EGU24-19753, https://doi.org/10.5194/egusphere-egu24-19753, 2024.

EGU24-21019 | Orals | AS3.21

Implementation and evaluation of updated photolysis rates in the EMEP model using Cloud-J v7.3e 

Willem van Caspel, David Simpson, Yao Ge, and Massimo Vieno

Photolysis reactions are an essential component of atmospheric chemistry, with the accurate representation of solar radiation and its interactions with clouds and aerosols being a fundamental part of atmospheric chemistry-transport models (CTMs). The photolysis rate calculation scheme in the EMEP MSC-W CTM has recently been updated to the interactive Cloud-J v7.3e scheme, replacing the old system based on tabulated values (van Caspel, et. al., 2023). The current work highlights the comparison of the photolysis rate systems against aerial observations from the ATom-1 campaign over the Pacific Ocean (Hall, et. al., 2018). This comparison includes sensitivity analysis investigating the impact of model resolution, meteorological input model, and cloud averaging scheme. For air quality simulations, the Cloud-J photolysis rates lead to a clear shift in the partitioning of reactive oxygen into the ozone component, with simulations of surface ozone and carbon monoxide showing a general increase in performance. Annual mass-weighted tropospheric hydroxyl concentrations are increased by 26%, while the photolytic impact of aerosols is mostly limited to tropical biomass burning regions. The model run-time penalty of the interactive photolysis rate calculations is 15% at most, with the run-time of regional (forecasting) simulations being increased by no more than 3%.

van Caspel, W. E., Simpson, D., Jonson, J. E., Benedictow, A. M., Ge, Y., di Sarra, A., Pace, G, Vieno, M, Walker, H.L., & Heal, M. R. (2023). Implementation and evaluation of updated photolysis rates in the EMEP MSC-W chemistry-transport model using Cloud-J v7. 3e. Geoscientific Model Development, 16(24), 7433-7459. https://doi.org/10.5194/gmd-16-7433-2023

Hall, S. R., Ullmann, K., Prather, M. J., Flynn, C. M., Murray, L. T., Fiore, A. M., Correa, G., Strode, S. A., Steenrod, S. D., Lamarque, J.-F., Guth, J., Josse, B., Flemming, J., Huijnen, V., Abraham, N. L., and Archibald, A. T. (2018): Cloud impacts on photochemistry: building a climatology of photolysis rates from the Atmospheric Tomography mission, Atmos. Chem. Phys., 18, 16809–16828, https://doi.org/10.5194/acp-18-16809-2018

How to cite: van Caspel, W., Simpson, D., Ge, Y., and Vieno, M.: Implementation and evaluation of updated photolysis rates in the EMEP model using Cloud-J v7.3e, EGU General Assembly 2024, Vienna, Austria, 14–19 Apr 2024, EGU24-21019, https://doi.org/10.5194/egusphere-egu24-21019, 2024.

EGU24-21149 | Orals | AS3.21

Approaches to PBAP modelling in EMEP 

Gunnar Felix Lange, David Simpson, Karl Espen Yttri, Alvaro Valdebenito, Dirk Olivie, Willem van Caspel, and Hilde Fagerli

Primary biological aerosol particles (PBAP) are ubiquitous in the Earth’s atmosphere, and can make significant contributions to measured particulate matter (PM) concentrations [1,2]. They are also known to play an important role in cloud formation and have a significant impact on health [3]. The sources of PBAP, however, are many and complex (e.g., viruses, bacteria, algae, fungae, plant pollen), and PBAP can be emitted from both land and sea sources. Although modelling of pollen has been included in the EMEP MSC-W chemical transport model [4] for many years, other PBAP sources have not been included. This is mainly because of the difficulties in quantifying the magnitude and spatial and temporal distributions at both European and global scale. In this study we review some of the main sources of PBAP, and consider approaches for a more detailed inclusion of these important aerosol particles in the EMEP model.

[1] V. R. DesprÅLes et al. Primary biological aerosol particles in the atmosphere: a review, Tellus B: Chemical and Physical Meteorology, 64:1 (2012).

[2] K. Yttri et al. Trends, composition, and sources of carbonaceous aerosol at the Birkenes Observatory, northern Europe, 2001–2018, Atmos. Chem. Phys., 21, 7149–7170 (2021).

[3] J. FrÅNohlich-Nowoisky et al. Bioaerosols in the Earth system: Climate, health, and ecosystem interactions, Atmospheric Research Volume 182, 346-376 (2016).

[4] D. Simpson et al. The EMEP MSC-W chemical transport model – technical description, Atmos. Chem. Phys., 12, 7825–7865 (2012).

How to cite: Lange, G. F., Simpson, D., Yttri, K. E., Valdebenito, A., Olivie, D., van Caspel, W., and Fagerli, H.: Approaches to PBAP modelling in EMEP, EGU General Assembly 2024, Vienna, Austria, 14–19 Apr 2024, EGU24-21149, https://doi.org/10.5194/egusphere-egu24-21149, 2024.

EGU24-21468 | Posters on site | AS3.21

Impact of Non-Exhaust Emission on Ambient Particulate Matter Concentration using a Coupled Atmospheric Chemistry –CFD Model 

Seon-Young Park, Myeong-Gyun Kim, Hyo-Jong Song, Jae-Jin Kim, Wonsik Choi, Sanghyun Lee, DaeGyun Lee, Jinyoung Choi, and Minjoong J. Kim

Vehicular emissions are major sources of gaseous and particulate matter pollutants in urban atmospheres. Stringent environmental regulations on vehicular emissions have been consistently implemented, leading to a substantial decrease in exhaust emissions. In contrast, non-exhaust emissions are increasing with the growing share of electric vehicles. Non-exhaust particulate matter emissions account for approximately 90% of total vehicular emissions. However, standardized guidelines for non-exhaust emissions have not been established, largely due to the challenges in estimating ambient concentrations from non-exhaust particulate matter sources. In this study, we performed a particulate matter simulation to investigate the quantitative impact of non-exhaust emissions in Seoul, using a coupled atmospheric chemistry–CFD model (CFD-Chem). We evaluated the model using various emission factors and determined the most accurate emission factor by comparing it with observed PM concentrations at the pedestrian level. Our simulated PM concentrations follow the diurnal variation of traffic volume, indicating a significant contribution of non-vehicular emissions to PM concentration at ground level. We observed that the impact of non-exhaust sources on pedestrians is higher in alleys than on main streets. Our results suggest that precise simulations are essential for establishing accurate and standardized guidelines for non-exhaust emissions.

How to cite: Park, S.-Y., Kim, M.-G., Song, H.-J., Kim, J.-J., Choi, W., Lee, S., Lee, D., Choi, J., and Kim, M. J.: Impact of Non-Exhaust Emission on Ambient Particulate Matter Concentration using a Coupled Atmospheric Chemistry –CFD Model, EGU General Assembly 2024, Vienna, Austria, 14–19 Apr 2024, EGU24-21468, https://doi.org/10.5194/egusphere-egu24-21468, 2024.

EGU24-21978 | Posters on site | AS3.21

Chemistry-transport modelling with the new CHIMERE version v2023 

Laurent Menut, Arineh Cholakian, Romain Pennel, Guillaume Siour, Sylvain Mailler, Myrto Valari, Lya Lugon, and Yann Meurdesoif

The CHIMERE model has been under continuous development for many years, and has been used to carry out numerous analyses of air pollution cases, future scenarios and parameterization developments. The model is updated regularly, and a new version is released under the free GPL license every 2 or 3 years. This poster presents the new 2023 version released in December. It contains new schemes (emissions, turbulence, chemistry) but also a coupling with the XIOS code and the SSH-aerosol aerosol module, and the recent version of WRF 4.3 for direct and indirect aerosol effects. In terms of correlation and bias, this version is better than its predecessor for simulating gases and aerosols such as O3, NO2, PM10 and AOD. It is also faster, as it runs simulations 40% faster than the previous version.

How to cite: Menut, L., Cholakian, A., Pennel, R., Siour, G., Mailler, S., Valari, M., Lugon, L., and Meurdesoif, Y.: Chemistry-transport modelling with the new CHIMERE version v2023, EGU General Assembly 2024, Vienna, Austria, 14–19 Apr 2024, EGU24-21978, https://doi.org/10.5194/egusphere-egu24-21978, 2024.

EGU24-1618 | ECS | Posters on site | AS3.23

Global climate model development to constrain the impact of airborne microplastics on climate change 

Cameron McErlich, Catherine Hardacre, and Laura Revell

Because they are small and lightweight, airborne microplastics can remain suspended in the atmosphere for long periods. Microplastics appear to be ubiquitous in the atmosphere, having been identified at numerous remote sites and as high as 3500 m above sea level. Previously it has been shown that airborne microplastics may contribute to climate change by absorbing and scattering light. A weak cooling effect was calculated for direct microplastic-radiation interactions, subject to large uncertainties. Recent studies have identified the presence of microplastics in cloud water collected at high altitudes, suggesting that microplastics may act as cloud condensation nuclei (CCN). However, laboratory studies indicate that microplastics act as ice-nucleating particles (INP). The consequences of microplastics seeding cloud formation on climate change are unknown, as global climate models do not routinely include airborne microplastics, which are essentially a new class of anthropogenic aerosol. We present plans and progress for the implementation and assessment of microplastics as an aerosol species within GLOMAP-mode, the aerosol scheme used in the United Kingdom Chemistry & Aerosols (UKCA) component model of the UK Earth System Model (UKESM1.1). We aim to model microplastic-cloud interactions and their effect on climate so that together with microplastic-radiation interactions, the full effects of airborne microplastics on climate can be accounted for. 

How to cite: McErlich, C., Hardacre, C., and Revell, L.: Global climate model development to constrain the impact of airborne microplastics on climate change, EGU General Assembly 2024, Vienna, Austria, 14–19 Apr 2024, EGU24-1618, https://doi.org/10.5194/egusphere-egu24-1618, 2024.

EGU24-2542 | ECS | Posters on site | AS3.23

Microplastic particles resuspensions in bare soils and global atmospheric transport 

Ioanna Evangelou, Daria Tatsii, Silvia Bucci, and Andreas Stohl

Microplastics (MPs), which are synthetic polymer particles with sizes from 1 µm to 1 mm, are considered as an emerging pollutant. It has been proposed that the atmosphere has a significant role in the transport of MPs. Atmospheric MPs can originate from primary sources, such as population activities, or secondary sources, like the ocean and soils.

In this study, we estimate the secondary MPs that are resuspended in bare soils together with mineral dust, using measurements of MP soil mass fractions, the MP enrichment in wind-eroded sediments relative to the original soil, and spatiotemporally resolved dust emissions calculated with the dust mobilization scheme FLEXDUST (Groot Zwaaftink et al., 2016). Using the Lagrangian atmospheric dispersion model FLEXPART (Pisso et al., 2019), we simulate the global transport of resuspended MPs for a range of sizes and morphologies (spheres, fibers) based on our estimated emissions. We perform a ten-thousand-member Monte Carlo (MC) simulation in which the parameters affecting the resuspensions are perturbed, and an extended MC by varying further the assumed MP size distributions to estimate the resuspension and transport uncertainties, respectively.

How to cite: Evangelou, I., Tatsii, D., Bucci, S., and Stohl, A.: Microplastic particles resuspensions in bare soils and global atmospheric transport, EGU General Assembly 2024, Vienna, Austria, 14–19 Apr 2024, EGU24-2542, https://doi.org/10.5194/egusphere-egu24-2542, 2024.

EGU24-2744 | ECS | Orals | AS3.23

Detemination of Airborne Microplastics using LC-MS/MS 

B Praphulla Chandra, Durga Prasad Patnana, and Prashanth Tripathi

In recent times, microplastics (MPs) pollution has become a growing concern across the globe. MPs are easily transferred and ubiquitously found in ambient air. These MPs in the air can act as carriers for several toxic pollutants and exposure to MPs could lead to pulmonary diseases in humans. Polyethylene terephthalate (PET) is one of the most abundant airborne MPs in the ambient environements and nylon 66 is one of the most abundant MPs found in microenvironments. However, there are no studies reported for the quantification of airborne PET and nylon 66 microplastics present in inhalable fraction of ambient fine particulate matter. This study describes the methods optimized for the quantification of PET microplastics and nylon 66 microplastics bound to aiborne PM2.5 using LC-MS/MS. Teflon and Quartz fiber filters were tested for extraction efficiency in measuring the mass concentrations of airborne PET MPs and nylon 66 MPs. Teflon filters have shown good recovery (80 % – 120 %) compared to Quartz filters. Using the optimized methods, a pilot study was carried out at Delhi, the National Capital of India and Mohali, a suburban city in Northwest Indo-Gangetic Plain (NWIGP) for the determination of mass concentrations of PET MPs present in airborne inhalable fraction of ambient PM2.5 and a pilot study was carried out to measure the mass concentrations of nylon 66 microplastics present in the inhalable fraction of particulate matter collected in a shopping complex. Observed maximum mass concentrations of PET MPs in airborne PM2.5 at Delhi and Mohali are 135.2 ng m-3 and 158.0 ng m-3, respectively. The observed mass concentrations of nylon 66 MPs in the microenvironment in this study are in the range of 0.30 ng m-3 to 4.37 ng m-3.

How to cite: Chandra, B. P., Patnana, D. P., and Tripathi, P.: Detemination of Airborne Microplastics using LC-MS/MS, EGU General Assembly 2024, Vienna, Austria, 14–19 Apr 2024, EGU24-2744, https://doi.org/10.5194/egusphere-egu24-2744, 2024.

EGU24-3950 | Posters on site | AS3.23

Potential sources and transport of atmospheric microplastics in the North Atlantic Ocean 

Nikolaos Evangeliou, Isabel Goßmann, Dorte Herzke, Andreas Held, Janina Schulz, Vladimir Nikiforov, Sabine Eckhardt, Gunnar Gerdts, Oliver Wurl, and Barbara M. Scholz-Böttcher

The present study held in the frame of the JPI-Oceans FACTS examines the occurrence and long-range transport of microplastics (MP) in the North Atlantic Ocean. During a research cruise in 2021 seven transects along the Norwegian coast up to the Bear Island were actively sampled and the performance of two different sampling devices was evaluated. MP analysis and mass quantification was conducted using Py-GC/MS method. With careful reference to available field and laboratory blank values, MP was detected even in remote Artic areas with concentrations up to 37.5 ng MP m-3 and a clear predominance of the PET cluster. In addition, car tire tread, and clusters of PS, PP, and PUR were detected more often. Using the Lagrangian particle dispersion model FLEXPART, an attempt to reconstruct the origin of the air masses was made and to gain information about the origin of the measured MP by quantify different source contributions (sea-spray, mineral dust, road dust, agriculture). In this context, the resuspension of MP from the ocean into the overlying air layers appears to be a relevant source. Likewise, the long-range transport of PET particles appears to be substantial. The range of polymers detected, but also the risk of contamination, was closely linked to the particular sampling method used.

How to cite: Evangeliou, N., Goßmann, I., Herzke, D., Held, A., Schulz, J., Nikiforov, V., Eckhardt, S., Gerdts, G., Wurl, O., and Scholz-Böttcher, B. M.: Potential sources and transport of atmospheric microplastics in the North Atlantic Ocean, EGU General Assembly 2024, Vienna, Austria, 14–19 Apr 2024, EGU24-3950, https://doi.org/10.5194/egusphere-egu24-3950, 2024.

EGU24-4705 | ECS | Posters on site | AS3.23

Unveiling Microplastic Pollution in the Air: Optimizing filter material and Work-up in PM10 studies 

Mareike Schumacher, Albena Lederer, and Dieter Fischer

Microplastics (MP) are prevalent environmental pollutants found in urban, rural, and remote locations worldwide. Although aquatic and soil samples are extensively studied, the examination of aerosol samples is a relatively new area of research. The investigation of inhalation exposure to nano- and microplastic particles is particularly noteworthy, given that the portion of particulate matter (PM) with an aerodynamic diameter less than 10 µm (PM10) is believed to exert the most significant impact on human health. 

Analyzing MP involves the application of mass-balanced or particle-related methods. To allow the applicability of both methods, the election of filter material during sampling is crucial. Membrane filters like quartz fibre filters (QFF) are the material of choice used for various types of analytes due to their high uptake capacity of PM. The direct analysis of the sampled QFF with particle related methods is impeded without particle extraction, since microscopic methods require all analytes to be detectable on the surface.

The mechanical stress induced on the filters during extraction leads to an extensive fibre loss of the filter material that aggravates the following evaluation. A pre-sampling filter treatment for QFF with potassium silicate solution (K2SiO3 ⋅ n H2O, also known as water glass) as inorganic adhesive is presented. The advantages of the improved filter properties during post-sampling processing for microscopic analysis are shown and results are compared to non-treated filters.

A multiple step QFF work-up is applied including particle extraction, digestion (removal of organics by employing chemical treatment) and density separation. Since every processing step is prone to particle loss, the evaluation of recovery rates is essential. We present two approaches for quality assurance within the particle size range of interest. The optical approach allows the assessment in terms of absolute particle numbers, while mass spectrometry method provides the particle loss specified in mass.

After successful work-up, we are combining both method types by using Raman Microscopy (µRaman) and Pyrolysis Gas Chromatography-Mass Spectronomy (py-GC/MS) for the characterisation of MP. This combination raises the possibility to compare the results of both method types. We will show that the combination of both methods can be a significant contribution to the analysis of MP in the atmosphere.


How to cite: Schumacher, M., Lederer, A., and Fischer, D.: Unveiling Microplastic Pollution in the Air: Optimizing filter material and Work-up in PM10 studies, EGU General Assembly 2024, Vienna, Austria, 14–19 Apr 2024, EGU24-4705, https://doi.org/10.5194/egusphere-egu24-4705, 2024.

EGU24-5960 | ECS | Posters on site | AS3.23

Estimation of spatio-temporal source of microplastics using Bayesian Neural networks 

Antonie Brožová, Václav Šmídl, Ondřej Tichý, and Nikolaos Evangeliou

Estimation of the source of airborne microplastics is a challenging inverse problem since the number of measurements is very small compared to the number of potential sources. The source is spatio-temporal and thus its estimation from a few measurements is severely ill-posed. Recent studies [1] solve this issue using Bayesian methods that introduce prior on the source term using additional assumptions of sparsity and smoothness. Here, deposition measurements of airborne microplastics and microfibers from the Western USA are combined with the FLEXPART atmospheric dispersion model to construct and solve the linear inverse problem. However, the posterior is obtained only approximately, with an underestimated variance of the estimate.

In this contribution, we solve the same inverse problem as in [1] using a source term estimator in the form of a spatial Bayesian neural network [2]. We compare the obtained results with those obtained by the conventional methods. Since the ground truth for the microplastics is not available, the accuracy of the estimation cannot be assessed quantitatively. Therefore, we focus on qualitative comparison and sensitivity study with respect to initial conditions and hyper-parameters of the methods.

Acknowledgment:

This research has been supported by the Czech Science Foundation (grant no. GA24-10400S).

References:

[1] Evangeliou, N., Tichý, O., Eckhardt, S., Zwaaftink, C.G. and Brahney, J., 2022. Sources and fate of atmospheric microplastics revealed from inverse and dispersion modelling: From global emissions to deposition. Journal of Hazardous Materials, 432, p.128585.

[2] Zammit-Mangion, A., Kaminski, M.D., Tran, B.H., Filippone, M. and Cressie, N., 2023. Spatial Bayesian Neural Networks. arXiv preprint arXiv:2311.09491.

How to cite: Brožová, A., Šmídl, V., Tichý, O., and Evangeliou, N.: Estimation of spatio-temporal source of microplastics using Bayesian Neural networks, EGU General Assembly 2024, Vienna, Austria, 14–19 Apr 2024, EGU24-5960, https://doi.org/10.5194/egusphere-egu24-5960, 2024.

EGU24-6748 | ECS | Orals | AS3.23

Comprehensive Analysis of Atmospheric Microplastic Deposition: Insights from North Wales, UK, and Global Collaborations. 

Perrine J. Florent, Benjamin I. Collins, Martine Graf, Michaela K. Reay, Dave R. Chadwick, and Davey L. Jones

Microplastic contamination poses a significant environmental threat with far-reaching consequences for ecosystems and human well-being. This study addresses this concern by conducting an extensive analysis of atmospheric microplastic (MP) deposition, with a focus on fostering international collaboration across countries. While significant research has focused on microplastics in aquatic environments, their presence in the atmosphere remains relatively unexplored. This research seeks to fill this gap by evaluating atmospheric MPs, providing crucial insights into their distribution and transport mechanisms. The main objective of this study is twofold: first, to assess the characteristics and prevalence of atmospheric MPs in North Wales, UK; and second, to establish collaborative partnerships with countries such as China, Vietnam, Egypt, Sri Lanka and Brazil. Simultaneously, the research identifies MPs in the soil, facilitating a comprehensive comparison between these two environments. This comparative analysis not only contributes to our understanding of potential atmospheric MP deposition onto the soil but also emphasises the importance of collaborative efforts in addressing this global issue. The sampling approach involves collecting both rainfall and soil samples over a year. Fluorescence microscopy is employed to assess the quantity, shape, and size of MPs, while Laser Direct Infrared Imaging (LDIR) is utilised to identify their polymer composition. Preliminary findings reveal a significant prevalence of small MPs (20-40 microns), with abundance diminishing as MP size increases. Temporal variations in MPs align primarily with rainfall patterns, with wind emerging as a crucial factor during periods of low-intensity precipitation. Additionally, the presence of MPs in the soil is expected to be influenced by vegetation coverage, with deposition anticipated to rise with increased precipitation. This comprehensive examination not only enhances our understanding of the environmental fate of MPs but also underscores the need for collaborative approaches to address atmospheric MP pollution globally. By establishing partnerships, the research aims to create a framework for shared knowledge and resources, enabling the comparison of atmospheric MP deposition across different climate zones. This international collaboration not only expands the study's scope but also fosters a collective understanding of the impact of atmospheric MPs on diverse environments.


How to cite: Florent, P. J., Collins, B. I., Graf, M., Reay, M. K., Chadwick, D. R., and Jones, D. L.: Comprehensive Analysis of Atmospheric Microplastic Deposition: Insights from North Wales, UK, and Global Collaborations., EGU General Assembly 2024, Vienna, Austria, 14–19 Apr 2024, EGU24-6748, https://doi.org/10.5194/egusphere-egu24-6748, 2024.

EGU24-7162 | Orals | AS3.23

Emission characteristics of volatile organic compounds from plastics exposed to sunlight 

Narin Choi, Joongeon An, Donghwi Kim, Andrew Loh, and Unhyuk Yim

Fossil fuel-based synthetic polymers release substantial amounts of chemicals throughout their life cycle. Given their potential for accumulation and persistence in the environment, plastic-associated chemicals released into the surrounding matrix during weathering have gained attention due to potential hazards to both the environment and human health. Particularly, volatile organic compounds (VOCs), characterized by their high vapor pressure, can be emitted into the atmosphere as degradation products from plastics. Despite their significant impacts, the emission characteristics of these VOCs during the weathering process remain poorly understood. This study aims to fill this knowledge gap by systematically characterizing the VOC emissions from plastics exposed to outdoor conditions. Pellets of five types of plastic (low- and high-density polyethylene, LDPE and HDPE; polypropylene, PP; expanded polystyrene, EPS; polyethylene terephthalate, PET) prevalent in marine environments as debris were subjected to year-long outdoor exposure. Physical and chemical transformations were examined through Scanning Electron Microscope (SEM) and Fourier Transform Infrared Spectrometry (FTIR), respectively, while VOCs were measured using Selected Ion Flow Tube Mass Spectrometry (SIFT-MS) under controlled heating conditions of 60℃ in a chamber. Over the course of a year, noticeable alterations in color, fragmentation, and the occurrence of cracks were evident in EPS, PP, and LDPE plastics with considerable chemical modifications. Mass spectra of VOCs from plastics susceptible to weathering exhibited increased peak intensity and the number of peaks over time. The proportion of oxygen-containing compounds increased as a function of exposure time, indicating photooxidation of the plastic backbone. VOC emissions in the control group exhibited a decreasing trend throughout the year, indicating their source from residuals contained in the pellets. In contrast, those of the exposure group showed an increasing trend, particularly in LDPE, PP, and EPS, attributed to the production of degradation products. Calculations of potential annual emissions using annual concentration changes revealed a 2.25-fold increase in VOC emissions in sunlight exposure compared with the control group. These findings emphasize the significance of evaluating VOC emissions originating from plastics in environments with direct sunlight exposure, especially beaches, which frequently serve as hotspots for the accumulation of marine plastic debris.

Acknowledgement: This study was supported by the grant “Development of technology for impact assessment of plastic debris on marine ecosystem” from the Korea Institute of Ocean Science and Technology (PEA0204).

How to cite: Choi, N., An, J., Kim, D., Loh, A., and Yim, U.: Emission characteristics of volatile organic compounds from plastics exposed to sunlight, EGU General Assembly 2024, Vienna, Austria, 14–19 Apr 2024, EGU24-7162, https://doi.org/10.5194/egusphere-egu24-7162, 2024.

EGU24-8636 | ECS | Orals | AS3.23

The temporal evolution of long-range atmospheric microplastic deposition 

Oskar Hagelskjær, Frederik Hagelskjær, Jeroen E. Sonke, Henar Margenat, Nadiia Yakovenko, and Gaël Le Roux

This study investigated the concentration of microplastics (MPs) > 2 µm in multiple ombrotrophic sphagnum peat archives, providing a quantitative analysis of the temporal evolution of global atmospheric MP deposition. From the 1990s to 2020, deposition rates have increased from hundreds or thousands to tens or hundreds of thousands of MPs/m²/day, depending on location. Polyethylene (PE) dominated the composition of identified synthetic polymers, comprising 93.5% of identified MPs (Fig. 1). Notably, 95% of particles measured less than 20 µm in diameter, emphasizing the prevalence of small-sized MPs in atmospheric transport and deposition. Projections estimated a daily terrestrial deposition of 34±23 g of MP per square kilometer in 2023 depending on location, totaling 1.9 million tonnes/year globally. The exponential growth trend aligned closely with the annual plastic production rate and suggest a doubling of today’s MP deposition rate by 2030 (Fig. 2). Even in the improbable scenario of a complete cease in plastic production, atmospheric MP deposition rates are likely to increase in the coming decades due to the large amount of mobile legacy plastics in the environment.

How to cite: Hagelskjær, O., Hagelskjær, F., Sonke, J. E., Margenat, H., Yakovenko, N., and Le Roux, G.: The temporal evolution of long-range atmospheric microplastic deposition, EGU General Assembly 2024, Vienna, Austria, 14–19 Apr 2024, EGU24-8636, https://doi.org/10.5194/egusphere-egu24-8636, 2024.

EGU24-8969 | ECS | Orals | AS3.23 | Highlight

How much microplastic reaches the stratosphere? The example of road traffic-related emissions 

Daria Tatsii, Ioanna Evangelou, Silvia Bucci, Lucie Bakels, and Andreas Stohl

Depending on their size and shape, microplastic particles have the potential to be transported over great distances in the atmosphere, both vertically and horizontally. Recent studies have shown that they can even reach the stratosphere. However, there is a lack of information on the distribution and amount of microplastics in the stratosphere.

Here, we estimate how much of microplastics from the second largest primary source can be found in the stratosphere. To investigate this, we use global road traffic-related emissions of microplastics - from tyres, road markings and polymer-modified bitumen - to simulate the atmospheric transport of particles of different sizes and spherical and cylindrical shapes using the Lagrangian particle dispersion model FLEXPART (Pisso et. al, 2019).

When exposed to the ultraviolet (UV) light, microplastic particles degrade and can release halogen-containing gases such as chlorine and bromine. For
example, neoprene, aka polychloroprene, which is present in tyres, contains around 40% chlorine by weight.

The released bromine and chlorine compounds could be involved in the catalytic destruction of ozone, similar to the release of chlorofluorocarbons and
halons under the Montreal Protocol. Therefore, in addition to quantifying the amount of microplastics reaching the stratosphere, we also estimate the amount of chlorine and bromine that can potentially be released during UV degradation of microplastics.

How to cite: Tatsii, D., Evangelou, I., Bucci, S., Bakels, L., and Stohl, A.: How much microplastic reaches the stratosphere? The example of road traffic-related emissions, EGU General Assembly 2024, Vienna, Austria, 14–19 Apr 2024, EGU24-8969, https://doi.org/10.5194/egusphere-egu24-8969, 2024.

EGU24-9022 | ECS | Posters on site | AS3.23

Investigating the Atmospheric Dispersion of Microplastic Particles - A Model Study 

Matthias Faust and Roland Schrödner
Widespread contamination of several environmental compartments by micro and nano plastic particles has been documented globally, extending even to rural regions. The airborne transport of these particles is a recognised phenomenon; however, the intricacies of this atmospheric pathway remain poorly understood. In this study, we employ the COSMO-Itpas model system, enabling the simulation of Lagrangian transport for individual particles within the turbulent regime of the atmospheric boundary layer. This modelling technique facilitates the calculation of thousands of trajectories, providing valuable insights into the connectivity between potential sources of plastic particles such as roads, agricultural activities, and water bodies and the observation sites where particles may be detected. Our pilot study focuses on the atmospheric pathway of idealised microplastic particles in central Germany, aiming to discern potential sources and assess their significance. By utilising the COSMO-Itpas model system, we aim to better understand the atmospheric dispersion of microplastics.

How to cite: Faust, M. and Schrödner, R.: Investigating the Atmospheric Dispersion of Microplastic Particles - A Model Study, EGU General Assembly 2024, Vienna, Austria, 14–19 Apr 2024, EGU24-9022, https://doi.org/10.5194/egusphere-egu24-9022, 2024.

EGU24-10018 | Orals | AS3.23

Atmospheric Microplastic in the Arctic and Mainland Norway; comparing urban and remote locations  

Dorte Herzke, Natascha Schmidt, Sabine Eckhardt, and Nikolaos Evangeliou

The majority of studies on the transport of microplastics to the Arctic have focused on ocean pathways. Ocean currents originating in the south of Europe have been proposed to function as major transport routes, carrying microplastics from the more densely populated southern areas in Europe to the Arctic (Cózar et al., 2017; Tekman et al. 2020). However, given the limited empirical data and lack of harmonized methodologies for sample collection, it is not yet possible to estimate the magnitude, composition and sources of atmospheric microplastics transported to the Arctic.

Here we present the outcomes of a study applying passive and active air-samplers for wet and dry deposition on two remote monitoring stations, Ny Ålesund (Svalbard) in the High Norwegian Arctic, and at Birkenes in mainland Norway in 2022 and 2023. We complement the results with active airsamples collected on cruises along the East- and Westcoast of Svalbard in 2021 and 2023, representing Arctic offshore samples. Deposition sampling at Norwegian urban sites were carried out to further our understanding on sources and emission volumes from high populated areas.

Results were further analysed with respect to their spatial origin and long-range transport using the Lagrangian particle dispersion model FLEXPART. Rubber from car tires and Nylon dominated most samples, followed by PMMA and PVC. The estimated concentrations were fitting well on most timepoints, with some underestimation, indicating some missing sources in the model.

Bi-weekly samples were collected during the period of June-December in 2022 and 2023 for the Norwegian onshore samples and during June 2021 and 2023 for the arctic offshore samples. We used full metal bulk precipitation samplers and suspended air samplers (Innovation NILU’s Atmospheric Microplastic Collector).

All samples were handled under strict QA/QC requirements, with all sample treatment occurring in controlled conditions of clean rooms and laminar flow cabinets. After filtration on a GF/F filter, polymer determination was performed by pyr-GC/MS (Frontier lab multi shot pyrolizer EGA/PY 3030D connected to a Frontier lab AS 1020E Auto shot sampler connected to a ThermoScience TSQ9000 GC/MS/MS). All samples were accompanied with field and procedural blanks. Results were further analysed with respect to their spatial origin and long-range transport using the Lagrangian particle dispersion model FLEXPART.

Rubber from car tires and Nylon dominated most samples, followed by PMMA and PVC. The estimated concentrations were fitting well on most timepoints, with some underestimation, indicating some missing sources in the model. While SBR and Nylon dominate in the Norwegian mainland samples, contribute almost every of the measured polymers to the samples from Zeppelin. These differences can be explained by the closeness to urban regions being a source of car tire particles and synthetic textiles for Birkenes in Southern Norway, while Zeppelin is rather impacted by Long-range-transport of a broad range of polymers. MP concentrations in deposition samples were more than 10000-times higher than in active samples, and Arctic samples were in general lower than samples from the Norwegian mainland.


How to cite: Herzke, D., Schmidt, N., Eckhardt, S., and Evangeliou, N.: Atmospheric Microplastic in the Arctic and Mainland Norway; comparing urban and remote locations , EGU General Assembly 2024, Vienna, Austria, 14–19 Apr 2024, EGU24-10018, https://doi.org/10.5194/egusphere-egu24-10018, 2024.

EGU24-13933 | ECS | Orals | AS3.23 | Highlight

Using a Citizen Science Approach to Assess Nanoplastics Pollution in Remote High-Altitude Glaciers 

Leonie Jurkschat, Alasdair J. Gill, Robin Milner, Rupert Holzinger, and Dušan Materić

Microplastics have been found in almost every environment on Earth. As it is known that microplastics gradually degrade into smaller particles, eventually reaching the nanoscale, one naturally expects to find nanoplastics in all of the places where microplastics are found, but in even greater numbers. Such nanoplastics have been shown to adsorb organic pollutants and to cross cell membranes in vitro. While not fully understood, they may have an adverse effect on human health, and therefore warrant further investigation.

However, analysing nanoplastics is challenging. Firstly, the more commonly used measurement techniques have limitations at this scale. Secondly, while micro- and nanoplastic research has predominantly concentrated on marine and fluvial environments, atmospheric transport is believed to be significant, particularly for nanoplastics, and it is difficult to sample the atmosphere systematically.

In this study, we combine high-sensitivity trace science methods with sampling the surface snows from high-altitude glaciers as a proxy for airborne micro- and nanoplastics. This was facilitated by a citizen science sampling strategy involving mountaineers from the HLR 22 Expedition (www.high-level-route.com). This enabled us to obtain samples from otherwise inaccessible high-altitude glaciers in the Alps, thereby gaining a better insight into nanoplastics' presence and distribution in remote Alpine areas.

We analysed particles in the < 1 µm size fraction by thermal desorption-proton transfer reaction-mass spectrometry (TD-PTR-MS) using a method developed in previous studies. We fingerprinted the samples for common polymers (PE, PET, PP, PVC, PS and tire wear particles) and calculated a mass concentration for each polymer. Nanoplastics were detected at half of the sampled sites, with the majority by mass being PS and tire wear particles, showing just how pervasive nanoplastics are, even in places where humans rarely tread.

Our results show the value of a citizen science approach to analysing nanoplastics in remote and pristine environments. Confounding factors in such a sampling strategy bring risks of lower reproducibility, human error and contamination. However, strategies can be implemented to reduce these risks, and the results obtained are a unique and valuable contribution to understanding nanoplastics pollution. We conclude that the trained citizen science sampling approach is feasible for expanding the analysis to remote regions worldwide.

__PRESENT__PRESENT

__PRESENT

__PRESENT

How to cite: Jurkschat, L., Gill, A. J., Milner, R., Holzinger, R., and Materić, D.: Using a Citizen Science Approach to Assess Nanoplastics Pollution in Remote High-Altitude Glaciers, EGU General Assembly 2024, Vienna, Austria, 14–19 Apr 2024, EGU24-13933, https://doi.org/10.5194/egusphere-egu24-13933, 2024.

EGU24-16444 | ECS | Orals | AS3.23

Atmospheric microplastics in the Arctic Region: An examination of deposited and suspended atmospheric microplastics in Ny-Ålesund, Svalbard 

Anna MacDonald, Deonie Allen, Christopher White, Vernon Pheonix, and Dušan Materić

Atmospheric microplastics (MPs) are an emerging environmental concern and have been reported globally, from large urban cities such as Beijing to remote regions such as Antarctica. Due to their small size, MPs can be transported large distances and pose a threat to human health, ecosystem function, and climate processes. However, significant gaps in knowledge surrounding the presence and characteristics of atmospheric MPs found in remote regions remain, especially in the polar regions. These are sensitive environments with relatively low levels of human activity, and play important roles in the earth’s climate and ecosystem health. Although atmospheric MPs have been reported in both the Artic and Antarctic, the importance of local and distal sources, and the roles atmospheric and marine transport processes, are unclear. By examining the presence of atmospheric MPs in this region and their transport, it is possible to gain more understanding of the global extent of MP pollution and the pathways which result in the presence of this pollutant in such pristine locations.  

Supported by the Norwegian Polar Institute, deposited and suspended atmospheric MPs were collected over a 28-day period between May and June 2022 at the Ny-Ålesund Arctic research station in (78°55’ N, 11°56’ E), using active and passive sampling. µRaman analysis was carried out to identify polymer composition, and Nile-Red staining has been used to examine the shape and size of these particulates.

Atmospheric MP concentrations for the Artic region are reported and the environmental implications discussed. This is the first time both suspended and deposited atmospheric MPs have been reported in this area, and this offers the opportunity to further understand the global extent and composition of this emerging pollutant.

How to cite: MacDonald, A., Allen, D., White, C., Pheonix, V., and Materić, D.: Atmospheric microplastics in the Arctic Region: An examination of deposited and suspended atmospheric microplastics in Ny-Ålesund, Svalbard, EGU General Assembly 2024, Vienna, Austria, 14–19 Apr 2024, EGU24-16444, https://doi.org/10.5194/egusphere-egu24-16444, 2024.

EGU24-16953 | Posters on site | AS3.23

Tracking the sources of atmospheric microplastic using FLEXPART v. 11 

Silvia Bucci, Daria Tatsii, Ioanna Evangelou, Lucie Bakels, and Andreas Stohl

An emerging number of studies highlighted the presence of microplastic in the atmosphere all over the world. The presence of such particles has been observed at the poles, in the marine atmosphere above the surface of the oceans, in clouds, on the fresh snow of high mountains and high concentrations has been observed in the atmospheric fallout in densely populated areas. Despite so, the main sources of atmospheric microplastic are still not well characterized and there are high uncertainties in the attempts of estimating their relative contributions. In addition, the peculiar shape of some of these particles, e.g. the very elongated fibers, complicates tracking their atmospheric transport. In this work, we explore the contribution of different sources adopting a Lagrangian approach to analyze the existing timeseries of microplastic concentrations. To do so, we exploit the new version of the Lagrangian model FLEXPART v11 (L. Bakels et al. 2024, in preparation), which also has the capability of considering the differences in the atmospheric lifetimes of irregular particles such as flattened or elongated plastic film or fibers (D. Tatsii et al. 2023). The results will highlight the areas of main emission for the regions of observations and help advance in our understanding of the sources of atmospheric microplastic pollution.

How to cite: Bucci, S., Tatsii, D., Evangelou, I., Bakels, L., and Stohl, A.: Tracking the sources of atmospheric microplastic using FLEXPART v. 11, EGU General Assembly 2024, Vienna, Austria, 14–19 Apr 2024, EGU24-16953, https://doi.org/10.5194/egusphere-egu24-16953, 2024.

Plastic pollution has been recognised to be a global problem, as particles of various sizes have been detected in water, soil and air, from urban to remote areas. Nanoplastics have been suspected to be a significant environmental and health problem; however, until recently, no quantitative method was available to measure the nanoplastics in environmental samples. Thermal Desorption – Proton Transfer Reaction – Mass Spectrometry (TD-PTR-MS) offers a good sensitivity, which makes the technique capable of measuring nanoplastics in environmental samples in the sub-nanogram range – opening new venues for plastics-related research. So far, we have successfully measured and reported nanoplastics deposited on the snow surface in the Alps [1], remote field sites in the French Pyrenees [2], rural surface water in Sweden and Siberia [3], in the Dutch Wadden Sea [4], urban air [5], and Greenland ice core and Antarctica sea ice [6]. Here, we will discuss nanoplastic loads for these different environmental compartments and their connection to the atmospheric transport of nanoplastics. We will discuss the methodological challenges and research gaps associated with measuring ultrafine micro- and nanoplastics. 

[1] D. Materić, E. Ludewig, D. Brunner, T. Röckmann, and R. Holzinger, “Nanoplastics transport to the remote, high-altitude Alps,” Environ. Pollut., p. 117697, Jul. 2021, doi: 10.1016/j.envpol.2021.117697.

[2] S. Allen et al., “An early comparison of nano to microplastic mass in a remote catchment’s atmospheric deposition,” J. Hazard. Mater. Adv., vol. 7, p. 100104, Aug. 2022, doi: 10.1016/j.hazadv.2022.100104.

[3] D. Materić et al., “Presence of nanoplastics in rural and remote surface waters,” Environ. Res. Lett., vol. 17, no. 5, p. 054036, May 2022, doi: 10.1088/1748-9326/ac68f7.

[4] D. Materić, R. Holzinger, and H. Niemann, “Nanoplastics and ultrafine microplastic in the Dutch Wadden Sea – The hidden plastics debris?,” Sci. Total Environ., vol. 846, p. 157371, Nov. 2022, doi: 10.1016/j.scitotenv.2022.157371.

[5] B. Kirchsteiger, D. Materić, F. Happenhofer, R. Holzinger, and A. Kasper-Giebl, “Fine micro- and nanoplastics particles (PM2.5) in urban air and their relation to polycyclic aromatic hydrocarbons,” Atmos. Environ., vol. 301, p. 119670, May 2023, doi: 10.1016/j.atmosenv.2023.119670.

[6] D. Materić, H. A. Kjær, P. Vallelonga, J.-L. Tison, T. Röckmann, and R. Holzinger, “Nanoplastics measurements in Northern and Southern polar ice,” Environ. Res., vol. 208, p. 112741, May 2022, doi: 10.1016/j.envres.2022.112741. 

How to cite: Materić, D.: Measuring nanoplastics in the atmosphere and other environmental compartments by TD-PTR-MS, EGU General Assembly 2024, Vienna, Austria, 14–19 Apr 2024, EGU24-19262, https://doi.org/10.5194/egusphere-egu24-19262, 2024.

EGU24-21699 | ECS | Orals | AS3.23

Chasing plastic storms: Assessing atmospheric microplastic deposition by a ‘pulse event’ of tropical storm Fiona in Eastern Canada 

Justine Ammendolia, Deonie Allen, Amber D. LeBlanc, Jenna Rachel Jambeck, Erika Merschrod, Steve Allen, and Tony Robert Walker

Atmospheric processes and extreme weather events are pathways for the global distribution and deposition of microplastics. Despite the global prevalence of meteorological events, our understanding of atmospheric microplastic pathways and fall-out to the terrestrial, aquatic and marine environment resulting from storms and severe events is limited. In this study, we geospatially consider a unique time series of the movement of atmospheric microplastics and anthropogenic microdebris during an extreme tropical storm in Atlantic Canada. The large tropical storm Fiona was recorded as the deepest cyclone that caused the worst financial damage on record for Eastern Canada during its’ landfall in Nova Scotia (September 22nd to 24th 2022). We collected a unique timeseries of passive deposition samples of atmospheric fall-out before, during, and after storm Fiona. Through micro-Raman spectroscopy and Nile Red fluorescence techniques, we chemically and morphologically characterized particles and quantifies the microdebris and microplastic fallout resulting from the storm. Using back trajectory modelling we aim to identify storm related sources and movement of these particles prior to deposition. As climate change drives increased storm frequency and intensity, it becomes more critical than ever to obtain meteorological baseline data of these pathways.

How to cite: Ammendolia, J., Allen, D., LeBlanc, A. D., Jambeck, J. R., Merschrod, E., Allen, S., and Walker, T. R.: Chasing plastic storms: Assessing atmospheric microplastic deposition by a ‘pulse event’ of tropical storm Fiona in Eastern Canada, EGU General Assembly 2024, Vienna, Austria, 14–19 Apr 2024, EGU24-21699, https://doi.org/10.5194/egusphere-egu24-21699, 2024.

EGU24-932 | ECS | Orals | AS3.24

From novelty to norm: towards standardising drone quantification of gas emissions 

Jamie McQuilkin, Hugo Ricketts, and Grant Allen

New developments in the availability of precision robotics, battery technology, and miniaturised sensors have enabled hitherto impossible techniques in emissions quantification. Airborne drones can now retrieve a dense plane of gas concentration measurements in the cross-section of an advecting plume in a matter of minutes, revealing its structure, density, and variability. When interpolated spatiotemporally, and combined with wind measurements, a simple Eulerian mass balance model can be used to estimate emissions flux relatively quickly, with the potential to repeat measurements many times in a day to constrain uncertainty and characterise source dynamics. 

The drone mass balance method offers a cost-effective, precise, and flexible approach to measuring complex emitting sources that are otherwise challenging to monitor, at rates as low as 0.1 kg/h. Due to this, the method has received significant attention from industry and regulators in the context of the urgent need to understand and reduce greenhouse gas emissions, particularly methane. Its general applicability reaches wider, most notably to volcanology and other hazardous emission sources. 

However, as yet there is no consistent method of conducting drone mass balance, and different approaches in analysis of even the same data can lead to significant discrepancies in emissions estimates. This has thus far hindered the method's credibility, comparability, and regulatory uptake. 

We offer here a proposal for a protocol, based on more than ten years of flux method development, presented in a real-world context with results from campaigns and controlled release tests across Europe. The issues discussed will include best practices in flight planning, signal processing, interpolation, measurement and estimation of wind fields, sensor precision; and the ever-present issue of environmental sciences: how many replicates is sufficient. 

How to cite: McQuilkin, J., Ricketts, H., and Allen, G.: From novelty to norm: towards standardising drone quantification of gas emissions, EGU General Assembly 2024, Vienna, Austria, 14–19 Apr 2024, EGU24-932, https://doi.org/10.5194/egusphere-egu24-932, 2024.

Satellite-based detection of methane (CH4) point sources is crucial in identifying and mitigating anthropogenic emissions of CH4, a potent greenhouse gas. Previous studies have indicated the presence of CH4 point source emissions from coal mines in Shanxi, China, an important source region with large CH4 emissions, but a comprehensive survey has remained elusive. This study aims to conduct a survey of CH4 point sources over Shanxi's coal mines based on observations of the Advanced HyperSpectral Imager (AHSI) on board the Gaofen-5B satellite (GF-5B/AHSI) between 2021 and 2023. The spectral shift in center wavelength and change in full-width-half-maximum (FWHM) are estimated for all spectra channels, which are used as inputs for retrieving the enhancement of column-averaged dry-air mole fraction of CH4 (ΔXCH4) using a matched-filter based algorithm. Our results show that the spectral calibration on GF-5B/AHSI reduced estimation biases of emission flux rate by up to 5.0%. We applied the flood-fill algorithm to automatically extract emission plumes from ΔXCH4 maps. We adopted the integrated mass enhancement (IME) model to estimate the emission flux rate values from each CH4 point source. Consequently, we detected CH4 point sources in 32 coal mines with 93 plume events in Shanxi province. The estimated emission flux rate ranges from 857.67 ± 207.34 kg·h-1 to 14333.02 ± 5249.32 kg·h-1. The total emission flux rate reaches 13.26 t·h-1 in Shanxi, assuming all point sources emit simultaneously. Our results show that wind speed is the dominant source of uncertainty contributing about 84.84% to the total uncertainty in emission flux rate estimation. Interestingly, we found a number of false positive detections due to solar panels that are widely spread in Shanxi. This study also evaluates the accuracy of wind fields in ECMWF ERA5 reanalysis by comparing with ground-based meteorological station. We found large discrepancy, especially in wind direction, suggesting incorporating local meteorological measurements into the study CH4 point source are important to achieve high accuracy. The study demonstrates that GF-5B/AHSI possesses capabilities for monitoring large CH4 point sources over complex surface characteristics in Shanxi. 

How to cite: He, Z., Zeng, Z., Gao, L., and Liang, M.: A survey of methane point source emissions from coal mines in Shanxi province of China using AHSI on board Gaofen-5B, EGU General Assembly 2024, Vienna, Austria, 14–19 Apr 2024, EGU24-1632, https://doi.org/10.5194/egusphere-egu24-1632, 2024.

EGU24-5170 | ECS | Posters on site | AS3.24

Using mobile measurements of methane to detect natural gas leaks in two medium sized UK cities 

Thomas Moore, Sri Hapsari Budisulistiorini, Marvin Shaw, David Carslaw, and James Lee

Reducing fugitive emissions from natural gas networks is an important area to consider for future management of a country's methane emissions. The main problem with reducing these emissions comes from locating where leaks are commonly occurring, in order to determine which areas should be prioritised for replacing ageing or leaky pipes. This problem is especially relevant in the United Kingdom which has an extensive but ageing natural gas network. Two cities in the UK of varying sizes were selected in order to conduct vehicle-based measurement campaigns in summer and winter with a three-fold method to detect natural gas leaks; locating methane enhancements using 1Hz methane measurements; determining which areas had a recurring methane enhancement; confirming if these enhancements are natural gas emissions by use of ratios of other components contained within the natural gas mixture. This information can then be used to quantify the detected natural gas leaks and compare these to existing inventories.

How to cite: Moore, T., Budisulistiorini, S. H., Shaw, M., Carslaw, D., and Lee, J.: Using mobile measurements of methane to detect natural gas leaks in two medium sized UK cities, EGU General Assembly 2024, Vienna, Austria, 14–19 Apr 2024, EGU24-5170, https://doi.org/10.5194/egusphere-egu24-5170, 2024.

Abandoned oil and gas wells (O&G) are typically buried in Germany and thus a characterization of potential leakages is challenging. An industrial peat site in Steimbke (Northern Germany), which includes numerous buried oil wells, is an excellent area for studying the effects and challenges. In these peats, methane with an isotopic signature characteristic for a biogenic formation is highly abundant and likely consumed in large quantities by aerobic methanotrophic bacteria (MOB). These data underline the high complexity of characterising potential O&G well leakages (see also presentation of Sebastian Jordan et al.), but also indicate a high methane oxidizing capacity at peat sites in Germany and other comparable areas in Northern Europe.

Here, we present soil gas and lipid-biomarker data on the aerobic methane oxidizing community at Steimbke. We found that methane oxidation rates (MOx), as well as lipids typical for MOB, were enhanced at places, where high natural methane concentrations occurred. As typical lipids for MOB we studied phospholipid fatty acids (PLFA) and observed an increase of unsaturated PLFA with 16 and 18 carbon atoms with a likely unsaturation at the Δ8 position. These PLFA are typical for MOB-clusters of the Type II (α-proteobacteria) and Type I (γ-proteobacteria), respectively (e.g., Bowman et al., 1991; Nichols et al., 1985). Without PLFA concentrations being conclusive on the relative abundance of bacterial groups, our data argue for that both types are actively oxidizing methane in the Steimbke peats.

We also analysed the carbon isotopic fractionation factor of methane oxidation in the lab and modelled the isotopic behaviour of methane and CO2. Both were directly linked and demonstrate an ε of ~ -31 ‰ for methane (acc. Feisthauer et al., 2011). This is at the upper end of the known range of ε, which were previously reported between -3 and -39 ‰ for MOx (Templeton et al., 2006). Transferring the assessed fractionation factor to our field data and assuming MOx being responsible for the low methane emissions in the field, methane passing the MOB-layer should be substantially enriched in 13C during methane oxidation. Methane concentrations at the soil-atmosphere interface, however, were mostly too low for isotopic measurements. Only at a few sampling site, methane δ13C values could be determined, not showing a significant 13C enrichment. Thus, we assume this methane has likely bypassed the MOB layer. All in all, our data on the positive correlation of potential MOx and methane concentrations suggest that the microbial community can adapt, e.g., to a leaking O&G well. Thus, a shifting microbial community would help to mitigate methane emissions to the atmosphere. However, there were indications that high fluxes could bypass this biological methane filter.

  • Bowman et al. (1991) FEMS Microbiol. Ecol., 85, 15-22.
  • Feisthauer et al. (2011). Geochim. Cosmochim. Acta, 75, 1173-1184.
  • Nichols et al. (1985) FEMS Microbiol. Ecol., 0, 327-335.
  • Templeton et al. (2006) Geochim. Cosmochim. Acta, 70, 1739-1752.

How to cite: Blumenberg, M., Jordan, S., Krüger, M., and Schlömer, S.: Evidence from lipid biomarkers and the methane isotope fraction factor for the methane-degrading community in a peatland with abandoned oil wells (Northern Germany), EGU General Assembly 2024, Vienna, Austria, 14–19 Apr 2024, EGU24-7457, https://doi.org/10.5194/egusphere-egu24-7457, 2024.

EGU24-8005 | ECS | Orals | AS3.24

Methane emissions at buried abandoned wells in Northern Germany: sampling strategies, pitfalls, and silver linings 

Sebastian F. A. Jordan, Stefan Schlömer, Martin Krüger, and Martin Blumenberg

As we are risking to exceed the 1.5-degree target in the next decade, effective measures to cut back greenhouse gas emission are necessary. With this in mind, the global community expressed the necessity to shift away from fossil fuels at COP 28 for the first time in its history. During this transition process, millions of oil and gas wells will be abandoned. However, recent studies found substantial methane emissions from old abandoned wells for example in the USA and Canada. Hence, the establishment of a proper abandonment procedure is necessary. To achieve this, further research of the current situation of abandoned wells in different countries, reasons for well integrity failure and best abandonment practices are inevitable. So far, only about a dozen countries have measured data on methane emissions and even less include it in their yearly greenhouse gas inventory. Germany has about 20,000 abandoned wells, which are generally plugged and buried, however, it is unclear, whether they are emitting methane or not.

Here, we present an overview of two years of closed-chamber methane emission measurements at 59 onshore oil and gas wells in Northern Germany, covering both abandoned exploration and production wells. As the majority of well sites showed no methane leakage, we focus on two oil fields (“Steimbke Nord” and “Nienhagen (-Elwerath)”) with sample sites that showed minor methane emissions of up to ~540 nmol m-2 s-1. Based on a combination of soil gas hydrocarbon concentrations (methane, ethane, and propane) and isotopic methane compositions, we were able to link the methane emissions at three well sites at “Steimbke-Nord” to regionally occurring natural methanogenesis in the overburden (peat). One well at “Nienhagen (-Elwerath)”, however, was characterized by high δ13C-CH4 and a composition of higher hydrocarbons, typical for oil-associated gases and/or biodegraded oil. We will discuss two possible emission sources: (1) well integrity failure and (2) microbial degradation of oil residues from an old oil spill or a drilling mud pit. Furthermore, we will examine the mitigation potential of microbial methane oxidation for methane emissions to the atmosphere. In summary, our data demonstrates the complexity of emission studies on buried abandoned wells and underlines the necessity for a combination of soil gas sampling and flux measurements.

How to cite: Jordan, S. F. A., Schlömer, S., Krüger, M., and Blumenberg, M.: Methane emissions at buried abandoned wells in Northern Germany: sampling strategies, pitfalls, and silver linings, EGU General Assembly 2024, Vienna, Austria, 14–19 Apr 2024, EGU24-8005, https://doi.org/10.5194/egusphere-egu24-8005, 2024.

EGU24-9195 | Posters on site | AS3.24

Emissions Of Methane And Volatile Organic Compounds From Offshore Oil Loading Using Shuttle Tankers  

Ruth Purvis, James Lee, Tom Moore, Ralph Burton, James Hopkins, Ally Lewis, Stephen Mobbs, and Stuart Young

The full range of emissions from oil and gas production, especially offshore, is still not fully understood due to the vast number of sources and lack of observational data. Emissions from shuttle tanker loading are not well characterised. The latest National Atmospheric Emissions Inventory United Kingdom Green House Gas (NAEI_UK_GHG) Inventory Improvement Report (July 2022) cited evidence for emissions factors from methane (CH4) and non methane volatile organics (NMVOCS) compounds from oil loading as a future priority research area. In the UK almost 35 % of oil fields are designated “OTLS” which means that the liquids produced must be offloaded and transferred to onshore terminals/refineries using shuttle tankers.This work shows initial results from a campaign in October 2023 designed to investigate CH4 and NMVOC emissions from oil loading to shuttle tankers over the whole loading cycle. The project uses aircraft measurements along with different modelling techniques to evaluate emissions from the complete tanker loading process. The shuttle tanker data will also be looked at to see what abatement measures and equipment are on board.

How to cite: Purvis, R., Lee, J., Moore, T., Burton, R., Hopkins, J., Lewis, A., Mobbs, S., and Young, S.: Emissions Of Methane And Volatile Organic Compounds From Offshore Oil Loading Using Shuttle Tankers , EGU General Assembly 2024, Vienna, Austria, 14–19 Apr 2024, EGU24-9195, https://doi.org/10.5194/egusphere-egu24-9195, 2024.

EGU24-9599 | Posters on site | AS3.24

Towards the Quantification and Attribution of Anthropogenic CH4 Fluxes based on Airborne Lidar and Passive Measurements over the Lloydminster Oil and Gas fields 

Christian Fruck, Sebastian Wolff, Sven Krautwurst, Christoph Kiemle, Leah Marie Kanzler, Mathieu Quatrevalet, Martin Wirth, Andreas Fix, Jakob Borchardt, Oke Huhs, Gerhard Ehret, and Heinrich Bovensmann

The CoMet 2.0 Arctic airborne measurement campaign of 2022 targeted a variety of natural as well as anthropogenic sources of CH4, mostly in Canada, such as landfills, coal mines, power plants or fossil fuel exploitation sites. Many anthropogenic emission targets consist of a few strong emitters with small or negligible spatial extension. In these cases, emission plumes can readily be observed by passive imaging spectrometers, through the observed enhancement in column averaged CH4. However, over oil and gas fields such as the Lloydminster area at the Alberta/Saskatchewan border, with numerous individual wells extending over large areas, this is much more difficult since individual plumes are lower in magnitude and may even overlap. In such cases it may not be possible to resolve plumes from individual sources, but the total flux can still be estimated using a budget approach. Nevertheless, limitations arise from spatial and temporal variations in the wind field, regarding proper quantification of the source strengths.

In this contribution we present our strategy for source attribution, combining measurements by the airborne CHARM-F greenhouse-gas lidar and the MAMAP2DL imaging spectrometer with emission inventories and inverse modeling. A similar approach has already been successfully applied to CHARM-F data recorded over the Upper Silesian Coal Basin during the CoMet 1.0 campaign. CHARM-F is an Integrated-Path Differential-Absorption (IPDA) lidar that provides vertical column concentrations of CO2 and CH4 up to the flight altitude along the flight track. The advantages of lidar are the insensitivity to illumination conditions and a low intrinsic bias. MAMAP2DL is a passive airborne push broom imaging spectrometer that measures spatially resolved changes in relative column concentrations of CH4 and CO2. During the CoMet 2.0 Arctic campaign in August and September 2022, CHARM-F and MAMAP2DL have been deployed onboard the German research aircraft HALO, alongside a suite of complementary instruments for in-situ measurements of CH4, CO2 and other trace gases. We introduce our methods for data treatment and inverse modelling and show first results from this approach.

How to cite: Fruck, C., Wolff, S., Krautwurst, S., Kiemle, C., Kanzler, L. M., Quatrevalet, M., Wirth, M., Fix, A., Borchardt, J., Huhs, O., Ehret, G., and Bovensmann, H.: Towards the Quantification and Attribution of Anthropogenic CH4 Fluxes based on Airborne Lidar and Passive Measurements over the Lloydminster Oil and Gas fields, EGU General Assembly 2024, Vienna, Austria, 14–19 Apr 2024, EGU24-9599, https://doi.org/10.5194/egusphere-egu24-9599, 2024.

EGU24-9675 | ECS | Orals | AS3.24

Aerial Assessment of Methane Emissions from Canadian Landfills 

Donya Ghasemi, Chelsea Fougère, Afshan Khaleghi, Jordan Stuart, Rebecca Martino, Evelise Bourlon, and David Risk

Canada is committed to reducing methane emissions by 50% below 2020 levels by 2030 in alignment with the Global Methane Pledge. The waste sector accounts for 23% of Canada’s methane emissions, and accurate estimations of current emissions from landfill sites are needed to guide mitigation efforts. In 2022, we conducted a cross-Canada aircraft-based methane measurement campaign in collaboration with Environment and Climate Change Canada (ECCC) and the UNEP’s International Methane Emission Observatory (IMEO). We used a Twin Otter equipped with high-speed gas analyzers and meteorological measurement sensors, which was flown in ascending loops, downwind transects, or both in combination, at 27 active and inactive municipal solid waste landfills in Ontario and Québec, Canada. Mass balance flux estimates were generated using the Top-Down Emission Rate Retrieval Algorithm. Additional mass balance measurements were made by Scientific Aviation using a similar approach based on Gauss’s theorem. A Gaussian dispersion model was used at other sites where conditions were unsuitable for mass balance. We were also able to compare some results to an independent truck-based measurement campaign of the same sites. Most mass balance measurements fell within a factor of ~3 with Greenhouse Gas Reporting Program data submitted by industry operators, showing reasonable correspondence within expected variability to atmospheric pressure changes and other weather variables.

The research indicated that aircraft estimates were consistently higher than those derived from trucks. This implies a possible underestimation in truck measurements, particularly during sunny, low-wind conditions when the thermal lift of landfill CH4 plumes is notable. On the other hand, Gaussian dispersion model estimates were higher and more variable than mass balance-based methane emission rate estimates. We also compared our mass balance estimates to a First Order Decay landfill model used by the Environment and Climate Change Canada Waste Reduction for planning purposes, and we found that the model often overestimated emissions. These measurement-based estimates contribute to a refined understanding of methane emissions from Canadian landfills and provide valuable data for regulatory planning purposes.

How to cite: Ghasemi, D., Fougère, C., Khaleghi, A., Stuart, J., Martino, R., Bourlon, E., and Risk, D.: Aerial Assessment of Methane Emissions from Canadian Landfills, EGU General Assembly 2024, Vienna, Austria, 14–19 Apr 2024, EGU24-9675, https://doi.org/10.5194/egusphere-egu24-9675, 2024.

EGU24-10437 | ECS | Posters on site | AS3.24

Long-term monitoring of methane emission rates from a biogas plant in Heidelberg, Germany: quantification of method uncertainties with controlled release experiments 

Julia Wietzel, Piotr Korben, Antje Hoheisel, Johannes Kammerer, and Martina Schmidt

The increasing number of biogas plants in Germany and Europe requires an appropriate strategy to quantify potential methane losses from biogas plants to ensure the sustainability of this renewable energy production. In addition to the large uncertainties in these emission factors, there is little information on the temporal variations of CH4 emissions from biogas plants.

A long-term study of CH4 emission rates from a biogas plant in Heidelberg, Germany,  was performed over a five year period from August 2018 to December 2023. For a total of 27 measurement days the CH4 emission rates were determined for this biogas plant. These measurements were performed at different distances, weather conditions and two measurement devices. By averaging the individual emission rates of each measurement day at the biogas plant, an emission rate of 6.7 ± 0.8 kg CH4 h-1 was determined. For the calculation of CH4 emission rates, mobile measurements were performed nearby the biogas plant and analysed by applying a basic Gaussian plume dispersion model. Several controlled CH4 release experiments were carried out to analyse the accuracy and uncertainty of the CH4 emission rates from biogas plants and to improve the method. This included mobile measurements of methane concentration, meteorological measurements and the application of a Gaussian plume model. For this purpose, methane was released from gas cylinders in Heidelberg/Mannheim (Germany) in a controlled manner. Release rates between 0.1 and 0.7 kg CH4 h-1 were set and distances of 5 to 260 m between release point and inlet were investigated. The results obtained by applying a Gaussian plume model were compared with the actual release rates and thus the uncertainty of the method was analyzed in detail. The parameterization of the dispersion coefficients, the stability classes and thus the meteorological conditions during the measurements and other parameters like number of transects driven and averaging methods were assessed.

How to cite: Wietzel, J., Korben, P., Hoheisel, A., Kammerer, J., and Schmidt, M.: Long-term monitoring of methane emission rates from a biogas plant in Heidelberg, Germany: quantification of method uncertainties with controlled release experiments, EGU General Assembly 2024, Vienna, Austria, 14–19 Apr 2024, EGU24-10437, https://doi.org/10.5194/egusphere-egu24-10437, 2024.

EGU24-10722 | ECS | Orals | AS3.24

Automated detection of regions with persistently enhanced methane concentrations using Sentinel-5 Precursor satellite data  

Steffen Vanselow, Oliver Schneising, Michael Buchwitz, Heinrich Bovensmann, Hartmut Boesch, and John P. Burrows

Methane (CH4) is an important anthropogenic greenhouse gas and its rising concentration in the atmosphere contributes significantly to global warming. A comparatively small number of highly emitting persistent methane sources is responsible for a large share of global methane emissions. Methane sources often show large uncertainties regarding their emissions or locations, especially at local scales, making their detection and quantification inevitable to support mitigating climate change.

The TROPOspheric Monitoring Instrument (TROPOMI) onboard on the Sentinel-5 Precursor (S5P) satellite, launched in October 2017, provides measurements of the column-averaged dry-air mole fraction of atmospheric methane (XCH4) with a daily global coverage and a high spatial resolution of up to  km2, enabling the detection and quantification of localized methane sources.

We developed a fully automated algorithm to detect regions with persistent methane enhancement and to quantify their emissions using a monthly XCH4 TROPOMI dataset from the years 2018-2021, generated with the WFM-DOAS retrieval algorithm, developed at the University of Bremen. The detection process comprises several steps, including an analysis of the monthly dataset, where we first characterize each region by several quantities, such as the number of months in which the region shows a methane enhancement, and then marking the regions that fulfill the defined persistence criteria. We detect more than 200 potential persistent source regions (PPSRs), which account for about 20 % of the total bottom-up emissions. By comparing the PPSRs in a spatial analysis with anthropogenic and natural emission databases we attribute one of the following source types to each detected region: coal, oil and gas, other anthropogenic sources (such as landfills or agriculture), wetlands, or unknown. Many of the detected regions are well-known methane source regions, like large oil and gas fields (e.g., Permian Basin in the USA, Galkynish and Dauletabad in Turkmenistan), coal mining areas (e.g., Bowen Basin in Australia, Upper Silesia Coal Basin in Poland), regions including large urban cities (Dhaka in Bangladesh, Mumbai in India, Rio de Janeiro in Brazil) or wetland areas (e.g., Pantanal in Brazil, Sudd in South Sudan).

In this presentation, the algorithm and some results, including a global overview of the detected regions and a more detailed analysis for some of the regions, are presented.  

How to cite: Vanselow, S., Schneising, O., Buchwitz, M., Bovensmann, H., Boesch, H., and Burrows, J. P.: Automated detection of regions with persistently enhanced methane concentrations using Sentinel-5 Precursor satellite data , EGU General Assembly 2024, Vienna, Austria, 14–19 Apr 2024, EGU24-10722, https://doi.org/10.5194/egusphere-egu24-10722, 2024.

EGU24-11142 | ECS | Orals | AS3.24

High potential for CH4 emission mitigation from oil infrastructure in one of EU's major production regions 

Foteini Stavropoulou, Katarina Vinković, Piotr Korbeń, Martina Schmidt, Pawel Jagoda, Jaroslav M. Necki, Hossein Maazallahi, Dominik Brunner, Gerrit Kuhlmann, Antonio Delre, Charlotte Scheutz, Stefan Schwietzke, Daniel Zavala-Araiza, Huilin Chen, and Thomas Röckmann and the ROMEO team

Ambitious methane (CH4) emissions mitigation represents one of the most effective opportunities to slow the rate of global warming.  The oil and gas (O&G) sector, a significant source of CH4 emissions, offers technically feasible and cost-effective emission mitigation options. Romania, a key O&G producer within the EU, with the second highest reported CH4 emissions from the energy sector in 2020 can play an important role towards the EU’s emission reduction targets. Based on UNFCCC data, during the period 1990-2019, one of the largest reductions in fugitive CH4 emissions from O&G were observed in Romania. However, the concentrated reduction in mostly a single year raises questions about the true extent of emission reductions. The Romanian Methane Emissions from Oil and Gas (ROMEO) project aimed to characterize CH4 emissions related to onshore O&G production in Romania at a component, facility, and basin scale using a variety of both ground- and airborne-based measurement techniques. In the first phase in 2019 in the southern main oil production region, measured emissions were characterised by heavily skewed distributions, with 10% of the sites accounting for more than 70% of total emissions. Integrating the results from all site-level quantifications, we derive a central estimate of 5.4 kg h–1 site-1 of CH4 (3.6 – 8.4, 95% confidence interval) for oil production sites. Aircraft quantifications from mass balance flights and raster flights, combined with atmospheric modelling, confirm these high emission rates. Based on the site-level results, we estimate a total of 120 ktons CH4 yr–1 (range: 79 - 180 ktons yr–1) from oil production sites in our studied areas. This is approximately 2.5 times higher than the reported emissions from the entire Romanian oil production sector for 2020. During the second phase in 2021, targeting the Transylvanian gas production basin, more emitting sites are observed, but the emission rates per gas production site are lower than those from the oil production sites in the oil production region. Based on the source level characterization, up to three quarters of the detected emissions from oil production sites are related to operational venting. In 2021, following reported repairs by operators to address open vents, additional aircraft flights using a remote sensing method targeting the southern oil production region detected fewer emitting oil production sites. However, there is large uncertainty surrounding the exact magnitude of emissions below the method’s high detection threshold. Additionally, high emissions were observed from large vent stacks that had not been detected with the ground-based measurements in 2019. Our results suggest massive mitigation potential in Romania's O&G production infrastructure by capturing gas and minimizing operational venting and leaks. By synthesizing the findings and data collected across different spatial and temporal scales during the ROMEO campaigns, we can gain better understanding and valuable insights into the true magnitude and distribution of CH4 emissions from Romania's O&G sector. The results of this data integration can allow us to fill critical gaps of missing information and address discrepancies between existing emission inventories and empirical estimates.

How to cite: Stavropoulou, F., Vinković, K., Korbeń, P., Schmidt, M., Jagoda, P., Necki, J. M., Maazallahi, H., Brunner, D., Kuhlmann, G., Delre, A., Scheutz, C., Schwietzke, S., Zavala-Araiza, D., Chen, H., and Röckmann, T. and the ROMEO team: High potential for CH4 emission mitigation from oil infrastructure in one of EU's major production regions, EGU General Assembly 2024, Vienna, Austria, 14–19 Apr 2024, EGU24-11142, https://doi.org/10.5194/egusphere-egu24-11142, 2024.

EGU24-11178 | ECS | Orals | AS3.24

Coincident Airborne and Satellite Acquisitions of Methane Plumes 

Alana Ayasse, Daniel Cusworth, and Riley Duren

Methane super emitters are gaining importance for methane emission mitigation due to initiatives like the EPA’s Super Emitter Response Program. In addition, a variety of new methane plume-mapping sensors are coming online (e.g., Carbon Mapper/Planet Tanager, EnMAP, PRISMA, EMIT, GHGSat, MethaneSat). These sensors all have the capability to map and measure super emitters, therefore it is critical that we have robust methods to characterize the performance of individual sensors and to combine observations from multiple sensors. In this study we use coincident data from the EMIT instruments and an airborne imaging spectrometer to demonstrate the performance of EMIT and to test methods for multi-sensor observations. We use these data to constrain a Probability of Detection (POD) model for EMIT. We demonstrate that under favorable conditions the 90% probability of detection for EMIT is 700 kg/hr and the 10% probability of detection is 275 kg/hr. We also offer a new framework for how sensors with dramatically different detection limits, such as an airborne imaging spectrometer and EMIT, can be combined to accurately measure persistence and emission rates for individual sources that are observed by multiple instruments. 

How to cite: Ayasse, A., Cusworth, D., and Duren, R.: Coincident Airborne and Satellite Acquisitions of Methane Plumes, EGU General Assembly 2024, Vienna, Austria, 14–19 Apr 2024, EGU24-11178, https://doi.org/10.5194/egusphere-egu24-11178, 2024.

EGU24-11333 | ECS | Orals | AS3.24

Quantifying anthropogenic methane emissions and their uncertainties using very high spatial and spectral resolution satellite and airborne data 

Quentin Taupin, Dirk Schüttemeyer, Marianne Girard, Marvin Knapp, André Butz, Justyna Swolkień, Robert Field, Heidi Huntrieser, Eric Förster, and Gerrit Kuhlmann

Methane is one of the most powerful greenhouse gases that has contributed to about a third of the 2010-2019 global warming relative to the pre-industrial times in 1850-1900. The Upper Silesian Coal Basin in southern Poland is one of the strongest anthropogenic methane (CH4) emitters in Europe, with emissions ranging from 228 to 339 ktCH4yr-1. In that region, ventilation shafts and drainage stations used in coal mines are the main sources of CH4 emissions, of which the mass flows and their sources of uncertainties can be assessed using an adapted version of the Integrated Mass Enhancement (IME) method.

This challenge can be tackled using observations from Fabry-Perot imaging Short Wave InfraRed (SWIR) spectrometers onboard of the GHGSat aircraft and GHGSat satellite constellation. GHGSat acquisitions were made in June and July 2022 during a campaign including other measurements and which was partially funded in the framework of UNEP’s International Methane Emissions Observatory. The GHGSat level-2 data provide full-swath CH4 concentration estimations and filtered CH4 plumes with spatial resolutions < 1.1 m on a swath width < 0.75 km for the aircraft, and < 28 m on a swath width < 12 km for the satellites, both featuring a spectral resolution of 0.1 nm. Furthermore, another version of the methane plumes was generated through a Z-test filter.

These observations were complemented with local wind profile and plume profile observations to estimate the effective wind speed that accounts for the effects of turbulent diffusion in the plume dissipation. This was achieved using two instruments from the University of Heidelberg: a wind lidar measuring the wind profile up to 200 m height at a sampling rate of ~8 seconds and a hyperspectral SWIR camera featuring a 1 min scanning time, a spatial resolution of 0.8 m and a spectral resolution of 7 nm. Since local wind profile measurements are rarely accessible, this study attempted to find a relationship between the effective wind speed for the methane plumes of that region as a function of the wind speed at 10 m height from the ERA5-Land reanalysis (spatial resolution of 9 km and temporal resolution of 1 h).

Finally, a comparison is performed between the methane mass flow estimations derived from GHGSat satellites and aircraft observations with coinciding mass flow estimation from the CH4 safety sensors located inside four of the same ventilation shafts (data collected by AGH University of Kraków) and the hyperspectral camera in June and July 2022. Moreover, another comparison is done with data acquired from a helicopter towed probe (HELiPOD) operated by the DLR and the Technical University of Braunschweig over one of the same shafts in June 2022. While bottom-up inventories may have delays of a few years before being available and require a certain level of trust, satellites can solve these issues through a faster top-down approach but still with relatively high uncertainties and multiple sources. The findings presented in this study can help to quantify the level of contribution from the different sources of uncertainties with high resolution data.

How to cite: Taupin, Q., Schüttemeyer, D., Girard, M., Knapp, M., Butz, A., Swolkień, J., Field, R., Huntrieser, H., Förster, E., and Kuhlmann, G.: Quantifying anthropogenic methane emissions and their uncertainties using very high spatial and spectral resolution satellite and airborne data, EGU General Assembly 2024, Vienna, Austria, 14–19 Apr 2024, EGU24-11333, https://doi.org/10.5194/egusphere-egu24-11333, 2024.

EGU24-11832 | ECS | Posters on site | AS3.24

Mobile measurements of coal mine ventilation shafts in USCB, Poland. 

Paweł Jagoda, Jarosław Nęcki, Jakub Bartyzel, and Justyna Swolkień

In order to improve understanding and reduce methane emissions, three comprehensive measurement campaigns were conducted in June and October of 2022, as well as in June 2023. These campaigns were part of the METHANE-To-Go-Poland project, which was funded by the International Methane Emissions Observatory (IMEO) and the United Nations Environment Programme (UNEP). In addition to mobile measurements, other remote sensing techniques such as sun-viewing FTIR and hyperspectral imaging spectrometry, as well as a novel airborne approach called HELiPOD and UAV's, were deployed.

Transects were performed using Licor 7810, LGR MGGA918, or Picarro G2301i analyzers along with 2D anemometers and GPS loggers. Recognizing the significant impact of coal mines as a major source of methane emissions, these measurements aimed to enhance our understanding of the dynamics involved in methane release, contributing to ongoing efforts in addressing environmental challenges associated with coal mining.

The main focus of the campaigns was a high-emission shaft located in the Silesian Coal Basin, Southern Poland. This site had several favorable characteristics for successful measurements. The investigated ventilation shaft emitted approximately 1.5 tCH4/h of methane (based on the coal mine reporting it excavated 3457 kt of coal, which corresponds to 52.6 kt of emitted methane from the whole coal mine for the year 2021, as calculated for the national methane inventory). The shaft has good prominence, and its surroundings consist mostly of agricultural fields with intersecting roads and only a few barriers like groves and buildings.

Numerous transects were also performed at three other ventilation shafts visited during the campaigns. Emission estimates derived using an inverse Gaussian plume model ranged from 0.3±0.1 tCH4/h to 2.5±0.5 tCH4/h for these additional shafts. We attempted measurements at one of the shafts using the OTM-33A technique with the MGGA918 analyzer and a 3D anemometer. These deployments at distances exceeding 200 meters (up to 1450 meters) resulted in emission estimates ranging from 0.6±0.2 tCH4/h to 1.43±0.43 tCH4/h.

An overview of the ground-based measurements was analyzed to identify temporal variability in the emission rates from coal mine shafts. This information was also compared with measurements conducted by the coal mine operator using safety sensors (such as CH4-sensitive pellistores placed in the airflow of the ventilation shaft). A secondary goal was to compare the emission rates and measurement constraints for multiple coal mine ventilation shafts.

How to cite: Jagoda, P., Nęcki, J., Bartyzel, J., and Swolkień, J.: Mobile measurements of coal mine ventilation shafts in USCB, Poland., EGU General Assembly 2024, Vienna, Austria, 14–19 Apr 2024, EGU24-11832, https://doi.org/10.5194/egusphere-egu24-11832, 2024.

EGU24-12294 | ECS | Posters on site | AS3.24

Investigating Vienna’s methane budget with local observations of turbulent fluxes and total column mole fractions 

Bradley Matthews, Andreas Luther, Enrichetta Fasano, Haoyue Tang, Kathiravan Meeran, Simon Leitner, Andrea Watzinger, Jia Chen, and Helmut Schume

Like other cities across the globe, Vienna has announced an ambitious climate target of reaching net zero emissions of greenhouse gases (GHG) by 2040. Developing and implementing appropriate urban polices and measures to reach this goal requires robust understanding and quantification of the emissions of all GHGs, including Methane (CH4). According to the Austrian provincial emission inventory (Bundesländer Luftschadstoff-Inventur) that sets the current baseline for Vienna’s planned emission reductions, CH4 emissions contribute only ca. 1% of the city’s total GHG budget (87 of 8387 kt CO2eq in 2021; 100-year global warming potential). However, urban sources of methane are associated with large uncertainties (e.g. leaks from gas distribution networks, post-meter fugitive emissions) with inventories often producing substantial underestimations of these emissions. The Vienna Urban Carbon Laboratory is currently investigating the CH4 budget of Austria’s capital city with local atmospheric observations of turbulent fluxes and total column mole fractions. Since May 2022, CH4 fluxes are being measured at the Arsenal radio tower using an eddy covariance system installed 144 m above the city.  Furthermore, between May and July 2022, a parallel measurement campaign with four ground-based, sun-viewing FTIR spectrometers (EM27/SUN) was conducted to measure horizontal gradients in total column CH4 mole fractions. This conference contribution will discuss the temporal and spatial patterns in the CH4 fluxes derived directly from eddy covariance observations so far, as well as the inverse estimates of summer CH4 emissions from the EM27/SUN observations. The two independent, observation-based methods will provide robust, and policy-relevant indications on the potential accuracy (or potential bias) in Vienna’s CH4 inventory.

How to cite: Matthews, B., Luther, A., Fasano, E., Tang, H., Meeran, K., Leitner, S., Watzinger, A., Chen, J., and Schume, H.: Investigating Vienna’s methane budget with local observations of turbulent fluxes and total column mole fractions, EGU General Assembly 2024, Vienna, Austria, 14–19 Apr 2024, EGU24-12294, https://doi.org/10.5194/egusphere-egu24-12294, 2024.

EGU24-12408 | ECS | Orals | AS3.24

Demystifying the methane clouds over Dhaka, Bangladesh 

Imrul Kayes, Md Abdul Halim, Debra Wunch, and Sean Thomas

Urban areas are at the forefront of climate change impacts, with cities being responsible for ~75% of global GHG emissions. Methane, a GHG 80 times more potent than CO2, is significantly emitted from a range of urban sources including biogenic (e.g., landfills, drainage channels, and wetlands) and abiogenic (e.g., transportation, compressor stations, and oil and gas leaks). The real-time monitoring and precise identification of methane sources are crucial for targeted mitigation and the development of climate-resilient urban planning.

While mobile methane analyzer systems for monitoring methane have been deployed in European and North American cities, their use in densely populated tropical megacities with inferior infrastructure, like Dhaka, Bangladesh, is limited. This limitation obstructs a comprehensive understanding and mitigation of methane emissions on a global scale. Dhaka stands as the world's seventh most populous city, is acutely vulnerable to the impacts of climate change, and contends with extreme air pollution, ranking within the most polluted 1% of cities globally. Satellite imagery has persistently revealed a dense methane cloud above Dhaka, but the precise sources and extent of these emissions remain largely uncharted. Moreover, the potential methane sources in Dhaka may vary from those in other cities. Identifying and measuring these specific sources is imperative for formulating effective mitigation strategies.

In pursuit of this goal, we conducted a comprehensive ground-based mobile survey aimed to identify and quantify methane emissions in Dhaka, offering an intricate spatial and temporal emission profile of various urban sources. Using a human-propelled tri-wheeler equipped with a mobile gas analyzer system, we measured real-time CH4 concentrations across ~1300 km during 38 surveys conducted in the winter and summer of 2023. The vehicle also featured a mobile weather station and GPS logger, recording plume locations alongside meteorological data. From the methane plumes identified, we directly measured methane flux from urban soils, drainages, wastewater channels, landfills, and wetlands. We created methane emission maps using spatial interpolation, determined plume characteristics with the Gaussian dispersion model, and computed emission rates from diverse urban sources using a flux calculation algorithm.

Preliminary findings show that average near-ground methane levels in Dhaka were 5.75 ppm (range: 2.04–309 ppm) in winter and 4.29 ppm (range: 2.05–230 ppm) in summer 2023, markedly surpassing the global background level of ~2.0 ppm, with frequent local spikes above 100 ppm. Our research reveals that in contrast to other global cities, biogenic sources are the dominant methane contributors in Dhaka, succeeded by gas leaks from pipelines and CNG stations. Urban wastewater channels and landfills emerge as the principal biogenic emitters, with substantial contributions from urban canals, wetlands, and soils in developed wetlands. Measurements at a major landfill indicated a methane emission rate of ~500 nmol.m-2s-1, and even the capped landfill a decade post-closure emit methane at notable rates (~9.4 nmol.m-2s-1), indicating they are the significant contributor of the methane cloud observed over Dhaka. These results emphasize the urgent need for targeted mitigation strategies that focus on the primary sources identified, to effectively tackle methane emissions in tropical megacities like Dhaka.

How to cite: Kayes, I., Halim, M. A., Wunch, D., and Thomas, S.: Demystifying the methane clouds over Dhaka, Bangladesh, EGU General Assembly 2024, Vienna, Austria, 14–19 Apr 2024, EGU24-12408, https://doi.org/10.5194/egusphere-egu24-12408, 2024.

EGU24-12772 | ECS | Posters on site | AS3.24

Isotope tracing the coalbed methane migration from the underground longwall coal face to the surface of mining area  

Yaroslav Bezyk, Dawid Szurgacz, Dariusz Strąpoć, Maciej Górka, Jarosław Nęcki, Izabela Sówka, Carina van der Veen, Thomas Röckmann, Miroslaw Zimnoch, Paweł Jagoda, and Jakub Bartyzel

Simultaneous methane emission studies in combination with the analysis of the isotopic composition can help to identify the genesis, transport process, and migration pathways of coalbed gases resulting from coal mining activities. This study was focused on the investigation of the influence of physical processes, site-specific conditions, and parameters of coal mine operations on variations in composition and distribution of coalbed CH4 during gas migration pathways. The flask air sampling was performed in the sequence of the return airways flowing along the longwall face of a coal seam at depths down to 700 m, across walkways of mine workings, and through mine ventilation shaft into the atmosphere. The analyses were conducted during undergoing mining operations in one of the hard coal mines in the Upper Silesian Coal Basin (USCB), Poland.

The results of isotopic analysis of CH4 confirmed the relationship between gas migration from the coal seam into space of excavation and enrichment in 13C and 2H signatures. Free gas samples taken from the borehole in the coal seam, in the region of the longwall under analysis, consist mainly of thermogenic methane (86.8 – 92.1 %), with δ13C values between −50.9 and −50.7 ‰ and δ2H of −197.3 to −191.9 ‰. Samples collected along 145 m length of longwall coal face showed downward decreasing in CH4 concentration (range from 0.85 to 0.19 %) being diluted with the rise of ventilating air stream supplied to the longwall. The determined 13C- and 2H-enrichment in methane mixture flowing through the longwall from −48.9 to −46.6 ‰ for δ13C, and from −192.4 to −178.1 ‰ for δ2H, respectively, generally resulted from diffusion-controlled adsorption and desorption processes.

In general, methane concentrations significantly decreased during upward migration across walkways of mine workings expressing a pronounced dilution effect with the increase in air velocity and distance from the exploitation longwall towards the ventilation shaft. The measured methane concentration inside of the exhaust ventilation shaft (surface channel) varied from 0.15 to 0.42 %, while mean isotopic signatures were estimated to be –48.8 ± 0.9 ‰ for δ13C and –188.2 ± 3.2 ‰ for δ2H. In addition, such isotopic mass balance approach can be used to determine the contribution of mine ventilation and other atmospheric methane sources contributions around coal mining areas.


This work was funded by the Polish Ministry of Science and Higher Education under Grant No. 2022/44/C/ST10/00112. The isotopic analysis has been supported by the ATMO-ACCESS Project (grant agreement ID: ATMO-TNA-4--0000000041). 

How to cite: Bezyk, Y., Szurgacz, D., Strąpoć, D., Górka, M., Nęcki, J., Sówka, I., van der Veen, C., Röckmann, T., Zimnoch, M., Jagoda, P., and Bartyzel, J.: Isotope tracing the coalbed methane migration from the underground longwall coal face to the surface of mining area , EGU General Assembly 2024, Vienna, Austria, 14–19 Apr 2024, EGU24-12772, https://doi.org/10.5194/egusphere-egu24-12772, 2024.

EGU24-14711 | Orals | AS3.24 | Highlight

First Initiative in the Arabian Peninsula to Measure Methane Emissions from the Oil & Gas and Waste Sector by a Helicopter Probe 

Heidi Huntrieser, Eric Förster, Falk Pätzold, Lutz Bretschneider, Niclas Maier, Jaroslaw Necki, Jakub Bartyzel, Pawel Jagoda, Benjamin Witschas, Anke Roiger, Astrid Lampert, Oman Environmental Services Holding Company (be´ah), and Mark Lunt

Within the framework of the Oil and Gas Methane Partnership 2.0 (OGMP 2.0), initiated by the United Nations Environment Programme (UNEP), companies in the Oil and Gas (O&G) sector have committed to monitor and to reduce their methane (CH4) emissions. Presently, more than 120 companies have joined OGMP 2.0 covering operations in 70 countries around the world, one of which is Oman. Methane is one of the most potent greenhouse gases after carbon dioxide and the focus of worldwide initiatives to combat global warming. This includes UNEP’s International Methane Emissions Observatory (IMEO), which focuses on improved data collection and delivery not only from O&G, but also from other emission sectors including waste. According to Oman’s latest Biennial Update Report, the solid waste sector is the second largest CH4 emitter behind the O&G sector and represents 15% of Oman’s CH4 emissions. However, until now, no sector-specific measurement-based studies on such emissions exist for Oman.

Here, we present a novel measurement study, supported and funded by UNEP´s IMEO. The approach involves measuring CH4 emissions from both O&G installations and landfills using the unique helicopter-towed probe HELiPOD equipped with in situ CH4 instrumentation complemented by mobile ground-based CH4 measurements. Quantifications of CH4 mass fluxes from individual sources or clusters can be provided from these measurements. The methodology was deployed during the METHANE-To-Go-Oman field experiment lasting from November to December 2023 in collaboration with partners from the O&G and waste industry in Oman. Within four weeks, more than 70 flight hours were successfully flown with a helicopter in the northern and southern parts of Oman, which required a complex setup. For each of the 26 flights, different flight strategies were implemented depending on the wind situation at the probed sites, which was characterized by a continuously running wind lidar. The HELiPOD probe (weight 325 kg, length 5 m) was equipped with a sensor system measuring the 3D wind vector and in situ instrumentation (Picarro G2401-m and Licor-7700) to measure CH4 with a high precision (1 ppb) and temporal resolution (up to 40 Hz), which is necessary for a precise calculation of the CH4 mass flux. An initial overview of the measurements is presented focusing on a showcase from a landfill.

By comparing our collected data (top-down approach) with methane mass flux estimates provided by the industry (bottom-up approach), we aim to assist the involved companies and related governments in prioritizing their methane emission mitigation actions and policies for future endeavours.

How to cite: Huntrieser, H., Förster, E., Pätzold, F., Bretschneider, L., Maier, N., Necki, J., Bartyzel, J., Jagoda, P., Witschas, B., Roiger, A., Lampert, A., (be´ah), O. E. S. H. C., and Lunt, M.: First Initiative in the Arabian Peninsula to Measure Methane Emissions from the Oil & Gas and Waste Sector by a Helicopter Probe, EGU General Assembly 2024, Vienna, Austria, 14–19 Apr 2024, EGU24-14711, https://doi.org/10.5194/egusphere-egu24-14711, 2024.

EGU24-15034 | ECS | Posters on site | AS3.24

Urban Areas as a Hybrid System for Methane Emissions to the Atmosphere, Case Study: Cluj-Napoca (ROMANIA) 

Mustafa Hmoudah, Eduard Ghiorghiu, and Calin Baciu

Methane (CH4), a potent greenhouse gas (GHG) with a relatively short atmospheric lifetime, is important for mitigation actions to bring a near-term climate advantage.

Although urban areas cover <2% of the Earth’s surface, they host over half of the world’s population, and at the same time, they are associated with a high degree of uncertainty regarding CH4 emissions.

Studies of methane emissions in urban areas usually estimate gas leaks from natural gas and oil production sites, domestic natural gas networks, combustion systems, and landfills. However, according to recently published studies, the sewer and urban aquatic systems have become the focus of CH4 emission investigations, which show urban areas as a hybrid system for CH4 emissions. Nevertheless, CH4 sources in urban areas are still poorly understood and require further investigation. Moreover, the Romanian national GHG inventory did not report urban area emissions of CH4.

Our study aims at the preliminary identification of urban sources for CH4 emissions in Cluj-Napoca, the second-biggest city in Romania, based on a simple detection of gas leaks.

Tunable Diode Laser Absorption Spectroscopy (TDLAS), with a resolution of 0.1 ppmv, was used to determine the atmospheric concentrations of gas at different points of potential CH4 sources around the city. Also, gas from water samples was analyzed via head-space extraction. In addition, isotopic analysis was performed on samples collected from different systems in the urban area.

This study has revealed that CH4 emissions come from multiple sources, including traffic, leaks from the natural gas distribution network, and the sewer system. It has also pointed out that the aquatic ecosystem is oversaturated with CH4, which represents a hotspot for water-atmospheric exchange.

How to cite: Hmoudah, M., Ghiorghiu, E., and Baciu, C.: Urban Areas as a Hybrid System for Methane Emissions to the Atmosphere, Case Study: Cluj-Napoca (ROMANIA), EGU General Assembly 2024, Vienna, Austria, 14–19 Apr 2024, EGU24-15034, https://doi.org/10.5194/egusphere-egu24-15034, 2024.

EGU24-15206 | ECS | Posters on site | AS3.24

Improving the active AirCore system to determine the destruction rate efficiency of gas flares in the Netherlands 

Noni van Ettinger, Steven van Heuven, and Huilin Chen

Avoiding unnecessary methane (CH4) emissions is an easy way to mitigate the effects of
climate change, since methane has a higher global warming potential and a shorter lifetime
compared to carbon dioxide (CO2) and often no purpose is served with the flaring. Flaring is
the disposal of associated gas by combustion. In some cases, the flaring is unavoidable to
ensure the safety of the personnel, while in other instances flaring can easily be avoided,
resulting in unnecessary emissions. Yearly, approximately 140 billion cubic meters is flared
globally. With a destruction rate efficiency (DRE) of 98%, this results in yearly GHGs emission
of 315 Mt of CO2 and 1.4 Mt of CH4 (or 315 Mt and 42 Mt of CO2 equivalent). It is speculated
that the DRE of flares in operation is generally lower. For example, Plant et al. 2022 found a
DRE of 91% across three oil basins in the United States using an aircraft-based study.
However, there is still a lack of experimental data from other countries and on facility-scale.
In this research, the active AirCore system described by Andersen et al. 2018 was improved
and used to determine the flaring efficiency from gas flares in the Netherlands. An in-situ
CO2 sensor was added to obtain an in-flight signal allowing to reliably sample the entire
cross section of the plume. To test the system, it was used during two separate campaigns
in the Netherlands. The flaring (by a Dutch national gas grid operator) is a routine part of
scheduled infrastructure maintenance. The operator’s mobile flaring unit has been
specifically designed for high-efficiency combustion. In the flare plume, we observed a DRE
of 99.7% ± 0.2%. However, the last 1.2 bar absolute (of 40) that remains in the gas pipes is
vented and decreases the methane emission mitigation efficacy (MEME) of the operator’s
procedure with 3%. Additionally, using the in-situ sensor we were able to determine the CO2
fluxes from flaring during the campaigns which equated to a CH4 burn rate of 1240 ± 300
m3/h over three different flights, which agrees with the nominal burn rate of 1200 m3/h. This
shows that the system can characterize flaring efficiency and emissions well, which provides
us the capability to use the system in future flaring campaigns where the gas flushing rate is
still unknown.

References
Andersen, T., Scheeren, B., Peters, W., Chen, H. (2018). A UAV-based active Aircore system for
measurements of greenhouse gases. Atmos. Meas. Tech., 11, 2683-2699,
https://doi.org/10.5194/amt-11-2683-2018
Plant, G., Kort, E. A., Brandt, A. R., Chen, Y., Fordice, G., Gorchov Negron, A. M., Schwietzke, S.,
Smith, M., & Zavala-Araiza, D. (2022). Inefficient and unlit natural gas flares both emit large
quantities of methane. Science, 377(6614), 1566–1571. https://doi.org/10.1126/science.abq0385

How to cite: van Ettinger, N., van Heuven, S., and Chen, H.: Improving the active AirCore system to determine the destruction rate efficiency of gas flares in the Netherlands, EGU General Assembly 2024, Vienna, Austria, 14–19 Apr 2024, EGU24-15206, https://doi.org/10.5194/egusphere-egu24-15206, 2024.

EGU24-15785 | ECS | Posters on site | AS3.24

A novel helicopter-borne application for quantifying methane emissions from industrial activities: Results from measurements of coal mine ventilation shafts in Poland 

Eric Förster, Heidi Huntrieser, Michael Lichtenstern, Falk Pätzold, Lutz Bretschneider, Astrid Lampert, Jaroslaw Necki, Paweł Jagoda, Justyna Swolkień, David Holl, Robert Field, and Anke Roiger

The Upper Silesian Coal Basin in southern Poland is one of the strongest emitters of anthropogenic methane (CH4) in Europe. Coal mine ventilation shafts are responsible for a major part of these CH4 emissions, which were in focus of the METHANE-To-Go-Poland project presented here. For the first time, the unique helicopter towed probe HELiPOD was used to estimate CH4 mass fluxes from selected ventilation shafts based on the mass balance approach. The HELiPOD (weight 325 kg, length 5 m) was equipped with a sensor system for measuring the 3D wind vector and in situ methane analysers (Picarro G2401-m and Licor-7700) to measure CH4 with a high precision (1 ppb) and high temporal resolution (up to 40 Hz). In June and October 2022, repeated upwind and downwind probing of four selected shafts were performed within 16 flights at different horizontal distances from the source (~500 m - 5 km) and altitudes (~50 m – 2 km) to capture the inflow and horizontal/vertical dispersion of the CH4 plumes. Depending on wind speed, wind direction and atmospheric stability, suitable flight patterns were developed for every flight. Co-located mobile ground-based CH4 measurements complemented the airborne probing. In addition, two controlled CH4 releases were successfully carried out to prove the novel measurement concept.

In this presentation, top-down mass flux estimates based on measurements from the two airborne CH4 instruments (with different temporal resolution) will be compared and mass flux uncertainties will be discussed with respect to the flight strategies and meteorological conditions. Depending on the surveyed shaft, the calculated CH4 mass fluxes range from 1000 to 3000 kg/h. Subsequently, the top-down mass fluxes will be compared to bottom-up mass flux calculations based on production data obtained directly from the coal mine industry.

Our calculations are an example of the independent emission verification technique and will help coal, oil and gas companies as well as governments, to prioritize their CH4 emission mitigation strategies, actions and policies. This research has been funded in the framework of UNEP's International Methane Emissions Observatory.

How to cite: Förster, E., Huntrieser, H., Lichtenstern, M., Pätzold, F., Bretschneider, L., Lampert, A., Necki, J., Jagoda, P., Swolkień, J., Holl, D., Field, R., and Roiger, A.: A novel helicopter-borne application for quantifying methane emissions from industrial activities: Results from measurements of coal mine ventilation shafts in Poland, EGU General Assembly 2024, Vienna, Austria, 14–19 Apr 2024, EGU24-15785, https://doi.org/10.5194/egusphere-egu24-15785, 2024.

EGU24-16048 | ECS | Orals | AS3.24 | Highlight

UNEP's Methane Alert and Response System (MARS): current status, new developments and case studies 

Itziar Irakulis-Loitxate, Cynthia Randles, Marc Watine-Guiu, Gonzalo Mateo-García, Anna Vaughan, Meghan Demeter, Claudio Cifarelli, Luis Guanter, Joannes D. Maasakkers, Ilse Aben, Tobias A. de Jong, Shubham Sharma, Alexis Groshenry, Quentin Peyle, Antoine Benoit, and Manfredi Caltagirone

UNEP's Methane Alert and Response System (MARS) is a satellite-based system for the detection and mitigation of methane emissions around the world. As part of the International Methane Emissions Observatory (IMEO), MARS is the first global system connecting satellite methane detection to transparent notification processes intended to trigger mitigation efforts. MARS harnesses state-of-the-art satellite data to identify major emissions, activate its partners to notify relevant stakeholders, and support and track progress toward mitigation.

During the year-long pilot phase, more than 600 plumes from the energy sector were detected with high-resolution satellites, and more than a hundred were notified. In December 2023, MARS entered the nominal phase with the launch of a data portal including information about the plumes detected and notified by MARS. In its current form, MARS is focused on the detection of strong point sources (~>1 ton/h) from the oil and gas production sector, but the system is expected to develop and integrate observations from new satellites as they become available and extend to the notification of smaller sources, also from other sectors such as coal mining, waste, or agriculture.

In this contribution, we will provide a brief overview of the MARS satellite-based plume detection and monitoring system, with the updates made since the launch of the nominal phase. Furthermore, we will describe some examples of real source detection and notification efforts and discuss the next steps planned for MARS in 2024.

How to cite: Irakulis-Loitxate, I., Randles, C., Watine-Guiu, M., Mateo-García, G., Vaughan, A., Demeter, M., Cifarelli, C., Guanter, L., Maasakkers, J. D., Aben, I., de Jong, T. A., Sharma, S., Groshenry, A., Peyle, Q., Benoit, A., and Caltagirone, M.: UNEP's Methane Alert and Response System (MARS): current status, new developments and case studies, EGU General Assembly 2024, Vienna, Austria, 14–19 Apr 2024, EGU24-16048, https://doi.org/10.5194/egusphere-egu24-16048, 2024.

EGU24-17288 | ECS | Posters on site | AS3.24

Assessing the potential of TROPOMI measurements to improve regional methane emission estimates over India 

Thara Anna Mathew, Dhanyalekshmi K Pillai, Monish V Deshpande, Vishnu Thilakan, and Sanjid Backer Kanakkassery

Methane is emitted by several anthropogenic source sectors, including livestock, oil and gas systems, coal mining, landfills, wastewater treatment, rice cultivation and natural sources such as wetlands. The short lifetime and considerable global warming potential make methane an immediate target for reducing global warming. The existing bottom-up methods relate emissions to source region activities, but significant uncertainties exist when emissions are derived at regional or local scales. In this context, satellite observations of atmospheric methane concentrations can be helpful for improving the inventory information by using additional constraints from atmospheric distributions. In the present study, we use the column-averaged dry-air mixing ratio of methane (XCH4) from  TROPOMI (Tropospheric Monitoring Instrument) on the ESA Copernicus Sentinel-5 Precursor satellite to infer India’s CH4 emissions. We establish the potential of these retrievals to quantify methane emission hotspots and to improve the emission estimates over the Indian subcontinent. The Eulerian model Weather Research Forecast (WRF) coupled with Chemistry (WRF-Chem-GHG) simulations has been used for the forward  transport simulations of atmospheric methane. The inversion studies introduced will enable us to improve the existing anthropogenic emission estimates available in the Indian region.

How to cite: Mathew, T. A., Pillai, D. K., Deshpande, M. V., Thilakan, V., and Kanakkassery, S. B.: Assessing the potential of TROPOMI measurements to improve regional methane emission estimates over India, EGU General Assembly 2024, Vienna, Austria, 14–19 Apr 2024, EGU24-17288, https://doi.org/10.5194/egusphere-egu24-17288, 2024.

EGU24-17443 | Posters on site | AS3.24

Advances and challenges in quantification of greenhouse gas emissions by UAVs – A review 

Grant Allen, Jamie McQuilkin, and Han Yong

Accurate and efficient quantification of emissions from sources (both natural and anthropogenic) underpins our understanding of the natural drivers of climate change and the success of emissions mitigation strategies. While there exists many excellent methods and measurement networks from which to constrain emissions at national and regional scales (e.g. through transport inversion modelling), a dynamic and accurate picture of emissions from hotspot sources (e.g. landfill, oil and gas infrastructure etc) remains a technical and scientific challenge. Recent international agreements and national regulations to monitor, report, and validate GHG emissions by sector, all require robust and standardised approaches to directly measure emissions to prioritise targets for emissions reduction and mitigation.

Emissions quantification by UAV survey is a rapidly expanding field both academically and commercially. Since the first known report on the feasibility of such a capability around 10 years ago (2014), there now exists a mature international academic community, which continues to refine and validate methods, and a growing international commercial sector that can now provide survey capability and drive further technological development. However, transparency and robust validation of methods remains a barrier to largescale adoption by regulators and those compiling national emissions inventories.

This paper will review recent advances in unmanned aerial vehicle (UAV) platforms, GHG instrumentation, methodologies and field operations in the pursuit of emissions quantification. Building on Shaw et al., 2021 (https://doi.org/10.1098/rsta.2020.0450), which reviewed methane emissions quantification by UAVs at that time, we report and reflect here on current progress, capability, and challenges. We will report recent fieldwork (by ourselves and published by others)  to quantify methane emissions from natural and anthropogenic sources and discuss promising new combined survey approaches that could help bridge the gap between snapshot emissions case studies and more long-term (dynamic) monitoring. We shall also discuss future work planned to survey onshore UK anthropogenic sources by the UK NERC MOMENTUM project.

How to cite: Allen, G., McQuilkin, J., and Yong, H.: Advances and challenges in quantification of greenhouse gas emissions by UAVs – A review, EGU General Assembly 2024, Vienna, Austria, 14–19 Apr 2024, EGU24-17443, https://doi.org/10.5194/egusphere-egu24-17443, 2024.

EGU24-17580 | ECS | Orals | AS3.24

BBCMap 2023: Assessing methane emissions from open-cut and underground coal mining in eastern Australia 

Jakob Borchardt, Sven Krautwurst, Konstantin Gerilowski, Oke Huhs, Josua Schindewolf, Heinrich Bovensmann, Martin Kumm, Andrew McGrath, Shakti Chakravarty, Wolfgang Junkermann, Jorg Hacker, Mei Bai, Bryce F. J. Kelly, Stephen Harris, Robert Field, Hartmut Bösch, and John P. Burrows

Methane (CH4) is the second most important anthropogenic greenhouse gas (GHG), and its emissions reduction has been identified as an essential mitigation target to slow down climate change. According to inventories, fossil fuel production and usage account for roughly 17% of the global CH4  emissions, of which approximately 33% originate from coal mining. Accurate identification of coal mining-related CH4 sources and quantification of their annual emission rate is needed for corporate reporting requirements, national inventory verification, and the development of CH4 mitigation strategies.

A previous study estimated CH4 emissions for six coal mines in the Bowen Basin in Queensland, Australia, using TROPOMI satellite measurements. It covered a sub-area of the Bowen Basin, where coal is mined at over 40 active mining locations distributed over 60,000 km2. The study showed a significant discrepancy compared to inventory estimates by a factor of 7 during 2018 and 2019.

To further verify satellite estimates and improve knowledge of the distribution, persistence, and strength of emissions of this mining region, the Bowen Basin CH4 Mapping (BBCMap) Campaign was conducted in September-October 2023, funded by and performed in collaboration with UNEP's International Methane Emissions Observatory. During this campaign, two HK36 Eco-Dimona research aircraft carrying complementary sensing instrumentation were deployed. The MAMAP2D-Light (Methane Airborne MAPper 2D – Light) imaging spectrometer for estimating atmospheric CH4 and CO2 column anomalies and a lidar for topography scans were deployed on one DIMONA HK36 research aircraft, while the second identical aircraft was equipped with an in-situ payload consisting of an LGR OA-ICOS gas analyser for simultaneous measurements of atmospheric CH4, CO2, and water vapor concentrations, a turbulence probe for wind statistics, and a bag sampler for collecting multiple gas samples during each flight for later 13C isotope analyses in the laboratory. This two-aircraft strategy allowed coordinated measurements of CH4 emissions from different coal mines with both remote sensing and in-situ instruments and simultaneous wind measurements, which is essential for deriving a robust flux estimate.

During the campaign, 39 flights were conducted, covering approximately 33 mines across roughly 20,000 km2, focussing on the northern part of the Bowen Basin. Preliminary MAMAP2D-Light measurements of atmospheric CH4 column anomalies and emission estimates for both open-cut and underground coal mines will be presented and discussed.

How to cite: Borchardt, J., Krautwurst, S., Gerilowski, K., Huhs, O., Schindewolf, J., Bovensmann, H., Kumm, M., McGrath, A., Chakravarty, S., Junkermann, W., Hacker, J., Bai, M., Kelly, B. F. J., Harris, S., Field, R., Bösch, H., and Burrows, J. P.: BBCMap 2023: Assessing methane emissions from open-cut and underground coal mining in eastern Australia, EGU General Assembly 2024, Vienna, Austria, 14–19 Apr 2024, EGU24-17580, https://doi.org/10.5194/egusphere-egu24-17580, 2024.

EGU24-17703 | Posters on site | AS3.24

Application of TDLAS analysers, challenges and implications for future monitoring of methane emission from the coal mine ventilation shafts.  

Jarosław Nęcki, Jakub Bartyzel, Paweł Jagoda, Justyna Swolkień, and Robert Field

Tunable diode laser absorption spectrometers (TDLAS) are versatile devices with a wide range of applications. In particular, they can be used to detect methane using an analyzer that operates with an infrared band (1.6 – 1.7 μm) laser beam configured in an open path architecture. This setup is suitable for nonhomogeneous airflow coming from coal mine ventilation shafts. TDLAS devices are compact, robust, easy to install, and require minimal maintenance.

Methane emissions from the coal mining sector in Poland account for approximately 0.5 million tons of methane per year and are significant contributors to the continental budget of this gas. Most of the emissions occur through the ventilation shafts, where the methane content can vary from 0.05% to 0.7%.

During June 2023, a TDLAS analyzer (Unisearch, LasIR) was installed at a selected ventilation shaft air diffuser. The device operated for one month, recording the methane concentration in the ventilated air with a temporal resolution of 1 second. In addition to TDLAS, two other instruments were used to determine methane content: an ICOS analyzer (LGR/ABB, mGGA-918) and a pellistor sensor (EMAG, DCH). The ICOS analyzer was used to cross calibrate the TDLAS instrument across a wide range of methane concentrations. The pellistor sensor is a popular type of sensor used in coal mines for safety reasons. Typically, methane emissions are determined through gas chromatographic analyses conducted using periodically collected samples (e.g., once a month). However, methane content in ventilated air can vary on shorter timescales of hours, days, and weeks. Additionally, pellistor sensors are less precise, and the uncertainty of a single measurement cannot be better than 0.1%. In contrast, TDLAS analyzers can be commonly used by coal mine operators for methane reporting, as their precision is usually better than 0.01%.

The presentation will address the challenges associated with using TDLAS for methane emission calculations and highlight its advantages over other commonly used techniques. It will also provide insights into interpreting pellistor sensor readings for quantifying methane emissions and assessing associated uncertainties. Finally, the presentation will discuss the benefits of deploying TDLAS techniques in the coal mining industry, both in the short term and as a potential long-term solution of the reporting of CH4 release.

 This research was funded by and performed in collaboration with UNEP's International Methane Emissions Observatory. The results presented here are part of the findings from a series of three measurement campaigns performed in Poland’s Upper Silesia coal basin.

How to cite: Nęcki, J., Bartyzel, J., Jagoda, P., Swolkień, J., and Field, R.: Application of TDLAS analysers, challenges and implications for future monitoring of methane emission from the coal mine ventilation shafts. , EGU General Assembly 2024, Vienna, Austria, 14–19 Apr 2024, EGU24-17703, https://doi.org/10.5194/egusphere-egu24-17703, 2024.

Millions of oil and gas wells are abandoned and orphaned around the world. Due to funding shortfalls, many abandoned and orphaned wells remain unplugged and are negatively impacting the environment and contributing to greenhouse gas emissions, such as methane. To reduce emissions and environmental impacts, the wells are required to be plugged, but the well sites can be repurposed for wind and solar energy and/or the wells itself can be redeveloped for geothermal energy production. To quantify methane emissions and identify opportunities for repurposing abandoned and orphaned wells and well sites for renewable energy development, we analyze public oil and gas well data from governmental agencies of documented abandoned and orphaned wells in Canada and the United States. We estimate the total number of abandoned and orphaned wells in Canada and the United States to be 3,500,602, of which 4% are orphaned and in need of government funding. We estimate plugging costs for orphaned wells in the United States to exceed federal funding by 30%-80%. For abandoned and orphaned wells, we quantify methane emissions at the national and state/provincial/territorial level and potential emission reductions achieved through plugging. Furthermore, to evaluate mitigation and redevelopment opportunities, we analyze geographic locations of abandoned and orphaned wells with national maps of renewable energy potential (geothermal, wind, and solar) and land cover/land use in Canada and the United States. Mitigating oil and gas wells can help fulfill national energy transition goals and emission reduction targets, while providing an additional funding stream to manage the millions of abandoned and orphaned wells around the world. 

How to cite: Boutot, J. and Kang, M.: Reducing methane emissions from documented abandoned and orphaned oil and gas wells in Canada and the United States , EGU General Assembly 2024, Vienna, Austria, 14–19 Apr 2024, EGU24-17888, https://doi.org/10.5194/egusphere-egu24-17888, 2024.

EGU24-18796 | ECS | Orals | AS3.24 | Highlight

Aircraft-based mass balance estimate of methane emissions from the offshore oil industry in Angola 

Alina Fiehn, Maximilian Eckl, Tiziana Bräuer, Magdalena Pühl, Neeraj Dapurkar, Klaus-Dirk Gottschaldt, Heinfried Aufmhoff, Lisa Eirenschmalz, Gregor Neumann, Felicitas Sakellariou, Daniel Sauer, Guilherme Ventura, Winne Cadete, Dario Zua, Manuel Xavier, Paulo Correia, and Anke Roiger

Atmospheric methane (CH4) concentrations have more than doubled since the beginning of the industrial age, making CH4 the second most important anthropogenic greenhouse gas after carbon dioxide (CO2). The oil and gas (O&G) sectors are one of the major anthropogenic CH4 sources accounting for 22% of global anthropogenic CH4 emissions. The METHANE-To-Go Africa (MTGA) scientific aircraft campaign in September 2022 was conducted as part of UNEP’s International Methane Emissions Observatory (IMEO). During the campaign, we conducted the first large scale methane measurements of the O&G sector in West Africa. The study provides an initial empirical understanding of the magnitude and location of emissions in this important but previously unobserved source region. The emissions of O&G facilities were determined using an aircraft-based mass balance method.

The entire emissions of the Angolan offshore O&G sector and the liquid natural gas (LNG) plant were observed to be in the range of emissions reported by the Angolan operators. This is much less than the estimates from scientific emission inventories like EDGAR and CAMS-GLOB-ANT.

For the regional scale emission estimates, the Angolan O&G facilities are aggregated in blocks, a local operator-wise separation of assets. Most blocks have low emissions of methane. We observed medium emissions at one block and high emissions at two blocks. These three blocks are close to the coast, in shallow water, and the facilities are generally older than further out at sea.

Often the emissions of individual facilities or groups of facilities could be discerned from the mass balance flights. We deduced emission estimates for 31 individual facilities and 10 groups of facilities. The emission estimates on different days are consistent for all facilities, showing little temporal variation. The generally older shallow-water facilities show higher emissions than the deep and ultra-deep water facilities, which have a higher oil production.

The additional trace gases CO2, SO2, NOy and aerosol particles were also observed from the aircraft. This data is used to further investigate the source of CH4 emissions: flaring, fugitives, venting, or burning of fuel gas. The CH4-CO2 ratio indicates that most CH4 emissions result from fugitives and venting, not flaring. Ten different flare exhaust plumes were sampled at close distance. The flaring observations will be further analyzed including information on gas composition from the operators.

Overall, this study gathered a unique dataset in its coverage providing extraordinarily comprehensive measurements of the CH4 emissions from the O&G industry off the coast of West Africa.

How to cite: Fiehn, A., Eckl, M., Bräuer, T., Pühl, M., Dapurkar, N., Gottschaldt, K.-D., Aufmhoff, H., Eirenschmalz, L., Neumann, G., Sakellariou, F., Sauer, D., Ventura, G., Cadete, W., Zua, D., Xavier, M., Correia, P., and Roiger, A.: Aircraft-based mass balance estimate of methane emissions from the offshore oil industry in Angola, EGU General Assembly 2024, Vienna, Austria, 14–19 Apr 2024, EGU24-18796, https://doi.org/10.5194/egusphere-egu24-18796, 2024.

EGU24-18821 | ECS | Posters on site | AS3.24

Methane emission flux estimation from offshore oil and gas platforms with a dispersion model and airborne measurements. 

Irene Monreal Campos, Beth Nelson, Patryk Lakomiec, Dave Sproson, Stephane Bauguitte, and Ally Lewis

Accurate quantification of methane emission fluxes from the oil and gas sector remains challenging. Previous methods can encounter issues associated with atmospheric boundary layer dynamics, and the presence of multiple overlapping emission sources.

We evaluate a methodology to estimate methane emission fluxes using the commercially available dispersion model ADMS6 and airborne measurements.  It takes into consideration many parameters including meteorology variables such as boundary layer stability and high-accuracy atmospheric dynamics measurements from the aircraft. Assumptions about the source type are needed for accurately simulating plume dispersion behaviour.

The first method uses a single modelled plume concentration enhancements with a fixed mass flux input, and plume concentrations measured with the FAAM aircraft.  The emission flux is scaled using the ratio between the modelled and observed enhancements. 

For the second method, we generate multiple modelled plumes with varying emission fluxes, creating different potential scenarios. By comparing these simulations to the observed plume, we identify the most accurate fit and extract the corresponding emission rate directly from the model inputs. 

We then evaluate the methodologies using several emission case scenarios sampled by the FAAM Airborne Laboratory. The study focuses on offshore oil and gas extraction facilities such as the uncontrolled TOTAL ELGIN gas platform methane accidental release in 20121, and fugitive emissions from gas facilities on the Norwegian continental shelf2

The results from the methods are compared with the flux values determined with the more established mass-balance methodology1-4 and sources of uncertainties are discussed. 


1. Lee, James D. et al. (Mar. 2018). “Flow rate and source reservoir identification from airborne chemical sampling of the uncontrolled Elgin platform gas release”. In: Atmospheric Measurement Techniques 11.3, pp. 1725–1739. ISSN: 1867-8548. DOI: 10.5194/amt-11-1725-2018.

2. France, James L. et al. (Jan. 2021). “Facility level measurement of offshore oil and gas installations from a medium-sized airborne platform: method development for quantification and source identification of methane emissions”. In: Atmospheric Measurement Techniques 14.1, pp. 71–88. ISSN: 1867-8548. DOI: 10.5194/am-14-71-2021.

3. Foulds, Amy et al. (Apr. 2022). “Quantification and assessment of methane emissions from offshore oil and gas facilities on the Norwegian continental shelf”. In: Atmospheric Chemistry and Physics 22.7, pp. 4303–4322. ISSN: 1680-7324. DOI: 10.5194/acp-22-4303-2022.

4. Pühl, M et al. (2023). “Aircraft-based mass balance estimate of methane emissions from offshore gas facilities in the Southern North Sea”. In: Atmospheric Chemistry and Physics Discussions 2023, pp. 1–32. DOI: 10.5194/acp-2022-826.

How to cite: Monreal Campos, I., Nelson, B., Lakomiec, P., Sproson, D., Bauguitte, S., and Lewis, A.: Methane emission flux estimation from offshore oil and gas platforms with a dispersion model and airborne measurements., EGU General Assembly 2024, Vienna, Austria, 14–19 Apr 2024, EGU24-18821, https://doi.org/10.5194/egusphere-egu24-18821, 2024.

EGU24-18958 | ECS | Orals | AS3.24

High-resolution modelling of methane plumes: validation and sensitivity experiments to explore UAV and satellite observations 

Rakesh Yuvaraj, Thomas Lauvaux, Philippe Ciais, Jean-Louis Bonne, Lilian Joly, Alexis Groshenry, and Antoine Ba

With the rapid expansion of high-resolution satellite imagers collecting methane plume images across the globe, emissions assessment has been performed using Gaussian plume approaches, mass-balance estimations, or flux divergence methods. But many plumes of methane sampled by space borne imagers present complex features due to topography, to the presence of infrastructures, or to discontinuous turbulent structures inherent to the near-surface atmospheric dynamics. We present here the results from a Computational Fluid Dynamics (CFD) model to study and to analyse methane emissions from point sources using the Fire Dynamics Simulation (FDS) model. High-resolution models like FDS allow to include the terrain characteristics, buildings, canopy cover, and use the real-time weather (re-analyses or field measurements of 3-D wind conditions) to simulate the observed plumes. In addition, FDS enables the study of the non-linear relationship between emissions and the height of the methane release, the temperature of the decompressed gas, and its mass flow rate.

Controlled released experiments of methane measured by drone are used as a starting point to evaluate our FDS simulations and to perform various sensitivity experiments applied to real-cases (with terrain information from SRTM30, temperature and wind from meteorological ERA-5 re-analyses). We defined the optimal model physics configuration and domain characteristics based on two UAV campaigns (TADI campaigns in 2019 and 2021). The second part of our work is based on controlled releases measured by the high-resolution PRISMA satellite, covering a wide range of methane concentrations under various atmospheric conditions to evaluate the performances of FDS when simulating pressure-weighted columns.

We conclude here that high-resolution atmospheric simulations outperform current approaches when analysing irregular plumes due to uneven terrains, buildings, and canopy. This method helps to improve the quantification of even small methane leaks from different point sources such as oil and gas storage facilities.

How to cite: Yuvaraj, R., Lauvaux, T., Ciais, P., Bonne, J.-L., Joly, L., Groshenry, A., and Ba, A.: High-resolution modelling of methane plumes: validation and sensitivity experiments to explore UAV and satellite observations, EGU General Assembly 2024, Vienna, Austria, 14–19 Apr 2024, EGU24-18958, https://doi.org/10.5194/egusphere-egu24-18958, 2024.

EGU24-19331 | Posters on site | AS3.24

Empowering global methane policy through science: actionable data from the International Methane Emissions Observatory (IMEO) methane science studies  

Andreea Calcan, Daniel Zavala-Araiza, Manfredi Caltagirone, James Lawrence France, Stefan Schwietzke, Cynthia Randles, Marci Baranski, Robert Field, Stephen Harris, Alba Lorente, Itziar Irakulis Loitxate, Luis Guanter, Mark Lunt, Xuefei Li, Nataly Velandia, Chenchen Lin, Maria Villadoma, Kari Volkmann-Carlsen, and Steven P. Hamburg

Accurate and measurement-based methane data is urgently needed by countries to support science-based policy for the achievement of their methane reduction ambitions. The United Nations Environment Program (UNEP)’s International Methane Emissions Observatory (IMEO) is responding to this need by collecting and integrating diverse methane emissions data streams, one of which is data from Methane Science Studies funded by IMEO.  

IMEO’s Methane Science Studies (MSS) are making a difference through funding methane measurement studies and collaborating with scientists worldwide. The overarching aim of the MSS is to close the knowledge gaps and improve the understanding of the locations and magnitude of methane emissions across sectors, especially in regions where there is limited or no publicly available data. The studies have initially focused on the oil and gas sector but are now branching out into other anthropogenic sectors. By Jan 2024, IMEO has launched 35 studies around the world with 32 academic/research institutions and 22 peer-reviewed papers published so far. In Europe alone, IMEO has initiated 8 studies in countries including Romania, Poland, Germany, France, Netherlands, Norway, and the UK. 

In this presentation, we will provide an overview of i) the current scope of IMEO Methane Science Studies ii) key study achievements and findings of the completed studies, and iii) potential opportunities and resources for interested research institutes.

How to cite: Calcan, A., Zavala-Araiza, D., Caltagirone, M., France, J. L., Schwietzke, S., Randles, C., Baranski, M., Field, R., Harris, S., Lorente, A., Irakulis Loitxate, I., Guanter, L., Lunt, M., Li, X., Velandia, N., Lin, C., Villadoma, M., Volkmann-Carlsen, K., and Hamburg, S. P.: Empowering global methane policy through science: actionable data from the International Methane Emissions Observatory (IMEO) methane science studies , EGU General Assembly 2024, Vienna, Austria, 14–19 Apr 2024, EGU24-19331, https://doi.org/10.5194/egusphere-egu24-19331, 2024.

EGU24-19467 | ECS | Orals | AS3.24 | Highlight

Quantifying agricultural CH4 and N2O emissions of the Netherlands using a novel airborne eddy-covariance measurements system: First results of the GHGMon campaign in June 2023 

Paul Waldmann, Maximilian Eckl, Klaus-Dirk Gottschaldt, Leon Knez, Eric Förster, Christian Mallaun, Thomas Röckmann, Ronald Hutjes, Huilin Chen, Christoph Gerbig, Michal Galkowski, Christoph Kiemle, and Anke Roiger

Agricultural greenhouse gas (GHG) release is the most dominant anthropogenic emission sector of methane (CH4) and nitrous oxide (N2O), therefore contribute significantly to global warming. However, there are large uncertainties in both, top-down and bottom-up emission estimates especially on the regional scale. Process models have difficulties to properly reproduce the complexity of the underlying GHG formation processes. In addition, the complicated measurement conditions, such as large areas, strong temporal variability and the spatial heterogeneity caused by the variety of agricultural emitters, makes measurements challenging. Hence the data situation is sparse. With regard to effective mitigation guidelines, observations with innovative measurement techniques are urgently needed in order to improve process-based models and therefore leading to a better understanding of agricultural GHG emissions.

Here we present first results of the in-situ aircraft campaign GHG Monitoring (GHGMon), which took place in June 2023 in the Netherlands, the world’s second largest exporter of agricultural products and thus one of the most prominent hotspots of associated N2O and CH4 emissions. The main objective of the campaign was to investigate agricultural emissions in this important source region and to provide a basis for the evaluation of bottom-up estimates. To this end, we setup a new eddy-covariance measurement system, based on a Quantum Cascade Laser Spectrometer and suitable for the direct and continuous airborne measurement of N2O and CH4 fluxes - to our knowledge, a novelty for N2O. A total of 14 scientific research flights (45 hours) were conducted with the DLR research aircraft Cessna C208-B Grand Caravan to investigate the GHG fluxes of a variety of agricultural emitters under different meteorological conditions. The flight patterns were optimized for the eddy covariance measurement principle and to evaluate and optimize the new measurement system and to quantify this important source region. The gathered dataset will enable unique insights into the agricultural emissions of the Netherlands and will enable the evaluation of bottom-up emission estimates including process-based models.

We show that derived fluxes were consistent for repeated legs over the same target areas and during similar meteorological conditions, even on different days, indicating that our measurement approach is robust and reliable. In contrast, under different meteorological conditions, we observed different fluxes, e.g. N2O fluxes after rainfall following on a drought period were multiple times larger than during the drought. There were also large differences measured between the emissions of diverse agricultural subsectors (cattle vs. crops vs. swine). Preliminary turbulent fluxes of 0 – 0.3 gm-2d-1(CH4) and of 0 – 0.05 gm-2d-1(N2O) where found during GHGMon, which in a next step will be compared to available inventories, such as the Netherlands national inventory. Our measurements demonstrate the usefulness of the airborne eddy covariance method to study agricultural N2O and CH4 emissions on a regional scale and to evaluate process models.

How to cite: Waldmann, P., Eckl, M., Gottschaldt, K.-D., Knez, L., Förster, E., Mallaun, C., Röckmann, T., Hutjes, R., Chen, H., Gerbig, C., Galkowski, M., Kiemle, C., and Roiger, A.: Quantifying agricultural CH4 and N2O emissions of the Netherlands using a novel airborne eddy-covariance measurements system: First results of the GHGMon campaign in June 2023, EGU General Assembly 2024, Vienna, Austria, 14–19 Apr 2024, EGU24-19467, https://doi.org/10.5194/egusphere-egu24-19467, 2024.

EGU24-19967 | Orals | AS3.24 | Highlight

Methane emission quantification and reduction within the waste sector 

Charlotte Scheutz, Anders Fredenslund, and Peter Kjeldsen

Scheutz1, A. M. Fredenslund, P. Kjeldsen

1Department of Environmental and Resource Engineering, Building 115, Technical University of Denmark, 2800 Kgs, Lyngby, Denmark.

Methane – a potent greenhouse gas - is emitted from several different treatment plants in the waste sector such as landfills, anaerobic digestion, composting, and wastewater treatment. Emissions vary in time and space and are highly dynamic. The sources are often complex consisting of many different unit processes at the treatment plant e.g. wastewater treatment plants and cover a large area e.g. landfills. Emission can thus occur from local point sources, leakages or hotspots. As an example, investigations have shown that for landfills emission rates can vary up to seven orders of magnitude within a few meters distance and that 50-70% of the total emission comes from a minor area (<5%) of the landfill. Quantification of these fugitive emissions are challenging, however measurement methods to identify local point sources and to quantify whole plant emissions are key in mitigating these direct emissions and documenting future reduction targets.

A well-established, validated, measuring method is the tracer gas dispersion method (TDM) which can quantify methane emissions at the facility level. The method relies on continuous, controlled release of a gaseous tracer at the source combined with downwind measurements of concentration of target gas (e.g. methane) and tracer gas (often acetylene). This method is well-established, validated, and has been used to quantify fugitive methane emissions from various sources such as landfills, composting plants, biogas plants, oil and gas, etc. The method has been applied at several facilities to determine emission rates, emission factors and mitigation efficiencies.

Three application cases will be presented:

  • A landfill study focusing on determination of gas collection efficiencies and fulfillment of future reduction targets carried out at 23 Danish landfills.
  • A landfill study presenting methane mitigation efficiencies of a new biocover technology implemented at 22 sites
  • A biogas study quantifying methane emissions and losses at 69 Danish biogas plants

Combined the cases will illustrate how measurement can be used to determine emission rates, set emission reduction targets and document fulfillment.

References

Fredenslund, A.M., Gudmundsson, E., Falk, J.M., Scheutz, C., 2023. The Danish national effort to minimise methane emissions from biogas plants. Waste Management, 157, 15, 321-329.

Duan, Z., Kjeldsen, P., Scheutz, C. 2022. Efficiency of gas collection systems at Danish landfills and implications for regulations. Waste Management, 139, 269-278.


How to cite: Scheutz, C., Fredenslund, A., and Kjeldsen, P.: Methane emission quantification and reduction within the waste sector, EGU General Assembly 2024, Vienna, Austria, 14–19 Apr 2024, EGU24-19967, https://doi.org/10.5194/egusphere-egu24-19967, 2024.

EGU24-20389 | Orals | AS3.24

Aerial Survey Sample Size Requirements for Robust Methane Inventories in the Upstream Oil and Gas Industry 

Matthew Johnson, Bradley Conrad, and David Tyner

Accurate and frequent measurement-based inventories of methane emissions from the upstream oil and gas (UOG) industry are crucial to developing and implementing effective regulations and achieving sustainable mitigation.  Recent advances in the analysis of large-scale survey data have enabled measurement-based basin/jurisdiction-level methane inventories from remote surveys of UOG infrastructure.  Treating like facility or well types as strata within a larger sample and leveraging analytics that consider measurement uncertainties, probabilities of detection, empirical (non-smooth) source distributions, and sample size effects, specific conclusions can be derived in the context of measurement sensitivities and uncertainties.  These analyses provide useful insights to regulators and industry, including but not limited to the individual contributions of equipment types to overall methane emissions.  However, a priori design and optimization of surveys to cost-effectively derive measurement-based inventories and ensure survey coverage can achieve acceptable levels of uncertainty remains a key challenge. 

Here, we present an analysis of data from extensive aerial LiDAR and ground-based surveys of UOG facilities in Western Canada to provide much-needed guidance on source- and facility-specific sampling protocols for the UOG industry.  Insights into the temporal intermittency and variability of source rate magnitudes are derived using a statistically robust method that considers the quantification accuracy and probability of detection function of the aerial instrument.  Results provide important context regarding the required survey coverage of aerially detectable sources (greater than approximately 1 kg/h) to support the development of accurate inventories, defensible frequencies of regulated inspections, and alternative leak detection and repair programs. 

How to cite: Johnson, M., Conrad, B., and Tyner, D.: Aerial Survey Sample Size Requirements for Robust Methane Inventories in the Upstream Oil and Gas Industry, EGU General Assembly 2024, Vienna, Austria, 14–19 Apr 2024, EGU24-20389, https://doi.org/10.5194/egusphere-egu24-20389, 2024.

EGU24-20489 | Orals | AS3.24 | Highlight

Synthesis of methane emissions estimates from the Nord Stream subsea pipeline leaks 

Stephen Harris and Stefan Schwietzke and the Nord Stream Co-Authors

The Nord Stream subsea pipeline leaks in September 2022 resulted in an unprecedented amount of methane to be released to the atmosphere. However, the total amount emitted remains ambiguous, reflected in a wide range of pipeline volumetric estimates (bottom-up) and measurement-based (top-down) emissions estimates.

To derive a conclusive estimate of emissions, the United Nations Environment Programme’s International Methane Emissions Observatory (UNEP’s IMEO) has brought together a multitude of research groups spanning several disciplines to synthesise, contextualise and, where possible, reanalyse modelled emissions estimates. In this presentation, we present new pipeline rupture emission rate simulations and compare them with various top-down quantification approaches applied to the Nord Stream pipeline leaks. We show that our simulated bottom-up

emissions are reconciled with airborne, satellite and tall tower estimates over various points throughout the emission event, indicating our cumulative total is a robust estimate of emissions.

UNEP’s IMEO’s approach of synthesising and reanalysing existing data from all available sources assists in overcoming the methodological limitations of the individual approaches and provides a more holistic quantification of methane emissions from the Nord Stream pipeline leaks. This approach demonstrates how sharing data generated from various disciplines and quantification platforms can be used to overcome key assumptions when modelling and quantifying emissions. More generally, this study highlights the benefits of applying diverse measurement approaches to quantifying methane emissions in support of reduction commitments such as the Global Methane Pledge.


Affiliations

1-20 listed in Authors' Affiliations section

21. Deutscher Wetterdienst, Frankfurter Strasse 135, 63067 Offenbach, Germany

22. National Centre for Earth Observation, STFC Rutherford Appleton Laboratory (RAL), Chilton, UK

23. Remote Sensing Group, STFC Rutherford Appleton Laboratory, Chilton, UK

24. Technische Universität Braunschweig, Institute of Flight Guidance, Braunschweig, Germany

25. Enagás Transporte SAU, Madrid, Spain

26. GHGSat Inc., Montreal, Canada

27. Deutsches Zentrum für Luft- und Raumfahrt (DLR), Institut für Physik der Atmosphäre, Oberpfaffenhofen, Germany

28. National Centre for Earth Observation, University of Leicester, Leicester, UK

29. School of Physics and Astronomy, University of Leicester, Leicester, UK

30. School of Engineering and Applied Sciences, Harvard University, Cambridge, MA, United States

31. Key Laboratory of Coastal Environment and Resources of Zhejiang Province, School of Engineering, Westlake University, Hangzhou, Zhejiang Province, 310030, China

How to cite: Harris, S. and Schwietzke, S. and the Nord Stream Co-Authors: Synthesis of methane emissions estimates from the Nord Stream subsea pipeline leaks, EGU General Assembly 2024, Vienna, Austria, 14–19 Apr 2024, EGU24-20489, https://doi.org/10.5194/egusphere-egu24-20489, 2024.

EGU24-671 | ECS | Posters on site | AS3.25

Inversions of anthropogenic CO2 emissions using CTDAS-WRF over Greece in the East Mediterranean. 

Nikos Gialesakis, Nikos Daskalakis, Friedemann Reum, Mihalis Vrekoussis, and Maria Kanakidou

The Eastern Mediterranean experiences a rapid acceleration of climate warming mainly due to the continuous growth of greenhouse gases (GHG) in the atmosphere. Carbon dioxide (CO2) is a key contributor to the human-induced greenhouse effect due to its long lifetime and high atmospheric concentrations. With its levels continuing to rise, the need to mitigate its emissions is of utmost importance. Towards this direction, atmospheric models are used to assess the influence of emissions on atmospheric composition. Emission fields used in models, called bottom-up emission inventories, provide information on the amounts and the distribution of the emitted pollutants. However, these emissions are coupled with large uncertainties at small spatiotemporal scales. Therefore, optimization of these emission estimates is needed to increase accuracy and thus support the identification of targets for emission reduction. In this study, we are optimizing the anthropogenic emissions of CO2 over Greece by using the data assimilation system CTDAS-WRF (Carbon Tracker Data Assimilation Shell) that uses an Ensemble Kalman filter data assimilation method. As a forward model, we use WRF-CHEM with the GHG mechanism that allows passive tracer transport of CO2. The sum of emissions from all different anthropogenic sectors from the CAMS anthropogenic emission inventory (CAMS-GLOB-ANT 5.3) is used as input to the model, in addition to biogenic (VPRM) and biomass burning emissions (FINN 2.5). The simulations are then compared to in-situ, FTIR and satellite observations of CO2 that have been assimilated by CTDAS. The differences between the observations and the simulations are assumed to be only due to the uncertainty of the anthropogenic emissions. Therefore, our system is optimizing only these emissions. Preliminary results show the largest underestimates by the bottom-up inventories over the city of Athens.

How to cite: Gialesakis, N., Daskalakis, N., Reum, F., Vrekoussis, M., and Kanakidou, M.: Inversions of anthropogenic CO2 emissions using CTDAS-WRF over Greece in the East Mediterranean., EGU General Assembly 2024, Vienna, Austria, 14–19 Apr 2024, EGU24-671, https://doi.org/10.5194/egusphere-egu24-671, 2024.

Estimation of the perturbation to the Earth’s energy budget by contrail-cirrus outbreaks is required for estimating the climate impact of aviation and verifying the climate benefits of proposed contrail avoidance strategies such as aircraft rerouting. Here we identified two large-scale and successive contrail-cirrus outbreaks in geostationary and polar-orbiting satellite infrared images of Western Europe lasting from 22 to 23 June 2020. These two outbreaks last 18 and at least 7 hours and have a mean optical depth of 0.3 and 0.6, respectively. Their cloud radiative effect is calculated using geostationary satellite cloud retrievals and radiative transfer calculations, is weak or negative during daytime and positive during nighttime. Surface albedo affects the sign of the cloud radiative effect, which switches from negative over ocean to positive over land in the first outbreak. The cumulative energy forcing of the outbreak is 7 PJ and –8.5 PJ, respectively, with uncertainties from individual cloud retrievals being about 3 PJ. This study suggests that automated quantification of contrail-cirrus radiative forcing for monitoring or avoidance verification should be possible based on geostationary satellite observations.

How to cite: Wang, X., Wolf, K., Boucher, O., and Bellouin, N.: Radiative effect of two contrail cirrus outbreaks over Western Europe estimated using geostationary satellite observations and radiative transfer calculations, EGU General Assembly 2024, Vienna, Austria, 14–19 Apr 2024, EGU24-1576, https://doi.org/10.5194/egusphere-egu24-1576, 2024.

The ventilation condition in the atmospheric boundary layer, which varies with the synoptic pattern, is a crucial factor affecting the transport and dispersion of air pollutants. In this study, taking Beijing as an example, local ozone (O3) accumulation and the transboundary O3 pollution (TOP) patterns during the warm season were explored under different boundary layer ventilation conditions by using integrated objective weather classification, non-negative matrix factorization, and backward trajectory model. Results show that local sources are a major contributor to O3 pollution in the whole of Beijing, accounting for ~73.36% of the O3 concentration on average. The local accumulation is mainly facilitated by poor ventilation conditions with weak wind speeds (<3 m/s) under favorable photochemical reaction conditions and abundant precursors, resulting in local O3 events. In contrast, the occurrence of synoptic patterns associated with TOP is more frequent, so the TOP contribution cannot be ignored, especially for the northern regions, where it may exceed 50%. Horizontal wind vector variations play a marked role in driving the TOP, affecting not only the location of the source region and transport pathway but also the transport distance and volume. In addition, a strong nocturnal low-level jet (LLJ) results in horizontal transport and a temporary rise in O3 concentration, while a daytime LLJ stimulates a peak in O3 concentration over the downwind area, lagging by about 1 hr. Our findings provide new perspectives on the effects of boundary layer ventilation on the regulation of O3 pollution, as well as other air pollutants.

How to cite: Yang, Y.: Elucidating the Impacts of Various Atmospheric Ventilation Conditions on Local and Transboundary Ozone Pollution Patterns: A Case Study of Beijing, China, EGU General Assembly 2024, Vienna, Austria, 14–19 Apr 2024, EGU24-1644, https://doi.org/10.5194/egusphere-egu24-1644, 2024.

EGU24-2393 | ECS | Posters on site | AS3.25

Uncertainty Quantification of Contrail Climate Impacts using Non-Intrusive Polynomial Chaos 

China Hagström, Sebastian Eastham, Ian Waitz, and Steven Barrett

Contrails are currently estimated to be one of the largest contributors to aviation climate forcing, with a cumulative effect roughly equivalent to that of the CO2 emitted by aviation.[3] Contrail properties are impacted by chemical and thermodynamic conditions in the exhaust and the meteorological environment. Currently, the state of meteorological and emissions data contains significant uncertainty.[4][2] As such, resulting contrail predictions and impact models are uncertain.

This uncertainty is a detriment to aviation impacts reduction analysis. Meteorological data such as relative humidity (RH) is a key determining factor for the lifetime and subsequent radiative forcing (RF) of the contrail. Mitigation strategies necessitate consistent predictions of when and where contrails are formed, which contrails persist, and their respective RF effects.[2] Identifying model parameter sensitivities to formation and meteorological condition uncertainty will improve the effectiveness of policies designed to reduce contrail climate impacts.

To address this problem we examine two existing models: the Aircraft Plume Chemistry, Emissions, and Microphysics Model (APCEMM), and the Contrail Cirrus Prediction Model (CoCiP).[1][5] Both model the chemical and physical evolution of an aircraft plume, using differing methods. Comparison of the models and their outcomes under different conditions will contribute to the characterization of current contrail models and identification of areas most sensitive to input parameters. Inputs of interest are soot concentration, sulfur concentration, and the RH field.

Uncertainty quantification (UQ) for the existing models is limited, and largely relies on Monte-Carlo analysis. Computationally expensive models such as APCEMM cannot be appropriately characterized by this type of analysis. A non-intrusive Polynomial Chaos Expansion (PCE) method is implemented to better characterize the relationship between uncertain inputs and resulting impacts predicted by APCEMM and CoCiP. This technique is commonly used for UQ of results obtained from expensive computational models. PCE is a data-driven regression-based technique that relies on spectral polynomials as basis-functions. Outputs of few (expensive) numerical simulations estimate the PCE coefficients within a regression framework combined with regularization techniques. The resulting surrogate efficiently predicts outcomes given novel inputs, circumventing the use of the expensive model to produce analysis.

In this work we introduce a new method of UQ for contrail impacts, applied to two existing contrail impact models. The resulting surrogates explore the impact of uncertainty in soot and sulfur concentrations as well as RH field. Our goal in this work is to establish quantitative relationships between input parameter uncertainty and climate impacts, identifying output sensitivity to input perturbations. We present a set of tests on the 5 most travelled flight paths for the 5 most common aircraft, including spatially dependent and independent uncertain variables.

[1]Thibaud Fritz et. al. The role of plume-scale processes in long-term impacts of aircraft emissions. 10.5194/acp-20-5697-2020

[2]Klaus Gierens et al. How Well Can Persistent Contrails Be Predicted? 10.3390/aerospace7120169

[3]D. Lee et al. The contribution of global aviation to anthropogenic climate forcing for 2000 to 10.1016/j.atmosenv.2020.117834

[4]Vincent Meijer et al. Contrail coverage over the United States before and during the COVID-19 pandemic. 10.1088/1748-9326/ac26f0

[5]Ulrich Schumann. A contrail cirrus prediction model. 10.5194/gmd-5-543-2012

How to cite: Hagström, C., Eastham, S., Waitz, I., and Barrett, S.: Uncertainty Quantification of Contrail Climate Impacts using Non-Intrusive Polynomial Chaos, EGU General Assembly 2024, Vienna, Austria, 14–19 Apr 2024, EGU24-2393, https://doi.org/10.5194/egusphere-egu24-2393, 2024.

EGU24-2898 | Orals | AS3.25

Bringing to life a monitoring, reporting and verification system for aviation non-CO2 climate effects 

Roland Eichinger, Volker Grewe, Katrin Dahlmann, Malte Niklass, Alexander Lau, Janina Scheelhaase, Florian Wozny, Liam Megill, Martin Plohr, Sigrun Matthes, Dennis Piontek, Christiane Voigt, Florian Linke, Vincent de Haes, Marson Jesus, Eneko Rodriguez, Maarten Tielrooij, Robert Koster, and Luis Natera Orozco

To date, only CO2 is addressed in the EU aviation Emission Trading System (EU-ETS), which implies that the major part of aviation climate effects, the non-CO2 effects, is not included. An agreement on a revision of the CO2 EU-ETS by the EU trilogue from 2022 now includes monitoring, reporting and verification (MRV) of non-CO2 aviation climate effects starting in 2025. However, the detailed steps towards an inclusion of non-CO2 effects are controversially debated for i) the calculation of aviation CO2 equivalents (CO2e), regarding suitable models as well as the choice of a climate metric and its time horizon, ii) the complexity of the entire system including data requirements, availability and streams generating administrative burden for various parties and iii) the large uncertainties in non-CO2 climate effects and their associated risks. Here, we discuss, analyse and put forward these points aiming at an inclusion of aviation non-CO2 effects into a political framework, as results of a project with the German Environmental Agency and current activities at EU-commision level as part of a EU-tender.

In this presentation, we lay out a plan for an MRV system including tasks for monitoring and reporting by aircraft operators as well as verifying by competent autorities. Our work aims at supporting the process towards an EU-wide MRV system and its way to operationalisation. This includes analysis of suitable climate metrics and climate models for CO2e calculations of non-CO2 emissions by aviation. Moreover, the data needed to apply the models for CO2e computation of individual flights is defined. For this, a minimum set of data and a possible extended list of data for both a climatological and a weather-based approach is determined. The more complex solutions can be used to on the one hand increase accuracy of the results and on the other hand allow more incentives for aircraft operators to mitigate climate effects. However, increases in administrative burden have to be considered to maintain acceptance by all parties. Advice on default values for data gaps is provided too, which is needed in case of individually or generally missing data for example due to technical issues or confidentiality. Lastly, uncertainties in the context of non-CO2 aviation effects and their associated risks for the MRV are discussed. The governing overarching goal in this undertaking must always remain the contribution to reaching the Paris Agreement targets through climate change mitigation incentives for the aviation industry.

How to cite: Eichinger, R., Grewe, V., Dahlmann, K., Niklass, M., Lau, A., Scheelhaase, J., Wozny, F., Megill, L., Plohr, M., Matthes, S., Piontek, D., Voigt, C., Linke, F., de Haes, V., Jesus, M., Rodriguez, E., Tielrooij, M., Koster, R., and Orozco, L. N.: Bringing to life a monitoring, reporting and verification system for aviation non-CO2 climate effects, EGU General Assembly 2024, Vienna, Austria, 14–19 Apr 2024, EGU24-2898, https://doi.org/10.5194/egusphere-egu24-2898, 2024.

EGU24-2958 | ECS | Orals | AS3.25

Co-drivers of air pollutant and CO2 emissions from on-road transportation in China 2010-2020 

Zhulin Qi, Yixuan Zheng, Yueyi Feng, Chuchu Chen, Yu Lei, Wenbo Xue, Yanling Xu, Zeyuan Liu, Xiufeng Ni, Qingyu Zhang, Gang Yan, and Jinnan Wang

The sustained growth in on-road transportation demand poses an increasing challenge for countries in mitigating air pollution and addressing climate change. Revealing how varying socioeconomic and policy factors have contributed to synergies or trade-offs between CO2 and air pollution emissions is crucial for effectively co-controlling carbon-pollution emissions. Here, based on detailed air pollution and CO2 emission inventories from China’s on-road transportation over 2010-2020 and the Logarithmic Mean Divisia index (LMDI) analysis, we explore the on-road synergetic evolution trends among pollution and CO2 emissions and identify the co-drivers influencing carbon-pollution co-emissions. We find that the estimated sectoral emissions of VOCs, NOx, PM2.5, and CO declined by 49.9%, 25.9%, 75.2%, and 63.5%, respectively, while CO2 emissions increased by 46.1% in China over 2010-2020. The vehicle-type-specific analysis further highlights the crucial role of light-duty passenger vehicles and heavy-duty trucks in simultaneously improving air quality and mitigating CO2 emissions, given their synergies in emission growth of VOCs-CO2 and NOx-CO2, respectively. The driver analysis indicates that socioeconomic growth and rising transportation demand are major co-drivers of carbon-pollution emission growth, while the implementation of control policies, particularly advances in emission efficiency, can facilitate co-reductions. Specifically, in the passenger subsector, advances in emission efficiency and changes in travel behavior are identified as the most efficient co-drivers for synergistic emission reduction. The gradual proliferation of new energy vehicles also provides additional synergistic reductions. In the freight subsector, improved freight economic efficiency and optimized freight transport structure are identified as other two co-drivers of synergistic emission reduction. Regional disparities further emphasize the need for policy refinement, including reducing dependency on fuel vehicles in the passenger subsector and prioritizing co-reduction strategies in high-emission provinces in the freight subsector. Overall, our study confirms the effectiveness of China’s on-road control policies and provides valuable insights for future policy makers in China and other similarly positioned developing countries seeking to reduce CO2 and air pollutant emissions simultaneously.

How to cite: Qi, Z., Zheng, Y., Feng, Y., Chen, C., Lei, Y., Xue, W., Xu, Y., Liu, Z., Ni, X., Zhang, Q., Yan, G., and Wang, J.: Co-drivers of air pollutant and CO2 emissions from on-road transportation in China 2010-2020, EGU General Assembly 2024, Vienna, Austria, 14–19 Apr 2024, EGU24-2958, https://doi.org/10.5194/egusphere-egu24-2958, 2024.

Atmospheric chemistry transport models (CTMs) are since long time an important tool for studying multi-phase chemical reactions, particle formation and deposition processes of numerous trace gases and primary particles emitted into the atmosphere. These models need emission and meteorological information as essential inputs. Emissions are more than just a static inventory, they have dynamical spatial and temporal components. Therefore, separate model systems are typically applied for calculating the CTM input data. Their development and comprehensive evaluation are essential for enabling progress in air quality modelling. Emission control politics, in addition, need well suited tools to assess the overall impact of often costly emission reduction measures beforehand.

This contribution focuses on emission models for ground based transport, in particular for ship traffic and road traffic. While state-of-the-art ship emission models apply bottom-up approaches that are based on ship position data and technical ship characteristics, road traffic emission models cannot treat each vehicle individually. Nevertheless, road traffic activity data can also be combined with emission factors for certain vehicle types and emission standards. However, diurnal profiles and weekday dependencies are often not included in the activities. How highly resolved traffic activity data from mobile phones can be used was demonstrated during the lockdowns in the early phase of the COVID-19 pandemic. Google mobility data or Apple data was widely used to improve road traffic emission estimates in spring 2020.

In the presentation, challenges and limitations of ground based traffic emission model systems are discussed. In addition, their power for improving air quality simulations as well as for constructing consistent future emission scenarios, that are essential for intelligent emission reduction policies, are illustrated.

How to cite: Matthias, V.: Challenges in traffic emission modeling and their application, EGU General Assembly 2024, Vienna, Austria, 14–19 Apr 2024, EGU24-5719, https://doi.org/10.5194/egusphere-egu24-5719, 2024.

EGU24-6075 | ECS | Posters on site | AS3.25

Use of high-time resolution roadside measurements to inform NOx emission ratios  

Carys Williams, Dr Will Drysdale, Dr Samuel Cliff, Dr Sarah Moller, and Prof James Lee

As air quality targets become more stringent, a better understanding of urban air pollution sources continues to be important for the development of targeted and effective policy.  Ambient measurements of the enhancement of NOx and CO2 concentrations above background can be linked to direct emissions via the calculation of emission ratios (ΔNOx/ΔCO2), which in turn provide insight into emission sources. In this work, we use a regression analysis method to quantify emission ratios from high time resolution (1 second) roadside measurements of NOx and CO2 taken in two major UK cities, London and Manchester. Calculated emission ratios allow us to gain a greater understanding of the effect of factors such as fleet composition and vehicle operating conditions on NOx emissions, along the roads measured. Additionally, a comparison of emission ratios across the two cities allows for an interesting discussion on the differences in traffic behaviour and effectiveness of local traffic-related policy (e.g. low emission zones). Analysis of long-term measurements of NOx and CO2 at the Marylebone Road site demonstrate the effect of changes in vehicle technology and the effect of the ULEZ. This work also aims to highlight the benefit of long-term high time resolution measurements on a local level to develop an advanced understanding of local traffic-related NOx emission characteristics.

How to cite: Williams, C., Drysdale, D. W., Cliff, D. S., Moller, D. S., and Lee, P. J.: Use of high-time resolution roadside measurements to inform NOx emission ratios , EGU General Assembly 2024, Vienna, Austria, 14–19 Apr 2024, EGU24-6075, https://doi.org/10.5194/egusphere-egu24-6075, 2024.

Due to rapid urbanization and population growth, high aerosol pollution in the Korean Peninsula has become a major environmental concern. High concentrations of PM2.5 in atmosphere is not only highly hazardous to humans, but also contributes significantly to visibility degradation and climate change. In study, K-means clustering analysis was performed to classify major synoptic patterns on the Korean Peninsula during the seasonal PM2.5 management from 2015 to 2019. Also, we analyzed synoptic patterns according to the air quality on each cluster by dividing the PM2.5 pollution standard into four levels to identify the differences in the occurrence of PM2.5 concentrations in the similar meteorological environment. As a result, the synoptic patterns were classified into five clusters (C1~C5). The clusters (C1, C3, C4) with pressure gradient from east to west showed differences of PM2.5 concentrations in Seoul as the pressure gradient between east and west changed. The clusters (C2, C5) with pressure gradients from south to north had different PM2.5 concentrations in Seoul depending on the location and intensity of high pressure located in southeast of the Korean Peninsula and the intensity and location of high- and low-pressure systems located in the North Pacific and Kamchatka Peninsula, respectively. This study confirmed that air quality can vary depending on the location and strength of high- and low-pressure systems in the similar synoptic meteorological environment.

How to cite: Chae, D., Kim, J., Yoo, J.-W., and Lee, S.-H.: A study of differences in PM2.5 concentrations at similar synoptic meteorological fields during the seasonal PM2.5 management from 2015 to 2019, EGU General Assembly 2024, Vienna, Austria, 14–19 Apr 2024, EGU24-7334, https://doi.org/10.5194/egusphere-egu24-7334, 2024.

EGU24-7909 | ECS | Orals | AS3.25

Modeling the formation of contrails produced by H2 fuel emissions 

Margaux Vals, Etienne Terrenoire, and Nicolas Bonne

Alternative aviation fuels represent a promising approach to reduce contrails climate effect. In the frame of Cirrus H2 project (DGAC funding), the influence of fuel composition on exhaust plumes emission, and therefore on contrails, is investigated using the 1D detailed microphysical code MoMiE (Modèle Microphysique pour Effluents) developed at ONERA1,2.

In its most recent version the code has been adapted to Sustainable Alternative Fuels (SAF)2. It includes heterogenous freezing with soot activation by sulfur and organic species, as well as homogeneous freezing of liquid droplets of hydrated sulfates and organics, accounting for the competition between both nucleation modes. Chemiionization, brownian coagulation of particles, ice sublimation and condensation are also represented. The code outputs the different aerosols distributions (size and number) of sulfates, organics, dry soot, activated soot, and ice particles, homogeneously and heterogeneously formed. It has also been completed by the implementation of the entrainment of ambient particles (background soot, sulfates and ice particles), which are expected to play a significant role in the case of SAF, as these fuels drastically reduce soot and sulfur emissions in comparison to classical fossile kerosene fuels.

The work presented here aims at adapting the microphysics of contrail formation included in MoMiE to the case of hydrogen fuel emissions. In the case of a full hydrogen fuel composition, effluents are essentially composed of water vapor and the microphysical processes of the contrail formation are expected to mainly involve the background particles. Different simulations will be performed to explore the mechanisms of contrail formation in this particular case, and will be confronted to the cases of kerosene and SAF emissions. Advancement and results of this study will be presented and discussed during the conference.

1Vancassel X. et al., Numerical simulation of aerosols in an aircraft wake using a 3D LES solver and a detailed microphysical model, International Journal of Sustainable Aviation, 2014

2Rojo C. et al., Impact of alternative jet fuels on aircraft-induced aerosols, Fuel, 2014

How to cite: Vals, M., Terrenoire, E., and Bonne, N.: Modeling the formation of contrails produced by H2 fuel emissions, EGU General Assembly 2024, Vienna, Austria, 14–19 Apr 2024, EGU24-7909, https://doi.org/10.5194/egusphere-egu24-7909, 2024.

EGU24-9428 | ECS | Orals | AS3.25

Impacts of shipping emissions on air quality: emission factors and PM source apportionment in the coastal city of Toulon, France 

Quentin Gunti, Benjamin Chazeau, Brice Temime-Roussel, Irène Xueref-Remy, Alexandre Armengaud, Henri Wortham, and Barbara D'Anna

Maritime traffic can have a significant local impact, particularly in port areas during the docking and undocking phases. Air quality measurements conducted in certain port cities show that ship emissions are quantitatively comparable to those from road traffic and are contributing to a significant deterioration of air quality. This pollution is now recognized as a real societal problem and a proven danger for human health. Since the reduction of sulphur content in ship fuels in 2020, only few studies have been carried out to analyse in detail the contribution of shipping to urban pollution.

A month-long measurement campaign was carried out from August 24 to September 21, 2021, in the port of Toulon on the French Mediterranean coast. Particle concentration, size distribution, and chemical composition as well as gas concentrations were measured using state-of-the-art instruments such as Scanning Mobility Particle Sizer (SMPS, TSI), High-Resolution Time-of-Flight Aerosol Mass Spectrometer (HR-ToF-AMS, Aerodyne), Multi-Angle Absorption Photometer (MAAP, Thermo), Gas Concentration Analyzer (G2401, Picarro), Optical Particle Counter (OPC, Grimm), Condensation Particle Counter (EnviCPC100, Palas), Aethalometer (AE33, Magee) and various gas analyzers (100E, 200E and 400E from Teledyne).

In this study, the emission factors (EFs) for pollutants emitted from shipping were determined using a carbon mass balance approach. A total of 50 exhaust plumes was identified and quantified.

In addition, the organic fraction of the particles measured by HR-ToF-AMS was used to populate a source apportionment model based on positive matrix factorization (PMF) method.  The source deconvolution was performed for mass spectra with mass/charge ratios (m/z) ranging from 12 to 256 with a time step of 1 minute. Besides, mass spectra derived from docked ferries were used as constraining profiles. The model has been supplemented with spectra from the literature, in particular hydrocarbon-type and cooking-type organic aerosols. These features enhanced the deconvolution process, enabling emissions associated with cooking activities, road traffic and shipping to be distinguished. Ancillary measurements such as meteorological data, particle number, black carbon, and gaseous pollutants were used to underpin the physical accuracy of each organic aerosol factor in the source apportionment model. Finally, an eight-factor solution was chosen: three organic factors were associated to shipping, a hydrocarbon-type organic aerosol (HOA) associated with traffic exhaust emissions, a cooking-type organic aerosol (COA), a less oxidized organic aerosol (LOOA), a more oxidized organic aerosol (MOOA) and a last factor of intermediate oxidation.

The results of this analysis underscore the significant influence of maritime emission on urban pollution in the port area of Toulon.

How to cite: Gunti, Q., Chazeau, B., Temime-Roussel, B., Xueref-Remy, I., Armengaud, A., Wortham, H., and D'Anna, B.: Impacts of shipping emissions on air quality: emission factors and PM source apportionment in the coastal city of Toulon, France, EGU General Assembly 2024, Vienna, Austria, 14–19 Apr 2024, EGU24-9428, https://doi.org/10.5194/egusphere-egu24-9428, 2024.

EGU24-9776 | ECS | Posters on site | AS3.25

Contrail aging simulation of a supersonic aircraft 

Mathieu Muller, Etienne Terrenoire, Younes Bouhafid, and Nicolas Bonne

Over the last decades, the increasing globalisation and the associated need for substantially shortened travel times has led to public and privately-funded development of supersonic aircraft. The International Civil Aviation Organization (ICAO) needs to define standards for the advent of this new generation of supersonic aviation. The SENECA project (“noiSe and EmissioNs of supErsoniC Aircraft”) aims at developing supersonic aircrafts, investigating the impact of specifical supersonic engine technologies on the aircraft performance and noise, providing aircraft fuel burn, emitted CO2 data and engine emission indices for NOx, CO, HC, SOx and soot and quantifying a range of climate impacts of supersonic aviation.

In the context of this project, the ONERA objectives are to model and characterize the contrails due to supersonic aircraft during cruise and to provide data to climatologists to calculate their global impact.

In this study, a focus is made on the vortex phase of the contrail aging modelled with the CEDRE software from ONERA. The vortex phase strongly depends on both the aircraft geometry and the atmospheric conditions. So, first RANS simulations using mesh adaptation were performed to obtain an aerodynamical field used to initialize the vortex phase [1]. 

From the RANS field, a slice far from the aircraft is extracted, extruded and interpolated on a 3D mesh whose longitudinal dimension corresponds to the Crow wave length. Jet and atmospheric fluctuations are added to trigger the Crow instability, and the stratification of the atmosphere is also modelled corresponding to the lower stratosphere where the aircraft is flying in cruise regime. After those steps, a LES simulation is performed to simulate the contrail aging.


[1] M. Muller and E. Terrenoire, Near-field mesh adaptation for contrail modeling of a supersonic aircraft, 3AF International Conference on Applied Aerodynamics, 29-31 March 2023, Bordeaux, France

How to cite: Muller, M., Terrenoire, E., Bouhafid, Y., and Bonne, N.: Contrail aging simulation of a supersonic aircraft, EGU General Assembly 2024, Vienna, Austria, 14–19 Apr 2024, EGU24-9776, https://doi.org/10.5194/egusphere-egu24-9776, 2024.

EGU24-10038 | Posters on site | AS3.25 | Highlight

Emission location shape atmospheric and climate effects of alternative fuels in domestic aviation 

Jan Klenner, Marianne Tronstad Lund, Helene Muri, and Anders Hammer Strømman

Aviation emissions significantly contribute to global warming, necessitating reductions to align with the 1.5°C target. Beyond carbon dioxide emissions from fossil jet fuel combustion, non-CO2 emissions play a crucial role, exhibiting diverse impacts on atmospheric chemistry and radiative forcing based on geographic location, altitude, and time. To enhance comprehension of aviation emissions and potential alternative fuels, we introduce the AviTeam model—a data-driven, high-resolution model utilizing ADS-B data to quantify emissions of various species, including NOx, CO, BC, SO2, H2O, and hydrocarbons, alongside CO2. 

Integrating AviTeam's emission inventory with the OsloCTM3 chemical transport model allows us to assess the regional impact of aviation emissions. We explore the atmospheric chemistry effects of transitioning to liquid hydrogen and synthetic fuels as alternatives to fossil jet fuel. Additionally, a contrail formation potential analysis reveals that hydrogen exhibits a higher non-persistent contrail-forming potential than kerosene due to its elevated water vapor emissions. Our findings suggest that in high-latitude regions, adopting alternative aviation fuels may yield different mitigation effects with fewer trade-offs between non-CO2 and CO2 impacts than global averages suggest. However, the mitigation potential of alternative aviation fuels from a life cycle perspective is constrained to 44–56% reduction in GWP100, attributed to short-lived climate forcings and additional fuel demand for liquid hydrogen. Notably, the mitigation potential is less pronounced on shorter flights. Our results underscore the importance of integrating models like AviTeam with chemical transport models and life cycle perspectives to emphasize the significance of accounting for local atmospheric conditions and better understand variability in aviation emissions studies. 

How to cite: Klenner, J., Lund, M. T., Muri, H., and Strømman, A. H.: Emission location shape atmospheric and climate effects of alternative fuels in domestic aviation, EGU General Assembly 2024, Vienna, Austria, 14–19 Apr 2024, EGU24-10038, https://doi.org/10.5194/egusphere-egu24-10038, 2024.

EGU24-10040 | ECS | Posters on site | AS3.25

Comparisons of radiosonde water vapor measurements with ECMWF ERA-5 and contrails observations above Clermont-Ferrand (France) 

Sidy Diarra, Jean-Luc Baray, Nadège Montoux, Patrick Fréville, Fréderic Peyrin, Philippe Cacault, and Philippe Keckhut

The cirrus clouds impact on the radiation budget of the Earth depends mainly of their optical thickness and altitude (Heymsfield et al., 2017). The contrails formed from aircraft emissions bring an additional impact to that of natural cirrus clouds (Kärcher, 2018). Their formation and potential evolution in cirrus clouds depend on the thermodynamical state of the atmosphere at fine scales, in particular of the saturation of water vapour with respect to ice. However, at their altitude of formation (~10 km), few reliable measurements of the water vapour are available.

In this study, we use observational data on the presence of crystals through their scattering observed by lidar and water vapor measurements using the Raman scattering technique (Fréville et al., 2015). Observations from standard meteorological balloon soundings (temperature, water vapor, and wind) (Dupont et al., 2020), as well as meteorological reanalyses (ECMWF), will be also analyzed to better characterize the overall context, considering finer vertical resolutions.

A first part of this study is to evaluate the quality of Modem M10 radiosondes humidity measurements available from the MeteoFrance network by comparison with ECMWF ERA-5 analysis. A second part of this study is to document contrails formation and evolution using a combination of instruments: an ADS-B recorder to identify aircraft type and position, a full sky camera to detect the presence of contrails and a collocated lidar to retrieve water vapour concentration profiles and macrophysical and optical properties of the contrail. The methodology and first results will be presented on a case study identified the 2nd of June 2023 above Clermont-Ferrand (France). Contrails have been observed when ECMWF ERA-5 relative humidity was around 115% and stay visible on the full-sky camera during more than 2 hours. This study is carried out in the framework of the European project BeCoM (Grant agreement ID: 101056885) whose main objective is to reduce the contrail radiative forcing.


Keywords: water vapour, cirrus, contrail, Lidar, camera.


Bibliography:

Kärcher et al., (2018). Formation and radiative forcing of contrail cirrus. Nature communications9(1), 1824.

Heymsfield et al., (2017). Cirrus clouds. Meteorological Monographs58, 2-1.

Fréville et al. (2015). Lidar developments at Clermont-Ferrand – France for atmospheric observation, Sensors, 2015, 15, 3041-3069; doi:10.3390/s150203041

Dupont et al., (2020). Characterization and corrections of relative humidity measurement from Meteomodem M10 radiosondes at midlatitude stations. Journal of Atmospheric and Oceanic Technology37(5), 857-871.

How to cite: Diarra, S., Baray, J.-L., Montoux, N., Fréville, P., Peyrin, F., Cacault, P., and Keckhut, P.: Comparisons of radiosonde water vapor measurements with ECMWF ERA-5 and contrails observations above Clermont-Ferrand (France), EGU General Assembly 2024, Vienna, Austria, 14–19 Apr 2024, EGU24-10040, https://doi.org/10.5194/egusphere-egu24-10040, 2024.

EGU24-10092 | Posters on site | AS3.25

SO2 and NOx emissions from European shipping: a measurement study 

James Lee, Dominika Pasternak, Shona Wilde, and Stuart Lacy

The shipping industry is a significant source of both SO2 and NOx, two air pollutants which have neg-active implications for climate and air quality. SO2 is heavily regulated such that January 2020 marked a global reduction of the maximum permitted sulfur fuel content (SFC) in shipping fuel from 3.5% to 0.5% by mass. There are also various limits on NOx in coastal and inland waterways with more widespread NOx emissions limits likely to be implemented in the future. The anticipated effect of the new regulations is an improvement of coastal air quality, but there is a potential drawback in terms of reducing the climate cooling effect of SO2 caused by a change in cloud properties. However, the difficulty in measuring emissions from ships means that the overall impact and level of compliance with new and future regulations is unclear. Therefore, monitoring strategies capable of providing regular and long-term measurements of air pollutant emissions from the shipping industry are essential for fundamental research and compliance monitoring. Here we present top-down methodologies for calculating the SFC, along with emission ratios of ∆NOx/∆CO2 from individual ships. First, we demonstrate the application of an airborne platform to perform targeted measurements of ship plumes in the English Channel and Atlantic shipping lanes, allowing the comparison of emissions inside and out of sulfur emission control areas (SECAs). Second, we implement a stationary, point-sampling approach to measure ships arriving and departing two European ports.

Our results show there has been a significant reduction in the SFC of ships in the open ocean shipping lanes due to the new emission regulations, with most ships now well below the 0.5% limit imposed in 2020. Our measurements also show good agreement with a comprehensive ship specific emissions inventory (the Ship Traffic Emission Assessment Model – STEAM). This confirms the validity of models that use the new sulfur limit for radiative forcing calculations. In terms of NOx, the measured ∆NOx/∆CO2 ratios were generally greater than those from diesel vehicles operating within a typical European fleet, suggesting ships could be a significant source of NOx to cities, especially where ports are close to populated areas. It is envisaged that the presented methodologies could be implemented to facilitate widespread monitoring of ship emissions, which could provide the basis for policy formulation and validation.

How to cite: Lee, J., Pasternak, D., Wilde, S., and Lacy, S.: SO2 and NOx emissions from European shipping: a measurement study, EGU General Assembly 2024, Vienna, Austria, 14–19 Apr 2024, EGU24-10092, https://doi.org/10.5194/egusphere-egu24-10092, 2024.

EGU24-10277 | ECS | Posters on site | AS3.25

In-flight Measurements of Contrails in the Low Soot Regime during the ecoDemonstrator Experiment  

Tiziana Bräuer, Raphael Märkl, Monika Scheibe, Daniel Sauer, Rebecca Dischl, Christopher Heckl, Heinfried Aufmhoff, Luca Stremming, Christiane Voigt, Joshua Digangi, Glenn Diskin, Steven Baughcum, William Griffin, Tim Rahmes, Cassandra Miller, and Richard Moore

Analyzing the formation of contrails on emissions from the most recent generation of aircraft engines is key to understand the climate impact from aviation. As for conventional Rich-Quench-Lean engines contrail ice crystals mainly form on a high number of emitted soot particles, the question arises which and how many particles are activated during the contrail formation process if soot emissions are strongly reduced through the Lean Combustion technology.

The ecoDemonstrator experiment is a collaboration between Boeing, GE, NASA, DLR and other international partners and took place in October 2023. For the first time, we present in-flight measurements of contrail ice crystals in the exhaust of the ultra-low soot emitting CFM International LEAP-1B engine. This experiment combines the lean-burning engine technology with the use of Sustainable Aviation Fuels (SAF) and ultra-low sulfur kerosene (LS-Jet-A) in newly manufactured engines to achieve close to soot-free emissions. During the experiment, we performed measurements on board the NASA DC-8 research aircraft, sampling emissions behind a Boeing 737 MAX 10 aircraft. In addition to gas and particle emissions, we also measured the number concentrations of ice crystals that formed behind the 737 MAX 10 at a distance between 3 and 8 kilometers with two Cloud and Aerosol Spectrometers (CAS) that were positioned on the upper and lower fuselage of the DC-8. We show a first analysis of the contrail ice data for selected flights and present apparent ice emission indices (AEI) in relation to ambient conditions.

How to cite: Bräuer, T., Märkl, R., Scheibe, M., Sauer, D., Dischl, R., Heckl, C., Aufmhoff, H., Stremming, L., Voigt, C., Digangi, J., Diskin, G., Baughcum, S., Griffin, W., Rahmes, T., Miller, C., and Moore, R.: In-flight Measurements of Contrails in the Low Soot Regime during the ecoDemonstrator Experiment , EGU General Assembly 2024, Vienna, Austria, 14–19 Apr 2024, EGU24-10277, https://doi.org/10.5194/egusphere-egu24-10277, 2024.

EGU24-10398 | ECS | Posters on site | AS3.25

Empirical Calibration of Contrail Models based on LIDAR Observations 

Michael Xu, Vincent Meijer, Steven Barrett, and Sebastian Eastham

Aircraft induced cirrus clouds are estimated to account for 57% of aviation’s current-day climate impact, but this value is highly uncertain with the fidelity and biases in meteorological data being significant contributing factors. Our work aims to address this uncertainty and to provide empirical evaluation of multiple contrail modeling approaches. First, we use a dataset of contrail cross sections observed from the CALIOP orbital LIDAR that were attributed to specific flights to calibrate parameterizations for the initial widths and depths of contrails. We then examine the effect of systematic biases in wind, humidity and temperature, analyzing which modifications to the data provide the best agreement between a simulated contrail (using the APCEMM contrail model) and observations. Finally, we evaluate the degree of accuracy of the calibrated APCEMM model across a larger dataset and compare the results to those from the widely-used CoCiP model.


How to cite: Xu, M., Meijer, V., Barrett, S., and Eastham, S.: Empirical Calibration of Contrail Models based on LIDAR Observations, EGU General Assembly 2024, Vienna, Austria, 14–19 Apr 2024, EGU24-10398, https://doi.org/10.5194/egusphere-egu24-10398, 2024.

EGU24-11846 | ECS | Posters on site | AS3.25

Upper tropospheric humidity and ISSRs: near real-time flight data delivery, statistics, and application for contrail forecast model assessment 

Yun Li, Susanne Rohs, Torben Blomel, Ulrich Bundke, and Andreas Petzold

The so-called ice-supersaturated regions with air parcels in the status of ice supersaturation (ISSRs) are potential formation regions of cirrus, making them of particular interest to contrails and aviation-induced cirrus. Contrail persistence requires slight ice subsaturation to ice supersaturation (Lee et al., 2021; Li et al., 2023); otherwise, ice crystals would sublimate quickly. Contrails and contrail cirrus in regions with high relative humidity with respect to ice (RHice) have been derived to cause a net warming impact in earlier studies (Sausen et al., 2005; Stuber and Forster, 2007; Lee et al., 2021)

Seasonal and regional variabilities and long-term trends of upper tropospheric RHice and ISSRs have been studied using IAGOS routine measurements from passenger aircraft (Petzold et al., 2020; Rohs et al., 2023, see also https://www.iagos.org/). With increasing awareness of the strong climate impact of contrails and contrail cirrus among other aviation emissions, re-routing aircraft to avoid contrail formation becomes an important mitigation target for the aviation industry. However, the correct representation of ISSRs in forecast models is an essential prerequisite to plan robustly more climate-friendly flight trajectories.

In this work, we will show the status of weather forecast models in representing real upper tropospheric ice supersaturation. The near real-time RHice dataset from IAGOS observations, provided post-flight to Copernicus Atmosphere Monitoring Service (CAMS), are used to study the occurrence patterns and favourable spatial and temporal conditions of ISSRs in dense air traffic regions, e.g., the North Atlantic flight corridor. Cases demonstrating the assessment of ISSRs and contrail forecast models at cruise levels with in-situ aircraft observations will be showcased.

[Note: This work is conducted within the framework of the Horizon 2020 project ACACIA with Grant Agreement No. 875036 and the SESAR 3 JU project CICONIA with Grant Agreement No. 101114613.]

How to cite: Li, Y., Rohs, S., Blomel, T., Bundke, U., and Petzold, A.: Upper tropospheric humidity and ISSRs: near real-time flight data delivery, statistics, and application for contrail forecast model assessment, EGU General Assembly 2024, Vienna, Austria, 14–19 Apr 2024, EGU24-11846, https://doi.org/10.5194/egusphere-egu24-11846, 2024.

EGU24-11991 | ECS | Orals | AS3.25 | Highlight

Atmospheric Impacts of Hydrogen as a Sustainable Aviation Fuel 

Evan Gibney, Sebastian Eastham, Florian Allroggen, and Steven Barrett

Hydrogen is being investigated as a promising zero-carbon sustainable aviation fuel (SAF), offering the potential to eliminate direct CO2 emissions with low lifecycle greenhouse gas emissions. Additionally, the combustion of hydrogen can remove all emissions of SOx, nvPM, CO, and unburned hydrocarbons. There are, however, climate and air quality costs to the use of hydrogen. Combustion of hydrogen is still expected to result in emissions of NOx, and the degree to which contrails will be increased or mitigated is unknown. In addition, there has been little research into the long-term consequences of direct emission of hydrogen.

Hydrogen emissions originate from leakage, venting, and purging that occur both within the supply chain and on the aircraft. Though not a direct greenhouse gas, hydrogen reacts in the atmosphere via mechanisms that increase the effects of other potent greenhouse gases and air pollutants. Specifically, increased emissions of hydrogen are projected to increase the lifetime of methane, the tropospheric burden of ozone, and the stratospheric burden of water vapor – all greenhouse gases. No study to date has assessed the additional climate impacts associated with direct emission when considering hydrogen as an aviation fuel. Furthermore, with the dominant loss mechanism of emitted hydrogen being based in soil, no study has evaluated the degree to which these indirect mechanisms might differ for hydrogen which is emitted at altitude. These considerations have the potential to change the perceived sustainability of hydrogen as an aviation fuel.

In this study, we quantify the climate and air quality impacts (excluding contrails) of a hypothetical future hydrogen aircraft fleet compared to equivalent kerosene and hydrocarbon-based SAF fleets. We use the GEOS-Chem global chemistry transport model, modified to represent hydrogen’s surface soil sink, to conduct a spatially discretized, multi-year impact assessment. Multiple scenarios are evaluated to address uncertainty in factors such as hydrogen leakage rates and NOx emissions from hydrogen aircraft. This assessment will provide the foundation for understanding the magnitude of the environmental benefits and costs of hydrogen-fueled aviation.

How to cite: Gibney, E., Eastham, S., Allroggen, F., and Barrett, S.: Atmospheric Impacts of Hydrogen as a Sustainable Aviation Fuel, EGU General Assembly 2024, Vienna, Austria, 14–19 Apr 2024, EGU24-11991, https://doi.org/10.5194/egusphere-egu24-11991, 2024.

EGU24-12227 | ECS | Posters on site | AS3.25

A comparison of contrail detectability from LEO and GEO satellite images 

Marlene V. Euchenhofer, Ian Ross, Sebastian D. Eastham, Vincent Meijer, and Ian A. Waitz

Despite large uncertainties, persistent contrails are estimated to be responsible for more than half of the additional climate forcing attributed to aviation (Lee et al., 2021). Persistent contrails form only under ice-supersaturated conditions, present in vertically thin regions (Gierens et al., 2020), resulting in a potential to reduce the formation of aircraft-induced cirrus clouds by making altitude deviations of approximately 1km (Sausen et al., 2023). This requires knowledge of the location of the regions to be avoided.

Currently, research groups are using images from geostationary (GEO) satellites to observe and detect persistent contrails and to use these detections to estimate regions of persistent contrail formation (Meijer et al., 2022; Ng et al., 2021; Vazquez-Navarro et al., 2010). Observations from GEO satellites provide frequently updated images (every five minutes for GOES-16 ABI), enabling “nowcasting” of contrail forming regions (McCloskey et al., 2021).

We have conducted a preliminary assessment, which shows that data from GEO satellites does not resolve many contrails visible on images from satellites in the low-Earth orbit (LEO). This was particularly observed under conditions of high background cloudiness and shows a noticeable underestimation of the extent of regions of persistent contrail formation. Since LEO satellites orbit closer to the Earth’s surface (typically at an altitude around 800 km) compared to GEO satellites (35,786 km), instruments onboard LEO satellites often have a higher spatial resolution. However, most LEO satellites overfly most points on Earth only every 12 hours. We therefore find that, while high-resolution LEO images provide the potential for improved contrail detection at certain points in time, due to their more limited temporal resolution, they can only serve as an additional layer of information rather than as a sole source for contrail detection.

Here we present a dataset of collocated observations from a variety of sources, including GEO and LEO infrared radiometers, LEO lidar, data from numerical weather prediction models, and contrail height estimates from correlations of satellite observations with flight data. With this data, we are building our “ground truth library” of contrail observations, which allowed us to systematically investigate the influence of different cloud and atmospheric parameters on contrail detection.

Since attributing observed contrails to individual flights still is a highly manual process, we further investigated which instrument channels allow for the best human identification of contrails under different conditions. Considering weather data as an additional layer of information, especially when cloudiness impacts the visibility for all sources of visual data, allows us to assess the likelihood of contrail persistence in these regions and to identify the correlated uncertainty bounds for this process. Our investigation yields a multifaceted assessment of contrail detectability and the potential of different data sources to improve the identification of regions that allow for contrail persistence. 

How to cite: Euchenhofer, M. V., Ross, I., Eastham, S. D., Meijer, V., and Waitz, I. A.: A comparison of contrail detectability from LEO and GEO satellite images, EGU General Assembly 2024, Vienna, Austria, 14–19 Apr 2024, EGU24-12227, https://doi.org/10.5194/egusphere-egu24-12227, 2024.

EGU24-12820 | ECS | Posters on site | AS3.25

Two-dimensional stability of a wake vortex dipole in a stratified atmosphere. 

Pierre Saulgeot, Vincent Brion, Nicolas Bonne, Emmanuel Dormy, and Laurent Jacquin

A recent study (Lee et al., 2021) has shown that contrails are the main contributor to aviation-related radiative forcing. However, the same study shows that this contribution is highly imprecise due to numerous uncertainties. Among the most important are the numerous contingencies regarding the vertical and horizontal extent of ice plumes, as well as their altitude, which may differ from the flight level of the emitting aircraft, rising to hundreds of meters. This uncertainty is largely due to its interaction with the aircraft’s dynamic wake, which, very soon after the aircraft’s passage, is reduced to two counter-rotating vortices known as wingtip vortices.

These two vortices descend by induction into the atmosphere, driving the plumes to lower altitudes. However, these dynamics are influenced by atmospheric stratification, as shown in Spalart (1996). In most cases, the two wake vortices continue their descent, but certain dynamic structures are created in their vicinity by the baroclinic torque due to buoyancy, and rise to flight altitude. The wake then splits into two parts: one descending into the atmosphere and the other rising back up to, or slightly above, flight altitude. A long, rising column of fluid joins the two wakes. The plume initially trapped around the two vortices can then evolve in three different ways. Either the plume remains with the vortices well below the flight altitude, or it rises to this altitude or even higher, entrained in the secondary wake, or it is distributed between the two wakes and the column uniting them, as shown by Saulgeot et al. (2023).

Among the parameters influencing these dynamics is the relationship between atmospheric stratification, quantified by the Brunt-Väisälä frequency N, and the characteristic time τ0 of the vortex dipole

                                                                   τ0 = b0/ W0

where the natural motion of the vortices is a descent at constant speed W0 caused by mutual induction. This is the reference time scale, and the initial vortex separation b0 is the reference distance. In this scale framework, the effective stratification of the vortex flow is measured by the inverse of the Froude number

                                                                    Fr1 = Nτ0.                                                                  

The intermediate vorticity column plays a fundamental role in the upwelling of the plume: it is the only link between the primary and secondary wakes and can therefore influence both the latter and the plume. At the end of the two-dimensional phase of wake evolution, before the onset of the Crow instability, this column can destabilize, isolating the two parts of the wake and preventing the plume from rising. This can be thought of as thermal plume jet instabilities. These are of two types: sinusoidal and varicose. In most cases, the two instabilities follow one another (see figure 1): the varicose instability appears first, then the sinusoidal instability takes over due to a higher growth rate. Nevertheless, the appearance of one or the other can be observed independently.

Figure 1: Vorticity field for Fr1 =0.6. (a) t =7.3τ0; (b) t =7.4τ0; (c) t =7.5τ0; (d) t =7.6τ0; (e) t =7.7τ0; (f) t =7.8τ0; (g) t =7.9τ0.

How to cite: Saulgeot, P., Brion, V., Bonne, N., Dormy, E., and Jacquin, L.: Two-dimensional stability of a wake vortex dipole in a stratified atmosphere., EGU General Assembly 2024, Vienna, Austria, 14–19 Apr 2024, EGU24-12820, https://doi.org/10.5194/egusphere-egu24-12820, 2024.

EGU24-12867 | ECS | Orals | AS3.25

Robust satellite-based tracking of contrail forming regions 

Louis Robion, Vincent Meijer, Raymond Speth, Sebastian Eastham, and Steven Barrett

Contrails are estimated to be one of the largest contributors to the aviation sector’s climate impacts. A potential mitigation approach is avoiding flying in regions where contrails form and persist by rerouting aircraft above or below these regions.

Implementing such contrail avoidance strategies requires accurately forecasting the location of contrail forming regions. Although models exist, their prediction ability is limited by uncertainties in local weather conditions and contrail modeling. Understanding how these limitations affect our ability to predict contrail formation at a regional scale is necessary to improve forecasting of contrail avoidance regions.

To address this, we develop an observational inventory of the evolution of contrail forming regions over the United States. By developing a deep-learning algorithm and ensemble Kalman filter, we generate robust contrail detections on geostationary satellite imagery at a 5-minute frequency. Observed contrail forming regions are tracked over their lifespan allowing for the derivation of properties such as lifetime of the region, or rates of formation of contrails. These observed properties are compared to contrail model outputs using numerical weather prediction data, as well as correlated to patterns such as flight traffic density or spatial extent of the region. We also investigate the variability in conditions across the United States which support contrail formation.

Direct comparison of model outputs to large-scale high temporal resolution imagery of contrail forming regions will inform our understanding of contrail formation regions by providing observational evidence as to when and why current predictions can succeed.

How to cite: Robion, L., Meijer, V., Speth, R., Eastham, S., and Barrett, S.: Robust satellite-based tracking of contrail forming regions, EGU General Assembly 2024, Vienna, Austria, 14–19 Apr 2024, EGU24-12867, https://doi.org/10.5194/egusphere-egu24-12867, 2024.

EGU24-14735 | Posters on site | AS3.25

Investigating periods and regions with large mitigation potential using algorithmic climate change functions  

Simone Dietmüller, Sigrun Matthes, Christine Frömming, Patrick Peter, and Katrin Dahlmann

Planning climate-optimized aircraft trajectories requires temporally and spatially resolved quantitative estimates of the climate effects of aviation emissions. Algorithmic climate change functions (aCCFs) are applied, which efficiently assesses the climate effects of CO2 and individual non-CO2 effects (i.e. nitrogen oxide (NOx) induced ozone, methane and PMO, water vapour, and contrail-cirrus) using meteorological input data at the time and location of the emission. A consistent set of initial prototype aCCFs (aCCF-V1.0) has recently been made available (Yin et al., 2023), and an updated formulation of this aCCFs calibrated towards the climate response model AirClim has been developed (aCCF-V1.0A, Matthes et al., 2023).

Utilizing the recently published open source Python Library CLIMaCCF (Dietmüller et al., 2023), we calculate aCCFs for individual and merged non-CO2 climate effects for a variety of different summer and winter weather patterns over the North Atlantic flight corridor as well as over the European airspace. The calculations are based on meteorological data from the ERA5 reanalysis dataset. Through a detailed analysis of these aCCFs, we identify meteorological conditions with large non-CO2 climate effects and demonstrate the influence of these identified weather patterns on the mitigation potential.

We use ensemble members to systematically characterize the uncertainties arising from the limited predictability of weather forecasts for the weather patterns identified above. This allows to access the robustness of the climate effect estimates (and their mitigation potential). Moreover, we investigate the sensitivity of using different physical climate metrics and efficacy parameters and thus provide further insight to uncertainties linked to climate science.

We further investigate the dependence of aCCF patterns to differently resolved meteorological input data (temporal, spatial, and vertical variation). Based on this analysis, we provide recommendations regarding the level of complexity for such an advanced MET service. Additionally, sensitivity studies using meteorological data from different data products (i.e. archived historical forecast) are shown.

Acknowledgement: The current study has been supported by the following projects: CICONIA, which has received funding from the European Union under grant agreement no. 101114613, CONCERTO, which has received funding from the European Union under grant agreement no. 101114785 and the BMWK LuFo project D-KULT 20M2111A.


How to cite: Dietmüller, S., Matthes, S., Frömming, C., Peter, P., and Dahlmann, K.: Investigating periods and regions with large mitigation potential using algorithmic climate change functions , EGU General Assembly 2024, Vienna, Austria, 14–19 Apr 2024, EGU24-14735, https://doi.org/10.5194/egusphere-egu24-14735, 2024.

EGU24-14772 | Orals | AS3.25

Global model simulations on the impacts of aviation-induced aerosol on clouds and climate 

Mattia Righi, Johannes Hendricks, Christof Beer, and Sabine Brinkop

The current understanding of the impact of aviation-induced aerosol on the microphysical properties of clouds and the resulting climate effects is still regarded as highly uncertain. In this study, a global aerosol-climate model is applied to quantify (i) the impact of aviation-induced soot on cirrus clouds, and (ii) the impact of aviation-induced particles on low-level liquid-phase clouds. For the soot-cirrus effect, a radiative forcing in the range of −35 to 13 mW m−2 is simulated, depending on the assumed ice nucleating properties of aviation soot, but with a low statistical significance in several cases. A comparison with previous studies shows a general lack of consensus, which could not be reconciled even within the broad range of assumptions on the ice nucleating properties of aviation soot examined with the model. The effect of aviation-induced particles on low-level clouds results in a radiative forcing of –64 mW m-2 for present-day conditions in the CMIP6 emission inventory, and of –126 to –83 mW m-2 in 2050 under different scenarios. This mostly confirms the estimates of previous studies, although these are very sensitive to the assumed size distribution of emitted particles and to the fuel sulfur content of the aviation fleet. The main uncertainties behind these cloud effects are explored in the context of the existing literature and suggestions for refined estimates are discussed.

How to cite: Righi, M., Hendricks, J., Beer, C., and Brinkop, S.: Global model simulations on the impacts of aviation-induced aerosol on clouds and climate, EGU General Assembly 2024, Vienna, Austria, 14–19 Apr 2024, EGU24-14772, https://doi.org/10.5194/egusphere-egu24-14772, 2024.

EGU24-14794 | ECS | Orals | AS3.25

Aviation-induced aerosol particles within the UTLS: Properties and processing observed from the IAGOS-CARIBIC Flying Laboratory 

Christoph Mahnke, Rita Gomes, Ulrich Bundke, Marcel Berg, Helmut Ziereis, Monica Sharma, Mattia Righi, Johannes Hendricks, Andreas Zahn, and Andreas Petzold

The influence of aviation on atmospheric aerosol, its processing, and its implications for climate are still areas associated with significant uncertainties. We carried out an in-depth examination of the characteristics of atmospheric aerosols linked to aviation by analysing aircraft emissions observed during missions of the IAGOS-CARIBIC Flying Laboratory.

Equipped with a wide variety of aerosol and trace gas instrumentation, the IAGOS-CARIBIC Flying Laboratory conducted 42 operational flights on a Lufthansa Airbus A340-600 passenger aircraft from July 2018 to March 2020. These flights included routes from Munich, Germany, to various destinations in North America, South Africa, and East Asia. We developed and implemented a method to automatically identify aircraft exhaust plumes based on the 1 Hz resolved NOy and aerosol data sets. Between 2018 and 2020, this method identified over 1100 distinct aircraft plumes, offering a robust statistical foundation and global perspectives on aviation's influence on aerosol and trace gas characteristics. For each plume, the measured parameters were further divided into their respective background and plume excess values.

The analysis of the plume excess properties, such as the non-volatile aerosol fraction, shows similar characteristics independent of the emission altitude. Notably, the emitted aerosol predominantly existed as an external mixture in contrast to the mostly internally mixed background aerosol, even at a mean plume age of 1 to 3 hours. For the large accumulation mode particles (diameter > 250 nm) no enhancement above the background variability could be detected in the aircraft plume. Furthermore, we discuss the particle emission indices (EI's) derived from our aircraft plume analysis in comparison to the particle EI's used in global models and those reported from aircraft engine certification measurements.

How to cite: Mahnke, C., Gomes, R., Bundke, U., Berg, M., Ziereis, H., Sharma, M., Righi, M., Hendricks, J., Zahn, A., and Petzold, A.: Aviation-induced aerosol particles within the UTLS: Properties and processing observed from the IAGOS-CARIBIC Flying Laboratory, EGU General Assembly 2024, Vienna, Austria, 14–19 Apr 2024, EGU24-14794, https://doi.org/10.5194/egusphere-egu24-14794, 2024.

EGU24-14802 | ECS | Posters on site | AS3.25

A Morphological Algorithm for the Detection of Linear Contrails 

Nicolas Gourgue, Olivier Boucher, and Laurent Barthes

The climate impact of aviation can be separated into CO2 and non-CO2 effects, with the latter being potentially larger than the former. In this
context we are more specifically interested in condensation trails (hereafter contrails) and induced cirrus. Monitoring contrail formation and evolution is
necessary to understand their radiative effects and help the aviation industry to transition towards a more sustainable activity. Current research aimed at
detecting contrails is mostly based on geostationary satellite images because they allow to follow the contrail over a long period of time. However a major
shortcoming is that the formation phase of the contrails cannot be detected and larger, but older, contrails cannot always be attributed to the flights
that produced them. To circumvent the problem that satellite images do not have a sufficient resolution to observe the contrail formation phase, we
use a ground-based hemispheric camera with a two-minute sampling rate as a complementary source of information. As a first step, we have developed
a traditional morphological algorithm that will help preparing a sufficiently large labelled database as required to train a deep-learning algorithm. Our
algorithm aims to detect whether each aircraft that passes in the field of view of the camera (as monitored from an ADSB radar) produces a contrail or not. We are thus able to relate contrail formation and evolution with aircraft
type, flight altitude and weather conditions. We start by focusing on the young linear contrails that appears just behind the aircraft. We also consider
all weather conditions except completely cloudy conditions that prevents contrails to be observed. The algorithm combines various morphological
treatments to binarise the image and a linear Hough transform to identify straight lines in a direction close to the aircraft’s trajectory. Its performance is evaluated against a database that was manually annotated consisting of 400 images with 407 contrails. We find that our algorithm has a specificity
of 97%, i.e. there are few false detections, but its sensitivity is about 55%, i.e. it is missing a significant fraction of contrail appearances. Looking in
more details, the sensitivity is 60% in clear-sky contidions but only 40% in conditions of a thin high cloud cover with superimposed contrails. An
analysis of several years of contrail detection will be presented to determine precisely the fraction of contrail-producing flights and the associated weather
conditions with non-persistent and persistent contrails.

How to cite: Gourgue, N., Boucher, O., and Barthes, L.: A Morphological Algorithm for the Detection of Linear Contrails, EGU General Assembly 2024, Vienna, Austria, 14–19 Apr 2024, EGU24-14802, https://doi.org/10.5194/egusphere-egu24-14802, 2024.

Condensation trails (contrails) are considered the main non CO2 effect of aviation on global warming (Lee 2021) However, the uncertainty remains important and therefore a better understanding of the physical process underlying contrail formation is required. For a Jet A-1 kerosene fuel burned with a rich burn engine, the formation of contrails is mainly due to the condensation of water around soots emitted by the engine. In the case of Sustainable Aviation Fuels (SAF) or lean burn engines, the soots emitted are in very weak quantity so to let other nucleation process to occur (Kärcher 2018) such as homogeneous nucleation based on water and sulfuric acid (Rojo 2014). In order to perform contrail formation simulation with the details of the jet dilution due to the interaction between the plume and the aerodynamic of the aircraft, it is important to include the nucleation process strongly coupled with the aerodynamic in the simulation. This has been done for nucleation around soots (Khou 2016) but not for homogeneous nucleation. In this work, we propose a mix Lagrangian Eulerian approach in order to evaluate the homogeneous nucleation.

Lee D.S. et al., The contribution of global aviation to anthropogenic climate forcing for 2000 to 2018, Atmospheric Environment, 2021

Kärcher B, Formation and radiative forcing of contrail cirrus, Nature, 2018

Rojo C. et al., Impact of alternative jet fuels on aircraft-induced aerosols, Fuel, 2014

Khou JC. et al., CFD simulation of contrail formation in the near field of a commercial aircraft: Effect of fuel sulfur content, Atmospheric Chemistry, 2016

How to cite: Bonne, N.: A mix Lagrangian Eulerian approach for volatile particles and contrails formation, EGU General Assembly 2024, Vienna, Austria, 14–19 Apr 2024, EGU24-15562, https://doi.org/10.5194/egusphere-egu24-15562, 2024.

EGU24-16192 | ECS | Posters on site | AS3.25

Parametrizing the number of formed ice crystals in contrails from hydrogen combustion 

Josef Zink and Simon Unterstrasser

Hydrogen-powered aircraft have the potential to reduce CO2 emissions to zero. However, a significant portion of the global warming attributed to aviation arises from non-CO2 effects, including contrails. The thermodynamic state and microphysical pathways that form these contrails differ substantially between hydrogen and conventional kerosene combustion. Therefore, the overall climate impact of contrails formed by hydrogen combustion is not yet known and needs to be assessed by Global Circulation Models (GCMs). The contrail parametrization in a GCM cannot resolve the contrail formation processes. However, these early processes have a large influence on the contrail life cycle and should therefore be included in the contrail initialization of a GCM. Here, a crucial ingredient is the number of ice crystals formed during the jet phase.

In this study, we present a parametrization that provides a link between the outcome of a high-resolution model and the contrail initialization in a GCM. For that, we performed contrail formation simulations with the particle-based Lagrangian Cloud Module (LCM) in a box model approach. We assume that contrail droplets and ice crystals form solely on entrained ambient aerosols. With our simulation setup, we aim to cover the entire parameter space relevant for contrail formation in the case of hydrogen combustion. This involves varying background meteorological conditions, ambient aerosol properties, and engine exit conditions, resulting in more than 20,000 simulations.

The simulation results show that the number of formed ice crystals is mostly sensitive to a variation of the ambient aerosol background concentration, followed by a variation of the ambient temperature. We identify a parameter subspace where the number of ice crystals becomes almost independent of the size and chemical composition of the ambient aerosols.

Furthermore, we performed simulations with two coexisting background aerosol ensembles differing in mean size and/or solubility. The simulation results show that coarse mode particles have neither a direct nor an indirect influence on the number of formed ice crystals if their number concentration is 2-3 orders of magnitude lower than that of a coexisting Aitken/accumulation mode. Furthermore, the ice crystal number from simulations with the two coexisting background aerosol ensembles can be reconstructed by a weighted mean of two single simulations, each containing only one of the two aerosol ensembles. This allows to construct a simpler parametrization still covering the case of two coexisting aerosol ensembles.

We used the simulation results to train a shallow feed-forward neural network that maps the box model input parameters to the number of formed ice crystals. This neural network serves as a fit function of our simulation results, which can be implemented in a GCM for contrail initialization.

This work contributes to the collaborative effort of the German Aerospace Center (DLR) and Airbus in assessing the climate impact of H2 contrails.

How to cite: Zink, J. and Unterstrasser, S.: Parametrizing the number of formed ice crystals in contrails from hydrogen combustion, EGU General Assembly 2024, Vienna, Austria, 14–19 Apr 2024, EGU24-16192, https://doi.org/10.5194/egusphere-egu24-16192, 2024.

EGU24-16230 | Posters virtual | AS3.25

Source attribution modeling of PM2.5 and CO in Indore, India 

Suvarna Tikle, Idir Bouarar, Rajesh Kumar, and Guy Brasseur

Indore grapples with severe air quality challenges due to rapid urban development, posing significant public health risks. To investigate the source contributions, it is vitally important to distinguish the contribution of local emissions and regional emissions. This study employs the WRF-Chem model in tracer mode to discern the contributions of PM2.5 and CO emissions from diverse regions over Indore, India. We identify the different high-emission contributing local and transboundary 25 regions and sources of particulate matter and CO emissions in Indore using WRF-Chem model during 2019.  The model utilizes a two-domain configuration. Model simulations successfully capture the spatial distributions of key meteorological parameters over the domain when compared to various datasets such as IMERG, MOPITT, and ERA5.  Results reveal that CO anthropogenic sources, both local and transported across domain boundaries, significantly contribute to concentrations in Indore. While the general spatial distribution of simulated CO aligns with MOPITT, simulated values are comparatively lower due to the exclusion of secondary sources and biogenic emissions. PM2.5 in Indore itself is a main source of emissions with contributions exceeding 16% throughout the year, whereas biomass burning emerges as the primary source of PM2.5 during specific months, with a consistent contribution observed throughout the year within the Indore district boundary. From an effective mitigation strategy perspective, further, we have combined local emissions and CAMS emissions in the model for the quantification of various pollutants over the Indore region.  We estimated the various sectoral contributions from residential, industry, transport, DG sets, eateries, brick kilns, and crematoriums with high spatial resolution using Weather Research and Forecasting with a Chemistry model.

How to cite: Tikle, S., Bouarar, I., Kumar, R., and Brasseur, G.: Source attribution modeling of PM2.5 and CO in Indore, India, EGU General Assembly 2024, Vienna, Austria, 14–19 Apr 2024, EGU24-16230, https://doi.org/10.5194/egusphere-egu24-16230, 2024.

EGU24-16254 | Orals | AS3.25

Observing links between lifetimes of satellite detectable contrails and aircraft type 

Edward Gryspeerdt, Marc Stettler, Roger Teoh, Ulrike Burkhardt, Toni Delovski, and David Painemal

Clouds produced by aircraft (contrails) are responsible for over half of the positive radiative forcing from aviation, leading to the proposal of contrail avoidance as a method for mitigating the climate impact of aviation. This requires accurate prediction of the radiative properties of individual contrails, which themselves are highly dependent on the contrail microphysical properties, lifetime and macrophysical evolution along with the background atmospheric state.  In-situ observations have also shown an impact of the generating aircraft and its fuel type on the properties and evolution of contrails. However, these observations are typically made close to the aircraft, with fewer observational constraints for the properties of the longer-lived contrails that drive the majority of the radiative forcing.

Coupling satellite observations of contrails with flight data, we track contrails formed by individual aircraft over the North Atlantic. We find a strong link between aircraft type and contrail lifetime, with newer, more fuel-efficient aircraft forming longer-lived contrails. This relationship is not driven by the aircraft properties, but rather by operational differences in aircraft flight patterns, with the newer types flying higher in this region and so producing contrails with longer lifetimes. We present some encouraging initial evidence of reductions in aircraft soot emissions affecting contrail lifetime.

How to cite: Gryspeerdt, E., Stettler, M., Teoh, R., Burkhardt, U., Delovski, T., and Painemal, D.: Observing links between lifetimes of satellite detectable contrails and aircraft type, EGU General Assembly 2024, Vienna, Austria, 14–19 Apr 2024, EGU24-16254, https://doi.org/10.5194/egusphere-egu24-16254, 2024.

Aviation outflow is the only anthropogenic source of pollution that is directly emitted into the upper troposphere and potentially alters cloud patterns by creating linear contrails. These contrail cirrus formations can either increase high-cloud cover in supersaturated, cloud-free air or modify the microphysics of existing natural cirrus clouds. Despite the likelihood of aircraft intersecting natural cirrus, the extent of their impact remains uncertain.

Our study interests using the ICON_NWP model, integrated with a two-moment cloud microphysical scheme, to simulate contrail formation and dynamics. Central to this research is examining how aviation aerosols and emitted water vapor influence contrail development within already existing cirrus clouds.

The number of surviving nucleated ice crystals after the jet phase depends on engine and fuel parameters as well as on the ambient atmosphere (Kärcher et al 2015) and displays large regional variation (Bier & Burkhardt, 2019).  Bier and Burkhardt (2022) demonstrated that the concentration of ice crystals after the jet phase varies, ranging in terms of ice particle concentrations from 160 to 200 cm-3 over the North Pacific.

We assume a suggestive fixed-wing span of 50 meters, typical of aircrafts such as Airbus 300 and Boeing 737, correlating to a water vapor emission rate of 10 g per meter of flight. In our simulations, contrail formation is initiated at 450 seconds, marking the end of the vortex phase. Beyond this point, the remaining ice crystals are predominantly influenced by atmospheric conditions. Within each grid box, our initial step involves assessing the critical contrail temperature according to the Schmidt-Appleman criterion. Depending on whether these criteria are met, we then proceed to either introduce ice crystals or add the corresponding amount of water vapor.

Ultimately, we compare our simulation results with corresponding aircraft data, utilizing the DARDAR-NICE dataset that offers height-resolved measurements within cirrus clouds, to validate the imprints of aircraft emissions.

How to cite: Marjani, S. and Quaas, J.: Exploring the Interaction between Aircraft Emissions and Cirrus Clouds: Through Simulation Techniques and Satellite retrievals, EGU General Assembly 2024, Vienna, Austria, 14–19 Apr 2024, EGU24-16260, https://doi.org/10.5194/egusphere-egu24-16260, 2024.

EGU24-16300 | ECS | Posters on site | AS3.25

High-resolution modelling of contrails formed behind hydrogen-powered aircraft 

Annemarie Lottermoser and Simon Unterstraßer

The effort to make aviation more climate-friendly requires to develop new propulsion technologies in comparison to the conventional kerosene combustion engines. Hydrogen (H2) combustion is seen as a promising, green alternative. Assessing the climate impact of contrails, which is a major contribution to the aviation’s non-C02 effects, is an essential part of developing climate-friendly aviation. Our study investigates the properties of contrails behind H2-powered aircraft, in particular in comparison to conventional contrails from kerosene combustion. For this, high-resolution simulations of individual contrails over their full lifecycle are performed employing the established EULAG-LCM model (a large-eddy simulation (LES) model with fully coupled particle-based ice microphysics). Young contrails and their interaction with the wake vortices are simulated as well as their transition into contrail-cirrus over time periods of several hours.

Recent simulations of contrail formation behind engines with H2 combustion have shown that the number of created ice crystals is smaller than in conventional contrails, as the exhaust plumes are expected to be void of soot particles, on which contrail ice crystals typically form.
Previous simulations of the early contrail evolution during the vortex phase and the contrail-cirrus evolution have been performed for a broad parameter space regarding variations in meteorological and aircraft-related quantities. However, these simulations were restricted to contrails from conventional kerosene combustion.

In order to investigate the influence of a H­2 propulsion system on the contrail evolution, two input parameters are adapted: The amount of emitted water vapour is larger and the number of initial ice crystals is smaller.  Moreover, we extend our set of atmospheric scenarios to higher ambient temperatures, as H2 contrails can form in warmer environments where ice crystal formation in kerosene plumes does not occur.

We explore the H2 contrail evolution for different idealised atmospheric scenarios. It is well-known that young contrails are strongly affected by the trailing wake vortices and a substantial fraction of the initially formed ice crystals can get lost due to adiabatic heating in the descending vortex pair. We clearly see that this ice crystal loss is reduced if fewer ice crystals are present in the beginning. On the other hand, ice crystal loss is more substantial for ambient temperatures above 225K.
Looking at the aged contrail-cirrus, we investigate in particular the evolution of the total extinction, which we assume to be a proxy of a change in the contrail climate impact. We observe that the initially prescribed ice crystal number, ambient temperature and relative humidity have a strong impact on the contrail lifecycle. Increasing the water vapour emission is, however, of secondary importance.

The total extinction of H2 contrails is significantly lower than in the case of kerosene contrails. Hence, our simulations suggest that the usage of H2 combustion as propulsion technology might strongly reduce the climate impact of a single contrail.

This work contributes to the collaborative effort of the German Aerospace Center (DLR) and Airbus in assessing the climate impact of H2 contrails.

How to cite: Lottermoser, A. and Unterstraßer, S.: High-resolution modelling of contrails formed behind hydrogen-powered aircraft, EGU General Assembly 2024, Vienna, Austria, 14–19 Apr 2024, EGU24-16300, https://doi.org/10.5194/egusphere-egu24-16300, 2024.

EGU24-16759 | ECS | Posters on site | AS3.25 | Highlight

Mitigation potential of optimized aircraft trajectories and its dependency on weather patterns 

Federica Castino, Feijia Yin, Volker Grewe, and Hiroshi Yamashita

The climate impact of a flight is determined not only by the amount of aircraft emissions, but also by the time, location, and specific weather conditions at which such emissions occur. As a result, there is the potential of mitigating the climate impact of a flight by optimizing its trajectory. This operational strategy presents trade-offs between minimizing the climate impact from carbon dioxide (CO2), which only depends on the amount of emitted CO2, and minimizing the so-called non-CO2 effects of aviation, due to the radiative forcing from contrails and contrail cirrus, the perturbation of atmospheric concentrations of ozone and methane caused by NOx emissions, and H2O emissions at high flight levels. Moreover, operating costs and climate impact are expected to be conflicting objectives for trajectory optimization (Grewe et al., 2014). The characteristics of the sets of Pareto optimal solutions resulting from such multi-objective optimizations would, however, vary under different atmospheric conditions.

To compare the benefits and costs associated to this operational strategy under different weather patterns, we use the air traffic simulator AirTraf, which optimizes aircraft trajectories based on the atmospheric fields computed by the ECHAM/MESSy Atmospheric Chemistry (EMAC) model (Yamashita et al., 2020). This modelling chain presents the advantage of enabling the analysis of optimized aircraft trajectories over a large number of consecutive days, identifying preferred compromise solutions between multiple optimization objectives (Castino et al., 2023). In the present study, we consider four winter and four summer seasons between 2015 and 2019, optimizing 100 flights over the North Atlantic Corridor (NAC) on each simulation day. Subsequently, we compare trajectories minimizing different objective functions, including fuel used, and the potential formation of contrails along the trajectory. We classify the weather patterns by comparing their similarity to the positive and negative phases of the North Atlantic Oscillation (NAO) and East Atlantic (EA) patterns, applying the methodology  presented by Irvine et al. (2013). As a result, we can identify which conditions are correlated to a larger potential of mitigating the climate impact of our air traffic sample, e.g., by reducing the formation of persistent contrails.

Acknowledgment: This research has received funding from the Horizon Europe Research and Innovation Actions programme under Grant Agreement No 101056885.

References:

  • Irvine, E. A., et al.: Characterizing North Atlantic weather patterns for climate-optimal aircraft routing, Meteorological Applications, 20, 80 – 93, https://doi.org/10.1002/met.1291, 2013.
  • Grewe, V., et al.: Reduction of the air traffic's contribution to climate change: A REACT4C case study, Atmospheric Environment, 94, 616 – 625, https://doi.org/10.1016/j.atmosenv.2014.05.059, 2014.
  • Yamashita, H., et al.: Newly developed aircraft routing options for air traffic simulation in the chemistry–climate model EMAC 2.53: AirTraf 2.0, Geoscientific Model Development, 13, 4869 – 4890, https://doi.org/10.5194/gmd-13-4869-2020, 2020.
  • Castino, F., et al.: Decision-making strategies implemented in SolFinder 1.0 to identify eco-efficient aircraft trajectories: application study in AirTraf 3.0, Geosci. Model Dev. Discuss. [preprint], https://doi.org/10.5194/gmd-2023-88, in review, 2023.

How to cite: Castino, F., Yin, F., Grewe, V., and Yamashita, H.: Mitigation potential of optimized aircraft trajectories and its dependency on weather patterns, EGU General Assembly 2024, Vienna, Austria, 14–19 Apr 2024, EGU24-16759, https://doi.org/10.5194/egusphere-egu24-16759, 2024.

EGU24-17410 | ECS | Posters on site | AS3.25

Towards an improved treatment of (semi) volatile particle activation in contrail models 

Joel Ponsonby, Roger Teoh, and Marc Stettler

Contrails are estimated to account for the majority of the present-day warming by the aviation industry. Their formation relies on the availability of aerosol in the exhaust plume, upon which water vapour can condense and subsequently freeze to form contrail ice crystals Most modern aircraft operate in the soot-rich regime, releasing soot particles with a number emission index (EIn) of between 1014 and1016 (kg-fuel)-1. Under these conditions, the number concentration of soot particles and contrail ice crystals scales linearly. For this reason, existing global contrail simulations typically assume that the number concentration of ice crystals and soot particles are equivalent. However, the use of alternative fuels such as sustainable aviation fuel (SAF) and liquid hydrogen, and the adoption of cleaner lean-burn combustors in the existing fleet are likely to drive the soot EIn into the soot-poor regime < 1013 (kg-fuel)-1. Here, (semi) volatile material and entrained ambient particles can compete with soot for plume supersaturation and the relationship between the number concentration of soot particles and contrail ice crystals is non-linear. These effects are not currently accounted for in existing contrail models used to simulate regional and global contrail climate forcing.  

In this work, we extend the parcel model proposed by Kärcher et al. [1] to account for the activation of volatile particulate matter (vPM) in the soot-poor regime and integrate this into the contrail cirrus prediction model (CoCiP) [2]. We explore the relationship between the soot EIn and the apparent ice emissions index (AEI) in the soot-rich and soot-poor regimes, evaluating the model’s sensitivity to different aerosol properties, including particle hygroscopicity and characteristics of the particle size distribution. Preliminary results show a linear relationship between the soot EIn and AEI in the soot-rich regime, consistent with previous work [1]. However, in the soot-poor regime, the AEI: (i) could be up to two orders of magnitude larger than the soot EIn; (ii) increases with decreasing ambient temperatures and (iii) depends on the assumed particle properties of the (semi) volatile and ambient particle modes. These results suggest that existing global contrail simulations may underestimate the contrail climate forcing for a small subset of flights with soot EIn < 1014 (kg-fuel)-1.

The model developed in this work will be implemented in a global contrail simulation, incorporating activation of vPM. A sensitivity analysis will also be performed, and the results validated with in-situ measurements from the recent Emissions and Climate Impact of Alternative Fuels (ECLIF) III experimental campaign [3].

References

[1] Bernd Kärcher et al., Journal of Geophysical Research: Atmospheres, 2015, 120, 7893–7927.

[2] Ulrich Schumann, Geoscientific Model Development, 2012, 5, 43–580.

[3] Raphael Märkl et al., [EGUsphere preprint].

How to cite: Ponsonby, J., Teoh, R., and Stettler, M.: Towards an improved treatment of (semi) volatile particle activation in contrail models, EGU General Assembly 2024, Vienna, Austria, 14–19 Apr 2024, EGU24-17410, https://doi.org/10.5194/egusphere-egu24-17410, 2024.

EGU24-17420 | ECS | Orals | AS3.25

The role of the host climate model in quantifying the contrail cirrus climate impact 

Weiyu Zhang, Alexandru Rap, Kwinten Van Weverberg, Kalli Furtado, Wuhu Feng, Cyril Morcrette, and Piers Forster

Aviation currently makes a 3.5% contribution to the anthropogenic effective radiative forcing of climate. The largest component of this forcing comes from contrail cirrus, estimated to be 2 times larger than the contribution from aviation CO2 emissions. However, there is still a large uncertainty (i.e. ~70%) in the contrail cirrus effective radiative forcing (ERF) estimates according to the latest aviation climate impact assessment.

Here we implement the existing contrail parameterisation developed for the Community Atmosphere Model version 6 (CAM6) in the atmospheric component of the UK Earth System Model (UKESM), i.e. the Unified Model (UM). By analysing and comparing the results from both models, we are able to isolate and investigate for the first time how key features of the host climate model is affecting our ability to accurately quantify the contrail climate impacts.

We show that differences in background humidity (particularly ice supersaturation) in the two climate models lead to substantial differences in the simulated contrail fractions, with UM values being 2-3 times larger than those from CAM6. We also find contrasting responses in overall global cloud cover due to air traffic, with contrails causing increases and decreases in total cloud fraction in the UM and in CAM6, respectively. The different complexity of the two models’ cloud schemes (i.e. single and double moment cloud scheme in UM and CAM6, respectively) results in substantial differences in the simulated contrail-driven changes in cloud ice water content. However, if we account for this difference in cloud scheme complexity by scaling the simulated UM contrail cirrus optical depth to match existing estimates, the contrail cirrus ERFs simulated by the two models are comparable.

To conclude, the large dependence of the simulated contrail cirrus climate impact on the host climate model highlights the need for improved evaluations of the key model microphysical and radiative processes.

How to cite: Zhang, W., Rap, A., Van Weverberg, K., Furtado, K., Feng, W., Morcrette, C., and Forster, P.: The role of the host climate model in quantifying the contrail cirrus climate impact, EGU General Assembly 2024, Vienna, Austria, 14–19 Apr 2024, EGU24-17420, https://doi.org/10.5194/egusphere-egu24-17420, 2024.

EGU24-17462 | Posters on site | AS3.25

Update of Climate Change Functions and comparison with algorithmic Climate Change Functions 

Christine Frömming, Sigrun Matthes, Simone Dietmüller, Patrick Peter, Volker Grewe, Katrin Dahlmann, and Patrick Jöckel

Strategic planning of climate-optimal flight trajectories is one option to potentially reduce the climate impact of non-CO2 aviation emissions. Such a measure builds upon detailed knowledge of climate response to aviation emissions at specific locations. So-called climate change functions (CCFs) were calculated by means of a Lagrangian approach within the atmospheric chemistry climate model system EMAC (ECHAM5/MESSy Atmospheric Chemistry Model) to provide this information. The CCFs contain temporally and spatially resolved information on the climate effect of standardized non-CO2 aviation emissions, such as water vapour, nitrogen oxides, and effects of contrail cirrus. The initial CCFs were calculated for three specific summer and five winter weather situations covering the Northern Atlantic flight corridor (Frömming et al., 2021).

The present study (Frömming et al., in prep) describes updates over previous CCF calculations. These include the geographical expansion of the CCF domain from the Northern Atlantic towards EU and USA, the calculation of CCFs for a weather situation in spring, a higher spatial resolution for contrail CCFs, employing nudged climate model simulations enabling the comparison with observations, a consistent methodology for instantaneous to adjusted radiative forcing conversion, a more sophisticated choice of future emission scenario and the inclusion of efficacies.

As the calculation of CCFs demands very high computational effort, they cannot be used for operational eco-efficient flight planning. For that reason, more generally applicable algorithmic Climate Change Functions (aCCFs) were derived (van Manen and Grewe, 2019; Yin et al., 2023) based on statistics of weather-related similarities within the CCFs. The aCCFs require only a small number of local meteorological parameters taken from numerical weather forecast models and represent a fast methodology to predict the specific climate impact per unit emission for a certain location, altitude and time.

Since the new CCFs are located partially outside the initial aCCF domain and time, an independent comparison of CCFs and aCCFs is performed. Results indicate that, depending on species, particular attention is required, when aCCFs - developed for winter and summer - are transferred to other seasons, e.g. spring, when midlatitudes might be influenced by polar airmasses. Further studies expanding the spatial and temporal domains of CCFs appear necessary.

References:

Frömming, C., Grewe, V., Brinkop, S., Jöckel, P., Haslerud, A. S., Rosanka, S., Van Manen, J., and Matthes, S.: Influence of weather situation on non-CO2 aviation climate effects: The REACT4C climate change functions, ACP, 21, 9151 – 9172, 2021.

van Manen, J. and Grewe, V.: Algorithmic climate change functions for the use in eco-efficient flight planning, Transportation Research Part D: Transp. Env., 67, 388–405, 2019.

Yin, F., Grewe, V., Castino, F., Rao, P., Matthes, S., Dahlmann, K., Dietmüller, S., Frömming, C., Yamashita, H., Peter, P., et al.: Predicting the climate impact of aviation for en-route emissions: the algorithmic climate change function submodel ACCF 1.0 of EMAC 2.53, GMD, 16, 3313–3334, 2023.

Frömming, C., Matthes, S., Dietmüller, S., Peter, P., Grewe, V., Dahlmann, K., Jöckel., P., Geographical extension and refinement of Climate Change Functions: AIRTRAC.Vxy (included in EMAC-MESSy d2.52), GMD, in prep.

How to cite: Frömming, C., Matthes, S., Dietmüller, S., Peter, P., Grewe, V., Dahlmann, K., and Jöckel, P.: Update of Climate Change Functions and comparison with algorithmic Climate Change Functions, EGU General Assembly 2024, Vienna, Austria, 14–19 Apr 2024, EGU24-17462, https://doi.org/10.5194/egusphere-egu24-17462, 2024.

EGU24-17467 | Orals | AS3.25

Assessing climatic impacts of shipping fuels: integrating MariTeam emission inventories with Earth system modeling  

Helene Muri, Diogo Kramel, and Anders Hammer Strømman

Shipping plays a substantial role in global anthropogenic emissions and is a particularly challenging sector to decarbonize. COP28 emphasized the urgent need for accelerated emissions reduction in such sectors, and the IMO has a net-zero goal for 2050. Hence tools such as the MariTeam model presented here are essential in order to understand not only current emissions from shipping, but also the effect of decarbonization efforts like alternative fuels. The MariTeam model, a high-resolution AIS-based ship emission model, emerges as a crucial tool. It goes beyond merely assessing current shipping emissions, delving into the impact of decarbonization strategies, such as alternative fuels. 

Utilizing ship technical data, including engine size and vessel dimensions, MariTeam calculates emissions for various species like CO2, CH4, N2O, BC, OC, CO, NOx, and SOx on a global scale. Our presentation includes a comprehensive inventory of current shipping emissions in addition to the changes when alternative fuels are introduced. 

To understand the climate effects, we employed the Norwegian Earth System Model (NorESM), coupled with MariTeam. Notably, shipping emissions lead to significant pollutant transport, particularly black carbon (BC) to the Arctic, with a 40% surface concentration increase, with the potential to accelerate cryosphere melt. Current shipping emissions are also found to mask global warming, impacting multiple aspects of the climate system. When exploring alternatives like blue ammonia and LNG, methane and nitrous oxide gain significance. Our results emphasize the importance of considering well-to-wake versus tank-to-wake, indicating the complexities when considering mitigation efforts for the shipping sector. 

How to cite: Muri, H., Kramel, D., and Strømman, A. H.: Assessing climatic impacts of shipping fuels: integrating MariTeam emission inventories with Earth system modeling , EGU General Assembly 2024, Vienna, Austria, 14–19 Apr 2024, EGU24-17467, https://doi.org/10.5194/egusphere-egu24-17467, 2024.

EGU24-17795 | Posters on site | AS3.25

Soils and surface waters are secondary sources of polycyclic aromatic compounds 

Gerhard Lammel, Benjamin A. Musa Bandowe, Pernilla Bohlin-Nizzetto, Céline Degrendele, Anne Karine Halse, Minas Iakovides, Petr Kukučka, Marios Kyprianou, Jakub Martiník, John Mwangi, Barbora Palátová Nežiková, Petra Přibylová, Roman Prokeš, Milan Sáňka, Jaromir Sobotka, Jakub Vinkler, Marco Wietzoreck, Ulrich Pöschl, Euripides G. Stephanou, and Manolis Tsapakis and the PAC air-surface exchange

Polycyclic aromatic hydrocarbons (PAHs) in the atmospheric environment are almost exclusively formed in combustion processes. Oxygenated and nitrated PAHs are co-emitted with parent PAHs from fossil fuel and biomass combustion processes, and many are formed in photochemical and microbiological reactions of PAHs in air and soil. As semivolatiles resisting biodegradation in soils and surface waters to some extent, polycyclic aromatic compounds (PACs) i.e., PAHs and their derivatives, can be subject to re-volatilisation., which may turn soils and surface waters from sinks into secondary sources and enhances the long-range transport potential of PACs by multihopping (grasshopper effect). The significance of these secondary sources for PAC abundances in ambient air is unknown and is not accounted for in emission inventories. Gaps in PAH emission inventories have been indicated by field studies in various countries.

We determined the concentrations of 15 parent, 10 oxygenated and 17 nitrated PAHs in air and soils at a rural and near-coastal northern European site and a central European rural background site, and in air and surface seawater at two off-shore sites in the eastern Mediterranean and along NW-SE transects in the Mediterranean. Directions of air-soil and air-sea exchanges were derived from the substances’ fugacities.

At the central European site, a number of 2-4 ring PACs were found to volatilise from grassland and more from forest soils in summer, and much less in winter. Conversely, at the receptor site in northern Europe, net deposition of PACs prevails and re-volatilisation occurs only sporadically. In the Mediterranean, 3-4 ring PAHs and dibenzofuran are found to volatilise in most seasons.

Existing data on air-surface exchange of PACs is notably scarce, and methodological uncertainties persist in quantifying air-soil exchange. As very little is known about the spatial and seasonal distributions of PACs soil burdens and net mass fluxes, an assessment of the significance of soils and surface waters as secondary sources of PACs in the air of source and receptor areas is not possible.


How to cite: Lammel, G., Bandowe, B. A. M., Bohlin-Nizzetto, P., Degrendele, C., Halse, A. K., Iakovides, M., Kukučka, P., Kyprianou, M., Martiník, J., Mwangi, J., Palátová Nežiková, B., Přibylová, P., Prokeš, R., Sáňka, M., Sobotka, J., Vinkler, J., Wietzoreck, M., Pöschl, U., Stephanou, E. G., and Tsapakis, M. and the PAC air-surface exchange: Soils and surface waters are secondary sources of polycyclic aromatic compounds, EGU General Assembly 2024, Vienna, Austria, 14–19 Apr 2024, EGU24-17795, https://doi.org/10.5194/egusphere-egu24-17795, 2024.

EGU24-18183 | Posters on site | AS3.25

Estimating the Climate Efficacy of Contrail Cirrus on Surface Temperature 

Marius Bickel, Michael Ponater, Ulrike Burkhardt, Mattia Righi, Johannes Hendricks, and Patrick Jöckel

So far, the various components contributing to the global climate impact of aviation were mostly quantified and ranked on the basis of radiative forcings. However, regarding for example the Paris Agreement, the temperature change at Earth’s surface is the main target parameter, for which radiative forcing is only a proxy. A specific climate sensitivity parameter for contrail cirrus has, so far, not been established.

Here we close this gap for contrail cirrus with specially designed global climate model simulations, equipped with a coupled mixed layer ocean to determine the corresponding surface temperature change. For the first time the climate sensitivity and efficacy parameters were calculated for contrail cirrus. The efficacy of contrail cirrus to warm the Earth’s surface is found to be 62% smaller compared to CO2 in the effective radiative forcing framework. That means that radiative forcings of same magnitude result in a much weaker surface warming for contrail cirrus than for CO2. The origin of the reduced efficacy can be explained in detail by analyzing the related Feedback processes. An opposing response of the natural clouds (even in sign), with decreasing resp. increasing low- and mid-level clouds in case of CO2 resp. contrail cirrus was found to be the main reason. In addition, a more negative Lapse-Rate Feedback was found for contrail cirrus, originating from a non-homogeneous vertical warming, with the largest temperature increase directly below contrail cirrus and decreasing in strength toward Earth’s surface.

The reduced contrail cirrus efficacy substantially affects contrail cirrus mitigation concepts when using climate metrics based on surface temperature change (e.g. GTP or ATR). Therefore, re-routing aiming for contrail cirrus reduction, but leading to an increased fuel consumption and additional CO2 emissions might be much less effective than currently assumed.

How to cite: Bickel, M., Ponater, M., Burkhardt, U., Righi, M., Hendricks, J., and Jöckel, P.: Estimating the Climate Efficacy of Contrail Cirrus on Surface Temperature, EGU General Assembly 2024, Vienna, Austria, 14–19 Apr 2024, EGU24-18183, https://doi.org/10.5194/egusphere-egu24-18183, 2024.

EGU24-18334 | Orals | AS3.25

Future global temperature impact of global aviation in ICAO scenarios 

Borgar Aamaas, Marianne T. Lund, Jan S. Fuglestvedt, Anna Totterdill, David S. Lee, and Bethan Owen

We model the global temperature change due to global aviation based on the recently developed International Civil Aviation Organization (ICAO) Long Term Aspirational Goal (LTAG) emissions scenarios. ICAO has produced four different “scenarios”, including a baseline scenario with frozen technology and three “integrated scenarios” with varying levels of in-sector CO2 reductions from technology and operational improvements and including different fuel mixes. Aviation activity leads to a mix of long-lived CO2 effects and several short-lived effects. Our analysis includes CO2, contrails/cirrus, NOx, water vapor, and black carbon. The non-CO2 emissions and activity are developed in this study to be consistent with each of the ICAO CO2 scenarios.

We combine these fuel and emission data with recent knowledge on radiative forcing, including uncertainties. By using the simple climate model CICERO-SCM, we model the change in global temperature until 2100 given the different scenarios. We will show how scenario range, uncertainty in RF, effect of background conditions, and uncertainties in other parameter choices impact the temperature calculations. For NOx, we include scenarios that account for the effect of background NOx emissions. We also compile CO2 emission aviation scenarios available in the literature from the past decade and compare these with ICAO’s.

Our results confirm the temperature impact of the aviation sector estimated by other studies, but also show large uncertainties. When accounting for the impact of aviation NOx being dependent on the background conditions, we find a large variation in global temperature change based on what SSP is used as background. While NOx emissions from aviation will likely grow according to the ICAO scenarios, global emissions of NOx are declining in the SSPs, making this issue important to study further. With a growing share of SAF and LH2 in the fuel mix, we also observe a large range in temperature impact accounting for the literature range on contrail formation for different types of fuels.

Our overarching study shows that better understanding is needed to more robustly estimate the climate impact of aviation, including estimating RF of non-CO2 and in going from aviation activity to RF from contrails for different types of fuels.

How to cite: Aamaas, B., Lund, M. T., Fuglestvedt, J. S., Totterdill, A., Lee, D. S., and Owen, B.: Future global temperature impact of global aviation in ICAO scenarios, EGU General Assembly 2024, Vienna, Austria, 14–19 Apr 2024, EGU24-18334, https://doi.org/10.5194/egusphere-egu24-18334, 2024.

EGU24-18806 | Posters on site | AS3.25

Advancing understanding on aviation's non-CO2 climate effects through combination of numerical modelling and observations: ACACIA 

Sigrun Matthes, Nicolas Bellouin, Irene Dedoussi, Jan Fuglestvedt, Klaus Gierens, Didier Hauglustaine, Zamin Kanji, Martina Krämer, David Lee, Ulrike Lohmann, Andreas Petzold, Johannes Quaas, Mattia Righi, and Bernadett Weinzierl

Non-CO2 emissions contribute to climate effects from aviation in the same order of magnitude as carbon dioxide (CO2) emissions. However, the non-CO2 effects, comprising e.g., ozone and methane induced from NOx emissions, together with contrails, or the indirect aerosol effects, are associated with much larger uncertainties. The EU Aeronautics project ACACIA (Advancing the SCience for Aviation and ClimAte) explored the climate impacts of non-CO2 effects which show a strong dependence on atmospheric conditions and synoptic situation. While CO2 and non-CO2 effects in general introduce a warming effect for climate change, some indirect effects might result in a relatively large cooling.

ACACIA investigated indirect aerosol effects comprising formation and properties of clouds. Atmospheric conditions for the formation of long-lived contrails have been investigated, with the aim to improve their predictability. Indirect effects of nitrogen oxide emissions on atmospheric ozone and methane have been estimated, using a set of global chemistry-climate models. These different effects have been brought to a common scale by various physical climate metrics. A dedicated study on prevailing uncertainties has been performed, with the goal to provide robust recommendations considering uncertainties of individual estimates. Together with the numerical studies a dedicated analysis of existing measurement data has been completed in order to identify needs and requirements for atmospheric observations.

To this end, ACACIA brought together research across scales, from plume to global scale, from laboratory experiments to global models resulting in a series of scientific publications, and it proceeds from fundamental physics and chemistry to the provision of recommendations for policy, regulatory bodies, and other stakeholders in the aviation business. 

Acknowledgements This project ACACIA (Advancing the scienCe for Aviation and ClImAte) receives funding from the European Union’s Horizon 2020 research and innovation programme under grant agreement No 875036. High performance supercomputing resources were used from the German DKRZ Deutsches Klimarechenzentrum Hamburg.

How to cite: Matthes, S., Bellouin, N., Dedoussi, I., Fuglestvedt, J., Gierens, K., Hauglustaine, D., Kanji, Z., Krämer, M., Lee, D., Lohmann, U., Petzold, A., Quaas, J., Righi, M., and Weinzierl, B.: Advancing understanding on aviation's non-CO2 climate effects through combination of numerical modelling and observations: ACACIA, EGU General Assembly 2024, Vienna, Austria, 14–19 Apr 2024, EGU24-18806, https://doi.org/10.5194/egusphere-egu24-18806, 2024.

EGU24-19573 | ECS | Orals | AS3.25

A new approach for the bottom-up calculation of global road transport emissions 

Isheeka Dasgupta, Mario Feinauer, Nina Thomsen, Jens Hellekes, and Simone Ehrenberger

Road transport is responsible for two-thirds of transport related greenhouse emissions. To assess the impact of road transport on climate change, different model approaches have been applied. For global emissions, integrated assessment models (IAMs) have been established to asses the impact of different sectors on climate change. IAMs are capable of linking technical and socioeconomic development as well as policy decisions to emission scenarios. However, they offer limited differentiation in analyzing specific subsectors, transport modes, countries, or vehicle technologies. To address this gap, our aim is to calculate emissions from different road transport modes bottom-up for various world regions for the reference year 2019.

The established models for determining transport activities and emissions consider different transport modes like passenger car, various truck classes, and two- and three-wheelers. Drivetrain and country specific emission factors are derived and subsequently aggregated according to the stock fleet in 2019. Different approaches and data sources are considered for estimating the drivetrain specific emission factors of each country analyzed. For giving a comprehensive overview of emissions, twenty species have been calculated, including CO2, CH4, CO, N2O, NMVOC, NO2, PM10, PM2.5, SO2 etc. Additionally, non-exhaust emissions have been analyzed. In this paper, we present the methodology and results of the emission calculations for the reference year 2019.

Regarding the passenger car transport activity, the data for 2019 is determined based on historical motorization rates for representative countries. Gompertz functions are estimated that represent the relationship between economic development and car ownership. The result is motorization rates in number of cars per 1000 inhabitants for each country. Together with population data, average annual mileages per vehicle and occupancy rates, the annual car traffic demand is calculated. The transport performance of the 2- and 3-wheeler, rail and bus modes is calculated in relation to car transport performance on the basis of modal split assumptions.

For the commercial vehicles, less statistical data is available. Therefore, for non-OECD countries where the transport activity in ton-km is not available, a similarity analysis has been performed to derive an approximate behavior. The 2019 commercial transport activity was mapped using fixed effects models. Data up to 2013 was used as training data for the regression. In order to obtain modeled results, economic and population data from 2019 was used in the model.

For the spatial distribution of emissions, a new approach based on traffic data counts is presented. This enables a more precise allocation of emissions, which is important for certain pollutants. With this approach, we achieve a spatial resolution of 0.1°.

The resulting emission inventory for road transport provides additional information of uncertainty factors along the entire modelling chain and allows a detailed evaluation of the results for climate modelers and practitioners. Moreover, the models developed in with this approach allow the creation of scenarios for the future trend for road traffic emissions. These scenarios can take into account specific technological developments and measures for individual modes of transport and countries.

How to cite: Dasgupta, I., Feinauer, M., Thomsen, N., Hellekes, J., and Ehrenberger, S.: A new approach for the bottom-up calculation of global road transport emissions, EGU General Assembly 2024, Vienna, Austria, 14–19 Apr 2024, EGU24-19573, https://doi.org/10.5194/egusphere-egu24-19573, 2024.

EGU24-19733 | ECS | Posters virtual | AS3.25

Brake and Tire Emission Analysis with the Zero-Emission-Drive-Unit-Demonstrator for Battery Electric Vehicles 

Sven Reiland, Franz Philipps, and Lukas Arens

Within the scope of the ZEDU1 (Zero Emission Drive Unit Generation 1) project, both a conventional electric vehicle as a reference model and a prototype of the Zero Emission Drive Unit were developed for measurement characterizations. Concurrently with the demonstrator development, examinations of cast iron and hard-coated brake discs were conducted under real operating conditions and on test benches. Special attention was paid to the influence of recuperation on the airborne particle emissions from the brakes. Advanced on-board measurement methods were developed and effectively utilized.

The results highlight that the brake temperature significantly influences particle generation in the range of 10 nm, while the braking process primarily produces particles between 200 nm and 300 nm. Impressively, the use of regenerative braking during real driving led to a reduction in abrasion emissions of up to nearly 90%. Furthermore, a reduction of up to 83% in airborne brake abrasions for particle sizes ranging from 300 nm to 10 µm was observed with hard-coated brake discs.

Moreover, a novel brake system without airborne abrasion emissions was developed and validated. A demonstrator vehicle, equipped with the newly developed ZEDU1 unit, was designed, measured, and assessed for its everyday usability. Comprehensive tests confirm the complete functionality and durability of the developed brake system, thus showcasing its practicality

How to cite: Reiland, S., Philipps, F., and Arens, L.: Brake and Tire Emission Analysis with the Zero-Emission-Drive-Unit-Demonstrator for Battery Electric Vehicles, EGU General Assembly 2024, Vienna, Austria, 14–19 Apr 2024, EGU24-19733, https://doi.org/10.5194/egusphere-egu24-19733, 2024.

EGU24-19754 | Posters on site | AS3.25

In-flight and ground-based measurements of nitrogen oxide emissions from latest generation jet engines and 100% sustainable aviation fuel 

Anke Roiger, Theresa Harlass, Tiziana Braeuer, Hans Schlager, Ulrich Schumann, Daniel Sauer, Christiane Voigt, Andreas Doernbrack, Raphael Maerkl, Rebecca Dischl, Tobias Schripp, Linda Bondorf, Tobias Grein, Maxime Gauthier, Charles Renard, Darren Luff, Mark Johnson, Paul Madden, Peter Swann, and Reetu Sallinen

Nitrogen oxides, emitted from air traffic, are of concern due to their impact on climate by changing atmospheric ozone and methane levels. Using the DLR research aircraft Falcon, total reactive nitrogen (NOy) measurements were carried out at high altitudes to characterize emissions in the fresh aircraft exhaust from the latest generation Rolls-Royce Trent XWB-84 engine aboard the long-range Airbus A350-941 aircraft. The impact of different engine thrust settings, monitored in terms of combustor inlet temperature, pressure, and engine fuel flow, was tested for three different fuel types under similar atmospheric conditions: Jet A-1, for the first time a 100% sustainable aviation fuel (SAF), and a blend of both fuels. In addition, a range of combustor temperatures were tested during ground emission measurements. We confirm that the NOx emission index increases with increasing combustion temperature, pressure and fuel flow. We find that as expected, the fuel type has no measurable effect on the NOx emission index. These measurements are used to evaluate cruise NOx emission index estimates from three engine emission models. Our measurements thus help to evaluate the ground to cruise correlation of current engine models, serve as input for climate modelling, and extend the extremely sparse data set on in-flight aircraft NOx emissions to newer engine generations.

How to cite: Roiger, A., Harlass, T., Braeuer, T., Schlager, H., Schumann, U., Sauer, D., Voigt, C., Doernbrack, A., Maerkl, R., Dischl, R., Schripp, T., Bondorf, L., Grein, T., Gauthier, M., Renard, C., Luff, D., Johnson, M., Madden, P., Swann, P., and Sallinen, R.: In-flight and ground-based measurements of nitrogen oxide emissions from latest generation jet engines and 100% sustainable aviation fuel, EGU General Assembly 2024, Vienna, Austria, 14–19 Apr 2024, EGU24-19754, https://doi.org/10.5194/egusphere-egu24-19754, 2024.

EGU24-19971 | Posters on site | AS3.25

Transport-induced changes of atmospheric composition in the UTLS in the multi-scale Earth system model MECO(1) 

Katrin Dahlmann, Sigrun Matthes, Anna-Leah Nickl, Patrick Peter, Mariano Mertens, Helmut Ziereis, Theresa Harlaß, and Andreas Zahn

Anthropogenic transport sectors are concerned by their climate effects which results from CO2 and non-CO2 effects, comprising NOx-induced changes of atmospheric ozone and methane. Here climate-chemistry models are required to advance our understanding on induced changes of reactive species and the associated radiative forcing associated to aviation emissions. Evaluation of such comprehensive models is key in order to be able to investigate associated uncertainties can use observational datasets from research infrastructures like IAGOS and DLR aircraft measurement campaign data, as well as ground-based observations.

We use the MECO(n) system which is a “MESSy-fied ECHAM and COSMO nested n-times”, relying on the Modular Earth Submodel System (MESSy) framework. For this purpose, both models have been equipped with the MESSy infrastructure, implying that the same process formulations (MESSy submodels) are available for both models. Modelled atmospheric distributions from the multi-scale model system MECO(n) are systematically compared to observational data from aircraft measurements in the upper troposphere and lower stratosphere. Nudging of meteorology to reanalysis data, and special diagnostics available within the modular MESSy infrastructure are implemented in the numerical simulations. Online sampling along aircraft trajectories allows to extract model data with a high temporal resolution (MESSy submodel S4D), in order to evaluate model representation and key processes. Beyond systematic evaluation with IAGOS scheduled aircraft measurements, particular focus on those episodes where dedicated measurements from aircraft campaigns are available.

We present an analysis of reactive species, NOy and ozone, which also identifies those weather pattern and synoptic situations where transport sectors, comprising aviation contributes strong signals. We evaluate model representation of the NOx-induces effect on radiatively active species ozone and methane via the hydroxyl radical in both model instances, ECHAM5 and COSMO. This is key for advancing the scientific understanding of NOx-induced effects from transport effects required in order to quantify potential compensation and trade-offs and eventually in order to identify robust mitigation options for sustainable anthropogenic transport sectors.

This project has received funding from the European Union’s Horizon 2020 research and innovation programme under grant agreement No 875036 (ACACIA, Advancing the Science for Aviation and Climate). This work uses measurement data from the European Research Infrastructure CARIBIC/IAGOS. High-Performance Super Computing simulations have been performed by the Deutsches Klima-Rechenzentrum (DKRZ, Hamburg) and the Leibniz-Rechenzentrum (LRZ, München).

How to cite: Dahlmann, K., Matthes, S., Nickl, A.-L., Peter, P., Mertens, M., Ziereis, H., Harlaß, T., and Zahn, A.: Transport-induced changes of atmospheric composition in the UTLS in the multi-scale Earth system model MECO(1), EGU General Assembly 2024, Vienna, Austria, 14–19 Apr 2024, EGU24-19971, https://doi.org/10.5194/egusphere-egu24-19971, 2024.

EGU24-19989 | ECS | Posters on site | AS3.25

Improving aviation aerosol scavenging representation in LMDZ-OR-INCA model 

Nicolas Février, Didier Hauglustaine, and Nicolas Bellouin

The radiative forcing of aviation aerosol-cloud interactions remains very uncertain. Its quantification relies on climate models. One of the main drivers of aerosol concentrations and long-range vertical and horizontal transport in climate models is wet scavenging, which can be parameterised in different ways with several tunable parameters. In this work, we use the LMDZ-OR-INCA climate to investigate the impact of different scavenging parameterisations on aerosol transport, using regional and seasonal vertical profiles obtained from ATom and HIPPO airborne measurements to discriminate between parameterisations. Results show that the residence time and the mass budgets of BC from all sources are both significantly influenced by the scavenging parameterisation. Moreover, the ability of a BC scavenging parameterisation to simulate vertical aerosol concentration profiles depends on geographical location, altitude and season. Near-surface aerosol concentrations, mainly due to Landing and Take-off Operations (LTO), are also affected by the choice of a wet scavenging parameterisation. Results suggest it may be possible to design a new scavenging routine for LMDZ-OR-INCA model to better represent the long-range transport of aviation aerosols and reduce uncertainties in aviation aerosol-cloud interaction radiative forcing.

How to cite: Février, N., Hauglustaine, D., and Bellouin, N.: Improving aviation aerosol scavenging representation in LMDZ-OR-INCA model, EGU General Assembly 2024, Vienna, Austria, 14–19 Apr 2024, EGU24-19989, https://doi.org/10.5194/egusphere-egu24-19989, 2024.

EGU24-20120 | ECS | Posters on site | AS3.25

Contrail formation in mid-latitudes: Estimating the climate effect of contrails with climate change functions in EMAC using a Lagrangian approach. 

Patrick Peter, Sigrun Matthes, Christine Frömming, and Volker Grewe

Aviation has long been linked to environmental problems, including pollution, noise, and climate change. Although CO2 emissions are the primary focus of public discussion, non-CO2 emissions from aviation, such as contrails, nitrogen oxides, or cloud cover caused by aviation, can have comparable impacts on the climate. Previous studies have investigated the impact of different weather conditions on aviation and identified regions that are sensitive to climate change. They have also created data products, such as 4-dimensional climate change functions (CCFs), which enable air traffic management (ATM) to plan for climate-optimized trajectories. However, these functions were only derived for specific regions, seasons, and weather situations [1,2].

The presented research focuses on developing methods to determine the sensitivity of the atmosphere to aviation emissions in relation to climate effects. This is necessary to describe spatially and temporally dependent distributions, which are required to determine climate-optimized aircraft trajectories. While previous studies have focused on characterizing the North Atlantic Flight Corridor region [2], this study aims to extend the geographic scope by performing Lagrangian simulations for the extratropical regions of the northern hemisphere. The modular global climate model EMAC was used in this study to investigate contrail evolution on Lagrangian trajectories. The study analyzed the effects of contrails on the temporal evolution of key contrail formation parameters along these trajectories, as well as their effects on radiation in terms of the radiative forcing concept. With this comprehensive model, we can investigate the physical processes that determine the effects of contrails on climate and study their spatial and temporal variations.

The project leading to this study was funded by the European SESAR programme under Grant Agreement No. 101114785 (CONCERTO). High performance supercomputing resources were used from the German CARA Cluster in Dresden and the DKRZ Cluster in Hamburg.

References:  

[1] Matthes, S., Lührs, B., Dahlmann, K., Grewe, V., Linke, F., Yin, F., Klingaman, E. and Shine, K. P.: Climate-Optimized Trajectories and Robust Mitigation Potential: Flying ATM4E, Aerospace 7(11), 156, 2020.

[2]  Frömming, C., Grewe, V., Brinkop, S., Jöckel, P., Haslerud, A. S., Rosanka, S., van Manen, J., and Matthes, S.: Influence of weather situation on non-CO2 aviation climate effects: the REACT4C climate change functions, Atmos. Chem. Phys., 21, 9151–9172, https://doi.org/10.5194/acp-21-9151-2021, 2021.

How to cite: Peter, P., Matthes, S., Frömming, C., and Grewe, V.: Contrail formation in mid-latitudes: Estimating the climate effect of contrails with climate change functions in EMAC using a Lagrangian approach., EGU General Assembly 2024, Vienna, Austria, 14–19 Apr 2024, EGU24-20120, https://doi.org/10.5194/egusphere-egu24-20120, 2024.

EGU24-20326 | ECS | Orals | AS3.25

Impact of aircraft NOx and aerosol emissions on atmospheric composition: a model intercomparison, and a multimodel assessment using the airborne IAGOS data 

Yann Cohen, Didier Hauglustaine, Nicolas Bellouin, Sebastian Eastham, Marianne Tronstad Lund, Sigrun Matthes, Mattia Righi, Agnieszka Skowron, and Robin Thor

Aircraft emissions consist of carbon dioxide (CO2), nitrogen oxides (NOx), aerosols (black carbon and sulfate) and water vapour. The non-CO2 effects have been recently evaluated as twice the CO2 effects regarding their radiative forcing of climate in 2018 [1]. Among the non-CO2 effects, nitrogen oxides emissions impact several greenhouse gases concentrations. Through tropospheric ozone production and subsequent increased OH concentrations, it enhances the methane chemical destruction, thus decreasing the stratospheric water vapour content and the methane-linked background ozone levels in the troposphere. The net radiative forcing caused by the aircraft NOx emissions is evaluated as a net positive forcing but still shows important uncertainties.

In order to investigate representation of key mechanisms involved for climate forcing, in the framework of the ACACIA (Advancing the Science for Aviation and Climate) EU project, six global chemistry-climate models have been used to reevaluate the climate effects of NOx and aerosol aircraft emissions on atmospheric composition following a common protocol. As a first step, the standard runs have been assessed regarding ozone, carbon monoxide (CO), water vapour and reactive nitrogen (NOy) against the IAGOS measurements during 1994- 2018, separately in the upper troposphere and in the lower stratosphere.

As a second step, the models have been used to assess the impact of NOx and aerosol emissions on atmospheric composition. The subsonic aircraft perturbations are calculated based on the CEDS aircraft emission inventories [2] for the present-day conditions and based on different socioeconomic scenarios [3] for future (2050) conditions. Several sensitivity simulations will be presented in order to investigate the sensitivity of the results to background atmospheric conditions (present, future) and to lightning emissions. Changes in atmospheric composition will be presented and compared for the different models and scenarios.


Acknowledgement:

This study was supported by the European Union’s Horizon 2020 research and innovation programme under grant agreement No 875036 within the Aeronautics project ACACIA, and by the French Ministère de la Transition écologique et Solidaire (grant no. DGAC 382 N2021-39), with support from France’s Plan National de Relance et de Résilience (PNRR) and the European Union’s NextGenerationEU.


References:

  • [1] S. Lee, D.W. Fahey, A. Skowron, M.R. Allen, U. Burkhardt, Q. Chen, S.J. Doherty, S. Freeman, P.M. Forster, J. Fuglestvedt, A. Gettelman, R.R. De León, L.L. Lim, M. T. Lund, R.J. Millar, B. Owen, J.E. Penner, G. Pitari, M.J. Prather, R. Sausen, and L. J. Wilcox, Atmospheric Environment 244, 117834 (2021)
  • [2] M. Hoesly, S. J. Smith, L. Feng, Z. Klimont, G. Janssens-Maenhout, T. Pitkanen, J. Seibert, L. Vu, R. J. Andres, R. M. Bolt, T. C. Bond, L. Dawidowski, N. Kholod, J. Kurokawa, M. Li, L. Liu, Z. Lu, M. C. P. Moura, P. R. O’Rourke, and Q. Zhang, Geosci. Model Develop. 11, 369-408 (2018)
  • [3] J. Gidden, K. Riahi, S. J. Smith, S. Fujimori, G. Luderer, E. Kriegler, D. P. van Vuuren, M. van den Berg, L. Feng, D. Klein, K. Calvin, J. C. Doelman, S. Frank, O.Fricko, Harmsen, T. Hasegawa, P. Havlik, J. Hilaire, R. Hoesly, J. Horing, A. Popp, E. Stehfest, and K. Takahashi, Geosci. Model Develop. 12, 1443-1475 (2019)

How to cite: Cohen, Y., Hauglustaine, D., Bellouin, N., Eastham, S., Lund, M. T., Matthes, S., Righi, M., Skowron, A., and Thor, R.: Impact of aircraft NOx and aerosol emissions on atmospheric composition: a model intercomparison, and a multimodel assessment using the airborne IAGOS data, EGU General Assembly 2024, Vienna, Austria, 14–19 Apr 2024, EGU24-20326, https://doi.org/10.5194/egusphere-egu24-20326, 2024.

EGU24-21987 | ECS | Posters on site | AS3.25

Advancing Contrail Detection Methods over European Skies 

Irene Ortiz, Manuel Soler, Javier García-Heras, Hugues Brenot, Nicolas Clerbaux, and Pierre de Buyl

Under particular atmospheric conditions, aircraft water vapor emissions can evolve into enduring formations, known as contrails, wherein they entrap the long-wave infrared radiation emitted by the Earth's surface modifying, consequently, the temperature structure within the lower atmosphere. This phenomenon, linked to global warming, underscores the need for studying contrail environmental impacts. Achieving this requires accurate methods to identify formation patterns and monitor size, splitting, and evolutionary dynamics of these features. The present study introduces a novel approach for achieving contrail detection in Multispectral Satellite Imagery based on linear structure considerations and temporal dynamic analysis. The assessment of experimental results relies on images acquired over Europe at specific instances when contrails were visible, leveraging the high temporal resolution provided by the geostationary satellite Meteosat Third Generation.

How to cite: Ortiz, I., Soler, M., García-Heras, J., Brenot, H., Clerbaux, N., and de Buyl, P.: Advancing Contrail Detection Methods over European Skies, EGU General Assembly 2024, Vienna, Austria, 14–19 Apr 2024, EGU24-21987, https://doi.org/10.5194/egusphere-egu24-21987, 2024.

Non-CO2 emissions contribute to climate effects from aviation in the same order of magnitude as carbon dioxide (CO2) emissions. However, the non-CO2 effects, comprising e.g., ozone and methane induced from NOx emissions, together with contrails, or the indirect aerosol effects, are associated with much larger uncertainties. While CO2 and non-CO2 effects in general introduce a warming effect for climate change, some indirect effects might result in a relatively large cooling component. The EU Aeronautics project ACACIA (Advancing the SCience for Aviation and ClimAte) explored the climate impacts of non-CO2 effects which show a strong dependence on atmospheric conditions and synoptic situation. An overview on current scientific understanding, as well as open research questions will be provided.

Acknowledgements ACACIA (Advancing the scienCe for Aviation and ClImAte) receives funding from the European Union’s Horizon 2020 research and innovation programme under grant agreement No 875036.

How to cite: Dedoussi, I.: Advancing understanding on aviation's non-CO2 climate effects, EGU General Assembly 2024, Vienna, Austria, 14–19 Apr 2024, EGU24-22108, https://doi.org/10.5194/egusphere-egu24-22108, 2024.

Because of their computational expense, models with comprehensive tropospheric chemistry have typically been run with prescribed sea surface temperatures (SSTs), which greatly limits the model’s ability to generate climate responses to atmospheric forcings. In the past few years, however, several fully coupled models with comprehensive tropospheric chemistry have been developed. For example, the Community Earth System Model version 2 with the Whole Atmosphere Community Climate Model version 6 as its atmospheric component (CESM2-WACCM6) has implemented fully interactive tropospheric chemistry with 231 chemical species as well as a fully coupled ocean. Earlier versions of this model used a “SOAG scheme” that prescribes bulk emission of a single gas-phase precursor to secondary organic aerosols (SOAs). In contrast, CESM2-WACCM6 simulates the chemistry of a comprehensive range of volatile organic compounds (VOCs) responsible for tropospheric aerosol formation. Such a model offers an opportunity to examine the full climate effects of comprehensive tropospheric chemistry. To examine these effects, 211-year preindustrial control simulations were performed using the following two configurations: (1) the standard CESM2-WACCM6 configuration with interactive chemistry over the whole atmosphere (WACtl) and (2) a simplified CESM2-WACCM6 configuration using a SOAG scheme in the troposphere and interactive chemistry in the middle atmosphere (MACtl). The middle-atmospheric chemistry is the same in all configurations, and only the tropospheric chemistry differs. Differences between WACtl and MACtl were analyzed for various fields. Regional differences in annual mean surface temperature range from −4 to 4 K. In the zonal average, there is widespread tropospheric cooling in the extratropics. Longwave forcers are shown to be unlikely drivers of this cooling, and possible shortwave forcers are explored. Evidence is presented that the climate response is primarily due to increased sulfate aerosols in the extratropical stratosphere and cloud feedbacks. As found in earlier studies, enhanced internal mixing with SOAs in WACtl causes widespread reductions of black carbon (BC) and primary organic matter (POM), which are not directly influenced by VOC chemistry. These BC and POM reductions might further contribute to cooling in the Northern Hemisphere. The extratropical tropospheric cooling results in dynamical changes, such as equatorward shifts of the midlatitude jets, which in turn drive extratropical changes in clouds and precipitation. In the tropical upper troposphere, cloud-driven increases in shortwave heating appear to weaken and expand the Hadley circulation, which in turn drives changes in tropical and subtropical precipitation. Some of the climate responses are quantitatively large enough in some regions to motivate future investigations of VOC chemistry’s possible influences on anthropogenic climate change. Additional simulations of a 2000 baseline (rather than preindustrial) climate reveal that these results are sensitive to the prescribed land emissions. Most of this work was recently published in Atmospheric Chemistry and Physics (doi:10.5194/acp-23-9191-2023).

How to cite: Stanton, N. A. and Tandon, N. F.: How does tropospheric VOC chemistry affect climate? Investigations using the Community Earth System Model Version 2., EGU General Assembly 2024, Vienna, Austria, 14–19 Apr 2024, EGU24-2025, https://doi.org/10.5194/egusphere-egu24-2025, 2024.

EGU24-3142 | ECS | Posters on site | AS3.26

Understanding and quantifying chemical uncertainties in the hydrogen budget 

Rayne Holland, M. Anwar H. Khan, and Dudley Shallcross

The potential transition to a hydrogen-based economy, requires a comprehensive understanding of hydrogen's atmospheric behaviour for well-informed decision-making. Among the uncertainties surrounding the atmospheric fate of hydrogen, the chemical processes governing its formation and transformation are pressing.

This study employs STOCHEM-CRI, a global 3D tropospheric chemical transport model, to explore the chemical uncertainty associated with atmospheric hydrogen. The primary objective is to improve our understanding of the hydrogen distribution, sources, and sinks on a global scale. Addressing the significant role of formaldehyde (HCHO) as a chemical source, we update its photolysis parameterisation in accordance with recent recommendations (JPL 2020 and IUPAC 2013) and assess its variability. Furthermore, we evaluate the atmospheric burden of HCHO as a function of its sources to identify key photochemical contributors to the present hydrogen budget.

The study undertakes preliminary studies of the major sink of atmospheric hydrogen, namely uptake by soil, to gauge its impact. Through a meticulous examination of model outputs against observational data, various scenarios are systematically assessed for their ability to accurately replicate global hydrogen distribution and seasonal variations.

Preliminary results show updates to the photochemical parameters of HCHO significantly reduce the hydrogen burden by between 50 and 90 ppb globally. This is namely due to updates to the quantum yield of the molecular (H2 producing) photolysis channel which varies significantly when compared to previous recommendations. There is limited variation between the two updates (JPL 2020 and IUPAC 2013) of up to 5 ppb. Additionally, minor updates relating to the temperature dependence of the soil sink result in significant improvement in the models replication of observational data, including seasonal variation.

How to cite: Holland, R., Khan, M. A. H., and Shallcross, D.: Understanding and quantifying chemical uncertainties in the hydrogen budget, EGU General Assembly 2024, Vienna, Austria, 14–19 Apr 2024, EGU24-3142, https://doi.org/10.5194/egusphere-egu24-3142, 2024.

EGU24-3552 | ECS | Posters on site | AS3.26

Hydrogen supply chain and its impacts on energy storage and carbon neutrality 

Tatsuto Yukihara and Qian Sun

As a clean and efficient secondary energy, hydrogen energy is of great significance for energy transition and carbon neutrality. However, hydrogen development faces big challenges of high cost, unclean in production process, insecurity in transportation and storage etc. This paper tries to build a theoretical framework of hydrogen supply chain which contains whole life cycle of production, transportation, storage, utilization, and recycle of end use. Our study shows that a complete and mature hydrogen energy supply chain can enlarge the scale of hydrogen production and reduce the cost, improve its efficient and safety, and obtain a stable, sustainable, and zero-emission energy system. At the same time, a sound hydrogen energy supply chain also plays an important role in ensuring energy security and a bridge for the transition from fossil energy to renewable energy and these will help to reduce CO2 emissions, promote carbon peaking and neutrality through energy technological innovation and rapid energy transition.

Key words: Hydrogen energy storage, hydrogen industry supply chain, green hydrogen, energy transition, carbon peaking and neutrality.

How to cite: Yukihara, T. and Sun, Q.: Hydrogen supply chain and its impacts on energy storage and carbon neutrality, EGU General Assembly 2024, Vienna, Austria, 14–19 Apr 2024, EGU24-3552, https://doi.org/10.5194/egusphere-egu24-3552, 2024.

EGU24-4434 | ECS | Posters on site | AS3.26

Uncertainties in tropospheric ozone changes due to natural precursor emissions 

Xingpei Ye, Xiaolin Wang, Danyang Li, Paul Griffiths, Alex Archibald, and Lin Zhang

Accurate modelling of tropospheric ozone is crucial for understanding its climate and health effect, yet the uncertainty associated with natural ozone precursor emissions such as lightning and soil NOx is often overlooked. Here we apply a global chemical transport model, GEOS-Chem High Performance, to explore this uncertainty.

The modelled present-day tropospheric ozone burden, under low to high natural NOx emissions levels (set to align with the current literature’s range), varies from 285 to 373 Tg; primarily attributed to lightning NOx uncertainty. Such a range far exceeds the ozone difference driven by anthropogenic emissions between the two most disparate SSP scenarios in 2050 (33 Tg). Ozone’s sensitivity to natural emissions is the highest around the tropical upper troposphere where ozone’s climate effect is also large, and would be even higher if anthropogenic emissions were reduced along the SSP1-2.6 pathway. At the surface, global mean warm-season ozone ranges from 32.4 to 38.8 ppbv, mainly due to soil NOx. This especially introduces large ozone uncertainties in southern hemisphere regions such as the Amazon and Australia.

We also examine ΔO3-anthro, the ozone change driven by anthropogenic emissions changes up-to 2050. We found that with respect to tropospheric ozone burden, ΔO3-anthro shows limited differences between high and low natural emission levels (~13%), implying that the estimate of future changes in ozone radiative forcing is subject to less uncertainty from uncertain natural emissions than the present-day ozone radiative forcing itself. However, ΔO3-anthro related to the surface ozone exposure metric shows significant contrasts with different natural NOx emissions. The largest difference exceeds 5 ppbv (~50%) in regions such as Europe, North America, eastern China, and India. We hence stress that extra care needs to be taken when using individual models to assess ozone health risks in these densely populated regions as highly uncertain natural emissions will produce a presently unconstrained error.

How to cite: Ye, X., Wang, X., Li, D., Griffiths, P., Archibald, A., and Zhang, L.: Uncertainties in tropospheric ozone changes due to natural precursor emissions, EGU General Assembly 2024, Vienna, Austria, 14–19 Apr 2024, EGU24-4434, https://doi.org/10.5194/egusphere-egu24-4434, 2024.

EGU24-6038 | ECS | Posters virtual | AS3.26

A Simple Approach for Atmospheric Hydrogen Modelling Based on the Seasonal Variability 

Alexander Tardito Chaudhri and David Stevenson

Anthropogenic hydrogen emissions to the atmosphere have the potential to increase if there is a proliferation of hydrogen as a fuel in the future (Warwick et al., 2023).  It is well understood that atmospheric hydrogen has a positive indirect global warming potential (Ocko and Hamburg, 2022; Sand et al., 2023).  However, substantial uncertainty remains in evaluating this global warming potential, and how this value depends on the distribution of emissions.  Principally, the most appropriate surface deposition scheme to use in models remains unclear (Paulot et al., 2021).

Motivated by the observation that the seasonal variability of station hydrogen measurements (from Petron et al., 2023) can be well described as a function of latitude, we present an idealised latitude-height model for testing prototype deposition schemes.  We show how much of the key features of the seasonal variability can be captured with an illustrative benchmark deposition scheme, and finally how this model can be used to iteratively develop existing deposition schemes (e.g. Bertagni et al., 2021).

How to cite: Tardito Chaudhri, A. and Stevenson, D.: A Simple Approach for Atmospheric Hydrogen Modelling Based on the Seasonal Variability, EGU General Assembly 2024, Vienna, Austria, 14–19 Apr 2024, EGU24-6038, https://doi.org/10.5194/egusphere-egu24-6038, 2024.

There are close to 6000 megaconstellation satellites in low-Earth orbit comprising 65% of all satellites orbiting Earth. The growth in satellite megaconstellations has driven surges in rocket launches and re-entry destruction of spent satellites. This has contributed to large increases in emissions of pollutants that are very effective at depleting stratospheric ozone and altering climate, due to direct injection of pollutants into the upper layers of the atmosphere where turnover rates are very slow. An additional 540,000 megaconstellation satellites are proposed, yet the environmental impacts of emissions from current and future satellite megaconstellations remain uncharacterized and unregulated. Here we calculate emissions of the dominant pollutants from megaconstellation and non-megaconstellation rocket launches and re-entries from 2020 to 2022 to determine the effect on climate and stratospheric ozone. Pollutants include black carbon (BC), nitrogen oxides (NOx≡NO+NO2), water vapour (H2O), carbon monoxide (CO), alumina aerosol (Al2O3) and chlorine species (Cly≡HCl+Cl2+Cl) from rocket launches and nitrogen oxides (NOx≡NO) and alumina aerosol (Al2O3) from re-entries. Launch emissions are calculated by determining the vertical distribution of propellant consumption for each rocket stage and calculating and applying vertically resolved propellant specific emission indices that account for additional oxidation in the hot rocket plume and changes in atmospheric composition with altitude. To quantify the re-entry emissions, the mass of re-entering objects is compiled for all objects (spacecraft, rocket stages, fairings, and components) re-entering Earth’s atmosphere in 2020-2022. Many objects, accounting for 12-16% of re-entry mass, are not geolocated, so the longitude and latitude of re-entry is bounded by the reported orbital inclination. Object class and object reusability are used to define the chemical composition and mass ablation profile of each re-entering object. We find that total propellant consumed has nearly doubled from ~38 Gg in 2020 to ~67 Gg in 2022 and re-entry mass has increased from ~3.3 Gg in 2020 to ~5.6 Gg in 2022. Megaconstellation re-entries accounted for 8-12% of the Al2O3 and NOx re-entry emissions in 2020-2022, due to increased megaconstellation launches and short (~2 years) lifespan of most (85%) megaconstellation satellites. Anthropogenic re-entry emissions of NOx (~4.2 Gg) and Al2O3 (~0.96 Gg) in 2022 equal a third of the natural meteoritic injection of NOx and surpass the natural injection by 7 times for Al2O3. The annual emissions for 2020-2022 will be used to predict the rise in emissions up to 2029 from megaconstellation and non-megaconstellation rocket launches and object re-entries for input to the 3D atmospheric chemistry transport model GEOS-Chem coupled to a radiative transfer model to simulate stratospheric ozone depletion and radiative forcing attributable to a decade of satellite megaconstellation emissions.

How to cite: Barker, C., Marais, E., and McDowell, J.: Developing inventories of by-products from satellite megaconstellation launches and disposal to determine the influence on stratospheric ozone and climate, EGU General Assembly 2024, Vienna, Austria, 14–19 Apr 2024, EGU24-6467, https://doi.org/10.5194/egusphere-egu24-6467, 2024.

EGU24-7558 | Orals | AS3.26

Understanding the benefits and risks of the hydrogen economy: the HYDRA project 

Rossella Urgnani, Noelia Ferreras Alonso, Alessio Bellucci, Oliver Wild, Kyriakos Panopoulos, Massimo Santarelli, Nathanael Poinsel, and Isella Vicini

The European Green Deal target of zero emissions by 2050, boosted by the energy crisis due to the Russian-Ukranian conflict, put decarbonisation at the forefront of policymakers’ and industries’ development plans. Hydrogen, especially if produced by renewable energy sources, is considered one of the main candidates in the ongoing energy transition. The hydrogen economy is still in its early stages, due to the high cost of technologies, production, and infrastructure, but the electrolyser capacity installed in 2023 doubled 2022 levels (IEA report, 2023), with clear signs of increasing investments in this sector. However, large-scale diffusion of hydrogen technologies could negatively impact climate because of the increase in H2 emissions (through leakages or other mechanisms) to the atmosphere and its interactions with other gases. Hydrogen interacts with the oxidative cycles of CH4, NOx, and CO, affecting natural GHG-removing mechanisms. In addition, an increase in atmospheric hydrogen could alter stratospheric levels of ozone and water vapour. Increasing H2 emissions may result in an increase in global radiative forcing, even if H2 replaces a proportion of fossil fuel use. However, quantification of these impacts remains uncertain and depends on the development and uptake of different hydrogen technologies. The HYDRA project, funded by the European Commission under the Horizon Europe program, officially started on November 1st, 2023, and aims to evaluate the benefits and the potential risks associated with the hydrogen economy. It starts with the analysis of policies and markets to quantify the potential diffusion of hydrogen technologies in the mid-to-long term and the associated emissions of H2 and other gases (e.g., CH4, H2O, NOX, methanol, NH3). Using these data, HYDRA will simulate the impacts of the integration of hydrogen in the energy sector using WILIAM, an Integrated Assessment Model accounting for interactions between society, economy, and the environment, which will produce a range of energy, land, and emission scenarios. The FRSGC/UCI Chemical Transport Model will then be used to quantify global and regional impacts on O3, CH4, NOX, VOC, CO, and other oxidants, estimating the uncertainty in the important soil sink of hydrogen. The role of H2 in influencing stratospheric water vapour, ozone, and nitrous oxide (N2O) will be determined with the SLIMCAT and UKCA models. The changes in atmospheric composition from these simulations will be used to estimate the effective radiative forcing associated with H2 emissions and perform future climate projections, using the EC-Earth global climate model. Finally, since hydrogen-air mixes are highly inflammable, HYDRA will develop a new leakage detection/quantification monitoring system to make H2 technologies safer. The overall benefits and risks associated with a future hydrogen economy will be evaluated from a sustainable perspective, from changes in mean climate conditions to impacts on society and environment. HYDRA is fully committed to finding sustainable solutions for the development of the hydrogen economy, and to proposing mitigation strategies and guidelines for policymakers at the end of the 4-year project.

How to cite: Urgnani, R., Ferreras Alonso, N., Bellucci, A., Wild, O., Panopoulos, K., Santarelli, M., Poinsel, N., and Vicini, I.: Understanding the benefits and risks of the hydrogen economy: the HYDRA project, EGU General Assembly 2024, Vienna, Austria, 14–19 Apr 2024, EGU24-7558, https://doi.org/10.5194/egusphere-egu24-7558, 2024.

EGU24-9653 | Orals | AS3.26

Impact of hydrogen on atmospheric composition and climate 

Tanusri Chakraborty, Gill Thornhill, and Bill Collins

Hydrogen(H2) is one of the most abundant greenhouse gases in the atmosphere that participates in stratospheric ozone depletion and influences air quality. Using hydrogen as an alternative energy source to meet net-zero carbon emissions by 2050 can increase the risk of Hydrogen Leakage. Excess H2 leaked from a hydrogen economy could travel from the Earth’s surface to the stratosphere, where its oxidation would increase water vapor (H2O) in the upper atmosphere. It also has the potential to modify stratospheric ozone destruction by altering catalytic reactions involving HOx (=OH+HO2) radicals as well as changing stratospheric temperatures. Additional H2 in the air would consume the hydroxyl radical (OH) and lengthen the atmospheric lifetime of methane (CH4), increasing its abundance, whilst the oxidation of both H2 and CH4 generates tropospheric O3. The changes in OH can cause a cascade of climate impacts that includes changes in aerosol clouds. Increases in H2 will increase the concentration of CH4, O3, and H20, resulting in increased radiative forcing. Here, we are using the UK Earth System Model (UKESM) chemistry-climate model to see the effect of indirect radiative forcing arising from increases in H2 in the atmosphere. We have conducted experiments at present and future H2 and CH4 concentrations and analyzed the feedback on O3, aerosol, and stratospheric H2O over the period of 40 years. The highlight of the study is to see the effects of radiative forcing on CH4, O3, and H2o separately . We have seen the effect on one component at a time by switching off the feedback of the other components and also see the effect of radiative forcing as a whole due to an increase in H2 concentration.

How to cite: Chakraborty, T., Thornhill, G., and Collins, B.: Impact of hydrogen on atmospheric composition and climate, EGU General Assembly 2024, Vienna, Austria, 14–19 Apr 2024, EGU24-9653, https://doi.org/10.5194/egusphere-egu24-9653, 2024.

When hydrogen is used as an energy carrier, some hydrogen will leak into the atmosphere during production, storage, transport, and end use. Hydrogen itself is not a greenhouse gas, but via chemical reactions in the atmosphere, the leaked hydrogen will affect the atmospheric composition of methane, ozone, and stratospheric water vapor and hence radiation in the atmosphere. A recent multi-model study found the Global Warming Potential over a 100-year time horizon (GWP100) to be 11.6 ±2.8 (one standard deviation). In this study, a chemistry transport model (OsloCTM3) is used to investigate the sensitivity of the calculated GWP100 due to the size of the hydrogen perturbation, the location of the hydrogen perturbation as well as the chemical composition of the background atmosphere.

The hydrogen perturbation of an additional 0.1, 1, 10 and 100 Tg yr-1 of anthropogenic hydrogen emissions gave GWP values that differed by only 0.4. To test the sensitivity of the location of the perturbation, 1 Tg yr-1 was added to seven different sites around the world. Perturbations at sites that are further away from dry deposition areas (such as middle of the ocean and in Antarctica) resulted in feedback factor larger than one. The GWP values were enhanced compared to perturbations at sites influenced more by dry deposition where feedback factor was less than one. The difference in GWP100 between the two most extreme sites was 4, less than the width of the ± one standard deviation range from the multi-model GWP100 study.

The hydrogen economy is expected to grow, and in the future, the atmospheric composition might be different than the 2010 atmosphere used to calculate GWP100 in the multi-model study. To check the sensitivity to this the GWP100 is calculated with the perturbations on top of three different 2050 atmospheres using different SSP scenarios. The three different SSPs had different combinations of NOx to CO emission ratios and methane levels that both influence the atmospheric lifetime of hydrogen. The atmospheric lifetime increased in all the scenarios, and in SSP4-3.4 by as much as ~1 year. However, the dominant control on the total lifetime of hydrogen is the soil sink. Thus, future changes to the soil sink should be investigated, with a focus on how it influences the calculated GWP.

How to cite: Skeie, R. B.: Sensitivity of climate effects of hydrogen to leakage size, location, and chemical background, EGU General Assembly 2024, Vienna, Austria, 14–19 Apr 2024, EGU24-9851, https://doi.org/10.5194/egusphere-egu24-9851, 2024.

EGU24-10002 | Orals | AS3.26

Improving quantification and understanding of the global H2 soil sink through field and lab based flux measurements 

Nicholas Cowan, Julia Drewer, Toby Roberts, Mark Hanlon, Chiara Di Marco, Carole Helfter, and Eiko Nemitz

An improved quantification of the soil sink of Hydrogen (H2) gas is required to understand the environmental implications of a future Hydrogen economy and global atmospheric models. Typically, soil microbes utilise H2 as an energy source, but we also have evidence that emission of H2 from soils is also possible via microbial processes. We present new H2 flux data from several field sites and lab studies in which a variety of soils from around the world have been measured from. These sites include agricultural and forest soils from the UK where we have preliminary data of a longer-term measurement campaign. We have developed flux chamber methodology to establish a best practice for measuring H2 flux in soils, which is radically different from typical greenhouse gas protocols. We present our work so far on the development of H2 measurement methodology and on the characterisation of the H2 soil sink in relation to soil physical & chemical properties, vegetation and climate under controlled environment conditions. We also present observations of spatial and temporal soil H2 uptake rates from sites across the UK. We highlight the importance of soil aeration and the physical barriers that strongly interfere with H2 uptake in soils, particularly the influence of high water-filled pore space which should be accounted for in future modelling efforts.

How to cite: Cowan, N., Drewer, J., Roberts, T., Hanlon, M., Di Marco, C., Helfter, C., and Nemitz, E.: Improving quantification and understanding of the global H2 soil sink through field and lab based flux measurements, EGU General Assembly 2024, Vienna, Austria, 14–19 Apr 2024, EGU24-10002, https://doi.org/10.5194/egusphere-egu24-10002, 2024.

EGU24-10067 | ECS | Orals | AS3.26

Detection of regional industrial H2 emissions using an active Aircore and a high-precision GC-PDHID system 

Iris M. Westra, Bert A. Scheeren, Steven M.A.C. van Heuven, Bert A.M. Kers, and Harro A.J. Meijer

As result of the global energy transition, it is expected that H2 emissions are on the rise due to increasing production, transport and usage. Leakage rates might be up to 10% of the total hydrogen production. This will lead to an increase of the global atmospheric hydrogen mole fraction, resulting in the lengthening of the lifetime of in particular methane, enhanced tropospheric ozone production, and increased stratospheric water vapor levels. Because of these effects, H2 is called an indirect greenhouse gas. We present first results of the use of a high-precision Agilent 8890 GC-system equipped with a Pulsed Discharge Helium Ionization Detector (PDHID) combined with an ‘active’ Aircore and sampling flasks as a tool to detect and quantify industrial H2 emissions. Our GC-PDHID measures H2 with a precision <2 ppb and is calibrated and linked to the international NOAA-H2-X1996 hydrogen scale (e Max Planck Institute for Biogeochemistry (MPI-BGC) Jena, Germany). The ‘active’ AirCore is an atmospheric sampling system that consists of a long narrow tube (in the shape of a coil) in which atmospheric air samples are collected using a pump during the sampling experiment, in this way preserving a profile of the trace gas of interest along the measurement trajectory. In this study we focus on potential H2 emitters in the Groningen province, mainly located at the Delfzijl Chemistry Park bordering the Wadden sea coast. During our field experiments we deployed three different complementary sampling methods. The first method involves the use of an active Aircore system with a sample volume of 4.35 L from a passenger car. This Aircore is filled to an end-pressure of up to 1.6 bar over the course of about 2 hours of sampling resulting in up to 38 discrete Hsamples on the GC-PDHID. The second method involved the use of an active Aircore system on a UAV with a volume of 3.7 L and filled with a sampling flow of 200 ml min-1 at atmospheric pressure, allowing for up to 21 discrete Hsamples. The third sampling technique involved the use of dried and vacuumized 2.3 L glass flasks to collect discrete samples along the measurement trajectory. The glass flasks samples were further analysed by CRDS (Picarro G2401) on mole fractions of CO2, CH4, CO, to get additional information on the emission sources co-located with H2. We found a regional H2 background of 529 ± 5 ppb in agreement with the European background station observations at Mace Head, Ireland. Our results so far indicate constant undetected industrial H2 emissions at the Chemistry Park Delfzijl, ranging from enhanced signals of 580 ppb up to 1.5 ppm of H2 downwind the source area. Based on these results we present first estimates of current industrial H2-emissions from the Delfzijl Chemistry park. Further work will focus on specific H2 production and storage infrastructure.

How to cite: Westra, I. M., Scheeren, B. A., van Heuven, S. M. A. C., Kers, B. A. M., and Meijer, H. A. J.: Detection of regional industrial H2 emissions using an active Aircore and a high-precision GC-PDHID system, EGU General Assembly 2024, Vienna, Austria, 14–19 Apr 2024, EGU24-10067, https://doi.org/10.5194/egusphere-egu24-10067, 2024.

EGU24-10187 | ECS | Posters on site | AS3.26

Analysis of trade-offs from the use of hydrogen blended with natural gas in the European Union 

Thiago Brito, Lena Höglund-Isaksson, Peter Rafaj, Robert Sander, and Zbigniew Klimont

Context: Increasing use of hydrogen (H2) across the economy is currently seen as an important strategy for decarbonization of fossil fuel-dependent sectors. Energy scenarios, especially those aiming at net-zero GHG emission targets, project that surplus electricity produced from renewable sources, such as solar and wind, will be converted and stored as H2 by electrolysis. The use of pure hydrogen would require the replacement or significant modification of some of the infrastructure (e.g. steel pipelines) and end-use appliances (e.g. combustion engines) by H2-dedicated equipment (e.g. PE/PVC pipelines, fuel cells); in fact, many sectors are already moving towards these solutions. However, hydrogen can also be blended into natural gas and used in the same applications. The combustion of such blends enables reduction of carbon intensity in several sectors without significant technological retrofits. However, hydrogen combustion under lean air conditions leads to higher thermal formation of nitrogen oxides (NOx), when compared to natural gas. The amount depends on the burner type, load and hydrogen blending ratio. While NOx emissions pose a direct risk to human health and act as a precursor to the O3 and particulate matter, deployment of H2 would also result in direct leakages to atmosphere and associated climate impacts.

Objective: This study seeks to quantify and evaluate the potential NOx increases in the European Union (EU27) countries due to the combustion of hydrogen blended with natural gas.

Methodology: We use GAINS model framework to conduct this analysis assuming that hydrogen combustion will mostly take place in the buildings, industry (boilers and furnaces) and power generation sectors. The exclusion of the transport sector is justified by the predominant use of hydrogen in fuel cell vehicles, which do not contribute to NOx formation. Since hydrogen blends will be used in the same devices as currently natural gas, existing abatement technologies as well as their adoption rates are kept across all sectors and regions.

Expected Results: We expect the results of this study will allow us a better understanding of hydrogen impacts in terms of pollutant emissions. While the paper asserts that the findings are unlikely to influence the development or viability of future hydrogen economies in Europe, it acknowledges the importance of the analysis in revealing potential emissions trends and identifying local or country-specific trade-offs. The emphasis on existing regulations and emission control strategies in Europe provides context for the limited air quality impacts expected on the overall trajectory of hydrogen adoption. Moreover, these preliminary results could lead to relevant insights regarding expected H2 fugitive emissions which may impact climate mitigation targets and economical viability. 

How to cite: Brito, T., Höglund-Isaksson, L., Rafaj, P., Sander, R., and Klimont, Z.: Analysis of trade-offs from the use of hydrogen blended with natural gas in the European Union, EGU General Assembly 2024, Vienna, Austria, 14–19 Apr 2024, EGU24-10187, https://doi.org/10.5194/egusphere-egu24-10187, 2024.

EGU24-10918 | ECS | Posters on site | AS3.26

The Impacts of Hydrogen on Tropospheric Ozone and their Modulation by Background NOx 

Hannah Bryant, David Stevenson, Mathew Heal, and Maria Sand

A shift in our energy production is crucial to the control of global warming. This will occur as fossil fuels are phased out, following legislation created to reach the targets set out in the Paris Agreement. One of the possible sources for a low carbon energy landscape is renewable hydrogen. Whilst hydrogen represents an alternative energy store, it can leak from the system. Understanding the fate of leaked hydrogen is vital to quantify the implications of this energy transition. This study uses the atmospheric version of the United Kingdom Earth System Model to analyse the impact of hydrogen on the atmosphere. The model indicates that increased atmospheric hydrogen leads to an increase in tropospheric ozone concentrations. Ozone is a greenhouse gas and therefore there is an indirect atmospheric warming due to hydrogen emission through ozone. Understanding the relationship between hydrogen and the chemical ozone budget is therefore required to dissect how this warming occurs. We find that hydrogen increases ozone production, governed by the increased flux through the reaction of HO2 with NO. Future atmospheric nitrogen oxide concentrations are expected to decrease in the coming decades, under most climate scenarios. Understanding the relationship between hydrogen and background NOx concentrations is therefore crucial in determining the mechanisms of how hydrogen is expected to impact future atmospheres. We use the model to calculate the tropospheric global warming potential of hydrogen and how this is altered by changing background NOx. We find that this tropospheric GWP will stay relatively constant alongside decreases in ground level anthropogenic NOx.

How to cite: Bryant, H., Stevenson, D., Heal, M., and Sand, M.: The Impacts of Hydrogen on Tropospheric Ozone and their Modulation by Background NOx, EGU General Assembly 2024, Vienna, Austria, 14–19 Apr 2024, EGU24-10918, https://doi.org/10.5194/egusphere-egu24-10918, 2024.

EGU24-11016 | Orals | AS3.26 | Highlight

The climate impact of a future hydrogen economy 

Didier Hauglustaine

Inflammable air, known today as hydrogen, was first identified and produced in 1766 by the British chemist and physicist Henry Cavendish. Today, hydrogen can be produced by splitting the liquid water molecules. The water electrolysis producing hydrogen can be powered by renewable energy in the case of "green" hydrogen. Hydrogen is also produced from fossil fuels by steam reforming of methane in natural gas in conjunction with carbon sequestration in the case of "blue" hydrogen, or without carbon sequestration in the case of "grey" hydrogen. The use of hydrogen enables energy conversion and storage, and can provide a way to decarbonize sectors of the economy where decarbonization has no alternative or is hard to reach, such as long-distance transport by truck, train or airplane, heavy industries, or for domestic use in mixture with natural gas. Hydrogen has no direct greenhouse effect but is an indirect climate gas which induces perturbations of atmospheric methane, ozone and water vapour, three powerful greenhouse gases. The budget of atmospheric molecular hydrogen will be presented and the main sources and sinks will be briefly discussed. Based on the results of state-of-the-art global numerical climate and chemistry models, we derive various indicators intended to quantify the climate impact of hydrogen and in particular derive its Global Warming Potential (GWP).

All the scenarios considered in this study for a future transition towards a hydrogen economy in Europe or in the world clearly suggest that a "green" hydrogen economy is beneficial in terms of CO2 emissions mitigation for the relevant time horizons and leakage rates considered. In contrast, the results suggest that carbon dioxide (CO2) and methane (CH4) emissions associated with the production and transport of "blue" (and "grey") hydrogen reduce the climate benefit of such a transition and even introduce a climate penalty in the event of a very high leakage rate or strong penetration of "blue" hydrogen on the market. Various assumptions will be illustrated for future “blue” hydrogen production carbon intensity. Reducing the leakage rate of H2 (and CH4 in the case of "blue" hydrogen production) and increasing the "green" hydrogen production sector appear to be the key levers towards maximum mitigation of CO2 emissions from a large-scale structural transition to a hydrogen economy.

In addition, in the specific case of aviation, the use of liquid hydrogen powered aircraft induces additional climate forcings from water vapour emissions in the upper atmosphere and from impact on contrail formation. In the case of an hydrogen powered fleet, the forcings from NOx and from contrails are still subject to large uncertainties. These effects will be illustrated based on various assumptions for future aircraft using hydrogen fuel.


How to cite: Hauglustaine, D.: The climate impact of a future hydrogen economy, EGU General Assembly 2024, Vienna, Austria, 14–19 Apr 2024, EGU24-11016, https://doi.org/10.5194/egusphere-egu24-11016, 2024.

EGU24-12262 | Posters virtual | AS3.26

Impact of Hydrogen and Ammonia on Surface Air Pollution. 

Caroline Jouan, Øivind Hodneborg, and Ragnhild Skeie

Hydrogen and ammonia fuels are being explored as cleaner and sustainable energy alternatives to fossil fuels, due to their potential for decarbonization. The production of renewable energy-based hydrogen converted into green ammonia offers a more efficient solution for storing and transporting energy than gaseous hydrogen. However, both ammonia and hydrogen can indirectly lead to air pollution.

Ammonia, if leaking to the atmosphere, plays a role in forming secondary aerosols, generating particles like ammonium nitrate that add to fine particulate matter (particulate matter with diameter <2.5 micrometers; PM2.5). Additionally, the production of oxides of nitrogen (NOX) gases during ammonia combustion contributes to tropospheric ozone formation and can influence aerosol abundance (as NOX may lead to less aerosols and not necessarily more). Hydrogen, if leaked to the atmosphere, will impact tropospheric ozone and possible aerosols through a complex chain of chemical reactions.

Our research aims to assess the potential air quality effects of shifting to a hydrogen and ammonia-based economy.

Using simulations from the three-dimensional global chemical transport model (OsloCTM3), we are investigating the impacts of hydrogen and ammonia on key air quality parameters, with a specific focus on surface concentrations of ozone and PM2.5.

We will attempt to assess the benefits of this energy transition in relation to the reduction of atmospheric pollutants associated with fossil fuels. In the case of ammonia, we will compare air pollution impacts across different emission sectors. Future work will involve the analysis of chemistry-climate model simulations.

How to cite: Jouan, C., Hodneborg, Ø., and Skeie, R.: Impact of Hydrogen and Ammonia on Surface Air Pollution., EGU General Assembly 2024, Vienna, Austria, 14–19 Apr 2024, EGU24-12262, https://doi.org/10.5194/egusphere-egu24-12262, 2024.

EGU24-14242 | ECS | Orals | AS3.26

Quantifying leaks with a field-deployable, fast, sensitive hydrogen instrument 

Elizabeth Lunny, Richard Wehr, Joseph Roscioli, Conner Daube, Joanne Shorter, Tianyi Sun, William Long, Ahmad Momeni, John Albertson, Scott Herndon, and David Nelson

Accurate quantification of leaks associated with hydrogen transport and storage infrastructure is vital to evaluate the environmental benefit associated with the transition from fossil fuels to hydrogen as an energy source. Understanding the locations and magnitudes of leaks is critical in efforts to mitigate the indirect climate impact of transitioning to a hydrogen economy. Quantification of hydrogen leaks requires a field-deployable, fast, sensitive measurement technology which, until recently, has not existed. We have developed a novel inlet system which couples to an Aerodyne tunable infrared laser direct absorption spectrometer (TILDAS) to measure hydrogen with <5 ppb precision and <5 second time response. Laboratory-based instrument performance results and data from recent mobile measurements will be presented.

How to cite: Lunny, E., Wehr, R., Roscioli, J., Daube, C., Shorter, J., Sun, T., Long, W., Momeni, A., Albertson, J., Herndon, S., and Nelson, D.: Quantifying leaks with a field-deployable, fast, sensitive hydrogen instrument, EGU General Assembly 2024, Vienna, Austria, 14–19 Apr 2024, EGU24-14242, https://doi.org/10.5194/egusphere-egu24-14242, 2024.

EGU24-16477 | ECS | Posters on site | AS3.26

Modelling the Global Uncertainty of Hydrogen Deposition 

Megan Brown, Alex Archibald, Luke Abraham, Nicola Warwick, and Paul Griffiths

Using hydrogen as an alternate fuel source could lead to lower carbon emissions if sourced from renewable energies. However, it can act as an indirect greenhouse gas by extending the lifetime of methane and causing stratospheric water vapour to increase. The global production and loss of hydrogen in the atmosphere are important in order to quantify its lifetime and, by extension, its global warming potential. The main sinks for hydrogen are loss through chemical reactions with OH and biological soil uptake, the latter of which accounts for approximately 80% loss and, on average, has an error range of +/-40%. Due to the wide potential range of deposition velocities and its large global impact on hydrogen, this introduces a major uncertainty to the overall hydrogen budget.

Previously in the UK Chemistry and Aerosol model (UKCA), the soil uptake of hydrogen was fixed temporally and depended on land type, following the scheme by Sanderson et al. (2003). We have implemented the deposition scheme from Paulot et al. (2021) into UKCA in order to better represent the uptake of hydrogen. A wide range of soil parameters are used in the updated scheme: soil moisture, temperature, snow depth, soil carbon content, soil type, and soil saturation content, which allow for a more diverse and dynamic range of deposition velocities. These results from UKCA are evaluated against previous global hydrogen budgets and verified against hydrogen observations from the National Oceanic and Atmospheric Administration.

The calculation of hydrogen deposition velocity onto soil is independent of atmospheric hydrogen, and, as a result, can be calculated offline. We use data from CMIP6 simulations as inputs to calculate a range of global hydrogen deposition velocities across multiple future projections using a range of different deposition models. The different uncertainties associated with models (hydrogen deposition and climate models) natural variation, and future scenarios can be isolated. Fluctuations in deposition and variation through time can be analysed to assess the which factors have the greatest contribution to the hydrogen deposition velocity uncertainty.

How to cite: Brown, M., Archibald, A., Abraham, L., Warwick, N., and Griffiths, P.: Modelling the Global Uncertainty of Hydrogen Deposition, EGU General Assembly 2024, Vienna, Austria, 14–19 Apr 2024, EGU24-16477, https://doi.org/10.5194/egusphere-egu24-16477, 2024.

EGU24-16712 | ECS | Orals | AS3.26

Climate effects of contrail cirrus for aircraft with hydrogen combustion    

Susanne Pettersson and Daniel Johansson

Aviation accounts for approximately 5% of the current anthropogenic climate impact. Up to two thirds of the warming generated by airplanes is attributed to non-CO2 effects with contrail cirrus as the largest contributor. Hydrogen as aviation fuel promises zero carbon emission but the non-CO2 effects of this new fuel are poorly known.

In this study we investigate the generation of contrail cirrus from hydrogen combustion using a modified version of the Contrail Cirrus Prediction model (CoCip). In the absence of soot-emissions ice particles in hydrogen contrail are assumed to form on entrained aerosols, ultrafine volatile particles and lubrication oil. The calculation of the number of ice particles formed on entrained aerosols is approximated by previously published simulation results and theory.  Ultrafine volatile particles and lubrication oil both activate into water droplets at lower temperatures than soot and aerosols due to the Kelvin effect (small radius) and hydrophobicity respectively and are implemented using theory and published experimental results.

Using hydrogen fuel contrails can, according to the Schmidt-Appleman criteria, form at lower altitudes than with jet fuel due to the increase in water vapor in the exhaust. Despite this our preliminary results show an overall decrease in both warming and cooling contrails for hydrogen compared to standard jet fuel. We do find that hydrogen contrails can generate more radiative forcing than jet contrails at very low temperatures mainly due to the activation of lubrication oil in combination with the larger amount of water vapor. For the bulk of flights however, hydrogen fuel leads to either equal or less contrail radiative forcing than jet fuel even with reduced soot-emissions in line with lean-burn engines.   

How to cite: Pettersson, S. and Johansson, D.: Climate effects of contrail cirrus for aircraft with hydrogen combustion   , EGU General Assembly 2024, Vienna, Austria, 14–19 Apr 2024, EGU24-16712, https://doi.org/10.5194/egusphere-egu24-16712, 2024.

Hydrogen fuel, a green transition option and a cleaner alternative to fossil fuels, has an indirect greenhouse impact through atmospheric reactions of “leaked” hydrogen. Sand et al., 2023 used six different chemistry-transport models (CTM) to estimate a Global Warming Potential over a 100-year time horizon (GWP-100) for hydrogen of 11.6 ± 2.8, in range with similar studies. In this study, we extend those analyses by investigating the atmospheric production and loss terms of hydrogen in the CTMs. Specifically, we compare formaldehyde (HCHO) and the hydroxyl radical (OH) concentrations. Then we develop a box model that can be used for quickly evaluating the impact of the different sources and sinks on atmospheric concentration and isotopic composition of H2 from a global perspective.

Atmospheric production of hydrogen through photo-oxidation of methane and volatile organic compounds represents roughly 60% of the total production. To compare the atmospheric production in the models, we evaluate HCHO (produced during photo-oxidation). A preliminary comparison between the global mean model-derived tropospheric HCHO and TROPOMI-derived HCHO suggests that all models other than WACCM perform reasonably well. Generally, models tend to overestimate HCHO values over land and underestimate HCHO concentrations over the oceans. WACCM has very low HCHO values compared to TROPOMI and the other models.

The two primary removal mechanisms are soil uptake (65-85%), and atmospheric oxidation by hydroxyl radical (OH). Among the models, OsloCTM3 and WACCM have higher OH concentrations compared to GFDL, INCA and UKCA. Direct measurements of atmospheric OH concentrations are lacking due to the short lifetime of the OH radical. Therefore, we used CO and NO2 concentrations as a proxy to evaluate the models. Compared to satellite values (TROPOMI for NO2 and MOPPIT for CO), models seem to generally overestimate NO2 and underestimate CO. These results are discussed within the context of the OH radical and atmospheric lifetime of H2.

Then we present a simple box model that is developed using CTM results for studying the atmospheric budget of H2. Reconstructions of hydrogen concentrations using ice-core records from the South Pole over the last 150 years show an increase in H2 concentration of ~200ppb, likely due to increased methane oxidation and anthropogenic emissions. We use time-varying emissions in our box model to replicate this time evolution since the pre-industrial period.

The box model also contains a framework for studying hydrogen isotopic composition. Each of the sources and removal processes of H2 have distinct isotopic signatures. This allows for the evaluation of concurrent changes in atmospheric concentrations and hydrogen isotopic compositions for each source/sink contribution, leading to a more robust evaluation of the hydrogen budget in the atmosphere.

How to cite: Krishnan, S.: Atmospheric hydrogen budget: an evaluation using chemistry-transport models and a box model, EGU General Assembly 2024, Vienna, Austria, 14–19 Apr 2024, EGU24-16977, https://doi.org/10.5194/egusphere-egu24-16977, 2024.

EGU24-19183 | ECS | Posters on site | AS3.26

Fugitive hydrogen emissions from a converted national UK network of methane pipelines – stratospheric climate impacts 

Anna Peecock, Lars Schewe, and Stuart Haszeldine

Increased fugitive hydrogen in the stratosphere can promote chemical reactions that result in increased lifetimes and abundances of gases that have a harmful climate impact. It is therefore crucial to understand the significance of this effect, and thereon identify and mitigate potential leakage pathways within future hydrogen energy systems. Repurposing the existing high-pressure National Transmission System and low pressure local gas distribution networks for pure or blended hydrogen delivery throughout the UK, is a solution favoured by existing gas network operators. It minimises the necessary replacement of pipeline infrastructure by re-use of £30bn of already installed welded polythene pipe network and compatible assets, which will decrease associated transport costs. However, gaseous hydrogen can compromise mechanical properties of carbon steels, posing integrity concerns for pipelines and other network components. Considerable work has investigated the extent to which material integrity could affect the repurposing potential of existing infrastructure. By contrast, this study aims to quantify the ranges of anticipated increase in atmospheric hydrogen release upon conversion of existing UK gas networks for hydrogen delivery. Based on existing network architectures, provided by UK network operators, we identify the most likely locations for leakage within UK pipeline networks and present a static model to estimate potential fugitive hydrogen. Sensitivity analyses have been undertaken to assess the impact of emissions mitigation strategies, including polythene renewal in the Iron Mains Replacement Programme and replacement of wet compressor seals. Consequently, we can consider both physical leakage at joints and equipment, and permeation losses through pipe walls from natural gas leakage data. Our findings indicate that, while significant, the climate implications of determined theoretical rates of potential hydrogen leakage without mitigation are between 6.5 and 14 times less than those associated with current natural gas transport, based on respective GWP100s. It should be noted that we have considered only the potential emissions associated with pipeline transport, and have thus ignored the additional impact of embedded supply chain emissions.

We further propose a geospatial distribution of these potential hydrogen emissions across the UK network. The dataset could serve as a crucial input for future climate modelling to assess the impact of emission location dependency on hydrogen’s global warming potential and quantify the benefits of mitigating leakage in identified “hotspots”. 

How to cite: Peecock, A., Schewe, L., and Haszeldine, S.: Fugitive hydrogen emissions from a converted national UK network of methane pipelines – stratospheric climate impacts, EGU General Assembly 2024, Vienna, Austria, 14–19 Apr 2024, EGU24-19183, https://doi.org/10.5194/egusphere-egu24-19183, 2024.

EGU24-20693 | Posters on site | AS3.26

Quantifying the role of interactive chemistry on the anthropogenic effective radiative forcing in Earth System Models 

Jane Mulcahy, Martin Cussac, Dirk Olivie, Pierre Nabat, Martine Michou, and Juliette Lathiere

Many global climate and Earth system models that participated in CMIP6 did not include fully interactive chemistry mechanisms mainly due to the large associated computational cost of these schemes. A number of studies have recently highlighted the potential importance of enhanced aerosol-chemistry-climate coupling and associated feedbacks for the anthropogenic effective radiative forcing (ERF) of a number of key climate forcing agents such as aerosols (Thornhill et al., 2021), methane (O’Connor et al., 2022) and ozone. The different levels of complexity in both aerosol and chemistry schemes in CMIP6 models has been highlighted as a leading contributor to the large inter-model diversity in the ERF of aerosols and trace gas species (Thornhill et al., 2021). To this end, as part of the EU Horizon project, ESM2025, advanced stratospheric-tropospheric chemistry schemes have been developed and implemented in 2 ESMs, CNRM-ESM and NorESM2, for the first time. Dedicated experiments have been conducted to determine the pre-industrial (1850) to present-day (2014) ERF with these updated models and the UKESM1.1 model, to assess the impact of fully interactive chemistry on the ERF of key forcing agents. In UKESM1.1, which already includes interactive chemistry, the interactive chemistry scheme is switched off and run with a much-simplified aerosol-chemistry mechanism driven by prescribed oxidant fields. We argue the improved realism of representing these aerosol-chemistry-climate interactions is essential for improved cross-model consensus on the magnitude of anthropogenic ERFs of aerosol and key trace gas species.

References:

Thornhill et al., Effective radiative forcing from emissions of reactive gases and aerosols – a multi-model comparison, Atmos. Chem. Phys., 21, 853–874, https://doi.org/10.5194/acp-21-853-2021, 2021.

O’Connor et al., Apportionment of the pre-industrial to present-day climate forcing by methane using UKESM1: The role of the cloud radiative effect. Journal of Advances in Modeling Earth Systems, 14, e2022MS002991. https://doi.org/10.1029/2022MS002991, 2022.

How to cite: Mulcahy, J., Cussac, M., Olivie, D., Nabat, P., Michou, M., and Lathiere, J.: Quantifying the role of interactive chemistry on the anthropogenic effective radiative forcing in Earth System Models, EGU General Assembly 2024, Vienna, Austria, 14–19 Apr 2024, EGU24-20693, https://doi.org/10.5194/egusphere-egu24-20693, 2024.

EGU24-763 | ECS | Posters on site | BG1.1

The influence of pyrolysis time, moisture, and plant species on carbon bridgehead fraction of charcoal 

Vinothan Sivapalan and William Hockaday

Paleofire reconstructions are a challenging endeavor primarily due to the numerous factors involved in wildfire frequency, behavior, and regimes. These factors include, but are not limited to fuel composition, moisture, soil types, climate/weather conditions, and topographical features. Therefore, development of robust wildfire proxies requires vigorous experimental testing for multiple variables. Here, we explore the influence of pyrolysis time, moisture, and plant species on a novel proxy for fire intensity—carbon bridgehead fraction of charcoal. Experimentally, we have produced charcoals from three native Texas plants: live oak (Quercus sp.), Ashe juniper (Juniperus ashei), and broomsedge bluestem (Andropogon virginicus) under a range of temperature (300-700°C), moisture (0-100% moisture capacity), and time (0-1 hr) conditions in a tube furnace. Samples were analyzed using solid-state C-13 nuclear magnetic resonance (NMR) spectroscopy with two experiments to calculate carbon bridgehead fraction: cross polarization – magic angle spinning (CP-MAS) to quantify total aromatic carbon and dipolar dephasing (DD) to quantify aromatic bridgehead carbon. Results reveal significant differences between vegetation types, with moisture delaying or slowing the rate of carbon bridgehead formation. Relationship between carbon bridgehead fraction and time are less clear and may be influenced by the formation of pyrolysis byproducts (such as pyroligneous acids and free radicals) and/or signal losses in the cross-polarization spectra. To assess the influence of these factors on carbon bridgehead fraction we plan to conduct additional analyses on our experimental charcoals, including electron paramagnetic resonance (EPR) spectroscopy to quantify the free radicals in samples and C elemental analysis to assess carbon observability by NMR. Future work involves ground truthing the proxy to modern wildfires and subsequently applying it to paleorecords.

How to cite: Sivapalan, V. and Hockaday, W.: The influence of pyrolysis time, moisture, and plant species on carbon bridgehead fraction of charcoal, EGU General Assembly 2024, Vienna, Austria, 14–19 Apr 2024, EGU24-763, https://doi.org/10.5194/egusphere-egu24-763, 2024.

EGU24-1123 | ECS | Orals | BG1.1

Assessment of ecohydrological response of Himalayan Forest ecosystems to  forest fires 

Nagashree Ge and Ashutosh Sharma

Himalayan forests boast an incredible biodiversity, harboring a wide range of flora and fauna and playing a significant role in regulating water resources. Forest fires are one of the disturbances which constitute a major force influencing, even determining, the structure and functions of ecological components-populations, communities, and ecosystems. The ability to withstand disturbance is defined as resistance whereas resilience is the capacity to recover from disturbance. These two terms define the ecohydrological response to forest fire. This study insights on how remote sensing technique can be utilized for the measurement of ecohydrological response of a large extent of region subjected to forest fire based on resistance-resilience framework and how further implementation of these measures would help to know the changes in the interaction been vegetation and water cycle. Normalized burn ratio (NBR) is used to quantify the response.  The outcome of the study reveals that deciduous needled leaf forests are subjected frequently to forest fires compared to other classes of forests during 2002-2022. The regions considered for study showed moderate to high range of resistance but low resilience, signifying the region has gained and lost vegetations in the post-fire. There was a variation in rainfall and run-off occurred during the post-fire year for different burn severities. The present approach has the potential to quantify the response of ecosystems to the forest fire and related effects on hydrology of the region.

How to cite: Ge, N. and Sharma, A.: Assessment of ecohydrological response of Himalayan Forest ecosystems to  forest fires, EGU General Assembly 2024, Vienna, Austria, 14–19 Apr 2024, EGU24-1123, https://doi.org/10.5194/egusphere-egu24-1123, 2024.

From March to April, widespread forest fires and agro-residue burning frequently occur in Southeast Asia, which release large amounts of gas species and aerosols and impact air quality over the wide source and downwind regions. In this study, we investigated the impact of biomass burning (BB) over Southeast Asia on particulate matter concentrations and aerosol properties in downwind areas of the low-latitude plateau from 1 March to 30 April 2019, with a focus on a typical pollution event in Kunming (KM), the capital of Yunnan Province, by using a wide variety of observations from the Chenggong ground monitoring station in Yunnan University, an air quality network in China, satellite retrievals and ERA-5 reanalysis data and numerical simulation. A regional pollution event contributed by BB pollutants from Southeast Asia and the India-Myanmar trough occurred in Yunnan Province on 31 March to 1 April 2019, which was the only typical pollution event that pollution transmission ran through central Yunnan Province from south to north since 2013, when the Airborne Pollution Action Plan was unveiled by China government. The daily mean PM2.5, PM1, and black carbon concentrations increased by 73.3 μg m−3 (78%), 70.5 μg m−3 (80%), and 7.7 μg m−3 (83%), respectively, and the scattering and absorbing coefficients increased by 471.6 Mm−1 and 63.5 Mm−1 , respectively, at the Chenggong station. The southwest winds exceeding 2 km vertically thick appeared in front of the India-Myanmar trough over the fire regions, pushing BB plumes northward into Yunnan Province. The model results show that 59.5% of PM2.5 mass produced by BB in Yunnan Province was sourced from the Myanmar-Thailand border, and 29.3% was from western Myanmar at a lower altitude (<4.9 km), which indicated that BB in the Myanmar-Thailand border was the dominant contributor.

How to cite: Fan, W., Li, J., Han, Z., and Wu, J.: Impacts of biomass burning in Southeast Asia on aerosols over the low-latitude plateau in China: an analysis of a typical pollution event, EGU General Assembly 2024, Vienna, Austria, 14–19 Apr 2024, EGU24-1471, https://doi.org/10.5194/egusphere-egu24-1471, 2024.

EGU24-1756 | ECS | Orals | BG1.1

Direct Estimation of Carbon Emissions from High Latitude Fires: The Adapted FREM Approach 

Will Maslanka and Martin Wooster

Landscape fires are a widespread natural phenomenon that directly influences carbon cycling through the combustion of organic material. Space-based remote sensing, including Active Fire (AF), remains the only way to estimate wildfire activity accurately on the regional-to-global scale. Fire emission inventories generally fall into two categories. “Bottom-up” methodologies rely on observations of AF counts, Fire Radiative Power (FRP), or burned area to estimate the amount of biomass burned, or “Top-down” methodologies, which directly relate observations of FRP to landscape fire emission estimates. Bottom-up methods tend to have a reliance on uncertain parameters, such as pre-fire fuel load and combustion completeness, or a conversion factor between FRP and fuel consumption rate. The Fire Radiative Energy Emission (or FREM) approach is one such top-down methodology that has removed such a reliance, by directly relating FRP to observed rates of emissions, such as CO or aerosols, but has so far been used with geostationary FRP data only. Whilst very effective at lower latitudes, due to the poor spatial resolution and extreme viewing geometry of geostationary data at higher latitudes, the approach is not applicable for fires in this region in its current format. However, by using polar orbiting FRP data and making use of the high latitude orbital convergence, this study looks to adapt the FREM approach to deliver direct estimation of carbon emissions for high latitude (>60°N) landscape fires. We use direct observations of FRP, from Suomi-NPP, NOAA-20 and MODIS, along with observations of Total Column Carbon Monoxide from TROPOMI onboard Sentinel-5P. A series of cloud-free plumes and associated FRP data were identified in Deciduous and Evergreen Needleleaf biomes in North America and Russia in the summers of 2019 – 2023. The resulting emission coefficients and emission totals were compared to pre-existing top-down and bottom-up emission coefficients and totals from the FEER, GFAS, and GFED inventories for high latitude fires between 2018-2023. This adapted FREM approach is shown to provide direct emission estimates without recourse to significant assumptions and can do so in real time – opening up a new avenue for real-time fire emission estimation at high latitudes.

How to cite: Maslanka, W. and Wooster, M.: Direct Estimation of Carbon Emissions from High Latitude Fires: The Adapted FREM Approach, EGU General Assembly 2024, Vienna, Austria, 14–19 Apr 2024, EGU24-1756, https://doi.org/10.5194/egusphere-egu24-1756, 2024.

EGU24-2099 | ECS | Orals | BG1.1

Exploring the effect of vegetation photosynthesis phenology on wildfire dynamics 

Gengke Lai, Jialing Li, Jun Wang, Chaoyang Wu, Yongguang Zhang, Constantin M. Zohner, and Josep Peñuelas

2023 has witnessed a record-breaking extreme wildfire season in Canada from coast to coast, following closely to the unprecedented wildfire outbreaks in 2019/20 Australia and 2021 Siberia, causing far-reaching threats on terrestrial carbon stock, air quality, and human society. The heightened wildfire activity in specific regions prompts us to rethink the underlying factors driving the global wildfire dynamics. Climate change has been recognized as an important factor in amplifying wildfire risk, mainly through increasing temperature and reducing relative humidity. However, the role of vegetation productivity and phenology on wildfire dynamics remains elusive, even though which can exacerbate or mitigate the climate-induced fire risk. Importantly, changes in vegetation phenology can cause biophysical feedback to the climate system and land surface by modulating the exchanges of water and energy between land and the atmosphere. Considering the climate feedback of vegetation phenology, we hypothesize that peak photosynthesis timing (PPT) can contribute to wildfire activity. To explore it, we provide comprehensive analyses using multiple satellite-based photosynthesis observations from solar-induced chlorophyll fluorescence (SIF), and wildfire activity from national fire perimeters and MODIS global burned area records from 2001 to 2018, as well as diverse methodologies and models. In response to changes in various biological and climatic factors, we find PPT has advanced 1.10 ± 0.57 days per decade at a global scale. This earlier PPT acts to expand the extent of wildfires, with an increase in the global average burned fraction by 0.021% (~2.20 Mha) for every additional day of PPT advancement. Satellite observations and the Earth system modeling consistently reveal that this expansion is attributed to the intensified drought conditions during the potential fire season, induced by the earlier PPT that can modulate the global patterns of temperature, precipitation, and surface soil moisture. Furthermore, current fire-vegetation models participating in the FireMIP project underestimate the sensitivity of burned area to PPT, despite reproducing their negative correlation. Our findings highlight the importance of climate-vegetation-fire feedback loops in future prediction of wildfire dynamics and the strategy of climate change adaptation and mitigation.

How to cite: Lai, G., Li, J., Wang, J., Wu, C., Zhang, Y., Zohner, C. M., and Peñuelas, J.: Exploring the effect of vegetation photosynthesis phenology on wildfire dynamics, EGU General Assembly 2024, Vienna, Austria, 14–19 Apr 2024, EGU24-2099, https://doi.org/10.5194/egusphere-egu24-2099, 2024.

EGU24-4071 | ECS | Posters on site | BG1.1 | Highlight

The Influence of Climate Teleconnections on Global Burned Area 

Yuquan Qu, Harry Vereecken, Sander Veraverbeke, and Carsten Montzka

Wildfires are known to be controlled by fuels and weather. Climate teleconnections may influence wildfires by altering fuel availability and fire weather. In this study, we used the random forest approach to systematically detect relationships between teleconnection climate indices (CIs) and burned area while accounting for different lag times. Results indicate that burned area is especially modulated by climate teleconnections in Africa and Australia. The Tropical Northern Atlantic (TNA) pattern was the most influential CI for the global burned area, followed by the El Niño Southern Oscillation (ENSO), the Indian Ocean Dipole (IOD), and the Pacific–North American (PNA) pattern. To study pathways of how teleconnections affect the burned area, we distinguished two classes of fire drivers: bottom-up fuel availability and top-down weather conditions. Bottom-up fuel drivers showed higher correlation with CIs than top-down weather drivers and served as mediators between teleconnections and wildfires. The mediating effect of top-down weather drivers was only apparent in specific seasons. Our study highlights that in teleconnection-wildfire hotspot regions, knowledge of the relation between CIs and drivers of wildfires could improve long-term wildfire predictability. We recommend that bottom-up fuel drivers should also be integrated into wildfire predictive frameworks as they play an important mediating role in linking teleconnections and wildfires.

How to cite: Qu, Y., Vereecken, H., Veraverbeke, S., and Montzka, C.: The Influence of Climate Teleconnections on Global Burned Area, EGU General Assembly 2024, Vienna, Austria, 14–19 Apr 2024, EGU24-4071, https://doi.org/10.5194/egusphere-egu24-4071, 2024.

EGU24-5191 | ECS | Orals | BG1.1 | Highlight

Impacts of land use change and interannual climate variability on biomass burning emissions, air quality and public health in Amazon 

Tsin Hung Leo Ng, Amos P. K. Tai, Stephen Sitch, Luiz Aragao, and Shixian Zhai

Biomass burning in Amazon Basin has a significant impact on regional climate and deteriorates regional air quality, which poses a threat to human and ecosystem health. The fire-induced pollution worsens during dry season (Jul to Nov) and shows a strong seasonal variation. Past research has demonstrated that the occurrence of wildfires in Amazon is not only influenced by deforestation, but also interannual climate variability, particularly droughts. Here we estimate the impacts of deforestation and droughts on fire emissions and regional air quality between 2010 to 2015 by using Global Fire Emission Database Version 4 (GFED v4) to drive a global 3-D atmospheric chemical transport model GEOS-Chem High Performance (GCHP) and further examine the effect of PM2.5 and O3 on premature mortality across the region. By comparing the “fire-on” and “fire-off” scenarios, we find that biomass burning alone in normal years (2011 and 2013) contributes 5.7 μg m-3 (47.6% of the total concentration) PM2.5, 0.08 ppm (46.3%) CO, 0.03 ppb (85.0%) NOx, and 9.5 ppb (41.2%) O3; and these numbers during drought years (2010, 2012, 2014 and 2015) increase to 19.6 μg m-3 (74.7%) for PM2.5, 0.20 ppm (67.0%) for CO, 0.19 ppb (97.4%) for NOx, and 15.6 ppb (52.0%) for O3. We find that these pollutants from wildfires mainly concentrate in the south-eastern Amazon and then transport southward, thus strongly impacting public health in the downwind regions. We estimate that premature mortality due to long-term exposure to particulate matter and ozone by applying the simulated concentration to the concentration-response functions from the European Environment Agency. We find that ~8,500 and ~10,400 deaths per year are attributable to PM2.5 and O3 exposure for 2010-2015 respectively. During drought years, we discover there are 2.8% and 3.4% more deaths than normal years for PM2.5 and O3 exposure. Our study shows the significance of biomass burning emissions in shaping the air quality in the Amazon region, and highlights the impact of drought events on enhancing biomass emissions, worsening regional air quality and causing public health issues. Therefore, it is important to address the underlying causes of biomass burning in the Amazon, such as deforestation and land use change, and droughts, to protect the region's ecosystems and mitigate the impacts of climate change.

How to cite: Ng, T. H. L., Tai, A. P. K., Sitch, S., Aragao, L., and Zhai, S.: Impacts of land use change and interannual climate variability on biomass burning emissions, air quality and public health in Amazon, EGU General Assembly 2024, Vienna, Austria, 14–19 Apr 2024, EGU24-5191, https://doi.org/10.5194/egusphere-egu24-5191, 2024.

EGU24-5236 | ECS | Posters on site | BG1.1 | Highlight

Are there lightning Fires in the Amazon Rainforest? 

Cunhui Zhang, Thomas Janssen, Matt Jones, and Sander Veraverbeke

Tropical rainforests have exceptionally high biodiversity and store large amounts of carbon in biomass. However, large and frequent fires across tropical rainforests in the last decades threaten the ecosystem integrity of these ecosystems. The general belief is that fires in the Amazon rainforest are all human-ignited and that lightning fires do not occur in rainforests due to the predominant wet conditions. However, recent research indicates the possibility of lightning fires in tropical rainforests. Here, we aim to investigate the occurrence of lightning-ignited fires in the Amazon rainforest, a topic that has been largely overlooked in the current understanding of fire dynamics in this biome. We collected and analyzed data on lightning strikes, fire occurrences, and weather patterns derived from satellite imagery and climate datasets. The objective is to detect, quantify, and characterize lightning fires in the Brazilian Amazon rainforests, thereby providing new insights into the natural fire regime of this crucial ecosystem.

How to cite: Zhang, C., Janssen, T., Jones, M., and Veraverbeke, S.: Are there lightning Fires in the Amazon Rainforest?, EGU General Assembly 2024, Vienna, Austria, 14–19 Apr 2024, EGU24-5236, https://doi.org/10.5194/egusphere-egu24-5236, 2024.

EGU24-5348 | Posters on site | BG1.1

Wetlands in monoculture forests – how fire activity and different forest management strategies impact Sphagnum-dominated peatlands 

Katarzyna Marcisz, Mariusz Bąk, Mariusz Lamentowicz, Piotr Kołaczek, Thomas Theurer, Paweł Matulewski, and Dmitri Mauquoy

Monoculture forests are now a dominant forest type in Europe. Created for easier management and increased timber production, they are now witnessing many disturbances due to climate change, such as more frequent windthrows, droughts, fires or insect outbreaks. The functioning of forests impacts other elements of the landscape, including peatlands, which also have been affected by various natural and anthropogenic disturbances (e.g., drainage) that make them more vulnerable to drying and burning. We aim to recognize how peatland functioning has changed along with changing forest management strategies. For this we studied a Sphagnum-dominated peatland located in the Tuchola Pinewoods – one of the largest Scots pine (Pinus sylvestris) monoculture forest in Poland. We used high-resolution multi-proxy palaeoecology including pollen, plant macrofossils and testate amoebae, additionally focusing on a wide range of charcoal analyses: charcoal counts, charcoal morphological types, and Raman spectroscopy. Our results show that the studied peatland experienced several critical transitions in vegetation composition and hydrology over the last 600 years when new forest management techniques were introduced. A reduction in fire activity led to a dominance of Sphagnum and increased peat accumulation rates. Establishment of a monoculture forest further impacted the site and stabilized Sphagnum growth and acidity levels. We believe that these results can be helpful for the improvement of conservation planning for peatlands located in forested areas, especially in monoculture forests.

The study is funded by the National Science Centre, Poland (2020/39/D/ST10/00641).

How to cite: Marcisz, K., Bąk, M., Lamentowicz, M., Kołaczek, P., Theurer, T., Matulewski, P., and Mauquoy, D.: Wetlands in monoculture forests – how fire activity and different forest management strategies impact Sphagnum-dominated peatlands, EGU General Assembly 2024, Vienna, Austria, 14–19 Apr 2024, EGU24-5348, https://doi.org/10.5194/egusphere-egu24-5348, 2024.

EGU24-5494 | ECS | Orals | BG1.1 | Highlight

Half of global burned area is due to managed anthropogenic fire: findings from a coupled socio-ecological modelling approach  

Oliver Perkins, Matthew Kasoar, Apostolos Voulgarakis, Tamsin Edwards, and James Millington

Globally, vegetation fires are a key component of many ecosystems and have substantial impacts on carbon emissions. Yet humans also use and manage fires for a huge range of purposes around the world, dependent on numerous social and biophysical factors. Existing representations of anthropogenic fire in dynamic global vegetation models (DGVMs) have been highly simplified, with readily available global variables (e.g. population density) used to estimate numbers of anthropogenic ignitions. Here, we present results from a novel coupled socio-ecological modelling approach to improve understanding of how human and biophysical factors combine to drive the spatio-temporal distribution of global fire regimes. Specifically, we present the integration of two process-based models. The first is the Wildfire Human Agency Model (WHAM!1), which draws on agent-based approaches to represent anthropogenic fire use and management. The second model is JULES-INFERNO2, a fire-enabled DGVM, which takes a physically-grounded approach to the representation of vegetation-fire dynamics.

The new WHAM-INFERNO model ensemble suggests that as much as half of all global burned area is generated by managed anthropogenic fires - typically small fires that are lit and spread according to specific land use objectives (such as crop residue burning). Furthermore, we demonstrate that including representation of managed anthropogenic fires in a coupled socio-ecological simulation can improve understanding of the biophysical drivers of unmanaged wildfires, by allowing clearer recognition of the role of anthropogenic land management in global fire regimes. Hence, WHAM-INFERNO is applied to understand how landscape fragmentation, wider land use change, and changes in human fire management have together led to observed recent declines in global burned area despite the warming climate. Overall, findings presented here have substantial implications for understanding of present and future fire regimes, indicating that changes to socio-economic systems are at least as important a consideration as climate change.  

1. Perkins, O., Kasoar, M., Voulgarakis, A., Smith, C., Mistry, J., and Millington, J. (2023). A global behavioural model of human fire use and management: WHAM! v1.0. EGUsphere, 1–42. 10.5194/egusphere-2023-2162.

2. Mangeon, S., Voulgarakis, A., Gilham, R., Harper, A., Sitch, S., and Folberth, G. (2016). INFERNO: a fire and emissions scheme for the UK Met Office’s Unified Model. Geosci. Model Dev. 9, 2685–2700. 10.5194/gmd-9-2685-2016.

How to cite: Perkins, O., Kasoar, M., Voulgarakis, A., Edwards, T., and Millington, J.: Half of global burned area is due to managed anthropogenic fire: findings from a coupled socio-ecological modelling approach , EGU General Assembly 2024, Vienna, Austria, 14–19 Apr 2024, EGU24-5494, https://doi.org/10.5194/egusphere-egu24-5494, 2024.

EGU24-6077 | ECS | Orals | BG1.1

Updated Exposure Estimate for Indonesian Peatland Fire Smoke using Network of Low-cost Purple Air PM2.5 sensors 

Ailish M Graham, James B McQuaid, Thomas E L Smith, Hanun Nurrahmawati, Devina Ayona, Hasyim Mulawarman, Chaidir Adam, Dominick V Spracklen, Richard Rigby, and Shofwan A B Choiruzzad

Air pollutant emissions from wildfires on Indonesian peatlands lead to poor regional air quality across south-east Asia. Fine particulate matter (PM2.5) emissions are particularly high for peat fires leading to substantial population exposure to PM2.5. Despite this, air quality monitoring is limited in regions close to peat fires meaning the impacts of peatland fires on air quality is poorly understood and it is difficult to evaluate predictions from atmospheric chemistry models. To address this, we deployed a network of low-cost (Purple Air) PM2.5 sensors at 8 locations across Central Kalimantan, where peat fires are frequent. The sensors measured indoor and outdoor PM2.5 concentrations during August to December 2023. During the haze season (September 1st to October 31st), daily mean outdoor concentrations were 120 mg m-3 but peaked at >400 mg m-3. Indoor PM2.5 concentrations were only ~10% lower (mean 110 mg m-3), indicating that is difficult for the population to reduce their exposure to PM2.5 from fires. The reduction in mean PM2.5 concentrations between outdoor and indoor environments was larger in urban locations (-11%) compared with rural locations (-3%), suggesting urban housing may provide better protection from outdoor air pollution. To generate an updated assessment for the population’s exposure to peatland fire PM2.5 we combine the information from monitoring both indoor and outdoor PM2.5 concentrations with modelled ambient (outdoor) PM2.5 concentrations from the WRF-Chem atmospheric chemistry transport model. Our updated exposure assessment accounts for the population’s personal exposure to peatland fire PM2.5 for the first time.

How to cite: Graham, A. M., McQuaid, J. B., Smith, T. E. L., Nurrahmawati, H., Ayona, D., Mulawarman, H., Adam, C., Spracklen, D. V., Rigby, R., and Choiruzzad, S. A. B.: Updated Exposure Estimate for Indonesian Peatland Fire Smoke using Network of Low-cost Purple Air PM2.5 sensors, EGU General Assembly 2024, Vienna, Austria, 14–19 Apr 2024, EGU24-6077, https://doi.org/10.5194/egusphere-egu24-6077, 2024.

EGU24-6624 | ECS | Orals | BG1.1

Excessive fire occurrence in Romania from 2001 to 2022: Trends and drivers across ecoregions and land cover classes 

Till Mattes, Irene Marzolff, and Angelica Feurdean

Wildfire is an integral part of temperate ecosystems, but human activities have significantly altered fire regimes, including frequency, size, intensity and seasonality. Romania, located in central-eastern Europe, recently exhibited the highest biomass burning in Europe. However, little is known of the trends and determinants of fire recurrence, apart from the common use of fire to clear crop residues on arable land. This study utilizes satellite-based fire data (FIRMS) from 2001 to 2022 and land cover maps (CORINE) to investigate temporal trends in fire occurrence across ecoregions and land cover types in Romania and identify those most susceptible to fire.

Over 2001-2022, Romania witnessed a total of 0.44 fires/ km² averaging 0.02 fires/km²/yr. Our analysis revealed a declining trend in fire occurrence along an elevation gradient, from plains to hills, plateaus and mountains, aligning with the prevalence of the dominant land cover classes and climatic gradients. Agricultural land cover types demonstrated the highest fire incidence, with arable land exhibiting the highest rate (0.04 fires/km²/yr) and forests the lowest (below 0.01 fires/km²/yr). Following the accession of Romania to the EU in 2007 and the prohibition of agricultural fires, a reduction in burning on arable land (crop residues) can be observed, while the use of fire in other agricultural classes persisted or even increased, indicating a more complex effect of socio-economic developments on fire pattern. Specifically, areas more marginal for agriculture, such as complex agricultural fields interspaced with housing and natural vegetation continued to employ fire as a management tool.

Natural land cover classes, such as wetlands principally occupying the Danube Delta (0.06 fires/km²/yr) and natural grasslands (0.01 fires/km²/yr), also experienced substantial fire occurrences and an intensification in more recent periods. Given the rarity of naturally ignited fires (lightning) in Romania, the intentional use of fire to clear dry reed biomass for land regeneration appears to be prevalent also in moist areas. Remarkably, broadleaved and mixed forests burned more frequently than coniferous forests despite the latter having traits to convey high flammability and burn with high frequency. This feature suggests that fires in broadleaved forests, predominant at low and mid elevations, likely expanded from neighbouring agricultural lands.

Crucially, our analysis highlights that years with elevated fire occurrence coincide with extreme droughts and heatwaves (e.g., 2012, 2015), emphasizing the influence of extreme climate conditions in accelerating fire episodes and the spread of fires initiated in agricultural areas into natural and semi-natural habitats. Given the substantial occurrence of fires in agricultural land but also in natural habitats, such as wetlands and grasslands in Romania, research investigating the risks and vulnerability of these habitats to fire should be prioritized.

How to cite: Mattes, T., Marzolff, I., and Feurdean, A.: Excessive fire occurrence in Romania from 2001 to 2022: Trends and drivers across ecoregions and land cover classes, EGU General Assembly 2024, Vienna, Austria, 14–19 Apr 2024, EGU24-6624, https://doi.org/10.5194/egusphere-egu24-6624, 2024.

Wildfires have become more prevalent in recent years because of climate change. Meanwhile wildfires, as a major type of biomass burning, could emit a large amount of black carbon (BC) and brown carbon (BrC) to the atmosphere. Since BC and BrC play important roles in climate change, air pollution and human health issues, it is necessary to research their physicochemical properties to evaluate their impacts on urban areas. Here we present BC mass concentration and absorption coefficients measured by aethalometer (AE43), combing with the chemical constitutions acquired by GC-MS, during the record-breaking 2023 wildfire season in Canada. The back-trajectory analysis indicated that the smoke mainly came from north Quebec where the wildfires took place. We demonstrated how BC and BrC emitted by wildfires could affect urban regions after long-range transport.

How to cite: Li, H. and Ariya, P.: Measurement of Physicochemical Properties of Black Carbon and Brown Carbon and the Impacts of Canada Record-Breaking Wildfires in Summer 2023 , EGU General Assembly 2024, Vienna, Austria, 14–19 Apr 2024, EGU24-6761, https://doi.org/10.5194/egusphere-egu24-6761, 2024.

EGU24-7467 | ECS | Posters on site | BG1.1

The Impact of Wildfires on Atmospheric Nitrogen Deposition in the United States: A Multiple Linear Regression-based Analysis 

Jiangshan Mu, Yingnan Zhang, Chenliang Tao, Zhou Liu, Yu Zhao, Lei Zhang, Yuqiang Zhang, and Likun Xue

Nitrogen deposition can exert a significant impact on global ecosystems. The increased occurrence of natural factors such as wildfires are becoming more important in atmospheric deposition especially with the continued decreases of the anthropogenic emissions in developed countries. In this study, we investigate the mechanisms by which the increasingly frequent wildfires affect nitrogen deposition in the United States using comprehensive datasets and multiple linear regression (MLR) methods. We found a downward trend in nitrogen deposition in the U.S. (-0.09 kgN ha yr-1), mainly due to the decreases in oxidative nitrogen deposition (-0.1 kgN ha yr-1). In contrast, reduced nitrogen deposition showed a slight increase (0.02 kgN ha yr-1). Our preliminary results show that wildfires contributed ~10% to the U.S. domestic deposition overall, but the magnitudes and signs of impact vary geographically, depending on the frequency and intensity of wildfires and the dominant deposition types. On average across the U.S., wildfires predominantly negatively contribute to wet deposition, while their contributions to dry deposition is smaller or slightly positive. Specifically, wildfires enhance dry deposition in the western U.S. while inhibiting wet deposition in the southeastern U.S. Wildfires exert a suppressive effect on both oxidized and reduced forms of nitrogen deposition in the southeastern U.S. Our study highlights the significant influence of wildfires on nitrogen deposition, underscoring the need to consider wildfire events in environmental management and policy-making.

How to cite: Mu, J., Zhang, Y., Tao, C., Liu, Z., Zhao, Y., Zhang, L., Zhang, Y., and Xue, L.: The Impact of Wildfires on Atmospheric Nitrogen Deposition in the United States: A Multiple Linear Regression-based Analysis, EGU General Assembly 2024, Vienna, Austria, 14–19 Apr 2024, EGU24-7467, https://doi.org/10.5194/egusphere-egu24-7467, 2024.

EGU24-7895 | ECS | Posters on site | BG1.1

Vegetation types influence fine-scale drought impact on land surface cooling and burn patterns in the Siberian coastal tundra 

Nils Rietze, Jakob Assmann, and Gabriela Schapeman-Strub

In 2020, the Northeastern Siberian lowland tundra faced an extreme drought and unprecedented wildfires. The burning of carbon-rich soils in this region can release large amounts of carbon, worsening climate change and Arctic warming.  However, we know little about of how droughts impact vegetation and how this vegetation might become fuel for large fires in the typically wet landscapes of the Northeastern Siberian lowland tundra. We studied the impact of the extreme summer drought in 2020 on the tundra vegetation and the resulting burn patterns in the Indigirka lowlands using a combination of in-situ, thermal, and multispectral remote sensing data from drone and high-resolution satellite imagery. The fine-scale vegetation types revealed increased landscape-wide drought susceptibility indicated by an overall loss of land surface cooling. This suggests a shift towards an energy budget dominated by sensible heat flux, which may feed back and intensify the heatwave.  Further, we found that mostly dry vegetation types were affected by fire in the NE Siberian coastal tundra, while wetter vegetation types did not burn, leading to a fine-scale heterogeneous burn pattern. Our results indicate that the enhanced drought susceptibility of vegetation types may have led to higher fire fuel connectivity of the tundra landscape. Consequently, this may have resulted in the large burn extents observed in 2019 and 2020. Our analysis is an effort toward the prediction of fire fuel connectivity and fire management in remote Arctic areas.

How to cite: Rietze, N., Assmann, J., and Schapeman-Strub, G.: Vegetation types influence fine-scale drought impact on land surface cooling and burn patterns in the Siberian coastal tundra, EGU General Assembly 2024, Vienna, Austria, 14–19 Apr 2024, EGU24-7895, https://doi.org/10.5194/egusphere-egu24-7895, 2024.

EGU24-8017 | ECS | Posters on site | BG1.1

Combining stand-level and remote sensing data to model post-fire recovery of Mediterranean tree-forest communities – A case study in Spain. 

Raul Hoffren, Juan de la Riva, Darío Domingo, María Teresa Lamelas, Paloma Ibarra, Alberto García-Martín, and Marcos Rodrigues

Mediterranean forests are recurrently affected by wildfires. Fire activity is expected to accelerate in the future due to landscape homogenization, fuel accumulation, and climate warming. A key aspect to prevent and mitigate the negative impacts of wildfires on ecosystems is to understand the factors that govern the recovery of forest communities. This study analyzes the post-fire recovery potential of four representative Mediterranean tree-communities (Pinus halepensis, Pinus nigra, Pinus pinaster, and Quercus ilex) affected by large wildfires (> 500 ha) during the summer of 1994 in Spain. For this purpose, information collected in the field 25 years after the fires in 203 forest plots (131 burned and 72 unburned control plots) was coupled with remote sensing, geospatial, and forest inventory data, to build an empirical model capable of assessing recovery. Remote sensing data provided a proxy for burn severity, through the Composite Burn Index, and allowed modelling the local topography (slope and aspect) of the terrain. The geospatial data included climatic information on temperature and precipitation trends. These data were entered into the model, calibrated using Random Forest, to provide information on the degree of recovery, inferred from the similarity (in terms of vegetation height, aboveground biomass, species diversity) between the burned and unburned control plots. Results showed that only the 25% of the burned plots can be considered as recovered. The burn severity had a significant effect on the recovery albeit strongly modulated by local topography. Overall, the key features of the recovered plots were a low-to-moderate burn severity and a favorable topographical setting, especially the shading effect of steep northwestern slopes. Furthermore, a warmer and more humid climate improved the capacity of recovery. These results constitute a valuable tool for improving forest management and preserving ecosystem services.

How to cite: Hoffren, R., de la Riva, J., Domingo, D., Lamelas, M. T., Ibarra, P., García-Martín, A., and Rodrigues, M.: Combining stand-level and remote sensing data to model post-fire recovery of Mediterranean tree-forest communities – A case study in Spain., EGU General Assembly 2024, Vienna, Austria, 14–19 Apr 2024, EGU24-8017, https://doi.org/10.5194/egusphere-egu24-8017, 2024.

Wildfires pose an increasing threat to boreal forest and tundra ecosystems in boreal North America (Alaska and northwestern Canada), as their frequencies rise under global warming. These fires exhibit strong interannual variability that is influenced by regional atmospheric circulation. However, potential impacts of remote boundary forcings on regional fires and the underlying mechanisms remain unclear. This study provides a comprehensive analysis on the impacts of spring sea surface temperature (SST) and sea ice on interannual variability of burned area in this region during fire season (summer) from 1997 to 2020 using GFED5 burned area, SST and sea ice concentration data from the Met Office Hadley Centre, and ERA5 reanalysis data. Results show that in spring a warmer SST in the East Pacific and reduction of sea ice in the northern Chukchi Sea lead independently to an increase in burned area in boreal North America. The correlation coefficients between the SST and sea ice factors with the burned area in boreal North America are 0.43 and –0.44 respectively. The SST-fire relationships can be explained as follows: A warm SST anomaly in the East Pacific triggers a northeastward-propagated Rossby wave, inducing a high-pressure anomaly over boreal North America in spring. Consequently, this circulation anomaly causes a higher surface temperature and thus vegetation growth or drying. As temperatures rise and lightning activity intensifies in summer, burned area increases. On the other hand, the process of sea ice affecting burned area is different. A reduction in sea ice coverage in the northern Chukchi Sea leads to a decrease in surface albedo, resulting in an increase in heat flux. The heat release persists from spring to summer and causes a high-pressure circulation anomaly in boreal North America in summer, which suppresses regional water vapor convergence and precipitation, reducing soil moisture and surface air humidity and increasing vapor pressure deficit (VPD) thereby promoting fuel flammability.

How to cite: Zhao, Z., Lin, Z., and Li, F.: Impacts of Spring East Pacific SST and Arctic Sea Ice on Interannual Variability of Summer Burned Area in boreal North America, EGU General Assembly 2024, Vienna, Austria, 14–19 Apr 2024, EGU24-8303, https://doi.org/10.5194/egusphere-egu24-8303, 2024.

EGU24-8506 | Orals | BG1.1

Anticipating future extreme wildfire events by coupling ignition and success of initial attack models 

Pere Joan Gelabert Vadillo, Adrian Jiménez Ruano, Fellice Catelo, and Marcos Rodrigues Mimbrero

In recent years, the EU Commission has enacted various firefighting policies to combat and diminish the adverse effects of wildfires. The Mediterranean area has experienced an observable extension of its wildfire season, coupled with rapid shifts in fire-weather dynamics, resulting in exceptionally severe wildfire occurrences. As of 2022, the EU has recorded an approximate total burned area of 792,902 hectares, with forests accounting for 66% of this figure (Rodrigues et al., 2023).

The main objective of this study is to anticipate extreme wildfire conditions by providing a synthetic product depicting the chances of a fire event starting and escaping containment. To do so, we combined empirical models of ignition likelihood and effectiveness of the initial attack stage. We employed machine learning techniques to calibrate binary regression models using historical wildfire ignition data and geospatial layer depicting the main drivers of ignition and containment, namely: accessibility, human pressure on wildlands, fuel moisture and availability. We illustrate our approach along the Mediterranean coastal region of Spain. Our approach enables us to predict wildfire contention capacity under diverse population growth and climate warming scenarios. This strategy aims to improve disaster risk reduction by pointing wildfire management zones and prioritizing intervention in high-risk areas.

Results indicate a high predictive ability to model human-caused wildfire ignition (AUC>0.80) but a modest capability to capture the containment capability (AUC≈0.70). Accessibility by road largely controls the spatial pattern of ignition and containment, with dead fuel moisture content modulating the temporal pattern of probability. We further illustrate the approach by providing insights into future SSP (Shared Socieconomic Pathways) scenarios by synthesizing both products into comprehensive management zones (Rodrigues et al., 2022).


References

Rodrigues, M., Camprubí, À.C., Balaguer-Romano, R., Megía, C.J.C., Castañares, F., Ruffault, J., Fernandes, P.M., Dios, V.R. de, 2023. Drivers and implications of the extreme 2022 wildfire season in Southwest Europe. Science of The Total Environment 859, 160320. https://doi.org/10.1016/j.scitotenv.2022.160320

Rodrigues, M., Zúñiga-Antón, M., Alcasena, F., Gelabert, P., Vega-Garcia, C., 2022. Integrating geospatial wildfire models to delineate landscape management zones and inform decision-making in Mediterranean areas. Safety Science 147, 105616. https://doi.org/10.1016/j.ssci.2021.105616

How to cite: Gelabert Vadillo, P. J., Jiménez Ruano, A., Catelo, F., and Rodrigues Mimbrero, M.: Anticipating future extreme wildfire events by coupling ignition and success of initial attack models, EGU General Assembly 2024, Vienna, Austria, 14–19 Apr 2024, EGU24-8506, https://doi.org/10.5194/egusphere-egu24-8506, 2024.

EGU24-8507 | ECS | Posters on site | BG1.1

Unravelling Variability: Discrepancies in Amazonian Biomass Burning Emissions Under Different Emission Factor Scenarios  

Guilherme Mataveli, Matthew W. Jones, Gabriel Pereira, Saulo R. Freitas, Valter Oliveira, Esther Brambleby, and Luiz E.O. C. Aragão

Biomass burning (BB) plays a key role in the biosphere–atmosphere interaction. It is a major source of trace gases and aerosols that alters the atmosphere and the water cycle. Additionally, these emissions are often related to other detrimental impacts including biodiversity loss in fire-sensitive biomes, increase of respiratory diseases, and massive economic losses. BB emissions are used as inputs in models that estimate air quality and the effect of fires on Earth’s climate. Hence, an accurate estimation of BB emissions is paramount. While BB emissions spread over most of the global vegetated areas, the integration of orbital remote sensing and modelling is the most effective approach to estimate them from regional to global scales. BB emission estimation follows the relationship between burned biomass and the emission factor (EF - mass emitted of a given species, for example carbon dioxide, per mass of dry matter burned). The burned biomass can be estimated using two approaches: (i) based on the relationship among burned area, above-ground biomass, and combustion completeness; or (ii) based on fire radiative power (FRP), a quantitative measurement that is directly related to the rate of burned biomass and is estimated to each active fire detected by several orbital sensors such as the Moderate Resolution Imaging Spectroradiometer (MODIS) sensor. EF values, which are Land Use and Land Cover (LULC) based, are required to estimate BB emissions independently on the approach adopted to estimate the burned biomass. Although novel approaches to improve the accuracy of BB emissions have been developed, the impact of EF values on the final estimated emissions remains uncertain. We have evaluated the impact of the EFs on the final estimate of fine particulate matter (PM2.5) emitted from BB in the Brazilian Amazon during a nineteen years’ time series (2002-2020) by running the PREP-CHEM-SRC emissions preprocessor tool under four EF scenarios: the tool original EF values based on the work of Andreae and Merlet (2001), the average EF values recently updated by Andreae (2019), and the minimum and maximum EF values also proposed by this author. The minimum (maximum) EF values were defined as the average EF value for each LULC class minus (plus) one standard deviation. The PM2.5 emissions were estimated at the spatial resolution of 0.1º using the FRP approach implemented on PREP-CHEM-SRC (3BEM_FRP model) having MODIS active fires as input, since this approach requires fewer inputs and the impact of the EFs over the emissions would be more evident. Our results showed that the annual average PM2.5 emission in the Amazon varied by 163% between the four EF scenarios (from1,426 Gg and 3,747 Gg), while the scenario based on the average values was the closest to the one based on PREP-CHEM-SRC original EF values (2,582 Gg and 2,213 Gg, respectively – an increase of 17%). These results contribute to the better understanding of how this single parameter impacts on the estimation of BB emissions.

How to cite: Mataveli, G., W. Jones, M., Pereira, G., R. Freitas, S., Oliveira, V., Brambleby, E., and E.O. C. Aragão, L.: Unravelling Variability: Discrepancies in Amazonian Biomass Burning Emissions Under Different Emission Factor Scenarios , EGU General Assembly 2024, Vienna, Austria, 14–19 Apr 2024, EGU24-8507, https://doi.org/10.5194/egusphere-egu24-8507, 2024.

EGU24-8668 | ECS | Posters on site | BG1.1

Effect of long-range transported fire emissions on aerosol and cloud properties at high latitudes: In situ measurements and satellite observations 

Snehitha M. Kommula, Angela Buchholz, Yvette Gramlich, Tero Mielonen, Liqing Hao, Iida Pullinen, Lejish Vettikkat, Jorma Joutsensaari, Siegfried schobesberger, Petri Tiitta, Ari Leskinen, Dominic Heslin Rees, Sophie Haslett, Karolina Siegel, Chris Lunder, Paul Zieger, Radovan Krejci, Sami Romakkaniemi, Claudia Mohr, and Annele Virtanen

Global warming and climate change-induced rise in Earth’s temperature have increased the frequency of forest/wildfires over the past decade. Therefore, understanding the effect of fire emissions on aerosol-cloud interactions is crucial for improving Earth system models.

         We present observations from in-situ measurements of aerosol properties at the Puijo SMEAR IV station in eastern Finland and the Zeppelin Observatory in Ny-Ålesund, High Arctic. Both stations are frequently inside low-level clouds due to their topographic prominence. During the autumn of 2020, fire emissions from the same active fire region in south-eastern (SE) Europe reached both stations after ~2 - 8 days of atmospheric aging. This enabled us to investigate the changes in aerosol and cloud properties for clouds formed under the influence of aged fire emissions (referred to as the ‘fire’ period) and under cleaner conditions with no fire emission influence at these stations (‘non-fire’ period). The aerosol hygroscopicity parameter (κchem) was derived from the chemical composition data obtained from online aerosol mass spectrometers and was used to derive the number concentration of cloud condensation nuclei (NCCN) from the measured particle size distributions.

         At both stations, the aerosol number concentration in the accumulation mode and the cloud condensation nuclei concentration (NCCN) were higher during the fire period than during non-fire times. However, the aerosol hygroscopicity increased at Puijo but decreased a Zeppelin from the non-fire to fire period. At Puijo, in-situ measured cloud droplet number concentration (CDNC) was by a factor of ~7 higher when comparing fire to non-fire periods. This was in good agreement with the satellite observations (MODIS, Terra). At Puijo, the higher CCN concentrations during the fire period cause a depletion of the water vapor available for cloud droplet activation leading to larger observed activation diameters during cloud events despite the higher hygroscopicity of the aerosol particles.

         These observations show the importance of SE European fires for enhancing the CCN activity in Finland and the high Arctic. Results from this study emphasize the complex interplay between particle size and chemical composition, and how fires even from sources far away can have strong impacts in these remote regions.

How to cite: Kommula, S. M., Buchholz, A., Gramlich, Y., Mielonen, T., Hao, L., Pullinen, I., Vettikkat, L., Joutsensaari, J., schobesberger, S., Tiitta, P., Leskinen, A., Rees, D. H., Haslett, S., Siegel, K., Lunder, C., Zieger, P., Krejci, R., Romakkaniemi, S., Mohr, C., and Virtanen, A.: Effect of long-range transported fire emissions on aerosol and cloud properties at high latitudes: In situ measurements and satellite observations, EGU General Assembly 2024, Vienna, Austria, 14–19 Apr 2024, EGU24-8668, https://doi.org/10.5194/egusphere-egu24-8668, 2024.

EGU24-9225 | ECS | Orals | BG1.1 | Highlight

Warming and cooling influences of North American boreal fires 

Max van Gerrevink, Sander Veraverbeke, Sol Cooperdock, Stefano Potter, Qirui Zhong, Michael Moubarak, Scott J. Goetz, Michelle C. Mack, James T. Randerson, Merritt R. Turetsky, Guido van der Werf, and Brendan M. Rogers

The Arctic-boreal region is warming rapidly, with consequences for northern ecosystems and global climate. Fires across the Arctic-boreal region are a major natural disturbance mechanism that initiate climate warming (positive) and cooling (negative) feedbacks. Understanding the net forcing effect from boreal fire on climate is crucial in managing and mitigating climate change impacts of boreal fires. Here we report radiative forcing estimates from boreal forest fires across Alaska and Western Canada (Arctic Boreal Vulnerability Experiment-domain). Our results integrate the effect of greenhouse gas emissions (warming) and aerosols emission (net cooling) have through direct combustion, post-fire vegetation recovery sequestering carbon (cooling), fire-induced permafrost degradation emitting CO2 and CH4 (warming), and changes in surface albedo (cooling). Alaskan fires are on average climate warming (1.34±2.95 W/m2 per burned area) – uncertainty given as spatial standard deviation, while Canadian fires show on average a climate cooling (‑2.26±2.48 W/m2 per burned area) effect. The emissions from the combustion of organic soils and post-fire permafrost thaw dominate the positive feedback for Alaskan fires, whereas the cooling effect of post-fire changes in surface albedo because of prolonged spring snow cover dominate for the western Canadian fires. Our work demonstrates large-scale spatial variability in the climate feedbacks from North American boreal forest fires. Such fine-scale spatial information on the warming and cooling influences of forest fires could be useful in designing forest management and fire suppression activities informed by climate impacts.

How to cite: van Gerrevink, M., Veraverbeke, S., Cooperdock, S., Potter, S., Zhong, Q., Moubarak, M., Goetz, S. J., Mack, M. C., Randerson, J. T., Turetsky, M. R., van der Werf, G., and Rogers, B. M.: Warming and cooling influences of North American boreal fires, EGU General Assembly 2024, Vienna, Austria, 14–19 Apr 2024, EGU24-9225, https://doi.org/10.5194/egusphere-egu24-9225, 2024.

EGU24-9270 | ECS | Orals | BG1.1

What limits the growth of lightning fires in the remote northeast Siberian taiga? 

Thomas Janssen and Sander Veraverbeke

In recent years, boreal forests have experienced unprecedented fire activity. These fires have contributed substantially to carbon emissions and posed hazards to human health. In the remote northeast Siberian taiga, the vast majority of fires are ignited by lightning strikes and not by human activity. Furthermore, active fire suppression is largely absent in these remote areas, resulting in uncontrolled fire growth. Here, we present a detailed look at the places and times where these lightning fires do finally stop spreading and aim to identify the causes. We employ various remote sensing and geo-spatial datasets including fire weather as well as landscape variables such as the presence of surface water, road networks, woody fuel load, fire history, elevation and landcover, to pinpoint the limitations to fire growth along fire perimeters recorded between 2012 and 2022 at a 300-meter spatial resolution. We were able to attribute 87% of all fire perimeter locations to a statistically significant (p < 0.01) change in one or more of these fire limitations over either time (fire weather) or space (landscape). The analysis reveals that fire growth is mainly limited by a change in the vegetation (fuel type and fuel load) as well as a change to less favourable weather for fire spread, although there are clear regional differences in the importance of specific limitations. Overall, fire weather seems to be the most important limitation to fire growth in the north of the Siberian taiga where continuous permafrost is present. With a rising frequency of lightning strikes, droughts, and heatwaves in boreal regions, uncontrolled lightning fires have the potential to expand even further in the future, leading to significant implications for vulnerable permafrost landscapes and, consequently, the global carbon cycle.

How to cite: Janssen, T. and Veraverbeke, S.: What limits the growth of lightning fires in the remote northeast Siberian taiga?, EGU General Assembly 2024, Vienna, Austria, 14–19 Apr 2024, EGU24-9270, https://doi.org/10.5194/egusphere-egu24-9270, 2024.

EGU24-10145 | ECS | Posters on site | BG1.1

Burned area and climate extremes in different land covers in southeastern Australia 

Patrícia Páscoa, Ana Russo, Andreia Ribeiro, and Célia Gouveia

Large burned areas (BA) in southeastern Australia were regularly registered during hot and dry years, such as the Black Saturday (2009) and the Black Summer (2019-2020) extreme bushfires. These types of extreme climate conditions are expected to become more frequent, leading to an increased risk of large BA in this region.

In this work, the influence of drought conditions and hot events on the BA in southeastern Australia was assessed, using correlation and copula functions. Bivariate copula functions were fitted, and conditional probabilities of large BA given climate extremes were computed. Three classes of drought intensity were studied, namely moderate, severe, and extreme, as well as three thresholds for temperature extremes, namely the 80th, 90th, and 95th percentiles. Monthly BA were computed as the sum of the burned pixels in the fire season (from October to March), using data from the MODIS Burned Area product. The analysis was performed on forests, grasslands, and savannas separately. Drought conditions were assessed with SPEI at several time scales, computed with data from the CRU TS4.07 dataset. Maximum and minimum daily temperature were retrieved from the ERA5 dataset.

Results showed that the correlation between BA and SPEI was high in the current and previous 1 month for all land covers, being highest in savannas and lowest in grasslands. Short time scales of SPEI had the highest correlation on grasslands, and the opposite was observed in forests and savannas. The correlation with maximum temperature increased until 10-15 days before the fire event and surpassed 0.6 over forests. Minimum temperature presented much lower correlations and there was not a pronounced increase in the previous days, as observed with the maximum temperature.

The conditional probability of large BA increased with the intensity of the drought on all land covers, and it reached almost 100% probability of exceeding the 50th percentile of BA under extreme droughts on forests and savannas. For the case of the 80th percentile of BA, the probability was lower, but the difference given drought and non-drought conditions was larger than for the 50th percentile. On savannas and forests, the conditional probability was still high when considering SPEI in the previous 2 and 3 months.

Maximum temperature yielded a higher probability of BA for the two highest percentiles. Savannas presented the lowest probability of BA given hot events, and forests the highest. The probability increased up to 10 days before the fire. Overall, the probabilities obtained given drought conditions are higher than given hot events, particularly for larger fires. Moreover, high probabilities obtained with large time scales and longer lead times are indicative of the importance of drought conditions before the fire season and may help predict the occurrence of large BA.


Acknowledgments: This study was partially supported by FCT (Fundação para a Ciência e Tecnologia, Portugal) through national funds (PIDDAC) – UIDB/50019/2020, by project Floresta Limpa (PCIF/MOG/0161/2019), and by project 2021 FirEUrisk, funded by European Union’s Horizon 2020 research and innovation programme under the Grant Agreement no. 101003890). A.R. was supported by FCT through https://doi.org/10.54499/2022.01167.CEECIND/CP1722/CT0006. 

How to cite: Páscoa, P., Russo, A., Ribeiro, A., and Gouveia, C.: Burned area and climate extremes in different land covers in southeastern Australia, EGU General Assembly 2024, Vienna, Austria, 14–19 Apr 2024, EGU24-10145, https://doi.org/10.5194/egusphere-egu24-10145, 2024.

EGU24-10377 | ECS | Posters on site | BG1.1

Human land occupation regulates the effect of the climate on the burned area of the Cerrado biome 

Carlota Segura-Garcia, David Bauman, Vera L. S. Arruda, Ane Alencar, and Imma Oliveras Menor

The Brazilian Cerrado is a heterogeneous biome formed by a mosaic of savannas, grasslands, and smaller patches of denser woody forms. In this biome, fire is a natural disturbance agent that contributes to maintaining its open ecosystems and rich biodiversity. However, modern human activities and climate change are altering its fire regimes. In tropical savannas, land-use expansion is usually associated to a decrease in burned area primarily through land fragmentation, but also through active fire suppression. Meanwhile, climate change is fostering fire weather conditions, exacerbating fire activity. Hence, the two main drivers of fire could be pushing burned area in opposite directions, both with important ecological consequences for the Cerrado. However, it remains unclear how these two drivers interact, which is essential to devise effective fire management policies and conservation plans.

In this study, we use a causal inference framework to quantify the interaction between anthropic area percentage – as a proxy of human presence and fragmentation – and various climatic variables on their effects on Cerrado’s burned area. As well, we explore the spatial structure of temporal trends in burned area, anthropic expansion and climate change, and quantify the causal effect of the last two on the former.

We use geospatial data from different sources on a 0.2o grid over the Cerrado for the period 1985 to 2020. We use burned area and land use data from the MapBiomas project, and climate re-analysis data from ERA5 Land, CHIRPS and TerraClimate. We design our models using Directed Acyclic Graphs, a graphic representation of the causal relations between the predictors and burned area that informs variable selection for causal inference. Hence, based on these DAGs, we build multilevel Bayesian regression models to quantify the effects of the predictors and their interactions.

We find that a larger presence of land-use activities keeps burned area low and, importantly, hinders the effects of the climate. That is, while in landscapes composed mostly of native vegetation hotter and drier conditions increase burned area as expected; in anthropic landscapes, humans completely limit burned area responsiveness to climate. We also find spatially heterogeneous increasing and decreasing trends in burned area over the period, but concentrated in those areas of the Cerrado that were mostly natural in 1985. In these areas, a large anthropic expansion brought about a decrease in burned area, while we observe an increase in burned area in relation to climate change only in the areas that remained intact throughout the study period.

In conclusion, burned area in the Cerrado is shaped primarily by the extent of human presence in the landscape, even limiting the effects of the climate, while climatic effects become relevant in areas with larger tracts of native vegetation, suggesting that these areas may be more vulnerable to climate change.

How to cite: Segura-Garcia, C., Bauman, D., S. Arruda, V. L., Alencar, A., and Oliveras Menor, I.: Human land occupation regulates the effect of the climate on the burned area of the Cerrado biome, EGU General Assembly 2024, Vienna, Austria, 14–19 Apr 2024, EGU24-10377, https://doi.org/10.5194/egusphere-egu24-10377, 2024.

EGU24-10606 | ECS | Orals | BG1.1

Characterizing lightning-ignited wildfire occurrences at sub-grid scales in orography-aware NOAA/GFDL land model LM4.2 

Rui Wang, Enrico Zorzetto, Sergey Malyshev, and Elena Shevliakova

Lightning ignitions are the dominant causes of wildfires in many regions, responsible for 80% of burned areas at high latitudes and about 70% of fires in the Amazon rainforest. With global wildfire activities and extreme fire events (e.g., intensity, duration, and size) increasing under the changing climate conditions, understanding the interactions between lighting, landscape characteristics, and wildfires is crucial for predicting and mitigating the impacts of climate change. Cloud-to-ground lightning activities are driven by a combination of large- and local-scale factors, e.g., local atmospheric circulations and convection and topography. Furthermore, the number of lightning strikes is predicted to increase by 10 – 30 % per degree warming. Decadal satellite observations have revealed Earth’s lightning hotspots at very high resolution, however, there is a paucity of fine-scale lightning strikes and lightning-ignited wildfires (LIW) in the Earth system and climate models. Currently, many climate and ESM  models do not include fires at all or simulate them with meteorological inputs and grid-average lightning at the scale of atmospheric models (25 to 100 km), introducing large uncertainties of LIW due to the lack of information at the scales relevant to fire dynamics.  Lack of information about lightning trends and variability hinders the prediction and projection of fires and their contribution to carbon and other atmospheric tracers and global warming. For example, in the US National Oceanic and Atmospheric Administration (NOAA) Geophysical Fluid Dynamics Laboratory (GFDL) ESM4.1 model, the fire model uses a climatology of lightning strikes from preindustrial to 2100.

In this presentation, we will demonstrate the implications of capturing subgrid lightning distributions in the GFDL land model LM4.2 for the global simulations of wildfire dynamics over the available records (1998-2013) and provide insights into future projections. LM4.2 captures sub-grid heterogeneity of land cover and use, soil geomorphology, and topography, facilitating the understanding of LIW distribution across global to regional and sub-grid scales. In this study, we leverage 0.1° × 0.1° lightning observations from the Lightning Imaging Sensor (LIS) and Optical Transient Detector (OTD) in the GFDL LM4-HB to characterize fine-scale lightning strike distribution and associated LIW.

How to cite: Wang, R., Zorzetto, E., Malyshev, S., and Shevliakova, E.: Characterizing lightning-ignited wildfire occurrences at sub-grid scales in orography-aware NOAA/GFDL land model LM4.2, EGU General Assembly 2024, Vienna, Austria, 14–19 Apr 2024, EGU24-10606, https://doi.org/10.5194/egusphere-egu24-10606, 2024.

EGU24-10793 | ECS | Posters on site | BG1.1

A Decision Support System for Forest Fire Danger Notices in Ireland  

Padraig Flattery, Klara Finkele, Paul Downes, Alan Hally, and Ciaran Nugent

Since 2006 the Canadian Forest Fire Weather Index System (FWI) has been employed operationally at Met Éireann to predict the risk of forest fires in Ireland. Around 11% or 770,000 ha of the total land area of Ireland is afforested, but there are also large areas of open mountain and peatlands covered in grasses, dwarf-shrub and larger woody shrub type vegetation which can provide fuel for spring wildfires under suitable conditions. After winter, vegetation can be dead or have a very low live moisture content, and the flammability of this vegetation can be readily influenced by prevailing weather, especially following prolonged dry periods.

Different decision support tools are available to different sectors, namely:

  • The General Public: who have access to fire weather index meteograms on Met Éireann’s public website.
  • Local Authorities, who have access to the ANYWHERE multi-hazard warning system, which provides multiple sources of information about fire danger and propagation.
  • The Department of Agriculture, Food and Marine (DAFM), who are provided with information and additional support from National and European partners and networks.

DAFM is the Forest Protection authority in Ireland responsible for issuing Forest Fire Danger Notices which improve preparedness for fire responses and are based on a range of factors including information provided by Met Éireann who calculate the FWI and FWI components using observation data at synoptic stations, and the predicted FWI for the next five days ahead based on numerical weather prediction data. This allows fire responders to build resilience and prepare for impending fires.

The FWI is determined based on the types of forest fuel and how quickly they dry out/get rewetted, and components of fire behaviour. The FWI represents the fire intensity as the rate of energy per unit length of fire front (kW/m). The components which provide the most accurate indication of risk under Irish conditions are the Fine Fuel Moisture Code and Initial Spread Index, based on the fuels involved and ignition patterns observed to date. Since 2022 Met Eireann provide the FWI as well as the individual components Fine Fuel Moisture Content and Initial Spread Index via the public website for synoptic stations. These indices are based on observations and a seven-day forecast into the future using ECMWF predictions. This allows all county councils responsible for wildfire preparedness to access this information swiftly and directly.

Met Éireann also use the ANYWHERE multi-hazard warning tool which allows for visualisation of multiple fire-related risk factors and warning indices to be viewed simultaneously. The ANYWHERE system, in combination with our station-based forecast and antecedent conditions, provide fire managers and response teams with excellent information with which to make decisions.

How to cite: Flattery, P., Finkele, K., Downes, P., Hally, A., and Nugent, C.: A Decision Support System for Forest Fire Danger Notices in Ireland , EGU General Assembly 2024, Vienna, Austria, 14–19 Apr 2024, EGU24-10793, https://doi.org/10.5194/egusphere-egu24-10793, 2024.

EGU24-10920 | ECS | Posters on site | BG1.1

Reconstructing 20th century burned area by combining global fire model input, satellite observations and machine learning 

Seppe Lampe, Lukas Gudmundsson, Vincent Humphrey, Inne Vanderkelen, Bertrand Le Saux, and Wim Thiery

The temporal coverage (∼2000 to present) of global burned area satellite observations limits many aspects of fire research e.g., long-term trend analysis, disentangling the effect of various drivers on fire behaviour and detection and attribution of changes to climate change. As a result, global fire models are more frequently being called upon to answer questions about past and future fire behaviour. Unfortunately, the limited temporal coverage of the observations also hinders the development and evaluation of these fire models. The current generation of global fire models from ISIMIP are able to simulate well some characteristics of regional fire behaviour such as mean state and seasonality. However, the performance of these models differs greatly from region to region, and aspects such as extreme fire behaviour are not well represented yet. Here, we explore the possibility of using machine learning algorithms to model burned area from the same input parameters that are passed to global climate models. Once trained, this data-driven model can be evaluated against regional proxies for past fire behaviour e.g., tree rings and charcoal records. Hopefully, this data-driven reconstruction can provide valuable insights on the 20th century burned area, and can help improve and evaluate fire models.

How to cite: Lampe, S., Gudmundsson, L., Humphrey, V., Vanderkelen, I., Le Saux, B., and Thiery, W.: Reconstructing 20th century burned area by combining global fire model input, satellite observations and machine learning, EGU General Assembly 2024, Vienna, Austria, 14–19 Apr 2024, EGU24-10920, https://doi.org/10.5194/egusphere-egu24-10920, 2024.

EGU24-10947 | Orals | BG1.1 | Highlight

Burned area and fire emissions according to the fifth version of the Global Fire Emissions Database (GFED) 

Guido van der Werf, James Randerson, Dave van Wees, Yang Chen, Roland Vernooij, Louis Giglio, Joanne Hall, Douglas Morton, Kelley Barsanti, and Bob Yokelson

Quantifying burned area and associated fire emissions is paramount to understand how changing fire patterns affect radiative forcing and air quality. It is now well established that many fires are too small to be detected by coarse resolution satellite burned area products on which the Global Fire Emissions Database (GFED) relied. In the fifth version of GFED (GFED5) we therefore combine burned area derived from mapped coarse-resolution burned area from the MODIS sensor -which excels in detecting larger fires- with small-fire burned area. The latter is derived from MODIS active fire detections scaled to burned area using ratios constrained by higher-resolution burned area datasets from Landsat and Sentinel-2 for selected regions. Burned area in cropland regions was based on the Global Cropland Area Burned (GloCAB) dataset. Total global burned area is 61% higher than in GFED4s. We converted burned area to emissions using a simplified version of the CASA model used in previous GFED versions, but which now runs at a 500 m spatial resolution. This allows for better constrained modeled fuel loads based on field measurements. Although GFED5 emissions are aggregated to a 0.25 degree grid due to the statistical nature of deriving our burned area, we can now account for heterogeneity in fire processes within these large pixels. Emissions (3 Pg carbon per year) are roughly 50% higher than in GFED4 and we show how diverging trends in grassland versus forest ecosystems impact trends in total emissions. Finally, we show how converting fire carbon losses to trace gas and aerosol emissions is now better constrained due to the addition of several new emission factor measurement campaigns. In the savanna biome we now account for spatial and temporal variability in emission factors.

How to cite: van der Werf, G., Randerson, J., van Wees, D., Chen, Y., Vernooij, R., Giglio, L., Hall, J., Morton, D., Barsanti, K., and Yokelson, B.: Burned area and fire emissions according to the fifth version of the Global Fire Emissions Database (GFED), EGU General Assembly 2024, Vienna, Austria, 14–19 Apr 2024, EGU24-10947, https://doi.org/10.5194/egusphere-egu24-10947, 2024.

EGU24-11206 | ECS | Posters on site | BG1.1 | Highlight

Global cloud-to-ground lightning data to inform wildfire ignition patterns 

Esther Brambleby, Sander Veraverbeke, Guilherme Mataveli, Manoj Joshi, and Matthew Jones

Lightning is recognised as a crucial wildfire ignition source worldwide, especially in remote regions including boreal and temperate forests where large carbon stocks are held. The societal consequences of these wildfires, as well as their contribution to climate change, can be immense. The occurrence of lightning is projected to increase in these areas under climate change, however robust assessments of lightning contribution to wildfire risk have been restricted to selected regions due to the narrow spatial extent of cloud-to-ground lightning records. Consequently, evaluations of lightning-fire relationships using existing global lightning observational datasets have been limited to considering the total amount of lightning. Only cloud-to-ground lightning can ignite a wildfire, therefore when considering impacts on wildfire risk it is essential to distinguish between lightning types.

Using Vaisala’s unique Global Lightning Dataset (GLD360), which discriminates between cloud lightning and cloud-to-ground lightning strikes, we present our preliminary analyses of the spatial patterns and seasonality of cloud-to-ground lightning. Here, we show the regional variation in the lightning frequency and the cloud-to-ground fraction, as well as the strength (current) and polarity of cloud-to-ground lightning strikes.

By considering cloud-to-ground lightning strikes only, we characterise the spatial and seasonal variation in lightning events with the potential to ignite wildfires. Combining global observations of lightning strikes with observations of individual fires and coincident meteorology will advance our mechanistic understanding of wildfire ignition potential in a range of weather conditions, improve the process representation of the ignition process in global models, and refine projections of changing wildfire risks under climate change.

How to cite: Brambleby, E., Veraverbeke, S., Mataveli, G., Joshi, M., and Jones, M.: Global cloud-to-ground lightning data to inform wildfire ignition patterns, EGU General Assembly 2024, Vienna, Austria, 14–19 Apr 2024, EGU24-11206, https://doi.org/10.5194/egusphere-egu24-11206, 2024.

This research delves into the dynamics of forest fires across various Indian regions, particularly during the unique COVID-19 lockdown period. The study's core focus is on the interaction between forest fires, climatic factors, and vegetation indices in a scenario of reduced human activity. It employs a multidimensional methodology, integrating satellite imagery and climatic data from periods before, during, and post-lockdown. The lockdown provides a critical opportunity to assess the impact of decreased human interference on forest fire patterns. Advanced statistical techniques are used to analyze the relationship between vegetation indices, fire occurrences, and meteorological conditions. This approach aims to uncover the underlying mechanisms driving these relationships, moving beyond simple trend identification. The research offers a nuanced perspective by differentiating natural factors from human influences. This distinction is vital in understanding the environmental dynamics during the lockdown. The findings have significant implications, offering insights for policymakers and environmentalists in enhancing forest fire management strategies. Emphasizing the need for a comprehensive understanding of environmental interactions, this study contributes to forming more informed and sustainable approaches to natural disaster management in the face of global challenges like climate change and pandemics.

How to cite: Kate, R. and Bhattacharya, J.: Forest Fires during COVID-19: Assessing Environmental Interactions and Fire Dynamics Amidst Reduced Human Intervention in India, EGU General Assembly 2024, Vienna, Austria, 14–19 Apr 2024, EGU24-11291, https://doi.org/10.5194/egusphere-egu24-11291, 2024.

EGU24-11432 | ECS | Posters on site | BG1.1 | Highlight

Northern high latitude peat fires: from lab to modelling  

Dimitra Tarasi, Eirini Boleti, Katie Blackford, Matthew Kasoar, Emmanouil Grillakis, Guillermo Rein, Hafizha Mulyasih, and Apostolos Voulgarakis

Climate warming is occurring most rapidly at high latitudes, heightening the vulnerability of carbon-rich peatlands to fire. Northern peatlands comprise the largest terrestrial carbon store, and exert a net cooling effect on the climate. Warmer and drier conditions due to the anticipated climate change are expected to contribute substantially to increased fire severity and frequency in the northern high latitudes, potentially shifting peatlands from being carbon sinks to being greenhouse gas emission sources. Therefore, peat fires, which are considered the largest and most persistent fires on Earth, can significantly impact the global carbon cycle, atmospheric composition, climate, air quality, and human health. Representing peatland fire feedbacks to climate in Earth system models is essential for accurately predicting the future of the climate system. Here, we present the first steps of an effort to distill lab results on peat burning and emissions into global fire modelling. Since peat moisture content and the depth of burn have been experimentally proved to be critical for the representation of peat fires, we aim to incorporate those mechanisms into a global model functionality. More specifically, we aim to represent the mechanistic understanding of the ignition and spread of peat fires in INFERNO-peat, the peat module of the JULES-INFERNO global fire model. To assess the added value of our updated model, we compare the simulated burnt area and carbon emissions with observation-based products. As boreal regions remain a big mystery for the future of our planet, our improved model representation of peat fires in northern high latitudes contributes to a better understanding of future atmospheric composition, radiative forcing and climate. 

How to cite: Tarasi, D., Boleti, E., Blackford, K., Kasoar, M., Grillakis, E., Rein, G., Mulyasih, H., and Voulgarakis, A.: Northern high latitude peat fires: from lab to modelling , EGU General Assembly 2024, Vienna, Austria, 14–19 Apr 2024, EGU24-11432, https://doi.org/10.5194/egusphere-egu24-11432, 2024.

EGU24-11599 | ECS | Orals | BG1.1

Comparison and validation of state-of-the-art fire emissions models for the Amazon 

Dave van Wees, Vincent Huijnen, Matthias Forkel, Jos de Laat, Niels Andela, and Christine Wessollek

Amazon forest conservation is critical for reaching net-zero carbon emissions and protecting regional biodiversity but these efforts are at risk from deforestation, fire and drought. In particular, accurate quantification of carbon losses from forest and deforestation fires are required to understand long-term impacts of fire on the carbon cycle and inform management strategies. Recent developments in the detection of burned area, near-real time tracking of fire patch metrics, and higher-resolution fire emissions models allow for improved estimates of carbon losses from fire. Nevertheless, independent validation of these novel approaches often remains elusive, leading to large disagreement between different emissions inventories.

Here, we compare carbon emissions estimates from several state-of-the-art fire emissions models, including a 500-m resolution GFED version, GFAS, and the Sense4Fire project, in a case-study for the Amazon region. Where necessary, we have updated the models to extend to 2022 and to include the most recent version of model input data from MODIS (Collection 6.1). We analysed the added years of data to elucidate recent trends in fire-related carbon emissions across the Amazon and adjacent biomes. For validation, we ingested the CO emissions from the considered fire emissions models into an atmospheric transfer simulation (IFS-COMPO) and compared those to column CO observations from Sentinel-5P TROPOMI. Finally, we propose an optimization methodology for matching modelled CO concentrations to observations with the objective of constraining regional carbon losses from fire. Results provide novel insights into carbon losses from fire across different fire types and land use practices, and can be extended to global scale for improved estimates of global fire emissions.

How to cite: van Wees, D., Huijnen, V., Forkel, M., de Laat, J., Andela, N., and Wessollek, C.: Comparison and validation of state-of-the-art fire emissions models for the Amazon, EGU General Assembly 2024, Vienna, Austria, 14–19 Apr 2024, EGU24-11599, https://doi.org/10.5194/egusphere-egu24-11599, 2024.

EGU24-11809 | ECS | Posters on site | BG1.1

Analysing the effects of postfire oak afforestation on the provision of ecosystem services 

Luis Filipe Lopes, Erika S. Santos, Leónia Nunes, Paulo M. Fernandes, and Vanda Acácio

Forests play a substantial role in generating externalities and supporting services essential for maintaining key ecosystem functions and processes. Fire has long been a natural element of forest dynamics, contributing to model the structure, composition, and diversity of vegetation. However, changes in fire regimes in recent decades in Europe (e.g., more frequent and severe fires) have led to negative ecological, social, and economic impacts, particularly marked by a decline in the provision of ecosystem services. Mediterranean Europe, being a region highly prone to wildfires and currently experiencing a change in fire regimes, exemplifies this situation.

In this study, we aim to understand the effects of postfire oak afforestation on the provision of ecosystem services (ES). We analysed 15 afforestation projects with the deciduous Pyrenean oak (Quercus pyrenaica) carried out in 1994-2006 in similar soil type (Cambisols) in the North and Center of Portugal, including seven pure and eight mixed oak stands. For each project area, we identified an adjacent control area affected by the same fire event but without oak afforestation or evident management. In 2021-2022, for each project and control areas, we collected field data on: site conditions, stand characteristics, forest biometry, understory vegetation (height and cover), floristic richness and diversity, oak natural regeneration and litter. At the moment of data collection, the majority of projects (10) were 12 to 17 years old, with the remaining projects (5) having been implemented 21 to 25 years ago. Collected data was used to quantify provisioning ecosystem services (wood volume) and regulation and maintenance services (forest and litter carbon, fire protection, maintenance of nursery populations, habitats, and seed dispersal).

Afforested areas supplied more provisioning services (higher wood volume), as a consequence of a higher tree density when compared to non-afforested areas. Total carbon content and litter carbon were not significantly different between afforested and control areas. Nevertheless, afforested and control areas exhibited distinct patterns concerning carbon in the different forest layers: carbon in the tree layer was significantly higher in afforested areas, while carbon in the understory layer was significantly higher in control areas. Afforested areas also showed a significantly higher fire protection service, as a consequence of lower fuel load from regular understory shrub management. Lastly, we found no significant differences in services related to maintenance of nursery populations and habitats (estimated with floristic species and diversity), and seed dispersal (estimated with oak natural regeneration), although afforested areas presented a higher number of oak seedlings.

Our study shows that postfire afforestation in oak forests may have a positive, null or negative impact on ES, depending on the service under analysis, highlighting the existence of trade-offs among multiple ES. We emphasize the importance of a comprehensive understanding of the impacts of postfire afforestation on ES to guide postfire management, aiming to enhance forest resilience in the face of predicted climate change.

How to cite: Lopes, L. F., Santos, E. S., Nunes, L., Fernandes, P. M., and Acácio, V.: Analysing the effects of postfire oak afforestation on the provision of ecosystem services, EGU General Assembly 2024, Vienna, Austria, 14–19 Apr 2024, EGU24-11809, https://doi.org/10.5194/egusphere-egu24-11809, 2024.

EGU24-11962 | Orals | BG1.1

The Great Fuel Moisture Survey: developing fundamental wildfire science and sustainable community owned agency in traditionally non-fire prone societies 

Nicholas Kettridge, Katy Ivison, Alistair Crawford, Gareth Clay, Claire Belcher, Laura Graham, and Kerryn Little

New fire vulnerable communities are emerging in traditionally non-fire prone regions of the world. But these communities are often largely unaware of the developing threat and do not hold the core wildfire knowledge to galvanise collective community-based action to mitigate the risk. Furthermore, we urgently require knowledge of fuel moisture dynamics and flammability of fuels in such regions to provide accurate assessments of fire danger at the national scale. Here we characterise the moisture content and flammability of heather through engaged environmental science, demonstrating the potential of the approach to develop a public consciousness and knowledge of wildfire within communities. Fuel sampling kits were sent to 150 samplers who collected ~1000 vegetation samples across the UK (from Land’s End to John O’Groats) over a period of two days during a single period of high fire danger. The validity of the volunteer approach for collecting high quality fuel moisture data was also assessed from the analysis of a separate ~1500 samples collected by 17 samplers in a single test plot. The approach provides a simple nationally available entry point for residents traditionally unaware of both the wildfire risk and the management of their community for wildfire mitigation. Empowering samplers offers potential future opportunity to create meaningful local datasets, to build communities, and in doing so give a strong voice to residents in regional and national policy discussions.

How to cite: Kettridge, N., Ivison, K., Crawford, A., Clay, G., Belcher, C., Graham, L., and Little, K.: The Great Fuel Moisture Survey: developing fundamental wildfire science and sustainable community owned agency in traditionally non-fire prone societies, EGU General Assembly 2024, Vienna, Austria, 14–19 Apr 2024, EGU24-11962, https://doi.org/10.5194/egusphere-egu24-11962, 2024.

EGU24-11965 | ECS | Posters on site | BG1.1

Effects of 2018 wildfire on soil properties in a peatland within the Peak District National Park (central England) 

Luigi Marfella, Mark A. Ashby, Georgia Hennessy, Rossana Marzaioli, Flora A. Rutigliano, and Helen C. Glanville

Peatland soil is a valuable component of natural capital by constituting the largest terrestrial carbon sink (~30% of the global soil carbon) and an essential freshwater source. Despite covering only ~3% of the Earth’s surface, peatlands provide crucial ecosystem services i.e. water-quality improvement and climate regulation by storing carbon in peat. However, peat degradation due to anthropogenic activities (e.g. drainage) as well as global climate change exposes this ecosystem to fire risk.
This study assessed the medium-term (~5 years) impacts of the 10 August 2018 wildfire within The Roaches Nature Reserve. This area spans the southeastern sector of the Peak District National Park and Special Area of Conservation (SAC-UK0030280). According to the Staffordshire Wildlife Trust (responsible authority for Reserve management), the human-caused fire broke out in a wooded area and aided by wind, spread to the peatland. Here, we integrated soil analyses and vegetation surveys of a burnt and unburnt area i) to assess possible correlations between soil biogeochemical properties and vegetation cover with ii) remote sensing to collect data on fire severity exploring temporal and spatial wildfire impacts.
Processing of satellite imagery highlighted a high-severity fire impact within the perimeter of the burned area, which predicts alteration of soil characteristics. Preliminary outcomes on the soil indicated deacidification and reduced water content in the burned peat remains 5 years post-fire.
Given that global peatland conservation is an important tool for addressing climate-change, this research appears necessary to develop effective management strategies, including rewetting of peatlands postfire.

How to cite: Marfella, L., Ashby, M. A., Hennessy, G., Marzaioli, R., Rutigliano, F. A., and Glanville, H. C.: Effects of 2018 wildfire on soil properties in a peatland within the Peak District National Park (central England), EGU General Assembly 2024, Vienna, Austria, 14–19 Apr 2024, EGU24-11965, https://doi.org/10.5194/egusphere-egu24-11965, 2024.

The ignition, spread, and severity of wildfires are driven largely by weather conditions (Jain et al. 2020: https://doi.org/10.1139/er-2020-0019; Liu et al. 2013: https://doi.org/10.1371/journal.pone.0055618).  The main tool for weather prediction across the globe is a set of physical, coupled atmosphere/ocean models, called numerical weather prediction (NWP).  Despite rapid improvements in the last few decades, NWP alone is not sufficient for wildfire prediction, because it does not resolve every process related to wildfire.  One solution is to post-process NWP with statistical models, which correct the NWP model towards better resolving processes related to the phenomenon of interest (here, wildfire).  This post-processing is called model-output statistics (MOS) and typically involves linear regression.  However, recent work has advanced MOS by incorporating more powerful statistical models from deep learning (DL).  We use DL to predict extreme fire weather and behaviour at multi-day lead times throughout the United States.


For fire weather, we have trained U-nets -- a type of deep neural network -- to predict at lead times of 3-240 hours over the United States.  The output (target) variables are seven indices from the Canadian Fire Weather Index System (CFWIS), computed from the ECMWF Reanalysis version 5 (ERA5).  These seven indices include the fine-fuel moisture code (FFMC), initial-spread index (ISI), overall fire-weather index (FWI), etc.  Meanwhile, the input (predictor) variables come from five sources.  The first is a forecast time series of atmospheric state variables (height, temperature, humidity, and wind) from the Global Forecast System (GFS) NWP model.  The second is a forecast time series of surface and subsurface moisture (soil moisture, accumulated precipitation, and snow depth) from the GFS.  The third is a set of constant fields (terrain height/slope/aspect, land-sea mask, etc.) describing the underlying terrain.  The fourth is a lagged time series of CFWIS over the past several days, i.e., past target values.  The fifth is a forecast time series of CFWIS indices, computed by applying the CFWIS functions directly to GFS-forecast weather variables.  These are the uncorrected (GFS-only) CFWIS forecasts, to be corrected by the U-net.


For fire behaviour, we have trained random forests -- ensembles of decision trees -- to predict fire radiative power (FRP) at lead times of 1-48 hours over the United States.  The labels (correct answers) for FRP are obtained from the Regional ABI and VIIRS Emissions (RAVE) merged satellite product.  Predictors for the random forest include the first three sources listed for the U-net above, plus a lagged time series of FRP over the past 24 hours, i.e., past target values.


Both models -- the U-net for fire weather and the random forest for fire behaviour -- are trained with built-in uncertainty quantification.  Thus, at every lead time and grid point, both models provide an expected value and an estimate of their own uncertainty.  We will present objective evaluation results (for both the mean forecast and uncertainty) and explainable artificial intelligence (XAI) to understand what the models have learned, e.g., which spatiotemporal weather patterns in a given area are most conducive to extreme fire weather/behaviour.

How to cite: Lagerquist, R. and Kumler, C.: Using deep learning to improve multi-day forecasts of extreme fire weather and behaviour throughout the United States, EGU General Assembly 2024, Vienna, Austria, 14–19 Apr 2024, EGU24-12223, https://doi.org/10.5194/egusphere-egu24-12223, 2024.

EGU24-12320 | ECS | Orals | BG1.1

Integrating Human Domain Knowledge into Artificial Intelligence for Hybrid Forest Fire Prediction: Case Studies from South Korea and Italy 

Hyun-Woo Jo, Shelby Corning, Pavel Kiparisov, Johanna San Pedro, Andrey Krasovskiy, Florian Kraxner, and Woo-Kyun Lee

Forest fires pose a growing global threat, exacerbated by climate change-induced heat waves. The intricate interplay between changing climate, biophysical, and anthropogenic factors emphasizes the urgent need for sophisticated predictive models. Existing models, whether process-based for interpretability or machine learning-based for automatic feature identification, have distinct strengths and weaknesses. This study addresses these gaps by integrating human domain knowledge, crucial for interpreting forest fire dynamics, into a machine learning framework. We introduce FLAM-Net, a neural network derived from IIASA's wildfire Climate impacts and Adaptation Model (FLAM), melding process-based insights of FLAM with machine learning capabilities. In optimizing FLAM-Net for South Korea, new algorithms interpret national-specific forest fire patterns, and multi-scale applications, facilitated by U-Net-based deep neural networks (DN-FLAM), yield downscaled predictions. Successfully tailored to South Korea's context, FLAM-Net and DN-FLAM reveal spatial concentration near metropolitan areas and the east coastal region, with temporal concentration in spring. Performance evaluation yields Pearson's r values of 0.943, 0.840, and 0.641 for temporal, spatial, and spatio-temporal dimensions. Projections based on Shared Socioeconomic Pathways (SSP) indicate an increasing trend in forest fires until 2050, followed by a decrease due to increased precipitation. During the optimization process of FLAM-Net for Italy, optimal parameters for sub-areas are identified. This involves considering biophysical and anthropogenic factors at each grid, contributing to improved localized projection optimization by utilizing various sets of optimal parameters. There by, this process illuminates the intricate connections between environmental factors and their interpretation in the dynamics of forest fires. This study demonstrates the advantages of hybrid models like FLAM-Net and DN-FLAM, seamlessly combining process-based insights and artificial intelligence for interpretability, accuracy, and efficient optimization. The findings contribute scientific evidence for developing context-specific climate resilience strategies, with global applicability to enhance climate resilience.

How to cite: Jo, H.-W., Corning, S., Kiparisov, P., San Pedro, J., Krasovskiy, A., Kraxner, F., and Lee, W.-K.: Integrating Human Domain Knowledge into Artificial Intelligence for Hybrid Forest Fire Prediction: Case Studies from South Korea and Italy, EGU General Assembly 2024, Vienna, Austria, 14–19 Apr 2024, EGU24-12320, https://doi.org/10.5194/egusphere-egu24-12320, 2024.

EGU24-12529 | ECS | Orals | BG1.1 | Highlight

GlobalRx: A global assemblage of regional prescribed fire records for use in assessments of climate change impacts 

Alice Hsu, Jane Thurgood, Adam Smith, Liana Anderson, Hamish Clarke, Stefan Doerr, Paulo Fernandes, Crystal Kolden, Cristina Santín, Tercia Strydom, and Matthew Jones and the GlobalRx Consortium

Prescribed (Rx) and controlled fires are an important land management tool used globally for a variety of reasons, including the reduction of hazardous fuel loads, ecological conservation, agriculture, and natural resource management. Its use has important implications for wildfire risk, biodiversity, and carbon storage. However, the use of Rx and controlled fires is highly dependent upon weather conditions, requiring a weather window during which a careful balance of temperature, moisture, and wind ensure that the burns achieve their objectives while minimizing ecological damage or risk to human lives or assets. The planning and execution of Rx burns must also consider how these weather conditions interact with the local vegetation and ecology. As fire weather is projected to grow more extreme under the impacts of climate change, there is a growing need to monitor this effect on the ability to carry out Rx burning.

Here, we introduce a new dataset, GlobalRx, which includes around 140,000 records of Rx and other controlled fires from 16 countries, encompassing 207 ecoregions and 13 biomes around the world. For each record, we have geolocated values of various metrics of fire weather and fire danger (e.g. fire weather indices, vapour pressure deficit) from the ERA5 meteorological reanalysis, as well as the biome, ecoregion, fuelbed type, and protected area status from global thematic layers. We demonstrate the usefulness of this dataset for analyzing viable meteorological windows under which Rx fires may be conducted across diverse environmental settings in the present climate, as well as how these Rx burning windows may shift under the threats of climate change. This dataset has potential to shed light on how Rx burning windows may shift under future climate change, as well as opportunities to understand other drivers and effects of Rx burning.

This project has been supported by valuable contributions from non-public data from a consortium of data providers: Parks Canada, South Africa National Parks, Brazilian Institute of the Environment and Renewable Natural Resources, East-Pyrenees Prescribed Burning Team, Institute for Nature Conservation and Forests (Portugal), Regional Forest Fire Service (Italy), Russian Federal Forestry Agency, H2020 LifeTaiga Project, Government of the Principality of Asturias, Council of Andalucía, Council of Galicia, Forestry England, National Forestry Commission of Mexico, ZEBRIS Geo-IT GmbH, Hokkaido University, Pau Costa Foundation, Asian Forest Cooperation Organization.

How to cite: Hsu, A., Thurgood, J., Smith, A., Anderson, L., Clarke, H., Doerr, S., Fernandes, P., Kolden, C., Santín, C., Strydom, T., and Jones, M. and the GlobalRx Consortium: GlobalRx: A global assemblage of regional prescribed fire records for use in assessments of climate change impacts, EGU General Assembly 2024, Vienna, Austria, 14–19 Apr 2024, EGU24-12529, https://doi.org/10.5194/egusphere-egu24-12529, 2024.

EGU24-13237 | Posters on site | BG1.1

The role of fire radiative power to estimate fire-related smoke pollution. 

Rita Durao, Catarina Alonso, Ana Russo, and Célia Gouveia

The intensity of a wildfire can be assessed based on its released energy, obtained through remote measurements of the fire's radiative power. Since the Fire Radiative Power (FRP) is proportional to the amount of burned biomass and therefore to smoke production. Higher FRP values are associated with more severe fires, suggesting higher levels of smoke production and, consequently, higher emissions of particulate matter and other pollutants. The specific composition of smoke emissions can vary depending on factors such as the type of vegetation burned, the temperature of the fire, and the combustion conditions. In general, fire smoke is composed of a variety of air pollutants, including gases (NOx, CO, VOCs, O3, PAHs, etc) and particulate matter (PM). The objective of this work is to evaluate the ability of FRP, to be used as an indicator of fire smoke pollution. Particulate matter (PMx) and carbon monoxide (CO) concentrations emitted during recent wildfires in Portugal are analyzed to assess the link between pollution concentration levels and fire intensity over the affected areas, taking into account the spatial and temporal characteristics of each event. For this purpose, two particularly severe fires with significant impacts on air quality in central and southern Portugal were analyzed namely the ones taking place in October 2017 and August 2018. Concentrations of PMx and CO were evaluated through CAMS data, and the radiative power through the FRP product of the SEVIRI/MSG disseminated by LSA-SAFThe results show that the emitted pollutant concentrations significantly exceeded the established daily target limit values (air quality and public health guidelines). The fire intensity, based on the emitted Radiative Energy (FRE) derived from FRP, aligns with the known severity of these events, consistent with the observed concentrations of air pollutants, being demonstrated that the FRP can be associated with smoke production, especially PMx emissions during a fire. Thus, the proposed methodology using FRP can be a valuable tool for assessing the impact of wildfires on air quality and understanding the potential for smoke dispersion over fire-affected regions. The role of FRP as an indicator of air pollution highlights the potential use of FRP in assisting in management activities, operational planning, and emergency intervention during ongoing fires. 

Acknowledgments: This study is partially supported by the European Union’s Horizon 2020 research project FirEUrisk (Grant Agreement no. 101003890); and by the Portuguese Fundação para a Ciência e a Tecnologia (FCT) I.P./MCTES on behalf of DHEFEUS -2022.09185.PTDC and the project FAIR- 2022.01660.PTDC).

How to cite: Durao, R., Alonso, C., Russo, A., and Gouveia, C.: The role of fire radiative power to estimate fire-related smoke pollution., EGU General Assembly 2024, Vienna, Austria, 14–19 Apr 2024, EGU24-13237, https://doi.org/10.5194/egusphere-egu24-13237, 2024.

EGU24-13416 | ECS | Posters on site | BG1.1

Two decades of fire-induced albedo change and associated radiative effect over sub-Saharan Africa 

Michaela Flegrova and Helen Brindley

Fire is an important, widespread Earth-system process, influencing local ecosystems and climate around the globe. Over half of global burned area occurs in Africa, with over 10% of the continent affected by fire every year. Fire temporarily alters the surface properties, including surface albedo, causing long-lasting changes to the surface radiation budget.

We present the analysis of 20 years of fire and albedo data in Africa, using the MODIS product suite. We show that fire causes an average immediate albedo decrease, recovering exponentially with a time constant of several weeks. While the magnitude of albedo changes shows large spatial and temporal variations and a strong land cover type (LCT) dependency, exponential recovery is observed in the majority of LCTs. We show that fires cause long-term brightening, observing on average a small positive albedo change 10 months after a fire, but we find this is driven almost exclusively by slow vegetation recovery in the Kalahari region.

Using downward surface shortwave flux estimates we calculate the fire-induced surface radiative forcing (RF), peaking at 5±2 Wm−2 in the burn areas, albeit with a significantly smaller effect when averaged temporally and spatially. We find that the average long-term RF is negative because of the brightening observed.

Our temporal analysis does not indicate a decrease in overall fire-induced RF, despite a well-documented reduction in burning in Africa in the recent decades, suggesting that the RF of individual fires is increasing because of higher levels of downward surface shortwave flux. We hypothesise this may be due to lower levels of smoke aerosols in the atmosphere.

How to cite: Flegrova, M. and Brindley, H.: Two decades of fire-induced albedo change and associated radiative effect over sub-Saharan Africa, EGU General Assembly 2024, Vienna, Austria, 14–19 Apr 2024, EGU24-13416, https://doi.org/10.5194/egusphere-egu24-13416, 2024.

EGU24-14202 | Posters on site | BG1.1 | Highlight

Evaluation of global fire simulations in CMIP6 Earth system models 

Fang Li, Xiang Song, Sandy Harrison, and Zhongda Lin

       Fire is the primary form of terrestrial ecosystem disturbance globally and a critical Earth system process. So far, most Earth system models (ESMs) have incorporated fire modeling, with 19 out of them submitted fire simulations to the CMIP6. Transitioning from CMIP5 to CMIP6, much more models submitted fire simulations and the dominant fire scheme has evolved from GlobFIRM to the Li scheme. However, it remains unknown how well CMIP6 ESMs perform in fire simulations. This study provides the first comprehensive evaluation of CMIP6 fire simulations, through comparisons with multiple satellite-based datasets and the Reading Paleofire Database of global charcoal records (RPD).

        Our results show that most CMIP6 models simulate the global amounts of present-day burned area and fire carbon emissions within the range of satellite-based products, and reproduce observed major features of spatial pattern and seasonal cycle as well as the relationships of fires with precipitation and population density, except for models employing the GlobFIRM fire scheme. Additionally, most CMIP6 models can reproduce the response of interannual variability of tropical fires to ENSO, except for some models incorporating the SPITFIRE fire scheme. From 1850 to 2015, CMIP6 models generally agree with RPD, with some discrepancies in southern South America before 1920 and in temperate and eastern boreal North America, Europe, and boreal Asia after 1990. Compared with CMIP5, CMIP6 has solved the serious issues of CMIP5 which simulates the global burned area less than half of observations, fails to capture the high burned area fraction in Africa, and underestimates seasonal variability. CMIP6 fire carbon emissions simulations are also closer to RPD. However, CMIP6 models still fail to capture the present-day significant decline in observed global burned area and fire carbon emissions partly due to underestimation in anthropogenic fire suppression, and fail to reproduce the spring peak in NH mid-latitudes mainly due to an underestimation of crop fires. Based on our findings, we identify potential biases in fire and carbon projection based on CMIP6 models. We also provide suggestions for the fire scheme development, and bias correction methods when generating multi-source merged fire products.

How to cite: Li, F., Song, X., Harrison, S., and Lin, Z.: Evaluation of global fire simulations in CMIP6 Earth system models, EGU General Assembly 2024, Vienna, Austria, 14–19 Apr 2024, EGU24-14202, https://doi.org/10.5194/egusphere-egu24-14202, 2024.

EGU24-14446 | ECS | Posters on site | BG1.1

Wildland Fire Smoke and Emissions Tradeoff Decision Support 

Laurel Sindewald, Shawn Urbanski, Karin Riley, Christopher Eckerson, Alex Dye, and Rachel Houtmann

In 2023, 6,551 wildfires across Canada burned 184,961 km2 of the landscape—about 5% of Canadian forests—emitting nearly 480 megatonnes of carbon, with emissions leading to air quality warnings as far away as Washington DC, USA. In early June, the air quality index in New York City was over 400, and by mid-June, smoke plumes passed above Europe. As wildland fires of increasing severity occur with increasing frequency, driven by global climate change and decades of fire suppression, societies near and far from high-risk ecosystems face increased exposure to wildfire emissions that may have both acute and long-term health impacts. Prescribed fire interventions show promise for reducing the risk of large wildfires in fire-prone ecosystems, but implementing prescribed fire can be difficult, in part due to concerns about the potential health impacts of prescribed fire smoke on nearby communities. To provide decision support for land managers aiming to reduce wildfire risk with prescribed fire treatments, we will produce a geospatial database of daily pollutant emissions and fire intensity from simulations of prescribed and wildland fires over a 20-year period for: 1) a baseline scenario of no management actions, 2) one or more scenarios of prescribed fire locations and timing based on interaction with tribes and Okanogan-Wenatchee National Forest (OWNF) managers, and 3) scenarios of prescribed fire locations and timing based on fire paths, locations of highly valued resources, areas available and suitable for treatment, determined by the research team. We can accomplish this by iterating between FSim, the Large Fire Simulator, which stochastically simulates large wildfire ignition and spread across a LANDFIRE fuels landscape, and FFE-FVS, the Forest Vegetation Simulator with the Fire and Fuels Extension, which simulates post-fire regeneration, forest growth, management actions including prescribed fire, fuel dynamics, and fuel consumption and pollutant emissions from prescribed fires and wildfires. Because FSim takes a Monte Carlo approach, simulating fires over 10,000 or more hypothetical fire seasons comprised of daily weather sequences, we will be able to estimate the probability of each landscape pixel burning in a wildfire and the conditional probability of that pixel burning at different flame lengths, allowing us to provide emissions estimates within a risk-assessment framework for managers. The framework will allow land managers to quantify the likelihood that smoke impacts from near-term prescribed fire treatments will be offset by reductions in severe smoke events from future wildfires. Additionally, the smoke event geospatial datasets may provide input into atmospheric transport models which could be used to simulate regional to national scale smoke impacts. We will pilot the project in Okanogan-Wenatchee National Forest, Washington, USA, working with the forest’s managers to design fuel treatment scenarios that will yield realistic fire occurrence trajectories and emission estimates to inform near-term prescribed fire operations. As a U.S. Federal Bipartisan Infrastructure Law Research & Development “proof of concept” project, the Wildland Fire Smoke and Emissions Tradeoff Decision Support project will inform U.S. Forest Service management policy and strategy around the use of prescribed fire in other National Forests in the U.S.

How to cite: Sindewald, L., Urbanski, S., Riley, K., Eckerson, C., Dye, A., and Houtmann, R.: Wildland Fire Smoke and Emissions Tradeoff Decision Support, EGU General Assembly 2024, Vienna, Austria, 14–19 Apr 2024, EGU24-14446, https://doi.org/10.5194/egusphere-egu24-14446, 2024.

EGU24-14748 | ECS | Posters virtual | BG1.1

Reconstructing human-fire-vegetation inter-relationships in a protected dry tropical forest, Mudumalai National Park, southern India 

Prabhakaran Ramya Bala, Nithin Kumar, Diptimayee Behera, Anoop Ambili, and Raman Sukumar

Tropical dry forests are recognized globally as the first frontier of human land-use change, due to multiple factors that make them amenable to human occupation, especially with the use of fire. However, in southern India, biodiversity ‘hotspots’ with human habitation are not uncommon with a long-term co-existence of humans in pristine environments. This points to the need for more accurate evidence-based (using charcoal, pollen, phytoliths) understanding of if, when and how land use and land cover changes impact regional vegetation-fire relationships. We reconstruct the environmental history for Mudumalai National Park, a fire-prone dry forest with >30% of the park subject to annual fires and a west-to-east rainfall-vegetation gradient. We examined a 150 cm sediment profile from an excavation in a seasonal wetland in the wettest part. The record spans 1200 years in time (bracketing radiocarbon dates) with very low macrocharcoal counts (mean - 4), with highest numbers in the surface and near-surface layers. Molecular fire proxies Polycyclic Aromatic Hydrocarbons (PAHs) were also found present - Phenanthrene (Phe), Anthracene (Ant), Fluoranthene (Fl), Pyrene (Py), Benzo[ghi]fluoranthene (Bghi), Benz[a]anthracene (BaA), Chrysene (Chr), Benzo(b)fluoranthene (BbF), Benzo(k)fluoranthene (BkF), Benzo[e]pyrene (BeP), Benzo[a]pyrene (BaP), and Perylene (Pry). Notably, Fl, Py, Bghi, BbF, BaA,and BeP constituted 90% of the total concentrations. Diagnostic ratios of PAHs for source determination pointed at a pyrogenic source consistently across all samples. Paleovegetation proxies n-alkanes (C14-C33) were analyzed and the average chain length (ACL) showed a transition towards higher chain lengths towards the surface indicating a change towards grass sources (C31, C33) in addition to woody biomass-derived compounds (C27, C29). Further analysis to characterize the human-fire-vegetation relationships is underway and to our knowledge, as the first report from a protected forest in India, our study offers critical insights for forest fire management in forested landscapes.

How to cite: Ramya Bala, P., Kumar, N., Behera, D., Ambili, A., and Sukumar, R.: Reconstructing human-fire-vegetation inter-relationships in a protected dry tropical forest, Mudumalai National Park, southern India, EGU General Assembly 2024, Vienna, Austria, 14–19 Apr 2024, EGU24-14748, https://doi.org/10.5194/egusphere-egu24-14748, 2024.

EGU24-14762 | Orals | BG1.1

Climate change has increased fire PM2.5 and its associated health burden 

Chaeyeon Park, Kiyoshi Takahashi, Shinichiro Fujimori, Thanapat Jansakoo, Chantelle Burton, Huilin Huang, Sian Kou-Giesbrecht, Christopher Reyer, Matthias Mengel, and Eleanor Burke

Climate change has influenced fire activities, altering the fire risk associated with air pollution and human health. However, the specific contribution of climate change to fire risks on air pollution and health burden has not yet been discovered. In this study, three fire-vegetation models were employed to simulate fire aerosol emissions under two simulations over the past six decades: an observation climate scenario and a counterfactual scenario where the long-term climate change trend is removed. Combining fire aerosol emissions with a chemical transport model and an avoidable mortality risk model, we calculated global fire PM2.5 and its associated mortality. By comparing the results under the two simulations, we demonstrated the climate change has increased the fire PM2.5 and its mortality. The findings indicated an increase in fire mortality over the six decades: 46,401 in the 1960s and 98,748 in the 2010s, with 3-8% attributed to climate change. Clear relationships were observed between the contribution of climate change to fire mortality and relative humidity or air temperature in some regions. This suggests that fire risks in these regions are sensitive to climate change and necessitate the development of adaptation strategies to mitigate risks in the future.  

How to cite: Park, C., Takahashi, K., Fujimori, S., Jansakoo, T., Burton, C., Huang, H., Kou-Giesbrecht, S., Reyer, C., Mengel, M., and Burke, E.: Climate change has increased fire PM2.5 and its associated health burden, EGU General Assembly 2024, Vienna, Austria, 14–19 Apr 2024, EGU24-14762, https://doi.org/10.5194/egusphere-egu24-14762, 2024.

EGU24-14891 | Orals | BG1.1

Fire hazard trajectories under climate change and management scenarios 

Marcos Rodrigues, Pere Gelabert, Teresa Lamelas, Raúl Hoffrén, Juan de la Riva, Darío Domingo, Cristina Vega-García, Paloma Ibarra, Aitor Ameztegui, and Lluís Coll

In this work we showcase the in-progress results from the FirePATHS project (PID2020-116556RA-I00). The project aims to assess the evolution of fire danger under different emission and forest management scenarios through the explicit interaction of the climate-vegetation-fire system. For this purpose, a methodological framework combining different simulation models of the elements of this system is proposed. The core of the process lies in the modeling of vegetation dynamics at stand scale according to different trajectories of climatic evolution to characterize the state and typology of fuels and the subsequent simulation of potential fire behavior during the 21st century.

We analyzed a set of 114 Pinus halepensis plots, surveyed in the field during 2017;  68 plots burned during the summer of 1994 and 46 unburned control stands. We used the medfate model to simulate forest functioning and dynamics, which provides the necessary fuel model parameters to be entered into fire behavior models (Fuel Characteristics Classification System, implemented in medfate as well). The combination of these two approaches provides time-varying estimates of fire behavior metrics (e.g., flame length or rate of spread). The simulation was conducted under SSP climate scenarios (SSP 126, 245, 370 and 585) depicting different levels of climate warming, vegetation dynamics and, hence, fire danger. Likewise, we devised a set of forest management prescriptions aimed at reducing climate vulnerability of tree communities and reducing extreme wildfire potentials. A baseline scenario with no management was also assessed.

We observed very contrasting trajectories between burned and control stands, with the first leading to increasing fuel loads, except in SSP 585. Fire potentials depicted a significant increase in surface fire behavior, with adaptive and mitigation management being able to mitigate it to some extent.

How to cite: Rodrigues, M., Gelabert, P., Lamelas, T., Hoffrén, R., de la Riva, J., Domingo, D., Vega-García, C., Ibarra, P., Ameztegui, A., and Coll, L.: Fire hazard trajectories under climate change and management scenarios, EGU General Assembly 2024, Vienna, Austria, 14–19 Apr 2024, EGU24-14891, https://doi.org/10.5194/egusphere-egu24-14891, 2024.

EGU24-15398 | Posters on site | BG1.1

Effects of recent increase in anomalous fires and smokes at high latitude regions on regional atmosphere 

Kwon-Ho Lee, Kwanchul Kim, and Dasom Lee

Spatiotemporal patterns and trends of atmospheric aerosols in high latitude region have been analyzed. Aerosol observation data from 2000-2022 acquired from the earth observing satellites including the Moderate Resolution Imaging Spectroradiometer (MODIS), the Ozone Monitoring Instrument (OMI), or geostationary satellites such as the Geostationary Korea Multi-Purpose Satellite-2A (GK-2A) . Results showed that Aerosol Optical Thickness (AOT) over the high latitude region has gradually decreased before 2016. However, AOT has increased significantly over the past 8 years. This increase was clearly shown in North America and North Asia, and was associated with an increase with fire activities. Smoke plumes originated from fire active fires transported eastward with meteorology, but occasionally moved toward the Arctic region. The occurrence of fires and the production and transport of aerosols will be a consequence or factor of the recent rapid climate change.

Acknowledgement: This research was supported by Basic Science Research Program through the National Research Foundation of Korea (NRF) funded by the Ministry of Education (NRF-2019R1I1A3A01062804).


How to cite: Lee, K.-H., Kim, K., and Lee, D.: Effects of recent increase in anomalous fires and smokes at high latitude regions on regional atmosphere, EGU General Assembly 2024, Vienna, Austria, 14–19 Apr 2024, EGU24-15398, https://doi.org/10.5194/egusphere-egu24-15398, 2024.

EGU24-15436 | ECS | Posters on site | BG1.1

Investigation of spatiotemporal variability in South American wildfire emissions and its impacts on CO concentrations 

Maria Paula Velasquez Garcia, Richard Pope, Steven Turnock, and Martyn Chipperfield

Wildfires in South America are a significant concern, causing high emissions and deforestation rates. They affect air quality, radiation balance, and sensitive ecosystems like the Amazon rainforest. Wildfires are expected to intensify with future land use and climate changes, making it crucial to enhance decision-making tools. Models of atmospheric composition, combined with wildfire emissions inventories, support decision-making by simulating events and their impacts on air quality. There are currently a range of wildfire/biomass burning emission inventories, which all use different approaches. This can lead to substantial differences in estimated emissions and thus impacts on atmospheric composition estimation.  This study aims to assess four inventories (2004-2022) in South America: Global Fire Emissions Database (GFED), Fire INventory from NCAR (FINN), Global Fire Assimilation System (GFAS) and Brazilian Biomass Burning Emission Model (3BEM-FRP), focussing on carbon monoxide (CO) given its relatively large emission and complementary satellite missions retrieving atmospheric CO. Our results analyse the temporal consistency in the emission seasonal cycles from the inventories and quantify the spatial agreement/differences between them. We also exploit the Measurements Of Pollution In The Troposphere (MOPITT) retrieved CO to assess the links between emission inventory tendencies with that of the atmospheric temporal evolution. Finally, we use an offline version of the INteractive Fire and Emission algoRithm for Natural envirOnments (INFERNO) model, within the Joint UK Land Environment Simulator (JULES) framework to investigate simulated skill of emissions of CO against the observational constraints above as INFERNO is the fire model of choice in the UK Earth System Model (UKESM).

How to cite: Velasquez Garcia, M. P., Pope, R., Turnock, S., and Chipperfield, M.: Investigation of spatiotemporal variability in South American wildfire emissions and its impacts on CO concentrations, EGU General Assembly 2024, Vienna, Austria, 14–19 Apr 2024, EGU24-15436, https://doi.org/10.5194/egusphere-egu24-15436, 2024.

EGU24-15518 | Posters on site | BG1.1

Integrating stakeholders’ opinion in land management to build climate resilience in the context of fire risk 

Valentina Bacciu, José Costa Saura, Grazia Pellizzaro, Bachisio Arca, Pierpaolo Duce, Donatella Spano, and Costantino Sirca

The Mediterranean region, already a climate change hotspot, is experiencing milder winters, hotter and drier summers, and increased extreme weather events, leading to longer fire seasons and increasing fire impacts. The socio-economic consequences of wildfires are significant, including the loss of human lives, infrastructure, and economic activity. Additionally, wildfires contribute significantly to climate change, accounting for up to 20% of global greenhouse gas emissions annually. Climate change is expected to worsen these conditions in the near future.

Given these circumstances, it is necessary to accelerate the transition towards the implementation of integrated and holistic fire management approaches aligned with future hazards. In the framework of The HUT project (The Human-Tech Nexus - Building a Safe Haven to cope with Climate Extremes), financed by the Horizon Europe program, the "Ogliastra-DEM8" case study (located in Sardinia, Italy) is aimed at responding to this necessity.

In particular, the main objective of The HUT is to mitigate the effects of climate-related events, by integrating and leveraging best practices and successful multi-disciplinary experiences and focusing on the prevention and preparedness phases of the disaster risk management cycle. In this context, the specific aim of the "Ogliastra-DEM8" case study is to provide the scientific/knowledge base needed to help policymakers and decision-makers defining adaptation and mitigation strategies that are effective in reducing fire impacts and associated costs in the short to medium-term under a changing climate. Towards this end, innovative tools (e.g., fire simulators, catastrophe insurance products, nature-based solutions) and stakeholder engagement, including participatory methods, will be developed.

This work presents the first phase of the work aimed at evaluating enablers and barriers to multi-hazard/systemic risk reduction by (i) reviewing the literature from other projects based in Sardinia, (ii) mapping and engaging stakeholders during an initial round of workshops, and (iii) debating fire-smart land management and adaptation options. Preliminary results indicate key barriers such as stakeholder conflicts, administrative silos, lack of political will, and funding complexities. All these elements contributed to varying degrees to the lack of a comprehensive approach towards integrated and sustainable management of the entire territory. On the other hand, enablers include stakeholder engagement, evidence of performance and co-benefits, and community awareness.

Further work will integrate stakeholder opinions into fire exposure and risk mapping under climate change conditions, with the goal of selecting and co-designing with them which fire-smart land management and adaptation options can be applied and where to protect the most important and vulnerable communities and ecosystems.

How to cite: Bacciu, V., Costa Saura, J., Pellizzaro, G., Arca, B., Duce, P., Spano, D., and Sirca, C.: Integrating stakeholders’ opinion in land management to build climate resilience in the context of fire risk, EGU General Assembly 2024, Vienna, Austria, 14–19 Apr 2024, EGU24-15518, https://doi.org/10.5194/egusphere-egu24-15518, 2024.

EGU24-16087 | Posters on site | BG1.1

Assessing post-fire soil erosion and water contamination risk in European fire-affected catchmentswith WEPPcloud-EU WATAR watershed model 

Jonay Neris, Carmen Sánchez-García, Marta Basso, Roger Lew, Anurag Srivastava, Mariana Dobre, Pete Robichaud, Erin Brooks, Cristina Santin, and Stefan Doerr

Soil and ash are key sources of sediment, carbon, nitrogen, and associated pollutant movement following a wildfire. Their transport into freshwater systems can pose severe environmental and socio-economic implications including impacts to water quality and aquatic ecosystems, disruptions to drinking water supply and high remediation costs, as well as the depletion of carbon and nutrients from areas affected by erosion. We assessed the risk of soil erosion, ash and contaminant transport, and water contamination in three burned European catchments in Central Europe (Germany and the Czech Republic), Portugal and Spain using the European Water Erosion Prediction Project cloud interface with the Wildfire Ash Transport and Risk (WEPPcloud-EU WATAR) watershed model. The watersheds varied in size from 100 to 22,000 ha and represent distinct climatic conditions. To our knowledge, this is the first application of this model in European post-fire scenarios. We calibrated and validated the model using catchment runoff data (where available) and nearby streamflow data from both pre- and post-fire periods when runoff data was unavailable. Additionally, we used sediment transport data (where available) along with ash contaminant content data to calibrate and validate erosion and ash transport rates. Model performance was assessed using statistics like Nash-Sutcliffe Efficiency (NSE), coefficient of determination (R2) and percent bias (PBias (%)). Once the model was calibrated and validated, we estimated the post-fire risk of soil erosion, ash transport, and ash pollutant concentrations in the affected areas. The simulations provided the probabilities of occurrence and return periods for severe erosion events, as well as for ash and contaminant transport events. Based on these simulations, we identified hillslopes that were the main sources of runoff, erosion, ash and contaminant transport. This information is important to managers who can prioritize the application of mitigation treatments and prevention plans. Given the projected increase in fire weather in many regions in Europe, our findings suggest that the WEPPcloud-EU WATAR model is an increasingly useful tool in predicting and mitigating soil erosion and water contamination impacts of European burnt catchments.

How to cite: Neris, J., Sánchez-García, C., Basso, M., Lew, R., Srivastava, A., Dobre, M., Robichaud, P., Brooks, E., Santin, C., and Doerr, S.: Assessing post-fire soil erosion and water contamination risk in European fire-affected catchmentswith WEPPcloud-EU WATAR watershed model, EGU General Assembly 2024, Vienna, Austria, 14–19 Apr 2024, EGU24-16087, https://doi.org/10.5194/egusphere-egu24-16087, 2024.

EGU24-16263 | ECS | Orals | BG1.1

Fire, permafrost, and people: Late Holocene fire regimes and their impacts on lake systems in Yakutia, Siberia 

Ramesh Glückler, Elisabeth Dietze, Stefan Kruse, Andrei Andreev, Boris K. Biskaborn, Evgenii S. Zakharov, Izabella Baisheva, Amelie Stieg, Shiro Tsuyuzaki, Kathleen Stoof-Leichsenring, Luidmila A. Pestryakova, and Ulrike Herzschuh

The Republic of Sakha (Yakutia), the coldest permanently inhabited region on Earth, is characterized by unique ecological relationships between larch forest, permafrost, and wildfires. Together, they can stabilize each other, preserving the larch-dominated biome. Abundant lakes have important cultural and subsistence-related functions and are dynamically connected to warming permafrost processes. Recently intensified wildfire seasons, however, raised questions regarding the causes and impacts of long-term (centennial to millennial) fire regime changes. Despite recent progress, eastern Siberia is still sparsely covered by reconstructions of long-term fire history. This also limits any evaluation of fire regime impacts on permafrost lake development and catchment erosion. Past studies have shown the benefit of combining paleoecological fire reconstructions with geochemical data to shed light on fire regime changes and their impacts on lake catchments, as well as traces of potential human land use.

We present nine new records of Late Holocene wildfire activity, based on macroscopic charcoal in lake sediments (including information on charcoal particle sizes, morphologies, and length to width ratios), accompanied by sediment geochemistry data from high-resolution XRF core scanning. The studied lakes are located in the Lena-Amga interfluve of the Central Yakutian Lowlands, the Verkhoyansk Mountains, and the Oymyakon Highlands. The new data cover both thermokarst and glacial lakes, and a range from remote to rural settings and low to high elevations. Charcoal concentration in the lowland lakes is on average three times as high as in the highland lakes. Contrary to our hypothesis, charcoal concentration in most lakes is negatively correlated to many XRF-derived lithogenic elements indicating detrital input from catchment erosion (e.g., Ti, K). Reminiscent of earlier findings [1], multiple lowland sites share a signal of sharply decreasing biomass burning around 1300 CE. This coincides with the initial settlement of the Sakha people and increased catchment erosion. The new fire reconstructions allow for the evaluation of potential human impacts on past fire regime changes in Yakutia, while improving the region’s representation in global synthesis studies.

[1]  Glückler R. et al. (2021): Wildfire history of the boreal forest of south-western Yakutia (Siberia) over the last two millennia documented by a lake-sediment charcoal record. Biogeosciences 18 (13): 4185–4209. https://doi.org/10.5194/bg-18-4185-2021.

How to cite: Glückler, R., Dietze, E., Kruse, S., Andreev, A., Biskaborn, B. K., Zakharov, E. S., Baisheva, I., Stieg, A., Tsuyuzaki, S., Stoof-Leichsenring, K., Pestryakova, L. A., and Herzschuh, U.: Fire, permafrost, and people: Late Holocene fire regimes and their impacts on lake systems in Yakutia, Siberia, EGU General Assembly 2024, Vienna, Austria, 14–19 Apr 2024, EGU24-16263, https://doi.org/10.5194/egusphere-egu24-16263, 2024.

EGU24-16293 | ECS | Posters on site | BG1.1 | Highlight

Global atmospheric impacts of aerosols emitted from the 2023 Canadian wildfires 

Iulian-Alin Rosu, Matt Kasoar, Eirini Boletti, Mark Parrington, and Apostolos Voulgarakis

Wildfires are a central but relatively unexplored component of the Earth system. Severe wildfire events can lead to intense destruction of both nature and property, as was the case during the anomalously intense 2023 Canadian wildfire event. Last year, approximately 5% of the total forest area of Canada burned [1] [2], which is the highest wildfire damage Canada has ever sustained [1].

Conditions pertaining to climate change and modifications in atmospheric conditions are considered to be responsible for this record series of wildfires [3]. Increasing mean temperatures and decreasing humidity in the region has exacerbated wildfire risk. Carbon emissions from the 2023 Canadian wildfires have been the highest on record [4], including large amounts of carbonaceous aerosol which can exert substantial atmospheric radiative forcing. Also, Canadian fire emissions contributed around 20% of global emissions from vegetation fires. Thus, beyond the well-known health risks of wildfire emission compounds, it is important to also study the consequences of these emissions on large-scale atmospheric composition and meteorological behavior.

In this work, the global and regional atmospheric impact of the previously mentioned series of wildfires is investigated using the EC-Earth3 and UKESM1 earth system models. Simulated atmospheric conditions with and without the wildfire emissions, as provided by the Copernicus Atmosphere Monitoring Service (CAMS) Global Fire Assimilation System (GFAS), are compared through atmospheric modelling in the context of the Canadian 2023 fire season. The investigation reveals the connections between the emissions produced by this series of wildfires and atmospheric phenomena of importance, such as large-scale circulation, temperature patterns, and precipitation.

[1] "Fire Statistics". Canadian Interagency Forest Fire Centre. Retrieved January 4, 2024.

[2] The State of Canada’s Forests: Annual Report 2022. Canadian Minister of Natural Resources.

[3] Barnes, Clair, et al. "Climate change more than doubled the likelihood of extreme fire weather conditions in eastern Canada." (2023).

[4] “Copernicus: Emissions from Canadian wildfires the highest on record – smoke plume reaches Europe”. Atmosphere Monitoring Service, Copernicus. Retrieved January 4, 2024.

How to cite: Rosu, I.-A., Kasoar, M., Boletti, E., Parrington, M., and Voulgarakis, A.: Global atmospheric impacts of aerosols emitted from the 2023 Canadian wildfires, EGU General Assembly 2024, Vienna, Austria, 14–19 Apr 2024, EGU24-16293, https://doi.org/10.5194/egusphere-egu24-16293, 2024.

EGU24-16592 | ECS | Posters on site | BG1.1 | Highlight

Exploring the role of post-fire erosion as a carbon sink mechanism 

Antonio Girona-García, Diana Vieira, Stefan Doerr, and Cristina Santín

Wildfires release approximately 2.1 Pg C to the atmosphere each year. The impact of wildfires on the carbon cycle, however, extends well beyond direct emissions, involving complex interactions among various source and sink processes. One such process, the enhanced post-fire soil organic carbon (SOC) erosion, remains unquantified as a potential C sink mechanism. Post-fire SOC erosion functions as a C sink when the subsequent burial and stabilization of eroded C offsite, coupled with the recovery of net primary production and SOC content onsite, outweigh the C losses to the atmosphere during post-fire transport of SOC. In this work, we synthesize published data on post-fire SOC erosion and evaluate its overall potential to act as C sink. In addition, we estimate its magnitude at continental scale following the 2017 wildfire season in Europe, showing that SOC erosion can indeed play a quantitatively significant role in the overall C balance of wildfires. 

How to cite: Girona-García, A., Vieira, D., Doerr, S., and Santín, C.: Exploring the role of post-fire erosion as a carbon sink mechanism, EGU General Assembly 2024, Vienna, Austria, 14–19 Apr 2024, EGU24-16592, https://doi.org/10.5194/egusphere-egu24-16592, 2024.

EGU24-16676 | ECS | Orals | BG1.1

Study of greenhouse gases emitted by biomass burnings with a decade of infrared observation of CO2 and CH4 by IASI 

Victor Bon, Cyril Crevoisier, and Virginie Capelle

Biomass burnings are one of the major sources of greenhouse gases in the atmosphere, impacting air quality, public health, climate, ecosystem dynamics, and land-atmosphere exchanges. In the tropics, South America represents about 10 % of the tropical emissions and present a large diversity of biomes and fire conditions. Over the last two decades, satellite observations have provided crucial information, notably via active fires detection, Fire Radiative Power (FRP) estimates and burned area (BA) measurements from imagers such as Moderate Resolution Imaging Spectroradiometer (MODIS) and Visible Infrared Imaging Radiometer Suite (VIIRS). Global inventories (e.g., GFED, GFAS, FEER, QFED, etc.) heavily rely on these satellite-derived indicators to estimate emissions from biomass burnings. However, emissions derived from these various models can significantly differ among them and large uncertainties persist regarding fire emissions, their variability, and their links with several drivers (e.g., type of combustion, vegetation, transport, etc.).

In this context, we propose a novel approach to estimate emissions from biomass burnings by directly using greenhouse gas concentrations in the atmosphere derived from spaceborne observations. Leveraging a decade of observations from the Infrared Atmospheric Sounding Radiometer (IASI) on-board the three Metop satellites, we have access to an unprecedented spatial coverage of global mid-tropospheric CO2 and CH4 concentrations twice a day (9:30 AM/PM LT). From this dataset, we developed the Daily Tropospheric Excess (DTE) method, which is based on the use of the diurnal cycle of biomass burnings and the vertical transport of their emissions to link the observed diurnal variations of the mid-tropospheric CO2 and CH4 concentrations to burnings activities.

We will demonstrate the relevance of the DTE for analyzing CO2 and CH4 emissions from various type of burnings, biomes, and human activities across South America. This will be achieved by comparing DTE with existing indices of fire characteristics such as FRP and BA from MODIS/SUOMI satellite observations, alongside global emissions databases like GFED and GFAS. Globally, we will show that their spatial distribution, seasonal intensity, and interannual variability are consistent with each other, even if some differences have been found and will be discussed. Additionally, geostationary data from GOES-R, MSG, and Himawari-8 satellites will be used to analyze the impact of observation times on the differences observed between the various datasets and the DTE.

How to cite: Bon, V., Crevoisier, C., and Capelle, V.: Study of greenhouse gases emitted by biomass burnings with a decade of infrared observation of CO2 and CH4 by IASI, EGU General Assembly 2024, Vienna, Austria, 14–19 Apr 2024, EGU24-16676, https://doi.org/10.5194/egusphere-egu24-16676, 2024.

EGU24-17593 | Orals | BG1.1

Effect of combustion conditions on aerosol particle emissions from savanna and grassland fires 

Ville Vakkari, Angela Buchholz, Liqing Hao, Mika Ihalainen, Kerneels Jaars, Kajar Köster, Viet Le, Pasi Miettinen, Arya Mukherjee, Saara Peltokorpi, Iida Pullinen, Stefan J. Siebert, Olli Sippula, Markus Somero, Lejish Vettikkat, Annele Virtanen, Pasi Yli-Pirilä, Arttu Ylisirniö, and Pieter G. van Zyl

Fire is an integral part of savanna and grassland biomes and globally approximately half of landscape fire emissions originate from savannas and grasslands. Emissions of trace gases and aerosol particles from landscape fires are characterised by emission factors (EFs), which denote the amount of emitted substance per mass of combusted biomass. EFs vary depending on both the biomass that is consumed in the fire and the combustion characteristics of the fire, i.e. the ratio of flaming to smouldering combustion. However, emission inventories tend to use only one average EF for each biome.

Here, we use a set of 27 laboratory experiments to characterise the effect of combustion characteristics on submicron aerosol EFs from savanna and grassland biomass acquired from South Africa as well as boreal forest floor samples from Finland. Combustion experiments were carried out at the ILMARI facility in Kuopio, Finland from May to June 2022 under an open stack mimicking natural burning and dilution. Sample was injected into a 29 m3 environmental chamber for ageing studies. Chemical and physical properties of both fresh and aged smoke were observed with a host of instruments including e.g. AMS, FIGAERO-CIMS, VOCUS, SP2 and SMPS. The ratio of flaming to smouldering combustion was characterised by modified combustion efficiency (MCE), i.e. CO2/(CO2+CO).

The increase of organic aerosol EF with increasing smouldering fraction (i.e. decreasing MCE) was very similar for both the grassland and savanna combustion experiments. Surprisingly, also the boreal forest floor EFs closely follow the same trend, where smouldering-dominated combustion EFs are more than 10 times higher than EFs for flaming combustion. We observed also that the submicron aerosol particle size distribution shifts towards larger sized particles with increasing smouldering fraction. Furthermore, both the number and the mass of the size distribution cannot be fully characterised with a single log-normal size distribution, which needs to be considered when converting mass emissions into number size distribution in simulations.

How to cite: Vakkari, V., Buchholz, A., Hao, L., Ihalainen, M., Jaars, K., Köster, K., Le, V., Miettinen, P., Mukherjee, A., Peltokorpi, S., Pullinen, I., Siebert, S. J., Sippula, O., Somero, M., Vettikkat, L., Virtanen, A., Yli-Pirilä, P., Ylisirniö, A., and van Zyl, P. G.: Effect of combustion conditions on aerosol particle emissions from savanna and grassland fires, EGU General Assembly 2024, Vienna, Austria, 14–19 Apr 2024, EGU24-17593, https://doi.org/10.5194/egusphere-egu24-17593, 2024.

EGU24-17935 | Posters on site | BG1.1

The FLARE Workshop perspective on Fire’s Role in the Carbon Cycle 

Chantelle Burton, Stephen Plummer, Noah Liguori-Bills, Morgane Perron, Douglas Kelley, Miriam Morrill, Boris Vannière, Joanne Hall, Stijn Hantson, Matthias Forkel, Christoph Völker, Kebonye Dintwe, Cristina Santin, Jessie Thoreson, Benjamin Poulter, Matthew Jones, and Douglas Hamilton

Fire substantially influences and modulates the global carbon cycle through numerous processes, interactions, and feedbacks. Fires are also strongly intertwined with human activities; people act both as drivers of change through ignitions, suppression, land-cover change, prescribed burning, and climate change, and are affected in return by changes in fire regimes. 

Despite fire’s many complex interactions throughout the Earth System, it is often viewed only as a destructive process, and one that solely acts as a source of atmospheric carbon. In terms of fire’s carbon budget, the release of carbon only represents the very initial stages of the process, missing the drivers and complex ways in which fire shapes plant species evolution and ecosystem trajectories, nutrient cycling and redistribution, carbon allocation, deposition and sequestration over different spatiotemporal scales. Therefore, there is a clear need to fully understand the role of fire in the Earth System holistically. However, different aspects of fire’s role in the carbon cycle are often studied by different communities and disciplines, hindering this much-needed integrated understanding. 

Through the Fire Learning AcRoss the Earth Systems (FLARE) workshop (September 2023) we brought together fire scientists across multiple disciplines to facilitate transdisciplinary discussion. We propose that the visualization of fire processes as carbon colours across the Earth System can be a thematic tool for unifying disciplines. It explores all aspects of fire and smoke implications for living systems and opens questions about fire’s role in carbon budgets, afforestation, and climate change and related mitigation strategies. We also identified several scientific challenges for the community where, by working together, we can address some fundamental questions for fire’s role in the carbon cycle, such as: What is the contribution of fire and of individual fire events to the global carbon cycle? How do changes in fire regimes influence ecosystem stability across different timescales? How do future changes in fire regimes influence global climate, allowable emissions and carbon budgets, and temperature mitigation ambitions? In this presentation, we explore how we can bring a more interdisciplinary approach to fire science to address these fundamental questions.

How to cite: Burton, C., Plummer, S., Liguori-Bills, N., Perron, M., Kelley, D., Morrill, M., Vannière, B., Hall, J., Hantson, S., Forkel, M., Völker, C., Dintwe, K., Santin, C., Thoreson, J., Poulter, B., Jones, M., and Hamilton, D.: The FLARE Workshop perspective on Fire’s Role in the Carbon Cycle, EGU General Assembly 2024, Vienna, Austria, 14–19 Apr 2024, EGU24-17935, https://doi.org/10.5194/egusphere-egu24-17935, 2024.

EGU24-18169 | ECS | Posters on site | BG1.1 | Highlight

What makes a fire grow extremely large? 

Rebecca Scholten, Tirtha Banerjee, Yang Chen, Ajinkya Desai, Tianjia Liu, Douglas Morton, Sander Veraverbeke, and James Randerson

Wildfires are an important disturbance in global ecosystems and are a critical driver of trends in the land carbon budget. Fire is an extreme phenomenon, with the largest burned area often occurring during extreme fire seasons generating large fires. Days with fire conditions conducive to fire ignition and spread are increasing in a warming climate in many regions of the world, contributing to increases in fire occurrence and annual burned area. However, the climate, fuel, and weather conditions that lead to extremely large fires in different biomes are poorly understood.

Here, we explore the temporal evolution of extremely large fires in temperate and boreal regions using new satellite-derived fire event tracking datasets optimized to match higher resolution time series of fire progression from aircraft and other sources. We aimed to understand the specific environmental conditions required for the development of a large fire. Our analysis revealed a disproportionate impact of multiple fire ignitions in creating large fires through merging. Our findings suggest that the largest fires in both biomes may be commonly created through multiple fires growing together. We hypothesize that a combination of physical and anthropogenic factors may accelerate merging, making these fires extremely difficult to contain and more robust to environmental controls regulating extinction. In our analysis, we use the Fire Events Database, the Arctic-boreal Fire Atlas, and GOFER, which enable attribution of ignition sources. Our analysis may contribute to an improved understanding of the influence of large-scale lightning storms in creating extremely large and destructive fire events.

How to cite: Scholten, R., Banerjee, T., Chen, Y., Desai, A., Liu, T., Morton, D., Veraverbeke, S., and Randerson, J.: What makes a fire grow extremely large?, EGU General Assembly 2024, Vienna, Austria, 14–19 Apr 2024, EGU24-18169, https://doi.org/10.5194/egusphere-egu24-18169, 2024.

EGU24-18811 | Posters virtual | BG1.1

Taking advantage of satellite data, large datasets of fire records and cloud computing for modelling potential fire severity useful for better assess fire risk 

José Maria Costa Saura, Valentina Bacciu, Donatella Spano, and Costantino Sirca

Fire risk analyses, usually focused on fire hazard (i.e. the probability of fire occurrence), often neglect an important issue such as the sensitivity/vulnerability (i.e., the degree of potential damage, sensus IPCC) of different locations within the area of interest.  Such lack of consideration comes from past data processing constrains that limited fire severity studies to analyse only single or few fire events. Nowadays, online data repositories and processing platforms (e.g. Google Earth Engine) allow to easily integrate and process a vast amount of data from multiple sources that might prove useful for developing tailored tools for decision making. Here, we present an example for predicting potential fire severity based on the analysis of more than 1 000 fire events from southern France and western Italy which integrates climate, topographical and remote sensing variables. Furthermore, we assessed if the model “used” the explanatory variables under a meaningful biophysical sense.   Using the random forest algorithm and the relativized difference of the Normalized Burn Ratio (rdNBR) as proxy of fire severity, we reach to explain up to 75% of the variability in the data with most of the variables showing a clear and interpretable effect. Our results suggests that this type of approach might prove useful for better address fire risk assessments.

How to cite: Costa Saura, J. M., Bacciu, V., Spano, D., and Sirca, C.: Taking advantage of satellite data, large datasets of fire records and cloud computing for modelling potential fire severity useful for better assess fire risk, EGU General Assembly 2024, Vienna, Austria, 14–19 Apr 2024, EGU24-18811, https://doi.org/10.5194/egusphere-egu24-18811, 2024.

EGU24-18894 | ECS | Posters virtual | BG1.1

Mapping open burning of agricultural residues from Earth Observations 

Eduardo Oliveira, João Gata, Diogo Lopes, Leonardo Disperati, Carla Gama, and Bárbara Silva

Agricultural residue burning is a common practice in various regions of the world, which may have several environmental impacts, including on air quality, and the potential for triggering wildfires. In Portugal, this practice is particularly prevalent during the wet season, spanning from October to April. It involves open field burning of pruning residues and extensive burning to clear shrubbery, creating pastures for livestock. This research, conducted within the framework of the PRUNING project - Mapping open burning of agricultural residues from Earth Observations and modelling of air quality impacts- aims to explore the potential for detecting such events through satellite remote sensing.

The primary focus of this study is to assess the limitations of satellite remote sensing detection, with the overarching aim of integrating these findings into a systematic monitoring framework for open burning of agricultural residues. Additionally, the study aims to predict pollutant emissions and assess their impacts on air quality, providing valuable insights for environmental management and sustainable agricultural practices.

To achieve this goal, an in-depth analysis of known burning events was conducted using infrared thermal sensors. Multiple products, including Fire Radiative Power and fire masks from various sensors (e.g., MODIS, VIIRS, and Sentinel 3), were employed to characterize these known open field burning events. The results of this work allow verifying the tradeoffs effects associated with spatial, spectral, and temporal resolutions for each sensor, elucidating their impacts on the precision and accuracy of event detections. In parallel, this study evaluated the accuracy of the MINDED-FBA method in characterizing these known events. This automatic detection method, allows incorporating data from higher spatial resolution sensors (e.g., Sentinel-1, Sentinel-2, Landsat), for determining the extent of burned areas through multiple multispectral indices. In this context, the MINDED-FBA method may also be used to validate thermal anomalies detection products. Finally, the results of this work have also been compared to a national level register database of open burning, provided by the ICNF (Institute for Nature Conservation and Forests).

How to cite: Oliveira, E., Gata, J., Lopes, D., Disperati, L., Gama, C., and Silva, B.: Mapping open burning of agricultural residues from Earth Observations, EGU General Assembly 2024, Vienna, Austria, 14–19 Apr 2024, EGU24-18894, https://doi.org/10.5194/egusphere-egu24-18894, 2024.

EGU24-18941 | Orals | BG1.1

Arctic peat fire emissions estimated from satellite observations of fire radiative power 

Johannes Kaiser, Kerstin Stebel, Philipp Schneider, and Vincent Huijnen

Exceptional wildfire activity occurred in the Arctic during the last years due to pronounced heat episodes. The Arctic has an abundance of peat and soils with organic content. When peat is burnt, the carbon flux into the atmosphere is virtually irreversible and this process may become of global significance for Arctic fires. Furthermore, smoke from smoldering fires (below-ground, peat) has a different chemical composition than smoke from flaming fires. It is therefore important to distinguish peat fires and above-ground, potentially flaming fires in fire emission estimation.

The operational Copernicus Atmosphere Monitoring Service (CAMS) is tracking global fire activity and emissions with its Global Fire Assimilation System (GFAS) as a near-real time service. GFAS uses satellite-based observations of fire radiative power (FRP), which links observed thermal radiation directly to the biomass combustion rate, i.e. amount of biomass burnt and corresponding emission of carbon into the atmosphere, based on satellite retrievals from MODIS and VIIRS. 

Here, we present a partitioning of the Arctic fire activity represented in GFAS into smoldering below-ground and potentially flaming above-ground fires using two approaches: (1) masking the fire activity maps with published peat maps and (2) analysing the observed diurnal cycles of the fire activity at all locations. We subsequently apply adapted emission factors and compare the resulting emission estimates to the standard values produced by CAMS for carbon, carbon monoxide, nitrogen dioxide and aerosols.

Furthermore, we may confront the fire emission estimates with independent atmospheric smoke observations by feeding them into IFS-COMPO, which is used to generate hindcasts of atmospheric composition, including tropospheric columns of CO and NO2. This allows an evaluation of the estimated trace gas emissions, by comparing the model simulations to satellite retrievals of carbon monoxide and nitrogen dioxide. It thus provides an independent assessment of the estimated fire emissions, and, in turn, carbon flux.

How to cite: Kaiser, J., Stebel, K., Schneider, P., and Huijnen, V.: Arctic peat fire emissions estimated from satellite observations of fire radiative power, EGU General Assembly 2024, Vienna, Austria, 14–19 Apr 2024, EGU24-18941, https://doi.org/10.5194/egusphere-egu24-18941, 2024.

EGU24-18977 | Orals | BG1.1 | Highlight

Global seasonality of small-scale livelihood fire 

Matthew Kasoar, Cathy Smith, Ol Perkins, James Millington, and Jayalaxshmi Mistry

Landscape fires are increasingly represented in dynamic global vegetation models to understand impacts on carbon emissions and climate. Deliberate human fire use and management influence landscape fire characteristics, varying in space and time depending on social, economic, and ecological factors. For example, fire is used variously in rural livelihoods involving e.g., agriculture, hunting, gathering, and for other cultural practices, often depending on the time of year. Yet existing global fire models typically represent human fire use as a constant function of gridded datasets such as population density or gross domestic product.

Recently, initiatives have begun to draw together available data on global fire use from across multiple disciplines and disparate sources into coherent databases. We draw on information from one of these databases, the Livelihood Fire Database (LIFE), which includes case studies in 587 locations worldwide, to assess the availability of data on seasonality of anthropogenic fires associated with small-scale rural livelihoods. By defining seasonal cycles relative to the local variation of precipitation and evapotranspiration at each case study location, we look for patterns in the spatiotemporal nature of anthropogenic fires associated with different fire-use purposes - such as clearing vegetation for agriculture, maintaining pasture for livestock, or driving game when hunting - and consider the potential for this analysis to inform fire models.

For many fire types, especially those related to hunting, gathering, human wellbeing, and social signalling, there are limited quantitative data available, but it is possible to draw qualitative insights from case studies. Where quantitative data are available, we find some correspondence between fire seasonality and the intended fire-use purpose, suggesting that distinguishing between distinct fire-use purposes could improve the representation of human fire use in fire models, and consequently the seasonal cycle of fire emissions. Case studies demonstrate that environmental and social conditions drive variation in fire use for the same purpose, reiterating that a wide range of factors influence human behaviour and that assumptions of uniform drivers of anthropogenic fire may be misleading. Many of the fires now being revealed in global burned area data by new fine-scale remote sensing products are likely human-set; continued collection, collation, and analyses of data on human fire use globally is important to ensure appropriate anthropogenic representation in fire models.

How to cite: Kasoar, M., Smith, C., Perkins, O., Millington, J., and Mistry, J.: Global seasonality of small-scale livelihood fire, EGU General Assembly 2024, Vienna, Austria, 14–19 Apr 2024, EGU24-18977, https://doi.org/10.5194/egusphere-egu24-18977, 2024.

EGU24-19223 | ECS | Posters virtual | BG1.1

Monitoring wildfires from satellite, integration in Copernicus services and characterizing atmospheric impacts from the regional to the global scales 

Dominika Leskow-Czyżewska, Stephan Bojinski, Julien Chimot, Andrea Meraner, Mark Parrington, and Federico Fierli

Satellite-borne observations offer the possibility to monitor wildfires and their impact worldwide. In addition, satellite products are increasingly used in early warning and forecasting systems for fire management. Europe is implementing a long-term and reliable observational programme and, within this frame, EUMETSAT, the European meteorological satellite operator, provides numerous observational products ranging from near-real-time wildfire identification (e.g. fire radiative power) to atmospheric impacts (e.g. major pollutants and smoke). 

Our presentation will focus on the satellite data value chain, e.g. the integration in the Copernicus Atmosphere Monitoring Service (CAMS) Global Fire Assimilation System (GFAS). To do that, we will firstly present datasets addressing wildfires (e.g. Fire Radiative Power, atmospheric composition, and smoke) currently generated at EUMETSAT and its Satellite Applications Facility (SAF). We will also introduce upcoming (based on the Flexible Combined Imager on-board the Meteosat Third Generation) and future products (Sentinel-4 and 5), with an example of potential joint use for a past intense fire case in the Mediterranean (Greece, August 2023).  

We will then show the entire value chain, including how the data is used in the Copernicus Atmosphere Monitoring Service (CAMS) Global Fire Assimilation System (GFAS), with an example on the recent intense and anomalous fire season in Canada (spring to summer 2023). This will show how distinct phases of wildfires management – from early warnings up to the impacts on yearly emissions – can be monitored with the synergy of satellite data and Copernicus forecast and analysis. Finally, we will touch also on the user support activities within EUMETSAT in this area. 

How to cite: Leskow-Czyżewska, D., Bojinski, S., Chimot, J., Meraner, A., Parrington, M., and Fierli, F.: Monitoring wildfires from satellite, integration in Copernicus services and characterizing atmospheric impacts from the regional to the global scales, EGU General Assembly 2024, Vienna, Austria, 14–19 Apr 2024, EGU24-19223, https://doi.org/10.5194/egusphere-egu24-19223, 2024.

EGU24-19330 | Orals | BG1.1

Burned Area Mapping with Sentinel-2 based on reflectance modelling and deep learning – preliminary global calibration and validation 

Marc Padilla, Ruben Ramo, Sergio Sierra, Bernardo Mota, Roselyne Lacaze, and Kevin Tansey

Current global burned area products are available at coarse spatial resolutions (300-500 m), what leads to large amounts of errors, hindering an accurate understanding of fire-related processes. This study proposes a global calibration method for a sensor-independent burned area algorithm, previously used with 300 m Sentinel-3 Synergy data, and here implemented with 20 m Sentinel-2 MSI imagery. A binomial model that combines reflectance-based burned area predictions constrained by spatio-temporal densities derived from VIIRS active fires is calibrated using a reference dataset generated from Landsat imagery at a sample of 34 units across the globe. Preliminary leave-one-out cross-validation analyses show promisingly high accuracies (Dice of coefficient of 84.8%, commission error ratio of 13.2%, omission error ratio of 17.1% and relative bias of -4.5%), especially taking into account the mismatch of acquisition dates between reference and algorithm input data, what introduces apparent errors on the validation results.

How to cite: Padilla, M., Ramo, R., Sierra, S., Mota, B., Lacaze, R., and Tansey, K.: Burned Area Mapping with Sentinel-2 based on reflectance modelling and deep learning – preliminary global calibration and validation, EGU General Assembly 2024, Vienna, Austria, 14–19 Apr 2024, EGU24-19330, https://doi.org/10.5194/egusphere-egu24-19330, 2024.

EGU24-19716 | ECS | Posters on site | BG1.1

"Fire impacts in the Cerrado: Integrating LiDAR and field data to monitor vegetation structure and post-fire recovery." 

Manoela Machado, Wesley da Cruz, Maria Antonia Carniello, Emily Sturdivant, Francisco Navarro-Rosales, Marcia Macedo, Wayne Walker, and Imma Oliveras Menor

Fire is a natural disturbance capable of altering plant distributions and community assemblages, influencing species evolution through the selection of traits and strategies, and affecting biogeochemical cycles. This powerful tool of landscape transformation can negatively impact even a fire-dependent ecosystem when natural fire regimes are altered. In recent times, interactions between human activities in the Cerrado (e.g., deforestation and intentional fires used to clear land), and a hotter and drier climate (due to climate change), have altered natural fire regimes causing more frequent and intense fire events, negatively impacting biodiversity, human health, and the regional climate. These fire-disturbed areas are widespread and highly vulnerable to future degradation from compounding disturbances, but they still harbour valuable biodiversity and carbon stocks that deserve protection and restoration. Monitoring the impacts of fire disturbance on vegetation structure and the potential pathways of recovery is critical to understand and protect resilient ecosystems under a rapidly changing climate. Robust monitoring requires the integration of modelled and field-based data tools and techniques. Field inventories alone are insufficient to capture the spatiotemporal variability of impacts of fire on native vegetation and should be coupled with remotely sensed data, among which, LiDAR (light detection and ranging) is unparalleled in characterising 3-D vegetation structure. Thus, the combination of LiDAR and forest inventory data is ideally suited for scaling the impacts of fire on forest vegetation and associated carbon stocks. In this study, we are assessing key metrics of vegetation structure derived from a combination of LiDAR and field data collected at the Experimental Station Serra das Araras, Mato Grosso state, Brazil. This field site comprises Cerrado vegetation that has been subject to three experimental fire treatments: every year, every two years, and every three years beginning in 2017, as well as fire suppression for over three decades. We are investigating whether key vegetation structural metrics can capture different fire treatments and identify spatial patterns of disturbance. We are also assessing if these patterns are different when comparing LiDAR data collected with a handheld scanner versus an airborne drone. This study aims to refine our methods and improve our understanding of vegetation structure responses across a gradient of fire disturbance regimes and potential post-fire recovery trajectories, which are key not only for ecological studies but also for emerging carbon markets – one of several mechanisms aimed at achieving climate change mitigation, conservation, and sustainable development outcomes. We hope to improve the process of carbon stock mapping in disturbed ecosystems and use the outputs to drive scenarios modelling at larger scales, providing a more comprehensive assessment of what future Cerrado carbon dynamics might look like under a range of possible disturbance/recovery dynamics.

How to cite: Machado, M., da Cruz, W., Carniello, M. A., Sturdivant, E., Navarro-Rosales, F., Macedo, M., Walker, W., and Oliveras Menor, I.: "Fire impacts in the Cerrado: Integrating LiDAR and field data to monitor vegetation structure and post-fire recovery.", EGU General Assembly 2024, Vienna, Austria, 14–19 Apr 2024, EGU24-19716, https://doi.org/10.5194/egusphere-egu24-19716, 2024.

EGU24-20564 | ECS | Orals | BG1.1 | Highlight

Future global wildfire regimes under high and low climate mitigation efforts  

Olivia Haas, Colin Prentice, and Sandy P. Harrison

There is growing concern over future trajectories of burning on Earth. One the one hand, some regions have seen the emergence of large and novel wildfires, whilst satellite observations continue to show declining burnt area globally, most notably in the tropics. Quantifying the response of global wildfire regimes to future changes in especially challenging given that wildfires are driven by climate, vegetation, and human activities, and that these different factors may have contrasting and opposing effects.

Using global empirical models of burnt area, fire size and fire intensity we explore the trajectory of future fire regimes under high and low climate change mitigation efforts. The models are driven by lightning ignitions, climate, vegetation properties, topography, and human factors. Making use of a set of sensitivity analysis, we show a global shift in wildfire patterns by the end of the 21st century even with warming kept below 1.5°. Burning will generally be reduced in tropical regions but larger and more intense wildfires will occur in extra-tropical regions. Under low mitigation, increases in burnt area worldwide overwhelm the human-driven decline, with up to a 60% increase in burnt area by the end of the century. However, fire size and intensity will be increasingly limited by dryness and vegetation fragmentation.

These results suggest that even under high climate change mitigation, fire management strategies must urgently be revised as current fire-suppression policies will no longer be effective in much of the world. Regional-level fire management, led by local stakeholders, should be encouraged. Wildfire risk and management must also be incorporated into mitigation scenarios that rely on extending forest area if these mitigation scenarios want to remain realistic.

How to cite: Haas, O., Prentice, C., and Harrison, S. P.: Future global wildfire regimes under high and low climate mitigation efforts , EGU General Assembly 2024, Vienna, Austria, 14–19 Apr 2024, EGU24-20564, https://doi.org/10.5194/egusphere-egu24-20564, 2024.

EGU24-939 | ECS | Orals | AS3.29

High spatial resolution aerosol and surface reflectance retrieval and validation using Sentinel-2 

Supriya Mantri, John Remedios, Feng Yin, Joshua Vande Hey, and Elisa Carboni

Aerosols may vary spatially quite rapidly in an urban environment, but present aerosol products fail to detect them due to limitations in coarse spatial resolution. Aerosol dispersal can be mapped at local scales using Sentinel-2 with relatively high spatial (10, 20, and 60 m) and temporal (5 days) resolutions. A new high-resolution (60 m) coupled aerosol-surface reflectance retrieval algorithm Modified Sensor Invariant Atmospheric Correction (MSAIC) has been developed to address the urban air pollution problem from Sentinel-2. Sentinel-2 retrieved AOD products validated against Aerosol Robotic Network (AERONET) (R2= 0.830, and RMSE= 0.156) and MODIS (R2= 0.655, and RMSE= 0.240) AOD products. For light to medium aerosol loading (AOD < 0.2), it was largely successful in extracting AOD with uncertainties <0.10. Additionally, MSIAC produces precise surface reflectance estimation at 60 m resolution across the 13 band of Sentinel-2. This is important as the accuracy of satellite-retrieved AOD is determined by surface reflectance correctness. Thus, it is crucial also to create an accurate estimation of surface reflectance. In the absence of in-situ observations and a Radiometric Calibration Network (RadCalNet) over India, two indirect approaches were used to verify Sentinel-2 retrieved surface reflectance products: (a) Sensitivity analysis , and (b) the use of invariant targets. Little or no change in surface reflectance was observed for different aerosol concentrations, and insignificant change in surface reflectance was observed for invariant targets. Additionally, Sentinel-2 retrieved surface reflectance was validated using observations obtained from the radiometric calibration network RadCalNet over La Crau (France) with uniform landscape and low AOD. Results for this validation will be presented to demonstrate the quality of this Sentinel-2 analysis compared to previous results. For further improvement of the algorithm, more investigation is required over the in-situ sites with varying (high) AOD concentration, less uniform and low reflectance landscapes, and not just desert sites like Gobabeb and Psedo-Invariant Calibration Sites (PICS). We argue that co-located global networks of continuous ground monitoring stations are required simultaneously characterising surface reflectance and aerosol over a range of surface and atmospheric conditions. Such a network would allow thorough quality evaluation of satellite retrieved products conducted over land.


How to cite: Mantri, S., Remedios, J., Yin, F., Vande Hey, J., and Carboni, E.: High spatial resolution aerosol and surface reflectance retrieval and validation using Sentinel-2, EGU General Assembly 2024, Vienna, Austria, 14–19 Apr 2024, EGU24-939, https://doi.org/10.5194/egusphere-egu24-939, 2024.

EGU24-1258 | ECS | Orals | AS3.29

Retrieval of Cloud Properties from Thermal Infrared Radiometry Using Convolutional Neural Network 

Quan Wang, Chen Zhou, Letu Husi, Yannian Zhu, Xiaoyong Zhuge, Chao Liu, Fuzhong Weng, and Minghuai Wang

Utilizing solar-independent thermal infrared (TIR) radiances, a convolutional neural network (CNN)-based framework (TIR-CNN) is developed to consistently retrieve cloud properties from passive satellite observations during both daytime and nighttime conditions. This framework enables the retrieval of diverse cloud properties, including cloud mask, cloud optical thickness (COT), cloud effective radius (CER), cloud top height (CTH), cloud base height (CBH), column cloud phase, and the identification of single/multi-layer clouds. The TIR-CNN framework primarily consists of two branches. In the first branch, the inputs include TIR radiances, viewing geometry, and altitude, producing outputs such as cloud mask, COT, CER and CTH. The network is trained using daytime Moderate Resolution Imaging Spectroradiometer (MODIS) products over a full year, and the results are validated and evaluated using passive and active products in an independent year. The evaluation results demonstrate that the retrieved cloud properties are well consistent with available MODIS daytime (cloud mask, COT, CER, and CTH) and nighttime (cloud mask and CTH) products. The retrieved COT and CTH also show robust agreements with active sensors during both daytime and nighttime, indicating that the algorithm performs stably across the diurnal cycle. The second branch of the TIR-CNN framework receives inputs including TIR radiances, altitude, landcover, lifting condensation level, and the retrieved cloud products from the first branch. It generates outputs such as CBH, cloud phase, and single/multi-layer cloud identifications. The comprehensive training, validation, and testing procedures are conducted using radar-lidar products from CloudSat/CALIPSO. The estimation of global CBH results in root-mean-square errors of 1.19 km and 1.91 km for single- and multi-layer clouds, respectively. The cloud classifier achieves total accuracies of 82% for single-layer clouds and 85% for multi-layer clouds. In addition, the model has remarkable accuracy in identifying cloud phase within each pixel's vertical column, particularly in distinguishing mixed-phase clouds with an ice cloud top.

How to cite: Wang, Q., Zhou, C., Husi, L., Zhu, Y., Zhuge, X., Liu, C., Weng, F., and Wang, M.: Retrieval of Cloud Properties from Thermal Infrared Radiometry Using Convolutional Neural Network, EGU General Assembly 2024, Vienna, Austria, 14–19 Apr 2024, EGU24-1258, https://doi.org/10.5194/egusphere-egu24-1258, 2024.

EGU24-1486 | ECS | Orals | AS3.29

Information content analysis for aerosol type from a combination of three satellite instruments 

Ulrike Stöffelmair, Thomas Popp, Marco Vountas, and Hartmut Bösch

Aerosols affect climate in several ways. Their effect depends not only on the aerosol abundance and geospatial distribution but also on the aerosol types present. Therefore, there is an important need for the retrieval of aerosol types from satellite measurements.

By combining data from different satellite instruments, information on the composition of aerosols in the atmosphere shall be determined with an optimal estimation retrieval algorithm. We make use of data from three different instruments measuring with different observation characteristics, different spectral ranges (UV, VIS, thermal IR), different viewing geometries (nadir, oblique). The included instruments are dual-view instrument SLSTR (Sea and Land Surface Temperature Radiometer) onboard Sentinel 3A and 3B; and the Infrared Atmospheric Sounding Interferometer (IASI) and the Global Ozone Monitoring Experiment-2 (GOME-2), both onboard Metop A/B/C.

In preparation for the information content analysis and future aerosol retrieval, the data from the different instruments are homogenized to a common grid of 40x80 km2, the coarsest instrument resolution (GOME-2), within a temporal matching window of 60 minutes.  A cloud masking algorithm (APOLLO_NG) is then applied to the highest resolution radiometer data (1x1 km2) from SLSTR and in addition to the Advanced Very High Resolution Radiometer (AVHRR) onboard Metop A/B/C to take into account the temporal variation of the clouds.

For the information content analysis, a set of those observations is simulated with the SCIATRAN radiative transfer model for different observing conditions / geometries, surface types, aerosol types and aerosol amounts. With these data an analysis of the combined information content is then conducted which focuses on capabilities for the determination of aerosol abundance (total Aerosol Optical Depth - AOD) and aerosol types (as contributions to total AOD of fine / coarse mode, mineral dust, absorbing aerosols) in a cloud-free atmosphere over different ground surface types. The information content analysis will help to identify those instrument channels / spectral windows that carry most of the information which is then used to develop a retrieval algorithm for AOD and aerosol types.

How to cite: Stöffelmair, U., Popp, T., Vountas, M., and Bösch, H.: Information content analysis for aerosol type from a combination of three satellite instruments, EGU General Assembly 2024, Vienna, Austria, 14–19 Apr 2024, EGU24-1486, https://doi.org/10.5194/egusphere-egu24-1486, 2024.

EGU24-1880 | ECS | Orals | AS3.29

Cloud property retrieval based on DISAMAR: implications of differences between Oxygen-A and Oxygen-B band data from TROPOMI on Sentinel 5P 

Xiaoyun Zhang, Ping Wang, Piet Stammes, Tao Xie, Feng Lu, and Maarten Sneep

DISAMAR (determining instrument specifications and analysing methods for atmospheric retrieval) is a computer model developed to simulate the retrieval of properties of atmospheric trace gases, aerosols, clouds, and the ground surface from passive remote sensing observations in a wavelength range from 270 to 2400 nm. It is being used for the TROPOMI/Sentinel-5P and Sentinel-4/5 missions to derive Level-1b product specifications. It is also used  in some research to obtain aerosol and trace gas properties, but its application to cloud properties retrieval is limited. This study presents the retrieval of cloud pressure and cloud optical thickness as well as surface pressure for cloud free based on TROPOMI Oxygen-A (Band 6) and Oxygen-B (Band 5) band measurements, and compares the results with FRESCO and NPP-Suomi Level 2 cloud property data. Different cross section datasets including JPL2008, HITRAN 2008 and HITRAN2020 are also tested in this study. In conclusion, for surface pressure retrieval, using O2-A band gives more reliable results than O2-B band and is easier to converge in the calculation, especially over land surface. But while over sea surface, using O2-B band in retrieval performs better than O2-A band. Secondly, the retrieval based on the cross section file JPL2008 shows better results when using O2-A band, but HITRAN2020 gives better results when using O2-B band. Thirdly, setting appropriate a-priory value in DISAMAR and removing some of the wavelengths with high residual simulated reflectivity can significantly improve the results , both in terms of convergence and reduction of validation error. The cloud pressure correlation coefficient between the retrieval and NPP or FRESCO data is 0.85 and 0.99 respectively, while the cloud optical thickness has a correlation coefficient of 0.77 between retrieval and NPP COT datasets.

How to cite: Zhang, X., Wang, P., Stammes, P., Xie, T., Lu, F., and Sneep, M.: Cloud property retrieval based on DISAMAR: implications of differences between Oxygen-A and Oxygen-B band data from TROPOMI on Sentinel 5P, EGU General Assembly 2024, Vienna, Austria, 14–19 Apr 2024, EGU24-1880, https://doi.org/10.5194/egusphere-egu24-1880, 2024.

EGU24-2364 | Orals | AS3.29

Latest developments of the Aerosol Layer Height retrieval from S5P/TROPOMI 

Martin de Graaf, Maarten Sneep, Gijsbert Tilstra, Mark ter Linden, and Pepijn Veefkind

The height of aerosols is important for many applications, such as the Earth’s radiation budget, transport of aerosols, aviation, retrieval of aerosol optical thickness and the atmospheric correction. Active instruments, such as the lidars on Caliop and Aeolus have provided important insight in the vertical distribution of aerosols, but these missions had a small spatial coverage and have now ended. EarthCare will provide an important replacements for these instruments, but the daily, global coverage provided by passive instruments, such as TROPOMI, remains essential.

In 2019, the first operational, global Aerosol Layer Height (ALH) product was released, retrieved from near-infrared measurements by TROPOMI on Sentinel-5P.  The operational algorithm uses a machine learning technique in the forward model, to quickly and accurately simulate the around 4000 spectral absorption lines in the O2-A band around 760 nm, and the inversion problem is solved iteratively using an optimal estimation routine, in order to have a proper error estimation.

Since its release, many important improvement have been implemented. First focused on single, selected layers of absorbing aerosols, the processor now provides the ALH for all cloud-free scenes, including scattering aerosol layers. The algorithm performs well over oceans (within the 1 km accuracy requirement) but not over land surfaces. The surface albedo is an important error source, especially over bright surfaces and for thin aerosol layers. In order to improve the retrieval over land, the surface albedo can be fitted, yielding highly improved results. However, for the operational processor this required the retraining of the neural network, since the derivatives to the fit parameters are needed in the optimal estimation routine. Therefore, the derivatives to surface albedo at two wavelengths in the continuum (outside the  O2-A band) were added to the algorithm forward model. This yielded improved accuracy over land and a large increase in the number of successful retrievals. The latest version of the S5P/TROPOMI ALH (version 2.6.0, including all these improvements and the surface fit) was released in November 2023. We will present the algorithm and the latest validation results, including ALH estimates from various instruments in space and from ground-based lidar networks. 

The TROPOMI ALH algorithm is developed and maintained within the EU Copernicus program. Its developments are important for Sentinel-3 OLCI, for which a similar O2-A band retrieval is being developed, and the upcoming geostationary mission Sentinel-4 and the successor missions for S5-precursor (Sentinel-5), which will also have a similar ALH product. 

How to cite: de Graaf, M., Sneep, M., Tilstra, G., ter Linden, M., and Veefkind, P.: Latest developments of the Aerosol Layer Height retrieval from S5P/TROPOMI, EGU General Assembly 2024, Vienna, Austria, 14–19 Apr 2024, EGU24-2364, https://doi.org/10.5194/egusphere-egu24-2364, 2024.

EGU24-2902 | ECS | Posters on site | AS3.29

Consistency of multiple Aerosol Optical Depth retrievals from satellite data 

Diana Dermann, Ulrike Stöffelmair, and Thomas Popp

This study addresses the critical issue of accurately measuring Aerosol Optical Depth (AOD) from satellite data, given the significant impact of aerosols on climate. Aerosols and clouds contribute the largest uncertainty to Earth's radiative forcing estimates, as stated by the IPCC. The study utilizes data from the Copernicus Climate Change Service and focuses on AOD retrieval using Dual-View Instruments (ATSR2, AATSR, SLSTR) and the Infrared Atmospheric Sounding Interferometer (IASI), specifically for Dust AOD.

Due to the under-determined nature of the AOD retrieval process, assumptions about aerosol properties and Earth's surface are necessary. Furthermore, cloud masking needs to be done prior to the retrieval since even spurious cloud contamination can lead to significant AOD errors. Consistency among different algorithms and instruments is crucial for reliable conclusions. Analyzing data from Dual-View Instruments and IASI, the research examines the varying levels of consistency among different algorithms.  

For these metrics, 5x5° global maps are provided for each metric. Defining a minimal threshold for each of the 4 metrics, an overall count of fulfilled consistency criteria (ranging from 0 to 4) is calculated as ultimate quantity.  Low consistency (total number of fulfilled criteria below 3) is then an indicator for a higher level of difficulty in retrieving AOD, while areas with high consistency (3 or 4) are considered more reliable. Such a consistency map helps aerosol retrieval experts to focus critical examination of their algorithms while research using the satellite aerosol data records can base their analysis on well-founded quality statements. It is important to point out that there is no perfect algorithm to this day since each of them has their strengths and weaknesses under specific conditions.

How to cite: Dermann, D., Stöffelmair, U., and Popp, T.: Consistency of multiple Aerosol Optical Depth retrievals from satellite data, EGU General Assembly 2024, Vienna, Austria, 14–19 Apr 2024, EGU24-2902, https://doi.org/10.5194/egusphere-egu24-2902, 2024.

Hyperspectral IR sounders such as AIRS on Aqua, CrIS on S-NPP, NOAA20 and JPSS-2, IASI on Metop A, B, and C provide high-quality atmospheric temperature, water, vapor, and greenhouse gas vertical profiles.  Additionally, they provide atmospheric cloud properties, surface emissivity, and surface skin temperatures.  We have developed two algorithms which can consistently derive these products from multiple IR sounders.  The first one is a Single Field-of-view Sounder Atmospheric Product (SIFSAP) algorithm and the second one is a Climate Fingerprinting Sounder Product (ClimFiSP) algorithm.  The SiFSAP algorithm performs one retrieval for each FOV using an all-sky optimal estimation approach. The core of the SiFSAP algorithm is an accurate and fast Principal Component-based Radiative Transfer Model (PCRTM), which can calculate hyperspectral radiance spectra under both clear and cloudy conditions. The PCRTM was developed in the past decade using consistent reference line-by-line radiative transfer model and spectroscopy for hyperspectral sounders such as AIRS, CrIS, IASI, NAST-I, and S-HIS.  The ClimFiSP algorithm, which performs retrievals from spatiotemporally averaged L1 hyperspectral radiances directly, will be orders of magnitude faster than traditional method. he ClimFiSP algorithm uses consistent radiative kernels and a robust spectral fingerprinting method. It provides accurate data climate data fusion products from multiple satellite sensors. Both SiFSAP and ClimFiSP will be available at NASA GES DISC data center for public access.


How to cite: Liu, X.: Remote Sensing of Atmospheric Temperature, Water Vapor, Trace Gases, Cloud, and Surface Properties on Daily and Decadal Time Scales, EGU General Assembly 2024, Vienna, Austria, 14–19 Apr 2024, EGU24-2925, https://doi.org/10.5194/egusphere-egu24-2925, 2024.

EGU24-3068 | ECS | Orals | AS3.29

Remote sensing aerosol observations from AREAD ship campaign in the Mediterranean and Middle East 

Alkistis Papetta, Franco Marenco, Michael Pikridas, Luc Blarel, Gael Dubois, Philippe Goloub, Benjamin Torres, Ruqaya Mohamed, and Jean Sciare

Atmospheric Research Expedition to Abu Dhabi (AREAD) is a ship campaign that sailed from Vigo, Spain to Abu Dhabi, UAE between 26/11/2022 and 19/12/2022, aimed at the characterization of the atmospheric composition and at identifying pollutants transport over the Mediterranean, Red Sea and Arabian Sea. In this study, we present preliminary results from the remote sensing observations acquired during the cruise. The area of interest, surrounded by deserts and anthropogenic sources, has been recognized as a climate change hotspot due to extreme temperature increases and an important contribution to greenhouse gas emissions. Limited studies focus on the area because of limited and few observational data are available.

AREAD’s main objective was to contribute to the knowledge of trace gases and aerosol concentrations in the region and to complement with wintertime observations the AQABA campaign (24/06/2017-03/09/2017) performed in the same region during the summer season. The research vessel’s voyage included observations in the Suez Canal, one of the most heavily used navigational hubs in global trade routes. The on-board instrumentation included in-situ observations for trace gases (NO, NO2, O3, SO2, CO2, CH4) and aerosol optical, physical and chemical properties (PM1, PM10, particle sizes, aerosol spectral absorption and scattering). In addition, remote sensing of aerosol, clouds and boundary layer height (BL) was obtained with a VAISALA CL51 ceilometer and an automatic ship-photometer (CIMEL CE318T, modified for marine applications) included in AERONET.

The preliminary results suggest a change of regime between the Mediterranean and the Suez Canal. AOD levels remained below 0.1 for the first part of the cruise and increased to more than 0.2 after the entrance of the ship into the Suez Canal. Even though there was no significant variation in BL height which remained below 1km for most of the cruise, increased particle backscatter is observed within the BL and in elevated layers after the Suez Canal. Desert dust, trade ship emissions and pollution from Middle East fossil energy production plants could be some of the species contributing to the higher aerosol loading observed in the latter leg of the cruise.


Acknowledgment: The datasets presented in this research were acquired during the Atmospheric Research Expedition to Abu Dhabi (AREAD) on-board research vessel Jaywun, operated by the Environment Agency of Abu Dhabi (EAD), which is gratefully acknowledged. The ship-photometer is developed in the frame of AGORA-Lab joint laboratory (Laboratoire d’Optique Atmospherique from CNRS/University of Lille and CIMEL Electronique company).

How to cite: Papetta, A., Marenco, F., Pikridas, M., Blarel, L., Dubois, G., Goloub, P., Torres, B., Mohamed, R., and Sciare, J.: Remote sensing aerosol observations from AREAD ship campaign in the Mediterranean and Middle East, EGU General Assembly 2024, Vienna, Austria, 14–19 Apr 2024, EGU24-3068, https://doi.org/10.5194/egusphere-egu24-3068, 2024.

The Polarized Submillimeter Ice-Cloud Radiometer (PolSIR): Observing the diurnal cycle of ice clouds in the tropics and sub-tropics

In May 2023 NASA has selected PolSIR as the latest addition to its Earth Venture Instrument class missions. PolSIR addresses key research priorities related to uncertainties in our current understanding in high clouds and cloud feedbacks as formulated in NASA’s latest Decadal Survey and in the latest Intergovernmental Panel on Climate Change (IPCC) Assessment. In this context, PolSIR will address the following objectives:

  • Constrain the seasonally influenced diurnal cycle amplitude, form, and timing of the ice water path (IWP) and particle diameter in tropical and sub-tropical ice clouds
  • Determine the diurnal variability of ice clouds in the convective outflow areas and understand relation to deep convection
  • Determine the relationship between shortwave and longwave radiative fluxes and the diurnal variability of ice clouds
  • Enable improvement of climate models by providing novel observations of the diurnal cycle of ice clouds, ultimately leading to improved climate modeling skills and increased fidelity of climate forecasts in support of critical decision-making.

The PolSIR mission consists of two 12U CubeSats, each equipped with a cross-track scanning polarized submillimeter radiometer in the spectral range of 325–680 GHz. The two PolSIR satellites fly in separate, 52-degree inclination, non-sun-synchronous orbits, taking science measurements between ±35 degrees latitude enabling monthly sampling of the diurnal cycle of ice clouds and their microphysical properties in the tropics and sub-tropics. PolSIR’s observation concept provides significant benefits over the Program of Record (PoR) as well as synergies with future missions which will either be in sun-synchronous orbits, thus not sampling the diurnal cycle, or lack the observation frequencies needed to fully observe ice water path (IWP).

How to cite: Bennartz, R. and Wu, D. and the PolSIR Science Team: The Polarized Submillimeter Ice-Cloud Radiometer (PolSIR): Observing the diurnal cycle of ice clouds in the tropics and sub-tropics, EGU General Assembly 2024, Vienna, Austria, 14–19 Apr 2024, EGU24-5886, https://doi.org/10.5194/egusphere-egu24-5886, 2024.

Clouds significantly affect Earth's energy budget by absorbing, reflecting and transmitting short- and long-wave radiation. They can either intensify, or weaken the greenhouse effect. The overall impact of cloudiness on radiating transfer depends on macro- and micro-physical properties of clouds (e.g., optical thickness, altitude, water content, cloud drop effective radius) and still remains one of the greatest uncertainties in global climate predictions.

Recent studies based on traditional, synoptic (surface) data have shown several statistically significant trends in cloud types (genera) frequency over Poland. Those changes included an increase in high and convective clouds, along with a decrease in Stratus, Altostratus and Nimbostratus. As the ability to observe mid and high-level clouds from the ground is limited due to clouds overlapping, in this research we aim to explore whether these trends can be confirmed by satellite records.

We use Moderate Resolution Imaging Spectroradiometer (MODIS) data, restricted to the area of Poland, as well as surface (SYNOP) observations of cloud genera from the country's 27 ground-based stations for the period 2003–2021. In order to define cloud types from MODIS records, we analyze cloud optical thickness (COT) and cloud top pressure (CTP) parameters and use International Satellite Cloud Climatology Project (ISCCP) COT–CTP classification.

We found that while for some cloud types (Cirrus, Altostratus + Nimbostratus and Cumulus) MODIS and SYNOP show the similar trends over the last two decades, for other cloud types (Cumulonimbus, Altocumulus, Stratocumulus) the two sources of data are not consistent. Hence, we conclude that they should be treated as independent rather than complementary. Additionally, we demonstrated that the increase in high-level clouds over Poland, which has been observed by other authors who based their research on synoptic data, is not due to a decrease in the frequency of low- and mid-level clouds, but can be confirmed by satellite records.

This research was funded by the University of Warsaw.

How to cite: Wojciechowska, I.: Cloud types frequency over Poland in satellite-based (MODIS) and surface-based (SYNOP) observations, EGU General Assembly 2024, Vienna, Austria, 14–19 Apr 2024, EGU24-9277, https://doi.org/10.5194/egusphere-egu24-9277, 2024.

EGU24-9506 | ECS | Orals | AS3.29

Cloud Droplet Number Concentration: Satellite Retrievals Improved by Advanced Atmospheric Modelling 

Alexandre Siméon, Jessenia Gonzalez, and Odran Sourdeval

The cloud droplet number concentration (CDNC) is one of the most important microphysical properties of liquid clouds for understanding and quantifying the effective radiative forcing by aerosol-cloud interactions (ERFaci). Indeed, CDNC is linked to the relevant processes of the cloud formation and evolution. CDNC is closely related to the chemical composition of the condensation nucleation nuclei and the cloud droplet size distribution. Nevertheless, this key parameter remains poorly known. CDNC is not yet operationally provided from current standard satellite retrievals. Our approach relies on an innovative determination of CDNC from satellite observations in combination with atmospheric cloud-resolving modelling. We introduce our new, community-based tool: the Satellite Simulator and Sandbox for Cloud Observation and Modelling (S3COM). Briefly, S3COM aims to simulate realistic satellite observations and cloud products from model outputs, to quantify the sensitivity of radiative quantities to cloud parameters, and to assist the development of retrieval algorithms using output fields from high-resolution models. We use realistic cloud situations (stratocumulus, cumulus, marine and continental clouds) obtained from the ICOsahedral Nonhydrostatic Large Eddy Model (ICON-LEM) to simulate top of atmosphere radiances with the Radiative Transfer for TOVS (RTTOV), from visible to infrared, observed by the Moderate Resolution Imaging Spectroradiometer (MODIS). Performance of MODIS-type algorithms coupled with ICON-LEM simulations is described and characterization of error sources is given. Results on CDNC retrievals for warm liquid water stratocumulus clouds are presented and discussed for the study case of the 02 May 2013.

How to cite: Siméon, A., Gonzalez, J., and Sourdeval, O.: Cloud Droplet Number Concentration: Satellite Retrievals Improved by Advanced Atmospheric Modelling, EGU General Assembly 2024, Vienna, Austria, 14–19 Apr 2024, EGU24-9506, https://doi.org/10.5194/egusphere-egu24-9506, 2024.

The new-generation of satellites will revolutionize Earth observation with advanced sensors, including polarimetric observation capabilities like EUMETSAT's Metop-SG. Equipped with instruments like the Multi-Viewing Multi-Channel Multi-Polarisation Imaging (3MI), these satellites will offer unprecedented insights into the aerosol and cloud components of Earth's atmosphere. However, the indirect nature of satellite observations requires validation through in-situ measurements. In response, we are developing an in-situ cloud and aerosol imaging polarimeter, designed for operation in cloud chambers, at mountain-top stations as well as aboard research aircraft. This innovative approach aims to bridge the gap between satellite data and in-situ measurements, enhancing validation studies and ensuring the accuracy of next-generation satellite observations in climate change research.

Our polarimeter features an innovative design, highlighting a high-resolution camera chip combined with a wide-angle lens for capturing laser light scattered by cloud and aerosol particles at a high angular resolution of better than 0.05° and for a wide backscattering angular range from about 101° to 169°. A directed laser beam is imaged over several meters at a specific observation angle in an open path arrangement. Light scattered from particles transforms into a line on the camera chip, with each pixel corresponding uniquely to a different scattering angle. The optical design incorporates an adjustable polarization filter set-up within the imaging system, enabling seamless measurement of the full Stokes polarization vector of the angular light scattering function. This advanced imaging polarimeter concept offers high accuracy in measuring cloud drop size distribution, as well as linear and circular polarization and depolarization ratios. Notably, our in-situ polarimeter is "active," utilizing a polarized laser beam, distinguishing it from the "passive" approach of satellite polarimeters relying on sunlight.

The presentation will delve into the detailed concept of this innovative polarimeter, offering insights into its optomechanical design. Results from comprehensive optical simulations will showcase the expected measurement capabilities, concluding with findings from initial laboratory tests of the prototype instrument.

How to cite: Schnaiter, M., Hamel, A., Wagner, S., and Järvinen, E.: A novel in-situ cloud and aerosol imaging polarimeter for atmospheric research - Bridging the gap between satellite data and in-situ measurements, EGU General Assembly 2024, Vienna, Austria, 14–19 Apr 2024, EGU24-10144, https://doi.org/10.5194/egusphere-egu24-10144, 2024.

EGU24-10693 | ECS | Posters virtual | AS3.29

Black carbon aerosol trend in urban regions of China during 2005-2022 using MERRA-2 and CAMS reanalysis 

Robabeh Yousefi, Abdallah Shaheen, Fang Wang, Quansheng Ge, and Renguang Wu

High atmospheric black carbon (BC) levels due to human activities pose a severe air pollution issue in China, especially in urban agglomerations. In this talk, we analyzed the trends of black carbon-aerosol optical depth (BCAOD) from Modern-Era Retrospective Analysis for Research and Applications, version 2 (MERRA-2) and Copernicus Atmosphere Monitoring Service (CAMS) from 2005 to 2022.  Four densely populated and highly polluted urban regions (Beijing-Tianjin-Hebei [BTH], Sichuan Basin [SCB], Yangtze River Delta [YRD], and Pearl River Delta [PRD]) were selected for the analysis. BCAOD from MERRA-2 data showed significant negative trends over the four urban regions during the years 2005-2022, with rates of -0.0007, -0.0008, -0.0007, and -0.0006 yr-1 in BTH, YRD, SCB, and PRD, respectively. Similar significant BCAOD trends from CAMS were also observed in the urban selected regions with rates of -0.0005, -0.0006, -0.0009, -0.0006 yr-1 in BTH, YRD, SCB, and PRD, respectively. The decreasing trend in BCAOD could be mainly attributed to the air pollution policies implemented by the Chinese government.

How to cite: Yousefi, R., Shaheen, A., Wang, F., Ge, Q., and Wu, R.: Black carbon aerosol trend in urban regions of China during 2005-2022 using MERRA-2 and CAMS reanalysis, EGU General Assembly 2024, Vienna, Austria, 14–19 Apr 2024, EGU24-10693, https://doi.org/10.5194/egusphere-egu24-10693, 2024.

EGU24-11077 | Posters on site | AS3.29

Synthetic Data and AI - Teaching a Neural Network to Identify Clouds Despite the Lack of Annotated Observation Data 

Ronald Scheirer, Aleksis Pirinen, Nosheen Abid, Nuria Agues Paszkowsky, Thomas Ohlson Timoudas, Chiara Ceccobello, György Kovács, and Anders Persson

Clouds are characterized - among other things - by their intense variability in time, space and optical thickness. These variables impact the modulation of solar radiation (reflection, transmission and absorption) and may distort the signal from the surface beneath. This in turn makes it important to detect even optically thin clouds using remote sensing methods, even if the focus is on earth observation.

This study has been initiated by the Swedish Forest Agency (SFA). In order to reduce the proliferation of bark beetles, SFA needs to identify stressed trees at an early stage. To this end, high-resolution scenes from the Multi-Spectral Imager (MSI) on board the Sentinel-2 platforms were analyzed. Unfortunately, the quality of ESA's scene classification layer (SCL) does not meet the requirements for reliably sorting out scenes contaminated with thin clouds.

To overcome this problem, it was decided to make use of the fact that the integration of machine learning (ML) methods within the remote sensing domain has significantly improved performance on remote sensing tasks. But a common difficulty is that ML methods typically depend on large amounts of annotated data for training. Annotation or classification is usually done manually or by a superior instrument (i.e. active LIDAR). Since such a data basis is missing, a synthetic database (based on simulations instead of observations) was generated to train a Multi Layer Perceptron (MLP). The dataset consists of 200,000 data points, which have been simulated taking into consideration different cloud types, cloud optical thicknesses (COT), cloud geometrical thickness, cloud heights, as well as ground surface and atmospheric profiles. The MLP is trained to predict COT as a proxy for the cloud/clear decision.

The performance of the proposed algorithm using both synthetic data (as used during training) and real satellite observations (never presented to the algorithm before) will be discussed in detail. It was found that the MLP approach trained on 1D synthetic data can seamlessly transition to real datasets without requiring additional training. Furthermore it outperforms the ESA-SCL.

How to cite: Scheirer, R., Pirinen, A., Abid, N., Agues Paszkowsky, N., Ohlson Timoudas, T., Ceccobello, C., Kovács, G., and Persson, A.: Synthetic Data and AI - Teaching a Neural Network to Identify Clouds Despite the Lack of Annotated Observation Data, EGU General Assembly 2024, Vienna, Austria, 14–19 Apr 2024, EGU24-11077, https://doi.org/10.5194/egusphere-egu24-11077, 2024.

Aerosol-Cloud-Interactions (ACIs) still represent a major source of uncertainty on climate predictions.
Satellites have greatly contributed to better understanding these effects due to their global and
continuous observations of the atmosphere. Consequently, numeroussatellite-based estimates of the
ACI radiative forcing (or Twomey effect) as well as rapid adjustments have been obtained over the last
decades, not always in agreement with each other. Natural experiments, which correspond to specific
or controlled pollution events have been particularly helpful to assess these effects from satellite.
However, satellite retrievals are not always adapted to quantify aerosol-cloud interactions. Haywood
(2003) hasinvestigated instrumental biases due to aerosol being above cloud layers(AAC), in particular
the impact of desert dust and biomass burning aerosol (BBA), both absorbing aerosols, on cloud
effective radius(CER or 𝑟𝑒𝑓𝑓) and cloud optical thickness(COT or 𝜏). He found that when a thick aerosol
layer is situated above clouds (AAC) a passive remote sensor like MODIS will underestimate 𝜏 and,
depending on the channel’s wavelength, overestimate, or underestimate 𝑟𝑒𝑓𝑓. Such effects can be
mistakenly attributed to ACI and must efficiently be reduced or corrected.
This study focuses on the Australian wildfires from 2019/2020 to observe and try to understand how
physical effects and instrumental effects are entangled when studying ACI. Aerosol and cloud
properties are obtained from several sets of data from several instruments: MODIS, TROPOMI, AMSR2, as well as ERA5 reanalysis. We only keep non-precipitant liquid clouds and we separated AAC cases
from non-AAC ones. We chose several areas in south hemisphere (Pacific, Atlantic and Indian Oceans)
for studying the evolution of ACIs with aerosols plume transport and decoupling each effect.
We obtained encouraging results, where instrumental biases have been observed under AAC
conditions; overestimation of 𝑟𝑒𝑓𝑓 and underestimation of 𝜏 were found over Pacific during DJF
2019/2020 and over Atlantic Ocean for the same period. But, imposing a strong cloud fraction, we
observed that biases were disappearing, which lets us think that MODIS might also misjudge aerosols
as clouds. However,satellite observations are limited, and we need for Radiative Transfer calculations.
Indeed, we will combine simulations (using RTTOV) with observations to better characterise and
correct the instrumental bias and then focus on physical aerosols impacts.

How to cite: Devigne, E.: Assessing the Effects of Wildfires Aerosols on Clouds using Satellite Observations, EGU General Assembly 2024, Vienna, Austria, 14–19 Apr 2024, EGU24-11616, https://doi.org/10.5194/egusphere-egu24-11616, 2024.

EGU24-11696 | ECS | Orals | AS3.29

Distinguishing between cloud and aerosol layers in the TROPOMI/Sentinel-5P measurements 

Athina Argyrouli, Ronny Lutz, Fabian Romahn, Víctor Molina García, Luca Lelli, Diego Loyola, Omar Torres, Eleni Marinou, and Vassilis Amiridis

TROPOMI on board of Sentinel-5 Precursor (S5P) provides continuous daily distribution of several cloud properties, which are required as input for trace-gas retrievals. The operational TROPOMI cloud retrieval is a two-step algorithm. At first, the OCRA (Optical Cloud Recognition Algorithm) computes a radiometric cloud fraction using a broad-band UV/VIS color space approach and later the ROCINN (Retrieval of Cloud Information using Neural Networks) retrieves the cloud height, cloud optical thickness and cloud albedo from NIR measurements in and around the oxygen A-band (~760nm). Within the ROCINN algorithm two different models are possible; the Clouds-as-Reflecting-Boundaries (CRB), where the cloud is a simple Lambertian reflector and the Clouds-as-Layers (CAL), where the cloud is a homogeneous layer of scattering liquid-water spherical particles. There is evidence that some TROPOMI cloud retrievals are contaminated by aerosols. This is particularly true in the following cases: (a) when there is co-existence of clouds and aerosols in the same TROPOMI footprint and (b) when there is a pure aerosol layer, appearing in the TROPOMI cloud product. The latter is usually the case of OCRA deriving an elevated radiometric cloud fraction corresponding to the given aerosol conditions. Then, ROCINN is triggered and returns two additional cloud parameters. Often, the false alarms of elevated OCRA cloud fraction can be identified when ROCINN retrieves a cloud height at the surface level. However, there are cases in which ROCINN cloud outputs do not refer to the surface properties of the scene, but to aerosol layers present in the same TROPOMI footprint. Especially for dust aerosols, which are usually large particles and comparable to the cloud droplet size, we expect more frequently those mixed retrievals. In particular, dust layers with large concentrations (i.e., high aerosol optical depth (AOD)) are better candidates for erroneously retrieved clouds in the TROPOMI L2 product. The TROPOMI aerosol algorithm (TropOMAER) makes use of the L1b reflectances in the UV to derive aerosol information in cloud-free and above-cloud aerosol scenes. With the use of ground-based active and passive remote sensing instruments, we are able to characterize well the vertically resolved cloud and aerosol layers in the lower troposphere. In this work, synergistic ground-based measurements from a PollyXT multiwavelength-Raman-polarization lidar and an AERONET sun-photometer are used to discriminate dust aerosols from clouds in TROPOMI measurements. We have selected ground-based observation sites over which the atmospheric column frequently contains large contributions of desert dust particles.

How to cite: Argyrouli, A., Lutz, R., Romahn, F., Molina García, V., Lelli, L., Loyola, D., Torres, O., Marinou, E., and Amiridis, V.: Distinguishing between cloud and aerosol layers in the TROPOMI/Sentinel-5P measurements, EGU General Assembly 2024, Vienna, Austria, 14–19 Apr 2024, EGU24-11696, https://doi.org/10.5194/egusphere-egu24-11696, 2024.

EGU24-12426 | ECS | Posters on site | AS3.29

Generation of long-term ground fog time series using harmonized time series cross-calibrating two Meteosat generations 

Sheetabh Gaurav, Boris Thies, Sebastian Egli, and Jörg Bendix

Fog, a meteorological phenomenon resulting in horizontal visibility of less than 1000 meters, has significant socio-economic and environmental consequences. Current long-term research on the fog occurrence based on station data have indicated that the frequency of fog has decreased over Europe since the 1960s. However, due to a limited number of ground-based observations, primarily in low-altitude areas, there is insufficient evidence to support the hypothesis that fog is decreasing across Europe. In order to scientifically investigate different factors which might be responsible in influencing fog formation over the years over space and time, there is a need of long term consistent satellite data time series to analyze the fog distribution. In this study, first a machine learning based methodology has been developed and implemented to harmonize the two generation Meteosat datasets, i.e. Meteosat First Generation (MFG) and Meteosat Second Generation (MSG) to generate a long-term consisent dataset (1991-2020) which can be further used to classify fog over the European domain (WMO region VI). For this, a Random Forest (RF) based model is trained during the overlap period (2004-2006) of MFG and MSG datasets, to synthesize MFG data from MSG data to generate a consistent MFG time series. The results of this model indicates a good match of synthesized MFG datasets with the original MFG datasets during the overlap period with mean absolute error (MAE) of 0.7 K for the WV model and 1.6 K for the IR model and out-of-bag (OOB) R2 score of 0.98 for both models. In the next stage, this harmonized dataset is currently being investigated along with the CM-SAF MSG based cloud mask dataset to generate a homogeneous cloud mask over the domain using a machine learning based eXtreme Gradient Boosting (XGBoost) classifier model. The current version of the cloud mask is able to predict high & mid level clouds for both day and night time with high accuracy. In case of fog and low stratus (FLS) clouds, the model exhibits excellent performance during day time but encounters some difficulty in detecting in certain FLS patches during night time. This resultant cloud mask can subsequently be employed to classify fog occurrences by integrating harmonized MFG WV and IR channels with cloud base altitude (CBA) as well as visibility data obtained from Meteorological Aviation Routine Weather Reports (METAR) and synoptic weather observations (SYNOP) within a machine learning-based model. In this context, we present the current ongoing progress and the preliminary results in generating a 30 years fog climatology (1991-2020) for Europe with a temporal resolution of 30 minutes using this dataset.

How to cite: Gaurav, S., Thies, B., Egli, S., and Bendix, J.: Generation of long-term ground fog time series using harmonized time series cross-calibrating two Meteosat generations, EGU General Assembly 2024, Vienna, Austria, 14–19 Apr 2024, EGU24-12426, https://doi.org/10.5194/egusphere-egu24-12426, 2024.

EGU24-12449 | Orals | AS3.29

Aerosol vertical profile retrievals using passive radiometric measurements 

Elena Lind, Marcos Herreras-Giralda, Masahiro Momoi, Thomas Eck, Alexander Sinyuk, and Oleg Dubovik

Aerosol vertical profiles in the lowest 1 km of the atmosphere are not very well studied due to technology limitations (e.g. LIDARs) and air space restrictions (e.g. manned and unmanned aircrafts). This study investigates sensitivity of the radiance measurements to the aerosol profiles from the standard columnar almucantar and direct sun measurements combined with low elevation sky scanning (from the horizon to zenith direction). Sensitivity studies are conducted for the sun-sky radiometer filter bands deployed within AERONET. AErosol RObotic NETwork (AERONET) is a network of sun-sky-moon photometers that measure solar radiation at 9 wavelength bands (centered at 340, 380, 440, 500, 675, 870, 937, 1020, 1640 nm, 2-10 nm except 25 nm for 1640 nm FWHM filter transmission). The main AERONET products are columnar aerosol optical depth, Angstrom exponent (from direct sun measurements), single scattering albedo and size distribution (from Almucantar and hybrid scans). The additional products investigated in this study are vertical volume density and aerosol extinction coefficient profiles. GRASP (with the plane parallel radiative transfer model) is initially used to simulate scattered sky radiances and conduct aerosol profile inversions. Several aerosol models and loadings are investigating as well as aerosol volume density profiles.

How to cite: Lind, E., Herreras-Giralda, M., Momoi, M., Eck, T., Sinyuk, A., and Dubovik, O.: Aerosol vertical profile retrievals using passive radiometric measurements, EGU General Assembly 2024, Vienna, Austria, 14–19 Apr 2024, EGU24-12449, https://doi.org/10.5194/egusphere-egu24-12449, 2024.

EGU24-15702 | Orals | AS3.29

The quest for an accurate retrieval of vertically complex cloud layers from passive instruments. 

Alessio Bozzo, Loredana Spezzi, Philip Watts, and John Jackson

Accurate cloud properties retrievals from passive instruments are particularly challenging in presence of vertically highly in-homogeneous and/or multiple cloud layers because of the inherent lack of observational constraints for the vertical profile below the cloud top. The Optimal estimation algorithm for Cloud Analysis (OCA) developed at EUMETSAT is capable of retrieving cloud properties of up to two overlapping layers using radiances from imaging instruments. Example of such instruments are the Spinning Enhanced Visible and Infrared Imager (SEVIRI) aboard the Meteosat Second Generation (MSG), the Flexible Combined Imager (FCI) aboard the Meteosat Third Generation and METimage aboard the Metop-Second Generation. Since 2013 OCA retrievals have been operational as demonstrational product for MSG-SEVIRI and are now ready to be disseminated as operational products for MTG-FCI.

A number of improvements to the baseline OCA algorithm have been implemented recently including a better initialisation of cloud phase and multi-layer flag and a new forward model to enable the use of solar channels not only in single-layer but also in multi-layer cloud conditions. We also introduced a cloud model with a more complete representation of the vertical inhomogeneity in optical properties.

Using observations from the MSG-SEVIRI and MTG-FCI in the visible/near-infrared and infrared channels, we tested the updated algorithm to retrieve simultaneously a set of cloud microphysical and optical properties. To evaluate the accuracy of the retrieval we employ a number of retrieved cloud vertical profiles from Lidar/Radar measurements from both collocated A-Train orbits and in-situ data from the ACTRIS-Cloudnet network. The use of the solar channels in both single and multi-layer clouds enables a more consistent retrieval of their microphysical properties (effective radius and optical thickness). The addition of the vertical inhomogeneity has a significant impact on the retrieved cloud top pressure, bringing it closer to the estimates from the cloud Lidar.

The new version of OCA allows for a more complete and consistent retrieval of single- and two-layer cloud profiles and provides some further insights on the vertical distribution of cloud parameters. This in turn can be helpful for various applications such as the height assignment of Atmospheric Motion Vectors and specific visualisations of cloud products for forecasters.

How to cite: Bozzo, A., Spezzi, L., Watts, P., and Jackson, J.: The quest for an accurate retrieval of vertically complex cloud layers from passive instruments., EGU General Assembly 2024, Vienna, Austria, 14–19 Apr 2024, EGU24-15702, https://doi.org/10.5194/egusphere-egu24-15702, 2024.

EGU24-15941 | Orals | AS3.29

Potential and limitation of remote sensing observations to monitor super coarse particles of ambient aerosol 

Anton Lopatin, Oleg Dubovik, Alexander Sinuyk, Elena Lind, Tatyana Lapyonok, Tom Eck, Alexander Smirnov, Marcos Herreras Giralda, Masahiro Momoi, Pavel Litvinov, and Carlos Perez

The potential presence of super coarse desert dust aerosol particles  with volume radii larger than 15 microns in the atmosphere has recently become one of hot topics intensively discussed in the modeling and observation community. Such large particles may represent an essential part of aerosol mass in the atmosphere and while their contribution to atmospheric radiation is rather moderate. Therefore, the characterization of super coarse aerosols is very challenging while they are responsible for sizable overall contributions in aerosol effects environment and climate dynamics. Indeed, AERONET network, that arguably can be considered as the most comprehensive source of information about ambient columnar aerosol properties does not consider aerosol particles with radius larger  than 15 microns. In contrast, most chemical transport models do consider super course particles and a number of in situ campaigns have reported the presence of such particles. This presentation describes efforts to test and evaluate the capabilities and limitations of detecting the super coarse dust particles from AERONET like measurements. It also considers possibilities to detect such particles using other remote sensing methods including lidar active observation and measurements in IR spectral range. Several modifications of the retrieval approaches that allow for optimizing remote sensing of super coarse ambient aerosol are proposed and discussed.

How to cite: Lopatin, A., Dubovik, O., Sinuyk, A., Lind, E., Lapyonok, T., Eck, T., Smirnov, A., Herreras Giralda, M., Momoi, M., Litvinov, P., and Perez, C.: Potential and limitation of remote sensing observations to monitor super coarse particles of ambient aerosol, EGU General Assembly 2024, Vienna, Austria, 14–19 Apr 2024, EGU24-15941, https://doi.org/10.5194/egusphere-egu24-15941, 2024.

EGU24-16557 | ECS | Posters on site | AS3.29

Balloon-borne lidar observations of cirrus in the tropics 

Thomas Lesigne, François Ravetta, Aurélien Podglajen, Vincent Mariage, and Jacques Pelon

Tropical cirrus clouds have a strong impact on the Earth’s climate, modulating both the radiative budget and the amount of water vapor transported to the stratosphere. They are still challenging to observe : ground-based and airborne observations have a limited coverage, and if space-borne sensors provide invaluable continuous observations at the global scale, they lack sensitivity to optically thin clouds. To tackle this issue and better characterize the tropical cirrus coverage, a new light-weight microlidar, named BeCOOL (Balloon-borne Cirrus and convective overshOOT Lidar), has been designed to fly onboard long duration super-pressure balloons in the lower stratosphere (~20 km), right above the clouds. Three of those have been recently flown during the Strateole-2 project, between October 2021 and January 2022. Comparisons with CALIPSO’s lidar observations highlight the microlidar’s unprecedented sensitivity to very thin cirrus that are below the detection capabilities of space-borne sensors.

How to cite: Lesigne, T., Ravetta, F., Podglajen, A., Mariage, V., and Pelon, J.: Balloon-borne lidar observations of cirrus in the tropics, EGU General Assembly 2024, Vienna, Austria, 14–19 Apr 2024, EGU24-16557, https://doi.org/10.5194/egusphere-egu24-16557, 2024.

EGU24-17246 | ECS | Posters on site | AS3.29

Towards introducing aerosols inhomogeneity into GRASP remote sensing algorithm  

Philippe Lesueur, Yevgeny Derimian, Oleg Doubovik, and Tatyana Lapyonok

Though inhomogeneous particles are common for atmospheric aerosol, inhomogeneity is not taken into account in present-day remote sensing retrieval algorithms. Effects of inhomogeneity on radiation scattering can however have an impact on the quality of aerosol retrievals, as shown in Mishenko et al., 2016. The current study aims to address this gap by an attempt to introduce aerosol inhomogeneity parameterization into the aerosol remote sensing retrieval algorithm – GRASP (Dubovik et al., 2021). First, we focus on AERONET measurements as a global network with an efficient retrieval algorithm with the aim to identify situations where currently employed homogeneous aerosol model does not reproduce correctly the radiation field or gets to the limits of the field of solutions. We examine AERONET retrievals using results of operational AERONET algorithm, but also those obtained using an independent recently developed version of GRASP/Component algorithm (Li et al., 2019) applied to AERONET. A notable part of these retrievals, under atmospheric conditions suspected to cause particles inhomogeneity, present questionable values for retrieved refractive index, i.e. values of its real part reach the algorithmic limit. This situation unveils potential mismatch of employed aerosol microphysical model. At the second step we model the aerosol inhomogeneity by Mie calculations for layered spheres (core/shell) particle structure with an ammonium nitrate/sulfate liquid shell and various composition of core, relying on some field results reported in (Unga et al. 2018). We then examine the response of the obtained optical characteristics to variation in core/shell model. Namely, the phase function and degree of linear polarization are compared for several core radii, refractive indexes and particles size distributions. We present comparative analysis for the effects of structure changes over size changes and study their differences relative to homogeneous particle model. This analysis reveals potential sensitivity of remote sensing to particles inhomogeneity and serves for parameterization of core/shell model in the remote sensing algorithm GRASP. The updated GRASP/Component algorithm will then be applied to previously identified cases of questionable AERONET retrievals.


References

Dubovik O., Fuertes D., Litvinov P., et al.: A Comprehensive Description of Multi-Term LSM for Applying Multiple a Priori Constraints in Problems of Atmospheric Remote Sensing: GRASP Algorithm, Concept, and Applications. Front. Remote Sens. 2:706851, 2021. doi:10.3389/frsen.2021.706851

Unga F., Choël M., Derimian Y., et al. : Microscopic Observationsof Core-Shell Particle Structure and Implications for Atmospheric Aerosol Remote Sensing. Journal of Geophysical research 123:24, 2018. doi:10.1029/2018JD028602

Michael I. Mishchenko, Janna M. Dlugach, and Li Liu, "Linear depolarization of lidar returns by aged smoke particles," Appl. Opt. 55, 9968-9973, https://doi.org/10.1364/AO.55.009968, (2016).

Li, L., Dubovik, O., Derimian, Y., et al.: Retrieval of aerosol components directly from satellite and ground-based measurements, Atmos. Chem. Phys., 19, 13409–13443, https://doi.org/10.5194/acp-19-13409-2019, 2019.

How to cite: Lesueur, P., Derimian, Y., Doubovik, O., and Lapyonok, T.: Towards introducing aerosols inhomogeneity into GRASP remote sensing algorithm , EGU General Assembly 2024, Vienna, Austria, 14–19 Apr 2024, EGU24-17246, https://doi.org/10.5194/egusphere-egu24-17246, 2024.

EGU24-18224 | ECS | Orals | AS3.29

A Machine Learning Algorithm for Cloud Detection Based on the CO2M Multi-Angular Polarimetric Satellite Measurements 

Babak Jahani, Zihao Yuan, Bastiaan van Diedenhoven, Otto Hasekamp, Guangliang Fu, and Sha Lu

The Earth’s atmosphere contains suspended particles and molecules with a wide range of characteristics. Their interaction with radiation (in both solar and thermal spectral regions) affects the transfer of energy as well as its spatial distribution in the atmosphere, affecting the weather at any moment and climate in the long term. Multi-Angular Polarimetric (MAP) observations have a great potential for quantifying the properties (e.g., size, concentration, etc.) of aerosol particles at a high accuracy. For this reason, a MAP is included on the Copernicus Carbon Dioxide Monitoring satellite mission (CO2M; intended launch date: 2026) to provide a correction of the light path to meet the mission’s stringent requirements for CO2 column retrievals. However, for both trace gas and aerosol retrievals it is also essential to filter out any cloud-contaminated measurements, because clouds strongly interact with radiation and cover between 60-70% of the Earth’s surface at any given time. This study presents an algorithm designed for detecting clouds based on the MAP instrument on CO2M. The algorithm is an adaptation of an approach that was newly developed at SRON Netherlands Institute for Space Research for the MAP instrument onboard the Polarisation and Anisotropy of Reflectances for Atmospheric Science coupled with Observations from a Lidar (PARASOL) platform (i.e., POLarization and Directionality of Earth Reflectances; POLDER) and we are working towards making it applicable to other MAP instruments. This algorithm consists of an Artificial Neural Network model that is trained based on synthetic measurements with realistic geometry, aerosol, and cloud inputs. The synthetic measurements correspond to a wide range of atmospheric conditions and were produced for using the Remote Sensing of Trace Gases and Aerosol Products (RemoTAP) forward radiative transfer model developed at SRON Netherlands Institute for Space Research. This algorithm is designed to predict the cloud fraction based on the observed multi-angular polarization and radiance data, plus the instrument specifications and the corresponding viewing- and solar- geometry parameters. Here we focus on the efficacy of the approach for the CO2M mission. Furthermore, the sensitivity of the algorithm’s performance as a function of instrument characteristics (e.g, viewing angles, wavelengths, accuracy) will be discussed.

How to cite: Jahani, B., Yuan, Z., van Diedenhoven, B., Hasekamp, O., Fu, G., and Lu, S.: A Machine Learning Algorithm for Cloud Detection Based on the CO2M Multi-Angular Polarimetric Satellite Measurements, EGU General Assembly 2024, Vienna, Austria, 14–19 Apr 2024, EGU24-18224, https://doi.org/10.5194/egusphere-egu24-18224, 2024.

EGU24-18779 | ECS | Posters on site | AS3.29

Object-based characterization of continental Shallow Cumulus Cloud properties using high-resolution Sentinel-2 observations 

Oscar Ritter, Hartwig Deneke, and Sebastian Bley

Shallow convective cumulus clouds (ShCu) play a major role in determining the global radiation balance and the water cycle. However, such clouds are characterized by small-scale spatiotemporal variability that is inadequately represented in observations and climate models, making ShCu a significant contributor to uncertainty in future climate projections. While large observational efforts have been devoted to better understand the mechanisms of marine ShCu in the Tropical trades, continental ShCu has received less attention.

Using 7 years of very high-resolution multispectral images with 10x10m2 pixel size acquired by polar-orbiting Copernicus Sentinel-2 satellites we will give the first analysis of these high-resolution observations focused on continental ShCu around the Central Facility of the ARM Southern Great Plains site in the United States. We will show, that the clouds and cloud shadows can be considered as individual objects with associated properties, such as shape and size parameters as well as their geometric relationship, but also as part of an object field. The cloud fraction, cloud-size-distribution and organization index are calculated for various continental ShCu scenes. The influence of large-scale meteorological conditions and surface properties on the cloud fields will be discussed.

Furthermore, a technique will be presented for deriving cloud height and cloud thickness from Sentinel-2 observation, which exploits the geometric relationship between cloud objects and their shadows. The satellite-based estimation will be evaluated using ground-based observational data at the ARM Southern Great Plains Facility, such as the Clouds Optically Gridded by Stereo (COGS) 4-D cloud product. We will discuss how cloud height affects the properties of the cloud fields and thus the radiative forcing.

How to cite: Ritter, O., Deneke, H., and Bley, S.: Object-based characterization of continental Shallow Cumulus Cloud properties using high-resolution Sentinel-2 observations, EGU General Assembly 2024, Vienna, Austria, 14–19 Apr 2024, EGU24-18779, https://doi.org/10.5194/egusphere-egu24-18779, 2024.

EGU24-18834 | Orals | AS3.29

Assessing the benefits of improved spatiotemporal resolution of current geostationary imagers for surface solar irradiance retrievals based on the S2VSR campaign 

Hartwig Deneke, Connor Flynn, Michael Foster, Andrew Heidinger, Heike Kalesse-Los, Andreas Macke, Jan Fokke Meirink, Jens Redemann, Manajit Sengupta, Andi Walther, Job Wiltink, and Jonas Witthuhn

The current advanced geostationary imagers including the GOES-R ABI and MTG FCI instruments offer significant improvements in terms of spatio-temporal resolution compared to previous instruments, featuring pixel sizes for solar channels down to 500x500m2, and scan frequencies up to 1 per min. While these capabilities enable us to better resolve small-scale variability in clouds and radiation, our understanding of the practical benefits for monitoring cloud development and retrieving surface solar irradiance remains limited. One key reason is the limited representativity of many ground-based remote sensing observations serving as potential reference, which are point-like in nature. In contrast, satellite-derived quantities correspond to extended spatial domains.

To improve our knowledge about the small-scale structure and variability of clouds and its influence on solar radiation, the Small-Scale Variability of Solar Radiation (S2VSR) campaign was conducted at the ARM Southern Great Plains (SGP) site in summer 2023. A unique sensor network consisting of 60 autonomous pyranometer stations developed at the Leibniz Institute for Tropospheric Research was deployed at the SGP site for a 12-week period. Stations were distributed across a 6x6 km2 domain centered around the ARM SGP Central Facility. Together with operational ARM measurements including cloud profiling and a stereo-photogrammetric 4D reconstruction of clouds, this campaign offers an unprecedented dataset for studying cloud-induced small-scale variability in solar irradiance, resolving fluctuations down to the second- and decameter-scale.

In the present contribution, a preliminary analysis of the benefits of 500m-resolution retrievals based on the GOES-R ABI imager using the S2VSR data will be given. Specifically, the deviation of satellite retrievals of surface solar irradiance from single-site measurements caused by the limited representativity will be quantified. An estimate of the instantaneous retrieval uncertainty will be given for different cloud situations. Also, the effects of navigation accuracy and the impact of two different parallax correction strategies will be quantified.

How to cite: Deneke, H., Flynn, C., Foster, M., Heidinger, A., Kalesse-Los, H., Macke, A., Meirink, J. F., Redemann, J., Sengupta, M., Walther, A., Wiltink, J., and Witthuhn, J.: Assessing the benefits of improved spatiotemporal resolution of current geostationary imagers for surface solar irradiance retrievals based on the S2VSR campaign, EGU General Assembly 2024, Vienna, Austria, 14–19 Apr 2024, EGU24-18834, https://doi.org/10.5194/egusphere-egu24-18834, 2024.

Understanding the spatio-temporal heterogeneity of aerosol composition is critical in improving climate projection and health impact assessment of air pollution. Systematic data on aerosol composition is lacking over the Indian subcontinent. In this work, we processed 22 years (2001 to 2022) of Level 2 version 23 Multi-angle Imaging Spectro-Radiometer (MISR) aerosol products to derive information about aerosol composition over the Indian Subcontinent.

We broadly categorized aerosols into four types: Secondary Inorganic Aerosol (SIA), Absorbing (BC, OC), Sea- Salt and Dust. MISR aerosol retrieval algorithm assumes 74 aerosol mixtures considering 8 aerosol models based on size, shape and absorbing properties. We calculated the % retrieval frequency of all 74 aerosol mixtures over 22 years, month-wise, in a grid of 0.05 x 0.05. Utilizing this, we then mapped the monthly climatology of aerosol retrieval frequency of four broad types calculated summing over the frequency of a particular mixture multiplied by the fraction of aerosol models assumed in that mixture. We also investigated aerosol optical properties such as size and shape-segregated AODs, Angstrom exponent and SSA. The result shows a very high retrieval frequency for SIA (>50%), while a very low value (<10%) for absorbing aerosol particles almost throughout the year. The second most frequently retrieved aerosol type is sea salt, ranging between 25% to 40 %, but increasing to >50% during monsoon months. Dust aerosol’s retrieval frequency is very high (>50%) during the pre-monsoon and monsoon months over the oceans surrounding Southern India, while the value is much lower over the land. SIA retrieval frequency is >60% over the land and nearby oceanic regions in the winter season, which decreases to 40%-50% in the pre-monsoon season, increasing dust fractions from <10% to 15-25% over the land. Overall, particles with high AE and high small mode AODs dominate over India region, which supports the high fraction of small anthropogenic particles. The aerosol species AODs derived utilizing this information will help in understanding the differential impacts of aerosol species on the Radiation Budget.

How to cite: Srivastava, S. and Dey, S.: Understanding spatio-temporal variability of aerosol composition based on MISR aerosol product over the Indian Subcontinent, EGU General Assembly 2024, Vienna, Austria, 14–19 Apr 2024, EGU24-19245, https://doi.org/10.5194/egusphere-egu24-19245, 2024.

EGU24-19279 | ECS | Posters on site | AS3.29

Derivation of aerosol optical properties from satellite AOD data and low-cost Particulate Matter sensors 

Giorgia Proietti Pelliccia, Tiziano Maestri, Erika Brattich, Federico Porcù, Silvana Di Sabatino, and Francesco Barbano

The numerous issues caused to human health by aerosol pollution are well documented and certified since long time (e.g. Brunekreef and Holgate 2002). To date, the monitoring of aerosol levels in urban areas is conducted mainly through standardized procedures based on in-situ measurements at fixed and mobile stations. In the last two decades, the possibility of deriving PM values from satellite observations has been investigated (Hoff and Christopher 2009). A large variety of innovative methodologies relies on the retrieval of the Aerosol Optical Depth (AOD) from satellite measured reflectivity at shortwave wavelengths. AOD, once merged with auxiliary data related to meteorology, allows the estimation of the PM concentration over widespread urban and remote locations.

Statistical and Machine Learning approaches have been often applied to investigate the correlation between PM concentration and AOD (Ma et al. 2022). Nevertheless, the physical interpretation is sometimes hidden by the complex nature of the relation and by the specificities of the studied areas. On the other hand, the derivation of rigorous physical laws requires a thorough investigation of the physico-chemical relationships between aerosol composition and optical properties.

Most studies use measurements of mass concentration at dry conditions and apply corrections to account for the effect of humidity, which causes aerosol particles to grow. Only few research studies so far have directly considered measurements performed at ambient conditions, such as those operated by Optical Particle Counters (OPC) (e.g. Gupta et al. 2018). Particle number concentration measurements from OPCs and more so PM concentrations derived from such measurements are affected by humidity because of particle hygroscopic growth. Similarly, satellite algorithms used to retrieve AOD are affected by the aerosol hygroscopicity and the estimated AOD amounts is due to both the dry and humid component of the aerosol layer.

This study applies a physical approach, investigates the possibility of using measurements from low-cost OPC sensors together with satellite AOD data to derive the relationship between aerosol concentration and their optical properties and, from that, to derive humidity-dependent properties. The study starts from the theoretical definition of AOD and PSD; it also uses information about local aerosol composition and PSD, and optical aerosol properties from model simulations.

References:

Brunekreef, Bert, and Stephen T. Holgate. 2002. ‘Air Pollution and Health’. The Lancet 360 (9341): 1233–42
Gupta, P., P. Doraiswamy, R. Levy, O. Pikelnaya, J. Maibach, B. Feenstra, Andrea Polidori, F. Kiros, and K. C. Mills. 2018. ‘Impact of California Fires on Local and Regional Air Quality: The Role of a Low-Cost Sensor Network and Satellite Observations’. GeoHealth 2 (6): 172–81
Hoff, Raymond M., and Sundar A. Christopher. 2009. ‘Remote Sensing of Particulate Pollution from Space: Have We Reached the Promised Land?’ Journal of the Air & Waste Management Association 59 (6): 645–75
Ma, Zongwei, Sagnik Dey, Sundar Christopher, Riyang Liu, Jun Bi, Palak Balyan, and Yang Liu. 2022. ‘A Review of Statistical Methods Used for Developing Large-Scale and Long-Term PM2.5 Models from Satellite Data’. Remote Sensing of Environment 269 (February): 112827

How to cite: Proietti Pelliccia, G., Maestri, T., Brattich, E., Porcù, F., Di Sabatino, S., and Barbano, F.: Derivation of aerosol optical properties from satellite AOD data and low-cost Particulate Matter sensors, EGU General Assembly 2024, Vienna, Austria, 14–19 Apr 2024, EGU24-19279, https://doi.org/10.5194/egusphere-egu24-19279, 2024.

EGU24-19551 | Orals | AS3.29 | Highlight

EUMETSAT efforts to establish the European (NRT) satellite constellation for aerosol & fire monitoring. Current status and upcoming developments with Sentinel-3 and MTG. 

Julien Chimot, Andrea Meraner, Edouard Martins, Sauli Joro, Bertrand Fougnie, and Bojan Bojkov

Since 2014, EUMETSAT is leading the establishment for the European Near Real Time (NRT) and operational satellite constellation dedicated to the monitoring of aerosols and some of their sources, like wildfires. On top of that, EUMETSAT is developing the Level-2 (L2) NRT satellite Aerosol Optical Depth (AOD) products and intensively works with the European Centre for Medium-Range Weather Forecasts (ECMWF) to prepare the future operational assimilation by the Copernicus Atmospheric Monitoring Service (CAMS).

Our presentation will focus on the current status of the NRT aerosol products from the Copernicus Sentinel-3 mission, the challenges, and their evolution. It will notably address the current quality of the AOD data from the Collection 3 as derived and operationally disseminated by EUMETSAT from the Optimized Simultaneous Surface Aerosol Retrieval (OSSAR-CS3) processing chain, the planned evolution with the Day-2/Day-3 developments with notably the NRT SYNergy items, and also the new Aerosol Layer Height (ALH) developments under preparation from the O2-A Sentinel-3 bands.

The NRT Aerosol products are jointly produced with the NRT Fire Radiative Power products from Sentinel-3, hence providing key information on some important aerosol emission sources. Consistency across these two datasets will be addressed. These products provide the foundation of the upcoming NRT aerosol and fire developments under preparation for the Flexible Combined Imager (FCI) instrument onboard the Meteosat Third Generation (MTG) platform.

How to cite: Chimot, J., Meraner, A., Martins, E., Joro, S., Fougnie, B., and Bojkov, B.: EUMETSAT efforts to establish the European (NRT) satellite constellation for aerosol & fire monitoring. Current status and upcoming developments with Sentinel-3 and MTG., EGU General Assembly 2024, Vienna, Austria, 14–19 Apr 2024, EGU24-19551, https://doi.org/10.5194/egusphere-egu24-19551, 2024.

EGU24-20775 | ECS | Posters on site | AS3.29

Flexible Aerosol and Cloud Obstruction Mask (ACOM) for various remote sensing applications 

Christian Matar, Pavel Litvinov, Cheng Chen, Masahiro Momoi, Zhen Liu, Oleg Dubovik, and Philippe Goryl

Clouds and aerosols can obstruct the solar radiation propagating through the atmosphere before it reaches the Earth's surface due to the scattering and absorption processes. The impact of this obstruction on Earth observation is related to the degree of obstruction along the optical path, and to the remote sensing application in question. Usually, such obstruction is accounted for by applying cloud and shadow masking for the observed pixels or by performing simultaneous atmosphere/surface retrieval. Estimation of the atmospheric signal (clouds and aerosol obstructions) from the top of atmosphere measurements can be used to identify clouds, cloud shadows or presence of aerosol in the atmosphere. In ACOM this is done by extracting surface signal from atmospheric one and then separating clouds and aerosol features from each other using multi dimensional spectral thresholds and spatial variability tests.

The concept applied in ACOM allows a quantitative estimation of the atmospheric obstruction which results in the distinction of different clouds and aerosols classes varying from low to high levels of aerosol and clouds loading in addition to cloud vicinity, cloud shadow and aerosol plumes shadow classes. ACOM shows robust results with ENVISAT/MERIS and Sentinel-3/OLCI and the algorithm can be easily extended to any other optical instruments with spectral channels in the blue and infrared ranges.

How to cite: Matar, C., Litvinov, P., Chen, C., Momoi, M., Liu, Z., Dubovik, O., and Goryl, P.: Flexible Aerosol and Cloud Obstruction Mask (ACOM) for various remote sensing applications, EGU General Assembly 2024, Vienna, Austria, 14–19 Apr 2024, EGU24-20775, https://doi.org/10.5194/egusphere-egu24-20775, 2024.

EGU24-20841 | Orals | AS3.29 | Highlight

Multi-instrument synergetic retrieval of aerosol and surface properties with GRASP algorithm 

Pavel Litvinov, Cheng Chen, Oleg Dubovik, Siyao Zhai, Christian Matar, David Fuertes, Anton Lopatin, Tatsiana Lapionak, Manuel Dornacher, Arthur Lehner, and Christian Retscher

Big variety of different satellites on Earth orbit are dedicated to aerosol studies. However, due to limited information content, the main aerosol products of the most of satellite missions is AOD while the accuracy of aerosol size and type retrieval from space-borne remote sensing still requires essential improvement. . The combination of measurements from different satellites essentially extends their information content and, therefore, can provide new possibility for much better retrieval of extended set of both aerosol and surface properties.

In the frame of ESA SYREMIS project GRASP algorithm was adapted for synergetic retrieval from combined space-borne instruments: (i) synergy from polar-orbiting (LEO) satellites (in particular, synergy of Sentinel-5p/TROPOMI, Sentinel-3A, -3B/OLCI instruments) and (ii) synergy of LEO and geostationary (GEO) satellites (in particular, synergy of Sentinel-5p/TROPOMI, Sentinel-3A, -3B/OLCI and HIMAWARI/AHI sensors). On one hand such synergy constellation extends the spectral range of the measurements. On another hand it provides unprecedented global spatial coverage with several measurements per day which is crucial for global climate studies and air-quality monitoring.

In this talk we discuss physical basis and concept of the LEO-LEO and LEO-GEO synergies used in GRASP retrieval. It will be demonstrated that SYREMIS/GRASP synergetic approach allows transition of information from the instruments with richest information content  to the instruments with lower one. This results in increased performance of AOD, aerosol size and absorption properties retrieval and more consistent surface BRDF characterization. 

How to cite: Litvinov, P., Chen, C., Dubovik, O., Zhai, S., Matar, C., Fuertes, D., Lopatin, A., Lapionak, T., Dornacher, M., Lehner, A., and Retscher, C.: Multi-instrument synergetic retrieval of aerosol and surface properties with GRASP algorithm, EGU General Assembly 2024, Vienna, Austria, 14–19 Apr 2024, EGU24-20841, https://doi.org/10.5194/egusphere-egu24-20841, 2024.

EGU24-208 | ECS | Orals | AS3.30

Evaluation of Ozone Profile and NO2 vertical column densities of Geostationary Environment Monitoring Spectrometer (GEMS) in China 

Naveed Ahmad, Changqing Lin, Alexis K.H. Lau, Jhoon Kim, Kai Qin, Chengcai Li, and Jimmy C.H. Fung

Ozone (O3) and nitrogen dioxide (NO2) are critical atmospheric trace gases due to their role in air quality, oxidative chemistry, and climate forcing. Both O3 and NO2 were formerly monitored from space on a daily basis using sun-synchronous polar orbiting satellite instruments. However, the Geostationary Environment Monitoring Spectrometer (GEMS) now provides hourly measurements during the daylight hours over East Asia. Since GEMS is a newly launched satellite instrument, to check the accuracy and uncertainties associated with the first version of its dataset, there is a need for its evaluation through ground-based instruments over the Chinese region. This study presents the systematic evaluation of GEMS hourly measurements of Column Amount NO2 (NO2 VCDs) and Ozone Profile (O3P) by using ground-based measurements. The MAX-DOAS measurements were conducted in Xuzhou in eastern China for one week of each of the four seasons in 2021 to have a better representation of both high and low NO2 concentrations. NO2 variations were well captured in all seasons by both instruments, with higher VCDs in winter and lower during the summer.  A good correlation (R = 0.82) between MAX-DOAS and GEMS was found. However, GEMS underestimated the NO2 VCDs with a consolidated mean deviation (without seasonal discrimination) by -1.87 ± 8.73 x 10¹⁵ molec/cm2. The comparison of hourly GEMS NO2 VCDs with in-situ measurements available across China for 2021 has shown a good correlation coefficient of around 0.4-0.6 and higher, particularly in the highly polluted region of the North China Plain. Then, to evaluate the GEMS ozone profile, we used Ozonesonde measurements available for 2021 in Hong Kong, situated in the southern part of China. For the vertical profile of ozone in the troposphere and lower stratosphere, GEMS and Ozonsonde depicted a similar pattern. However, in the troposphere, the Ozonesonde measurements were slightly underestimated, while in the stratosphere, GEMS showed underestimation. It is pertinent to mention that both instruments depicted peak ozone concentrations at an altitude of around 24 to 27 km. The correlation between the two instruments was good, particularly in the lower troposphere (R = 0.74) at 4 km. Further, the lowest layer of the GEMS ozone profile was compared with in-situ measurements for 2021 across the entire Chinese region, and a good correlation coefficient (R: 0.4 - 0.6) was observed. These findings are meaningful scientific advancement enhancing our understanding of the potential of the first geostationary satellite instrument to monitor atmospheric trace gases (O3 and NO2) hourly. More robust validations are recommended in other regions to understand the uncertainties associated with the local conditions and to further improve the GEMS products in future versions of datasets.

How to cite: Ahmad, N., Lin, C., K.H. Lau, A., Kim, J., Qin, K., Li, C., and C.H. Fung, J.: Evaluation of Ozone Profile and NO2 vertical column densities of Geostationary Environment Monitoring Spectrometer (GEMS) in China, EGU General Assembly 2024, Vienna, Austria, 14–19 Apr 2024, EGU24-208, https://doi.org/10.5194/egusphere-egu24-208, 2024.

EGU24-2121 | Posters on site | AS3.30

Investigating NO2 processing in power plant plumes from TROPOMI 

Steffen Beirle and Thomas Wagner

The divergence, i.e. the spatial derivative of the horizontal flux, yields the local balance of sources of sinks. Strong positive divergence is observed for (and allows to quantify) NOx emissions from point sources like power plants. Within the downwind plume, NO2 changes due to (a) further NO to NO2 conversion (NO2 source, positive divergence) and (b) NO2 reaction with OH (NO2 sink, negative divergence).

In this study we aim to disentangle and quantify these competing effects based on the divergence of the observed NO2 flux. We focus on large and isolated power plants where additional sources are negligible. Goal is to determine the time scales for the NO to NO2 conversion and the NO2 lifetime for power plant plumes.

How to cite: Beirle, S. and Wagner, T.: Investigating NO2 processing in power plant plumes from TROPOMI, EGU General Assembly 2024, Vienna, Austria, 14–19 Apr 2024, EGU24-2121, https://doi.org/10.5194/egusphere-egu24-2121, 2024.

EGU24-2156 | Orals | AS3.30

Quantifying seasonal urban NO2 emissions using satellite observations 

Vitali Fioletov, Chris McLinden, Debora Griffin, Xiaoyi Zhao, and Henk Eskes

The tropospheric NO2 vertical column density (VCD) values measured by the Tropospheric Monitoring Instrument (TROPOMI) were used to study the NO2 variability and estimate urban NO2 emissions for 261 major cities worldwide. The used algorithm isolated three components in tropospheric NO2 data: background NO2, NO2 from urban sources, and from industrial point sources, and then each of these components was analyzed separately. The method is based on fitting satellite data by a statistical model with empirical plume dispersion functions driven by a meteorological reanalysis. Unlike other similar studies that studied plumes from emission point sources, this study included the background component as a function of the elevation in the analysis and separated urban emissions from emissions from industrial point sources. Population density and surface elevation data as well as coordinates of industrial sources were used in the analysis. Differences between workday and weekend emissions were also studied. Urban emissions on Sundays (or Fridays for some countries) are typically 20%-50% less than workday emissions for all regions except China. No significant difference in urban emissions between seasons was found. In contrast, the background component does not show any significant differences between workdays and weekends suggesting that background NO2 has a substantially longer lifetime compared to that in the plumes. 

How to cite: Fioletov, V., McLinden, C., Griffin, D., Zhao, X., and Eskes, H.: Quantifying seasonal urban NO2 emissions using satellite observations, EGU General Assembly 2024, Vienna, Austria, 14–19 Apr 2024, EGU24-2156, https://doi.org/10.5194/egusphere-egu24-2156, 2024.

EGU24-2865 | Posters on site | AS3.30

1-km resolution inversion of NOx emissions based on satellite constrained by geodata 

Hao Kong, Jintai Lin, Yuhang Zhang, Sijie Wang, and Chenghao Xu

High-resolution spaceborne emission inversions play a crucial role in independent emission monitoring, small-scale pollution modelling, and exposure estimation. However, spaceborne emission inversion at 1-km resolution is still a challenge due to the insufficiency of satellite observations, along with limitations such as computational costs and meteorological data. The spatial resolutions of existing satellite-based NO2 observations (e.g. TROPOMI: nadir pixel of ~3.5×5.5 km2) fall short in capturing spatial features at 1-km resolution. Here we develop an innovative technique to integrate high-resolution geodata in emission inversions. This technique introduces constraints based on geodata associated with emissions to inversions independent of predefined downscaling schemes. Our inversions show advanced results of NOx emissions with detailed spatial patterns at small scale, especially for sources relevant to traffic and marine shipping which are of large uncertainties in current inventories.

How to cite: Kong, H., Lin, J., Zhang, Y., Wang, S., and Xu, C.: 1-km resolution inversion of NOx emissions based on satellite constrained by geodata, EGU General Assembly 2024, Vienna, Austria, 14–19 Apr 2024, EGU24-2865, https://doi.org/10.5194/egusphere-egu24-2865, 2024.

EGU24-2882 | Orals | AS3.30

Near-Automated Estimate of City Nitrogen Oxides Emissions Applied to South and Southeast Asia 

Eloise Marais, Gongda Lu, Karn Vohra, Rebekah Horner, Dandan Zhang, Randall Martin, and Sarath Guttikunda

Cities in South and Southeast Asia are developing rapidly, but lack routine, up-to-date, publicly available inventories of air pollutant precursor emissions such as nitrogen oxides (NOx). This data deficiency can be addressed by deriving city NOx emissions from satellite observations of nitrogen dioxide (NO2) tropospheric column densities. In this approach, the city plume is aligned along a consistent direction using wind rotation and a best-fit Gaussian applied to estimate NOx emissions. Issues that impact success of this approach is subjective selection of the sampling area around the city centre and the Gaussian fit often fails or yields physically implausible parameters. Here, we automate this top-down approach by defining many (54) sampling areas that we test with TROPOspheric Monitoring Instrument (TROPOMI) NO2 observations over 19 cities in South and Southeast Asia. Our approach is efficient, adaptable to a wide range of city sizes, eliminates the need for subjective sampling area selection, and increases success of deriving annual emissions from 40-60% with a single sampling area to 100% (all 19 cities) with 54 sampling areas. Annual emissions range from 16±5 mol s-1 for Yangon (Myanmar) to 118±39 mol s-1 for Dhaka (Bangladesh). A widely used global emissions inventory exhibits large (2-fold) discrepancies for 5 of the 19 cities. The increase in success achieved with our updated approach also enables derivation of monthly emissions, although all 12 months are only obtained for one city (Karachi in Pakistan). Seasonality in the monthly emissions matches seasonality in tropospheric column abundances of NO2 and is greater than can be reasoned with seasonality in anthropogenic activity in cities. This suggests that past annual emissions calculated using observations for a portion of the year or select days may be biased. Further refinement of this approach is needed to fully exploit the large sampling density of high-resolution low-Earth orbiting instruments such as TROPOMI and hourly measurements from geostationary instruments such as Geostationary Environmental Monitoring Spectrometer (GEMS), Tropospheric Emissions: Monitoring of Pollution (TEMPO), and Sentinel-4.

How to cite: Marais, E., Lu, G., Vohra, K., Horner, R., Zhang, D., Martin, R., and Guttikunda, S.: Near-Automated Estimate of City Nitrogen Oxides Emissions Applied to South and Southeast Asia, EGU General Assembly 2024, Vienna, Austria, 14–19 Apr 2024, EGU24-2882, https://doi.org/10.5194/egusphere-egu24-2882, 2024.

EGU24-3175 | Orals | AS3.30

An efficient use of a Lagrangian transport model for atmospheric inversions using satellite observations: case study using TROPOMI to estimate CH4 emissions over Siberia 

Nalini Krishnankutty, Rona L. Thompson, Ignacio Pisso, Philipp Schneider, Kerstin Stebel, Motoki Sasakawa, and Stephen M. Platt

We present a novel and efficient method for atmospheric inversions of satellite observations using a Lagrangian Particle Dispersion Model (LPDM) and demonstrate its use for a case study in Siberia. LPDMs have several advantages over Eulerian models. First, they can more precisely represent an observation since calculations are independent of a computational grid and second, LPDMs can be run in a backwards in time mode, which allows the computation of the sensitivity of an observation to fluxes and in this way are sometimes said to be “self adjoint”. The LPDM used in our study is FLEXPART.

In our method, FLEXPART is run in a backwards-in-time mode to determine total column source-receptor relationships (SRRs), which describe the relationship between a total column observation (such as from a satellite) and fluxes. The SRRs are used in the Bayesian inversion framework, FLEXINVERT, to optimize fluxes over a nested domain. Background mixing ratios for the total column observations are determined by coupling FLEXPART backward trajectories with the outputs of an optimized global Eulerian model (TM5).

We demonstrate the method in a case study, determining CH4 emissions over Siberia using observations from the TROPOspheric Monitoring Instrument (TROPOMI) onboard Sentinel 5P. Siberia was chosen as it is a region with important emissions from oil/gas facilities and coal mining, as well as abundant natural sources from wetlands. The posterior fluxes obtained using TROPOMI XCH4 are evaluated by comparing to inversions using observations from the ground-based network, JR-STATION.

How to cite: Krishnankutty, N., Thompson, R. L., Pisso, I., Schneider, P., Stebel, K., Sasakawa, M., and Platt, S. M.: An efficient use of a Lagrangian transport model for atmospheric inversions using satellite observations: case study using TROPOMI to estimate CH4 emissions over Siberia, EGU General Assembly 2024, Vienna, Austria, 14–19 Apr 2024, EGU24-3175, https://doi.org/10.5194/egusphere-egu24-3175, 2024.

EGU24-3562 | ECS | Posters on site | AS3.30

Early Results of Ozone Production Rate Estimates Using Satellite Observations: Insights From Numerous NASA Atmospheric Composition Campaigns 

Amir Souri, Gonzalo González Abad, Glenn Wolfe, Matthew Johnson, Bryan Duncan, and Tijl Verhoelst

Questions about how regulations have shaped ozone pollution regionally cannot be answered by studying observed surface ozone concentrations alone, as we must precisely determine ozone production rates, which refer to the amount of ozone molecules photochemically produced in the atmosphere. Through an extensive suite of NASA's airborne campaigns such as DISCOVER-AQs, KORUS-AQ, INTEX-B, SENEX, and ATOMs, constraining a well-characterized chemical box model, we establish a simple but robust relationship between ozone production rates and various observable parameters; some of these factors, fortunately, are being measured or constrained by satellite observations, which has allowed us to create the first-ever maps of ozone production rates across the globe. We quantitatively and qualitatively assess this product's efficacy through independent airborne campaigns and by contrasting extreme events to a norm. We have a clear path forward to enhance this innovative product using agile machine learning algorithms for the years from 2005 to 2024, along with its well-characterized error budget.

How to cite: Souri, A., González Abad, G., Wolfe, G., Johnson, M., Duncan, B., and Verhoelst, T.: Early Results of Ozone Production Rate Estimates Using Satellite Observations: Insights From Numerous NASA Atmospheric Composition Campaigns, EGU General Assembly 2024, Vienna, Austria, 14–19 Apr 2024, EGU24-3562, https://doi.org/10.5194/egusphere-egu24-3562, 2024.

Nitrogen dioxide (NO2) is an important air pollutant and has been widely recognized for its hazardous impact on human health. Tropospheric NO2 is routinely monitored using satellites (e.g. TROPOMI onboard Sentinel-5P), in situ instruments, and ground-based spectroscopic measurements (e.g. multi-axis differential optical absorption spectroscopy, MAX-DOAS). However, these measurements do not give the full picture: Satellite instruments can only measure the integrated load (column density), in situ measurements are mostly deployed at the surface, and MAX-DOAS instruments are still very sparse. In consequence, it is currently impossible to obtain sufficiently resolved NO2 profiles from measurements alone. Regional chemistry and transport (RCT) simulations can be used to simulate NO2 profiles where no observations are available, but they are computationally expensive and require meticulous parameter calibration to achieve acceptable agreement with observational reference data.

We present NitroNet, a new deep-learning model for the prediction of tropospheric NO2 profiles. The model is based on a feedforward neural network, which was trained on a synthetic dataset from the RCT model WRF-Chem. NitroNet receives vertical NO2 column densities (VCDs) from TROPOMI and ancillary variables (meteorological, emissions, etc.) as input, from which it predicts tropospheric NO2 concentration profiles. The NO2 VCD is descriptive of the profiles' magnitudes, while their shapes are derived from the ancillaries (e.g. the boundary layer height). The ancillaries are taken from the TROPOMI NO2 data product, ERA5 reanalysis data, and the EDGARv5 emission inventory. By prior filtering of the training data based on their agreement to reference data, NitroNet can achieve better agreement with TROPOMI’s NO2 VCDs and surface in situ measurements than WRF-Chem at a much faster runtime. On the downside, these predictions are available only once per day, when the TROPOMI overpass occurs. We showcase the model’s performance against a variety of validation data (satellite, in situ, and MAX-DOAS measurements), and its ability to generalize to different seasons and geographical regions.

What makes NitroNet unique in the field of deep-learning air pollution models is its training on synthetic data. This conceptual difference to the many recently developed models, trained on empirical observations alone, unlocks important new possibilities: Due to the paucity of other observations, empirical training sets are practically confined to surface concentrations from in situ measurements. Synthetic data generation, on the other hand, allows for training sets with full NO2 profiles instead. Moreover, synthetic training examples do not suffer from the cross-sensitivities of in situ measurements to other nitrogen compounds (up to a factor of 2).

The NO2 profiles produced by NitroNet can be used as high-resolution replacements for the a priori profiles in satellite retrievals, or for studies on surface level air pollution.

How to cite: Kuhn, L., Beirle, S., and Wagner, T.: NitroNet – A new deep-learning model for the prediction of NO2 profiles based on TROPOMI satellite observations, EGU General Assembly 2024, Vienna, Austria, 14–19 Apr 2024, EGU24-3660, https://doi.org/10.5194/egusphere-egu24-3660, 2024.

EGU24-4220 | Orals | AS3.30

Remote sensing of trace gases from multiple Chinese satellite instruments and its application combined with AI  

Cheng Liu, Xiaohan Wang, Jingkai Xue, Qihou Hu, Qihua Li, Wenjing Su, and Chengxin Zhang

Recently, China launched a series of the Environmental Trace Gases Monitoring Instruments (EMI) on satellites with different over-pass times to support global daily multi-temporal atmospheric monitoring. Compared with previous satellites in sun-synchronous orbit, such as OMI and TROPOMI which over passes at 13:30 LT, the series of Chinese EMI satellite instruments with similar performance can be used to investigate the diurnal variations in trace gases. Besides, the series of EMI expanded the areas with diurnal observation in trace gases from the North America, East Asia, and Europe, where are covered by geostationary satellite observations, to the global scales, particularly the South Hemisphere. However, how to eliminate the systematic bias between retrieval results from multiple satellites is the major difficulty.

Here we are performed further spectral calibration and inversion algorithm improvement. We use meteorological parameters and a priori atmospheric profiles at different moments in the radiative transfer calculations and inversion. Results from the Tracer Model (version 5, TM5) were also used for background correction. We use secondary radiometric calibrations, i.e. soft calibrations, to further correct the systematic biases between observed spectra from different instruments. Through these algorithm updates, we have successfully retrieved the concentrations of several trace gases, such as Ozone (O3), nitrogen dioxide (NO2), sulfur dioxide (SO2) and formaldehyde (HCHO), at different times of day (10:30 and 13:00 LT). The retrieved trace gas concentrations from the series of EMI were further used to investigate the diurnal variation in air pollutant emissions and ozone formation.

Moreover, due to the influence of factors such as cloud cover, satellite observations often have gaps. Here we used artificial intelligence (AI) analysis, such as neural operator methods, to achieve spatial full coverage of remote sensing results. We masked existing satellite observation data, and then used artificial intelligence models to repair and fill in missing areas, with ERA5 meteorological field data, various emission inventories, and geographical information data. The combination with AI analysis improved the usability and application scope of satellite data.

How to cite: Liu, C., Wang, X., Xue, J., Hu, Q., Li, Q., Su, W., and Zhang, C.: Remote sensing of trace gases from multiple Chinese satellite instruments and its application combined with AI , EGU General Assembly 2024, Vienna, Austria, 14–19 Apr 2024, EGU24-4220, https://doi.org/10.5194/egusphere-egu24-4220, 2024.

EGU24-4517 | ECS | Posters on site | AS3.30

Satellite unravels recent changes in atmospheric nitrogen oxides emissions from global ocean shipping 

Xiaohan Wang, Chengxin Zhang, and Cheng Liu

Nitrogen dioxide (NO2) in the lower marine atmosphere, mainly emitted by maritime shipping, plays a crucial role in air pollution formation and global human health. However, few measurements of marine atmospheric NO2 hinder knowledge of trace gas trends and atmospheric chemistry evolution due to shipping emissions. In this study, we use long-term satellite observations of tropospheric NO2 column from the European TROPOspheric Monitoring Instrument (TROPOMI) and the Chinese Environmental trace gases Monitoring Instrument (EMI) to analyze marine atmospheric NO2 variations, especially during the global COVID-19 pandemic and escalating geopolitical crises. First, we demonstrate the detection of NO2 enhancements along shipping routes, including the North Atlantic route, the North Pacific route, and the Cape route, indicating significant emissions of atmospheric NO2 from on-ocean shipping. Second, we observe and quantify the response of marine atmospheric NO2 concentrations to major shipping events, such as the Suez Canal blockage, the Los Angeles-Long Beach port congestion, and the Russia-Ukraine war, resulting in local NO2 concentration variations of approximately 40% decrease to 70% increase. Long-term analysis reveals reduced NO2 concentrations in most coastal ports and maritime shipping routes during the COVID-19 lockdown, with reductions exceeding 50% or durations lasting up to 200 days. However, some rapidly developing ports, such as Beibu Gulf (China) and Dakar (Senegal), did not experience a decrease in NO2 concentrations, suggesting that local authorities need to pay more attention to these fast-growing yet underestimated emission sources. In addition, by excluding the impact of meteorology using statistical models, we find that the current Emission Control Area (ECA) policies have effectively reduced NO2 concentrations in Chinese coastal ports. These results contribute to understanding spatiotemporal characteristics of marine atmospheric NO2, including ports and open-sea shipping routes, and guide further ECA policies to control marine NO2 pollution.

How to cite: Wang, X., Zhang, C., and Liu, C.: Satellite unravels recent changes in atmospheric nitrogen oxides emissions from global ocean shipping, EGU General Assembly 2024, Vienna, Austria, 14–19 Apr 2024, EGU24-4517, https://doi.org/10.5194/egusphere-egu24-4517, 2024.

EGU24-4816 | Orals | AS3.30

Observing a Volatile Organic Compound from a Geostationary Infrared Sounder: HCOOH from FengYun-4B/GIIRS 

Zhao-Cheng Zeng, Bruno Franco, Lieven Clarisse, Lu Lee, Chengli Qi, and Feng Lu

Formic acid (HCOOH) is one of the most abundant volatile organic compounds (VOCs) in Earth’s atmosphere and an important source of atmospheric acidity. Satellite observations play an indispensable role in improving our understanding of global HCOOH sources and sinks. However, existing polar-orbiting satellites that are sensitive to tropospheric HCOOH provide only two daily overpasses over the same location, one during the day and the other at night. The diurnal changes of tropospheric HCOOH are therefore under-constrained, limiting our ability to monitor its evolution and transport throughout the troposphere. The Geostationary Interferometric Infrared Sounder (GIIRS) onboard China’s FengYun-4 satellite series is the world’s first geostationary hyperspectral infrared sounder. Here, we present the first retrieval of HCOOH from GIIRS onboard FengYun-4B. Results from July 2022 to June 2023 highlight the seasonal variation of the HCOOH distribution in Asia driven by biomass burning emissions and biogenic sources. Sensitivity to HCOOH peaks during daytime and decreases at night, following diurnal changes of thermal contrast between the surface and the atmosphere. FY-4B/GIIRS in the geostationary orbit will offer important information with its high temporal resolution to improve our understanding of the production, evolution, and loss processes of HCOOH in the atmosphere. Furthermore, cross-validation with IASI HCOOH data shows good agreement, indicating that observations from FY-4B/GIIRS have comparable sensitivity to IASI.

How to cite: Zeng, Z.-C., Franco, B., Clarisse, L., Lee, L., Qi, C., and Lu, F.: Observing a Volatile Organic Compound from a Geostationary Infrared Sounder: HCOOH from FengYun-4B/GIIRS, EGU General Assembly 2024, Vienna, Austria, 14–19 Apr 2024, EGU24-4816, https://doi.org/10.5194/egusphere-egu24-4816, 2024.

Formaldehyde (HCHO) is a toxic and harmful air pollutant to humans, animals, and plants and is an essential precursor of PM2.5 and ozone compound pollution. Few studies have focused on HCHO in Tibet, the third pole with a unique ecosystem that requires protection. Here, we investigate the spatial-temporal distribution of HCHO from 2013 to 2021 and its influencing factors from satellite observations in Tibet. We found that the average HCHO VCD in Tibet presents a significant annual growth rate of 2.25%/yr, which is similar to that in India and even higher than that in most of the world, including eastern China. Moreover, HCHO VCD in the eastern region of Tibet shows no seasonal pattern, unlike other areas. The anomalous variation in HCHO concentrations in Tibet is primarily attributed to long-distance transnational transport from incomplete combustion in India Assam. Our results help strengthen concerns about atmospheric environmental management in Tibet.

How to cite: Xu, Y., Su, W., and Liu, C.: Unexpected HCHO transnational transport: Influence on the temporal and spatial distribution of HCHO in Tibet from 2013 to 2021 based on satellite, EGU General Assembly 2024, Vienna, Austria, 14–19 Apr 2024, EGU24-4826, https://doi.org/10.5194/egusphere-egu24-4826, 2024.

In this study, TROPOspheric Monitoring Instrument (TROPOMI) observations were resampled to obtain 0.01° × 0.01° NO2 VCD (vertical column density) of Yangtze River Delta (YRD), China. The adjusted Exponentially-Modified Gaussian (EMG) model was improved to estimate the quantified nitrogen oxides (NOX) emission. The estimation in typical cities under regionally polluted YRD area has a good correlation with Multi-resolution Emission Inventory for China (MEIC) emission with R more than 0.9 but lower results mainly due to the underestimation of NO2 VCD by TROPOMI in polluted areas. On this basis, using the adjusted EMG method, this study quantified NOX emission in Shanghai during 2022 lockdown period as 32.60 mol/s with a decrease of 50–80%, which was mainly contributed by the transportation and industrial sectors. The significant reduction of NOX emission in Shanghai is much higher than that of volatile organic compounds (VOCs), which led to dramatic changes in formaldehyde-to-nitrogen dioxide ratio (HCHO/NO2, FNR). Thus, when enforcing regulation on NOX emission control in the future, coordinately reducing VOCs emission should be implemented to mitigate urban O3 pollution.

This work was supported by Sino-German Mobility Program (M-0509) and National Natural Science Foundation of China (grant number 42075097, 22176037, 42375089, 22376030).

How to cite: Xue, R., Wang, S., and Zhou, B.: Assessing NOX emission reduction of Shanghai during city-wide lockdown from TROPOMI high spatial resolution observations, EGU General Assembly 2024, Vienna, Austria, 14–19 Apr 2024, EGU24-5854, https://doi.org/10.5194/egusphere-egu24-5854, 2024.

Ammonia (NH3) plays a crucial role in the formation of PM2.5 as a primary alkaline gas in the atmosphere. An NH3 emission inventory is an essential component of numerical chemical transport models for scenario simulations and developing mitigation strategies. The significantly NH3 hotspots located in China can be seen both in compiled inventories and in satellite observations. However, almost all emission inventories report that NH3 emissions from China have a large uncertainty. In our research, we conducted a top-down optimization of monthly NH3 emission over China using IASI-derived surface NH3 concentration and the CAMx model. First, IASI-derived surface NH3 concentrations are assessed by comparing against a surface monitoring network (NNDMN) in China during 2020. Second, an optimal estimation method is used to assimilate observations to optimize the NH3 priori emissions. The posteriori NH3 emissions are approximately double the priori estimates from the prior MEIC inventory and indicate potential underestimation over hotspot areas, especially during the warm months. Monthly variations in posteriori emissions exhibited significant differences across 6 regions of China, with peak emissions occurring in May and July, and relatively stable levels observed in the southern regions of China. In conclusion, this analysis enhanced the understanding of the spatial-temporal patterns of regional NH3 emissions in China, which is important for the development of mitigation strategies to address consistently high NH3 emissions in China.

How to cite: Chen, J.: Inversion of monthly ammonia emissions in China by assimilating satellite surface observations, EGU General Assembly 2024, Vienna, Austria, 14–19 Apr 2024, EGU24-6173, https://doi.org/10.5194/egusphere-egu24-6173, 2024.

EGU24-7013 | ECS | Orals | AS3.30

Large discrepancy between observed and modeled wintertimetropospheric NO2 variabilities due to COVID-19 controls in China 

Jiaqi Chen, Zhe Jiang, Kazuyuki Miyazaki, and Dylan Jones

Recent studies demonstrated the difficulties to explain observed tropospheric nitrogen dioxide (NO2) variabilities over the United States and Europe, but thorough analysis for the impacts on tropospheric NO2 in China is still lacking. Here we provide a comparative analysis for the observed and modeled (Goddard Earth Observing System-Chem) tropospheric NO2 in early 2020 in China. Both ozone monitoring instrument and surface NO2 measurements show marked decreases in NO2 abundances due to the 2019 novel coronavirus (COVID-19) controls. However, we find a large discrepancy between observed and modeled NO2 changes over highly polluted provinces: the observed reductions in tropospheric NO2 columns are about 40% lower than those in surface NO2 concentrations. By contrast, the modeled reductions in tropospheric NO2 columns are about two times higher than those in surface NO2 concentrations. This discrepancy could be driven by the combined effects from uncertainties in simulations and observations, associated with possible inaccurate simulations of lower tropospheric NO2, larger uncertainties in the modeled interannual variabilities of NO2 columns, as well as insufficient consideration of aerosol effects and a priori NO2 variability in satellite retrievals. In addition, our analysis suggests a small influence from free tropospheric NO2 backgrounds in E. China in winter. This work demonstrates the challenge to interpret wintertime tropospheric NO2 changes in China, highlighting the importance of integrating surface NO2 observations to provide better analysis for NO2 variabilities.

How to cite: Chen, J., Jiang, Z., Miyazaki, K., and Jones, D.: Large discrepancy between observed and modeled wintertimetropospheric NO2 variabilities due to COVID-19 controls in China, EGU General Assembly 2024, Vienna, Austria, 14–19 Apr 2024, EGU24-7013, https://doi.org/10.5194/egusphere-egu24-7013, 2024.

EGU24-7964 | ECS | Posters on site | AS3.30

Tropospheric NO2 changes in Ukraine (2019–2022) amidst the Russian-Ukrainian conflict and consequent transboundary effects 

Liudmyla Malytska, Evgenia Galytska, Annette Ladstätter-Weißenmayer, John P. Burrows, and Stanislav Moskalenko

Apart from the loss of life and property, the hostilities, which started on February 24, 2022, with the invasion by Russian armed forces into Ukraine, are altering Ukraine’s environment. In this study, we will present the major findings of Malytska et al., 2024, discussing the changes in tropospheric pollution, specifically nitrogen dioxide (NO2), as a consequence of military activities. This study uses the TROPOspheric Monitoring Instrument (TROPOMI) and Visible Infrared Imaging Radiometer Suite (VIIRS) satellite observations, Global Fire Assimilation System (GFAS) wildfire emission inventory, European Centre for Medium-Range Weather Forecasts (ECMWF) daily ERA5 reanalysis data, and the Hybrid Single-Particle Lagrangeian Integrated Trajectory analysis model (HYSPLIT) 5.2 to quantify the spatiotemporal distribution of tropospheric NO2, its changes and transport during the first three months of the armed conflict in Ukraine. This provides insights into the impact of hostilities on local air quality, as well as regional and transborder pollution.

We discuss NO2 variability with a particular emphasis on comparing periods before and during hostilities to differentiate the effects of COVID-19 restrictions and the hostilities on NO2 emissions over Ukraine. The retrieved emissions show a temporal reduction in NO2 emission in industrial areas, comparable to the COVID-19 pandemic lockdown, whereas the NO2 tropospheric vertical column locally increased in the areas of conflict. Based on the TROPOMI and VIIRS data, we linked the major fires caused by the conflict to air pollution and found that hostilities led to more frequent and intense fires in conflict zones deteriorating air quality in the region. To investigate the impact of the hostilities on atmospheric pollution, we analysed nitrogen oxide (NOx) emission and injection altitude of fire, using the GFAS data. It was found that fires in conflict-affected areas exhibit greater intensity, characterized by larger plume top heights and higher rates of emission, in comparison to fires located far from the front line or resulting from isolated strikes. To demonstrate that increased fire activities contribute to pollution at both local and regional levels, we provide a case study of the fire episode of March 19-23, 2022, in the Kyiv region, coinciding with the active stage of the conflict and the defense of the capital, Kyiv. The simulations of HYSPLIT version 5.2 forward trajectories model showed that a smoke-particle-included air mass, related to the fires in the Chornobyl Exclusion Zone, was transported to Poland and countries of the Baltic region at the height of 1.5-3 km within 72 hours. A plume of NO2, which originated from fires in the Chornobyl Exclusion Zone on March 20, 2022, was observed in Poland the following day.

References:

Malytska L., Ladstätter-Weißenmayer A., Galytska E, and. Burrows J.P. Assessment of environmental consequences of hostilities: Tropospheric NO2 vertical column amounts in the atmosphere over Ukraine in 2019–2022. Atmospheric Environment 318 (2024) 120281, DOI: https://doi.org/10.1016/j.atmosenv.2023.120281

How to cite: Malytska, L., Galytska, E., Ladstätter-Weißenmayer, A., Burrows, J. P., and Moskalenko, S.: Tropospheric NO2 changes in Ukraine (2019–2022) amidst the Russian-Ukrainian conflict and consequent transboundary effects, EGU General Assembly 2024, Vienna, Austria, 14–19 Apr 2024, EGU24-7964, https://doi.org/10.5194/egusphere-egu24-7964, 2024.

A new era of air quality observations from geostationary Earth orbit(GEO) has begun with the launch of Geostationary Environment Monitoring Spectrometer (GEMS) over Asia and Tropospheric Emission of Pollutants (TEMPO) over North America as the two components of geostationary air quality (AQ) constellation. GEMS has provided hourly observations of AQ over Asia from a GEO since November 2020. Column amounts of atmospheric pollutants (O3, NO2, SO2, HCHO, CHOCHO, and aerosols) have been provided to capture their diurnal variations with the UV–visible spectrometer at 0.6 nm spectral resolution and sophisticated retrieval algorithms. Details of the latest GEMS version 3 products are presented, including validations, calibration, and case studies of volcanic eruption, dusts, and urban pollution. In version 3, there are noticeable improvements in trace gases from updated AMF, the separation of stratospheric/tropospheric components, fitting window, spectroscopy etc. Calibration/validation activities including the ASIA-AQ, Pandora Asia network (PAN), PEGASOS, GMAP/SIJAQ, ACCLIP, and international CAL/VAL team works are critical to evaluate and improve the overall data quality. The GEMS retrievals indicate good agreements from the campaigns, but still require further improvements in L1 processing as well. We are improving L1 processor including BTDF correction. Faster sampling rates at higher spatial resolution increase the probability of finding cloud-free pixels, leading to more observations of aerosols and trace gases than have been possible from LEO. Planned ESA’s Sentinel-4 in 2025 will complete the GEO AQ satellite constellation with GEMS and TEMPO, as recognized by the Committee on Earth Observation Satellites (CEOS).

How to cite: Kim, J. and the GEMS Science Team: Revealing Diurnal Variations of Air Quality Observations in Asia from Geostationary Environment Monitoring Spectrometer (GEMS), EGU General Assembly 2024, Vienna, Austria, 14–19 Apr 2024, EGU24-8024, https://doi.org/10.5194/egusphere-egu24-8024, 2024.

EGU24-8072 | Posters on site | AS3.30

Ammonia in Paris derived from ground-based open-path and satellite observations 

Camille Viatte, Nadir Guendouz, Clarisse Dufaux, Arjan Hensen, Daan Swart, Martin Van Damme, Lieven Clarisse, Pierre Coheur, and Cathy Clerbaux

Ammonia (NH3) is an important air pollutant which, as precursor of fine particulate matter, raises public health issues. This study analyzes 2.5-years of NH3 observations derived from ground-based (miniDOAS) and satellite (IASI) remote sensing instruments to quantify, for the first time, temporal variabilities (from interannual to diurnal) of NH3 concentrations in Paris.

The IASI and miniDOAS datasets are found to be in relatively good agreement (R>0.70) when atmospheric NH3 concentrations are high and driven by regional agricultural activities. Over the investigated period (January 2020 – June 2022), NH3 average concentrations in Paris measured by the miniDOAS and IASI are 2.23 μg.m-3 and 7.10x10¹⁵ molecules.cm-2, respectively, which are lower or equivalent to those documented in other urban areas. The seasonal and monthly variabilities of NH3 concentrations in Paris are driven by sporadic agricultural emissions influenced by meteorological conditions, with NH3 concentrations in spring up to 2 times higher than in other seasons.

The potential source contribution function (PSCF) reveals that the close (100-200km) east and northeast regions of Paris constitute the most important potential emission source areas of NH3 in the megacity.

Weekly cycles of NH3 derived from satellite and ground-based observations show different ammonia sources in Paris. In spring, agriculture has a major influence on ammonia concentrations and, in the other seasons, multi-platform observations suggest that ammonia is also controlled by traffic-related emissions.

In Paris, the diurnal cycle of NH3 concentrations is very similar to the one of NO2, with morning enhancements coincident with intensified road traffic. NH3 evening enhancements synchronous with rush hours are also monitored in winter and fall. NH3 concentrations measured during the weekends are consistently lower than NH3 concentrations measured during weekdays in summer and fall. This is a further evidence of a significant traffic source of NH3 in Paris.

How to cite: Viatte, C., Guendouz, N., Dufaux, C., Hensen, A., Swart, D., Van Damme, M., Clarisse, L., Coheur, P., and Clerbaux, C.: Ammonia in Paris derived from ground-based open-path and satellite observations, EGU General Assembly 2024, Vienna, Austria, 14–19 Apr 2024, EGU24-8072, https://doi.org/10.5194/egusphere-egu24-8072, 2024.

EGU24-8299 | ECS | Orals | AS3.30

Using satellite observations to examine the role of land cover and fires in driving atmospheric composition over the southern Amazon 

Emma Sands, Richard Pope, Ruth Doherty, Fiona O'Connor, Chris Wilson, and Hugh Pumphrey

We exploit satellite datasets of spatio-temporal distributions of atmospheric composition for the rainforest and savanna region on the southern boundary of the Amazon to understand how its emissions of biogenic volatile organic compounds (BVOCs) and local pyrogenic emissions impact the atmosphere. In particular, we explore the relationship between land cover change, considering vegetation type (e.g. broadleaf forest, savanna, grassland) and Leaf Area Index (LAI), and burned area and atmospheric composition. In this study, we investigate these relationships over the southern Amazon for the period 2001-2019, focussing on seasonal and spatial patterns. We utilise data for five chemical species: total column isoprene (TCC5H8), total column methanol (TCCH3OH), tropospheric column nitrogen dioxide (TCNO2), total column carbon monoxide (TCCO) and total column formaldehyde (TCHCHO), as well as aerosol optical depth (AOD).

We find burned area approximately delineates the areas of change in dominant vegetation cover type over time.  Robust relationships were found between TCC5H8 and forest cover, and TCNO­2­ and burned area. Here, we find that TCC5H8 linearly increases by 1 × 10¹⁴ molecules cm-2 with an increase of 1 percentage point in broadleaf forest cover. This is equivalent to densely forested regions having column isoprene ­­values four times greater than those with no­ forest cover. There is a strong power law relationship between TCNO2 and burned area. Overall, there is a larger increase in TCNO2 in regions of lower, though still substantial, biomass burning (i.e. potentially new regions of burning/deforestation). These relationships highlight the relatively short lifetimes of the two species such that their spatial extent is largely confined to their emission source regions.

Conversely, TCHCHO, TCCO and AOD reach maximum values for high broadleaf forest coverage and high burned areas, suggesting a mixed influence of both biogenic and pyrogenic sources, likely due to the longer lifetimes of these species and aerosols, allowing them to mix and be transported further from their emissions sources. Broadleaf forest cover and burned area do not appear to have a substantial impact on methanol, which is elevated over a region of savanna and grasslands in the northeast of the study region.

The results highlight the potential for air quality impacts from the biogenic and pyrogenic emissions and their interactions that differ seasonally and regionally, and illustrates how land cover and land use change exerts a strong control on isoprene and nitrogen dioxide concentrations over remote regions.

How to cite: Sands, E., Pope, R., Doherty, R., O'Connor, F., Wilson, C., and Pumphrey, H.: Using satellite observations to examine the role of land cover and fires in driving atmospheric composition over the southern Amazon, EGU General Assembly 2024, Vienna, Austria, 14–19 Apr 2024, EGU24-8299, https://doi.org/10.5194/egusphere-egu24-8299, 2024.

EGU24-8314 | ECS | Posters on site | AS3.30

Sensitivity tests for improved retrievals of SO2 plume height from TROPOMI observations 

Lorenzo Fabris, Nicolas Theys, Lieven Clarisse, Hugues Brenot, Huan Yu, Jeroen van Gent, Jonas Vlietinck, and Michel Van Roozendael

Sulfur dioxide (SO2), emitted from volcanic eruptions, can have a major impact on the environment and society. While nadir-viewing satellites have been providing precise information on its Vertical Column Density (VCD) for several decades, the retrieval of its Layer Height (LH) is a more recent development, although it is important for the aviation safety, estimation of SO2 emissions, understanding of volcanic processes and climate research. In the Ultraviolet (UV), the current algorithms are often time-consuming and still lack sensitivity, especially in the presence of aerosols. 


Our research aims at developing an improved SO2 LH (and VCD) retrieval algorithm for the TROPOspheric Monitoring Instrument (TROPOMI). While the third spectral band of TROPOMI is traditionally used for sulfur dioxide, a shorter UV region has been exploited here to take advantage of the strong absorption of SO2 in the second band. As a demonstration case, Slant Column Density (SCD) retrievals in band 2 were carried out using the Covariance-Based Retrieval Algorithm (COBRA) [1]. We show that SO2 SCDs from both spectral bands are generally in excellent agreement. However, the results in band 2 reveal a greater sensitivity to SO2 than in band 3.

Motivated by this result, we performed SO2 plume height retrievals on an extensive set of synthetic spectra representative of TROPOMI observation conditions, using the Look-Up Tables Covariance-Based Retrieval Algorithm (LUT-COBRA) [2]. The SO2 LHs and VCDs we find from the second band are more accurate, and the associated retrieval errors appear to be considerably reduced in comparison to those of the band 3.

In addition, sensitivity analyses were conducted to further characterise the wavelength dependence and effect of some observation conditions on the quality of these retrievals. More specifically, we assess the impact of the temperature, air density, ozone profile and VCD, SO2 absorption cross sections, surface albedo and height as well as the SO2 profile shape. 

Finally, we present the next steps to further develop the LUT-COBRA approach and application to TROPOMI band 2 measurements. 


[1] N. Theys et al. Atmospheric Chemistry and Physics, 21(22):16727–16744, 2021.
[2] N. Theys et al. Atmospheric Measurement Techniques, 15(16):4801–4817, 2022.

How to cite: Fabris, L., Theys, N., Clarisse, L., Brenot, H., Yu, H., van Gent, J., Vlietinck, J., and Van Roozendael, M.: Sensitivity tests for improved retrievals of SO2 plume height from TROPOMI observations, EGU General Assembly 2024, Vienna, Austria, 14–19 Apr 2024, EGU24-8314, https://doi.org/10.5194/egusphere-egu24-8314, 2024.

Lightning is the dominant source of nitrogen oxides (NOx) in the free troposphere. Yet, its representation in models is highly parameterised, limiting our ability to determine past and future changes in lightning NOx and causing errors in model representation of tropospheric ozone and NOx. Models such as GEOS-Chem use fixed lightning NOx production rates constrained with historic satellite instrument observations of ozone. A new approach is to model NOx production per flash (mol N fl-1) using lightning energy dependent NOx yields and lightning flash radiant energy data from the space-based lightning imaging sensor (LIS) aboard both the Tropical Rainfall Measuring Mission (TRMM) satellite and the International Space Station (ISS). This updated approach is then used in GEOS-Chem to compute total lightning NOx yields through the Harmonized Emissions Component (HEMCO), rather than using fixed values. The updated annual lightning NOx emissions total 6.5 Tg N, similar to the original parameterised representation (5.8 Tg N), but with much greater variability in NOx production rates. The original implementation uses 260 mol N fl-1 everywhere except the northern extratropics that are at 500 mol fl-1. In the updated implementation, values range from 27 to 632 mol N fl-1 over the ocean and from 66 to 482 mol N fl-1 over land. Greater values over the ocean are due to oft-reported much more energetic maritime lightning. To test the effect on tropospheric ozone and NOx, we are currently comparing seasonal mean GEOS-Chem and TROPOMI-derived vertical profiles of ozone and NO2. The TROPOMI-derived values, obtained by cloud-slicing partial columns over optically thick clouds, we have previously evaluated to be consistent with NASA DC-8 aircraft measurements in the free troposphere for cloud-sliced NO2 (differences < 20 pptv) and the global ozonesonde network for cloud-sliced ozone across the whole troposphere (differences < 35 ppbv). This offers the means to assess the representation of lightning NOx and better understand its influence on tropospheric NOx and ozone.

How to cite: Horner, R., Marais, E., and Wei, N.: Improved lightning NOx emission inventory evaluated with vertical profiles of NO2 and ozone obtained by cloud-slicing TROPOMI  , EGU General Assembly 2024, Vienna, Austria, 14–19 Apr 2024, EGU24-8441, https://doi.org/10.5194/egusphere-egu24-8441, 2024.

EGU24-8487 | ECS | Posters on site | AS3.30

SO2 emissions in India derived from TROPOMI observations using the flux-divergence method and local SO2 lifetimes. 

Yutao Chen, Ronald van der A, Jieying Ding, Henk Eskes, Jason Williams, Thanos Tsikerdekis, and Pieternel Levelt

This study aims to constrain SO2 emissions during 2018-2023 from satellite measurements by utilizing an improved flux-divergence method and estimated local monthly averaged SO2 lifetimes. The local SO2 lifetime incorporating SO2 chemical loss and dry deposition is calculated to derive the sink term of SO2. The derived SO2 lifetime in India shows seasonality, with longer lifetime (19 hours on average) in winter and shorter lifetime (12 hours on average) in summer. The inclusion of this non-constant lifetime improves the precision of estimating Indian SO2 emissions when compared to calculations using a constant SO2 lifetime. Our implementation of the divergence method improves its spatial resolution. With this improvement on the resolution, the smoothing of the source locations is mitigated.  Finally, the annual total SO2 emissions of India is estimated to be 6.5 Tg year-1, which is in the middle of the range of emissions of previous inventories.  Opposite to the continue increasing trend anticipated in previous studies, the SO2 emissions first decreased in 2020, while increasing in 2021 to 2023. The lower emissions in 2020 might be a result of the COVID-19 quarantine measures.

How to cite: Chen, Y., van der A, R., Ding, J., Eskes, H., Williams, J., Tsikerdekis, T., and Levelt, P.: SO2 emissions in India derived from TROPOMI observations using the flux-divergence method and local SO2 lifetimes., EGU General Assembly 2024, Vienna, Austria, 14–19 Apr 2024, EGU24-8487, https://doi.org/10.5194/egusphere-egu24-8487, 2024.

EGU24-9075 | ECS | Posters on site | AS3.30

Retrieval of vertical concentration profiles of SO2 using the IASI satellite instrument 

Nga Ying Lo, Matthias Schneider, Kanwal Shahzadi, Frank Hase, Peter Braesicke, René Caspart, and Achim Streit

The development of MUSICA IASI processing was initiated as part of the MUSICA (Multi-platform remote Sensing of Isotopologues for investigating the Cycle of Atmospheric water) project funded by the European Research Council. This processor works with IASI (Infrared Atmospheric Sounding Interferometer) radiances measured under cloud-free conditions, and, using optimal estimation, derives vertical distributions of water vapor, ratios between water vapor isotopologues, and several trace gases including greenhouse gases, methane and nitrous oxide. In accordance with the FAIR (findable, accessible, interoperable, reusable) principles, all MUSICA IASI products are freely available together with their observation specific averaging kernels and uncertainty covariances. Recently, retrievals of sulfur dioxide (SO2), peroxyacetyl nitrate (PAN), acetic acid and acetone have been included, in order to account for their important spectroscopic signals in case of volcanic eruptions and biomass burning events, respectively. 


Here, we present the MUSICA IASI SO2 retrieval setup. A particularity is the use of a logarithmic SO2 concentration scale, which facilitates a reliable detection of the altitude where the SO2 plume is situated (retrieved from the spectral signal, no a priori assumptions of an SO2 plume height required). We document the superiority of this retrieval setup compared to a retrieval on a linear SO2 concentration scale. In addition, we empirically demonstrate the quality of the SO2 profile data in the preliminary results of three different volcano eruption events at three different latitude regions: 2019 Raikoke (48°N), 2021 La Palma (Cumbre Vieja, 29°N), and 2022 Hunga Tonga-Hunga Ha’apai (20°S). The amount of SO2 and the SO2 plume height are different for the three events. We show that the MUSICA IASI product is able to correctly capture these differences.


The availability of individual averaging kernels allows a quantitative inter-comparison to other SO2 data products. For SO2 plumes in the low and middle troposphere, we will explore respective comparison possibilities to data obtained from Ticosonde in-situ measurements. For SO2 plumes in the upper troposphere or stratosphere, we plan to use data provided by MLS (Microwave Limb Sounder instrument aboard the NASA/Aura satellite). IASI SO2 products generated by other processors and TROPOMI/S5P SO2 products will also be potential candidates for inter-comparison studies.

How to cite: Lo, N. Y., Schneider, M., Shahzadi, K., Hase, F., Braesicke, P., Caspart, R., and Streit, A.: Retrieval of vertical concentration profiles of SO2 using the IASI satellite instrument, EGU General Assembly 2024, Vienna, Austria, 14–19 Apr 2024, EGU24-9075, https://doi.org/10.5194/egusphere-egu24-9075, 2024.

EGU24-9121 | Orals | AS3.30

High-resolution satellite measurements of NO2 and CO2 in power plant plumes 

Thomas Wagner, Steffen Beirle, and Christian Borger

The Environmental Mapping and Analysis Program (EnMAP) satellite is a hyperspectral satellite instrument for the monitoring of terrestrial and aquatic ecosystems. It provides high spatial resolution (30 x 30 m²) but relatively low spectral resolution (~6.5 nm FWHM in the visible to near-infrared spectral range and ~10 nm FWHM in the shortwave IR spectral range). Although the spectral information of ENMAP observations is limited, it is possible to analyse the atmospheric NO2 and CO2 contents from ENMAP spectra for strong emission plumes using differential optical absorption spectroscopy. While the CO2 signal is close to the detection limit, the evolution of the downward NO2 plumes from power plants can be well quantified.

We present the spectral analyses of both trace gases and show measurement results for power plant plumes from Riyadh in Saudi Arabia and the Highveld in South Africa. We compare the ENMAP NO2 results to observations from the TROPOMI satellite instrument and aircraft measurements. Our results show that ENMAP NO2 and CO2 measurements can be used to study the chemical and dynamical evolution of power plant plumes. For example, the conversion of NO to NO2 can be quantified, or turbulence elements of the plumes can be clearly identified. The simultaneous observation of NO2 and CO2 might also allow the characterization of different power plants by their emission ratio. Due to the high spatial resolution of ENMAP also plumes from nearby power plants with distances of only a few hundred meters can be separated. 

How to cite: Wagner, T., Beirle, S., and Borger, C.: High-resolution satellite measurements of NO2 and CO2 in power plant plumes, EGU General Assembly 2024, Vienna, Austria, 14–19 Apr 2024, EGU24-9121, https://doi.org/10.5194/egusphere-egu24-9121, 2024.

EGU24-9164 | ECS | Orals | AS3.30

Validation of the CrIS, IASI, AIRS and GOSAT-NH3 products  

Enrico Dammers and the FTIR-NH3 and satellite NH3 product teams

Ammonia (NH3) is an essential form of reactive nitrogen whose emissions originate primarily from manure and fertilizer. Atmospheric ammonia is a major precursor of anthropogenic aerosols, for example ammonium nitrate, and negatively impacts both human and ecosystem health. While important, the overall budget of ammonia remains highly uncertain, as in-situ measurements of ammonia are still sparse and typically only provide a very coarse spatial-temporal coverage. Satellite ammonia observations provide a tool to study the budget in detail, however NH3 satellite products validation studies are challenging due to the small scale spatiotemporal variability of atmospheric ammonia. Furthermore, the validation studies typically only focus on a single satellite product and/or comparison to in-situ surface concentrations. This limits such studies to more of an evaluation on how well a satellite represents a surface point measurement instead of validating the satellite vertical sounding (e.g. profile and total column) observations. The ground-based Fourier Transform infrared (FTIR)-NH3 product is an excellent dataset that can more directly evaluate the satellite column and profile type products as it shares a similar sounding measurement. Here we present an update to the FTIR-NH3 record, which includes an extension in both the number of sites as well as the observation period of these stations. Furthermore, we present the latest evaluation and intercomparison results for the most current CrIS (1, and 2), IASI(-A, -B and -C), AIRS and GOSAT(1) ammonia products.

How to cite: Dammers, E. and the FTIR-NH3 and satellite NH3 product teams: Validation of the CrIS, IASI, AIRS and GOSAT-NH3 products , EGU General Assembly 2024, Vienna, Austria, 14–19 Apr 2024, EGU24-9164, https://doi.org/10.5194/egusphere-egu24-9164, 2024.

EGU24-9814 | ECS | Posters on site | AS3.30

Towards retrieval of CO from MTG-IRS in the Fourier space with IASI as a demonstrator    

Nejla Eco, Sébastien Payan, and Laurence Croizé

On board of MetOp satellite series is Infrared Atmospheric Sounding Interferometer (IASI), a Fourier Transform, Michelson-based spectrometer which aims to provide a high-resolution atmospheric emission spectrum to derive temperature and humidity profiles with high spectral resolution. Having been operational since 2006, this spectrometer has been exploited for numerous research articles and can serve as a reliable reference instrument. We will use IASI archive to test the retrieval approach in the Fourier space which we believe is well suited for analysis of a large set of spectra to be recorded by next generation spatial tropospheric sounder as MTG-IRS.   

The technique of partially scanned interferograms applied to the retrieval of trace gases from the IASI was rarely used. However, there exist works that indicate the potential of this methodology for the specific cases of CO, CO2, CH4 and N2O that should allow us to retrieve trace gases column abundances at an unprecedented accuracy and at the level of the single IASI footprint. As IASI interferograms are not available, we must transform the IASI spectra back to the interferogram domain and identify regions sensitive to the single gas species. The retrieval is then performed using Least Squares estimation to these small segments of interferometric radiances. The expected advantage to the usual methods (retrieval in the spectral domain) is an efficient use of the information contained in all the IASI channels that are available in the absorption bands of a specific gas species. We will present the first step of our study on the retrieval of CO from partial interferogram of IASI observations. More specifically, the set of simulations of IASI interferograms that will be noised and then used for CO retrievals.

The simulation of IASI spectra, was performed using LATMOS Atmospheric Retrieval Algorithm (LARA), a robust and affirmed radiative transfer model. [Segonne at al., 2021] LARA was conjoined with the TIGR, a climatological library of atmospheric situations representing the Earth’s atmosphere called the Thermodynamic Initial Guess Retrieval (TIGR). [Chédin et al., 1985]. Each atmospheric situation is described by values of temperature, water vapor and ozone concentrations for a given pressure grid, from the ground surface to the TOA (top of the atmosphere). This case study includes all of the 2311 TIGR profiles available. Furthermore, the study considers carbon monoxide, a trace gas crucial for understanding both the air quality and climate forcing. Carbon monoxide typically appears in the range of 2050 to 2350 cm-1 wavenumber, with its characteristic “comb” shaped absorption signature. [Serio et al.,2012]The simulations are performed for surface temperatures ranging from -15 to 15 K in steps of 5 K from the base surface temperature, to explore the impact of thermal contrast. [Baudin et al., 2016]. Expected are number of radiance simulations in the CO-corresponding wavelength range, obtained by using LARA. Finally, FFT (Fast Fourier Transform) of simulated radiances are generated, leading to a 130 000 spectra interferogram dataset on which statistical analysis of CO signatures will be presented. If applicable, first full CO retrieval from the dataset should be presented.

How to cite: Eco, N., Payan, S., and Croizé, L.: Towards retrieval of CO from MTG-IRS in the Fourier space with IASI as a demonstrator   , EGU General Assembly 2024, Vienna, Austria, 14–19 Apr 2024, EGU24-9814, https://doi.org/10.5194/egusphere-egu24-9814, 2024.

EGU24-10410 | ECS | Posters on site | AS3.30

Assessing the future IRS-MTG NH3 and temperature observations 

Nadir Guendouz, Camille Viatte, Anne Boynard, Sarah Safieddine, Carsten Standfuss, Solène Turquety, Martin Van Damme, Lieven Clarisse, Pierre Coheur, Raymond Armante, Pascal Prunet, and Cathy Clerbaux

Ammonia (NH3) is an atmospheric pollutant mainly emitted by the agricultural sector, which has an effect on public health since it is a precursor of fine particles (PM2.5). The diurnal variability of NH3 in the atmosphere and its transformation into particles are poorly constrained and strongly depend on meteorological parameters, in particular temperature. This strongly influences our ability to correctly simulate NH3 emissions and associated particulate pollution events in atmospheric models

The IRS (InfraRed Sounder) instrument which will be launched on the MTG (Meteosat Third Generation) satellite into geostationary orbit in late 2024, will offer the ability to evaluate NH3 diurnal variabilities and its dependence on atmospheric temperature with frequent measurements (every 30-45 minutes over Europe and Africa) and fine spatial resolution (4 km x 4 km at the Equator and Greenwich meridian).

This work shows the potential of the European geostationary IRS-MTG mission to capture the spatio-temporal variability of ammonia and temperature focusing on a case study over the Brittany region in France. Synthetic spectra are simulated from the 4A/OP radiative transfer model using atmospheric states derived from the CHIMERE chemistry-transport model. The IRS NH3 observations are compared to the current IASI observations in terms of vertical sensitivity and error budget. The uncertainty analysis over the Brittany region is calculated using NH3 Jacobians computed from the 4A/OP radiative code and the noise covariance matrix provided by each satellite.

How to cite: Guendouz, N., Viatte, C., Boynard, A., Safieddine, S., Standfuss, C., Turquety, S., Van Damme, M., Clarisse, L., Coheur, P., Armante, R., Prunet, P., and Clerbaux, C.: Assessing the future IRS-MTG NH3 and temperature observations, EGU General Assembly 2024, Vienna, Austria, 14–19 Apr 2024, EGU24-10410, https://doi.org/10.5194/egusphere-egu24-10410, 2024.

EGU24-10413 | ECS | Posters on site | AS3.30

The November 2023 severe pollution episode in Pakistan and Northern India  

Selviga Sinnathamby, Sarah Safieddine, Camille Viatte, Juliette Hadji-Lazaro, Maya George, PIerre Coheur, Lieven Clarisse, Martin Van Damme, and Cathy Clerbaux

South Asia, with its high population density supported by thriving industrial and agricultural sectors, is one of the most polluted region in the world. In early November 2023, the region along the Himalayas, the Indo-Gangetic Plain (IGP), experienced a severe air pollution episode that affected visibility over several thousand kilometers and impacted millions of inhabitants.

Here we use a variety of measurements and datasets to attempt to untangle the reasons behind the formation and the buildup of this pollution episode. Using IASI (Infrared Atmospheric Sounding Interferometer) measurements, embarked on board of the Metop satellites, we find exceptionnally high concentrations of carbon monoxide (CO) and ammonia (NH3) in the Northwestern states of IGP. Fire satellite measurements from MODIS (Terra and Aqua) and VIIRS (Suomi-NPP and NOAA-20) show that CO is mainly emitted from agricultural waste burning, prevalent at the post-monsoon season. NH3 primarily emanated from extensive applications of nitrogenous fertilizers, as well as fires, contributing to the formation of fine particulate matter (PM2.5) in the region and degrading the air quality as seen by local air quality stations. ERA5 reanalysis unveiled that these high concentrations of pollutants and their buildup was favored by meteorological conditions that resulted in air mass stagnation, facilitating the accumulation of pollutants in the region.

This study builds a framework to demonstrate the potential of using satellite instruments data, in situ measurements, and reanalysis combined to understand the formation and the progression of air pollution episodes in South Asia.

How to cite: Sinnathamby, S., Safieddine, S., Viatte, C., Hadji-Lazaro, J., George, M., Coheur, P., Clarisse, L., Van Damme, M., and Clerbaux, C.: The November 2023 severe pollution episode in Pakistan and Northern India , EGU General Assembly 2024, Vienna, Austria, 14–19 Apr 2024, EGU24-10413, https://doi.org/10.5194/egusphere-egu24-10413, 2024.

EGU24-10777 | ECS | Posters on site | AS3.30

Comparison of inversions of global methane emissions using TM5-MP/4DVAR with TROPOMI measurements 

Santiago Parraguez Cerda, Johann Rasmus Nüß, Nikos Daskalakis, Oliver Schneising, Michael Buchwitz, Mihalis Vrekoussis, and Maria Kanakidou

Methane (CH4) is an important greenhouse gas (GHG), contributing about ~23% (0.62 W m-2) of the additional radiative forcing on the troposphere due to its increased concentrations compared to pre-industrial levels. Mainly, anthropogenic sources of CH4 are agriculture, livestock farming, fossil fuels and biomass burning. Further, natural sources are primarily wetlands, while minor ones are oceans, termites, wild animals and permafrost. There are persistent uncertainties regarding the sources of CH4 due to limited knowledge of the processes underlying them, leading to inconsistencies between top-down and bottom-up estimates. It is relevant to reduce these uncertainties and accurately assess CH4 emissions as it is meaningful for atmospheric modelling, climate change estimations, and policy making. Higher resolution and lower uncertainty data can benefit assimilation systems, thus increasing confidence in estimates of emission sources.

This work aims to assimilate high-resolution data from satellite observations and measurements obtained from surface stations to optimize global methane emission fields. We evaluate differences resulting from the assimilation of satellite observations at varying resolutions. Additionally, we compare different setups of the assimilation framework, using varied combinations of satellite and surface measurements, to assess potential discrepancies in the resulting emissions. The modelling framework is based on the TM5-MP (massive parallel) atmospheric chemistry-transport model, utilizing its adjoint in a four-dimensional (4DVAR) data assimilation system. Our study aims to constrain global CH4 emissions first at a spatial resolution of 3° × 2° (longitude × latitude) for 2018 and then increase the resolution to 1° × 1°. The tropospheric CH4 mixing ratio product slated for assimilation is acquired by the TROPOMI instrument onboard the satellite Sentinel 5-P, and retrieved using the weighting function modified differential optical absorption spectroscopy (WFMD-IUP) algorithm. This product offers enhanced coverage, especially over higher latitudes, and reduced uncertainty compared to the operational product. Conversely, near-surface CH4 measurements are obtained from stations within the global NOAA network. Preliminary results suggest a relevant role of both the resolution of the satellite instrument and the type of data assimilated regarding convergence and final results.

How to cite: Parraguez Cerda, S., Nüß, J. R., Daskalakis, N., Schneising, O., Buchwitz, M., Vrekoussis, M., and Kanakidou, M.: Comparison of inversions of global methane emissions using TM5-MP/4DVAR with TROPOMI measurements, EGU General Assembly 2024, Vienna, Austria, 14–19 Apr 2024, EGU24-10777, https://doi.org/10.5194/egusphere-egu24-10777, 2024.

EGU24-10779 | ECS | Orals | AS3.30

Comparing space-based to reported carbon monoxide emission estimates for Europe’s iron and steel plants. 

Gijs Leguijt, Joannes D. Maasakkers, Hugo A.C. Denier van der Gon, Arjo J. Segers, Tobias Borsdorff, and Ilse Aben

Carbon monoxide (CO) is an air pollutant that plays an important role in atmospheric chemistry and its emissions can serve as a proxy for CO2emissions. Within the European Union, large industrial emitters are required to report their annual facility-level emissions to the European Pollutant Release and Transfer Register (E-PRTR) based on stack measurements or calculations. We use TROPOMI satellite observations of carbon monoxide concentrations to estimate the emissions and compare these to the E-PRTR reports. Since 2018, the TROPOMI satellite instrument observes carbon monoxide concentrations at a resolution down to 5.5x7 km2with daily global coverage. CO plumes from large iron and steel plants are clearly visible in the TROPOMI data, enabling us to estimate the plants’ annual emissions. To achieve this, we perform high-resolution atmospheric transport simulations with the WRF model for 2019 over the 21 highest emitting iron and steel plants in Europe. We combine the simulations with TROPOMI observed concentrations in an analytical inversion to estimate the annual emission rates of the individual plants using the E-PRTR emissions as prior estimates. The TROPOMI-based emission estimates generally agree well with the reported emission rates (R2 = 0.87) while showing limited sensitivity to the prior emission estimate. For 10 out of 21 plants the reported and TROPOMI-estimated emission rates agree within 20% whereas 6 plants show discrepancies over 40%. For the plants with the largest emissions, we perform an additional emission quantification using the Cross-Sectional Flux (CSF) method, which does not use any prior knowledge. These CSF estimates are consistent with the inversions, providing additional confidence in the space-based emission estimates. For two plants for which the 2019 inversion-based emission estimates are significantly different from the reported emission rates, we extend our analysis to 2020. The inversion estimates for 2020 agree with those from 2019 and match with reported emissions for 2020, raising questions on reported emissions for 2019. Our work shows that we can use the TROPOMI observations to reliably estimate CO emissions from large iron and steel plants and how these analyses can be used to identify uncertainties in reported emissions.

How to cite: Leguijt, G., Maasakkers, J. D., Denier van der Gon, H. A. C., Segers, A. J., Borsdorff, T., and Aben, I.: Comparing space-based to reported carbon monoxide emission estimates for Europe’s iron and steel plants., EGU General Assembly 2024, Vienna, Austria, 14–19 Apr 2024, EGU24-10779, https://doi.org/10.5194/egusphere-egu24-10779, 2024.

EGU24-10888 | Posters on site | AS3.30

Evaluating trends using TROPOMI and OMI aerosol index 

Deborah Claire Stein Zweers, Maarten Sneep, and Martin de Graaf

With more than 5 years of operational aerosol index data from the TROPOMI instrument onboard the Sentinel 5-precursor (S5P), the seasonal cycle can be characterized and trends in global aerosol index can be investigated in more depth. Positive values of the aerosol index are driven by strong emission and transport events of ultraviolet (UV) absobring aerosols including desert dust outbreaks, biomass burning smoke, and volcanic ash eruptions. Near-zero values of the aerosol index however can also be useful to understand the dependency and sensitivity of calculated reflectances on precision and nature of the calibration of the instrument. Since the reprocessing of the dataset carried out in 2023, the largest effects of observed degradation in radiance and irradiance have been well characterized and are removed. A discussion will be presented addressing the delineation of variability due to changes in the global emission of absorbing aerosols as well as observed and characterized changes in insturment sensitivity and calibration.  As a comparison the soon-to-be released OMI aerosol index data (Collection 4) extending back to 2004 will be appended to lend additional insights about long-term variability seasonal variability of UV-absorbing aerosol presence. 

How to cite: Stein Zweers, D. C., Sneep, M., and de Graaf, M.: Evaluating trends using TROPOMI and OMI aerosol index, EGU General Assembly 2024, Vienna, Austria, 14–19 Apr 2024, EGU24-10888, https://doi.org/10.5194/egusphere-egu24-10888, 2024.

EGU24-10955 | ECS | Orals | AS3.30

Deriving NOx emissions of cities in Africa using the space-based TROPOMI instrument 

Nana Wei, Eloise A. Marais, and Gongda Lu

Surface concentrations of nitrogen oxides (NOx) are increasing at rates of up 10% per year in cities in Africa, as inferred with trends in long-term satellite observations of tropospheric columns of nitrogen dioxide (NO2). This is being driven by rapid population growth and urbanization in the absence of air quality policies. Models needed to inform air quality policies use out-of-date inventories for cities in Africa due to absence of detailed temporal and spatial information about emission and activity factors of sources unique to African cities. Here we apply a recently improved method of deriving city NOx emissions from satellite observations of NO2 that builds on the well-established rotation of each city NO2 plume along a consistent direction and selecting a single sampling area around the city centre to fit a modified Gaussian to calculate emissions. The improved method uses a more efficient fit routine and multiple sampling areas to eliminate subjective area selection and increase the success of deriving annual emissions from ~50% to 100%. Such an approach is ideal for African cities that have wide-ranging sizes due to the different development stages of countries and urban centres in Africa. Work is underway to quantify NOx emissions for more cities in Africa than has been achieved with global studies using 2019 observations of NO2 from the TROPOspheric Monitoring Instrument (TROPOMI). The resultant NOx emissions will then be compared to emissions estimates from widely used global (EDGAR, CEDS, HTAP) and regional (DACCIWA, DICE-Africa) inventories to assess shortcomings in inventories and the influence of these on designing evidence-based air quality policies and regulations.

How to cite: Wei, N., Marais, E. A., and Lu, G.: Deriving NOx emissions of cities in Africa using the space-based TROPOMI instrument, EGU General Assembly 2024, Vienna, Austria, 14–19 Apr 2024, EGU24-10955, https://doi.org/10.5194/egusphere-egu24-10955, 2024.

EGU24-11316 | ECS | Posters on site | AS3.30

Extension of the S5P/TROPOMI CCD tropospheric ozone retrieval to middle latitudes 

Swathi Maratt Satheesan, Kai-Uwe Eichmann, and Mark Weber

Tropospheric ozone, a critical pollutant and greenhouse gas, exhibits spatio-temporal variability, challenging satellite observations. Existing methods like the Convective Cloud Differential (CCD) and Cloud Slicing Algorithms (CSA) are standard for Tropospheric Column Ozone (TCO) retrieval but are limited to the tropics (20°S-20°N). Notably, the CCD approach has proven successful with satellite sensors like Aura OMI, MetOp GOME-2, and Sentinel-5 Precursor TROPOMI.

In this study, we present the first successful application of CCD retrieval outside the tropical region. We introduce CHORA-CCD (Cloud Height Ozone Reference Algorithm-CCD) for retrieving TCO from TROPOMI in middle latitudes. It utilises a local cloud reference sector (CLCD, CHORA-CCD Local Cloud Decision) to determine the stratospheric (above cloud) column (ACCO) ozone.  This ACCO is later subtracted from the total column in clear-sky scenes to determine the TCO. The new approach minimises the impact of variances in stratospheric ozone.

An iterative approach is used to automatically select an optimal local cloud reference sector around each retrieval grid point, varying the radius from 60 to a maximum of 600 km around the grid box, for which a mean TCO is determined until a sufficient number of ground pixels with nearly fill cloud cover are found. Due to the prevalence of low-level clouds in middle latitudes, the estimation of TCO is constrained to the column up to a  reference altitude of 450 hPa.  An alternative method is introduced to directly estimate the ACCO down to 450 hPa by Theil-Sen regression in cases where the cloud-top heights in the local cloud sector are variable. The algorithm dynamically decides between CCD and Theil-Sen method for ACCO estimation by analysing the cloud characteristics. The CLCD algorithm is further refined by introducing a homogeneity criterion for total ozone to overcome inhomogeneities in stratospheric ozone.

Monthly averaged CLCD-TCOs have been determined over the middle latitudes (60◦S-60◦N) from TROPOMI for the time period from 2018 to 2022. The accuracy of the method was investigated by comparisons with spatially collocated SHADOZ/WOUDC/NDACC ozonesondes from thirty-one stations. The validation results reveal that TCO retrievals at 450 hPa using the CLCD algorithm exhibit good agreement with ozonesondes at most stations. At the tropical station Natal (5.4°S, 35.4°W), there is an outstanding agreement between CLCD and ozonesondes, showcasing minimal bias and scatter (0.3 ± 1.0 DU). Similarly, in the subtropics over Irene (25.9°S, 28.2°E), CLCD exhibits a significantly lower bias and scatter (0.0 ± 1.4 DU). Specifically, at one of the northernmost stations, Legionowo (52.4°N, 21°E), bias and dispersion are minimal (0.4 ± 2.2 DU). Across all stations, the maximum observed bias and dispersion are below around 5 DU and 4 DU, respectively. 

In this presentation, a detailed validation of the new local CCD retrievals will be given, underlining the advantage of using the local cloud reference sector in the middle latitudes, providing an important basis for subsequent systematic applications in current and future missions of geostationary satellites.

How to cite: Maratt Satheesan, S., Eichmann, K.-U., and Weber, M.: Extension of the S5P/TROPOMI CCD tropospheric ozone retrieval to middle latitudes, EGU General Assembly 2024, Vienna, Austria, 14–19 Apr 2024, EGU24-11316, https://doi.org/10.5194/egusphere-egu24-11316, 2024.

EGU24-11354 | Posters on site | AS3.30

Regularization scheme in ALTIUS retrieval algorithms 

Antonin Berthelot, Noel Baker, Philippe Demoulin, Ghislain Franssens, Didier Fussen, Pierre Gramme, Nina Mateshvili, Didier Pieroux, Sotiris Sotiriadis, and Emmanuel Dekemper

ALTIUS (Atmospheric Limb Tracker for the Investigation of the Upcoming Stratosphere) is an atmospheric limb mission being implemented in ESA's Earth Watch programme and planned for launch in 2026.

The instrument consists of three imagers: UV (250-355 nm), VIS (440-675 nm) and NIR (600-1040 nm) channels. Each channel is able to take a snapshot of the scene independently of the other two channels, at a desired wavelength and with the requested acquisition time. The agility of ALTIUS allows for series of high vertical resolution observations at wavelengths carefully chosen to retrieve the vertical profiles of species of interest.

ALTIUS will perform measurements in different geometries to maximize global coverage: observing limb-scattered solar light in the dayside, solar occultations at the terminator, and stellar, lunar, and planetary occultations in the nightside. The primary objective of the mission is to measure high-resolution stratospheric ozone concentration profiles. Secondary objectives are the retrieval of mesospheric ozone, stratospheric aerosols particle density and extinction coefficient, NO2, NO3, BrO, OClO, water vapor and temperature profiles.

The Level-2 retrievals use a Levenberg-Marquardt algorithm coupled to a Tikhonov regularization scheme to limit noise amplification during the inversion process. The type and strength of regularization has a direct effect on the retrieved profile vertical resolution. Therefore, a trade-off has to be found between noise removal amplitude and vertical resolution. A study on the different regularization constraint types is performed and the regularization strength is determined using the retrieval noise error in stellar occultation mode for O3 and NO2 density and aerosol extinction retrievals. The ability of Tikhonov regularization to remove the effects of scintillation on the retrieved profiles is discussed. Moreover, a re-processing of GOMOS data is performed to test the validity of our approach.

How to cite: Berthelot, A., Baker, N., Demoulin, P., Franssens, G., Fussen, D., Gramme, P., Mateshvili, N., Pieroux, D., Sotiriadis, S., and Dekemper, E.: Regularization scheme in ALTIUS retrieval algorithms, EGU General Assembly 2024, Vienna, Austria, 14–19 Apr 2024, EGU24-11354, https://doi.org/10.5194/egusphere-egu24-11354, 2024.

EGU24-13764 | ECS | Posters on site | AS3.30

Comparison between Sentinel 5P and WRF-CHEM long-term simulations: An analysis based on TROPOMI HCHO data over São Paulo, Brazil within the BIOMASP+ project 

Daniel Zacharias, Arthur Freitas, Agnès Borbon, Rita Ynoue, and Adalgiza Fornaro

BIOMASP+: Biogenic Volatile Organic Compounds in the Metropolitan Area of São Paulo (MASP) is a collaboration project among different French and Brazilian institutions to investigate the critical role of the biosphere-atmosphere interactions on urban pollution conditions and to evaluate how the biogenic volatile organic compounds (BVOC) affect the secondary pollutant formation.

Formaldehyde (HCHO) is the most abundant atmospheric carbonyl compound and a photochemical oxidation product of VOCs from several anthropogenic and natural sources [1]. Over São Paulo state (SP), HCHO arises from complex atmospheric interactions between a large urban area with 15 million of vehicles using four different fuel types, several industries, an extensive Atlantic Rainforest (3.9 104 km2), biomass burning and thousands of farms that cover 40% (2.5 105 km2) of the SP area [2]. The Metropolitan Area of São Paulo (MASP) is a highly polluted megacity [3], with concentrations that often exceed the World Health Organization guidelines, particularly for ozone and PM2.5, which are produced by photochemical reactions, such as the formaldehyde.

Vertical formaldehyde columns data (mol/m²) were obtained from the TROPOspheric Monitoring Instrument (TROPOMI) spectrometer onboard the Sentinel-5P satellite [2], and used in the WRF-CHEM model performance evaluation. Both, the long-term simulation and the Sentinel-5P data, covered the full 2022-year.

Satellite data confirmed the spatial distribution of HCHO simulated by WRF-CHEM, indicating MASP as the main formaldehyde hotspot in the state of São Paulo [2]. For the HCHO monthly averages, the normalized cross-correlation (i.e., spatial distribution) between model and satellite remains inside the range of: 0.3 < r < 0.6.

Using the satellite time series, it was possible to identify a bias in the HCHO simulated concentrations, that reached up to 80% in 1-year of simulation. This reduced the model's ozone production by up to 60% in the end of simulation. Comparing the simulation results with ozone data from air quality monitoring stations of the state of São Paulo [4], the linear correlation was within the range of 0.4 < r2 < 0.7, while the error was high (RMSE < 46.5).

A long-term (1-year) simulation with WRF-CHEM is quite challenging task [3], however, the TROPOMI data was crucial to identify modeling problems in areas with absence of air quality data, indicating possible adjustments and corrections in the emissions inventories.


[1]        Gao, S., et al., 2021, Atmospheric formaldehyde, glyoxal and their relations to ozone pollution under low- and high-NOx regimes in summertime Shanghai, China, Atmospheric Research, https://doi.org/10.1016/j.atmosres.2021.105635

[2]        Freitas & Fornaro, 2022, Atmospheric Formaldehyde Monitored by TROPOMI Satellite Instrument throughout 2020 over São Paulo State, Brazil, Remote Sensing, https://doi.org/10.3390/rs14133032

[3]        Peralta, A., et al., 2023, Future Ozone Levels Responses to Changes in Meteorological Conditions under RCP 4.5 and RCP 8.5 Scenarios over São Paulo, Brazil., Atmosphere, https://doi.org/10.3390/atmos14040626

[4] CETESB < https://cetesb.sp.gov.br/ar/wp-content/uploads/sites/28/2023/07/Relatorio-de-Qualidade-do-Ar-no-Estado-de-Sao-Paulo-2022.pdf>


Keywords:  BIOMASP; Formaldehyde; TROPOMI; WRF-CHEM

How to cite: Zacharias, D., Freitas, A., Borbon, A., Ynoue, R., and Fornaro, A.: Comparison between Sentinel 5P and WRF-CHEM long-term simulations: An analysis based on TROPOMI HCHO data over São Paulo, Brazil within the BIOMASP+ project, EGU General Assembly 2024, Vienna, Austria, 14–19 Apr 2024, EGU24-13764, https://doi.org/10.5194/egusphere-egu24-13764, 2024.

EGU24-14719 | Posters on site | AS3.30

Integrating EO and Copernicus Atmospheric services into emergency response tools to support flight planning Applications 

Marcus Hirtl, Barbara Scherllin-Pirscher, Marie Danielle Mulder, Christian Maurer, Maximilian Weissinger, Stefano Natali, Ramiro Marco Figuera, Clemens Rendl, Carl-Herbert Rokitansky, Fritz Zobl, Robert Marschallinger, Robert Faber, and Raimund Zopp

Aviation is a vulnerable infrastructure. This is not only true during economic crises such as the COVID-19 pandemic but also during natural hazards, especially airborne ones. Airborne hazards can be detected and observed by Earth Observation (EO) instruments. Most EO sensors that observe air pollutants fly on Sun-synchronous satellites. The strength of these satellites is global coverage and provision of high spatial resolution measurements. Their disadvantage is, that they do not observe high temporal variations of air pollutants. This is a severe limitation for the detection of natural hazards. One solution is to combine observations from Sun-synchronous (e.g., OMI, GOME2, TROPOMI, IASI, OMPS, AIRS) and geostationary (e.g., MSG-SEVIRI for Europe and Africa) instruments.

The Volcanic Ash Advisory Centers (VAACs) are responsible for predicting the dispersion of the volcanic plumes for the aviation sector. In addition, GeoSphere Austria supports the Austrian aviation authority (Austro Control) with information on volcanic ash and SO2 dispersion generated by the GeoSphere Austria emergency response Volcano Tool (GeoSphere Austria-VT). Since dispersion information needs to be available shortly after the eruption, VAACs and GeoSphere Austria forecasts are both based on rough estimates of source term parameters. The usage of near-real-time observations can significantly improve the source terms, and reduce the dispersion uncertainty. The GeoSphere Austria-VT is extended with a dynamic inverse modelling system that provides sequentially updated source terms using satellite data.

Apart from flying through volcanic plumes resulting possibly in a significant hazard, flying through regions with elevated air pollution levels has an impact on engine lifetime, maintenance costs, and fuel consumption. Here, the relevant factor is the cumulative air pollution intake over time. Additional costs associated with maintenance and repair are currently not considered in flight planning. Continuous monitoring, forecasting, and optimizing data integration of air pollutants into atmospheric models has thus two significant advantages: on the one hand, the obvious risk associated with flying through highly polluted air (including volcanic ash and SO2) is reduced, on the other hand, the impact on engine maintenance and fuel costs for airline operators and engine manufacturers is minimized. From the wide range of air pollutants, we will focus on aerosols (volcanic, dust and salt) and SO2, because these are the most relevant air pollutants for the aviation sector.

The aim is to implement a flexible, holistic system that is able to consider both hazardous and non-hazardous air pollution levels. The emphasis is on making extensive use of existing services (SACS, CAMS, VAACs) as well as air quality observations from satellites to extend and improve model applications (GeoSphere Austria-VT). To provide end-users with one comprehensive tool for the analysis and comparison of the air pollutants distribution from selected sources, these products will be available and visualized in one new data platform, exploiting a datacube-like approach to deal with the different spatial and temporal resolutions of the data.

How to cite: Hirtl, M., Scherllin-Pirscher, B., Mulder, M. D., Maurer, C., Weissinger, M., Natali, S., Figuera, R. M., Rendl, C., Rokitansky, C.-H., Zobl, F., Marschallinger, R., Faber, R., and Zopp, R.: Integrating EO and Copernicus Atmospheric services into emergency response tools to support flight planning Applications, EGU General Assembly 2024, Vienna, Austria, 14–19 Apr 2024, EGU24-14719, https://doi.org/10.5194/egusphere-egu24-14719, 2024.

EGU24-15017 | Posters on site | AS3.30

Advanced retrieval of sulfur dioxide from TROPOMI using COBRA 

Nicolas Theys, Jonas Vlietinck, Huan Yu, Isabelle De Smedt, Lorenzo Fabris, Hugues Brenot, Jeroen van Gent, Sander Niemeijer, Fabian Romahn, Pascal Hedelt, Diego Loyola, and Michel Van Roozendael

Owing to its high spatial resolution, the TROPOspheric Monitoring Instrument (TROPOMI) launched in 2017 onboard the Sentinel-5 Precursor (S5P) platform provides important information on global volcanic and anthropogenic SO2 emissions, with an unprecedented level of details.

In a recent study (Theys et al., 2021), we proposed an approach called Covariance-Based Retrieval Algorithm (COBRA), different from the classical Differential Optical Absorption Spectroscopy (DOAS). Application of COBRA to TROPOMI SO2 column retrievals leads to a significant reduction of the retrieval noise and biases as compared to the TROPOMI operational (DOAS-based) SO2 product. COBRA even reveals new emission sources in long-term averaged SO2 maps.

In view of a future operational deployment (planned end 2024), the COBRA SO2 scheme is being implemented as part of the Copernicus S5-P Product Algorithm Laboratory (PAL). In this poster, we give an update of TROPOMI COBRA SO2 results. The latest developments of COBRA S5P-PAL v2 algorithm are presented and discussed. The pre-operational S5P-PAL environment enables a full reprocessing of TROPOMI data. For several examples, we illustrate the COBRA data set for the long-term monitoring of SO2 columns over both anthropogenic and volcanic scenes. Finally, possible future developments of COBRA are discussed.


Theys, N., Fioletov, V., Li, C., De Smedt, I., Lerot, C., McLinden, C., Krotkov, N., Griffin, D., Clarisse, L., Hedelt, P., Loyola, D., Wagner, T., Kumar, V., Innes, A., Ribas, R., Hendrick, F., Vlietinck, J., Brenot, H., and Van Roozendael, M.: A Sulfur Dioxide Covariance-Based Retrieval Algorithm (COBRA): application to TROPOMI reveals new emission sources, Atmos. Chem. Phys., 21, 16727–16744, https://doi.org/10.5194/acp-21-16727-2021, 2021.


How to cite: Theys, N., Vlietinck, J., Yu, H., De Smedt, I., Fabris, L., Brenot, H., van Gent, J., Niemeijer, S., Romahn, F., Hedelt, P., Loyola, D., and Van Roozendael, M.: Advanced retrieval of sulfur dioxide from TROPOMI using COBRA, EGU General Assembly 2024, Vienna, Austria, 14–19 Apr 2024, EGU24-15017, https://doi.org/10.5194/egusphere-egu24-15017, 2024.

EGU24-16562 | ECS | Posters on site | AS3.30

Long-term tropospheric ozone from SCIAMACHY+OMPS and effects of the upper limit definition of the column 

Andrea Orfanoz-Cheuquelaf, Carlo Arosio, Alexei Rozanov, Mark Weber, and John Burrows

About 10% of the total amount of ozone resides in the troposphere, which acts as a potent greenhouse gas. Anthropogenic emissions and biomass burning are the main sources of ozone in the troposphere, and overexposure to this pollutant causes health problems and damages vegetation.

A combination of space-borne limb and nadir measurements in the UV-visible spectral range (so-called limb-nadir matching, LNM) provides valuable information on tropospheric ozone. This study uses data from the SCanning Imaging Absorption spectroMeter for Atmospheric CartograpHY (SCIAMACHY) (2002-2012) and Ozone Mapping and Profiler Suite on board of Suomi National Polar-Orbiting Partnership (OMPS/NPP, since 2012). Both instruments observe the atmosphere in both limb and nadir geometry. Tropospheric ozone columns are retrieved globally by subtracting the stratospheric ozone column calculated from limb observations from the total ozone column derived from the nadir measurements.

Tropospheric ozone retrievals use different upper altitude limits to calculate the tropospheric ozone column. In the case of the LNM technique, the upper limit is defined by the thermal and/or dynamical tropopause. The Convective Clouds Differential technique (CCD) calculates the tropospheric ozone column up to 270 hPa. Phase II of the Tropospheric Ozone Assessment Report (TOAR-II) uses different pressure levels for different latitudes as an upper limit for the tropospheric column.

After updating and improving the SCIAMACHY-LNM and the OMPS/NPP-LNM datasets, we obtained a long-term dataset of tropospheric ozone (2002-2023) by merging them. Here, we present this new long-term LNM tropospheric ozone column dataset, which has been converted to the different definitions of column heights as prescribed in TOAR II. The datasets are validated using ozonesondes, and the results for the different column definitions are evaluated and discussed.

How to cite: Orfanoz-Cheuquelaf, A., Arosio, C., Rozanov, A., Weber, M., and Burrows, J.: Long-term tropospheric ozone from SCIAMACHY+OMPS and effects of the upper limit definition of the column, EGU General Assembly 2024, Vienna, Austria, 14–19 Apr 2024, EGU24-16562, https://doi.org/10.5194/egusphere-egu24-16562, 2024.

EGU24-16869 | ECS | Orals | AS3.30

TROPOMI-based NOx emission estimates of individual ships 

Christoph Rieß, Jasper van Vliet, and Folkert Boersma

Maritime transportation is a substantial contributor to anthropogenic NOx emissions and coastal air pollution. Recognizing this, the International Maritime Organization (IMO) has implemented stricter emission standards for NOx and SO2 in recent years. However, monitoring emissions of sea-bound vessels possesses inherent challenges, prompting the exploration of satellite observations as a promising solution. This study presents a first-ever satellite-based NOx emission inversions for multiple individual ships based on TROPOMI-observed NO2 plumes and AIS data over the Mediterranean Sea in 2019. Our inversion approach accounts for the complex, high-resolution atmospheric dynamics and chemistry that drive the relationship between the NOx emissions and observable NO2 plume. Additionally, we test how an updated Air Mass Factor (AMF) scheme – using high-resolution local plume NO2 profiles from  PARANOX simulations – improves the inversion. For the inversion, we create a large library of pseudo-observations of NO2 plumes with the Gaussian Plume Model PARANOX and test these with the large eddy simulation model MicroHH, which was run with an atmospheric chemistry scheme. The plume dispersion of the two models shows good agreement and the simulated in-plume NO2 differs by only 6%, making PARANOX a suitable (and computational efficient) model choice, especially when considering the large uncertainties related to satellite retrievals above sea.

The PARANOX library shows that background ozone and the effective wind speed determine the relationship between the ship NOx emission strength and the observable NO2 plume: Ozone drives the partitioning of the emitted NOx between NO and (observable) NO2 and the wind speed dictates the mixing and therefore lifetime of NOx in the plume. This explains the frequent occurrence of detectable ship NO2 plumes in the Eastern Mediterranean in summer, when background ozone is high and wind speeds are moderate. We study 130 NO2 plumes of individual ships found in TROPOMI data over the Mediterranean Sea in 2019, most of which are from container ships. In the early afternoon, the observed ships in the Mediterranean Sea emit on average 76g NO2 /s but reaching up to 240 g/s. Finally, these fluxes are compared against both the current IMO emission limits and the requirements for a future Emission Control Area in the Mediterranean Sea.

How to cite: Rieß, C., van Vliet, J., and Boersma, F.: TROPOMI-based NOx emission estimates of individual ships, EGU General Assembly 2024, Vienna, Austria, 14–19 Apr 2024, EGU24-16869, https://doi.org/10.5194/egusphere-egu24-16869, 2024.

EGU24-17309 | Posters on site | AS3.30

Enhancing Environmental Monitoring in Poland: Leveraging Sentinel Satellite Data through the CAMS National Collaboration Programme 

Karol Przeździecki, Joanna Strużewska, Jacek Kamiński, Grzegorz Jeleniewicz, Damian Mochocki, and Marcin Kawka

Copernicus provides a wide variety of services covering different topics, starting from Atmosphere through Marine, Land, Climate Change, Security and Emergency.

Satellite observations on atmospheric composition, complementary to Copernicus Atmosphere Monitoring Service (CAMS), become increasingly available. Unfortunately, analysis or even opening of satellite data in their native formats prove to be challenging in communities other than scientific.

Functionalities, data products, and analysis provided to users on the CAMS website are mainly at the global and European scales. It has been recognized that usage of those services and data they provided by Member States are rather unsatisfactory. Therefore, ECWF prepared CAMS National Collaboration Programmes for member states to improve the uptake of CAMS products at the national, regional and local levels, responding to regulatory needs coming from public administration, NGO's and other interested parties. Institute of Environmental Protection – National Research Institute is responsible for the provision and development of the CAMS National Collaboration Programme for Poland.

We will present the usage of prepared averaged products derived from Sentinel 5P AER AI, Sentinel 5P NO2, and S5P HCHO data in investigating transport episodes connected with wildfires or desert dust over the Polish region. We have investigated data from 2019 to 2023 for both RPRO and OFFL Sentinel 5P products.

We will also discuss the potential usage of other products being tailored and developed during the CAMS NCP Poland project, which have been indicated during the preliminary communication phase via survey  and discussion on 1-st User and stakeholder meeting. The study's outcome would also be important for the HE CAMEO project, where we investigate potential benefits from the assimilation of satellite data to the regional models.

How to cite: Przeździecki, K., Strużewska, J., Kamiński, J., Jeleniewicz, G., Mochocki, D., and Kawka, M.: Enhancing Environmental Monitoring in Poland: Leveraging Sentinel Satellite Data through the CAMS National Collaboration Programme, EGU General Assembly 2024, Vienna, Austria, 14–19 Apr 2024, EGU24-17309, https://doi.org/10.5194/egusphere-egu24-17309, 2024.

EGU24-17891 | Posters on site | AS3.30

Interpretation of Pandora NO2 measurements over Beijing and application to satellite validation 

Gerrit de Leeuw, Ouyang Liu, Zhengqiang Li, Yangyan Lin, Cheng Fan, Ying Zhang, Kaitao Li, Peng Zhang, Yuanyuan Wei, Tianzeng Chen, and Jiantao Dong

A Pandora spectrometer has been installed on the roof of the laboratory building of the Aerospace Information Research Institute of the Chinese Academy of Sciences in the Olympic Park, Beijing, China, in August 2021. The concentrations of trace gases (including NO2, HCHO, O3) measured with Pandora are made available through the open-access Pandora data base (https://data.pandonia-global-network.org/Beijing-RADI/Pandora171s1/). The Beijing-RADI Pandora is included in the data suite which is routinely used for TROPOMI S5P validation. The use of Pandora total and tropospheric NO2 VCDs for validation of collocated TROPOMI data, resampled to 100×100 m2, shows that although on average the TROPOMI VCDs are slightly lower, they are well within the expected error for TROPOMI. The location of the Pandora instrument within a sub-orbital TROPOMI pixel of 3.5×5.5 km2 may result in an error in the TROPOMI-derived tropospheric NO2 VCD between 0.223 and 0.282 Pmolec.cm-2, i.e., between 1.7% and 2%. In addition, the data also show that the Pandora observations at the Beijing-RADI site are representative for an area with a radius of 10 km.

The Pandora total and tropospheric NO2 vertical column densities (VCDs) and surface concentrations collected during the first year of operation show that NO2 concentrations were high in the winter and low in the summer, with diurnal cycle where the concentrations reach a minimum during day time. The concentrations were significantly lower during the 2022 Winter Olympics in Beijing, showing the effectiveness of the emission control measures during that period. The Pandora observations show that during northerly winds clean air is transported to Beijing with low NO2 concentrations, whereas during southerly winds pollution from surrounding areas is transported to Beijing and NO2 concentrations are high. The contribution of tropospheric NO2 to the total NO2 VCD varies significantly on daily to seasonal time scales, i.e., monthly averages vary between 50% and 60% in the winter and between 60% and 70% in the spring and autumn. The comparison of Pandora-measured surface concentrations with collocated in situ measurements using a Thermo Scientific 42i-TL Analyzer shows that the Pandora data are low and that the relationship between Pandora-derived surface concentrations and in situ measurements are different for low and high NO2 concentrations. Explanations for these differences are offered in terms of measurement techniques and physical (transport) phenomena.

How to cite: de Leeuw, G., Liu, O., Li, Z., Lin, Y., Fan, C., Zhang, Y., Li, K., Zhang, P., Wei, Y., Chen, T., and Dong, J.: Interpretation of Pandora NO2 measurements over Beijing and application to satellite validation, EGU General Assembly 2024, Vienna, Austria, 14–19 Apr 2024, EGU24-17891, https://doi.org/10.5194/egusphere-egu24-17891, 2024.

Tropospheric NO2, one of the major atmospheric pollutants, is harmful to human health and plays an important role in atmospheric chemistry. Tropospheric NO2 concentration is controlled by anthropogenic emission and meteorological conditions, such as solar radiation and humidity. In early 2020, unprecedented lockdowns and travel bans were implemented in China to fight COVID-19, leading to a large decrease of NO2 compared with preceding years. To isolate the effects of anthropogenic emission and weather, we applied a linear regression model between satellite observed NO2 column density and meteorological variables. Compared with 2017, it is found that atmospheric NO2 in 2020 changed -37.8 ± 16.3 %, with the contribution of weather +8.1 ± 14.2 % and anthropogenic emission -49.3 ± 23.5 %. Similar results were also found in 2018 and 2019, revealing that the effect of reduced emission on atmospheric NO2 is counteracted by the weather, and is actually larger than the observation. The simulations by GEOS-Chem model also supported the results in typical regions. The reduction of NO2 induced by anthropogenic emission can be well explained by human mobility, showing significantly negative correlations to migration indices provided by Baidu Location-Based-Service, particularly that inside the city. The intra-city migration index can explain 40.4 ± 17.7 % variance of the emission-induced reduction of NO2 in 29 megacities, each of which has a population of over 8 million in China.

How to cite: Zhang, Y.: Tropospheric NO2 in China during the COVID-19 lock-down is largely decreased due to the controlled human mobility, EGU General Assembly 2024, Vienna, Austria, 14–19 Apr 2024, EGU24-17976, https://doi.org/10.5194/egusphere-egu24-17976, 2024.

EGU24-18036 | Orals | AS3.30

Inversion of the global NH3 emissions (2019-2022) based on IASI NH3 observations and the LMDZ-INCA chemistry-transport model  

Pramod Kumar, Philippe Ciais, Didier Hauglustaine, Gregoire Broquet, Lieven Clarisse, Martin Van Damme, and Pierre Coheur

Atmospheric ammonia (NH3) has significant environmental impacts, contributing to biodiversity loss and air quality deterioration, with potential negative effects on ecosystems and human health. The global and regional NH3 emissions have been on continuous rise in the recent years, due to the extensive use of fertilizers in agricultural activities and to livestock production. However, the current bottom-up NH3 emission inventories exhibit large uncertainties at all the spatiotemporal scales. Top-down estimates of the global and regional NH3 emissions from the atmospheric inversion approach based on satellite observations with global coverage can provide valuable insights on the spatiotemporal variability of ammonia emissions. In this study, we provide top-down atmospheric inversion estimates of the worldwide anthropogenic NH3 emissions using the new version 4 of the IASI ANNI NH3 observations for a period of four years from 2019 to 2022 at 1.27°×2.5° (latitude × longitude) horizontal resolution and at daily (as a 10-day running average) temporal scale. We use a global chemistry transport model LMDZ-INCA for the NH3 concentrations simulations and a finite difference mass balance approach for the inversions of the NH3 emissions. We take advantage of the vertical averaging kernels provided in version 4 of the IASI NH3 data product by applying them consistently to the LMDZ-INCA NH3 simulations when evaluating these simulations. We perform the global inversions to estimate the anthropogenic NH3 emissions, using the IASI NH3 total columns observations and LMDZ-INCA NH3 total columns convolved with the vertical averaging kernel. The global annual anthropogenic NH3 emissions averaged over the four years period (2019-2022) are estimated as ~90 (88-92) Tg yr-1. These global estimates are ~70% higher than the prior CEDS inventory NH3 emissions used in the inversions and significantly higher (more than by a factor for two) when compared to two other global bottom-up inventories, CAMS and CAMEO. The regional NH3 emissions estimates derived from our global inversion are also assessed through comparisons with other inventories and recent top-down estimates based on the satellites NH3 observations. Our estimates of the NH3 emissions at both the global and regional scales are mostly consistent with other top-down inversion estimates. 

How to cite: Kumar, P., Ciais, P., Hauglustaine, D., Broquet, G., Clarisse, L., Van Damme, M., and Coheur, P.: Inversion of the global NH3 emissions (2019-2022) based on IASI NH3 observations and the LMDZ-INCA chemistry-transport model , EGU General Assembly 2024, Vienna, Austria, 14–19 Apr 2024, EGU24-18036, https://doi.org/10.5194/egusphere-egu24-18036, 2024.

EGU24-18365 | ECS | Orals | AS3.30

Improving global SO2 emission inventories using Sentinel-5P TROPOMI satellite data 

Adrian Jost, Steffen Beirle, Christian Borger, Nicolas Theys, Steffen Ziegler, and Thomas Wagner

We provide a global database of SO2 emissions from point sources generated from TROPOMI observations of SO2 (COBRA product) for the time range from May 2018 to July 2022. Our algorithm derives the advection of SO2 by combining TROPOMI SO2 column densities and ERA5 wind fields, i.e., taking the product of the vertical column density gradient and the horizontally projected wind speed. In addition, several corrections, e.g., for satellite sensitivity and topography, are applied. For each point source, error estimates are given, considering the uncertainties of the various retrieval steps.

A fully automated iterative detection algorithm of point sources from around the world forms the basis of our catalog. The catalog includes a list of 130 locations identified as substantial anthropogenic SO2 point sources. Most of these locations are close to power plants included in the Global Power Plant Database (GPPD) or match entries in previously compiled SO2 inventories.

The emissions in our catalog are in good agreement (Pearson correlation coefficient (r) of 0.82) with those recorded in existing SO2 datasets (Fioletov et al., 2023) but are higher by about 36%.

By comparing our SO2 catalog with matches in the global NOx catalog compiled by Beirle et al. (2023), information on the used fuel and applied filtering measures is provided. We observe an SO2 to NOx mass ratio ranging from 0.8 to 141.5 with a mean of about 10 for the selected point sources.

The SO2 catalog was created as part of the World Emission (2022) project, funded by ESA, which focuses on quantifying emissions of different species that can be detected by satellite instruments. The complete SO2 catalog will be made publicly available through the World Emission Portal at https://app.world-emission.com.

How to cite: Jost, A., Beirle, S., Borger, C., Theys, N., Ziegler, S., and Wagner, T.: Improving global SO2 emission inventories using Sentinel-5P TROPOMI satellite data, EGU General Assembly 2024, Vienna, Austria, 14–19 Apr 2024, EGU24-18365, https://doi.org/10.5194/egusphere-egu24-18365, 2024.

EGU24-19024 | Posters on site | AS3.30

Monitoring of NO2 emissions from space using an aerosol chemistry transport model and a non-linear optimization system 

Yathin Kudupaje Laxmana, Thomas Lauvaux, Philippe Ciais, Pramod Kumar, Ioannis Cheliotis, Jinghui Lian, and Anthony Rey-Pommier

Quantification of NO2 from different sectors of economic activity remains critical to monitor air pollutants with the rapid development of infrastructures and the rapid industrialization of emerging economies. This study aims to estimate NO2 emissions using satellite NO2 measurements from TROPOMI from different activity sectors over northern Egypt using a full-chemistry atmospheric transport model (WRF-Chem, including aerosol chemistry) and a non-linear Bayesian method. Our top-down approach was carried out for two months, January and July 2022, to analyse the seasonal variations in NO2 emissions over the studied region. The major source of uncertainties in our top-down emission estimates is due to missing sources in the prior emissions (fossil fuel inventory),  lacking more frequent updates and sub-monthly information. We also explore other sources of errors, such as the level of uncertainty used for calculating error covariance factors, the estimation of biogenic emissions, the selection of a quality assurance filter of TROPOMI NO2 and the use of regularization parameters. Non-linearities are included in our optimization algorithm by performing sensitivity experiments with the direct chemistry model (error propagation) to establish daily relationships between NO2 fluxes and concentrations. Our Bayesian inversion produces optimized values over sub-regions of Egypt and for specific sectors. We defined several subregions and assessed the regional NO2 emissions. The total estimated NO2 emissions from the studied region are about 45 Kt for the month of January 2022 and 32 Kt for the month of July 2022. The results were compared to a previous study using the flux-divergence method, showing a fair agreement for the month of winter (R2=0.67) but disagree in terms of magnitude during summer. We discuss the potential causes for the observed mismatch, which is possibly due to the extreme climate of the region, the availability of satellite observations, and large seasonal variations in the lifetime of NO2.

How to cite: Kudupaje Laxmana, Y., Lauvaux, T., Ciais, P., Kumar, P., Cheliotis, I., Lian, J., and Rey-Pommier, A.: Monitoring of NO2 emissions from space using an aerosol chemistry transport model and a non-linear optimization system, EGU General Assembly 2024, Vienna, Austria, 14–19 Apr 2024, EGU24-19024, https://doi.org/10.5194/egusphere-egu24-19024, 2024.

EGU24-19760 | ECS | Posters on site | AS3.30

AI and physical models for air quality monitoring at urban scale with PRISMA hyperspectral data 

Davide De Santis, Sarathchandrakumar T. Sasidharan, Marco Di Giacomo, Gianmarco Bencivenni, Fabio Del Frate, Gabriele Curci, Ana Carolina Amarillo, Francesca Barnaba, Luca Di Liberto, Ferdinando Pasqualini, Cristiana Bassani, Silvia Scifoni, Stefano Casadio, Alessandra Cofano, Massimo Cardaci, and Giorgio Licciardi

The challenge of air pollution and its impact on human health is a significant concern in contemporary society. The PRIMARY (PRIsma for Monitoring AiR quality) research project aims to leverage the capabilities of the Italian Space Agency's PRISMA (PRecursore IperSpettrale della Missione Applicativa) mission to enhance air quality monitoring, particularly in urban areas. The project seeks to utilize PRISMA's hyperspectral data for detailed qualitative and quantitative insights into atmospheric aerosol content and composition in urban environments, crucial for understanding the environmental and health impacts of particulate matter. PRISMA's decametric spatial resolution and the project's use of artificial intelligence address limitations in spatial resolution and the complexity of the inverse problem in satellite-based characterization of particulate matter.

In the context of the PRIMARY project, which deals with high-dimensional hyperspectral data, feature extraction before inversion modeling presents challenges, especially when employing machine learning techniques like neural networks (NNs). Dimensionality reduction addresses this challenge by using feature extraction. Comparative evaluation on a PRISMA dataset for Rome showed variable performance between PCA and NN models in compressing and reconstructing the original vector. Additionally, a synthetic dataset was generated to train the algorithm for atmospheric aerosol composition recognition, relying on a sufficiently large number of aerosol profile examples. The Copernicus Atmosphere Monitoring (CAMS) service, specifically its global atmospheric composition forecast product, was chosen as the primary data source. The FlexAOD code, a post-processing tool, was adapted to read CAMS data and obtain aerosol optical properties for input into LibRadtran, a radiative transfer model, used to generate PRISMA-like synthetic data. The resulting dataset, obtained through automated processes, serves as training data for neural networks. To provide validation for the PRIMARY products, the project planned dedicated measurement campaigns in Rome (autumn 2022) and Milan (from winter to summer 2023).


The PRIMARY project is co-funded by the Italian Space Agency (ASI – “Tor Vergata” University of Rome Agreement n. 2022-3 U.0); the project is part of the ASI’s program “PRISMA Scienza”.

How to cite: De Santis, D., Sasidharan, S. T., Di Giacomo, M., Bencivenni, G., Del Frate, F., Curci, G., Amarillo, A. C., Barnaba, F., Di Liberto, L., Pasqualini, F., Bassani, C., Scifoni, S., Casadio, S., Cofano, A., Cardaci, M., and Licciardi, G.: AI and physical models for air quality monitoring at urban scale with PRISMA hyperspectral data, EGU General Assembly 2024, Vienna, Austria, 14–19 Apr 2024, EGU24-19760, https://doi.org/10.5194/egusphere-egu24-19760, 2024.

EGU24-20191 | Posters on site | AS3.30

Assessment of TROPOMI HCHO Vertical Columns: evaluating the use of CAMS vertical profiles and new TROPOMI surface albedo climatologies for air mass factor determination 

Isabelle De Smedt, Huan Yu, Nicolas Theys, Klaus-Peter Heue, Steven Compernolle, Gaia Pinardi, Pascal Hedelt, Gijsbert Tilstra, Thomas Danckaert, Corinne Vigouroux, Bavo Langerock, Diego Loyola, Andreas Richter, Folkert Boersma, and Michel Van Roozendael

The ESA Climate Change Initiative (CCI) Ozone and Aerosols Precursors project is developing long-term climate data records (CDRs) of the Global Climate Observing System (GCOS) Precursors for Aerosol and Ozone Essential Climate Variables. These precursors include short-lived atmospheric trace gases such as formaldehyde (HCHO), glyoxal (CHOCHO), nitrogen dioxide (NO2), sulphur dioxide (SO2), carbon monoxide (CO), and ammonia (NH3). The project aims to create consistent and harmonized CDRs from multiple satellite missions, including GOME, SCIAMACHY, GOME-2, OMI, TROPOMI, IASI, and MOPITT.

This work presents selected findings of a round robin exercise conducted for UV-VIS retrievals. We focus on two key factors that influence HCHO air mass factor determination: the surface albedo climatology and the model a priori profiles. The impact of these factors on the HCHO vertical columns is evaluated by comparing the use of recent auxiliary datasets. Results are presented for TROPOMI HCHO columns and compared to the operational product.

The recent reprocessing of TROPOMI Level 1 data has enabled the development of new albedo climatologies in the UV, offering a finer spatial resolution than the previously used OMI albedo climatology. Additionally, we evaluate the use of a priori vertical profiles from the CAMS reanalysis dataset (spanning the 2003-2022 period) instead of the current TM5-MP profiles used in the TROPOMI operational product. We assess the impact of these alternative datasets on the TROPOMI HCHO vertical columns and on their validation towards ground-based data.

The generation of the ESA CCI HCHO CDR will be based on these findings. This comprehensive assessment not only contributes to the ongoing improvement of TROPOMI data quality but also provides deeper insights into the factors influencing HCHO vertical columns.

How to cite: De Smedt, I., Yu, H., Theys, N., Heue, K.-P., Compernolle, S., Pinardi, G., Hedelt, P., Tilstra, G., Danckaert, T., Vigouroux, C., Langerock, B., Loyola, D., Richter, A., Boersma, F., and Van Roozendael, M.: Assessment of TROPOMI HCHO Vertical Columns: evaluating the use of CAMS vertical profiles and new TROPOMI surface albedo climatologies for air mass factor determination, EGU General Assembly 2024, Vienna, Austria, 14–19 Apr 2024, EGU24-20191, https://doi.org/10.5194/egusphere-egu24-20191, 2024.

EGU24-20582 | ECS | Orals | AS3.30

The impact of the lockdown during the COVID-19 pandemic outbreak on NOx pollution in China, as derived from TROPOMI and variational atmospheric inverse modelling 

Rimal Abeed, Audrey Fortems-Cheiney, Grégoire Broquet, Robin Plauchu, Isabelle Pison, Antoine Berchet, Elise Potier, Gaëlle Dufour, Adriana Coman, Dilek Savas, Guillaume Siour, Henk Eskes, and philippe ciais

In 2020, China’s response to the COVID-19 breakdown included strict regulations on mobility in several provinces. Multiple studies showed that these measures caused a decrease in the emissions of nitrogen oxides NOx (= NO + NO2). In this study, we exploit the high spatial resolution and coverage of the TROPOMI nitrogen dioxide (NO2) observations, over Eastern China, in order to provide an estimate of this decrease down to the level of provinces. We assimilate these observations in NOx atmospheric inversions for the years 2019 through 2021, based on the variational inversion drivers of the Community Inversion Framework (CIF), coupled to a 0.5° resolution  configuration  of the CHIMERE regional chemistry transport model for the North Chinese Plain region, and of  its adjoint (both including the MELCHIOR-2 chemistry scheme). This framework allows to control the emissions at 0.5° resolution, and then to target emissions at province scale, but also to account for a full chemistry scheme in the atmospheric process. The prior estimate of the anthropogenic emissions for this Bayesian inversion framework is based on a combination of the Carbon-Monitor and CEDS inventories, accounting for the day-to-day variations of these emissions. The corrections of the prior anthropogenic and natural emissions allows to decrease the misfits to the TROPOMI NO2 observation by up to 50%, so that the inverted emissions are highly consistent with these satellite data. Furthermore, the satellite coverage of the domain is good, with more than 60% of the model domain observed 95% of the days. Our results show a decrease in NOx emissions observed in most of Eastern China, during January, February, and March 2020, reaching -40% in February 2020 as compared to 2019. In some Chinese provinces, such as Shanghai, Qinghai, Jiangsu, Hubei and Henan, the reduction in NOx emissions accounted for -38%, -29%, -31%, -36%, and -24% respectively. In North Eastern China, however, our results show an increase in the NOx emissions in three major provinces: Jilin (+11.35% in January 2020), and Liaoning (+16.33% in March 2020). The yearly total emissions of NOx in Eastern China were slightly lower in 2020 than those in 2019, with emissions of 15.58 and 15.76 TgNO2/year, respectively. While in 2021, the total emissions of NOx accounted to16.42 TgNO2/year. We compared the emissions in 2021 to those in 2019, and we found that the levels are higher in most of China, especially in February reaching +45% in the North East, for instance. We show that our results are consistent with other studies that focused on the change in NOx emissions in China, during the COVID-19 lockdown period.

How to cite: Abeed, R., Fortems-Cheiney, A., Broquet, G., Plauchu, R., Pison, I., Berchet, A., Potier, E., Dufour, G., Coman, A., Savas, D., Siour, G., Eskes, H., and ciais, P.: The impact of the lockdown during the COVID-19 pandemic outbreak on NOx pollution in China, as derived from TROPOMI and variational atmospheric inverse modelling, EGU General Assembly 2024, Vienna, Austria, 14–19 Apr 2024, EGU24-20582, https://doi.org/10.5194/egusphere-egu24-20582, 2024.

EGU24-20818 | Posters on site | AS3.30

Evaluating TEMPO NO2 over the New York City Metropolitan Area during CUPiDS 

Rainer Volkamer, Christopher Lee, Rebecca Mesburis, Catherine Silver, Mago Reza, Alan Brewer, Steven Brown, Brian McDonald, Kristen Zuraski, and Sunil Baidar

The Tropospheric Emissions: Monitoring of Pollution (TEMPO) satellite was launched in April 2023 by NASA and has been measuring tropospheric trace gases with hourly time resolution over North America since August 2023. The geostationary orbit of TEMPO poses advantages and also some new challenges to satellite validation efforts (e.g., due to changes in geometry, stratospheric correction, and the spatial scales of sampling) that remain understudied. Overlapping with TEMPO’s early measurement phase, the University of Colorado Airborne Multi-Axis Differential Optical Absorption Spectroscopy (CU AMAX-DOAS) instrument was deployed to probe tropospheric NO2 and other trace gas columns during research flights over New York City, NY conducted as part of the Coastal Urban Plume Dynamics Study (CUPiDS) from July 15 to August 15, 2023. CU AMAX-DOAS is co-deployed with a NOAA Doppler lidar, two 4-channel radiometers (surface albedo), and in situ measurements onboard the NOAA Twin Otter aircraft, with the objectives to better understand emissions and meteorology as drivers for air quality in coastal Metropolitan areas. This presentation focuses on the inter-comparison of tropospheric NO2 trace gas columns from TEMPO and AMAX-DOAS remote sensing measurements. 

How to cite: Volkamer, R., Lee, C., Mesburis, R., Silver, C., Reza, M., Brewer, A., Brown, S., McDonald, B., Zuraski, K., and Baidar, S.: Evaluating TEMPO NO2 over the New York City Metropolitan Area during CUPiDS, EGU General Assembly 2024, Vienna, Austria, 14–19 Apr 2024, EGU24-20818, https://doi.org/10.5194/egusphere-egu24-20818, 2024.

EGU24-21179 | Orals | AS3.30

Using Machine Learning to Predict Column Concentrations and Retrieval Diagnostics of the TROPESS Atmospheric Composition Profiles 

Frank Werner, Kevin W. Bowman, Vivienne Helen Payne, James Lester McDuffie, and Valentin Kantchev

Advances in sensor technology have led to a substantial increase in the data output from satellite-borne remote sensing instrumentation. For example, NASA’s Cross-track Infrared Sounder (CrIS) and Atmospheric Infrared Sounder (AIRS) provide millions of global, spectrally-resolved radiance observations every day. It is becoming increasingly challenging to process these large data sets and perform the subsequent composition profile retrievals for all observations. Indeed, NASA’s TRopospheric Ozone and its Precursors from Earth System Sounding (TROPESS) project, which produces records of atmospheric constituents from multiple satellite and ground data through a common retrieval algorithm, can only process about 1% of the sampled CrIS observations.

This talk presents efforts to process all the observed CrIS and AIRS data by applying machine learning techniques. In particular, we present staggered artificial neural networks (ANNs) that can reliably replicate the retrieved CrIS carbon monoxide and ammonia profiles, as well as important retrieval diagnostics such as the retrieval error and averaging kernels. Once trained, these ANNs can perform predictions for millions of CrIS radiance observations in minutes. This new data set not only covers the gaps in the global retrievals of composition fields, but also provide uncertainty and variability information on very small scales.

How to cite: Werner, F., Bowman, K. W., Payne, V. H., McDuffie, J. L., and Kantchev, V.: Using Machine Learning to Predict Column Concentrations and Retrieval Diagnostics of the TROPESS Atmospheric Composition Profiles, EGU General Assembly 2024, Vienna, Austria, 14–19 Apr 2024, EGU24-21179, https://doi.org/10.5194/egusphere-egu24-21179, 2024.

EGU24-1132 | ECS | Posters on site | AS3.31

Global evaluation of HCHO summertime diurnal variability using Pandonia Global Network (PGN) 

Tianlang Zhao, Jingqiu Mao, Xiaoyi Zhao, Elena Spinei Lind, and Thomas Hanisco

Formaldehyde (HCHO) serves as an important proxy for emissions of volatile organic compounds (VOCs) and their subsequent photochemistry affecting air quality and climate. Understanding HCHO diurnal variability is essential to accurately represent emissions, chemistry, and planetary boundary layer (PBL) mixing in chemical transport models (CTMs). Here we compare HCHO diurnal variations from Pandora Global Network (PGN), GEOS-CF (0.25°x0.25°) and GEOS-Chem (2°x2.5°) CTMs at 55 sites, to characterize the HCHO diurnal patterns in urban and rural sites over North America (NA), Europe (EU) and East Asia (AS) in 2021-2022 summers. We find that HCHO total column (HCHOcol) from GEOS-CF model shows a comparable stronger diurnal variability (quantified by relative amplitude) with that from PGN measurements, which is lower in GEOS-Chem (10-200% bias in late afternoon). While models and PGN show comparable HCHOcol at rural sites (e.g., ChapelHillNC and DearbornMI), PGN shows significantly higher (a factor of 2 - 3) local noon HCHOcol in some urban areas (e.g., Busan and Bangkok), suggesting missing Volatile Organic Compounds (VOCs) emissions in the models. We further examine the relationship between HCHOcol and HCHO near-surface concentration (HCHOsurf). While both model and PGN show a linear relationship (p<0.05) between HCHOcol and HCHOsurf in most of EU sites, they show larger discrepancies over a majority of NA and AS sites with a nonlinear relationship, suggesting model issues in PBL mixing. Our systematic evaluation of HCHO diurnal variability, using a global network of ground-based measurements and a global CTM, provides new insights into improving emissions, chemistry and PBL mixing in current models.

How to cite: Zhao, T., Mao, J., Zhao, X., Lind, E. S., and Hanisco, T.: Global evaluation of HCHO summertime diurnal variability using Pandonia Global Network (PGN), EGU General Assembly 2024, Vienna, Austria, 14–19 Apr 2024, EGU24-1132, https://doi.org/10.5194/egusphere-egu24-1132, 2024.

EGU24-2169 | ECS | Orals | AS3.31

A research product for tropospheric NO2 columns fromGeostationary Environment Monitoring Spectrometerbased on Peking University OMI NO2 algorithm 

Yuhang Zhang, Jintai Lin, Jhoon Kim, Hanlim Lee, Junsung Park, Hyunkee Hong, Michel Van Roozendael, Francois Hendrick, Ting Wang, Pucai Wang, Qin He, Kai Qin, Yongjoo Choi, Yugo Kanaya, Jin Xu, Pinhua Xie, Xin Tian, Sanbao Zhang, Shanshan Wang, and Siyang Cheng and the Yuhang Zhang

Tropospheric vertical column densities (VCDs) of nitrogen dioxide (NO2) retrieved from sun-synchronous satellite instruments have provided abundant NO2 data for environmental studies, but such data are limited by retrieval uncertainties and insufficient temporal sampling (e.g., once a day). The Geostationary Environment Monitoring Spectrometer (GEMS) launched in February 2020 monitors NO­2 at an unprecedented hourly resolution during the daytime. Here we present a research product for tropospheric NO2 VCDs, referred to as POMINO-GEMS. We develop a hybrid retrieval method combining GEMS, TROPOMI and GEOS-CF data to generate hourly tropospheric NO2 slant column densities (SCDs). We then derive tropospheric NO2 air mass factors (AMFs) with explicit corrections for surface reflectance anisotropy and aerosol optical effects, through parallelized pixel-by-pixel radiative transfer calculations. Prerequisite cloud parameters are retrieved with the O2-O2 algorithm by using ancillary parameters consistent with those used in NO2 AMF calculations.

Initial retrieval of POMINO-GEMS tropospheric NO2 VCDs for June–August 2021 exhibits strong hotspot signals over megacities and distinctive diurnal variations over polluted and clean areas. POMINO-GEMS NO2 VCDs agree with the POMINO-TROPOMI v1.2.2 product (R = 0.98, and NMB = 4.9%) over East Asia, with slight differences associated with satellite viewing geometries and cloud and aerosol properties affecting the NO2 retrieval. POMINO-GEMS also shows good agreement with OMNO2 v4 (R = 0.87, and NMB = −16.8%) and GOME-2 GDP 4.8 (R = 0.83, and NMB = −1.5%) NO2 products. POMINO-GEMS shows small biases against ground-based MAX-DOAS NO2 VCD data at nine sites (NMB = –11.1%) with modest or high correlation in diurnal variation at six urban and suburban sites (R from 0.60 to 0.96). The spatiotemporal variation of POMINO-GEMS correlates well with mobile-car MAX-DOAS measurements in the Three Rivers’ Source region on the Tibetan Plateau (R = 0.81). Surface NO2 concentrations estimated from POMINO-GEMS VCDs are consistent with measurements from the Ministry of Ecology and Environment of China for spatiotemporal variation (R = 0.78, and NMB = –26.3%) as well as diurnal variation at all, urban, suburban and rural sites (R 0.96). POMINO-GEMS data will be made freely available for users to study the spatiotemporal variations, sources and impacts of NO2.

How to cite: Zhang, Y., Lin, J., Kim, J., Lee, H., Park, J., Hong, H., Van Roozendael, M., Hendrick, F., Wang, T., Wang, P., He, Q., Qin, K., Choi, Y., Kanaya, Y., Xu, J., Xie, P., Tian, X., Zhang, S., Wang, S., and Cheng, S. and the Yuhang Zhang: A research product for tropospheric NO2 columns fromGeostationary Environment Monitoring Spectrometerbased on Peking University OMI NO2 algorithm, EGU General Assembly 2024, Vienna, Austria, 14–19 Apr 2024, EGU24-2169, https://doi.org/10.5194/egusphere-egu24-2169, 2024.

EGU24-3198 | ECS | Posters on site | AS3.31 | Highlight

Estimating Hourly Nitrogen Oxide Emissions Across Asia Using Data from the GEMS Geostationary Satellite 

Paul Palmer, Fei Yao, Daven Henze, Rokjin Park, and Gitaek Lee

Conventional bottom-up emission inventories for atmospheric pollutants suffer from infrequent updates and substantial uncertainties. The Geostationary Environment Monitoring Spectrometer (GEMS) now provides columnar measurements for key atmospheric pollutants, including tropospheric O3, aerosols, and their precursors (NO2, SO2, HCHO, and glyoxal), on an hourly basis throughout the sunlit day, with a nominal spatial resolution of a few kilometres. These satellite data represent new constraints to determine top-down estimates of air pollutant emissions, providing complementary information to the bottom-up inventories. Collectively, bottom-up and top-down information provide better actionable information to develop more effective air pollution mitigation strategies. To demonstrate this, we infer emissions of nitrogen oxides (NOx=NO+NO2) across Asia from GEMS column observations of NO2 by using the adjoint of GEOS-Chem atmospheric chemical transport model. We explore diurnal variations in NOx emissions across diverse Asian cities, assessing their implications for emission policy formulation. Additionally, we conduct a critical evaluation of our top-down estimates of NOx emissions by comparing model simulations of NO2, driven by these estimates, with independent observations of NO2 throughout the region.

How to cite: Palmer, P., Yao, F., Henze, D., Park, R., and Lee, G.: Estimating Hourly Nitrogen Oxide Emissions Across Asia Using Data from the GEMS Geostationary Satellite, EGU General Assembly 2024, Vienna, Austria, 14–19 Apr 2024, EGU24-3198, https://doi.org/10.5194/egusphere-egu24-3198, 2024.

EGU24-5000 | ECS | Posters on site | AS3.31

Evaluation of inter-calibration approaches for the GEMS Level 1B product 

Yeeun Lee, Myoung-Hwan Ahn, Mina Kang, Mijin Eo, Kyung-jung Moon, and Jhoon Kim

To meet the growing demand for diurnal information on trace gases and aerosols in the atmosphere, a series of satellite programs consisting of the GEO-ring (GEO-constellation) has been initiated. The series started off with the launch of the Geostationary Korean Multi-Purpose Satellite-2B (GK-2B) in 2020, followed by the Tropospheric Emissions: Monitoring of Pollution (TEMPO) in 2023 and the expected launch of Sentinel-4 in 2024. Onboard GK-2B, the Geostationary Environment Monitoring Spectrometer (GEMS) is dedicated to observing the Asia-Pacific region, providing spectral radiance in the 300-500 nm range to obtain specific spectral information on absorption and scattering lines. To evaluate the post-launch data quality of GEMS, especially for Level 1B products, this study utilizes inter-calibration approaches with the measurements from geostationary as well as polar orbit satellite sensors. The evaluation comprises two parts to address current and potential calibration issues of GEMS: 1) applying the ray-matching approach with the Advanced Meteorological Imager (AMI) onboard the twin satellite, GK-2A; and 2) employing vicarious calibration with polar orbit satellite sensors, Tropospheric Monitoring Instrument (TROPOMI) and Ozone Mapping and Profiler Suite (OMPS), targeting stable scenes on Earth. In the first approach, AMI and GEMS demonstrate a strong agreement, showing a high correlation coefficient exceeding 0.9 regardless of measurement time and season. However, the GEMS Level 1B product reveals a positive bias when compared to AMI, 10% and 5% for radiance and reflectance, respectively. The GEMS measurements also display distinct seasonal and diurnal variations compared to AMI, which needs further investigation considering that the variations could influence the Level 2 retrieval products of GEMS. In the second approach, GEMS shows residual stray light effect especially at the shorter wavelengths (below 320 nm) and quantitatively, GEMS shows a consistent bias with the first approach, when compared to TROPOMI and OMPS. The paper aims to provide valuable insights for the efficient monitoring of sensors under comparable conditions with GEMS, along with remaining challenges emphasizing the need for refined approaches to address the radiometric calibration accuracy of the GEMS Level 1B product.

How to cite: Lee, Y., Ahn, M.-H., Kang, M., Eo, M., Moon, K., and Kim, J.: Evaluation of inter-calibration approaches for the GEMS Level 1B product, EGU General Assembly 2024, Vienna, Austria, 14–19 Apr 2024, EGU24-5000, https://doi.org/10.5194/egusphere-egu24-5000, 2024.

EGU24-6093 | Orals | AS3.31

Application of the GeoXO ACX NO2 Algorithm to GEMS and TEMPO and Intercomparisons with TROPOMI 

Kai Yang, Shobha Kondragunta, and Zigang Wei

The atmospheric composition instrument (ACX) on NOAA's GeoXO mission will enhance NOAA's air quality monitoring capabilities by providing hourly high-resolution observations of air pollutants over North America, like its predecessor, NASA's TEMPO mission. We are developing and implementing an advanced algorithm for accurate NO2 retrieval from GeoXO ACX. Applying this algorithm to GEMS and TEMPO, we demonstrate in this presentation the success of rapid production of high-quality NO2 data soon after the mission starts to collect Earthview measurements. We describe the technique for instrument characterization and identification of instrument artifacts for improving retrieval precisions, and the soft calibration approach for removing systematic biases in NO2 retrieval. Using TROPOMI as a transfer standard, we show consistent NO2 slant columns are retrieved from GEMS and TEMPO using the GeoXO ACX NO2 algorithm.

How to cite: Yang, K., Kondragunta, S., and Wei, Z.: Application of the GeoXO ACX NO2 Algorithm to GEMS and TEMPO and Intercomparisons with TROPOMI, EGU General Assembly 2024, Vienna, Austria, 14–19 Apr 2024, EGU24-6093, https://doi.org/10.5194/egusphere-egu24-6093, 2024.

EGU24-6208 | ECS | Orals | AS3.31 | Highlight

Tropospheric NO2 column retrieval from the Geostationary Environment Monitoring Spectrometer (GEMS) 

Sora Seo, Pieter Valks, Klaus-Peter Heue, Ronny Lutz, Pascal Hedelt, Diego Loyola, Hanlim Lee, and Jhoon Kim

Nitrogen oxides play an important role in many atmospheric chemistry processes in both the stratosphere and troposphere. In this context, over the past few decades, NO2 column measurements have been provided from polar sun-synchronous low-earth orbit (LEO) satellite instruments. These space-borne remote sensing measurements have contributed to our understanding of the global distribution of tropospheric NO2 levels, their changes over time and estimates of emissions. However, the LEO instruments only observe NO2 once per day at a specific local time, limiting the monitoring of diurnal variation in NO2 due to variations in emissions and chemical reactions throughout the day. To address the shortcomings of the current atmospheric composition monitoring by LEO and to capture the diurnal variation of air quality processes at the local scale, the Geostationary Air Quality (Geo-AQ) constellation mission, consisting of three geostationary satellite sensors (i.e. Geostationary Environment Monitoring Spectrometer (GEMS) for Asia, Tropospheric Emissions: Monitoring of Pollution (TEMPO) for North America, and Sentinel-4 (S4) for Europe), has been launched.

In this study, we present a tropospheric NO2 retrieval algorithm designed for geostationary satellites using GEMS measurements. The GEMS NO2 retrieval algorithm is based on a heritage of NO2 retrieval from previous LEO satellites, following a common approach consisting of three steps: (1) the spectral retrieval of total NO2 slant columns using Differential Optical Absorption Spectroscopy (DOAS) technique, (2) the separation of slant columns into stratospheric and tropospheric contributions, and (3) the conversion of tropospheric slant columns to tropospheric vertical columns using air mass factors. However, to account for the characteristics of the geostationary satellite, such as hourly sampling, limited geographical coverage, and larger zenith angles, we developed and implemented a number of improvements in the DLR GEMS NO2 retrieval algorithm. To estimate the stratospheric contribution and describe the diurnal variation of stratospheric fields, an improved stratosphere-troposphere separation approach was developed using the CAMS global forecast (IFS cycle 48r1) data and evaluated by comparing it to results obtained using the STREAM scheme. For the improved tropospheric AMF calculation, sensitivity tests were performed using different surface reflectance and cloud products. Notably, a cloud correction using cloud parameters from the DLR Optical Cloud Recognition Algorithm (OCRA) based on Loyola et al. (2018) improves the tropospheric NO2 column retrievals for clear-sky scenes.

Our GEMS tropospheric NO2 retrieval results show good agreement with various reference datasets including ground-based and satellite measurements. Furthermore, the hourly sampling and high spatial resolution of GEMS tropospheric NO2 columns demonstrate the capability for a detailed analysis of the diurnal evolution of NO2 burden and emission strengths over Asia from space.

How to cite: Seo, S., Valks, P., Heue, K.-P., Lutz, R., Hedelt, P., Loyola, D., Lee, H., and Kim, J.: Tropospheric NO2 column retrieval from the Geostationary Environment Monitoring Spectrometer (GEMS), EGU General Assembly 2024, Vienna, Austria, 14–19 Apr 2024, EGU24-6208, https://doi.org/10.5194/egusphere-egu24-6208, 2024.

EGU24-6497 | Posters on site | AS3.31

Statistical and neural network-based AOD data fusion with Geostationary satellite instruments: GEMS, AMI, and GOCI-II. 

Minseok Kim, Jhoon Kim, Hyunkwang Lim, Seoyoung Lee, Yeseul Cho, Yun-Gon Lee, Sujung Go, and Kyunghwa Lee

Aerosol optical depth (AOD) data fusion for aerosol datasets obtained from the Geostationary Korea Multi-Purpose Satellite (GEO-KOMPSAT; GK) series was conducted through the application of both statistical and deep neural network (DNN)-based methodologies. The GK mission incorporates the Advanced Meteorological Imager (AMI) on GK-2A, as well as the Geostationary Environment Monitoring Spectrometer (GEMS) and Geostationary Ocean Color Imager-II (GOCI-II) on GK-2B. The statistical fusion approach rectified biases in each aerosol product by assuming a Gaussian error distribution. Utilizing Maximum Likelihood Estimation (MLE) fusion, the technique accounted for pixel-level uncertainties by weighting the root-mean-square error of each AOD product for individual pixels. A DNN-based fusion model was trained to align with Aerosol Robotic Network AOD values through fully connected hidden layers. The results of both statistical and DNN-based fusion generally surpassed the performance of individual GEMS and AMI AOD datasets in East Asia (R = 0.888; RMSE = −0.188; MBE = −0.076; 60.6% within EE for MLE AOD; R = 0.905; RMSE = 0.161; MBE = −0.060; 65.6% within EE for DNN AOD). Particularly, focusing on AOD around the Korean peninsula, encompassing all aerosol products, yielded significantly improved outcomes (R = 0.911; RMSE = 0.113; MBE = −0.047; 73.3% within EE for MLE AOD; R = 0.912; RMSE = 0.102; MBE = −0.028; 78.2% within EE for DNN AOD). The DNN AOD demonstrated effective handling of the rapid increase in uncertainty at higher aerosol loadings. Overall, the fusion AOD, particularly DNN AOD, closely matched with the performance of the Moderate Resolution Imaging Spectroradiometer Dark Target algorithm, exhibiting slightly less variance and a negative bias. Both fusion algorithms stabilized diurnal error variations and provided additional insights into hourly aerosol evolution.

How to cite: Kim, M., Kim, J., Lim, H., Lee, S., Cho, Y., Lee, Y.-G., Go, S., and Lee, K.: Statistical and neural network-based AOD data fusion with Geostationary satellite instruments: GEMS, AMI, and GOCI-II., EGU General Assembly 2024, Vienna, Austria, 14–19 Apr 2024, EGU24-6497, https://doi.org/10.5194/egusphere-egu24-6497, 2024.

EGU24-6864 | Posters on site | AS3.31

Analysis of Long-term Trends in Asian Aerosol Optical Depth Using Ground-based Observational Data 

Yujin Chai, Jhoon Kim, and Yeseul Cho

Aerosols play a crucial role in affecting air quality, climate change, and public health. They show significant differences in concentration across regions and fluctuate over time. Therefore, it's essential to examine long-term changes in aerosol levels and analyze the associated patterns to improve air quality and advance climate change research. This study specifically looks at the long-term trends of Aerosol Optical Depths (AODs) in Asia and compares the trends of Fine-mode Aerosol Optical Depths (FAODs) and Coarse-mode Aerosol Optical Depths (CAODs). AOD indicates how much solar radiation is blocked by aerosols in the atmosphere, serving as an important measure of aerosol quantity. The Aerosol Robotic Network (AERONET) is a ground-based observation network providing detailed information on aerosol properties globally. AERONET has extensive long-term data and ensures continuous observations through daily measurements. Consequently, we analyzed the prolonged trends of AOD using AERONET data. To understand changes in aerosol quantity from human-made sources and natural events like yellow dust, we examined trends in Coarse-mode Aerosol Optical Depths (CAODs) and Fine-mode Aerosol Optical Depths (FAODs), categorizing aerosols by size. By comparing CAODs and FAODs, we identified consistent trends in the analysis across countries or sub-regions. This analysis highlights significant regional differences in aerosol concentrations, influenced by factors such as the local environment and air quality policies of each country.

How to cite: Chai, Y., Kim, J., and Cho, Y.: Analysis of Long-term Trends in Asian Aerosol Optical Depth Using Ground-based Observational Data, EGU General Assembly 2024, Vienna, Austria, 14–19 Apr 2024, EGU24-6864, https://doi.org/10.5194/egusphere-egu24-6864, 2024.

EGU24-6890 | Posters on site | AS3.31

Comparison of GEMS and TROPOMI NO2 observations with ground-based measurements over South Korea 

Gyo-Hwang Choo, Hyunkee Hong, Goo Kim, and Sang-Min Kim

Nitrogen dioxide (NO2) is one of the most important trace gases in the atmosphere, mainly produced from the combustion of fossil fuels, thermal power plants, transportation activities, and natural sources. Short-term exposure to high concentrations of NO2 in the atmosphere can be problematic as it can cause adverse effects on human health, such as respiratory diseases, and exacerbate the symptoms of those already suffering from lung or heart conditions. The TROPOspheric Monitoring Instrument (TROPOMI) has limitations in tracking diurnal variation. TROPOMI scans South Korea only once daily. On the other hand, the Geostationary Environment Monitoring Spectrometer (GEMS) onboard the GEO-KOMPSAT 2B satellite was designed to continuously observe air pollutants, including NO2, SO2, HCHO, O3, and aerosols. The spatiotemporal pattern of total NO2 vertical column density (VCD) from GEMS shows spatial variability and the diurnal cycle of NO2. In this study, monthly averaged data were generated to compare GEMS, TROPOMI, and ground observation data. 
The research results showed that the monthly total NO2 VCD from GEMS and surface NO2 mixing ratio exhibited greater temporal variations compared to the total NO2 VCD from TROPOMI. Additionally, the monthly NO2 values were higher in spring and winter, while lower in summer and autumn. GEMS effectively detected the characteristics of NO2 in South Korea, including the distinct weekday-weekend effect, which is similar to ground observations. In the analysis of diurnal variations, GEMS exhibited a continuous increase in NO2 values from 9:45 to 14:45 KST for January. In contrast, other months showed a diurnal cycle. The comparison between GEMS and ground data showed a moderate level of correlation (R=0.77), while TROPOMI exhibited a higher correlation (R=0.81). However, the slope of GEMS was closer to the 1:1 line. GEMS demonstrated a good correlation, particularly in urban observation sites where total NO2 VCD was relatively high throughout the year. However, it showed a lower correlation in port observation sites.

How to cite: Choo, G.-H., Hong, H., Kim, G., and Kim, S.-M.: Comparison of GEMS and TROPOMI NO2 observations with ground-based measurements over South Korea, EGU General Assembly 2024, Vienna, Austria, 14–19 Apr 2024, EGU24-6890, https://doi.org/10.5194/egusphere-egu24-6890, 2024.

EGU24-7138 | Posters on site | AS3.31

GEMS ozone product evaluation using ozonesonde measurements during the ACCLIP campaign 

Joowan Kim, Subin Oh, Juseon Bak, Ja-Ho Koo, Sang Seo Park, and Won-Jin Lee

This study presents an comprehensive evaluation of Geostationary Environment Monitoring Spectrometer (GEMS) ozone products using daily ozonesonde data measured during the Asian Summer Monsoon Chemical and Climate Impact Project (ACCLIP). The analysis uses a total of 38 ozonesonde measurements along with atmospheric reanalysis to better understand ozone variability and circulation impacts during the Asian summer monsoon. It shows significant variability of tropospheric and lower stratospheric ozone related to convective activities associated with the Asian monsoon rainband and strong anticyclone in the upper troposphere and lower stratosphere (a.k.a. Tibet high). The comparison of the ozonesonde data and GEMS ozone products reveals GEMS’s capability to capture these variabilities, and also highlights its potential utility in the studies of chemical transport and regional-scale air quality in Asia.

How to cite: Kim, J., Oh, S., Bak, J., Koo, J.-H., Park, S. S., and Lee, W.-J.: GEMS ozone product evaluation using ozonesonde measurements during the ACCLIP campaign, EGU General Assembly 2024, Vienna, Austria, 14–19 Apr 2024, EGU24-7138, https://doi.org/10.5194/egusphere-egu24-7138, 2024.

EGU24-9883 | Posters on site | AS3.31

A cloud product for Sentinel-4 to support the Geo-Ring for Air Quality 

Ronny Lutz, Victor Molina Garcia, Athina Argyrouli, Fabian Romahn, and Diego Loyola

The Geo-Ring for Air Quality consists of three geostationary instruments to monitor the air quality and atmospheric composition over large parts of the northern hemisphere with a high temporal cadence. These are the Korean Geostationary Environmental Monitoring Spectrometer (GEMS, launched 2020), the US-American Tropospheric Emissions: Monitoring of Pollution (TEMPO, launched 2023) and the European UVN spectrometer on Sentinel-4 (S4, to be launched 2025). These geostationary instruments can benefit substantially from the knowledge gained by heritage LEO missions like OMI/Aura, GOME-2/MetOP-ABC and TROPOMI/Sentinel-5P and provide a great synergistic potential to combine the global spatial coverage of the LEO missions with the regional high temporal coverage of the GEO missions.
Although trace gases and greenhouse gases are the main focus of the Geo-Ring for Air Quality, knowledge about the presence and characteristics of clouds is a pre-requisite for an accurate retrieval of the aforementioned species for air quality. On top of that, clouds by themselves are an important parameter for climatological studies and applications via their importance and impact on the Earth’s radiation budget.
In this contribution, we present the operational cloud product developed for Sentinel-4. It is based on the algorithms called OCRA (Optical Cloud Recognition Algorithm) and ROCINN (Retrieval of Cloud Information using Neural Networks), which are already being in operational use for several heritage missions like GOME-2 and TROPOMI. The main retrieval parameters are cloud fraction, cloud mean height, cloud top height, cloud optical thickness and cloud albedo, achieved via two different cloud models: a simplified Lambertian reflector approach (CRB, clouds as reflecting boundaries) and a physically more realistic scattering layer approach (CAL, clouds as layers). As a testing scenario for the Seninel-4 development, the OCRA algorithm has been adapted to the GEMS instrument. We will show application results and also further comparisons of the S5P OCRA/ROCINN cloud product with the GEMS cloud product.

How to cite: Lutz, R., Molina Garcia, V., Argyrouli, A., Romahn, F., and Loyola, D.: A cloud product for Sentinel-4 to support the Geo-Ring for Air Quality, EGU General Assembly 2024, Vienna, Austria, 14–19 Apr 2024, EGU24-9883, https://doi.org/10.5194/egusphere-egu24-9883, 2024.

EGU24-10221 | Orals | AS3.31

The GEMS IUP-UB tropospheric NO2 product – sensitivity studies and first results 

Andreas Richter, Kezia Lange, John P. Burrows, Hartmut Boesch, Si-Wan Kim, Seunghwan Seo, Kyoung-Min Kim, Hyunkee Hong, Hanlim Lee, and Junsung Park

Nitrogen oxides (NOx = NO + NO2) are among the most important pollutants in the atmosphere. They impact tropospheric ozone chemistry, contribute to particle formation and adversely affect human health.

The monitoring of NO2 is mainly performed by surface in-situ networks. Satellite observations can contribute by providing a large-scale picture and covering regions without in-situ observations. The satellite instruments traditionally used for NO2 retrieval (GOME, SCIAMACHY, OMI, TROPOMI) operate on low-earth orbiting platforms, providing global coverage but only one or two measurements per day. The Korean GEMS instrument, launched in February 2020, is the first in a series of geostationary observation platforms allowing hourly measurements of NO2 from space.

Based on the work performed in preparation for the European S4 satellite, a tropospheric NO2 retrieval for GEMS has been developed at IUP-UB. This product focuses on achieving low noise and high accuracy by optimising the fitting window and including corrections for instrument polarisation sensitivity and scene inhomogeneity. Stratospheric correction is performed using different approaches to investigate the impact on the tropospheric columns. For the airmass factors, cloud correction is applied using cloud fractions derived after correction for calibration issues in GEMS irradiance measurements. The resulting tropospheric columns for the first three years of GEMS operation show excellent agreement with the operational TROPOMI NO2 product at the time of TROPOMI overpass. They also exhibit systematic and variable daily patterns, which depend on season and location.

How to cite: Richter, A., Lange, K., Burrows, J. P., Boesch, H., Kim, S.-W., Seo, S., Kim, K.-M., Hong, H., Lee, H., and Park, J.: The GEMS IUP-UB tropospheric NO2 product – sensitivity studies and first results, EGU General Assembly 2024, Vienna, Austria, 14–19 Apr 2024, EGU24-10221, https://doi.org/10.5194/egusphere-egu24-10221, 2024.

EGU24-10891 | ECS | Orals | AS3.31

Validation of GEMS tropospheric NO2 with the GEMS IUP-UB NO2 product, the TROPOMI NO2 product, and ground-based DOAS measurements 

Kezia Lange, Andreas Richter, Tim Bösch, Bianca Zilker, John P. Burrows, Hartmut Bösch, Alexis Merlaud, Caroline Fayt, Martina M. Friedrich, Michel Van Roozendale, Steffen Ziegler, Simona Ripperger-Lukosiunaite, Thomas Wagner, Donghee Kim, Lim-Seok Chang, Hyunkee Hong, Kangho Bae, Chang-Keun Song, and Hanlim Lee

Nitrogen dioxide (NO2) is one of the most important air pollutants in the troposphere. NO2 can be retrieved by differential optical absorption spectroscopy measurements, which can be performed from various platforms.

Measurements from low earth satellites in sun-synchronous orbits provide a global overview and have already contributed valuable insights into understanding NO2. The latest instrument, TROPOMI, with its high spatial resolution of 3.5 x 5.5 km2, has given new opportunities to disentangle and analyze NOx sources. However, instruments in low-earth orbits usually provide only one measurement per day at each location.

To achieve diurnal cycles of trace gases, instruments on geostationary satellites are needed. The Korean instrument GEMS on GK2B, launched in February 2020, is the first instrument in geostationary orbit, delivering hourly daytime observations of NO2 with a spatial resolution of 3.5 x 8 km2 over a large part of Asia.

In this study, one year of tropospheric NO2 vertical column densities (VCDs) of the operational GEMS product are compared to the scientific GEMS IUP-UB NO2 VCD product, the operational TROPOMI NO2 VCD product, and ground-based DOAS measurements in Korea. The diurnal variation of NO2 observed by GEMS is compared to the diurnal variation observed at several ground-based MAX-DOAS stations located in different pollution regimes in Korea. The large variety of observed diurnal cycles are interpreted regarding potential influencing factors. In this respect, the ERA5 10 m wind data provide valuable insights into the influence of transport effects on the tropospheric NO2 VCD depending on station location and seasonality.

How to cite: Lange, K., Richter, A., Bösch, T., Zilker, B., Burrows, J. P., Bösch, H., Merlaud, A., Fayt, C., Friedrich, M. M., Van Roozendale, M., Ziegler, S., Ripperger-Lukosiunaite, S., Wagner, T., Kim, D., Chang, L.-S., Hong, H., Bae, K., Song, C.-K., and Lee, H.: Validation of GEMS tropospheric NO2 with the GEMS IUP-UB NO2 product, the TROPOMI NO2 product, and ground-based DOAS measurements, EGU General Assembly 2024, Vienna, Austria, 14–19 Apr 2024, EGU24-10891, https://doi.org/10.5194/egusphere-egu24-10891, 2024.

EGU24-10909 | Orals | AS3.31

Comparing TROPOMI and GEMS Observations for the Same Sun-Satellite Geometry  

Pepijn Veefkind, Benjamin Leune, Jos van Geffen, and Hyunkee Hong

Together with the geostationary imagers over Southeast Asia (GEMS), North America (TEMPO) and Europe (Sentinel 4), TROPOMI and its follow-on low Earth orbit missions will establish the global air quality satellite constellation. The role of the low Earth orbit sensors in this constellation is twofold: firstly to provide the global coverage, including regions that cannot or will not be covered by the geostationary imagers, and secondly to facilitate cross-comparisons of the geostationary imagers, thereby serving as a travelling standard.

With the availability of the GEMS data and the expected release of the TEMPO data, the development of novel methods to intercompare the geostationary and low Earth orbit data is timely. When comparing data from geostationary and low Earth orbit data, one important aspect to overcome is the difference in the Sun-satellite geometry of the observations for an area on Earth. When comparing measured radiances under different geometries, complex corrections are required, for example to deal with the directionality of the surface reflectance. The uncertainties of such corrections may be larger than the expected difference in the radiance between the geostationary and low Earth orbit observations.

As the GEMS field of view includes the sub-satellite point at the equator, there is the unique opportunity for direct comparison when the TROPOMI nadir observations cover this point. In this case, observations of GEMS and TROPOMI with the same the same viewing geometry are available within maximum 30 minutes of each other. The time difference can be accounted for by interpolation, and/or by including a larger geographic area on the Earth in the intercomparison. As the orbital repeat cycle of TROPOMI is 227 orbits, there is an opportunity for direct comparisons approximately every 16 days. Such comparisons can include comparisons of the Level 1B radiances, reflectances, or fitted quantities such as slant column densities for different gases.

In this contribution we will demonstrate the method using case studies of direct comparisons of radiance, reflectances and NO2 slant columns, as well as comparisons for different seasons.

How to cite: Veefkind, P., Leune, B., van Geffen, J., and Hong, H.: Comparing TROPOMI and GEMS Observations for the Same Sun-Satellite Geometry , EGU General Assembly 2024, Vienna, Austria, 14–19 Apr 2024, EGU24-10909, https://doi.org/10.5194/egusphere-egu24-10909, 2024.

EGU24-11150 | Orals | AS3.31 | Highlight

NOAA's Plans for its GEO Program from Today to 2050 

Andrew Heidinger, Daniel Lindsey, Joanna Joiner, and Pamela Sullivan

NOAA’s Geostationary Operational Environmental Satellites (GOES) – R Series is now six years into its operational life with GOES-16 serving as GOES East, GOES-18 serving as GOES West, and GOES-17 in on-orbit storage.  The last GOES-R Series satellite (GOES-U) will launch in late April 2024.  Together the GOES-R satellites watch more than half the globe – from the west coast of Africa to New Zealand, and from Antarctica to the Arctic Ocean and will continue operations into the 2030s.

To ensure the continuity of these critical observations, NOAA has initiated the mission that will follow GOES-R, the Geostationary Extended Observations (GeoXO) program.  GeoXO will expand the weather-centric mission of GOES-R's imagers and lightning mappers by adding a hyperspectral IR sounder (GXS).  GeoXO will expand beyond the weather mission by including hyperspectral sensors that measure atmospheric composition and ocean colour.    

The first GeoXO launch is targeted for 2032 and the series is expected to be operational into the 2050s. This presentation provides a status on GOES-R operations and will also discuss GeoXO requirements, instrument status and  user readiness.

How to cite: Heidinger, A., Lindsey, D., Joiner, J., and Sullivan, P.: NOAA's Plans for its GEO Program from Today to 2050, EGU General Assembly 2024, Vienna, Austria, 14–19 Apr 2024, EGU24-11150, https://doi.org/10.5194/egusphere-egu24-11150, 2024.

EGU24-11547 | Orals | AS3.31

TEMPO Aerosol Retrieval Algorithm 

Hai Zhang, Shobha Kondragunta, and Pubu Ciren

TEMPO (Tropospheric Emissions: Monitoring Pollution) is a geostationary ultraviolet and visible spectrometer to monitor major air pollutants over north America.   The instrument was launched in April 2023 and the L1b data were available since October 17, 2023.   The sensor’s coverage of the O2B band (688nm) enables us to retrieve aerosol layer height (ALH).  At National Oceanic and Atmospheric Administration (NOAA) in the United States, we developed an algorithm to retrieve aerosol optical depth, aerosol type, and aerosol layer height from the TEMPO data.   Our approach involves the creation of a 0.05x0.05 degree database of surface reflectances for various bands, accounting for solar-satellite geometry.   To retrieve AOD, AOD and surface reflectance are varied until a solution is found that gives a minimum residual between derived and prescribed spectral surface reflectance ratio between blue and red bands. The surface reflectances at the O2B band are derived from retrievals of other bands using the surface reflectance ratio database. The ALH is determined by minimizing differences between the measured 688/670 bands' top-of-atmosphere (TOA) reflectance ratio and the calculated ratio.

The retrieval algorithm was tested using the August-September 2020 TROPOMI data as a proxy over CONUS region where heavy smoke was observed.  The results show good AOD retrieval performance compared to ground-based Aerosol Robotic Network (AERONET) AOD:  the retrieved AOD has a correlation of 0.68, a bias of 0.11 and RMSE of 0.37 with respect to AERONET AOD.   Comparing to CALIOP ALH, the retrieved ALH has a correlation of 0.67, a bias of 0.91 km and an RMSE of 2.59 km.  Preliminary AOD retrieval from TEMPO data also demonstrates favorable agreement with AOD from the ABI instrument onboard GOES-East.

Disclaimer: The scientific results and conclusions, as well as any views or opinions expressed herein, are those of the author(s) and do not necessarily reflect those of NOAA or the Department of Commerce.

How to cite: Zhang, H., Kondragunta, S., and Ciren, P.: TEMPO Aerosol Retrieval Algorithm, EGU General Assembly 2024, Vienna, Austria, 14–19 Apr 2024, EGU24-11547, https://doi.org/10.5194/egusphere-egu24-11547, 2024.

EGU24-11978 | ECS | Orals | AS3.31

Development of a Land-Use Regression of Hourly Surface NO2 in preparation for GeoXO Atmospheric Composition Data 

Omar Nawaz, Susan Anenberg, Daniel Goldberg, Gaige Kerr, and Shobha Kondragunta

The Geostationary Extended Observations (GeoXO) satellite system is the intended successor to the GOES-R Series from NOAA, and it is planned to begin operating in the early 2030s. This next generation system will be outfitted with an Atmospheric Composition Instrument (ACX) that will provide hourly observations of tropospheric trace gases and aerosols including pollutants associated with poor health; the highest priority factors for air quality monitoring in this new system include some of the pollutants most hazardous to human health such as ozone (O3), particulate matter (PM), and nitrogen dioxide (NO2). GeoXO will be a geostationary satellite with multiple overpasses of the United States per day in contrast to the TROPOspheric Monitoring Instrument (TROPOMI) on board the sun-synchronous polar-orbiting Sentinel-5P satellite. This satellite – launched by the European Space Agency – overpasses each place on Earth 1-2 times per day around 1:30 PM.

In this project, we evaluate the influence that GeoXO remote sensing capabilities could have for assessing air pollution-related health impacts in the United States. We do this by comparing the health effects associated with predicted NO2 exposure at TROPOMI overpass times to predicted NO2 exposure during daylight hours. To conduct this comparison, we develop a land-use regression (LUR) model that predicts hourly surface-level NO2 data per month in the United States using monthly oversampled TROPOMI NO2 columns, static land-use data including roads, population density, built environment and elevation differential, and hourly meteorological reanalysis data of temperature, boundary layer height, precipitation, and total liquid water column amount. We fuse these variables using different regression techniques including both a lasso and multi-layer perceptron regression to predict monthly surface-level NO2 during daylight hours.

We compare the predicted hourly surface-level NO2 to NO2 derived just at TROPOMI overpass time – approximately 1:30 PM – to quantify how geostationary observations could better reveal how populations are exposed to pollutants like NO2 than exposures that are reliant on data from a single overpass time. We additionally investigate the health disparity introduced from this assumption by estimating the new pediatric asthma cases and premature mortality associated with hourly daylight NO2 exposure versus NO2 exposure from just a single overpass time. Additionally, we discuss how data from the new TEMPO instrument – that was launched by NASA in 2023 – will influence and improve this TROPOMI-derived LUR.

How to cite: Nawaz, O., Anenberg, S., Goldberg, D., Kerr, G., and Kondragunta, S.: Development of a Land-Use Regression of Hourly Surface NO2 in preparation for GeoXO Atmospheric Composition Data, EGU General Assembly 2024, Vienna, Austria, 14–19 Apr 2024, EGU24-11978, https://doi.org/10.5194/egusphere-egu24-11978, 2024.

EGU24-12496 | ECS | Posters on site | AS3.31

Cloud characterization for trace gas retrievals over snow using O2-O2 and oxygen B-band absorption 

Lukas Fehr, Daniel Zawada, Doug Degenstein, and Adam Bourassa

Geostationary measurements of trace gases provide valuable air quality data at unprecedented temporal scales. At high latitudes challenges begin to arise, such as lines of sight that stray from nadir, and (during winter) limited sunlight and pervasive snow cover. Motivated by the desire to fully take advantage of TEMPO (Tropospheric Emissions: Monitoring of Pollution) measurements over Canada, we investigate one of these issues: snow.

A key challenge with measurements over snowy scenes is the similar reflectivity of snow and clouds. Trace gas algorithms rely on the contrast between surface and cloud reflectivities to estimate an effective cloud fraction which is necessary to characterize the light path for cloudy scenes. This snow-cloud ambiguity ultimately compromises the data quality, denying the opportunity to capitalize on the potential increase in surface sensitivity offered by the high reflectivity of snow. Here we present an algorithm that simultaneously uses O2-O2 and oxygen B-band absorption to extract cloud data for trace gas retrievals while reducing dependency on the surface-cloud reflectivity contrast.

How to cite: Fehr, L., Zawada, D., Degenstein, D., and Bourassa, A.: Cloud characterization for trace gas retrievals over snow using O2-O2 and oxygen B-band absorption, EGU General Assembly 2024, Vienna, Austria, 14–19 Apr 2024, EGU24-12496, https://doi.org/10.5194/egusphere-egu24-12496, 2024.

EGU24-13271 | Posters on site | AS3.31

Explore and Analyse Atmospheric Composition – perform multi-domain correlations with Innovative Online Data Access Services (Data Cubes) 

Julian Meyer-Arnek, Frank Baier, Jonas Müller, Andre Twele, Torsten Heinen, Stephan Kiemle, and Eberhard Mikusch

DLR’s EOC Geoservice (https://geoservice.dlr.de) is operational for than 10 years and provides access to a multitude of operational EO and EO-related products via OGC-compliant interfaces WMS and WCS. ISO metadata on data collections and products are exposed via standard compliant catalogue services. In order to support the currently arising needs for interoperability and for the analysis of long EO timeseries (big data analytics), innovative technologies and interfaces for data discovery, access and analysis were investigated and are now implemented. In particular to facilitate improved EO-(meta-)data discovery, the STAC API (SpatioTemporal Asset Catalogue) is provided by the EOC Geoservice besides the “traditional” OpenSearch API.

STAC is an extremely powerful interface: It supports simplified “human” discovery of EO data collections and dedicated EO products in the webbrowser (to identify individual scenes or products) as well as powerful machine-to-machine-interfaces for EO-product discovery according to spatio-temporal selection criteria.

The STAC-API allows to easily access published datasets via data cube concepts, supporting direct integration in operational processing environments or into interactive Jupyter notebooks. In Python, discovery and access of data products according to spatio-temporal user requirements can be implemented in only a few lines of simple code.

All required interpolation and data slicing is completely performed on the server. This supports perfect interoperability: EO-products originated from different providers can simply be interpolated onto an identical spatio-temporal grid for further analysis on the client side. Only preprocessed (sliced and/or interpolated) data is transferred to the client, significantly reducing required bandwidth.

Among the suite of value-added EO-products available at the EOC Geoservice are a variety of atmosphere-related Level-3 EO-products from GOME-2/MetOp-A/B/C as well as innovative Level 3 trace gas, cloud and radiation products derived from Sentinel-5P/TROPOMI observations. This also accounts for assimilated trace gas concentrations based on Sentinel-5P-observations. This hourly Level 4-product is generated by the POLYPHEMUS/DLR-system. In addition, value-added EO-products such as the World Settlement Footprint (WSF) can be accessed at EOC Geoservice: They allow correlation to spatio-temporal patterns of anthropogenic activity.

As soon as they become available, Level 3 and Level 4 EO-products from Sentinel 4 (geostationary) and Sentinel 5 (LEO) will become discoverable via EOC Geoservice’s STAC interface.

With respect to STAC, most recent improvements (including feasibility studies, development and implementation into EOC Geoservice’s operational environment) have been funded in the framework of the ESA GSTP-project “Technologies for the Management of Long EO Data Time Series” (LOOSE). Integration of innovative interfaces into an operational data discovery, access and analysis service (EOC Geoservice and DataCube) for the Copernicus atmospheric composition missions Sentinel-5P, Sentinel-4 and Sentinel-5 is supported by the DLR programmatic project “Innovative Produktentwicklung zur Analyse der Atmosphärenzusammensetzung” (INPULS).

How to cite: Meyer-Arnek, J., Baier, F., Müller, J., Twele, A., Heinen, T., Kiemle, S., and Mikusch, E.: Explore and Analyse Atmospheric Composition – perform multi-domain correlations with Innovative Online Data Access Services (Data Cubes), EGU General Assembly 2024, Vienna, Austria, 14–19 Apr 2024, EGU24-13271, https://doi.org/10.5194/egusphere-egu24-13271, 2024.

EGU24-13470 | Orals | AS3.31

Investigating expanding air pollution and climate change on the African continent 

Pieternel Levelt, Eloise A Marais, Helen Worden, Wenfu Tang, Sara Martinez-Alonso, David Edwards, Henk Eskes, Pepijn Veefkind, Steve Brown, Collins Gameli Hodoli, Allison Felix Hughes, Barry Lefer, Drobot Sheldon, and Dan Westervelt

In the next few decades a large increase in population is expected to occur on the African continent, leading to a doubling of the current population, which will reach 2.5 billion by 2050. At the same time, Africa is experiencing substantial economic growth. As a result, air pollution and greenhouse gas emissions will increase considerably with significant health impacts to people in Africa. In the decades ahead, Africa’s contribution to climate change and air pollution will become increasingly important. The time has come to determine the evolving role of Africa in global environmental change.  

We are building an Atmospheric Composition Virtual Constellation, as envisioned by the Committee on Earth Observation Satellites (CEOS), by adding to our polar satellites,  geostationary satellites in the Northern Hemisphere : GEMS over Asia (launch 2022); TEMPO over the USA (launch 2023) and Sentinel 4 over Europe to be launched in the 2024 timeframe. However, there are currently no geostationary satellites envisioned over Africa and South-America, where we expect the largest increase in emissions in the decades to come.

In this paper the scientific need for geostationary satellite measurements over Africa will be described, partly based on several recent research achievements related to Africa using space observations and modeling approaches, as well as first assessments using the GEMS data over Asia, and TEMPO over the USA. Our ambition is to develop an integrated community effort to better characterize air quality and climate-related processes on the African continent. 


How to cite: Levelt, P., Marais, E. A., Worden, H., Tang, W., Martinez-Alonso, S., Edwards, D., Eskes, H., Veefkind, P., Brown, S., Gameli Hodoli, C., Felix Hughes, A., Lefer, B., Sheldon, D., and Westervelt, D.: Investigating expanding air pollution and climate change on the African continent, EGU General Assembly 2024, Vienna, Austria, 14–19 Apr 2024, EGU24-13470, https://doi.org/10.5194/egusphere-egu24-13470, 2024.

EGU24-13628 | ECS | Posters virtual | AS3.31

Retrieval algorithm for GEMS aerosol optical properties: Improvement, validation, and post-processing 

Yeseul Cho, Jhoon Kim, Sujung Go, Mijin Kim, Seoyoung Lee, Minseok Kim, Hyunkee Hong, Dong-Won Lee, and Omar Torres

The Geostationary Environment Monitoring Spectrometer (GEMS), a pioneering Geostationary Earth Orbit (GEO) satellite instrument for air quality observation, is designed for atmospheric environmental monitoring and provides aerosol optical properties (AOPs). In this work, improvements to the GEMS aerosol retrieval algorithm, including spectral binning, surface reflectance estimation, cloud masking, and post-processing, are presented, along with validation results. These improvements aim to provide more accurate aerosol monitoring outcomes across Asia. Adopting spectral binning within the Look-Up Table (LUT) reduces random measurement errors and provides the stability of satellite data. Furthermore, Furthermore, a high-resolution surface reflectance database is constructed by considering monthly Background Aerosol Optical Depth (BAOD) values. This is based on the minimum reflectance method at the GEMS pixel resolution. The implementation of new cloud removal techniques enhances the accuary of cloud detection. Validation of GEMS AOD products against data from the AErosol RObotic NETwork (AERONET) and Cloud-Aerosol Lidar with Orthogonal Polarization (CALIOP) from November 2021 to October 2022 reveals a robust correlation with AERONET AOD (R=0.792). Different validation outcomes are observed for different aerosol types, namely Highly Absorbing Fine, Dust, and Non-absorbing. GEMS Single Scattering Albedo (SSA) aligns well with AERONET data within acceptable error margins, although accuracy varies among aerosol types. When GEMS AOD exceeds 0.4, 42.76% of GEMS SSA values fall within the expected error range of ±0.03, and 67.25% fall within the range of ±0.05. The comparison of GEMS Aerosol Layer Height (ALH) with CALIOP data shows commendable agreement, with a mean discrepancy of -0.225 km and 55.29% (71.70%) of the data within ±1 km (±1.5 km). However, to address the issue of artifactual diurnal biases in AOD measurements, a machine learning-based post-processing correction method is developed. Post-process correction enhances GEMS AOD performance, reducing biases. In particular, the slope is close to 1, at 0.806 and the R is 0.897. Post-process correction also enhances GEMS SSA performance. 68.54% of GEMS SSA values fall within the expected error range of ±0.03, and 88.95% fall within the range of ±0.05.

How to cite: Cho, Y., Kim, J., Go, S., Kim, M., Lee, S., Kim, M., Hong, H., Lee, D.-W., and Torres, O.: Retrieval algorithm for GEMS aerosol optical properties: Improvement, validation, and post-processing, EGU General Assembly 2024, Vienna, Austria, 14–19 Apr 2024, EGU24-13628, https://doi.org/10.5194/egusphere-egu24-13628, 2024.

EGU24-13808 | Posters on site | AS3.31

Aerosol Type Classification and Surface Reflectance Optimization for GOCI-II Aerosol Retrieval. 

Jeewoo Lee, Jhoon Kim, and Seoyoung Lee

Since its launch in 2020, the GOCI-II (Geostationary Ocean Color Imager-II) onboard the GEO-KOMPSAT-2B (GK-2B) satellite has provided aerosol products using the Yonsei aerosol retrieval (YAER) algorithm (Lee et al., 2023). The GOCI-II YAER algorithm retrieves aerosol optical depth (AOD) at 550 nm using an inversion algorithm with a precalculated look-up table (LUT) over UV to near-IR wavelengths. The surface reflectance database is collected using the Cox and Munk method (Cox and Munk, 1954) and the minimum reflectance technique (Hsu et al., 2004) over ocean and land, respectively. The minimum value of Lambertian Equivalent Reflectance (LER) of each wavelength is designated as the surface reflectance at each pixel. The 550 nm AOD is calculated by averaging the weighted AOD of two aerosol types that minimize the standard deviation among the six pre-assumed types.

In this study, we improved the performance of the GOCI-II YAER algorithm by renewing the surface reflectance database and the aerosol type selection phase. First, we validated the spectral AOD of the YAER algorithm to that of the AErosol RObotic NETwork (AERONET) to test the accuracy fluctuations between each wavelength. The wavelength with its AOD showing the highest consistency with that of AERONET was selected as the standard of the minimum reflectance composition. Second, aerosol type selection was modified to consider more information on the aerosol optical properties. As a result, the improved product showed better validation statistics when compared to AERONET AOD in terms of % within expected error (EE), the correlation coefficient, and the root mean squared error (RMSE). The improved GOCI-II aerosol products can help the air quality policymakers and broaden our knowledge of distribution of aerosols over Northeast Asia.

How to cite: Lee, J., Kim, J., and Lee, S.: Aerosol Type Classification and Surface Reflectance Optimization for GOCI-II Aerosol Retrieval., EGU General Assembly 2024, Vienna, Austria, 14–19 Apr 2024, EGU24-13808, https://doi.org/10.5194/egusphere-egu24-13808, 2024.

EGU24-14053 | Orals | AS3.31

Overview of Airborne Field Campaigns under TEMPO for Calibration and Validation of Trace Gas and Aerosol Products 

Brian McDonald, Owen Cooper, Carsten Warneke, Rebecca Schwantes, Andrew Rollins, Sunil Baidar, and Steven Brown and the AEROMMA / CUPiDS cal/val team

The North American component of the Geo-Ring for Air Quality, the Tropospheric Emissions: Monitoring of Pollution (TEMPO) instrument, began collecting measurements on August 2, 2023. Multiple airborne field-intensives were conducted over the US during this TEMPO first-light period, including the NOAA Atmospheric Emissions and Reactions Observed from Megacities to Marine Areas (AEROMMA) and Coastal Urban Plume Dynamics Study (CUPiDS) campaigns, coordinated with the NASA Synergistic TEMPO Air Quality Sciences (STAQS) campaign. The North American cities targeted included New York City, Los Angeles, Chicago, and Toronto. Here, we present an overview of the AEROMMA / CUPiDS collected summer 2023 datasets, relevant for calibration and validation activities of TEMPO, including for ozone (O3), nitrogen dioxide (NO2), formaldehyde (CH2O), sulfur dioxide (SO2), aerosol optical depth (AOD), and aerosol layer height (ALH). Ground-based lidar and airborne in-situ vertical profiling by the NASA DC-8 and NOAA Twin Otter aircraft are available for evaluating TEMPO Level 2 O3 profile products (tropospheric and 0-2 km column retrievals). Airborne measurements of NO2 (photolytic conversion of NO2 into NO followed by laser-induced fluorescence, cavity enhanced spectroscopy, and multi-axis differential optical absorption spectroscopy (MAX-DOAS)) are available for evaluating TEMPO Level 2 NO2 vertical column density products. Airborne measurements of formaldehyde and glyoxal (in-situ and MAX-DOAS remote sensing) can be evaluated similarly as other volatile organic compounds (VOCs). Lastly, a wide array of aircraft-based in-situ measurements of composition, size distribution, optical properties can be utilized to derive aerosol optical depth (AOD) and aerosol extinction profiles for evaluating TEMPO AOD and ALH products, along with TROPOMI and stereoscopic aerosol layer height products from GOES-16/18. Preliminary evaluation of TEMPO NO2 will be presented as an initial calibration / validation test case, employing best practices to facilitate direct comparisons between airborne data with TEMPO Level 2 observations.

How to cite: McDonald, B., Cooper, O., Warneke, C., Schwantes, R., Rollins, A., Baidar, S., and Brown, S. and the AEROMMA / CUPiDS cal/val team: Overview of Airborne Field Campaigns under TEMPO for Calibration and Validation of Trace Gas and Aerosol Products, EGU General Assembly 2024, Vienna, Austria, 14–19 Apr 2024, EGU24-14053, https://doi.org/10.5194/egusphere-egu24-14053, 2024.

EGU24-14173 | Orals | AS3.31

A New Era of Air Quality Monitoring from Space overNorth America with TEMPO: Commissioning and Early Nominal Operation Results 

Xiong Liu, Kelly Chance, Raid Suleiman, John Houck, John Davis, Gonzalo Gonzalez Abad, Caroline Nowlan, Huiqun Wang, Heesung Chong, and Weizhen Hou and the TEMPO Team

We present an overview of the initial data products of TEMPO during its commissioning and early nominal operation and preliminary comparison with correlative satellite and ground-based observations.

TEMPO is NASA’s first Earth Venture Instrument (EVI) and first host payload. It measures hourly daytime atmospheric pollution over North America from Mexico City to the Canadian oil sands, and from the Atlantic to the Pacific, at high spatiotemporal resolution (~10 km2 at boresight) from the geostationary (GEO) orbit. It uses UV/visible spectroscopy (293-493 nm, 538-741 nm) to measure O3 profiles including lower tropospheric O3 and columns of NO2, H2CO, SO2, C2H2O2, H2O, BrO, IO, as well as clouds aerosols, and UVB. TEMPO provides a tropospheric measurement suite that includes the key elements of tropospheric air pollution chemistry and captures the inherent high variability in the diurnal cycle of emissions and chemistry. The TEMPO instrument was built by Ball in 2018. It was integrated into the host commercial communication satellite Intelsat 40e (IS-40e) by Maxar. IS-40e was successfully launched on April 7 by a SpaceX Falcon 9 rocket on to the GEO orbit at 91°W. The TEMPO Instrument powered up for the first time on orbit in early June to start its commissioning. After a month of dry out and activation, TEMPO first light of solar and earth measurements occurred on July 31-August 2. Nominal operation started on 19 October 2023 after the commissioning phase and the post-launch acceptance review. Science data products are archived and distributed at NASA’s ASDC and will be released to the public in approximately February 2024 for L1b and in April 2024 for L2/3. TEMPO is part of a geostationary constellation to measure air quality along with GEMS (launched in Feb. 2020) over Asia and Sentinel-4 (to launch in 2024) over Europe.

How to cite: Liu, X., Chance, K., Suleiman, R., Houck, J., Davis, J., Gonzalez Abad, G., Nowlan, C., Wang, H., Chong, H., and Hou, W. and the TEMPO Team: A New Era of Air Quality Monitoring from Space overNorth America with TEMPO: Commissioning and Early Nominal Operation Results, EGU General Assembly 2024, Vienna, Austria, 14–19 Apr 2024, EGU24-14173, https://doi.org/10.5194/egusphere-egu24-14173, 2024.

EGU24-14190 | ECS | Posters on site | AS3.31

Characteristics and Results of Cloud Retrieval Algorithm for Geostationary Environment Monitoring Spectrometer 

Bo-Ram Kim, Gyuyeon Kim, Minjeong Cho, and Yong-Sang Choi

The cloud retrieval algorithm used by the Geostationary Environment Monitoring Spectrometer (GEMS) to monitor atmospheric conditions over East Asia is presented in this paper. In the UV-VIS range, cloud increase radiance and shorten the beam bath length. We defined cloud products as the effective cloud fraction, which represents the reflecting impact of clouds, and the cloud centroid pressure, which indicates the height at which clouds reflect. The absorption in the O2-O2 absorption band, which results from collisions of oxygen molecules in the atmosphere with generally constant concentrations, is used by the algorithm to determine the characteristics of clouds. Input data include observed radiance, irradiance, observation geometry, and surface information (reflectance and pressure). We evaluate the algorithm’s sensitivity to each input data. Moreover, we perform a monthly comparison and analysis of the actual cloud retrieval products acquired from GEMS with TROPOMI (Tropospheric Monitoring Instrument), investigating the algorithm's seasonality. Additionally, events showcasing prominent cloud features, such as high concentrations of air pollutants, typhoons, and sea fog, are chosen for performance evaluation through comparisons between GEMS results and those from TROPOMI, Advanced Meteorology Imager, and Cloud-Aerosol Lidar with Orthogonal Polarization. In comparing GEMS cloud retrieval results with those of other satellites, distinct variations based on land and ocean surfaces were observed, overshadowing the impact of seasonal differences. However, the CCP exhibited reduced accuracy during thick cloud in the summer season. This feature was consistently seen in event analysis, especially in cases of typhoons with diverse cloud shapes. In thin-cloud regions, CCP was comparable to other satellites; in thick-cloud regions, significant differences were seen. Besides, the investigation showed that GEMS had a tendency to identify clouds over highly reflective, low-altitude sea fog, resulting in CCP values that were comparable to surface pressure. This special quality made it possible to accurately characterize the characteristics of sea fog.

How to cite: Kim, B.-R., Kim, G., Cho, M., and Choi, Y.-S.: Characteristics and Results of Cloud Retrieval Algorithm for Geostationary Environment Monitoring Spectrometer, EGU General Assembly 2024, Vienna, Austria, 14–19 Apr 2024, EGU24-14190, https://doi.org/10.5194/egusphere-egu24-14190, 2024.

EGU24-14218 | Posters virtual | AS3.31

HONO Retrievals over Asia from the Geostationary Environment Monitoring Spectrometer (GEMS) 

Hyeji Cha, Jhoon Kim, Heesung Chong, Gonzalo González Abad, Dha Hyun Ahn, Sangseo Park, and Won-jin Lee

The hydroxyl radical (OH) plays a significant role in the atmosphere, driving the oxidation and removal of most trace gases. Therefore, quantifying the sources of OH is of great importance to the scientific community. Researchers have been particularly interested in the role of nitrous acid (HONO) in tropospheric photochemistry, as HONO serves as a source of OH. While ground-based measurements have been conducted in certain regions, there is a need for more extensive observations of HONO to enhance our understanding of its chemistry. In this study, the HONO retrieval algorithm from the Geostationary Environment Monitoring Spectrometer (GEMS) are presented, utilizing the ultraviolet spectra. The retrieval process consists of three steps: spectral fitting, air mass factor calculation, and post-processing. The retrieval window of 343.0 – 371.0nm is employed to obtain HONO slant columns and air mass factor calculation is performed using a monochromatic wavelength of 357 nm. Reference sector correction is then applied to compensate for the HONO slant columns from radiance reference spectrum. Focusing on biomass burning events, the increase in HONO from fire plumes was presented as the retrieved results. By refining the retrieval algorithm, more information on HONO chemistry as well as diurnal patterns is expected to be obtained.

How to cite: Cha, H., Kim, J., Chong, H., González Abad, G., Ahn, D. H., Park, S., and Lee, W.: HONO Retrievals over Asia from the Geostationary Environment Monitoring Spectrometer (GEMS), EGU General Assembly 2024, Vienna, Austria, 14–19 Apr 2024, EGU24-14218, https://doi.org/10.5194/egusphere-egu24-14218, 2024.

EGU24-15076 | ECS | Orals | AS3.31

The Copernicus Sentinel-4 UVN mission: status and ongoing activities at EUMETSAT   

Vinod Kumar, Frank Rüthrich, Sebastian Gimeno Garcia, Myojeong Gu, Praveen Pandey, Malcolm Taberner, Rasmus Lindstrot, Marcel Dobber, Jochen Grandell, Berit Ahlers, Ben Veihelmann, Gregory Bazalgette Courreges-Lacoste, and Bojan Bojkov

The Copernicus Sentinel-4/UVN mission is Europe's contribution to the virtual constellation of air quality related sensors in geostationary orbit. It is planned to be launched in 2025 on board EUMETSAT’s Meteosat Third Generation – Sounder (MTG-S) platform and complement the Korean GEMS and American TEMPO instruments which are already in orbit over Asia and North America, respectively.

Following the space segment development and in-orbit commissioning under ESA responsibility, EUMETSAT will be responsible for operations, data processing and continuous calibration/validation of the Copernicus Sentinel-4 instruments and the derived operational products. The state-of-the-art UVN sounder onboard the MTG-S satellite covers the UV to NIR spectral range to provide hourly high spatial resolution measurements of several trace gas and aerosol concentrations and vertical profiles, crucial for monitoring atmospheric pollution. Other instruments (e.g., the Infrared Sounder, Lightning Imager and Flexible Combined Imager) onboard the MTG platforms will provide complementary information about temperature, clouds, and atmospheric constituents like water vapour.

In this presentation, we will cover the progress achieved at EUMETSAT for the Sentinel-4 UVN mission with respect to the readiness of the ground segment including the in-orbit calibration key data (CKD) generation. We will put forward the in-flight measurement sequences and manoeuvres that are meant to secure the quality of the generated L1 and L2 data. We will show the results of the system validation test performed with the EUMETSAT ground segment and Telespazio after the successful mechanical integration of the instrument onto the platform in September 2023. We will also present the ongoing preparation and planned activities concerning the development of tools and facilities for monitoring and operational validation.

How to cite: Kumar, V., Rüthrich, F., Garcia, S. G., Gu, M., Pandey, P., Taberner, M., Lindstrot, R., Dobber, M., Grandell, J., Ahlers, B., Veihelmann, B., Courreges-Lacoste, G. B., and Bojkov, B.: The Copernicus Sentinel-4 UVN mission: status and ongoing activities at EUMETSAT  , EGU General Assembly 2024, Vienna, Austria, 14–19 Apr 2024, EGU24-15076, https://doi.org/10.5194/egusphere-egu24-15076, 2024.

EGU24-15371 | Orals | AS3.31

Diurnal variations of anthropogenic sulfur dioxide over Asia observed from GEMS 

Jeonghyeon Park, Hanlim Lee, Hyunkee Hong, and Jhoon Kim

Sulfur dioxide emissions (SO2) from coal-fired power plants are known as a major contributor to air pollution. SO2 emitted into the atmosphere forms sulfate aerosols, leading to acid rain and causing damage to forests. Moreover, exposure to SO2 in humans can cause eye irritation and affect respiratory health. This study presents the column density variations of anthropogenic SO2 over Asia using the Geostationary Environment Monitoring Spectrometer (GEMS) onboard the Geostationary Korea Multi-Purpose Satellite-2B (GEO-KOMPSAT-2B). We investigated the diurnal variations of SO2 emissions from anthropogenic sources, such as coal-fired power plants in India. Retrieved SO2 columns from GEMS were compared with low-orbit satellites In the GEMS observation area, there was a tendency of low sensitivity in SO2 retrieval due to scattering by air molecules in the high geometry region, particularly at a high viewing zenith angle (VZA), resulting in high uncertainty in SO2 retrieval. We discuss these tendencies in detail through an investigation of SO2 retrieval sensitivity based on concentration and geometry.

How to cite: Park, J., Lee, H., Hong, H., and Kim, J.: Diurnal variations of anthropogenic sulfur dioxide over Asia observed from GEMS, EGU General Assembly 2024, Vienna, Austria, 14–19 Apr 2024, EGU24-15371, https://doi.org/10.5194/egusphere-egu24-15371, 2024.

EGU24-16250 | Posters on site | AS3.31

Development and evaluation of the NO2 profile algorithm from Pandora measurements in South Korea 

Serin Kim, Ukkyo Jeong, Hanlim Lee, Robert J. D Spurr, and Hyunkee Hong

The algorithm developed for retrieving Nitrogen Dioxide (NO2) profiles utilizes optimal estimation and is based on sky measurement data obtained from the Pandora instrument. In this study, the Aerosol Optical Thickness (AOT) was calculated and employed as an input parameter through the SMART-s algorithm (Jeong et al., 2022).  The NO2 profile was retrieved by least-square fitting utilizing the VLIDORT radiative transfer model with a priori information derived from Community Earth System Model (CESM) data. Pandora measurements were taken in Yongin, South Korea from December 2021 to January 2022. The retrieved NO2 profile was compared with surface NO2 concentrations near two in situ sites. The correlation and Root Mean Square Error (RMSE) between the surface concentration measured by Pandora and the two in situ sites were approximately 0.56 and 12.24 ppb, respectively. A higher correlation was observed with in situ locations positioned along the line of sight compared to nearer sites. This correlation was further enhanced when incorporating aerosol optical thickness directly obtained from Pandora measurements. The findings of this study suggest that considering aerosol information in the retrieval of NO2 profiles, as measured values, can contribute to improvements.

How to cite: Kim, S., Jeong, U., Lee, H., Spurr, R. J. D., and Hong, H.: Development and evaluation of the NO2 profile algorithm from Pandora measurements in South Korea, EGU General Assembly 2024, Vienna, Austria, 14–19 Apr 2024, EGU24-16250, https://doi.org/10.5194/egusphere-egu24-16250, 2024.

EGU24-16468 | Orals | AS3.31 | Highlight

NOx emissions over Europe from Sentinel 5P and towards Sentinel 4 

Ronald van der A, Jieying Ding, and Henk Eskes

Since the launch of the Sentinel 5P satellite, NO2 observations have become available with a resolution of 3.5x5 km, which allows for the monitoring of NOx emissions at the scale of city districts and industrial facilities. For Europe, emissions are annually reported for country totals and large industrial facilities and these are made publicly available via the European Environmental Agency . Satellite observations can provide independent and more timely information on NOx and NH3 emissions. A new version of the inversion algorithm DECSO (Daily Emissions Constraint by Satellite Observations) has been developed for deriving NOx and NH3 emissions for Europe on a daily basis, averaged to monthly mean maps. These are based on observations of TROPOMI (Sentinel 5p) and CrIS. In a newly developed post-processing step anthropogenic NOx emissions are separated from soil NOx emissions. These satellite-derived emissions from DECSO have been compared for industrial locations, cities and country totals to the officially reported European emissions and spatial-temporal disaggregated emission inventories like CAMS. In addition, a branch of DECSO is developed to derive hourly NOx emissions. This new approach has been demonstrated for a high latitude region (around 70 degree North) in summer time, when multiple orbits of Sentinel 5P cover the same location on a single day.

How to cite: van der A, R., Ding, J., and Eskes, H.: NOx emissions over Europe from Sentinel 5P and towards Sentinel 4, EGU General Assembly 2024, Vienna, Austria, 14–19 Apr 2024, EGU24-16468, https://doi.org/10.5194/egusphere-egu24-16468, 2024.

EGU24-17722 | Orals | AS3.31

Diurnal characteristics of the NO2 columns observed over Asia from Geostationary Environment Monitoring Spectrometer (GEMS) 

Hanlim Lee, Junsung Park, Hyunkee Hong, Jhoon Kim, Hyo-Jung Lee, Yeonjin Jung, Michel Van Roozendael, Caroline Fayt, Rokjin Park, Siwan Kim, Myong-Hwan Ahn, Daniel J. Jacob, Daewon Kim, Wonei Choi, Won-Jin Lee, Dong-Won Lee, Thomas Wagner, Andreas Richter, Nickolay A. Krotkov, and Lok N. Lamsal

Nitrogen oxides are key gas components of emissions from fossil-fuel combustion, are known to degrade air quality and have adverse health effects. Diurnal NO2 observations are crucial for enhancing our understanding of NOx emissions, lifetime, and chemistry. Geostationary Environment Monitoring Spectrometer (GEMS) has been providing hourly observations NO2 columns over Asia since November 2020. The latest NO2 version 3 products have significantly improved with updated air mass factors (AMFs) and the separation of stratospheric and tropospheric columns. To identify the dependency of the distribution on the time of the day, we investigated hourly tropospheric NO2 cycles of cities over Asia using GEMS measurements for the first time. The cities show similar diurnal concentration patterns with peaks in the morning and troughs in the afternoon, although the amplitude and specific times vary by city. The reduction rate of NO2 was influenced by the temporal dependence of the spatial distribution within and around cities. We also observed distinct NO2 diurnal patterns in certain industrial areas and cities where NOx emissions are thought to be controlled. To explain the location-dependent variations of the tropospheric NO2 columns, we compared the diurnal NO2 cycles obtained from the GEMS measurement with WRF-Chem models for some cities. In addition, estimated top-down NOx emissions from GEMS measurements are presented in comparison with bottom-up emission inventory, showing a smaller difference compared to the top-down emission from TROPOMI measurements. It is expected that hourly top-down NOx emissions using GEMS measurements can provide a useful information in improving the future performance of air quality modeling.

How to cite: Lee, H., Park, J., Hong, H., Kim, J., Lee, H.-J., Jung, Y., Roozendael, M. V., Fayt, C., Park, R., Kim, S., Ahn, M.-H., Jacob, D. J., Kim, D., Choi, W., Lee, W.-J., Lee, D.-W., Wagner, T., Richter, A., Krotkov, N. A., and Lamsal, L. N.: Diurnal characteristics of the NO2 columns observed over Asia from Geostationary Environment Monitoring Spectrometer (GEMS), EGU General Assembly 2024, Vienna, Austria, 14–19 Apr 2024, EGU24-17722, https://doi.org/10.5194/egusphere-egu24-17722, 2024.

The advent of new satellite technologies has ushered in a promising era for trace gas and aerosol observations, offering advanced data quality and temporal resolution. Low Earth Orbit (LEO) satellites have markedly heightened our ability to generate accurate air quality forecasts. The Geo-Ring, comprising the geostationary satellites of GEMS over East Asia, TEMPO over North America and the imminent Copernicus Sentinel-4 over Europe, promises to unlock unprecedented possibilities in atmospheric monitoring.

The Horizon Europe CAMEO (CAMS EvOlution) project coordinated by the European Centre for Medium-Range Weather Forecasts (ECMWF) is dedicated to upgrading the quality and efficiency of the Copernicus Atmosphere Monitoring Service (CAMS). By integrating new satellite retrievals of atmospheric composition into the Integrated Forecast System (IFS), CAMEO aims to augment the data assimilation and inversion capabilities of the global and regional CAMS production system, thereby improving the quality of atmospheric composition analyses and forecasts.

During the initial year of CAMEO, the IFS was prepared to assimilate geostationary data alongside polar orbiting retrievals. This integration aims to optimise air quality modeling and provide a more accurate depiction of the diurnal cycle of O3, a pivotal component of atmospheric composition. The assimilation of a substantial volume of geostationary air quality data into the CAMS system poses challenges, necessitating the further development of the super observation software. Following updates to the IFS model and additional technical improvements, experiments were conducted using IFS version CY48R1 and the more recent CY49R1 to monitor and evaluate the Near Real-Time v.2. GEMS NO2 and O3 observations from April to December 2023.

Preliminary results reveal a notable positive bias in the GEMS NO2 tropospheric column data, consistently exceeding the model's first-guess and TROPOMI satellite observations. In urban and populated areas like Beijing, while similarities in structures and patterns of NO2 data between GEMS and TROPOMI are identified, significant discrepancies persist. The GEMS NO2 data also exhibit noticeable noise attributed to factors such as stratospheric correction, cloud treatment, and unspecified measurement errors. In the case of O3, GEMS demonstrates better performance than NO2 when compared to TROPOMI and the model's first guess, with no significant bias identified. Nonetheless, the current data version features large O3 gaps due to quality control measures. These findings offer crucial insights for refining the assimilation of geostationary air quality data, thereby enhancing forecasting and monitoring of atmospheric composition in CAMS. Upcoming releases, such as v.3. GEMS data, are anticipated to address the identified data issues, further amending the usefulness of the GEMS data for air quality applications. 

How to cite: Paschalidi, Z., Inness, A., Flemming, J., and Ribas, R.: Integrating Geostationary Satellite Data for Advanced Air Quality Modeling: Evaluating GEMS NRT Observations within the ECMWF’s IFS system for the HE CAMEO Project, EGU General Assembly 2024, Vienna, Austria, 14–19 Apr 2024, EGU24-19066, https://doi.org/10.5194/egusphere-egu24-19066, 2024.

EGU24-1267 | ECS | Posters virtual | AS3.32

Three ways to validate the XCO2 product from the Orbiting Carbon Observatory-2  

Saswati Das, Matthäus Kiel, Joshua Laughner, and Gregory Osterman

Carbon dioxide (CO2) is the primary greenhouse gas emitted into the atmosphere due to anthropogenic activities. While it is naturally present as a part of Earth’s carbon cycle, human activities impact the ability of natural sinks to reduce CO2 from the atmosphere and thus alter the carbon cycle. It thus becomes pertinent to focus on the long-term monitoring of atmospheric CO2 and the ability to make precise, accurate, and continuous CO2 measurements.

The Orbiting Carbon Observatory-2 (OCO-2) was launched in 2014. It is NASA’s first Earth-orbiting satellite dedicated to making observations of CO2 in the atmosphere and measuring its column-averaged dry-air mole fraction (XCO2). The primary goal of the OCO-2 mission is to provide XCO2 measurements with sufficient precision and accuracy alongside quantifying its seasonal and interannual variability. While OCO-2 provides global coverage and consistently measures at high latitudes, the remote sensing measurement of CO2 from space can be challenging. This is because the goal is to resolve inter-annual CO2 deviations to subcontinental scales, alongside capturing the known seasonal cycle and trends. Further, the XCO2 data is susceptible to location- and surface-property-dependent biases that must be corrected. Thus, validation of the XCO2 data from OCO-2 becomes necessary to ensure a high degree of retrieval accuracy on a global scale.

This study uses the new and improved OCO-2 V11.1 dataset and compares coincident XCO2 measurements against three independent datasets. The Total Carbon Column Observing Network (TCCON) is a network of solar-viewing ground-based Fourier Transform Spectrometers and the primary validation source for XCO2 from OCO-2. TCCON measurements are unaffected by surface properties and are minimally sensitive to aerosols. The COllaborative Carbon Column Observing Network (COCCON) is a network of portable ground-based Fourier Transform Infrared spectrometers that are less expensive than full TCCON sites and have lower spectral resolution, but are similarly insensitive to surface properties and aerosols. Comparison of coincident OCO-2 measurements against selected TCCON and COCCON sites indicate that the absolute average bias values are close to 0 ppm for TCCON and less than 0.7 ppm for COCCON in the Land Nadir/Glint and Target mode observations.

Finally, we compare coincident OCO-2 measurements to the airborne Atmospheric Tomography Mission (ATom) when ATom conducted around-the-world flights in each of the four seasons between 2016 and 2018. This study bridges the gap between satellite, ground-based, and airborne XCO2 measurements and aids the improvement of the OCO-2 XCO2 data product. Further, it provides the latest validation analysis for OCO-2, providing the most up-to-date information on biases and uncertainty in the OCO-2 data.

How to cite: Das, S., Kiel, M., Laughner, J., and Osterman, G.: Three ways to validate the XCO2 product from the Orbiting Carbon Observatory-2 , EGU General Assembly 2024, Vienna, Austria, 14–19 Apr 2024, EGU24-1267, https://doi.org/10.5194/egusphere-egu24-1267, 2024.

EGU24-1768 | ECS | Posters on site | AS3.32

Towards regional CH4 inversions with ICON-ART assimilating satellite TROPOMI data over Europe 

David Ho, Michael Steiner, Erik Koene, Michał Gałkowski, Julia Marshall, and Christoph Gerbig

Inversion modeling is a top-down technique to infer greenhouse gas (GHG) emissions using atmospheric observations. In particular, the use of satellite retrievals have been attractive due to their advantage in dense spatial coverage compared to typically sparse surface networks.
The goal of this study is to assimilate satellite data at high spatial resolution to independently locate and quantify GHG sources and sinks, which can be used as a reference for carbon budget studies and policy makers. The findings also contribute as groundwork for the development of the Integrated GHG Monitoring System for Germany (ITMS).
For this purpose, we coupled the numerical weather prediction and atmospheric transport model ICON-ART with an Ensemble Kalman Filter (EnKF) based inversion system, using the CarbonTracker Data Assimilation Shell (CTDAS). We use column data (XCH4) measured by the TROPOspheric Monitoring Instrument (TROPOMI) onboard the Sentinel-5 Precursor satellite, targeting anthropogenic CH4 fluxes over Europe. Prior anthropogenic emissions are taken from the EDGARv4.3.2 inventory, while natural fluxes were derived from peatlands, mineral soils, lakes, oceans, biofuels, biomass burning, termites, and geology. 
We first present a synthetic study of our system by performing an ensemble simulation forward in time with randomly perturbed emission fields. CH4 fluxes were retrieved at 0.25° x 0.25° resolution, and prior emissions are scaled to optimally fit the measured values. With this idealized experiment, we demonstrate that the system is capable of capturing the prescribed spatial pattern applied onto the emission field, using pseudo-observations of satellite retrievals with realistic coverage. In addition, we report on the results of assimilating real observations into the system, including emission estimates and their associated uncertainties. 
This study demonstrates the potential of incorporating satellite retrievals into inverse modeling, enabling us to extend its application to other GHG species. It also serve as a preparation work for the planned Copernicus Anthropogenic Carbon Dioxide Monitoring (CO2M) satellite mission.

How to cite: Ho, D., Steiner, M., Koene, E., Gałkowski, M., Marshall, J., and Gerbig, C.: Towards regional CH4 inversions with ICON-ART assimilating satellite TROPOMI data over Europe, EGU General Assembly 2024, Vienna, Austria, 14–19 Apr 2024, EGU24-1768, https://doi.org/10.5194/egusphere-egu24-1768, 2024.

EGU24-1841 | ECS | Posters on site | AS3.32

Using space-based NO2 observations to indirectly estimate anthropogenic CO2 emissions 

Xiaojuan Lin, Ronald van der A, Jos de Laat, Henk Eskes, Vincent Huijnen, Bas Mijling, Jieying Ding, and Zhu Liu

Since anthropogenic NOx (NOx=NO+NO2) and CO2 are co-emitted species for anthropogenic sources, some studies have used the NOx emissions retrieved from satellite observations to infer the anthropogenic CO2 emissions. However, these studies did not consider the fact that satellites measure total NO2 concentrations and their inferred emissions encompass both biogenic and anthropogenic sources. In this study, we introduce a method to distinguish soil NOx emissions from satellite-based total NOx emissions. The total NOx emissions are derived by the state-of-the-art inverse algorithm DECSO (Daily Emission estimation Constrained by Satellite Observations, Mijling and van der A, 2012; Ding et al., 2017a) from TROPOMI observations. Using the characteristic seasonal cycle of soil emissions we derive these emissions for representative regions with only biogenic emissions, which are then applied to nearby regions according land-use fractions. To evaluate this approach, we compared the deviation between the tropospheric NO2 concentration observed by satellite and two atmospheric composition model simulations: one using the satellite-derived soil NOx emissions and another with the Copernicus Atmosphere Monitoring Service (CAMS) global soil emissions inventory (CAMS-GLOB-SOIL). Once the soil NOx emissions are derived, they can be subtracted from the total emissions to get anthropogenic NOx emissions. Subsequently anthropogenic CO2 emissions can be estimated using known CO2/NOx factors from bottom-up inventories. The annual CO2 emissions derived from DECSO (called DECSO-CO2) in our study area (large part of Europe) is 3.7 Gt in 2019, which is comparable with the 3.2 Gt of the CAMS CO2 inventory (called CAMS-CO2). The DECSO-CO2 and CAMS-CO2 are comparable for most large sources and cities, but the DECSO-CO2 show a larger number of low emission spots than the CAMS-CO2. The results demonstrate the potential for DECSO to expand its application to other regions in the world with less information on anthropogenic CO2 emissions.

How to cite: Lin, X., van der A, R., de Laat, J., Eskes, H., Huijnen, V., Mijling, B., Ding, J., and Liu, Z.: Using space-based NO2 observations to indirectly estimate anthropogenic CO2 emissions, EGU General Assembly 2024, Vienna, Austria, 14–19 Apr 2024, EGU24-1841, https://doi.org/10.5194/egusphere-egu24-1841, 2024.

EGU24-4484 | ECS | Orals | AS3.32

How well can MethaneSAT detect and quantify pastoral agricultural emissions? 

Beata Bukosa, Sara Mikaloff-Fletcher, Alex Geddes, Dave Pollard, Stuart Moore, Richard Law, Dave Noone, Maryann Sargent, Joshua Benmergui, and Steve Wofsy

MethaneSAT is a joint American and New Zealand satellite mission, which involves partnership between the Environmental Defense Fund (EDF), MethaneSAT LLC and New Zealand government. MethaneSAT’s primary mission is to detect and quantify methane (CH4) emissions from both point and area sources from the global oil and gas production industry in support of emissions reductions. MethaneSAT will target specific 200 km x 200 km regions and map CH4 within those regions at 100 m x 400 m resolution with unprecedented precision. The Aotearoa New Zealand team’s aim is to develop and test the ability of the satellite to detect agricultural CH4 emissions. New Zealand is an ideal place to develop this capability due to its large CH4 emissions, 85% of which are from agricultural sources. We will present results of modelled atmospheric CH4 concentrations for agricultural targets in New Zealand, emission estimates from the agricultural targets and CH4 measurements collected during a shakedown field campaign, in preparation for the MethaneSAT launch in 2024.

We use 1.5 km spatial resolution, New Zealand specific bottom-up CH4 fluxes and the Numerical Atmospheric dispersion Modelling Environment (NAME III), driven by meteorological input from the New Zealand Convective Scale Model (NZCSM, 1.5 km spatial resolution) Numerical Weather Prediction (NWP) model to create modelled agricultural XCH4 (column averaged) enhancements. The MethaneSAT-like targets are created for different scenarios to assess the changes in the XCH4 enhancements relative to meteorological conditions and bottom-up fluxes. We use the modelled agricultural XCH4 fields to test operational methods that are being developed for Level 4 products (i.e., emissions) in an Observing System Simulation Experiments (OSSE) framework and adapt them for diffuse agricultural sources. We will present results of modelled XCH4 scans for the main agricultural targets across New Zealand and the application of the MethaneSAT Level 4 methods (i.e., Geostatistical Inversion Framework, Divergence Integral Method) for agricultural sources.

The 2023 New Zealand MethaneSAT pre-launch shakedown field campaign took place over ten days in Waikato, a region with New Zealand’s strongest agricultural CH4 emissions. The campaign involved the deployment of two EM27/SUN portable spectrometers and in situ CH4 samplers. One EM27/SUN was at a fixed location for the duration of the campaign, while the second instrument was positioned up or downwind to measure enhancements of XCH4. Four remote sites were used, with measurements collected on multiple occasions and under different meteorological conditions. Typical XCH4 enhancements of between 3 and 8 ppb were observed while side-by-side measurements with the two spectrometers yielded a minimum detection limit of 0.3 ppb. Ground based and airborne in situ measurements were also collected to provide additional context to the measured enhancements. The measured XCH4 enhancements aligned with agricultural XCH4 estimates from the modelling framework. 

How to cite: Bukosa, B., Mikaloff-Fletcher, S., Geddes, A., Pollard, D., Moore, S., Law, R., Noone, D., Sargent, M., Benmergui, J., and Wofsy, S.: How well can MethaneSAT detect and quantify pastoral agricultural emissions?, EGU General Assembly 2024, Vienna, Austria, 14–19 Apr 2024, EGU24-4484, https://doi.org/10.5194/egusphere-egu24-4484, 2024.

EGU24-4762 | ECS | Posters on site | AS3.32

GHG monitoring from microsatellite using compact micro-LiDAR and Push-broom spectrometer 

Daria Stepanova, Errico Armandillo, Mariana Adam, and Ivan Ramirez

In the context of growing climate change concerns, accurate and real-time monitoring of greenhouse gases (GHGs) such as carbon dioxide (CO2) and methane (CH4) is imperative. AIRMO's innovative GHG emissions monitoring service is at the forefront of addressing this need, offering high-resolution and high-sensitivity emissions data. Local winds, along with presence of aerosol and thin clouds significantly impacts the accuracy of GHG flux measurements, hence the output data quality.

The Airmo service, under development,  is powered by a small satellite constellation equipped with 3 co-located instruments including a pushbroom SWIR spectrometer, micro LiDAR, and an RGB camera. In this context, the LiDAR emerges as a pivotal tool due to its unique capability to characterise both winds and aerosols. The major difference and mission impact brought by AIRMO relies on complementing and supplementing the column Radiance data produced by the Spectrometer with atmospheric data from the LiDAR, including data about aerosol layers and cirrus cloud’s optical properties.

This approach enables precise localization of GHG sources with spatial resolution capabilities down to 30 meters. Temporal resolution with a revisit rate of 4 hours with complete deployment ensures timely data for tracking emission changes. High spectral sensitivity in the SWIR range guarantees retrieval accuracy and spectral line characterization. The expe4cted accuracy of methane measurements lies within ±5 ppb and CO2 within ±2 ppm, offering unprecedented precision in GHG quantification.

The upcoming In-Orbit Demonstration (IoD) mission will showcase AIRMO's capability to meet stringent observation requirements and validate its operational framework in alignment with mission objectives. Two airborne campaigns are  planned for 1st and 3rd   Q 2024.

The paper will provide an overview of the status of the Mission and critical payload development and performance.

How to cite: Stepanova, D., Armandillo, E., Adam, M., and Ramirez, I.: GHG monitoring from microsatellite using compact micro-LiDAR and Push-broom spectrometer, EGU General Assembly 2024, Vienna, Austria, 14–19 Apr 2024, EGU24-4762, https://doi.org/10.5194/egusphere-egu24-4762, 2024.

EGU24-5182 | ECS | Orals | AS3.32

Combining TROPOMI with high-resolution satellites to detect, attribute, and monitor large methane emission events. 

Tobias A. de Jong, Joannes D. Maasakkers, Shubham Sharma, Berend Schuit, Matthieu Dogniaux, Paul Tol, Itziar Irakulis-Loitxate, Cynthia A. Randles, and Ilse Aben

Anthropogenic methane emissions play an important role in exacerbating climate change, and thus there is a need for accurate and timely monitoring and mitigation of these emissions. With daily global coverage, TROPOMI, onboard Sentinel-5P, maps methane concentrations at 5.5 x 7 km2 resolution and can detect methane super-emitters (>~8 t hr-1) globally [1,2]. Here, we show how we detect, attribute, and quantify methane emissions from super-emitters using TROPOMI in combination with information from high-resolution satellite instruments to support the UNEP IMEO Methane Alert Response System (MARS). To determine optimal targets for high-resolution hyperspectral observations (e.g. PRISMA, EnMAP), we combine longer term TROPOMI data over persistent emitters. When emissions are transient, we combine TROPOMI with data from non-targeted high-resolution band imagers (also known as multispectral sensors) such as Sentinel-2 and Sentinel-3 to trace emissions to facility-level emission sources, in particular oil and gas infrastructure [3]. We illustrate how the combination of satellites with different overpass times and different spatial resolutions gives a comprehensive picture of these emissions. To evaluate the detections, we compare methane enhancements retrieved from band imagers with values from TROPOMI. Even when overpass times do not match, we achieve this by using transient emissions that result in methane plumes with a constant total mass, once detached from the source. Finally, we show how combining information from multiple satellites enables critical evaluation of the winds taken from global reanalysis products that underlie almost all high-resolution emission quantifications based on mass-balance methods.


References

[1]        Maasakkers JD, Varon DJ, Elfarsdóttir A, McKeever J, Jervis D, Mahapatra G, et al. Using satellites to uncover large methane emissions from landfills. Sci Adv 2022;8:eabn9683. https://doi.org/10.1126/sciadv.abn9683.

[2]       Irakulis-Loitxate I, Guanter L, Maasakkers JD, Zavala-Araiza D, Aben I. Satellites Detect Abatable Super-Emissions in One of the World’s Largest Methane Hotspot Regions. Environ Sci Technol 2022;56:2143–52. https://doi.org/10.1021/acs.est.1c04873.

[3]       Pandey, Sudhanshu, et al. "Daily detection and quantification of methane leaks using Sentinel-3: a tiered satellite observation approach with Sentinel-2 and Sentinel-5p." Remote Sensing of Environment 296 (2023): 113716. https://doi.org/10.1016/j.rse.2023.113716

How to cite: de Jong, T. A., Maasakkers, J. D., Sharma, S., Schuit, B., Dogniaux, M., Tol, P., Irakulis-Loitxate, I., Randles, C. A., and Aben, I.: Combining TROPOMI with high-resolution satellites to detect, attribute, and monitor large methane emission events., EGU General Assembly 2024, Vienna, Austria, 14–19 Apr 2024, EGU24-5182, https://doi.org/10.5194/egusphere-egu24-5182, 2024.

EGU24-5350 | ECS | Orals | AS3.32

Using a portable EM27/SUN FTIR-spectrometer for validating the TCCON site-to-site consistency: The COCCON Travel Standard 

Benedikt Herkommer, Frank Hase, Jochen Groß, Carlos Alberti, Paolo Castracane, Angelika Dehn, Jia Chen, Florian Dietrich, Isamu Morino, Matthias Max Frey, Lawson Gillespie, Nasrin Mostafavi Pak, Debra Wunch, Nicholas Deutscher, Brittany Walker, and Omaira Elena García

The precise knowledge of the global atmospheric concentrations of green-house gases (GHG) are crucial for understanding and monitoring climate change.
Satellites for measuring GHGs are offering a global coverage, however, they need precise ground-based reference data for validation.
This reference data is provided by ground-based measurements, foremost the Total Column Carbon Observing Network (TCCON).
The TCCON measures column averages of GHG abundances at about 25 stations around the globe using Fourier Transform Infrared (FTIR) spectrometer.

For achieving the high data quality needed for the validation of current and upcoming GHG measuring satellite missions the control of site-by-site biases across the network is of utmost importance. So far, the verification of the individual TCCON sites mainly depends on the collection of collocated in situ measurements of GHG profiles, using airplane overflights or balloon air-core measurements, the use of calibrated HCl gas cells and on the evaluation of XAIR.
 
In this work we present a new supplemental approach by using the portable EM27/SUN FTIR spectrometer, which is the standard instrument of the Collaborative Carbon Column Observing Network (COCCON). This instrument type has proven its high stability in various field campaigns and long-term studies. In the framework of the ESA project “Fiducial Reference Measurements for Green-House Gases II” we are exploiting the stability of the instrument to use it as a Travel Standard (TS) for the TCCON. We visited sites in Japan, Canada, Germany, Australia, France and the Canary Islands to perform side-by-side measurements with the local TCCON spectrometers. Between the visits, the stability of the TS was monitored using the Karlsruhe TCCON site and the COCCON reference spectrometer.
This allows to compare the different TCCON sites to a common reference and hence, to verify the level of station-to-station consistency currently achieved by the TCCON and support further improvements. Here, we present the results of the TS visit at the TCCON site Tsukuba(Japan), Wollongong(Australia) and Izana(Canary Islands).

How to cite: Herkommer, B., Hase, F., Groß, J., Alberti, C., Castracane, P., Dehn, A., Chen, J., Dietrich, F., Morino, I., Frey, M. M., Gillespie, L., Pak, N. M., Wunch, D., Deutscher, N., Walker, B., and García, O. E.: Using a portable EM27/SUN FTIR-spectrometer for validating the TCCON site-to-site consistency: The COCCON Travel Standard, EGU General Assembly 2024, Vienna, Austria, 14–19 Apr 2024, EGU24-5350, https://doi.org/10.5194/egusphere-egu24-5350, 2024.

EGU24-6681 | ECS | Orals | AS3.32

Global automatic detection of methane emissions in Sentinel 2 data using deep learning 

Bertrand Rouet-Leduc and Claudia Hulbert

Methane is one of the most potent greenhouse gases, and its short atmospheric half-life makes it a prime target to rapidly curb global warming. However, current methane emission monitoring techniques primarily rely on approximate emission factors or self-reporting, which have been shown to often dramatically underestimate emissions.

Although initially designed to monitor surface properties, satellite multispectral data has recently emerged as a powerful method to analyze atmospheric content. However, the spectral resolution of multispectral instruments is poor, and methane measurements are typically very noisy. Methane data products are also sensitive to absorption by the surface and other atmospheric gases (water vapor in particular) and therefore provide noisy maps of potential methane plumes, that typically require extensive human analysis.

Here we show that the image recognition capabilities of deep learning methods can be leveraged to automatize the detection of methane leaks in Sentinel-2 satellite multispectral data, with dramatically reduced false positive rates compared with state-of-the-art multispectral methane data products, and without the need for a priori knowledge of potential leak sites.

Our proposed approach is validated on thousands of catalogued leaks from AVIRIS-NG and GAO airborne detection campaigns, and paves the way for the automated, high-definition and high-frequency monitoring of point-source methane emissions across the world.

How to cite: Rouet-Leduc, B. and Hulbert, C.: Global automatic detection of methane emissions in Sentinel 2 data using deep learning, EGU General Assembly 2024, Vienna, Austria, 14–19 Apr 2024, EGU24-6681, https://doi.org/10.5194/egusphere-egu24-6681, 2024.

EGU24-8815 | ECS | Posters on site | AS3.32

The COllaborative Carbon Column Observing Network (COCCON) quality management. 

Carlos Alberti, Frank Hase, Darko Dubravica, Angelika Dehn, and Paolo Castracane

Year after year, the effects of climate change are more dramatic and evident, and it is no longer possible to hide them, which requires immediate action against anthropogenic emissions of greenhouse gases (GHGs) in Earth’s atmosphere, mainly carbon dioxide (CO2) and methane (CH4). The scientific community plays an important role in continuously developing and improving current instrumentation and methods, which enable high-resolution measurements to monitor, track, quantify, and verify the concentration and emissions of GHGs in the atmosphere.

Measuring GHGs with high accuracy in the atmosphere is challenging, but achieving measurements with global coverage is even more demanding, and only satellites can provide such data sets. However, they require ground-based column-integrating measurements for validation. For this purpose, the Total Carbon Column Observing Network (TCCON) was created; however, due to its high operational costs and the need for trained expertise on-site, the number of sites is limited (~ 26). Moreover, these stations are stationary, so performing observations of selected GHG source regions with several spectrometers is impossible. The COllaborative Carbon Column Observing Network (COCCON) was initiated to overcome these limitations and to supplement the existing TCCON stations. The standard instrument used by COCCON is the portable FTIR spectrometer EM27/SUN, developed by KIT in cooperation with Bruker Optics from 2011 onwards. Although this instrument has a lower spectral resolution (0.5 cm-1) in comparison to the TCCON instrument (0.002 cm-1), it delivers XCO2, XCH4, XH2O, and XCO with sufficient quality to complement TCCON satellite validation efforts.

COCCON data are tied to the trace gas scale as realized by the TCCON reference. COCOON ensures a high degree of internal consistency across the participating spectrometers, defines common standards for data processing, and performs quality assurance checks on individual spectrometers to ensure the quality of the network. The services of COCCON are enabled by ESA support. Meanwhile, one hundred twenty spectrometers have been optimized and characterized by the centralized testing facility operated at KIT, and many more units are expected to be commissioned in the months ahead. This contribution presents the current status of the activities of the central QA/QC facility: methods, results, and foreseen improvements.

How to cite: Alberti, C., Hase, F., Dubravica, D., Dehn, A., and Castracane, P.: The COllaborative Carbon Column Observing Network (COCCON) quality management., EGU General Assembly 2024, Vienna, Austria, 14–19 Apr 2024, EGU24-8815, https://doi.org/10.5194/egusphere-egu24-8815, 2024.

EGU24-9147 | ECS | Posters on site | AS3.32

Quantifying Carbon Dioxide and Methane Hotspots: A Simulation Study with the TANGO Satellite Initiative 

Harikrishnan Charuvil Asokan, Jochen Landgraf, Leon Scheidweiler, and André Butz

In addressing the challenges caused by climate change, it is crucial to understand the impact of anthropogenic carbon dioxide (CO2) and methane (CH4) emissions. Therefore, it is essential to collect accurate and precise information on the sources of these greenhouse gases to develop effective mitigation strategies. Here, we present a simulation study for quantifying the emission hotspot targets using next-generation satellite sensors. A satellite end-to-end simulator will be used to identify and prioritize targets of CH4 and CO2 sources around the globe.

The current study will follow the orbit and satellite parameters of the proposed Twin Anthropogenic Greenhouse Gas Observers (TANGO) mission, representing an innovative CubeSat satellite initiative consisting of two satellites. TANGO-Carbon (1) will measure CO2 and CH4 in the 1.6 μm range, while TANGO-Nitro (2) will detect NO2 and cloud-related data. These satellites offer a spatial resolution of 300x300 m2, covering target areas spanning 30x30 km2. The TANGO mission aims to quantify point sources with CO2 emission rates of at least 2 Mt/yr and CH4 emissions of at least 5 kt/yr. Supported by national Dutch funding, the TANGO mission is scheduled for launch in 2027.

After identifying localized point sources through the simulation study, we present performance analyses for these future-generation satellites. From an identified target tile, a simulated measurement study will also be conducted. Expected concentration fields will be used to create synthetic measurements from spectrometer parameters. These synthetic measurements will be used in a physics-based radiative transfer model to estimate emission rates. Additionally, we will examine different performance metrics and potential error sources, such as errors due to aerosol scattering, to understand how they might affect our emissions estimates.

How to cite: Charuvil Asokan, H., Landgraf, J., Scheidweiler, L., and Butz, A.: Quantifying Carbon Dioxide and Methane Hotspots: A Simulation Study with the TANGO Satellite Initiative, EGU General Assembly 2024, Vienna, Austria, 14–19 Apr 2024, EGU24-9147, https://doi.org/10.5194/egusphere-egu24-9147, 2024.

EGU24-9264 | Orals | AS3.32

Towards the Estimation of Canadian Wetland Methane Fluxes with Airborne Lidar 

Christoph Kiemle, Christian Fruck, Andreas Fix, Gerhard Ehret, Mathieu Quatrevalet, Michal Galkowski, and Christoph Gerbig

Airborne and satellite based lidar remote sensing combines the advantages of high measurement accuracy, large-area coverage and low-ambient-light measurement capability. The Merlin airborne demonstrator CHARM-F is an Integrated-Path Differential-Absorption (IPDA) lidar providing vertical column concentrations of carbon dioxide and methane up to the flight altitude along the flight track. It operated onboard the German HALO (high-altitude long-range) research aircraft during the CoMet 2.0 Arctic campaign in August and September 2022 over natural and anthropogenic sources of CO2 and CH4 in Canada. Natural methane fluxes from wetlands generally produce weak atmospheric concentration enhancements of the measured atmospheric column (<1%). To address this challenge, we initially use methane profiles from CAMS (Copernicus Atmosphere Monitoring Service) reanalyses to discard cases where long-range transport of methane within the free troposphere causes large gradients over the measurement area. We then use in-situ measurements of the Jena Instrument for Greenhouse gases (JIG) operating onboard the same aircraft to identify methane enhancements above wetlands during low-level flight segments within the boundary layer. Correlation analyses with lidar-detected enhancements above the same wetlands allow us to characterize the lidar detection limit. Aircraft in-situ wind measurements in the boundary layer provide plume drift and dilution information necessary for lidar-informed methane emission flux estimations using either the integrated mass enhancement (IME) approach or an upwind-downwind gradient analysis. Comparisons of the in-situ wind measurements with the CAMS wind fields reveal how well the fluxes can be assessed from solely remote sensing methane and model wind data in the absence of in-situ measurements. Measurement examples and preliminary results will be shown.

How to cite: Kiemle, C., Fruck, C., Fix, A., Ehret, G., Quatrevalet, M., Galkowski, M., and Gerbig, C.: Towards the Estimation of Canadian Wetland Methane Fluxes with Airborne Lidar, EGU General Assembly 2024, Vienna, Austria, 14–19 Apr 2024, EGU24-9264, https://doi.org/10.5194/egusphere-egu24-9264, 2024.

EGU24-9567 | ECS | Posters on site | AS3.32

A portable reflected-sunlight spectrometer for measuring atmospheric CO2 and CH4: Accounting for aerosols 

Benedikt A. Löw, Ralph Kleinschek, Vincent Enders, Stanley P. Sander, Thomas J. Pongetti, Tobias D. Schmitt, Frank Hase, and André Butz

Mapping the greenhouse gases carbon dioxide (CO2) and methane (CH4) above source regions, such as urban areas, can deliver insights into the distribution and dynamics of local emission patterns. To this end, we conduct ground-based measurements in the reflected-sun geometry, where a NIR spectrometer in an elevated position points downward at shallow viewing angles and observes reflected sunlight from a target area. From the spectra, we infer CO2 and CH4 concentrations integrated along a long (>10 km) horizontal path. Measurements in this viewing geometry are particularly sensitive to concentrations in the planetary boundary layer.

We deployed our portable reflected-sun prototype instrument (termed EM27/SCA) [1] during one month in April/May 2022 on Mt. Wilson above the Los Angeles basin to perform side-by-side measurements with the stationary CLARS-FTS [2]. We find a relative precision of 0.36%–0.55% for CO2 and CH4 slant column densities and good consistency with simultaneous CLARS-FTS measurements. However, we also identify the necessity to account for radiation scattered into the ray path when performing the quantitative analysis of recorded spectra.

Here, we present the instrument performance as well as our approach to account for atmospheric scattering effects. Our retrieval algorithm is based on the RemoTeC radiative transfer and retrieval algorithm, previously employed for solar backscatter satellite measurements. We showcase its performance by simultaneously inferring aerosol optical thickness, CO2 and CH4 from EM27/SCA observations.


References:
[1] Löw, B. A., et al.: A portable reflected-sunlight spectrometer for CO2 and CH4, Atmos. Meas. Tech., 16, 5125–5144, https://doi.org/10.5194/amt-16-5125-2023, 2023.
[2] Fu, D., et al.: Near-infrared remote sensing of Los Angeles trace gas distributions from a mountaintop site, Atmos. Meas. Tech., 7, 713–729, https://doi.org/10.5194/amt-7-713-2014, 2014.

How to cite: Löw, B. A., Kleinschek, R., Enders, V., Sander, S. P., Pongetti, T. J., Schmitt, T. D., Hase, F., and Butz, A.: A portable reflected-sunlight spectrometer for measuring atmospheric CO2 and CH4: Accounting for aerosols, EGU General Assembly 2024, Vienna, Austria, 14–19 Apr 2024, EGU24-9567, https://doi.org/10.5194/egusphere-egu24-9567, 2024.

EGU24-10179 | Posters on site | AS3.32

A data-driven method to retrieve XCO2 and XCH4 using artificial neural networks in preparation for the European Copernicus CO2 Monitoring Mission CO2M 

Maximilian Reuter, Michael Hilker, Stefan Noël, Antonio Di Noia, Michael Weimer, Michael Buchwitz, Heinrich Bovensmann, Hartmut Bösch, and John P. Burrows

Carbon dioxide (CO2) and methane (CH4) are the most important anthropogenic greenhouse gases because they are the main drivers of climate change. Monitoring their concentrations from space can help to detect and quantify anthropogenic emissions, supporting the mitigation efforts urgently needed to fulfill the Paris Agreement. Additionally, it can help to better understand the processes of the carbon cycle and thus allow better climate projections.

These are key objectives of the European Copernicus CO2 Monitoring Mission CO2M, scheduled for launch in 2026, for which three retrieval algorithms are currently being developed and implemented in the EUMETSAT ground segment. These are so called conventional retrieval techniques that base on radiative transfer calculations. Despite shortcuts and approximations, the vast amount of satellite data makes them computationally expensive, requiring thousands of CPU cores. Although conventional retrieval methods base on physical principles, they typically require empirical data-driven methods to correct for biases in order to meet the demanding accuracy and precision requirements. The biases arise, e.g., from inaccuracies of the radiative transfer computations or unknown instrumental issues. Machine learning methods have the potential to combine both steps into a single data-driven retrieval algorithm, reducing the computational cost by several orders of magnitude.

We used the radiative transfer model SCIATRAN to simulate two years (2015 and 2020) of sub-sampled realistic radiances of three instruments on board CO2M: the main instrument CO2I (CO2 imager), MAP (multi angle polarimeter), and CLIM (cloud imager). We use data from the first year of this data set to train artificial neural networks (ANNs) to retrieve XCO2 and XCH4 (the column-average dry-air mole fraction of atmospheric CO2 and CH4, respectively) plus related uncertainties and column averaging kernels. We will introduce a method which allows us to modify the training data making it representative for a wider range of atmospheric states. This ensures that the ANNs learn from the spectral signatures of CO2 and CH4 and that learning from spurious correlations is minimized. Despite the annual growth of CO2 and CH4, we will show that the ANNs trained with data from 2015 have almost the same quality when applied to data from 2020. We will analyze and compare the performance of different input vector settings, e.g., with and without MAP data and will discuss potential advantages or disadvantages of our ANN approach.

How to cite: Reuter, M., Hilker, M., Noël, S., Di Noia, A., Weimer, M., Buchwitz, M., Bovensmann, H., Bösch, H., and Burrows, J. P.: A data-driven method to retrieve XCO2 and XCH4 using artificial neural networks in preparation for the European Copernicus CO2 Monitoring Mission CO2M, EGU General Assembly 2024, Vienna, Austria, 14–19 Apr 2024, EGU24-10179, https://doi.org/10.5194/egusphere-egu24-10179, 2024.

EGU24-11087 | ECS | Posters on site | AS3.32

Towards CO2 emission monitoring from space using FOCAL XCO2 retrievals of OCO-3 satellite measurements 

Michael Weimer, Michael Hilker, Blanca Fuentes Andrade, Stefan Noël, Maximilian Reuter, Michael Buchwitz, Heinrich Bovensmann, John P. Burrows, and Hartmut Bösch

Anthropogenic emissions of carbon dioxide (CO2) are the main driver of the change in climate since the industrial revolution. Policy mitigation strategies include reduction of these emissions. The Paris Agreement from 2015 requires the states to report their greenhouse gas emissions on a regular basis. Space-borne remote-sensing measurements of CO2 are considered potentially of great value  to monitor CO2 emissions, due to their better coverage in comparison to in-situ instruments. Measuring CO2  from space of an adequate quality is a challenge because of the stringent requirements related to the accuracy and precision of the data products and thus the instruments. In this study, we use the Fast atmospheric traCe gAs retrievaL (FOCAL) algorithm to retrieve maps of the column-averaged dry-air CO2 mole fraction (XCO2) with the goal of quantifying CO2 emissions for specific emission targets using Orbiting Carbon Observatory 3 (OCO-3) snapshot area maps. This data product is planned to  be used in the German national Integrated Greenhouse Gas Monitoring System (ITMS), for which an operational data assimilation system for greenhouse gases is being set up for Germany.

How to cite: Weimer, M., Hilker, M., Fuentes Andrade, B., Noël, S., Reuter, M., Buchwitz, M., Bovensmann, H., Burrows, J. P., and Bösch, H.: Towards CO2 emission monitoring from space using FOCAL XCO2 retrievals of OCO-3 satellite measurements, EGU General Assembly 2024, Vienna, Austria, 14–19 Apr 2024, EGU24-11087, https://doi.org/10.5194/egusphere-egu24-11087, 2024.

EGU24-11680 | Orals | AS3.32

Impact of atmospheric turbulence on the accuracy of point source emission estimates 

Michal Galkowski, Julia Marshall, Blanca Fuentes Andrade, and Christoph Gerbig

Greenhouse gases have been extensively studied due to their key role in of Earth’s climate. Their anthropogenic fluxes are of particular interest for policies targeting the mitigation of climate change, as their long lifetimes, especially in case of most abundant CO2, will have an impact over several centuries. Monitoring of emissions is a critical part of climate mitigation, as without timely, accurate and precise information on the implementation progress, any potential diversions from the plan cannot be identified and acted upon in sufficient time. The scientific community has developed multiple observation-based emission estimation methods, among which application of space- and airborne state-of-the-art instrumentation hold much promise out thanks to their ability to provide relevant data on a global scale. Modern remote-sensing instruments have already demonstrated the ability to estimate emission from the strongest sources of greenhouse gases, like coal power plants, megacities or industrial sites. However, due to inherent technical difficulties as well as basic atmospheric physics, the accuracy of any single measurement is limited.

Here, using the high-resolution atmospheric model WRF-GHG set over the largest point-like CO2 emitter in Europe, namely the Bełchatów Power plant, we demonstrate how atmospheric dynamics limit the potential accuracy of emission estimation using the cross-sectional mass-flux method. We show how atmospheric turbulence affects the plume structure, and how that translates into emission estimates. We demonstrate how assumptions about well-mixedness can cause inaccuracies in emission estimates. Furthermore, through a novel application of temporally-tagged tracers, we also show that part of the CO2 plume variability is projected from the emission point across distances considerably longer than PBL turbulent scales, larger than was previously assumed.

Unless the discussed effects can be taken into the account when planning, executing and interpreting measurements, the discussed effects can have potentially detrimental consequences for the accuracy of estimated flux values. It is worth noting that the presented results are of general nature and will affect attempts to quantify emissions of any pollutant for which similar estimation techniques are applied, including CO2 and CH4, NOx and others.

How to cite: Galkowski, M., Marshall, J., Fuentes Andrade, B., and Gerbig, C.: Impact of atmospheric turbulence on the accuracy of point source emission estimates, EGU General Assembly 2024, Vienna, Austria, 14–19 Apr 2024, EGU24-11680, https://doi.org/10.5194/egusphere-egu24-11680, 2024.

EGU24-11787 | Posters on site | AS3.32

GHGSat’s constellation: Land and offshore greenhouse gases detection and quantification  

Mathias Strupler, Marianne Girard, Dylan Jervis, Jean-Philippe W MacLean, David Marshall, Jason McKeever, Antoine Ramier, Ewan Tarrant, and David Young

GHGSat operates a growing constellation of small satellites tailored for high-resolution imaging and quantification of methane emissions, achieving ~25 m spatial resolution and a sensitivity down to ~100 kg/hr. In 2023, the constellation expanded to 12 satellites with the launch of three additional satellites, including the introduction of the first CO2 sensing instrument. 

Land operations: We present a comprehensive analysis of the performance across the constellation, demonstrating consistent column precision levels (interquartile range: 1% to 3%) influenced primarily by ground reflectance. To assess the detection threshold, a series of controlled releases were self-organized and performed on a single-blind basis. Fitting our results to a probability-of-detection model we obtain a 50% probability of detection at 3 m/s wind of 102 kg/h. 

Offshore operations: Detecting and quantifying methane emissions from offshore platforms, which constitutes 30% of oil & gas production, is crucial for providing actionable feedback to industrial operators. Utilizing glint mode for offshore measurements, we capture the direct specular reflection of the sun, enabling quantification of atmospheric methane emissions over water. Our findings reveal a median column precision of 2.1%. Through analytical modeling and orbital simulations, we estimate detection limits ranging from 160 kg/h to 600 kg/h, depending on latitude and season.  

CO2 satellite: We provide the status of the recently launched CO2 satellite – with the same swath and spatial resolution as our methane satellites. This unit will bring a new dimension to our knowledge of global greenhouses gases emissions.  

Our presentation underscores the advancements made and insights gained from land and offshore operations, emphasizing the constellation's growing capabilities and the critical role it plays in monitoring and mitigating CH4 and CO2 emissions. 

How to cite: Strupler, M., Girard, M., Jervis, D., MacLean, J.-P. W., Marshall, D., McKeever, J., Ramier, A., Tarrant, E., and Young, D.: GHGSat’s constellation: Land and offshore greenhouse gases detection and quantification , EGU General Assembly 2024, Vienna, Austria, 14–19 Apr 2024, EGU24-11787, https://doi.org/10.5194/egusphere-egu24-11787, 2024.

EGU24-12350 | Posters on site | AS3.32

Expected Performance of the GeoCarb Integrated Instrument from Thermal Vacuum Measurements During a Limited Performance Test 

Sean Crowell, Berrien Moore III, Eric Burgh, Mate Adamkovicz, Timothy Miller, Peter Somkuti, Alex Webb, Gary Spiers, Eric Mentzell, Chris O'Dell, and Greg McGarragh

After selection as the second Earth Venture Mission in 2016, the Geostationary Carbon Observatory (GeoCarb), led by the University of Oklahoma PI Dr. Berrien Moore III, was developed until its cancellation during Phase C in November 2022. The GeoCarb PI was directed by NASA to complete as much of the instrument as remaining funding permitted.  The GeoCarb team successfully completed alignment and focus of the spectrograph before verification through a sequence of thermal vacuum campaigns, during which other characteristics of the instrument were determined (e.g., SNR, spectral range, stray light). These measurements suggested that the GeoCarb integrated instrument would have sufficient performance to deliver on the promise of the originally proposed greenhouse gas observing mission.  As a result, the project continued with integration of the optical subassemblies and electronics into a fully integrated instrument as of August 2023.  The instrument underwent a final thermal vacuum campaign during the fall of 2023 and was shipped to NASA for storage in November 2023.  Since that time, the GeoCarb science team has been analyzing the test data to determine the capabilities of the integrated instrument with positive results.  All indications are that the GeoCarb instrument will meet its key performance requirements.


In this presentation, we will discuss the spectral, radiometric, and polarimetric performance of the GeoCarb instrument from the measurement campaigns, including the spectral and spatial image quality, polarization response, and SNR.  We will address the implications for the scientific capabilities of the fully characterized and calibrated observatory should NASA restart the program.

How to cite: Crowell, S., Moore III, B., Burgh, E., Adamkovicz, M., Miller, T., Somkuti, P., Webb, A., Spiers, G., Mentzell, E., O'Dell, C., and McGarragh, G.: Expected Performance of the GeoCarb Integrated Instrument from Thermal Vacuum Measurements During a Limited Performance Test, EGU General Assembly 2024, Vienna, Austria, 14–19 Apr 2024, EGU24-12350, https://doi.org/10.5194/egusphere-egu24-12350, 2024.

EGU24-12720 | Posters on site | AS3.32

A fast forward model for IASI and TANSO-FTS CH4 retrievals  

Charles Robert, Sophie Vandenbusshe, Ann Carine Vandaele, Justin Erwin, and Martine De Mazière

Atmospheric methane (CH₄) is measured continuously from space, providing valuable information at global scales for atmospheric monitoring. CH₄ measurements from space can be based on observations in the shortwave infrared (SWIR), leading to a more uniform sensitivity to the atmospheric column, as well as thermal infrared observations (TIR) which provide useful information on the CH₄ content in the upper troposphere and lower stratosphere.

Among the various instruments measuring in the TIR, the Infrared Atmospheric Sounding Interferometer (IASI) series of instruments onboard the METOP satellites have been observing the Earth’s atmosphere for more than 15 years. Also, the Thermal And Near infrared Sensor for carbon Observation Fourier-Transform Spectrometer (TANSO-FTS) on-board the GOSAT 1 and 2 satellites monitor the atmosphere in the SWIR and TIR since 2009. Both instruments provide valuable information for the retrieval atmospheric CH₄.

CH4 retrievals in the TIR can be demanding in terms of computational time. The large number of species in the CH4 region, and the high radiometric accuracy of current and upcoming instruments (e.g. IASI, IASI-NG) demand highly accurate radiative transfer modelling (RTM), to be carried out on a fine spectral and vertical grid. These constraints usually lead to long processing time when using full-physics RTMs (e.g. ASIMUT-ALVL). Other fast RTMs exists (e.g. RTTOV), but they often cannot be easily modified to include a specific species or spectroscopy, and do not support all instruments.

To allow for faster processing of the already large datasets available, we developed a model based on the Principal Component-based Radiative Transfer Model (PCRTM) approach (Liu et al., 2006) to perform CH4 inversion in the TIR with IASI and TANSO-FTS. Instead of predicting channel radiance directly, the Principal Component-based Radiative Transfer Model (PCRTM) predicts the Principal Component (PC) scores of these quantities parameterized by a relatively small number of monochromatic RT simulations, leading to significant savings in computational time. The model returns the channel radiances and the jacobians for all species of interest.

In this work, we will detail the approach that was taken for the development of the fast RTM and will compare the results with a full-physics RTM. The impact of some internal parameters on the current model will also be discussed, as well as possible improvements in the future.


Reference:

Xu Liu, William L. Smith, Daniel K. Zhou, and Allen Larar, "Principal component-based radiative transfer model for hyperspectral sensors: theoretical concept," Appl. Opt. 45, 201-209 (2006)

How to cite: Robert, C., Vandenbusshe, S., Vandaele, A. C., Erwin, J., and De Mazière, M.: A fast forward model for IASI and TANSO-FTS CH4 retrievals , EGU General Assembly 2024, Vienna, Austria, 14–19 Apr 2024, EGU24-12720, https://doi.org/10.5194/egusphere-egu24-12720, 2024.

EGU24-13412 | Orals | AS3.32

Evaluating the JAXA GOSAT CO2 retrieval product using NASA CO2 retrieval products and NOAA Carbon Tracker 

Hiroshi Suto, Nobuhiro Kikuchi, Kei Shiomi, Tomohiro Oda, Tomoko Tashima, Fumie Kataoka, Kenji Kowata, and Akihiko Kuze

Space-based Greenhouse Gas (GHG) observations done by Japan’s Greenhouse Gas Observing Satellite (GOSAT) and NASA’s Orbiting Carbon Observatory (OCO) missions have collected long term and spatially dense CO2 data globally. The satellite GHG data have contributed to the monitoring of global CO2 concentrations and the detection of their regional and local changes. Given the high stake of the climate and environment applications, the evaluation of the space-based GHG data is a critical task. Space-based GHG data are often compared to data collected at ~ 30 Total Carbon Column Observing Network (TCCON) sites for examining potential biases and errors. Bias-correction methods are often developed based on the comparison to the TCCON data. While satellite GHG data products often show good agreement with TCCON data, we still see regional disagreements among different GHG data. We argue that the TCCON-based evaluation is powerful, but limited, and thus further evaluations of satellite GHG products are necessary. Recently, JAXA developed a new GOSAT GHG product named JAXA/GHG product. Our retrieval product includes total and partial column concentration values of CO2, CH4, H2O as well as solar-induced chlorophyll fluorescence (SIF). The JAXA/GHG GOSAT CO2 product is compared to NASA’s Atmospheric Carbon Observations from Space (ACOS)-GOSAT L2 full physics retrieval data, NASA’s OCO-2 satellite-based L2 full physics retrieval data, as well as simulated CO2 from the Carbon Tracker global atmospheric inversion system developed by NOAA Global Monitoring Laboratory. Our XCO2 comparisons with other satellite products show regional discrepancies over the Pacific Ocean, central Africa, south-east Asia (land), and Amazon areas. The results suggest that these discrepancies could be attributable to retrieved surface pressure and aerosol properties. We also compare near surface and upper tropospheric partial CO2 retrieved values to Carbon Tracker simulated values. These comparisons show the systematic positive discrepancy (~2-3 ppm) in JAXA’s near surface (surface to ~ 4km) CO2 concentration over the oceans against Carbon Tracker.

How to cite: Suto, H., Kikuchi, N., Shiomi, K., Oda, T., Tashima, T., Kataoka, F., Kowata, K., and Kuze, A.: Evaluating the JAXA GOSAT CO2 retrieval product using NASA CO2 retrieval products and NOAA Carbon Tracker, EGU General Assembly 2024, Vienna, Austria, 14–19 Apr 2024, EGU24-13412, https://doi.org/10.5194/egusphere-egu24-13412, 2024.

EGU24-14028 | ECS | Posters on site | AS3.32

First TanSat CO2 retrieval over land and ocean using both nadir and glint spectroscopy 

Chengxin Zhang, Xinhua Hong, and Cheng Liu

The world is facing a serious warming crisis, highlighting the need for monitoring greenhouse gases such as carbon dioxide (CO2). In 2016, China launched its first satellite mission for measuring atmospheric CO2, i.e., TanSat. Previous TanSat retrievals of the column-averaged dry air mole fraction of CO2 (XCO2) have a moderate precision of 1.47–2.45 ppm, with only limited spatial coverage over the land surface by using TanSat nadir-mode (ND) spectroscopy. These existing gaps are affected by the poor signal-to-noise ratio of glint mode (GL) or over the oceanic surface. However, CO2 measurements over the ocean, a major source of global carbon sinks, are often lacking and subject to significant uncertainties but are nevertheless quite important. To increase the spatial coverage and retrieval accuracy and precision of TanSat CO2, we further improve XCO2 retrieval by introducing spectral recalibration, spectral window optimization, and explicit radiative transfer simulation. Thus, universal CO2 retrieval with high precision over land and ocean is realized by using both ND and GL spectra. Ground-based comparisons using the total carbon column observing network (TCCON) indicate that the standard deviations of the bias-corrected XCO2 retrievals from the ND and GL modes were 1.28 and 1.19 ppm, respectively. Consistent spatial and temporal distributions of satellite XCO2 retrievals can also be found among TanSat, the Greenhouse gases Observing SATellite (GOSAT), and the Orbiting Carbon Observatory-2 (OCO-2) satellites. The updated TanSat XCO2 retrievals have ~3.5 times the seasonal spatial coverage of GOSAT, while the highest difference between TanSat and OCO-2 is only +0.63 ppm. In addition, TanSat XCO2 retrievals over the ocean successfully captured enhanced CO2 plumes from the neighboring Yasur volcano, with an estimated emission flux of 32.1 kilotons per day. These results indicate that the improved TanSat XCO2 retrieval is useful for understanding and quantifying global land and ocean carbon emissions.

How to cite: Zhang, C., Hong, X., and Liu, C.: First TanSat CO2 retrieval over land and ocean using both nadir and glint spectroscopy, EGU General Assembly 2024, Vienna, Austria, 14–19 Apr 2024, EGU24-14028, https://doi.org/10.5194/egusphere-egu24-14028, 2024.

EGU24-14174 | ECS | Orals | AS3.32

A multiannual and global synergetic satellite product of tropospheric CH4 

kanwal Shahzadi, Matthias Schnider, Nga Ying Lo, Jörg Mayer, Cayoglu Ugur, Frank Hase, Peter Braesicke, Tobias Borsdorff, and Mari Martinez Velarte

Data products of atmospheric methane with improved vertical sensitivity in the lower troposphere are crucial for gaining a more comprehensive understanding of the impact of anthropogenic emissions. This study presents a methane data product derived from the synergistic combination of TROPOMI (Tropospheric Monitoring Instrument) total column and IASI (Infrared Atmospheric Sounding Interferometer) profiles, utilizing level 2 data spanning the period from 2018 to 2021. IASI enables high-quality retrievals in the upper troposphere-lower stratosphere, while TROPOMI observations excel in providing sensitivity to total-column-averaged CH4. The combined product retains the information from individual datasets and therefore enhances sensitivity to lower tropospheric signals independently of the upper troposphere, which is not achievable by using IASI or TROPOMI data alone.

We present a method for optimally combining the IASI and TROPOMI level 2 data. Firstly, the products from the individual satellites are collocated in time and space (geomatching). Subsequently, the collocated data are optimally merged by fully considering the individual data characteristics (uncertainties and sensitivities) by the application of a Kalman filter. We show that the procedure is robust and computationally cheap, which allows the efficient combination of billions of IASI and TROPOMI observations, and the combined product offers good global coverage.

The combined product is validated by comparison to reference datasets such as 14 globally distributed TCCON (Total Carbon Column Observing Network) stations, CH4 profile measurements made by 36 individual AirCore soundings, and tropospheric CH4 data derived from continuous ground-based in situ observations made at two nearby Global Atmospheric Watch (GAW) mountain stations. These comparisons confirm the theoretically predicted quality of the combined data product, in particular the increased quality of the tropospheric CH4 data.

Following the procedure outlined above, the final data product will consist of CH4 partial columns below and above 6000 m a.s.l. together with their respective averaging kernels and uncertainties and it will be made available as netCDF files that are compliant with version 1.7 of the CF metadata convention.


How to cite: Shahzadi, K., Schnider, M., Ying Lo, N., Mayer, J., Ugur, C., Hase, F., Braesicke, P., Borsdorff, T., and Velarte, M. M.: A multiannual and global synergetic satellite product of tropospheric CH4, EGU General Assembly 2024, Vienna, Austria, 14–19 Apr 2024, EGU24-14174, https://doi.org/10.5194/egusphere-egu24-14174, 2024.

EGU24-15743 | ECS | Posters on site | AS3.32

End to end simulation chain for flux restitution of the spectral imaging concept Nanocarb 

Léa Khater, Laurence Croizé, Isabelle Pison, and Antoine Berchet

CH4 is the second anthropogenic contributor to global warming after CO2. Monitoring methane emissions is therefore essential in order to mitigate climate change. Satellite missions have the potential to offer more spatial coverage than ground stations, however their coverage is currently insufficient. This leads to the development of satellite missions that can be envisaged as constellations. For this purpose a concept currently studied is Nanocarb, relying  on the patent  WO2018002558A1 (ImSPOC). This instrument is a compact and robust spectral imaging concept relying on a static array of Fabry-Perrot interferometers to retrieve partial interferograms of the incident radiance. This study is focused on developing and using the appropriate tools and models to simulate the flux restitution performances of a methane focused Nanocarb instrument with two intertwined inverse approaches.

We have developed an end-to-end simulation chain of the flux restitution by the instrument Nanocarb. First an atmospheric situation is simulated from an inventory such as TNO's by the chemistry transport model Chimere. Then this atmospheric situation is used to simulate Nanocarb measurements, with a direct and backward ImSPOC conception and processing software called MEDOC which relies on the radiative transfer code 4A-OP. Those simulated measurements have realistic noise added and are used to recover atmospheric methane columns. Eventually this new atmospheric situation allows for the retrieval of atmospheric methane fluxes, thanks to the Community Inversion Framework (CIF), coupled with Chimere. Those fluxes can be compared to the initial situation to quantify the introduced biases.

We present this simulation chain, and specifically developments made on Medoc and columns obtained for an atmospheric simulation in the north of France. This simulation chain aims to model the flux retrieval ability of the instrument Nanocarb for point sources and area sources of methane.

How to cite: Khater, L., Croizé, L., Pison, I., and Berchet, A.: End to end simulation chain for flux restitution of the spectral imaging concept Nanocarb, EGU General Assembly 2024, Vienna, Austria, 14–19 Apr 2024, EGU24-15743, https://doi.org/10.5194/egusphere-egu24-15743, 2024.

EGU24-15956 | Posters on site | AS3.32

GEMINI-UK: a new UK network of ground-based greenhouse gas observing spectrometers to help track progress towards net-zero targets 

Neil Humpage, Paul Palmer, Liang Feng, Alex Kurganskiy, Jerome Woodwark, Stamatia Doniki, Robbie Ramsay, and Hartmut Boesch

As part of the UK Greenhouse gas Emissions Measurement Modelling Advancement programme, the National Centre for Earth Observation are establishing the Greenhouse gas Emissions Monitoring network to Inform Net-zero Initiatives for the UK (GEMINI-UK). The primary aim of the GEMINI-UK network, comprising ten Bruker EM27/SUN shortwave infrared spectrometers, is to help quantify regional net GHG emissions across the UK, complementing in situ measurements collected by the existing tall tower network. Collectively, these data will eventually form the backbone of a pre-operational GHG emissions monitoring framework. The GEMINI-UK instruments observe column concentrations of carbon dioxide, methane, and carbon monoxide in cloud-free conditions, which we are using in the context of Bayesian inverse methods to constrain regional flux estimates of these gases. We have designed the measurement network to deliver the biggest error reductions in carbon dioxide flux estimates, working closely with host partners that include UK universities and schools and NERC facilities to promote the open access and transparency of the collected data. Continuous and autonomous operation of these instruments at each site is achieved by an automated weatherproof enclosure, based on a design developed by University of Edinburgh researchers, which previously enabled year-round measurements to be collected during the UK DARE-UK experiment in central London. In this presentation we describe the status and longer-term goals of GEMINI-UK, which is coming online through the first half of 2024, including an ongoing evaluation of EM27/SUN with a higher specification TCCON spectrometer at Harwell. We will also report data from the DARE-UK London deployment, which demonstrates the value in using all-weather enclosures and allows comparison with coincident measurements collected by the NASA OCO-2 and OCO-3 Earth orbiting instruments.

How to cite: Humpage, N., Palmer, P., Feng, L., Kurganskiy, A., Woodwark, J., Doniki, S., Ramsay, R., and Boesch, H.: GEMINI-UK: a new UK network of ground-based greenhouse gas observing spectrometers to help track progress towards net-zero targets, EGU General Assembly 2024, Vienna, Austria, 14–19 Apr 2024, EGU24-15956, https://doi.org/10.5194/egusphere-egu24-15956, 2024.

EGU24-16659 | Posters on site | AS3.32

Annual Growth Rates of Column-Averaged CO2 on Global Scale Inferred from Long-Term TCCON Observations 

SeyedehNasrin Mostafavipak, Sussmann Ralf, and Rettinger Markus

To adhere to the Paris Agreement and restrict the rise in global temperatures to 1.5 degrees, it is imperative to significantly decrease anthropogenic greenhouse gas emissions, ultimately achieving net-zero emissions by the year 2050. To evaluate the reductions in CO2 emissions, it is essential to assess the related changes in CO2 mixing ratios in the atmosphere. An appropriate quantity to be used for this assessment in the years to come is the global annual growth rate of atmospheric CO2. As a data basis for this, in-situ measurement station networks can be used, and annual growth rates are being inferred, e.g., from the Mauna Loa station. On the other hand, TCCON, operating 30 stations worldwide, is committed to measuring greenhouse gas total column mixing ratios through the use of ground-based solar viewing FTIR instruments. The advantage of TCCON column observations is that they are less sensitive to local emissions close to the measurement site and are more representative of regional and global scale emissions and trends in greenhouse gas mixing ratios. TCCON data, therefore, represent a potent alternative data source. A recent algorithmic approach to infer annual growth rates from TCCON data by Sussmann and Rettinger (2020) considers the temporal sampling of TCCON, accounting for data gaps due to sun-viewing geometry, and has been successfully demonstrated for selected TCCON sites. The goal of our ongoing work, presented here, is to extend the retrieval of annual growth rates to more TCCON stations and compare our TCCON results with results from the in-situ networks.

Reference: Sussmann, R., and Rettinger, M.: Can We Measure a COVID-19-Related Slowdown in Atmospheric CO2 Growth? Sensitivity of Total Carbon Column Observations, Remote Sens., 12, 2387, https://doi.org/10.3390/rs12152387, 2020.

How to cite: Mostafavipak, S., Ralf, S., and Markus, R.: Annual Growth Rates of Column-Averaged CO2 on Global Scale Inferred from Long-Term TCCON Observations, EGU General Assembly 2024, Vienna, Austria, 14–19 Apr 2024, EGU24-16659, https://doi.org/10.5194/egusphere-egu24-16659, 2024.

EGU24-17625 | Orals | AS3.32

It Takes Two to Tango: The Twin Anthropogenic Greenhouse Gas Observers  

Jochen Landgraf, Pepijn Veefkind, Ryan Cooney, Manu Goudar, Raul Laasner, Zeger de Groot, and Nurcan Alpay Koc

The Twin Anthropogenic Greenhouse Gas Observers (TANGO) mission is a pioneering Cubsat satellite mission comprising two satellites, TANGO-Carbon and TNAGO-Nitro. Secured by national funding Tango will be launched in the year 2027 and envisages a unique European contribution to monitoring globally and independently the emission of anthropogenic greenhouse gases CO2 and CH4 over the period 2027-2031. To this end, breakthrough technology will be used to quantify emissions of the greenhouse gases methane (CH4) and carbon dioxide (CO2) at the level of individual industrial facilities and power plants. The mission will demonstrate a distributed monitoring system that will pave the way for future larger constellations of Cubsats allowing for enhanced coverage and temporal resolution. The TANGO mission consists of two agile satellite buses flying in formation, each carrying one spectrometer. The first satellite measures spectral radiances in the shortwave infrared part of the solar spectrum (1.6 µm) to detect moderate to strong emissions of CH4 (≥ 5 kt/yr) and CO2 (≥ 2 Mt/yr). The instrument has a field of view of 30 x 30 km2 at spatial resolutions small enough to monitor individual large industrial facilities (300 x 300 m2), with accuracy to determine emissions based on a single observation. Using the same strategy, the second satellite yields collocated NO2 observations from radiance measurements in the visible spectral range, supporting plume detection and exploiting the use of CO2/NO2 ratio. TANGO will provide surface fluxes of specific emission types based on the combination of CH4, CO2, and NO2 observations at a high spatial resolution following a strictly open data policy. Mission operation will be open for input from the science community on target selection. In doing so, TANGO aims to uniquely complement the large, planned Copernicus monitoring missions like Sentinel-5 and the CO2M mission by providing unrivaled high-resolution monitoring of the major anthropogenic greenhouse gas emissions regularly. In this presentation, we will discuss the TANGO mission concept and its synergy with future Copernicus missions.

How to cite: Landgraf, J., Veefkind, P., Cooney, R., Goudar, M., Laasner, R., de Groot, Z., and Alpay Koc, N.: It Takes Two to Tango: The Twin Anthropogenic Greenhouse Gas Observers , EGU General Assembly 2024, Vienna, Austria, 14–19 Apr 2024, EGU24-17625, https://doi.org/10.5194/egusphere-egu24-17625, 2024.

EGU24-17815 | Posters on site | AS3.32

Global distribution of methane in the mid-troposphere as seen by IASI onboard three successive Metop platforms 

Nicolas Meilhac, Cyril Crevoisier, Rémy Orset, Raymond Armante, Rigel Kivi, and Huilin Chen

Thanks to its continuous spectral coverage of the whole thermal infrared domain, the IASI sounder offers the possibility to monitor on the long term several essential climate variables, including mid-tropospheric columns of the 3 major greenhouse gases influenced by human activitie: carbon dioxide (CO2), methane (CH4) and nitrous oxide (N2O).

To tackle the very small seasonal variability of these gases compared to their background values, combined to the strong dependence of IR radiances to atmospheric temperature and the simultaneous sensitivity of the channels to several gases, a non-linear inference scheme has been developed at LMD. Since 2007, mid-tropospheric columns of methane have been derived for both day and night conditions, over land and over sea. The retrieval scheme strongly relies on careful validation of level1c spectra, characterization of systematic radiative biases and severe cloud and aerosol screening. CH4 fields are delivered on ‘near real time’ (D-1) basis to the Copernicus Atmosphere Monitoring Service (CAMS) and are assimilated in ECMWF C-IFS system, along with total columns from GOSAT, to produce forecast of vertical profiles of atmospheric concentration. Owing to its 20 year-program, IASI also participates to the establishment of long time series in the Copernicus Climate Change Service (C3S). The retrievals are thus used for a variety of purpose: assimilation to produce CH4/CO2 profile forecasts; estimation of surface fluxes using “top-down” atmospheric inversions; characterization of specific emissions such as biomass burnings.

In this talk we will present the latest development of the retrieval and application of methane. In particular, we will present the extension and validation of the retrieval to the high latitude regions achieved during the ESA MethaneCAMP project. By using AirCore 0-30 km profiles of methane concentration acquired at Sodankylä and Kiruna and several stations of the French AirCore network, we will also highlight the crucial need to better understand the variation of stratospheric methane in order to combine satellite-derived methane columns with simulations from atmospheric transport models. Finally, we will present long-term and interannual variability of methane as seen by IASI, with a focus of 2020-2021 methane anomaly and the characterization of specific emissions such as biomass burnings or NordStream leakage.

How to cite: Meilhac, N., Crevoisier, C., Orset, R., Armante, R., Kivi, R., and Chen, H.: Global distribution of methane in the mid-troposphere as seen by IASI onboard three successive Metop platforms, EGU General Assembly 2024, Vienna, Austria, 14–19 Apr 2024, EGU24-17815, https://doi.org/10.5194/egusphere-egu24-17815, 2024.

EGU24-19932 | Posters on site | AS3.32

MERLIN – Measuring methane with lidar from space 

Dietrich G. Feist, Sabrina Zechlau, Gerhard Ehret, and Philippe Bousquet

Methane is known to be the second largest contributor to greenhouse gas induced warming after carbon dioxide. However, we know much less about its sources and sinks on global to regional scales and their sensitivity to climate change. Emissions of methane from permafrost and from the abundant number of wetlands, lakes, and rivers located in arctic and tropic regions are expected to substantially increase during this century due to the rapid climate warming. Therefore, disentangling natural and anthropogenic methane fluxes is a key scientific task.

The French-German Methane Remote Sensing LIDAR Mission MERLIN is designed to measure highly accurate atmospheric columns of methane to identify natural fluxes and emissions to better quantify global and regional sources and sinks, aiming at - reducing uncertainties on the global methane budget. To accomplish this, MERLIN will be relying on its Integrated Path Differential Absorption (IPDA) lidar to access methane atmospheric concentration at all latitudes and in all seasons. Especially, MERLIN will be able to provide spaceborne methane observations also in regions with high cloud cover and at high latitudes in winter time and in the so-called shoulder seasons. The IPDA measurements are insensitive to ground albedo variations and atmospheric aerosol load and will therefore achieve a level of accuracy not possible with the current available passive measurement techniques in space but will provide highly valuable information for closing knowledge gaps concerning global to regional methane distributions. The launch date of the MERLIN satellite is expected in 2029. Here we want to provide an overview of the MERLIN mission together with some discussion on the validation needs.

How to cite: Feist, D. G., Zechlau, S., Ehret, G., and Bousquet, P.: MERLIN – Measuring methane with lidar from space, EGU General Assembly 2024, Vienna, Austria, 14–19 Apr 2024, EGU24-19932, https://doi.org/10.5194/egusphere-egu24-19932, 2024.

EGU24-20456 | ECS | Posters on site | AS3.32

Statistical evaluation of the performance of EM27/SUN measurements as part of the MAGIC initiative 

Hajar El Habchi El Fenniri and the MAGIC initiative group

Measuring the concentration of greenhouse gases (GHGs) has become a major concern in modern society because of the growing impact of human activity on the global climate system (Hui et al. 2022). Satellite observations give an unique opportunity to observe the GHGs total columns at a global scale, but these space missions need to be validated from ground-based measurements.

In order to enhance cal/val activities of current and future space missions and to better understand the spatial and vertical distributions of GHGs in different key regions for carbon and methane cycles, the MAGIC (Monitroing of Atmospheric composition and Greenhouse gases through multi-Instrument Campaigns) initiative was launched in 2018 by CNRS and CNES, brining now together more than fifteen international teams (https://magic.aeris-data.fr). Various instruments, including research aircrafts, balloons and ground-based measurements, have been used yearly over intensive measurement campaigns. The EM27/SUN Fourier Transform Spectrometer is one of the ground-based measurement instruments used as part of this initiative. This device offers the practical advantages of portability and access to  column mole fractions of dry air  of CO2, CH4, CO and H2O from solar spectra

The main objective of this study is to carry out a statistical evaluation of the EM27/SUN data collected during the MAGIC measurement campaigns. The EM27/SUN devices (LERMA, LSCE, GSMA, CNES and KIT) have been deployed at various measurement sites since 2018. For the last two years, 2022 and 2023, measurements of CO2 and CH4 total column have been carried out in the city of Reims as a pilot site representative of medium-sized cities on a European scale, with the aim of estimating emissions of the main greenhouse gases on a city scale. The results obtained can also be compared with data from current satellite missions (S5P, IASI, GOSAT-2) for cal/val purposes.


Keywords: Climate change, Greenhouse gases, Ground-based FTIR, EM27/SUN, Reims broadcasts, Comparison


[Hui et al. 2022]: Hui, D., Deng, Q., Tian, H., & Luo, Y. (2022). Global climate change and greenhouse gases emissions in terrestrial ecosystems. In Handbook of climate change mitigation and adaptation (pp. 23-76). Cham: Springer International Publishing.


Magic initiative group : Bruno GROUIEZ, Lilian JOLY, Abdelhamid HAMDOUNI, Yao TE, Pascal JESECK, Christel GUY, Caroline BES, Denis JOUGLET, Hervé HERBIN, Morgan LOPEZ, Josselin DOC, Simona LATCHABADY, Michel RAMONET, Christof JANSSEN, Marc DELMOTTE, Deniel CAROLE, Corinne BOURSIER, Nicole MONTENEGRO VARELA, Hao FU, Neil HUMPAGE, Carlos ALBERTI, Vincent CASSÉ, Bruna SILVEIRA, Frank HASE, Cyril CREVOISIER

How to cite: El Habchi El Fenniri, H. and the MAGIC initiative group: Statistical evaluation of the performance of EM27/SUN measurements as part of the MAGIC initiative, EGU General Assembly 2024, Vienna, Austria, 14–19 Apr 2024, EGU24-20456, https://doi.org/10.5194/egusphere-egu24-20456, 2024.

EGU24-20565 | Posters on site | AS3.32

A harmonised approach to Calibration and Validation for upcoming Sentinel missions: updates for CO2M and Sentinel-5 

Catherine Hayer, Ruediger Lang, Rasmus Lindstrot, Bernd Sierk, and Bojan Bojkov

As part of the Copernicus Programme of the European Commission, the European Space Agency (ESA) and the European Organisation for the Exploitation of Meteorological Satellites (EUMETSAT) are expanding the Copernicus Space Component to include additional measurements of atmospheric composition. To support the evaluation of greenhouse gas emission reductions decided during the COP21 meeting in Paris in 2015, new measurements are required with improved accuracy. Measurements from space-borne instruments are a key component of this effort – requiring improvements in both spatial and spectral resolution.

The Copernicus missions are Europe’s primary contribution to this effort. The CO2M mission – a constellation of initially 2 platforms – is due to launch at the end of 2026 and will be available to contribute to the global stocktake in 2028 and those beyond. Data from the three instruments on board each platform – CO2I/NO2I, MAP, and CLIM – will be combined to act as a single “hyper-instrument”. NO2 is often co-emitted with CO2 & CH4, so the spectrometer (NO2I) will be used to detect near-surface NO2 plumes; the impact of aerosol pollution on the XCO2 columns will be calculated using the Multi-Angle Polarimeter (MAP); and cloud contamination will be observed and removed via data from the Cloud Imager (CLIM). These data will be used within the CO2 and CH4 retrievals from the CO2I spectrometer to improve the retrievals and allow for a precision of 0.7 ppm and an error of 0.5 ppm for XCO2, and an uncertainty of ~10 ppb for CH4.

Sentinel-5 will fly on the EUMETSAT Polar System – Second Generation (EPS-SG) platform, due for launch in 2025. S-5 will be a push-broom hyperspectral UVN spectrometer, with a 7.5 km2 spatial resolution and global daily coverage via a 2670 km wide swath. It will monitor various trace gases, including CH4.

Comprehensive calibration and validation analysis during the satellite’s commissioning will be undertaken to ensure they meet the specified requirements, and ongoing monitoring will ensure the instruments continue to comply with the challenging requirements. External data from ground-, airborne-, and satellite-based instruments will be required, covering the whole globe and multiple parts of the EM spectrum. Calibration and Validation techniques are being developed across CO2M and S-5, as well as Sentinel-4 which is also due for launch in 2025. This inter-mission collaboration has been undertaken to reduce duplication of effort and ensure lessons are learned from the commissioning of each mission.

Here, we give an update on the current state of planning for the Calibration and Validation operations, and identify gaps in the current provision of external networks, ground-based in particular, so that alternative and additional data sources can be procured.

How to cite: Hayer, C., Lang, R., Lindstrot, R., Sierk, B., and Bojkov, B.: A harmonised approach to Calibration and Validation for upcoming Sentinel missions: updates for CO2M and Sentinel-5, EGU General Assembly 2024, Vienna, Austria, 14–19 Apr 2024, EGU24-20565, https://doi.org/10.5194/egusphere-egu24-20565, 2024.

EGU24-21273 | Orals | AS3.32

Attributing methane and carbon dioxide plumes by emission sector with the EMIT and AVIRIS-3 imaging spectrometers 

Andrew Thorpe, Robert Green, David Thompson, Philip Brodrick, Adam Chlus, Jay Fahlen, Red Willow Coleman, Katherine Dana Chadwick, and Michael Eastwood

Imaging spectrometers like NASA’s Earth Surface Mineral Dust Source Investigation (EMIT) and the Airborne Visible/Infrared Imaging Spectrometer 3 (AVIRIS-3) have similar instrument parameters and methane and CO2 mapping capability that enables direct attribution of observed plumes to the oil and gas, waste, and agriculture sectors. Onboard the International Space Station, EMIT can constrain methane and CO2 emissions over a significant portion of the Earth’s surface. With improved spatial resolution, the airborne AVIRIS-3 instrument enables quantification of smaller emissions sources that compliment EMIT observations from space.

We provide an update of EMIT methane and CO2 observations to date and highlight examples from the oil and gas, waste, and agriculture sectors. For the first time, we present AVIRIS-3 methane and CO2 results. The fine spatial resolution of these instruments allows pinpointing of multiple emission sources in close proximity from different sectors, which is not possible with coarser spatial resolution instruments. These instruments offer the potential to improve understanding of greenhouse gas budgets, inform mitigation strategies, and in some cases lead to voluntary mitigation.

In support of NASA’s Open Source Science Initiative, all EMIT data and greenhouse gas data products are available through the Land Processes Distributed Active Archive Center (LP DAAC) and code is open source. EMIT results are also available through the greenhouse gas applications online mapping tool (https://earth.jpl.nasa.gov/emit/data/data-portal/Greenhouse-Gfases/) and U.S. Greenhouse Gas Center (https://earth.gov/ghgcenter/).

Figure 1: Over 900 methane plume complexes observed by NASA’s Earth Surface Mineral Dust Source Investigation (EMIT) are available through the EMIT greenhouse gas applications online mapping tool (https://earth.jpl.nasa.gov/emit/data/data-portal/Greenhouse-Gfases/) and U.S. Greenhouse Gas Center (https://earth.gov/ghgcenter/).

How to cite: Thorpe, A., Green, R., Thompson, D., Brodrick, P., Chlus, A., Fahlen, J., Coleman, R. W., Chadwick, K. D., and Eastwood, M.: Attributing methane and carbon dioxide plumes by emission sector with the EMIT and AVIRIS-3 imaging spectrometers, EGU General Assembly 2024, Vienna, Austria, 14–19 Apr 2024, EGU24-21273, https://doi.org/10.5194/egusphere-egu24-21273, 2024.

EGU24-1747 | Posters on site | AS3.33

Temperature dependent rate coefficients of the OH reaction with methacrolein and of the 1,4 H-shift reaction of the organic peroxy radical from methacrolein 

Hendrik Fuchs, Florian Berg, Rene Dubus, Luc Vereecken, Andreas Wahner, and Anna Novelli

We present the measurement of the temperature dependent rate coefficient of the OH reaction with methacrolein between 280 and 340 K using an OH reactivity instrument that allows to accurately determine the loss rate of OH reactants. Experiments were performed in synthetic air (presence of oxygen). In the case of methacrolein, OH radicals are regenerated by the 1,4 H-shift reaction of the aldehyde group of the MACR-1-OH-O2 radical which is the main peroxy radicals formed its OH reaction. Therefore, the observed OH decay deviates from a single-exponential decay expected from a pseudo-first order loss reaction. This allows to determine the rate coefficient of the peroxy radical isomerization reaction using model calculations, in which reaction rates are optimized to best describe the observed OH radical decay. This method is one of few direct measurements of atmospherically relevant peroxy radical isomerization reaction coefficients that have been reported in literature so far. Experimentally derived values are compared to quantum-chemical calculations of the 1,4 H-shift reaction rate and to rate coefficients reported in literature for the isomerization reaction and the OH reactions of methacrolein.

How to cite: Fuchs, H., Berg, F., Dubus, R., Vereecken, L., Wahner, A., and Novelli, A.: Temperature dependent rate coefficients of the OH reaction with methacrolein and of the 1,4 H-shift reaction of the organic peroxy radical from methacrolein, EGU General Assembly 2024, Vienna, Austria, 14–19 Apr 2024, EGU24-1747, https://doi.org/10.5194/egusphere-egu24-1747, 2024.

EGU24-2586 | ECS | Orals | AS3.33

The metric α(CH3O2) indicates ozone formation sensitivity towards NOx and VOCs in the global troposphere 

Clara M. Nussbaumer, Andrea Pozzer, Jos Lelieveld, and Horst Fischer

While stratospheric ozone (O3) is essential to life on Earth, tropospheric ozone can have adverse effects. At the surface, it contributes to air pollution and impacts human health. Further, it is the third most important anthropogenic greenhouse gas enhancing global warming and climate change, and its radiative forcing efficiency is largest in the upper troposphere. Therefore, it is imperative to investigate ozone formation and its sensitivity to the precursor gases nitrogen oxides (NOx) and volatile organic compounds (VOCs). Commonly used metrics apply to the planetary boundary layer but fail to identify O3 formation sensitivity at higher altitudes. We introduce the new metric α(CH3O2) to indicate O3 sensitivity, which represents the share of methyl peroxy radicals (CH3O2) forming O3 through the reaction with NO in competition with the reaction with HO2 terminating the catalytic (O3 forming) HOx cycle. We demonstrate the versatility and applicability of α(CH3O2) by investigating a number of studies, including several based on data from stationary field measurements, aircraft observations and model simulations in various locations around the globe, across all altitudes from the surface to the upper troposphere and over a time period of the past 20 years. We identify where O3 chemistry is sensitive to NOx or VOCs in the global troposphere considering a wide range of ambient conditions.

How to cite: Nussbaumer, C. M., Pozzer, A., Lelieveld, J., and Fischer, H.: The metric α(CH3O2) indicates ozone formation sensitivity towards NOx and VOCs in the global troposphere, EGU General Assembly 2024, Vienna, Austria, 14–19 Apr 2024, EGU24-2586, https://doi.org/10.5194/egusphere-egu24-2586, 2024.

Hydroxyl radical (OH) is the dominant oxidation agent in the atmosphere due to its high reactivity. OH plays a decisive role in the degradation of primary air pollutants and the formation of secondary air pollutants (e.g., SOA and O3). For the same reason, OH atmospheric abundance is extremely low, and its atmospheric measurement usually presents a challenging job. In this work, we have developed a new method to detect OH radicals using chemical ionization mass spectrometry (CIMS). The working principle of the new method is that OH was first completely converted into gaseous sulfuric acid (SA) and was then detected by a nitrate-CIMS. Potential interference from ambient SA and other reactive intermediates, such as Criegee Intermediates (CIs), was also dealt with by introducing free radical scavengers. A high-resolution time-of-flight mass spectrometer was also used to explore potential isotopic interferences. The new instrument was calibrated with artificially generated SA standards, quantified with the N2O-actinnometry. A field test was conducted in the Summer of 2023. The results demonstrated that OH concentration ranged from a few 106 molecules cm-3 up to ~2×10⁷ molecules cm-3, basically in line with OH level reported in other areas of China. The ambient SA level was significantly lower than OH, likely due to the high condensation loss near the ground surface. These observation results were further verified by a master chemical mechanism (MCM) box model simulation.

How to cite: Zheng, J., Lyu, T., and Ma, Y.: Simultaneous detection of gaseous sulfuric acid and OH radicals using chemical ionization mass spectrometry, EGU General Assembly 2024, Vienna, Austria, 14–19 Apr 2024, EGU24-2766, https://doi.org/10.5194/egusphere-egu24-2766, 2024.

EGU24-2881 | ECS | Orals | AS3.33

Airborne Measurements of OH Reactivity over Urban Megacities 

Aaron Stainsby and the AEROMMA Team

           The production of organic peroxy radicals from the reactions of the hydroxyl radical (OH) and organic compounds is frequently a rate-limiting step in the formation of ground-level ozone.  OH reactivity, the inverse of the OH radical’s lifetime, gives a measure of the production rate of peroxy radicals. A custom-built instrument that can directly measure the total OH reactivity was developed at the Forschungszentrum Jülich and employed on the AEROMMA measurement campaign, organized by the US National Oceanic and Atmospheric Administration in the summer of 2023. The measurement campaign utilized a variety of aircraft and an array of advanced instrumentation to investigate the chemical composition of urban pollution outflows. It is expected that the importance of vehicle emissions is decreasing and that of other emissions, like volatile chemical products, are increasing.  OH reactivity was measured over major urban areas, including New York City, Los Angeles, Chicago, and Toronto.

           A suite of instrumentation measured the OH reactants, such as inorganics, nitrogen oxides, alkanes/alkenes, aromatics, and biogenic organic compounds. In the presentation, the sum of OH reactivity from these species is compared to the measured reactivity, to explore the closure of reactivity budget.  From the measurement campaign, the relative contributions of different emission sources to the total OH reactivity including sources for VCPs are analyzed.

How to cite: Stainsby, A. and the AEROMMA Team: Airborne Measurements of OH Reactivity over Urban Megacities, EGU General Assembly 2024, Vienna, Austria, 14–19 Apr 2024, EGU24-2881, https://doi.org/10.5194/egusphere-egu24-2881, 2024.

Chengdu Plain Urban Agglomeration (CPUA) is one of the most serious areas of ozone pollution in China. A comprehensive field experiment focused on the ozone episode characteristics, and temporal and spatial variations of ozone production rate was conducted at CPUA in the summer of 2019. Six sampling sites were set and two ozone pollution episodes were recognized. The daily maximum 8-h average (MDA8) O3 concentration reached 137.9 ppbv in the urban sites during the ozone episode. The high concentration of O3 was closely related to intense solar radiation, high temperatures, and precursor emissions. Based on the calculation of OBM, the OH-HO2-RO2 radical chemistry and ozone production rate (P(O3)) was analyzed. The OH daily maximum is in the range of 3-13×106 molecules cm−3, and HO2 and RO2 are in the range of 2–14×108 molecules cm−3 during ozone episodes, varying by the location of sites. During ozone episode, the average maximum of P(O3) in suburb sites (about 30 ppb h-1.) were compared with urban sites, while the maximum of P(O3) was 18 ppb h-1 in rural sites. The relative incremental reactivity (RIR) and empirical kinetic modeling approach (EKMA) results demonstrate that centered on the urban area of Chengdu, where it was a VOC-limited regime, the northern and southern suburban area was transition region. In the remote rural area of the southern CPUA, it was highly NOx-limited. Local ozone production driven by the photochemical process is important for CPUA. The geographically differentiated recognition of the ozone regime found by this study can help to tailor control strategies for local conditions and avoid the negative effects of a one-size-fits-all approach.

How to cite: Zhou, M., Liu, Y., and Lu, K.: Ozone production sensitivity analysis for the Chengdu Plain Urban Agglomeration based on a muti-site and two-episode observation, EGU General Assembly 2024, Vienna, Austria, 14–19 Apr 2024, EGU24-2984, https://doi.org/10.5194/egusphere-egu24-2984, 2024.

EGU24-3007 | ECS | Posters on site | AS3.33 | Highlight

Revisiting the Ultra-Violet Absorption Cross Section of Gaseous Nitrous Acid (HONO): New Insights for Atmospheric HONO Budget 

Xuan Li, Huabin Dong, Keding Lu, and Yuanhang Zhang

Nitrous acid (HONO) is an important source of hydroxyl radicals (OH) in the atmosphere. Precise determination of the absolute ultra-violet (UV) absorption cross-section of gaseous HONO lays the basis for the accurate measurement of its concentration by optical methods and the estimation of HONO loss rate through photolysis. We performed a series of laboratory and field intercomparison experiments for HONO measurement between striping coil-liquid waveguide capillary cell (SC-LWCC) photometer and incoherent broadband cavity-enhanced absorption spectroscopy (IBBCEAS). Specified HONO concentrations prepared by an ultra-pure standard HONO source were utilized for laboratory intercomparisons. Results shows a consistent ~22% negative bias in measurements of the IBBCEAS compared with SC-LWCC photometer. It is confirmed that the discrepancies occurring between these techniques are associated with the overestimation in the absolute UV absorption cross-sections through careful analysis of possible uncertainties. We quantified the absorption cross-section of gaseous HONO (360-390nm) utilizing a custom-built IBBCEAS instrument, and the results was found to be 22%-34% lower than the previously published absorption cross-sections widely used in HONO concentration retrieval and atmospheric chemical transport models (CTMs). This suggests that the HONO concentrations retrieved by optical methods based on absolute absorption cross-sections may have been underestimated by over 20%. Plus, the daytime loss rate and unidentified sources of HONO may also have evidently been overestimated in pre-existing studies. In summary, our findings underscore the significance of revisiting the absolute absorption cross-section of HONO and the re-evaluation of the previously reported HONO budgets.

How to cite: Li, X., Dong, H., Lu, K., and Zhang, Y.: Revisiting the Ultra-Violet Absorption Cross Section of Gaseous Nitrous Acid (HONO): New Insights for Atmospheric HONO Budget, EGU General Assembly 2024, Vienna, Austria, 14–19 Apr 2024, EGU24-3007, https://doi.org/10.5194/egusphere-egu24-3007, 2024.

EGU24-3759 | ECS | Orals | AS3.33

Open path cavity-enhanced absorption spectroscopy for detecting ambient nitrate radicals 

Haichao Wang, Yiming Wang, and Jie Wang

Nitrate radical is an important nocturnal oxidant in the atmosphere, regulates the fate of volatile organic compounds and nitrogen oxide, and affects the air quality. While the concentration of NO3 in the ambient is low to several to tens of parts per trillion by volume in general on the surface. During the past decades, people attempted to detect ambient NO3 by developing several techniques including Differential optical absorption spectroscopy (DOAS), Laser-induced fluorescence (LIF), Cavity Ring-Down Spectroscopy (CRDS), and Cavity-enhanced absorption Spectroscopy (CEAS). The latter two are widely used in NO3 measurement but suffer from the sampling loss change due to its high reactivity. Here we try to develop an open CEAS system to measure NO3 in the ambient air. This method is free of sampling loss but has its technical challenges, that as the interferences of water absorptions during the NO3 absorption window near 662 nm. Different from previous studies, we applied a small cavity cage (~40 cm high reflectivity mirror distance) during the hardware design, which features good stability. In addition, we used a sensor to measure ambient temperature and relative humidity, which helped us to calculate the real-time water vapor cross-section to retrieve the water vapor concentration with high accuracy. At last, we will report the instrumental performance in the laboratory tests and field applications.

How to cite: Wang, H., Wang, Y., and Wang, J.: Open path cavity-enhanced absorption spectroscopy for detecting ambient nitrate radicals, EGU General Assembly 2024, Vienna, Austria, 14–19 Apr 2024, EGU24-3759, https://doi.org/10.5194/egusphere-egu24-3759, 2024.

EGU24-3795 | Orals | AS3.33

Formation and reaction mechanisms of Criegee intermediates in the atmosphere 

Shengrui Tong, Meifang Chen, Shanshan Yu, and Maofa Ge

Criegee intermediates (CIs) can be generated by the ozonolysis of alkenes, and few amounts can come from radical-radical reactions. CIs are found to be the important oxidants, and can react with many gases in the atmosphere. The reaction rate of CIs with HCOOH is about 10-10 cm3molcule-1s-1, and the reaction rate of SO2 with CIs is much faster than with OH radical. A Matrix-isolate Vacuum FTIR method was constructed to capture CIs during the reaction of O3 with alkenes. Different kinds of Primary ozonides (POZs), CIs, and Secondary ozonides (SOZs) were detected, and the reaction processes were deduced. Combining of the experimental and quantum chemistry methods, the reactivity of different structure CIs were investigated. The contribution of these CIs to the formation of OH radicals and SOA were further discussed. Fundamental understanding on the structures and reactivity of CIs is crucial to deepen the understanding of Criegee chemistry and its impact on the atmospheric chemistry.

How to cite: Tong, S., Chen, M., Yu, S., and Ge, M.: Formation and reaction mechanisms of Criegee intermediates in the atmosphere, EGU General Assembly 2024, Vienna, Austria, 14–19 Apr 2024, EGU24-3795, https://doi.org/10.5194/egusphere-egu24-3795, 2024.

EGU24-4899 | Posters on site | AS3.33

Detection of RO2 radicals and other products from oxidation of VOCs in PAM chamber with NH4+ ionization mass spectrometry  

Yang Li, Xuefei Ma, Keding Lu, and Yuanhang Zhang

Organic peroxy radicals (RO2), derived from volatile organic compounds (VOCs) oxidation by hydroxyl radical (OH), ozone (O3), and nitrate radical (NO3) etc., play an important role in atmospheric chemistry. Direct measurements of speciated RO2 are challenging but necessary for understanding their atmospheric fate and impact. In this study, we introduce a newly developed Proton Transfer Reaction measurement method (PTR3-TOF) using NH4+ as the ion source to measure the multifunctional complex RO2 and related reactive oxidation products based on the principle of chemical ionization mass spectrometry (CIMS). We establish a calibration system that combines a home-built OH calibration source with various standard VOC gases, enabling to quantify both RO2 radicals and closed-shell species with a detection limit of about 1.6×10⁷ molecule cm-3 (2σ, 60 s) and an uncertainty of 10%. This technique is first applied to study the gas-phase ozonolysis of cyclohexene in our laboratory, with experiments carried out using the O3 OFR mode in a PAM-OFR system under near-real atmosphere conditions. As a consequence, a total of 30 cyclohexene ozonolysis reaction products are detected in the first step of cyclohexene ozonolysis, including 9 types of RO2 radicals and 21 types of closed-shell species, with oxygen atoms ranging from 1 to 8. We also establish a mechanistic model for the first-generation products of ozonolysis of cyclohexene, and the simulation and measurement results agree within a factor of 2-3 for the respective formulas except for some differences in a few species.

How to cite: Li, Y., Ma, X., Lu, K., and Zhang, Y.: Detection of RO2 radicals and other products from oxidation of VOCs in PAM chamber with NH4+ ionization mass spectrometry , EGU General Assembly 2024, Vienna, Austria, 14–19 Apr 2024, EGU24-4899, https://doi.org/10.5194/egusphere-egu24-4899, 2024.

EGU24-5080 | Posters on site | AS3.33

Intensive photochemical oxidation in the marine atmosphere: Evidence from direct radical measurements 

Renzhi Hu, Guoxian Zhang, Pinhua Xie, and Wenqing Liu

Measurement of OH and HO2 radicals was conducted at a coastal site in the Pearl River Delta in October 2019. The mixing of air masses of continental and marine origins can lead to more variability in radical concentrations. In the ocean-atmosphere period (OCM), the observed OH and HO2 radicals could be reflected by the RACM2-LIM1 chemical mechanism. However, the heterogeneous uptake process has a certain effect on the HOx radical chemistry, but the influence of the halogen mechanism is limited due to the NOx level. Land mass (LAM) was associated with a higher net ozone generation rate (5.52 ppb/h), and the daily maximum OH and HO2 concentrations were 7.1 × 106 cm−3 and 5.2 × 108 cm−3, respectively. Rapid oxidation process was accompanied by a higher diurnal nitrous acid (HONO) concentration (> 400 ppt). The particularity of HONO chemistry increases the ozone generation rate of the coastal atmosphere by ~40%. Without HONO constraint, simulated ozone concentration drops from ~75 ppb to a global background (~35 ppb). Therefore, the promotion of oxidation by elevated precursors deserves a lot of attention when aiding pollution mitigation policies.

How to cite: Hu, R., Zhang, G., Xie, P., and Liu, W.: Intensive photochemical oxidation in the marine atmosphere: Evidence from direct radical measurements, EGU General Assembly 2024, Vienna, Austria, 14–19 Apr 2024, EGU24-5080, https://doi.org/10.5194/egusphere-egu24-5080, 2024.

EGU24-5208 | ECS | Posters on site | AS3.33

An observation-based analysis of hydroxyl radicals in Guangdong, China 

Liyan Wei

Hydroxyl radical (OH) is recognized to be one of the most reactive oxidants in the troposphere and plays a critical role in driving the photochemistry of the troposphere. The reactions with OH initiate the oxidation of most trace gases in the troposphere, e.g. NOx and volatile organic compounds (VOCs), which leads to the formation of secondary oxidation products such as ozone (O3) and particular matter (e.g. PM2.5), thus changing the atmospheric composition and affecting the climate. In this study, an observation-based model (OBM) for evaluating the OH concentrations in Guangdong province, China has been developed. We employed the OBM to derive the OH radicals in seven representative districts/cities in Guangdong province from 2015 to 2020. The average OH concentrations in the seven cities gradually increased from an average of (3.3±0.8)×106 cm–3 at 08:00 to (6.7±0.7)×106 cm–3 at 13:00 local time. The OH concentrations derived by the OBM were found in reasonable agreement with previous observations as well as modeling studies in Guangdong. In addition, the average OH concentrations derived by the OBM method in the seven cities in Guangdong Province were about five times higher than those in clean background regions such as the Amazonas, Brazil, and pre-industrial Guangdong province. This is a highly significant point in terms of the impacts of the changing OH on the atmospheric capacity and chemical composition, which can have detrimental effects on human health, ecosystem and the climate.

How to cite: Wei, L.: An observation-based analysis of hydroxyl radicals in Guangdong, China, EGU General Assembly 2024, Vienna, Austria, 14–19 Apr 2024, EGU24-5208, https://doi.org/10.5194/egusphere-egu24-5208, 2024.

EGU24-5600 | ECS | Orals | AS3.33

Exacerbation of Ozone Pollution by Anthropogenic Monoterpenes 

Xuefei Ma, Haichao Wang, Zhaofeng Tan, Hongli Wang, Keding Lu, and Yuanhang Zhang
Monoterpenes exert a critical influence on air quality and climate change by impacting fine particle formation. This study provides field evidence indicating that monoterpene oxidations significantly bolster local ozone production in eastern China, with the observed monoterpene likely originating from biomass burning rather than biogenic emissions. Nighttime correlation with CO and consistent ratios align with values from biomass burning experiments. Experimental determination of fast monoterpene oxidations, through direct radical measurements, reveals a daily ozone enhancement of 4-18 ppb, constituting 6-16% of total ozone production, depending on monoterpene speciation. This underscores the substantial contribution of previously overlooked anthropogenic monoterpenes to O3 production in eastern China, with potential relevance in areas worldwide characterized by massive emissions, particularly those with high NOx levels. The findings emphasize the need to consider anthropogenic monoterpenes in coordinated efforts to mitigate O3 and particulate matter pollution.

How to cite: Ma, X., Wang, H., Tan, Z., Wang, H., Lu, K., and Zhang, Y.: Exacerbation of Ozone Pollution by Anthropogenic Monoterpenes, EGU General Assembly 2024, Vienna, Austria, 14–19 Apr 2024, EGU24-5600, https://doi.org/10.5194/egusphere-egu24-5600, 2024.

EGU24-6868 | ECS | Orals | AS3.33

Missing OH reactivity contributed by photochemical reactions cause uncertainty to ozone production in AQUAS campaigns in Japan 

Jiaru Li, Yosuke Sakamoto, Nanase Kohno, Kentaro Murano, and Yoshizumi Kajii

Tropospheric ozone is harmful to human and the ecosystem, which is by-product of the reaction of OH with VOCs and NOx. Field campaign is an effective way to assess regional air quality and the detection of OH reactivity provides a top-down approach to understand the general existence of trace species under specific conditions. Concurrent trace species measurement as bottom-up approach gives information on the detailed atmospheric chemistry. We have conducted Air QUAlity Study (AQUAS) campaigns in different sites in Japan over years and explored the missing OH reactivity contributed by unknown trace species that equals to the discrepancy between top-down total OH reactivity and bottom-up calculated OH reactivity. The investigation of missing OH reactivity in field campaigns showed potential contribution from secondary products. Unconsidered missing OH reactivity on ozone production sensitivity will lead underestimation to ozone production potential and overestimation to VOC-limited regime. In addition, field observations at the same site and varied years such as before and after the corona virus (COVID-19) pandemic can also shed light on the reduction of anthropogenic emission, which should be meaningful for a low emission future society. Missing trace species and unconsidered photochemistry in several field campaigns in Japan will be compared in detail and their role should be considered to make effective air quality policies.

Acknowledgement: We acknowledge all collaborators on each of the field campaigns specifically our debts to Dr. Yasuhiro Sadanaga, Dr. Kei Sato, Dr Shungo Kato, and Dr. Yoshihiro Nakashima.

How to cite: Li, J., Sakamoto, Y., Kohno, N., Murano, K., and Kajii, Y.: Missing OH reactivity contributed by photochemical reactions cause uncertainty to ozone production in AQUAS campaigns in Japan, EGU General Assembly 2024, Vienna, Austria, 14–19 Apr 2024, EGU24-6868, https://doi.org/10.5194/egusphere-egu24-6868, 2024.

EGU24-7819 | Orals | AS3.33

Using peroxy radical measurements from chemical amplifiers to quantify ozone production rates in the troposphere 

Sébastien Dusanter, Goufrane Abichou, Ahmad Lahib, Marina Jamar, Weidong Chen, Hendrik Fuchs, Anna Novelli, Michelle Färber, Franz Rohrer, and Alexandre Tomas

Ozone (O3) is a criteria air pollutant in the troposphere and powerful oxidant that damages cellular tissue along our respiratory tract, causing distress, and crops and other plants, decreasing primary productivity in the environment. O3 is also a greenhouse gas that is responsible for ~12% of the anthropogenic global warming since 1750. Unlike other criteria air pollutants that have major primary emission sources, O3 is entirely a secondary pollutant and has a complicated non-linear dependence on its precursors nitrogen oxides (NOx) and volatile organic compounds (VOCs). For instance, lowering some O3 precursors can actually increase local O3 concentrations under certain conditions. Ozone concentrations observed at monitoring sites not only depend on the local chemistry but also on the transport of air masses containing O3 from other locations, and on dry deposition. It is therefore essential to clearly understand how these physicochemical processes impact ozone budgets to design efficient mitigation measures at targeted sites.

Simultaneous measurements of ozone production rates, P(O3), and ozone concentrations can provide a detailed picture of the ozone budget at a monitoring site, including a critical assessment of the O3-driving processes mentioned above. In this study, we will present how a chemical amplifier can be used to infer P(O3) from peroxy radical measurements and we will discuss the reliability of this methodology. We will present results from ozone production experiments that were performed in the SAPHIR atmospheric chamber during the ROxCOMP (ROx Comparison) campaign. We will show how P(O3) values inferred from the chemical amplifier compare to values derived from observed Ox (O3+NO2) changes in the chamber for various experiments using contrasting conditions of VOCs and NOx.

Acknowledgments. This work is supported by the French national research agency (ANR) under LABEX-CaPPA (ANR-11-LABX-005-01), the CPER-CLIMIBIO program, the French national program LEFE/CHAT INSU and the Hauts-de-France region of France. This project has received funding from the European Union’s Horizon 2020 research and innovation programme through the ATMO-ACCESS Integrating Activity under grant agreement No 101008004.

How to cite: Dusanter, S., Abichou, G., Lahib, A., Jamar, M., Chen, W., Fuchs, H., Novelli, A., Färber, M., Rohrer, F., and Tomas, A.: Using peroxy radical measurements from chemical amplifiers to quantify ozone production rates in the troposphere, EGU General Assembly 2024, Vienna, Austria, 14–19 Apr 2024, EGU24-7819, https://doi.org/10.5194/egusphere-egu24-7819, 2024.

EGU24-9483 | ECS | Orals | AS3.33

Measurements and experimental budget analysis of OH, HO2 and RO2 radicals in a remote tropical marine location 

Samuel Seldon, Lisa Whalley, Graham Boustead, Rachel Lade, Dwayne Heard, Katie Read, Anna Callaghan, Shalini Punjabi, James Lee, Lucy Carpenter, and Luis Neves

The OH radical is the dominant daytime tropospheric oxidising agent, reacting with almost all Volatile Organic Compounds (VOCs). The majority of global methane is removed in the tropical troposphere by OH. The oxidation of VOCs by OH forms peroxy radicals, HO2 and RO2, with formaldehyde (HCHO) often formed as a product. In remote marine environments, ozone (O3) is destroyed during the day by reaction with OH or HO2, or photolysis.

Ground-based measurements of OH, HO2, RO2, OH reactivity and HCHO, together with a comprehensive suite of supporting measurements, were made at the Cape Verde Atmospheric Observatory (CVAO), situated on the island of São Vicente located in the Tropical North Atlantic Ocean, during February 2023 as part of the NERC-funded PEROXY project. With no nearby emissions and prevailing winds from over the ocean, the clean marine air sampled was representative of the open ocean.

In this work, time series and diurnal variations of the measured species are presented, and production and destruction rates of OH, HO2 and RO2 have been calculated. Reactions of the halogen oxides, IO and BrO, are shown to be important for understanding the chemistry of OH, HO2 and RO2. The CH3O2 reactions with halogen oxides are an important sink for RO2 and a possible source of HO2 that likely enhances O3 destruction in remote marine environments. Heterogeneous losses are also shown to be important for HO2. The OH budget analysis shows a possible minor missing source of OH while net HO2 production is observed, indicating either an overestimation of HO2 sources or an underestimation of HO2 sinks. Net RO2 production is observed, with the reactions of CH3O2 with halogen oxides and heterogeneous losses of CH3O2 to aerosols and the ocean surface needed to close the RO2 budget, but the magnitude of these loss processes is currently highly uncertain.

How to cite: Seldon, S., Whalley, L., Boustead, G., Lade, R., Heard, D., Read, K., Callaghan, A., Punjabi, S., Lee, J., Carpenter, L., and Neves, L.: Measurements and experimental budget analysis of OH, HO2 and RO2 radicals in a remote tropical marine location, EGU General Assembly 2024, Vienna, Austria, 14–19 Apr 2024, EGU24-9483, https://doi.org/10.5194/egusphere-egu24-9483, 2024.

EGU24-11121 | Orals | AS3.33 | Highlight

Exploring Biases and Long-term Trends in Tropospheric OH: A Synergistic Approach with Model Simulations, Interpretable Machine Learning, and Satellite Observations 

Bryan Duncan, Amir Souri, Sarah Strode, Daniel Anderson, Michael Manyin, Junhua Liu, Luke Oman, and Brad Weir

The accurate representation of tropospheric hydroxyl radical (TOH) is crucial for reasonably modeling methane concentrations — a potent greenhouse gas. We use an improved parameterization of TOH using an interpretable and agile machine learning module named ECCOH (pronounced "echo") in NASA's GEOS global model to unravel the intricacies of TOH to its key inputs. However, the accuracy of this model is hampered by the accurate representation of its critical inputs. Fortunately, retrieving trace gases like nitrogen dioxide (NO2) and formaldehyde (HCHO) from space-borne sensors, like the Aura Ozone Monitoring Instrument (OMI), has seen remarkable progress. Consequently, we leverage these observations to assess how they can effectively alleviate some biases in TOH and can help better reproduce its long-term trends. In contrast to the earlier investigations, the refined representation of TOH archives a finer spatial resolution (1x1 degrees), and it is more up to date (2005-2019), allowing for elucidating the impact of recent emission regulations, such as those imposed in China, on TOH. OMI NO2 yields valuable insights over biomass-burning areas in Eastern Europe and central Africa, where our prior emission estimates possess significant biases, mitigating regional TOH biases up to 20%. Oceanic HCHO concentrations, serving as a proxy for TOH due to the predominant chemical pathway of VOC oxidation through OH, are only moderately altered by OMI HCHO, attributed to low signal-to-noise ratios and satisfactory representation of HCHO in the a priori simulations. Ultimately, we disentangle the convoluted map of TOH linear trends by isolating five pivotal inputs to the TOH parameterization, including stratospheric ozone, tropospheric ozone, water vapor, HCHO, and NO2. Our results demonstrate that these five parameters can collectively explain 65% of the variability in TOH trends alone. With the deployment of new satellites with enhanced sensor configurations and better temporal resolutions, our mission at NASA is to exploit those observations to improve the representation of many variables highly linked to TOH.

How to cite: Duncan, B., Souri, A., Strode, S., Anderson, D., Manyin, M., Liu, J., Oman, L., and Weir, B.: Exploring Biases and Long-term Trends in Tropospheric OH: A Synergistic Approach with Model Simulations, Interpretable Machine Learning, and Satellite Observations, EGU General Assembly 2024, Vienna, Austria, 14–19 Apr 2024, EGU24-11121, https://doi.org/10.5194/egusphere-egu24-11121, 2024.

EGU24-11531 | ECS | Posters on site | AS3.33

Glyoxal Yields from Selected Hydrocarbon Oxidations 

Danny McConnell, Graham Boustead, Dwayne Heard, Moira Hutchinson, Daniel Stone, Paul Seakins, and William Warman

Glyoxal is a second generation product of atmospheric volatile organic compound (VOC) oxidation with both biogenic and anthropogenic compounds being major sources. Measurements of glyoxal provide information on the mechanism of precursor oxidations. This can include information on site specific OH abstraction reactions and branching ratios of peroxy and alkoxy reactions. Glyoxal’s low vapour pressure means that glyoxal is relevant in the formation and growth of secondary organic aerosols, impacting human health and climate. Due to glyoxal’s strong and distinct UV absorption spectrum, measurements of atmospheric glyoxal concentrations via satellite are possible allowing spatial distributions on global and regional scales. Ratios of formaldehyde and glyoxal formation vary widely across different compound oxidation pathways, hence satellite measurements of formaldehyde and glyoxal can give information of initial VOC distributions. This presentation reports glyoxal yields from various OH initiated VOC oxidation processes including: ethene, ethanal, and glycolaldehyde.

Experiments were carried out in the HIRAC chamber with direct detection of glyoxal via laser induced phosphorescence. Precursors and stable intermediates were tracked with PTR-MS or FTIR instruments, concentrations of relevant radicals were measured using FAGE or ROxLIF and O3 and NOx via commercial analysers. Preliminary results show glyoxal yields from ethene, ethanal and glycolaldehyde as (0.60 ± 0.07)%, (0.10 ± 0.05)% and (10 ± 1)% respectively.

The implications of these glyoxal measurements on VOC oxidation mechanisms and observed atmospheric glyoxal concentrations will be discussed.

How to cite: McConnell, D., Boustead, G., Heard, D., Hutchinson, M., Stone, D., Seakins, P., and Warman, W.: Glyoxal Yields from Selected Hydrocarbon Oxidations, EGU General Assembly 2024, Vienna, Austria, 14–19 Apr 2024, EGU24-11531, https://doi.org/10.5194/egusphere-egu24-11531, 2024.

A profound understanding of the correlation between ozone and particulate matter is crucial for the collaborative prevention and control of these pollutants. However, existing research predominantly focuses on near-surface analysis, with limited exploration into the vertical variations of the ozone-particulate matter correlation. Leveraging two years of observation data from the Canton Tower Atmospheric Pollution Vertical Gradient Observation Platform, this study investigates the correlation between ozone and particulate matter at different heights in the near-surface layer of Guangzhou urban area. The results indicate that: ①The correlation between ozone and particulate matter is more pronounced in summer and autumn at different heights but diminishes in winter; ②At lower levels, the correlation between ozone and particulate matter is weaker, ascending with altitude, and peaks at higher levels; ③Regardless of the height, the correlation between ozone and particulate matter is positively influenced by smaller particle sizes. In summary, within the near-surface layer below 500 meters in the urban area of Guangzhou, especially under meteorological conditions conducive to ozone generation, a significant positive correlation between ozone and particulate matter is evident. As altitude increases and particle size decreases, the correlation coefficient significantly rises, particularly in high-level ultrafine-sized particles, suggesting shared chemical mechanisms in the formation processes of ozone and particulate matter. This study contributes novel observational evidence supporting the cooperative control principle of ozone and particulate matter.

How to cite: Zhang, J. and Wang, X.: Correlation between Ozone and Particulate Matter in the Near-surface Layer of Guangzhou Urban Area, China, EGU General Assembly 2024, Vienna, Austria, 14–19 Apr 2024, EGU24-12263, https://doi.org/10.5194/egusphere-egu24-12263, 2024.

EGU24-12733 | ECS | Orals | AS3.33

Ultraviolet radiation as a proxy measurement for electrically generated hydroxyl radicals 

Jena Jenkins and William Brune

Reaction with hydroxyl radical (OH) initiates the removal of many pollutants from the atmosphere that impact human health and climate, but can also lead to the formation of different pollutants. Extreme amounts of OH are directly produced by lightning and other, weaker electrical discharges in the atmosphere, although estimates of the global impact of this source of OH are highly uncertain due to the limited field data. However, obtaining more field data is difficult, as measuring electrically generated OH with traditional OH-detecting instruments risks exposing both the instrument and the user to dangerous electrical currents. A possible alternative approach is to use the ultraviolet (UV) radiation generated by the electrical discharges as a proxy measurement for OH generation. Using a laboratory setup, the relationship between OH and UV radiation in different types of electrical discharges is investigated and quantified as a first step toward designing an instrument that can be safely deployed around electrical discharges in the field, leading to more certain estimates of the global impact of electrically generated OH.

How to cite: Jenkins, J. and Brune, W.: Ultraviolet radiation as a proxy measurement for electrically generated hydroxyl radicals, EGU General Assembly 2024, Vienna, Austria, 14–19 Apr 2024, EGU24-12733, https://doi.org/10.5194/egusphere-egu24-12733, 2024.

OH radicals play a key role for the self-cleaning and oxidation capacity of the atmosphere. Therefore, the detection of OH radicals in water is of great interest for atmospheric research. Terephthalate is a commonly used reagent to detect OH radicals in the aqueous system, forming the fluorescent product 2-hydroxytherephthalate. This reaction is reported to be a selective and sensitive method that can detect OH radicals in the nanomolar range. By irradiating a solution of disodium terephthalate in ultrapure water with different wavelengths between 250 nm and 310 nm the influence of photochemical excitation on the formation of 2-hydroxyterephthalate was studied using fluorescence spectroscopy. First results indicate that in the aqueous system the fluorescent 2-hydroxyterephthalate is not only formed by OH radicals but also through a photochemical reaction upon direct excitation of terephthalate. This photochemically driven hydroxylation may lead to an overestimation of the actual OH radical concentration, which could have a significant effect on the measurement outcome, particularly when measuring at the edge of the detection limit. Therefore, it can be concluded that the excitation wavelength should be carefully considered when using terephthalate as a detection reagent for OH radicals in aqueous solutions.

How to cite: Werner, L., Naumann, R., and Theis, A.: Detection of OH radicals in aqueous solution using terephthalate: Overestimation of the OH radical concentration due to photochemical hydroxylation of terephthalate, EGU General Assembly 2024, Vienna, Austria, 14–19 Apr 2024, EGU24-13055, https://doi.org/10.5194/egusphere-egu24-13055, 2024.

EGU24-13251 | Orals | AS3.33

Re-assessment of hydroxyl radical chemistry using new observation data and model comparisons 

Philip Stevens, Paige Price, Brandon Bottorff, Jena Jenkins, and William Brune

Atmospheric formation of ozone and secondary organic aerosols as well as the removal of greenhouse gases such as methane and hydrofluorocarbons depend on the fast radical cycling of the hydroxyl radical (OH). Previous measurements of these radicals in forest environments have shown serious discrepancies with model predictions, bringing into question our understanding of OH radical chemistry, especially in regions characterized by low NOx (NOx = NO + NO2) and high biogenic volatile organic compound (BVOC) concentrations. However, previous studies have discovered that some OH radical measurement techniques may be sensitive to interferences, such as from the ozonolysis of BVOCs. This has the potential to cause artificially high observations of OH especially in forested areas. In this work, we present an analysis of previous measurements of OH radical concentrations from rural, suburban, and urban areas while accounting for the measured interferences and covering a wide range of NOx concentrations. This re-assessment provides insight regarding our current understanding of OH radical recycling under low NOx and high BVOC conditions.

How to cite: Stevens, P., Price, P., Bottorff, B., Jenkins, J., and Brune, W.: Re-assessment of hydroxyl radical chemistry using new observation data and model comparisons, EGU General Assembly 2024, Vienna, Austria, 14–19 Apr 2024, EGU24-13251, https://doi.org/10.5194/egusphere-egu24-13251, 2024.

EGU24-13295 | Orals | AS3.33 | Highlight

Measurements and modelling of OH, HO2 and RO2 radicals and OH reactivity in the Tibetan Plateau 

Dwayne Heard, Lisa Whalley, Eloise Slater, Joanna Dyson, Chunxiang Ye, Robert Woodward-Massey, and Oliver Marsh

With an area of 2.5 million km2 and an average altitude of about 4000 m above sea level, the Tibetan Plateau is the largest and highest plateau in the mid-latitudes of the Northern Hemisphere. The high altitude, low latitude, and large snow coverage leads to strong solar radiation at the surface and, as such, a high production potential for OH. Given the large area of the Plateau, understanding the chemistry controlling OH concentrations in this region is important to accurately predict the global lifetime of the greenhouse gas, methane.

Here we present the first field observations on the Tibetan Plateau of the hydroxyl radical, OH, and also HO2 and RO2 radicals, as well as OH reactivity, made in April-May 2019 at the Nam Co research station, which is located at 4730 m above sea level. The atmospheric pressure at Nam Co is ~ 0.57 atm and these represent the highest altitude ground-based measurements of OH and other radical species. Concentrations of OH radicals were measured directly using laser-induced fluorescence (LIF) spectroscopy at 308 nm, whereas HO2 and RO2 concentrations were measured via their chemical conversion to OH, followed by LIF. OH reactivity was measured using laser-flash photolysis followed by time-resolved LIF.

Previous photostationary steady state (PSS) calculations of the OH concentrations in this region, which consider O3 photolysis and subsequent reaction of O(1D) with H2O as the primary source of OH, and CO and methane as the OH sinks, range from 3.7 to 11 x 106 cm-3 in January and from 1.4 to 3.0 x 107 cm-3 in July. (Lin et al., J. Geophys. Res., 113, D02309, doi:10.1029/2007JD008831, 2008) suggesting an extremely photo-active environment.

The average peak OH concentration was ~4 x 106 cm-3, which is at the lower end of the previously reported PSS predictions. The average peak HO2 and total organic RO2 concentrations observed were ~3 x 108 cm-3 (~20 pptv) and ~7 x 108 cm-3 (~ 50 ppt) respectively. On average, the measured OH reactivity was low, peaking before sunrise at ~2 s-1 and displaying only a weak diurnal profile. However, the OH reactivity is up to 4 times greater than that calculated assuming only methane and CO as OH sinks. A box model utilising the Master Chemical Mechanism and constrained with in situ measurements of radical sources and sinks at the Nam Co site was used to calculate radical concentrations and OH reactivity for comparison with field measurements, and to examine chemical budgets.

How to cite: Heard, D., Whalley, L., Slater, E., Dyson, J., Ye, C., Woodward-Massey, R., and Marsh, O.: Measurements and modelling of OH, HO2 and RO2 radicals and OH reactivity in the Tibetan Plateau, EGU General Assembly 2024, Vienna, Austria, 14–19 Apr 2024, EGU24-13295, https://doi.org/10.5194/egusphere-egu24-13295, 2024.

EGU24-14056 | ECS | Posters on site | AS3.33

N2O5 heterogeneous uptake on secondary organic aerosol: the effect of organic coating thickness, relative humidity and phase state 

Jiayin Li, Shuyang Xie, Hengyu Xu, and Keding Lu

The heterogeneous uptake reaction of dinitrogen pentoxide (N2O5) has a great effect on generation of soluble nitrate, nocturnal atmospheric chemistry and regulating NOx. Organic matter is one of the important components of atmospheric particles, and has been proved that can significantly affect the N2O5 heterogeneous uptake coefficients (γ(N2O5)). In this study, an aerosol flow tube system was used for γ(N2O5) measurements on ammonium sulphate aerosols ((NH4)2SO4, AS) and three kinds of core-shell structured secondary organic aerosols (SOA), and explored the effects of relative humidity (RH), phase state and organic coating thickness on γ(N2O5). Three kinds of SOA with core-shell structures were generated successfully by seed particle AS, organic gas (α-pinene, isoprene and toluene) and O3, and characterized by a scanning mobility particle sizer (SMPS) and TEM. The SOA yields, i.e., organic coating thicknesses, of the three organics were ranked, given the same organic gas concentration was α-pinene (17.1±2.2, 4.8 ppm) > isoprene (4.7±0.04, 4.8 ppm) > toluene (1.3±0.7, 4.8 ppm). The experimental results showed that the γ(N2O5) on AS were in the range of 0.002~0.017 (RH=1~50%), whereas that of SOA were between 3.7×10⁻⁵~2.6×10⁻³ (RH=30~50%), and the order of γ(N2O5) at the same RH was isoprene SOA> toluene SOA> α-pinene SOA. γ(N2O5) of the SOA was reduced by 1-3 orders of magnitude when compared with that of AS, which suggests that organic coating significantly inhibits the diffusion of N2O5 on the surface and in the bulk phase of particles. However, the γ(N2O5) of these three SOA were not completely correlated with the organic coating thickness. The organic coating thickness of two BVOCs showed a nonlinear negative correlation with γ(N2O5) (R2>0.9), while toluene SOA with the thinnest coating thickness greatly inhibited γ(N2O5) due to its greater influence on particle hygroscopicity. Therefore, due to the large number of organic species, it is not possible to generalize the degree of inhibition of γ(N2O5) only by coating thickness. It is necessary to further consider the influence of properties and structures of organics in the future, and widely applicable parameters for evaluating the effect of organic effect need to be proposed, so as to improve the accuracy of γ(N2O5) estimation.

How to cite: Li, J., Xie, S., Xu, H., and Lu, K.: N2O5 heterogeneous uptake on secondary organic aerosol: the effect of organic coating thickness, relative humidity and phase state, EGU General Assembly 2024, Vienna, Austria, 14–19 Apr 2024, EGU24-14056, https://doi.org/10.5194/egusphere-egu24-14056, 2024.

EGU24-14073 | Posters on site | AS3.33

Local radical chemistry driven ozone pollution in a megacity: A case study 

Guoxian Zhang, Jingyi Guo, Renzhi Hu, Chuan Lin, and Pinhua Xie

To investigate the effect of oxidation on the formation of secondary pollution in different environmental conditions, a comprehensive field campaign (STORM) was carried out from October to November 2018 at Peking University Shenzhen Graduate School (DXC, 22.60 °N, 113.97 °E) in Shenzhen, Guangdong Province. Precursor concentrations introduced typical urban characteristics on the modeled OH reactivity (kOH) levels with a broad range between 15.0 and 30.0 s-1. The daily maxima of the observed OH and HO2 radical concentrations were (2.3–12.8) × 106 cm-3 and (1.3–9.1) × 108 cm-3, respectively. In the polluted period, abundant photolysis sources (e.g., HONO, HCHO, and O3) intensified photochemistry. The OH radical concentration peaked 6.0 × 106 cm-3 at noon (11:00-13:00). The low kOH (12.0 s-1) in the clean atmosphere suggested that the reduction in termination efficiency prolonged the OH lifetime, so that the period maintained a sustained OH concentration comparable to the polluted period. In terms of meteorology, the dominating air mass was isolated from the east and northeast directions, which promoted the transition of ozone from mild pollution to severe pollution. The abundant precursor emissions at urban sites first compensated for the negative effect of declined solar radiation, and then they amplified radical propagation. Simultaneously amplified radical propagation promoted oxidation capacity, and increased the chain length (ChL) from 3.6 to 4.1, and P(O3) has lifted effectively by approximately 13.3 %. The stable wind direction and velocity reduced physical dilution losses and thus led to the rapid rise in Ox around 16:00. Further detailed investigations are required on the environmental causes of ozone pollution to address the influence of the oxidation processes on secondary pollution formation under other environmental conditions.

How to cite: Zhang, G., Guo, J., Hu, R., Lin, C., and Xie, P.: Local radical chemistry driven ozone pollution in a megacity: A case study, EGU General Assembly 2024, Vienna, Austria, 14–19 Apr 2024, EGU24-14073, https://doi.org/10.5194/egusphere-egu24-14073, 2024.

EGU24-14641 | ECS | Posters on site | AS3.33

Hydroxyl Radicals and Oxidation Capacity in the Tropical Troposphere: Measurements from CAFE Field Campaigns using HORUS 

Philip Holzbeck, Roland Rohloff, Sreedev Sreekumar, Carolina Monteiro, Anywhere Tsokankunku, Daniel Marno, Monica Martinez, Clara Nussbaumer, Dirk Dienhart, Nidhi Tripathi, Nijing Wang, Achim Edtbauer, Birger Bohn, Florian Obersteiner, Jonathan Williams, Horst Fischer, Joachim Curtius, Mira Pöhlker, Jos Lelieveld, and Hartwig Harder

In the tropics, intense solar radiation drives photochemistry and strong convection, transporting air from the boundary layer to the upper troposphere. Conditions in the tropics are characterized by high humidity and UV intensity enhancing hydroxyl (OH) radical production. In addition, OH radicals and ozone (O3) are formed through reactions of HOx (OH + HO2) with nitrogen oxides (NOx), the latter being produced by lightning in abundant convective systems. The convection also transports volatile organic compounds (VOCs), notably from emissions by the tropical rainforest. The VOCs are oxidized by radicals and O3, resulting in secondary species contributing to new particle formation. To understand and characterize the atmospheric chemistry in these conditions, the Chemistry of the Atmosphere Field Experiment (CAFE) Brazil was conducted from December 2022 to January 2023 with the High Altitude and Long Range Research Aircraft (HALO) in the Amazon region.

In this study, we present preliminary results measured with the Hydroxyl Radical measurement Unit based on fluorescence Spectroscopy (HORUS), focusing on vertical HOx profiles measured during different times of the day over both the continent and the ocean, including the outflow of both electrified and non-electrified convective systems. In contrast to the conditions over the continents where lightning-generated NOx aids in the efficient recycling of radicals, over the ocean, the limited availability of NO hinders recycling and results in radical termination. The conditions over the continent are compared to those measured over the Atlantic Ocean during the CAFE Africa expedition in summer 2018 based in the Cape-Verde islands. This unique dataset provides valuable insights into the atmospheric chemistry and oxidation capacity in these tropical regions.

How to cite: Holzbeck, P., Rohloff, R., Sreekumar, S., Monteiro, C., Tsokankunku, A., Marno, D., Martinez, M., Nussbaumer, C., Dienhart, D., Tripathi, N., Wang, N., Edtbauer, A., Bohn, B., Obersteiner, F., Williams, J., Fischer, H., Curtius, J., Pöhlker, M., Lelieveld, J., and Harder, H.: Hydroxyl Radicals and Oxidation Capacity in the Tropical Troposphere: Measurements from CAFE Field Campaigns using HORUS, EGU General Assembly 2024, Vienna, Austria, 14–19 Apr 2024, EGU24-14641, https://doi.org/10.5194/egusphere-egu24-14641, 2024.

EGU24-14758 | ECS | Orals | AS3.33

Recent progress on the role of chlorine radical in urban atmosphere 

Yee Jun Tham, Chao Yan, and Shichun Zou

Atmospheric chlorine radical plays essential roles in tropospheric photochemical processes, such as affecting the oxidation capacity and aerosol formation. Tropospheric chlorine chemistry was initially known to be important in the marine and polar atmosphere; nevertheless, more and more recent studies have indicated that chlorine chemistry was also active in inland areas. Here, we will present the vital chlorine radical precursors, such as nitryl chloride (ClNO2), molecular chlorine (Cl2), hydrochloric acid (HCl) and others that were observed in the urban atmosphere of China, as well as the recent understanding on the influence from anthropogenic chlorine sources. Our recent findings have shown the increasing importance of nocturnal chlorine activation processes in producing ClNO2 and Cl2, which ultimately contributing to the haze formation caused by NOx reduction. Another finding also showed that there is a potential atmospheric chlorine sink process in environment with low temperature and significant bromine chemistry. We will finally discuss the future challenges in the understanding of reactive chlorine chemistry in urban cities under the changing world.

How to cite: Tham, Y. J., Yan, C., and Zou, S.: Recent progress on the role of chlorine radical in urban atmosphere, EGU General Assembly 2024, Vienna, Austria, 14–19 Apr 2024, EGU24-14758, https://doi.org/10.5194/egusphere-egu24-14758, 2024.

Peroxyacetyl (PA) radicals are one of the critical intermediates in the atmospheric oxidation and combustion of VOCs, dominating the secondary formation of peroxyacetyl nitrate (PAN) and also promoting ozone (O3) formation. This study simulated the formation pathways of PA radicals from their precursors and evaluated their contributions to PAN and O3 formation in urban, rural, and mountainous background areas in southern China with the application of an observation-based photochemical box model with master chemical mechanism (PBM-MCM).

It was found that PA formation at the mountainous background site was dependent on both volatile organic compounds (VOCs) and NOx precursors (transition regime). In contrast to dominated acetaldehyde oxidation in previous urban and rural research, PA formation at the mountainous background site was primarily formed by methylglyoxal (38%), acetaldehyde (28%), other radicals (20%), and other oxygenated VOCs (13%).

Methylglyoxal oxidation was the major contributor to PA formation in urban and rural areas in southern China due to the relatively high levels of isoprene and aromatics in this region. Except for biogenic sources, xylene isomers and C4-C5 alkenes, largely from vehicle exhaust and solvent usage, were identified as the predominant contributors to PA formation in this region.

At last, PAN was net formed through the reaction of PA and NO2 in most urban, rural, and mountainous background areas in southern China, while it was thermal decomposed in coastal urban areas in the cold season due to the high level of PAN from regional transport, which released NO2 and PA radicals and promoted the local O3 formation. Overall, this study deepens our understanding of PA radical chemistry and provides valuable insights into secondary PAN and O3 formation control in contrasting environments.

How to cite: Wang, Y.: Modelling of peroxyacetyl (PA) radicals in contrasting environments: precursors, reaction pathways and their contributions to peroxyacetyl nitrate (PAN) and ozone (O3) formation, EGU General Assembly 2024, Vienna, Austria, 14–19 Apr 2024, EGU24-15572, https://doi.org/10.5194/egusphere-egu24-15572, 2024.

EGU24-15664 | ECS | Posters on site | AS3.33

Surface exchange flux measurement of HONO and NOx in agricultural fields of the Huaihe River Basin, China 

Baobin Han, Min Qin, Fanhao Meng, Wu Fang, Jianye Xie, Dou Shao, Zhitang Liao, and Pinhua Xie

Correspondence: Min Qin (mqin@aiofm.ac.cn)

Nitrous acid (HONO) and nitrogen oxides (NOx) play a crucial role in tropospheric photochemistry by contributing to the hydroxyl radical (OH) and influencing atmospheric oxidization capacity. Recent research has found that soil HONO emissions are considered to be the main source of atmospheric HONO. Here, an aerodynamic gradient (AG) method combined with a BroadBand Cavity Enhanced Absorption Spectrometer (BBCEAS) system was developed to measure HONO and NOx emission flux from agricultural fields in the Huaihe River Basin. Measurements were taken at two different heights and included various agricultural management activities such as rotary tillage, flood irrigation, fertilization, transplanting rice seedlings, and top-dressing. For HONO and NO, upward fluxes were observed (0.07 ± 0.22 and 0.19 ± 0.53 nmol /(ms)), while NO2 was deposited to the ground (-0.37 ± 0.47 nmol /(ms)). The maximum emission fluxes of HONO and NO occurred at around 24°C, which is close to the optimal temperature (25°C) for soil microbial nitrification processes. This indicates that surface microbial processes may contribute to gas emissions. Specifically, during rotary tillage, continuous peaks in HONO flux and NO flux were observed. POH(HONO)net and POH(O3)net were 1.42 ppb/h and 1.35 ppb/h, respectively, with HONO and O3 photolysis accounted for 51% and 49% of the total yield. The peak of POH(HONO)net coincides with the peak of HONO emissions from agricultural fields, revealing the significant contribution of agricultural HONO emissions to atmospheric oxidizing capacity. After irrigation in agricultural fields, the increase in soil moisture content (~80% water filled pore space) restricts oxygen availability, thereby suppressing the HONO emission. Overall, this study provides valuable insights into the dynamics of soil HONO and NOx emissions in agricultural fields, shedding light on their environmental implications and the role of agricultural activities in atmospheric chemistry.

Acknowledgments: This work was supported by the National Natural Science Foundation of China (U21A2028) and the National key Reearch and Development Program of China (2022YFC3701100).


How to cite: Han, B., Qin, M., Meng, F., Fang, W., Xie, J., Shao, D., Liao, Z., and Xie, P.: Surface exchange flux measurement of HONO and NOx in agricultural fields of the Huaihe River Basin, China, EGU General Assembly 2024, Vienna, Austria, 14–19 Apr 2024, EGU24-15664, https://doi.org/10.5194/egusphere-egu24-15664, 2024.

EGU24-16059 | ECS | Posters on site | AS3.33

DMS oxidation experiments in the SAPHIR* simulation chamber: Constraining chemical kinetics of the HPMTF channel 

Sascha Alber, Wilhelm Steffes, Fred Stroh, Hui Wang, Rongrong Wu, Annika Zanders, and Sören R. Zorn

The oxidation pathways of dimethyl sulfide (DMS), the largest natural source of sulfur in theatmosphere (Bates et al., 1992), and its impact on Earth’s radiative balance are not fully understood yet. One of the major open questions in the DMS oxidation scheme is the chemical kinetics of hydroperoxymethyl thioformate (HPMTF) formation and breakdown, which also leads to substantial HPMTF abundances in the global atmosphere as detetcted by Veres et al. in 2020 by means of aircraft observations. HPMTF is formed from methylthiomethyl peroxy radical (MTMP), one of the major oxidation products of DMS, and was first suggested by Wu et al. (2015) based on ab initio calculations. Meanwhile, several atmospheric simulation chamber studies have taken place to better understand DMS oxidation (e.g., Jernigan et al. (2022), Ye et al. (2022), Shen et al. (2022) and, von Hobe et al. (2023)).

In autumn 2023 a DMS oxidation campaign took place at the SAPHIR* chamber at the Forschungszentrum Jülich to address these issues. SAPHIR* (SAPHIR-STAR; Simulation of Atmospheric PHotochemistry In a large Reaction Chamber – STirred Atmospheric tank Reactor) is a continuously stirred tank reactor made of glass with a total volume of 2000 l. All experiments in SAPHIR* are carried out under steady state conditions. The chamber is inside a thermostat, features two independent UV light systems at 254nm (UV-C) and 365nm (UV-A), a state of the art control and gas supply system. Measurements are performed under extremely controlled conditions regarding temperature, relative humidity (RH), flows and composition/constituents. SAPHIR* features a set of standard measurements (O3, NO/NOx, CO, CO2, CH4). During the campaign three Chemical Ionisation Mass Spectrometers (CIMS) were used during the campaign: a CIMS-API-LTOF with a nitrate and bromide ion source, which was also used for frequent voltage scanning during the steady states, a CIMS-HTOF with iodide ion source and, FunMass-C, a rebuilt aircraft CTOF instrument employing CF3O- ion chemistry. Every of the four reagent ions is capable to detect HPMTF. Moreover, a proton-transfer-reaction mass spectrometer (PTR-MS) and a gas chromatography mass spectrometer (GC-MS) measured DMS. For FunMass-C, this was the first time measuring under non-laboratory conditions over weeks.

As precursor of OH, H2O2 photolysis was used. This allowed for HPMTF production even at mostly dry conditions (RH < 1%) as well as the investigation of the influence of additional water vapour (RH = 20, 40 and 60 %) under atmospherically relevant OH levels (~1*107 molecules*cm-3). In addition, the dependence of several NO levels (5, 10, 20 and 30 ppbv NO) on HPMTF formation under dry conditions was investigated. Lastly, the HPMTF formation caused by nitrate radicals in the dark (100 ppb O3 and 25 ppb NO) was investigated, as well as the influence of water vapour on this reaction pathway (RH = 20 %). For all experiments the initial DMS mixing ratio in the chamber was 10 or 20 ppb. The presentation gives an overview of these experiments and discusses preliminary results.

How to cite: Alber, S., Steffes, W., Stroh, F., Wang, H., Wu, R., Zanders, A., and Zorn, S. R.: DMS oxidation experiments in the SAPHIR* simulation chamber: Constraining chemical kinetics of the HPMTF channel, EGU General Assembly 2024, Vienna, Austria, 14–19 Apr 2024, EGU24-16059, https://doi.org/10.5194/egusphere-egu24-16059, 2024.

Accurate knowledge of the rate coefficient of the reaction of volatile organic compounds (VOCs) with the hydroxyl radical (OH) is fundamental for understanding atmospheric chemical processes and for predictions of air quality forecasting models. Nevertheless, the temperature dependence of reaction rates of many organic compounds is not well investigated as measurements are challenging.

In this work, we present absolute measurements of reactions rates with the OH radical for a series of VOCs for different temperatures. An OH reactivity instrument previously used for field and chamber measurements was further developed to enable these accurate measurements of reaction rates. The OH reactivity (kOH) is the inverse lifetime of the OH radical expressed by the product of the OH reactant concentrations and its reaction coefficient with OH. In this instrument, OH reactivity is measured by the direct observation of the decay rate of OH that is produced in a flow tube by ozone laser flash photolysis at 266 nm. The decay of OH radicals is measured at a high time resolution of 1 ms. If a known concentration of an organic compound is added to the bath gas (humidified synthetic air) the decay time directly gives the rate coefficient. As the air temperature can be controlled, the Arrhenius expression of the rate coefficient can be determined.

VOC mixtures in synthetic air were prepared in canisters. The concentration was determined by the total organic carbon method, in which all carbon atoms are combusted to CO2 on heated catalysts and the CO2 concentration is measured by a commercial cavity ring-down instrument.

The method was validated with several alkanes for which reaction rates are well-known. Excellent agreement within a few percent with recommendations by IUPAC and NASA-JPL demonstrates the high accuracy of the new method. The Arrhenius expression of OH reaction rates was determined for several monoterpenes and aromatic hydrocarbons.


How to cite: Novelli, A., Berg, F., Dubus, R., Wahner, A., and Fuchs, H.: Determination of temperature dependent rate coefficients of the reaction of hydroxyl radicals with volatile organic compounds using a new OH reactivity instrument , EGU General Assembly 2024, Vienna, Austria, 14–19 Apr 2024, EGU24-16085, https://doi.org/10.5194/egusphere-egu24-16085, 2024.

EGU24-16360 | ECS | Orals | AS3.33

Investigation of the ozone formation of anthropogenic VOCs in the atmospheric simulation chamber SAPHIR 

Michelle Färber, Hendrik Fuchs, Birger Bohn, Philip M.T. Carlsson, Georgios Gkatzelis, Andrea Carolina Marcillo Lara, Franz Rohrer, Sergej Wedel, Andreas Wahner, and Anna Novelli

The hydroxyl radical (OH) is the most important daytime oxidant in the troposphere, initiating chemical degradation of volatile organic compounds (VOCs) and hence contributing to the formation of secondary pollutants such as ozone (O3). In the oxidation process of VOCs, peroxy radicals (RO2) and hydroperoxy radicals (HO2) are formed. In polluted areas, characterised by the presence of nitric oxide (NO), the OH radical is regenerated by the reaction of HO2 with NO, enhancing atmospheric oxidation. Ozone is mainly produced from the photolysis of nitrogen dioxide (NO2) which is formed in the reaction of HO2 and RO2 with NO, where the latter reaction also leads to the formation of an alkoxy radical (RO). Depending on the fate of the RO radical, additional O3 may be produced.

Large discrepancies between measured and modelled HO2 and RO2 radical concentrations have been observed during daytime for several urban environments, both for low (< 1ppbv) and high (> 3ppbv) NO. As measured and modelled radical concentrations are commonly used to determine the instantaneous ozone production rate (P(Ox)), a large model-measurement discrepancy was also found for P(Ox) at high NO.

A systematic study of the photo-oxidation of different anthropogenic VOCs (propane, propene, iso-pentane, n-hexane, trans-2-hexene), associated with traffic emissions and involving different alkoxy chemistry, was conducted at the atmospheric simulation chamber SAPHIR at Forschungszentrum Jülich, Germany, for NO mixing ratios below 1ppbv and between 3 and 5ppbv.

Measured radicals as well as precursors and oxidation products are compared with results from a zero-dimensional box model using the Master Chemical Mechanism (MCM v3.3.1) which is complemented by structure-activity relationships (SAR). When including SAR, an improved model-measurement agreement of HO2 and RO2 radical concentrations was specifically found for n-hexane and trans-2-hexene. In addition, the Ox (= NO2 + O3) formation per oxidised VOC (P(Ox)VOC) could be derived from modelled radical concentrations and measured Ox concentrations. Overall, a good agreement between the different P(Ox)VOC was found.

How to cite: Färber, M., Fuchs, H., Bohn, B., Carlsson, P. M. T., Gkatzelis, G., Marcillo Lara, A. C., Rohrer, F., Wedel, S., Wahner, A., and Novelli, A.: Investigation of the ozone formation of anthropogenic VOCs in the atmospheric simulation chamber SAPHIR, EGU General Assembly 2024, Vienna, Austria, 14–19 Apr 2024, EGU24-16360, https://doi.org/10.5194/egusphere-egu24-16360, 2024.

EGU24-18998 | Posters on site | AS3.33

Analysis of biomass burning derived aerosol under different combustion and oxidation regimes at the EUPHORE chambers 

Rubén Soler, Mila Ródenas, Teresa Vera, Esther Borrás, Tatiana Gómez, Marco Chen, Martin Rigler, Asta Gregorič, Bálint Alföldy, Eduardo Yubero, Javier Crespo, and Amalia Muñoz

Biomass burning (BB), including wildfires, agricultural burning and domestic heating results in the emission of complex mixture of particle and gas phase species, among which volatile organic compounds and organic aerosols (primary organic aerosol – POA) are prevailing, in the atmosphere. These emissions and their chemical aging products, including both gas-phase pollutants and secondary organic aerosols (SOA), under different atmospheric and combustion conditions, remain poorly understood and have significant but still uncertain impacts on air quality, human health and climate.

The experimental campaign in the EUPHORE outdoor photoreactors focused on studying the gas and particle phase emissions and aging processes from the combustion of different types of wood (orange tree, vineyard and beech), as well as a diesel engine car exhaust, under diurnal and nocturnal operating regimes. It consisted of an ambitious campaign that involved a wide range of analytical instrumentation, highlighting state-of-the-art mass spectrometers (PTR-ToF-MS and API-ToF-CIMS coupled to a Figaero inlet) for both gas and particle phase analysis and a newly released 9λ Aethalometer model AE36s (Aerosol Magee Scientific) for improved characterization of aerosol optical properties. This work focuses on the analysis of the particulate phase emissions and their aged SOA products using the instrument API-ToF-Iodide-CIMS+Figaero inlet.

From the analysis of the chemical composition of the particulate phase in this extensive set of experiments, significant information, similarities and differences are derived, both between different types of wood fuels and between distinct combustion regimes (smoldering vs. flaming) and aging conditions (daytime vs. night-time). In the mass spectra (MS) analysis, a general emission of higher POA m/Q compounds is observed in the smoldering combustion compared to the flaming one. After several hours of aging, evolution and differentiation from the initial fume mass spectra is observed, with a gradual transition to MS with a more significant presence of higher molecular weight compounds. Diverse compound types have been identified, including phenolic, furanic, organonitrate products, non-oxygenated and oxygenated PAHs and other BB tracers, such as levoglucosan.

Combined dark and light aging experiments reveal changing trends in the formation and evolution of numerous compounds due to light conditions shift. Aerosol night-time aging periods lead to the formation and accumulation of organonitrate BB derived products, such as nitroanisole, nitroguaiacol and nitrocatechol, leading to its degradation after the chamber opening and the exposure to natural light. This is an ongoing work currently under investigation with great potential to provide with new valuable information that can enhance our understanding of the complex aging pathways of biomass-burning pollutants and to improve model results.

This work is part of a project supported by the European Commission under the Horizon 2020 – Research and Innovation Framework Programme through the ATMO-ACCESS Integrating Activity (grant agreement N. 101008004) and by the R+D project ATMOBE (PID2022-142366OB-I00), funded by MCIN/AEI/10.13039/501100011033/, the "ERDF A way of making Europe”, the Valencian Regional Government (GVA) and the EVER project CIPROM/20200/37.

How to cite: Soler, R., Ródenas, M., Vera, T., Borrás, E., Gómez, T., Chen, M., Rigler, M., Gregorič, A., Alföldy, B., Yubero, E., Crespo, J., and Muñoz, A.: Analysis of biomass burning derived aerosol under different combustion and oxidation regimes at the EUPHORE chambers, EGU General Assembly 2024, Vienna, Austria, 14–19 Apr 2024, EGU24-18998, https://doi.org/10.5194/egusphere-egu24-18998, 2024.

EGU24-19488 | ECS | Posters on site | AS3.33

Rise and fall of lead (Pb) pollution in East Asia:  lessons learnt from a 60-yr long modern coral 

Ke Lin, Mengli Chen, Yue-Gau Chen, and Xianfeng Wang

Despite the global phase-out of leaded gasoline, lead (Pb) pollution remains a persistent and serious issue, particularly in developing nations. To portray the temporal dynamics of Pb emissions and their responses to evolving policy interventions in Asia, we reconstructed a 60-year record of Pb concentration (Pb/Ca) and isotopic composition (i.e., 206Pb/207Pb and 208Pb/206Pb) in a coral from Dongsha Atoll, the South China Sea. Our study reveals a fourfold increase in coral Pb/Ca levels from 1953 to mid-2000s, followed by a ~ 60% decline in the subsequent decade. In the early era from 1953 to 1960, Pb isotopic compositions in the Dongsha coral align closely with the values in natural marine sediments. When anthropogenic Pb sources became to prevail, we observe an increase in Pb/Ca values and altered isotopic compositions, attributable mostly to automotive Pb emissions but also with significant contribution from industrial Pb emissions especially after 1990s. With Pb isotopic analysis on the coral, we identify that, after 1990s, the Chinese Pb was the primary endmember that impacts the regional Pb. The influence of Chinese Pb is also registered in other East and Southeast Asian coral records, probably also in those from the Indian Ocean. The increasing trend of Pb in these records underscores the necessity to reduce Pb emissions in the post-leaded gasoline era, particularly in developing countries in the region. On the other hand, the decline in Pb/Ca in our record after the mid-2000s provides encouraging evidence of the positive impact of environmental policies in safeguarding the environment and public health.


How to cite: Lin, K., Chen, M., Chen, Y.-G., and Wang, X.: Rise and fall of lead (Pb) pollution in East Asia:  lessons learnt from a 60-yr long modern coral, EGU General Assembly 2024, Vienna, Austria, 14–19 Apr 2024, EGU24-19488, https://doi.org/10.5194/egusphere-egu24-19488, 2024.

EGU24-20384 | Orals | AS3.33 | Highlight

Significant changes in the light absorption ability of BC-containing particles between the cold seasons of 2016 and 2022 in Beijing 

Min Hu, Shuya Hu, Linghan Zeng, Gang Zhao, Shiyi Chen, and Weilun Zhao

Black carbon (BC), the most important absorbing component in ambient aerosols, profoundly influences the Earth's radiation system and climate change. Previous studies have demonstrated a decline in the mass concentrations of BC and BC-containing particles in Beijing over the past decade, primarily attributed to stringent emission control measures. In this study, we found a substantial decrease in the mass absorption cross-section (MAC) of BC-containing particles during the cold seasons in Beijing, declining from 9.27 to 7.34 m²/g over a span of seven years. Three reasons lead to the reduction of MAC. Firstly, we observed that the average mass equivalent diameter of the BC cores in 2022 was larger (239 nm) compared to that in 2016 (195 nm). Secondly, the corresponding coating thickness of the BC-containing particles decreased from 1.5 to 1.3. Lastly, significant changes were noted in the chemical compositions of BC-containing particles, with more nitrate and less organic matter (OM) in the coating materials, which led to a diminished absorption ability of BC-containing particles. Our research sheds light on the crucial role of microphysical-chemical properties in determining the absorption ability of BC-containing particles. The results indicate that it is imperative to resolve the MAC of BC in the climate system for better estimating BC’s climate effects. Besides, characterizing the current pollution levels, properties, and impacts of BC-containing particles may help reassess the importance of BC-containing particles in the ambient atmosphere and clarify future research priorities and mitigation measures.

How to cite: Hu, M., Hu, S., Zeng, L., Zhao, G., Chen, S., and Zhao, W.: Significant changes in the light absorption ability of BC-containing particles between the cold seasons of 2016 and 2022 in Beijing, EGU General Assembly 2024, Vienna, Austria, 14–19 Apr 2024, EGU24-20384, https://doi.org/10.5194/egusphere-egu24-20384, 2024.

EGU24-20410 | ECS | Orals | AS3.33

Formation and photochemical aging of secondary organic aerosols from NO3 oxidation of phenolic compounds 

Hongru Shen, Rongrong Wu, Quanfu He, Hui Wang, Yarê Baker, Sören Zorn, Hendrik Fuchs, Thomas Mentel, and Defeng Zhao

Phenolic compounds containing at least one hydroxyl functional group on the aromatic ring constitute a significant fraction of volatile organic compounds precursors in urban cities, representing a wide range of environmental, climate, and health effects. Daytime OH oxidation and nighttime NO3 oxidation reactions are their main loss pathways. However, compared to OH oxidation, although NO3 reactions demonstrate higher chemical reactivities and potentially higher SOA yields, less is known about SOA formation from NO3 oxidation of phenolic compounds and their roles in next daytime OH oxidation aging. Here, we conducted NO3 oxidation experiments of phenol and o-cresol in SAPHIR-STAR (Simulation of Atmospheric PHotochemistry In a large Reaction Chamber-Stirred Atmospheric flow Reactor) and photochemical aging experiments in SAPHIR (Simulation of Atmospheric PHotochemistry In a large Reaction Chamber). In both chamber experiments, an online EESI-ToF-MS (Extractive ElectroSpray Ionization Time-of-Flight Mass Spectrometer) was used for direct measurement of SOA composition on near-molecular level. Combining gas measurement using NO3- CI-ToF-MS (Chemical Ionization Time-of-Flight Mass Spectrometer), we showed a full picture of gas-phase products formation, their partitioning to particle phase, and photochemical aging of particle phase products. In contrast to OH oxidation reactions, highly oxygenated organic molecules (O≥6) contribute a small fraction of both gas (<1%) and of particle (<10%) phase products. The main particle-phase products (monomers and accretion products) show different time series during OH oxidation aging process. Overall, our experiments help understand SOA formation and photochemical aging from NO3 oxidation of phenolic compounds and provide fundamental data support for accurate assessment of their roles in urban air quality, climate, and health effects.

How to cite: Shen, H., Wu, R., He, Q., Wang, H., Baker, Y., Zorn, S., Fuchs, H., Mentel, T., and Zhao, D.: Formation and photochemical aging of secondary organic aerosols from NO3 oxidation of phenolic compounds, EGU General Assembly 2024, Vienna, Austria, 14–19 Apr 2024, EGU24-20410, https://doi.org/10.5194/egusphere-egu24-20410, 2024.

EGU24-21794 | ECS | Orals | AS3.33

Aerosol particle effects on the atmospheric budgets of H2O2 and HOx radicals: studies utilizing a newly-developed multiphase model 

Huan Song, Keding Lu, Huabin Dong, Zhaofeng Tan, Zhongmin Chen, Limin Zeng, and Yuanhang Zhang

Hydrogen peroxide (H2O2), hydroxyl radicals (OH), hydroperoxyl (HO2), and superoxide (O2-) radicals interacting with aerosol particles significantly affect the atmospheric pollutant budgets. A multiphase chemical kinetic box model (PKU-MARK), including the multiphase processes of transition metal ions (TMI) and their organic complexes (TMI-OrC), was built to numerically drive H2O2 chemical behaviors in the aerosol particle liquid phase using observational data obtained from a field campaign in rural China. Instead of relying on fixed uptake coefficient values, a thorough simulation of multiphase H2O2 chemistry was performed. In the aerosol liquid phase, light-driven TMI-OrC reactions promote OH, HO2/O2-, and H22 recycling and spontaneous regenerations. The in-situ generated aerosol H2O2 would offset gas-phase H2O2 molecular transfer into the aerosol bulk phase and promote the gas-phase level. When combined with the multiphase loss and in-situ aerosol generation involving the TMI-OrC mechanism, the HULIS-Mode significantly improves the consistency between modeled and measured gas-phase H2O2 levels. The aerosol liquid phase could be a pivotal potential source of aqueous H22 and influence the multiphase budgets. Our work highlights the intricate and significant effects of aerosol TMI and TMI-OrC interactions on the multiphase partitioning of H2O2 when assessing atmospheric oxidant capacity.

How to cite: Song, H., Lu, K., Dong, H., Tan, Z., Chen, Z., Zeng, L., and Zhang, Y.: Aerosol particle effects on the atmospheric budgets of H2O2 and HOx radicals: studies utilizing a newly-developed multiphase model, EGU General Assembly 2024, Vienna, Austria, 14–19 Apr 2024, EGU24-21794, https://doi.org/10.5194/egusphere-egu24-21794, 2024.

EGU24-548 | ECS | Posters on site | BG2.2

Isotope analysis of snowpack nitrate in coastal Antarctica; evidence of nitrate photolysis and preservation. 

Amelia Bond, Markus M. Frey, Jan Kaiser, Alina Marca, and Freya Squires

Photolysis of snowpack nitrate results in emission of the reactive nitrogen species NOx and HONO. These are important pre-cursors of HOx radicals and ozone, and thereby affect the oxidising capacity of the lower atmosphere above remote snow-covered areas. This is of particular importance in the polar regions as the usual OH radical formation pathway (ozone photolysis and reaction of O(1D) with H2O) is limited by the low water vapour concentration. Isotope analysis of atmospheric reactive nitrogen species and snow nitrate is proving to be a crucial tool for elucidating mechanisms of reactive nitrogen cycling in and above snow.

The first snowpit profiles of nitrate stable isotopes (δ15N, δ18O) and concentration at Halley VI Research Station in coastal Antarctica will be presented. The observed isotope fractionation provides evidence of photochemical loss of nitrate and allows estimation of the photolytic isotope fractionation constant at the site. At this high accumulation site, the peak in nitrate concentration from the previous summer is preserved below the snow surface, unlike at low accumulation sites on the Antarctic Plateau. Combining measurements of nitrate concentration and its isotopic compositions preserved in snow helps disentangle the isotope signature of seasonal changes in atmospheric nitrate sources from post-depositional isotope fractionation occurring even at high snow accumulation sites.

How to cite: Bond, A., Frey, M. M., Kaiser, J., Marca, A., and Squires, F.: Isotope analysis of snowpack nitrate in coastal Antarctica; evidence of nitrate photolysis and preservation., EGU General Assembly 2024, Vienna, Austria, 14–19 Apr 2024, EGU24-548, https://doi.org/10.5194/egusphere-egu24-548, 2024.

EGU24-1257 | ECS | Orals | BG2.2

On the contribution of boreal wetlands to the Northern Hemisphere carbonyl sulfide sink 

Anna de Vries, Georg Wohlfahrt, Timo Vesala, and Kukka-Maaria Kohonen

Previous studies inferred a missing sink of carbonyl sulfide (COS) in high Northern latitudes. Boreal COS budgets, however, typically account solely for the contribution by forests and ignore any uptake that widespread wetland ecosystems may contribute. Here we present the first direct measurements of the ecosystem-atmosphere COS exchange of a boreal wetland and compare this with a needleleaf forest ecosystems. We then use these data to up-scale to the boreal region.

We found that the investigated wetland was a stable sink for COS during the vegetation period, taking up on average of 10 pmol m−2s−1COS. While this was just 64% of the forest COS uptake, upscaling to the boreal region using the ORCHIDEE land surface model revealed that the Northern wetland sink, c. 20 GgS/y, was on the same order of magnitude compared to the forest COS sink. Our results thus indicate that northern COS should not neglect contributions by wetland ecosystems.

How to cite: de Vries, A., Wohlfahrt, G., Vesala, T., and Kohonen, K.-M.: On the contribution of boreal wetlands to the Northern Hemisphere carbonyl sulfide sink, EGU General Assembly 2024, Vienna, Austria, 14–19 Apr 2024, EGU24-1257, https://doi.org/10.5194/egusphere-egu24-1257, 2024.

EGU24-2219 | Orals | BG2.2

Leaf carbon monoxide emission under field conditions: a potential stress indicator? 

Dan Yakir, Jonathan Muller, Rafael Stern, Rafat Qubaja, and Yasmin Bohak

Carbon monoxide (CO) is produced in living plants and can act as a stress-signaling molecule in both animals and plants. While CO emissions from soil, litter decomposition, and incomplete combustion have been extensively studied, there is a scarcity of research on CO flux from living vegetation, particularly under field conditions. We present the results of continuous CO fluxes measurements (together with those of water, CO2, and COS) using twig chambers in summer-droughted and in non-droughted (irrigated) Pinus halepensis trees across the seasonal cycle. We found significant CO emissions from leaves, which were correlated with environmental parameters (radiation, leaf temperature, and VPD). It peaked under the stressful summer conditions at the study site, when CO2 exchange and leaf conductance were at a minimum.  The CO fluxes were strongly correlated to twig transpiration and were enhanced under irrigated treatment. It is speculated that leaf CO emission is related to biotic reactions, such as heme degradation, which is enhanced under stress conditions and is possibly associated with photorespiration. Our results provide a rare, high-resolution, annual scale study of the environmental factors controlling leaf CO emissions under field conditions and indicate that including it in plant gas exchange studies may provide additional means to interpret their response to stress.

How to cite: Yakir, D., Muller, J., Stern, R., Qubaja, R., and Bohak, Y.: Leaf carbon monoxide emission under field conditions: a potential stress indicator?, EGU General Assembly 2024, Vienna, Austria, 14–19 Apr 2024, EGU24-2219, https://doi.org/10.5194/egusphere-egu24-2219, 2024.

EGU24-3338 | ECS | Posters on site | BG2.2

Mass-Independent Fractionation Reveals the Sources and Transport of Atmospheric Particulate Bound Mercury 

Xuechao Qin, Xinyuan Dong, Congqiang Liu, Rongfei Wei, Zhenghua Tao, Hua Zhang, and Qingjun Guo

Mercury (Hg) is highly toxic and the only heavy metal that can exist in the atmosphere in gaseous form. When atmospheric Hg mixes with aerosols, it forms particulate-bound mercury (PBM). PBM can be transported and settle down quickly across regions, posing serious threats to ecosystems globally. Despite these concerns, tracking the sources and transport of atmospheric Hg remains challenging due to its global dispersal nature. However, the three-dimensional fractionation of Hg isotopes provides a feasible approach for addressing this issue. In this study, PBM2.5 and PBMTSPsamples were collected simultaneously in rural, suburban, urban, industrial, and coastal areas of the Beijing-Tianjin-Hebei (BTH) region, which is influenced by severe atmospheric pollution and the East Asian monsoon. Due to the significant influence of anthropogenic sources, the concentrations of PBM2.5 and PBMTSP were highest in the industrial and coastal areas, followed by the urban, suburban, and rural areas. The δ202Hg values of PBM2.5 and PBMTSP at the five sites were negative, overlapping with the values of most anthropogenic sources. However, most PBM2.5 and PBMTSP samples showed significantly positive Δ199Hg, significantly higher than the values of emission sources,especially for PBM2.5. The mass-independent fractionation (MIF) of Hg and sulfur isotopes showed that strong photochemical reduction happened during long-distance transport, making Δ199Hg have a positive shift. The positive changes in Δ200Hg may be due to ozone-mediated oxidation during the transport process, as shown by the interesting relationships between O3, Δ199Hg, and Δ200Hg in PBM2.5. Additionally, the analysis of backward trajectories unveiled the influence of air masses originating northwest of the BTH region through high-altitude transport. The cross-border transport of PBM, influenced by westerly and northwesterly air masses from Central Asia and Russia, markedly impacted  PBM pollution in the BTH region. Furthermore, these air masses, upon reaching the BTH area, would transport heightened PBM concentrations to the ocean through the winter monsoon. Conversely, during the summer, southeastward air masses transported from the ocean by the summer monsoon acted to mitigate the inland PBM pollution. The study results show that significant positive odd-MIF of PBM can occur in places with intensive anthropogenic emissions rather than being limited to remote areas. It implies that the odd-MIF resulting from atmospheric transport has likely been significantly undervalued. Our research offers valuable perspectives on the transport, transformation, and circulation of Hg in the environment.

How to cite: Qin, X., Dong, X., Liu, C., Wei, R., Tao, Z., Zhang, H., and Guo, Q.: Mass-Independent Fractionation Reveals the Sources and Transport of Atmospheric Particulate Bound Mercury, EGU General Assembly 2024, Vienna, Austria, 14–19 Apr 2024, EGU24-3338, https://doi.org/10.5194/egusphere-egu24-3338, 2024.

EGU24-4515 | Posters on site | BG2.2

Sulfate formation in haze pollution using multiple sulfur isotopes 

Qingjun Guo, Xiaokun Han, Xinyuan Dong, Xuechao Qin, and Rongfei Wei

Air pollution has become a serious problem in some parts of the world. The mechanism of sulfate formation during haze events is still not clear. This research looks at the different sulfur isotope compositions of sulfate in PM2.5 (from 2015 to 2016) in Beijing and in seasonal samples of PM2.5, PM1.0, and TSP from rural, suburban, urban, industrial, and coastal areas of North China (in 2017). The goal is to figure out the mechanism by which SO2 oxidizes at different levels of air pollution. An obvious seasonal variation (with positive values in spring, summer, and autumn and negative values in winter) is shown by the Δ33S values of sulfate in aerosols, except for those samples collected in rural areas. The Δ33S value (S-MIF) of sulfate in PM2.5 shows a pronounced seasonality, with positive values in spring, summer, and autumn and negative values in winter. The negative Δ33S changes that happen during winter haze events are mostly caused by SO2 being oxidized by H2O2 and transition metal ion catalysis (TMI) in the troposphere, which is most likely caused by coal burning. The positive Δ33S results observed on clean days are mainly attributed to tropospheric SO2 oxidation and stratospheric SO2 photolysis. These results provide important information on sulfate formation during haze events and clean days.

How to cite: Guo, Q., Han, X., Dong, X., Qin, X., and Wei, R.: Sulfate formation in haze pollution using multiple sulfur isotopes, EGU General Assembly 2024, Vienna, Austria, 14–19 Apr 2024, EGU24-4515, https://doi.org/10.5194/egusphere-egu24-4515, 2024.

EGU24-5556 | Posters on site | BG2.2

Spatial Isotopic Analysis of Airborne CO2: Insights from Etna Volcano and Madonie Mountains, Italy, Surveys 

Sergio Gurrieri and Roberto M.R. Di Martino

Climate change is intricately linked to the carbon cycle. Both phenomena are examined across various temporal and spatial scales to clarify the processes of carbon exchange between the atmosphere and the Earth's surface in response to increasing greenhouse gas emissions, primarily CO2. Anthropogenic CO2 emissions emerge as the main driver of global warming, while natural CO2 emissions into the atmosphere constitutes approximately 1% of annual CO2 emissions, mainly resulting from volcanic activity.

This study relies on datasets gathered during surveys at Etna volcano and the Madonie mountains, Italy, to identify spatial variations in stable isotope composition and the concentration of airborne CO2. The dataset was collected along a path specifically designed from the urban areas of Catania and Cefalù, both in Italy, to high altitudes (i.e., ~2200 m a.s.l.) at Mount Etna and the Madonie mountains, Italy, respectively. This dataset facilitates exploration of spatial variations in the sources of atmospheric CO2 and patterns in the isotopic composition and concentration of airborne CO2 with altitude.

The study's findings indicate that the primary sources of airborne CO2 exhibit a biogenic isotopic carbon signature at Etna and the Madonie mountains, although a more 13C-enriched CO2 source influences the isotopic signature of airborne CO2 at Mount Etna. The concentration of airborne CO2 and the carbon isotopic signature remain independent of altitude. However, a high correlation between altitude and oxygen isotopic signature suggests that variations in hydrology significantly impact the airborne CO2.

Furthermore, the study underscores the complex relationship between environmental variables and airborne CO2 concentration, indicating that the pattern in airborne CO2 cannot be comprehensively investigated solely through concentration analysis due to the high background CO2 concentration compared to relative spatial variations. Additionally, the carbon isotopic signature of CO2 enables the differentiation of multiple sources of CO2 at Mount Etna and the distinction of 13C-enriched volcanic CO2 from background air at low airborne CO2 concentrations.

How to cite: Gurrieri, S. and Di Martino, R. M. R.: Spatial Isotopic Analysis of Airborne CO2: Insights from Etna Volcano and Madonie Mountains, Italy, Surveys, EGU General Assembly 2024, Vienna, Austria, 14–19 Apr 2024, EGU24-5556, https://doi.org/10.5194/egusphere-egu24-5556, 2024.

EGU24-6354 | ECS | Orals | BG2.2

Interannual variations in Δ(17O) of atmospheric CO2 suggest a strong link with stratospheric input 

Pharahilda Steur, Hubertus A. Scheeren, Gerbrand Koren, Getachew A. Adnew, Wouter Peters, and Harro A. J. Meijer

We present multiple year records of the triple oxygen isotope signature Δ(17O) of atmospheric CO2 conducted with laser absorption spectroscopy, from Lutjewad in the Netherlands (53° 24’N, 6° 21’E) and Mace Head in Ireland (53° 20’ N, 9° 54’ W). Measurements were done on flask samples covering the period 2017-2022. The average uncertainty of 0.07 is about 3 times smaller than the total observed variability. A positive Δ(17O) originates from intrusions of stratospheric CO2, whereas values close to zero result from equilibration of CO2 and water, predominantly happening inside plants due to enhanced dissolution in the presence of carbonic anhydrase. A biosphere driven seasonal signal is, however, not observed in the records. Both records show significant interannual variability, of up to 0.3 . The total range covered by smoothed monthly averages from the Lutjewad record is -0.065 to 0.046 , which is significantly higher than the range of -0.009 to 0.036 that was simulated with a 3-D transport model. One of the major model uncertainties is the representation of the stratospheric influx of Δ(17O). We modified the model using the 100 hPa 60-90° North monthly mean temperature anomaly as a proxy to scale stratospheric downwelling. This results in a strong improvement of the correlation coefficient of the simulated and the observed year-to-year Δ(17O) variations at Lutjewad over 2019 and 2022 from 0.37 to 0.81 (N=22). To infer terrestrial carbon fluxes, the contribution of the stratosphere to the observed signal should therefore be considered. In fact, as the Δ(17O) of atmospheric CO2  seems to be dominated by stratospheric influx, it might be used as a tracer for stratosphere-troposphere exchange. To further study the potential of Δ(17O) of atmospheric CO2 as a tracer for stratosphere-troposphere exchange at Lutjewad, we installed a laser absorption spectrometer at the measurement station for in-situ measurements. At Lutjewad numerous other atmospheric species are monitored, such as N2O, Rn and 14C. This will enable us to deepen our knowledge on the mechanisms that drive the interannual variability of Δ(17O) of atmospheric CO2  that we observe at Lutjewad.


How to cite: Steur, P., Scheeren, H. A., Koren, G., Adnew, G. A., Peters, W., and Meijer, H. A. J.: Interannual variations in Δ(17O) of atmospheric CO2 suggest a strong link with stratospheric input, EGU General Assembly 2024, Vienna, Austria, 14–19 Apr 2024, EGU24-6354, https://doi.org/10.5194/egusphere-egu24-6354, 2024.

We present a project aiming to provide a new estimate of the parameter known as "climate sensitivity" (symbol γL in the models) which is essential to constrain models of future climate change. This parameter describes how the amount of carbon sequestered by terrestrial ecosystems depends on temperature. Predictions of future climate by models show significant uncertainties associated with the estimates of carbon sequestration by terrestrial ecosystems with future temperature increases. Quantifying γL with data measured in the industrial era is very complicated because the terrestrial part of the carbon cycle is dominated by the effect of the increase in atmospheric CO2 (the so-called anthropogenic “fertilization” or CO2 concentration feedback, symbol βL in the models), while the effect of temperature is smaller. We will derive γL from measurements of ultra-trace gases trapped in polar ice cores in pre-industrial times.

The Little Ice Age (i.e. the period that roughly covers the centuries 1400-1800 AD) was characterized by temperatures lower than the average of the last millennium, due to intense volcanic activity and reduced solar activity. The global decrease in temperature has coincided with a decrease in the atmospheric concentration of CO2, mainly caused by sequestration from terrestrial ecosystems. Low CO2 concentrations contributed negligibly to the decrease in temperature, making the Little Ice Age a suitable time to derive γL.

Why CO2 decreased during the Little Ice Age is debated. On the one hand, considerations deriving from models that simulate the amount of carbon present in terrestrial ecosystems suggest that primary productivity increased during the Little Ice Age because of an anthropogenic effect. This increase would have been caused by pandemics and colonial conquests in America which led to a depopulation of cultivated lands and a regrowth of tree species. On the other hand, measurements of carbonyl sulphate (COS) and numerical calculations capable of closing the COS budget suggest that primary productivity naturally decreased during the Little Ice Age. In this second case, the decrease in CO2 would be caused by the fact that the respiration of terrestrial ecosystems decreased to a greater extent than the decrease in primary productivity. Therefore, if this second hypothesis is correct, it would be possible to derive γL from COS data covering the Little Ice Age.

Unfortunately, COS measurements covering the Little Ice Age have great uncertainty. It is therefore necessary to carry out new measurements of COS concentration during the Little Ice Age. The COS measurements will be accompanied by CO2 and δ13C-CO2 measurements, necessary to confirm, on the one hand, the working hypothesis, and, on the other, the quality of the ice samples used. Finally, future developments could build on measurements of COS isotopes in ice samples.

Rubino M., et al. Terrestrial uptake due to cooling responsible for low atmospheric CO2 during the Little Ice Age, Nature Geoscience, 9, 691-694 (2016)

How to cite: Iazzetta, D. and Rubino, M.: Quantification of the climate sensitivity of terrestrial ecosystems through the analysis of ultra-trace gases in ice cores over the last millennium, EGU General Assembly 2024, Vienna, Austria, 14–19 Apr 2024, EGU24-7270, https://doi.org/10.5194/egusphere-egu24-7270, 2024.

EGU24-10052 | ECS | Posters on site | BG2.2

Atmospheric O2 and CO2 measurements at a single height provide weak constraint on the surface carbon exchange. 

Kim Faassen, Ingrid Luijkx, Jordi Vilà-Guerau de Arellano, Raquel González-Armas, Bert Heusinkveld, Ivan Mammarella, and Wouter Peters

The ratios of atmospheric tracers are often used to interpret the local CO2 budget, where measurements at a single height are assumed to represent local flux signatures. Alternatively, these signatures can be derived from direct flux measurements or using fluxes derived from measurements at multiple heights. In this study, we contrast interpretation of surface CO2 exchange from tracer ratio measurements at a single height versus measurements at multiple heights. Specifically, we analyse the ratio between atmospheric O2 and CO2 (exchange ratio, ER) above a forest canopy. We consider two alternative approaches: the exchange ratio of the forest (ERforest) obtained from the ratio of the surface fluxes of O2 and CO2, derived from their vertical gradients measured at multiple heights, and the exchange ratio of the atmosphere (ERatmos) obtained from changes in the O2 and CO2 mole fractions over time measured at a single measurement height. We investigate the diurnal cycle of both ER signals, with the goal to relate the ERatmos signal to the ERforest signal and to understand the biophysical meaning of the ERatmos signal. We combined CO2 and O2 measurements from Hyytiälä, Finland during spring and summer of 2018 and 2019 with a conceptual land-atmosphere model and a theoretical relationship between ERatmos and ERforest to investigate the behaviour of ERatmos and ERforest during different environmental conditions. We show that the ERatmos signal rarely directly represents the forest exchange, mainly because it is influenced by entrainment of air from the free troposphere into the atmospheric boundary layer. The resulting ERatmos signal is not the average of the contributing processes, but rather an indication of the influence of large scale processes such as entrainment or advection. We conclude that the ERatmos only provides a weak constraint on local scale surface CO2 exchange, because large scale processes confound the signal. Single height measurements therefore always require careful selection of the time of day and should be combined with atmospheric modelling to yield a meaningful representation of forest carbon exchange. More generally, we recommend to always measure at multiple heights when using multi-tracer measurements to study surface CO2 exchange.

How to cite: Faassen, K., Luijkx, I., Vilà-Guerau de Arellano, J., González-Armas, R., Heusinkveld, B., Mammarella, I., and Peters, W.: Atmospheric O2 and CO2 measurements at a single height provide weak constraint on the surface carbon exchange., EGU General Assembly 2024, Vienna, Austria, 14–19 Apr 2024, EGU24-10052, https://doi.org/10.5194/egusphere-egu24-10052, 2024.

EGU24-10688 | Posters on site | BG2.2

A comprehensive model for COS isotope discrimination during leaf COS uptake 

Nerea Ubierna, Sophie L. Baartman, María Elena Popa, Jérôme Ogée, Maarten C. Krol, and Lisa Wingate

Anthropogenically emitted CO2 is warming the earth’s climate to temperatures that already exceed pre-industrial levels by more than 1.2 oC. Terrestrial vegetation has slowed the rate of climate change by removing part of this anthropogenic emission. Accurate estimations of the present and future terrestrial carbon sink are still needed for forecasting climate and for informing policies for climate stabilization. This requires precise knowledge of the photosynthetic C uptake over land (gross primary production, GPP), independently of the C released through plant and soil respiration. The gas carbonyl sulfide (COS) has emerged as a promising tracer for GPP. This is because both CO2 and COS are a substrate for carbonic anhydrase (CA), the first enzyme involved in photosynthesis, so that the uptake by foliage of COS and CO2 often covaries. Estimating GPP from COS measurements and atmospheric budgets also requires quantifying ocean and industrial COS sources, which is challenging. Isotopic constrained COS tropospheric mass balances can help quantify the relative contribution of these sources if the isotope discrimination during COS uptake by terrestrial vegetation (the main COS sink) is known. However, little is known about plant-atmosphere COS isotope exchange; measurements are challenging and theory to interpret these measurements is limited. Herein, we present a new comprehensive model for discrimination during COS uptake by plants (∆34S) and use it to revisit existing COS isotope datasets and atmospheric budgets. Our ∆34S model expands Davidson et al. (2022) pioneer framework by accounting for leaf COS production. By analogy with the well-established model for photosynthetic discrimination against 13CO2, Davidson et al. ∆34S model stated that COS discrimination occurs as COS diffuses into the leaf and binds to CA. Leaf COS emission was not considered, although it has been reported in species ranging from bryophytes to wheat and trees. Because it is uncertain where these emissions occur, we tested different leaf-level COS emission scenarios - including zero emissions - in various leaf compartments (cuticle, intercellular space, cytosol), alone or in combination. We used this comprehensive model to generate predictions for ∆34S in C3 and C4 species and discussed implications for determining a global plant uptake fractionation factor. Our mechanistic model provides a framework to interpret vegetation-atmosphere COS isotope exchange that can prove useful to improve COS uptake-based GPP estimates and our understanding of plant function, especially when combined with other isotopes (C, O, H).

How to cite: Ubierna, N., Baartman, S. L., Popa, M. E., Ogée, J., Krol, M. C., and Wingate, L.: A comprehensive model for COS isotope discrimination during leaf COS uptake, EGU General Assembly 2024, Vienna, Austria, 14–19 Apr 2024, EGU24-10688, https://doi.org/10.5194/egusphere-egu24-10688, 2024.

EGU24-11359 | ECS | Orals | BG2.2

Investigating the dust-induced N2O production in ice cores using bulk and position-specific isotope analysis 

Lison Soussaintjean, Jochen Schmitt, Joël Savarino, Andy Menking, Edward Brook, Barbara Seth, Thomas Röckmann, and Hubertus Fischer

Ice cores represent the only direct paleo-atmospheric archive that allow the reconstruction of greenhouse gas concentrations such as N2O. However, processes in the ice can alter the atmospheric information stored in air bubbles, for example by adding extra N2O by in situ production. This in situ production of N2O is especially severe in mineral dust-rich ice core sections corresponding to glacial periods. Understanding the production process and its link to the mineral dust content is key to systematically detecting altered samples and correcting for the in situ contribution. Isotope analysis is particularly useful for characterizing these processes and thus isolating the paleoclimatic signal from archived data. 

We measured the bulk nitrogen and oxygen isotopic composition of N2O in Antarctic and Greenland ice cores from glacial periods. The isotopic signatures of N2O produced in situ, calculated using a mass balance approach, differ from that of the atmospheric N2O. In addition, enrichment or depletion in 15N and/or 18O relative to atmospheric values varies with drilling site, snow accumulation rate, and properties of the snow-ice transition. Interestingly, isotopic signatures of nitrate (NO3-) exhibit similar dependencies. It is well established that NO3- is drastically altered by post-depositional processes in low accumulation areas. Joint isotopic analysis of N2O and NO3- in samples from the EDC and EDML ice cores revealed a correlation between δ15N values of NO3- and in situ N2O, pointing to NO3- as a potential precursor for in situ production. While being linearly correlated, the nitrogen isotopic signature of NO3- is twice as enriched as in situ produced N2O. This suggests that the two N atoms of N2O originate from two distinct sources and only one is likely derived from nitrate.

We additionally measured the site preference of 15N in N2O in ice core samples (SP = δ15Nα - δ15Nβ, where α is the central and β the terminal N atom in the N2O molecule). Previous work on SP suggests that SP might be indicative of the N2O formation pathway provided both N atoms are derived from the same N precursor. The SP signature in Vostok samples ranges from +57 to +242 ‰, and the δ15Nα values from +92 to +234 ‰, which is comparable to the δ15N values of NO3- at Vostok. Although similar reaction pathways were expected in different ice cores, in situ N2O from Taylor Glacier samples exhibits very different SP values from -17 to -7 ‰, with δ15Nα values from -45 to -32 ‰. Given that the difference in δ15N of NO3- is also up to 200 ‰ between these two locations, our findings suggest that the center-position nitrogen (α) of in situ N2O comes from NO3- and the terminal-position nitrogen (β) from another N-bearing compound. Thus, the SP signature seems to reflect not the N2O formation pathway but the difference in δ15N of the two nitrogen pools involved in the reaction.

Gaining a thorough understanding of the N2O production in ice marks a significant advancement towards interpretation of the N2O record and possibly correction for in situ production.

How to cite: Soussaintjean, L., Schmitt, J., Savarino, J., Menking, A., Brook, E., Seth, B., Röckmann, T., and Fischer, H.: Investigating the dust-induced N2O production in ice cores using bulk and position-specific isotope analysis, EGU General Assembly 2024, Vienna, Austria, 14–19 Apr 2024, EGU24-11359, https://doi.org/10.5194/egusphere-egu24-11359, 2024.

EGU24-13219 | ECS | Orals | BG2.2

Deciphering the origin of methane in fracture fluids at Virginia gas field using clumped isotope tracers. 

Orestis Gazetas, Andrew Houston, Matthieu Clog, Issaku Kohl, and Fin Stuart

The Witwatersrand Basin is a well-known area due to the immense gold mineralisation and mining activities, which have been ongoing since the late 19th century. The Virginia Gas Field, located in the southernmost extent of the basin, has recently gained further attention due to the discovery of gases with remarkable helium content of up to 12% and methane content between 75-99%. While the helium generation is likely straightforward and linked to the U-rich Dominion (2.9-3.0 Ga) and Central Rand (2.7-2.8 Ga) groups (Lippmann-Pipke et al., 2003), the origin of methane seems more complex but ultimately significant, with economic potential and implications for the evolution of life .

Stable isotopic compositions of carbon and hydrogen (δ13C and δD) along with molecular compositions (C1/C2+) are traditionally considered useful for understanding the origin of methane in natural gas reservoirs but can often be ambiguous or misleading. The recent development of HR-IRMS allows us to delve deeper into the distribution of isotopes beyond bulk ratios by introducing two additional tracers, the clumped isotopic compositions Δ13CH3D and Δ12CH2D2. These novel tracers offer two additional dimensions which can potentially provide insights into the formation pathways and formation or re-equilibration temperature of methane.

For this study, we measured bulk and clumped isotopic compositions along with molecular compositions for samples collected from shallow boreholes (300-700m depth) within the Virginia gas field production area. Here, we present evidence that the bulk and clumped isotopic compositions are governed by the microbial cycling of CH4 due to the presence of ancient microbial communities of methanogens and methanotrophs at depths below 1km (Omar et al., 2003). We also consider the possibility of mixing microbial methane with abiotic gas resulting from water-rock interactions occurring in the deep subsurface.

References

1. Lippmann-Pipke, J., Stute, M., Torgersen, T., Moser, D.P., Hall, J., Lin, L., Borcsik, M., Bellamy, R.E.S. and Onstott, T.C., 2003. Dating ultra-deep mine waters with noble gases and 36Cl, Witwatersrand, South Africa. Geochimica Cosmoshimica Acta, 67, pp.4597-4619.

2. Omar, G.I., Onstott, T.C. and Hoek, J., 2003. The origin of deep subsurface microbial communities in the Witwatersrand Basin, South Africa as deduced from apatite fission track analyses. Geofluids, 3(1), pp.69-80.


How to cite: Gazetas, O., Houston, A., Clog, M., Kohl, I., and Stuart, F.: Deciphering the origin of methane in fracture fluids at Virginia gas field using clumped isotope tracers., EGU General Assembly 2024, Vienna, Austria, 14–19 Apr 2024, EGU24-13219, https://doi.org/10.5194/egusphere-egu24-13219, 2024.

EGU24-13866 | Posters on site | BG2.2

Laser absorption spectroscopy-based ultraportable analyzer for δ18O and δ2H in water. 

Akshay Nataraj, Susan Fortson, Frederic Despagne, Julio Lobo Neto, and Doug Baer

Stable isotope analysis of water 2H2O and H218O are powerful tracers to understand the different hydrological processes like ecohydrological processes, and hydroclimatic processes [1]. The measurement of δ2H and δ18O in water samples using laser-based absorption techniques is adopted increasingly in hydrologic and environmental studies. In contrast to the conventional Isotope ratio mass spectrometry (IRMS) technique, optical absorption spectroscopic techniques allow the realization of isotopologue-specific, non-destructive, and compact spectrometers with short analysis times with high-precision capabilities.

ABB’s ultraportable water analyzers are compact, portable field-deployable laser spectrometers capable of making continuous, high-frequency measurements of δ18O and δ2H from multiple water sources. The instrument is based on Off-Axis Integrated Cavity Output Spectroscopy (OA-ICOS) technique [2]. These analyzers are capable of measuring liquid water (GLA132-LWIA) or vapor (GLA132-WVIA).  They are rugged and designed to handle both natural and isotopically enriched water samples.  Users can leverage the precision and speed of the GLA132-LWIA by coupling it with a portable auto-injector to perform automated, unattended injection patterns on multiple samples.

An important asset of this innovative approach based on OA-ICOS technology coupled with the portable auto-injector technology is its sample throughput, which allows one to measure approximately 90 samples a day corresponding to 720 injections each with a sample volume of 0.5 µL per injection per day. The precision (1σ) achieved corresponds to 0.6 ‰ for δ2H and 0.2 ‰ for δ18O. The analyzer’s ease of use, field portability, durability, and high throughput make it an excellent choice for reliable, high-performance measurement of freshly collected samples in the field, thereby opening a plethora of applications to understand the different processing governing the earth’s climate.

[1] Tian, C.,et al., Sci Rep 8, 6712 (2018). https://doi.org/10.1038/s41598-018-25102-7

[2] A. O’Keefe, et al., Chemical Physics Letters, vol. 307, no. 5, pp. 343–349, Jul. 1999, doi: 10.1016/S0009-2614(99)00547-3.

How to cite: Nataraj, A., Fortson, S., Despagne, F., Lobo Neto, J., and Baer, D.: Laser absorption spectroscopy-based ultraportable analyzer for δ18O and δ2H in water., EGU General Assembly 2024, Vienna, Austria, 14–19 Apr 2024, EGU24-13866, https://doi.org/10.5194/egusphere-egu24-13866, 2024.

 Nitrous oxide (N2O), known for its ozone-depleting potential and characterized by a long residence time of 120 years in the atmosphere, is the third most significant anthropogenic greenhouse gas after CO2 and CH4. Primary sources of N2O include nitrification and denitrification processes in soils and aquatic systems, as well as from direct anthropogenic sources such as fossil fuel combustion and wastewater treatment plants. The increase in N2O emissions due to agricultural activities and urbanization is complex, given the high variability of these emissions. To characterize anthropogenic N2O sources, we collected air samples from tunnels and wastewater treatment plants. Additionally, to establish the background levels for Seoul, a megacity in South Korea, we collected ambient air from three sites (Mt Gwanak, Mt Nam, and Olympic Park) monthly throughout the year 2023. These air samples were measured for greenhouse gas concentrations (CO2, CH4, and N2O), and the stable isotopic compositions of N2O (δ15Nbulk, δ18O, and SP values) were analyzed using IRMS. The stable isotopic ratios of N2O emitted from the vehicles were determined as 6.0 ± 1.2 ‰ for δ15Nbulk, 34.4 ± 11.7 ‰ for δ18O, and 6.0 ± 4.2 ‰ for SP values. Furthermore, N2O from wastewater treatment plant water tank air exhibited variations dependent on dissolved oxygen levels. Notably, the stable isotopic compositions of N2O from anthropogenic sources were consistently depleted compared to the ambient air of Seoul (δ15Nbulk: 5.9± 0.2 ‰, δ18O: 43.8 ± 0.1 ‰, SP: 18.6 ± 0.3 ‰ (S.E.)). Intriguingly, while δ15Nbulk and δ18O values of ambient air were depleted relative to the global average, SP values exhibited a wide range and significant variability. This suggests the presence of pronounced spatial and temporal variabilities in N2O emissions, underscoring the need for further research to understand the extent of anthropogenic impacts.

How to cite: Kim, J., Ahn, J., and Toyoda, S.: Nitrous oxide emissions and stable isotopic composition in urban sources and ambient air in Seoul, South Korea, EGU General Assembly 2024, Vienna, Austria, 14–19 Apr 2024, EGU24-13954, https://doi.org/10.5194/egusphere-egu24-13954, 2024.

EGU24-15555 | ECS | Orals | BG2.2

Tracing diurnal variations of carbon and water cycle tracers over a tropical and temperate forest 

Gerbrand Koren, Kim A. P. Faassen, Raquel González-Armas, Getachew Agmuas Adnew, Hella van Asperen, Hugo de Boer, Santiago Botía, Oscar Hartogensis, Lucas Hulsman, Ronald W. A. Hutjes, Sam P. Jones, Shujiro Komiya, Ingrid T. Luijkx, Wouter Mol, Michiel van der Molen, Robbert Moonen, Thomas Röckmann, and Jordi Vilà-Guerau de Arellano

Diurnal temperature and carbon dioxide ranges are key metrics to quantify the impact of regional climate changes in forests. These ranges depend on biophysical processes, surface heat, water and carbon exchange, and boundary-layer dynamics. A crucial and elusive process is the entrainment of air from the free troposphere and residual air layers into the atmospheric boundary layer. Here we provide observational constraints on entrainment for two contrasting measurement sites: the Amazon Tall Tower Observatory (ATTO) in central Amazonia and the Loobos flux tower (NL-Loo) in a temperate forest in the Netherlands. We used radio soundings, air samples from tall towers and aircraft data in combination with surface air measurements and ecophysiological data. Fluxes and concentrations were measured for biophysical-process tracers  CO2, O2/N2, δ13C, δ18O (in CO2) and δ18O (in water). These novel tracers are proposed to partition gross carbon and water fluxes and for estimating plant properties and we present a unique dataset with our interpretation. Our analysis enables us to unravel the role of entrainment on the diurnal ranges and how this is controlled by surface and entrainment fluxes. By means of a coupled forest-atmosphere model constrained by the comprehensive observations, we perform a sensitivity study on the surface flux partitioning (photosynthesis versus soil respiration; soil evaporation versus plant transpiration, sensible versus heat flux) under a wide range of leaf traits, surface and boundary-layer dynamic conditions. Our results are useful to assess the performance of carbon-climate models in tropical and temperate forests.

How to cite: Koren, G., Faassen, K. A. P., González-Armas, R., Adnew, G. A., van Asperen, H., de Boer, H., Botía, S., Hartogensis, O., Hulsman, L., Hutjes, R. W. A., Jones, S. P., Komiya, S., Luijkx, I. T., Mol, W., van der Molen, M., Moonen, R., Röckmann, T., and Vilà-Guerau de Arellano, J.: Tracing diurnal variations of carbon and water cycle tracers over a tropical and temperate forest, EGU General Assembly 2024, Vienna, Austria, 14–19 Apr 2024, EGU24-15555, https://doi.org/10.5194/egusphere-egu24-15555, 2024.

EGU24-15916 | ECS | Orals | BG2.2

Source apportionment of sulfate aerosols over South Asia using δ34S 

Sean Clarke, Henry Holmstrand, Krishnakant Budhavant, Manoj Remani, and Örjan Gustafsson

Sulfate aerosols are short lived climate forcers that cool the climate, but at the cost of human health and the environment. Their short lifetime leads to an unequal global distribution, with massive emissions in South Asia, resulting in some of the highest atmospheric loadings. These emissions originate from natural and anthropogenic sources, with their relative contributions uncertain, due to emissions being short lived and diffuse. However, the stable isotopic composition (δ34S), holds some promise of improved apportionment of sulfate sources. The aim was to leverage this isotopic composition to distinguish sources of sulfate aerosols intercepted at the Maldives Climate Observatory Hanimaadhoo (MCOH). This site is strategically located to intercept a wide footprint of the outflow from South Asia.

The results demonstrated that non-sea salt sulfate was largely of anthropogenic origin, contributing 93±21%, 85±14%, 61±20% in winter, spring, and summer, respectively. This study also found a moderate to strong correlation (r2 = 0.68) between continental anthropogenic (winter and spring) sulfate (δ34S) and fossil fuel black carbon (δ13C, Δ14C). This study provides improved constraints on sulfate sources in South Asia using stable δ34S isotopic analysis, which builds a foundation for future investigations aimed at unravelling the nexus of sulfate emissions in South Asia.

How to cite: Clarke, S., Holmstrand, H., Budhavant, K., Remani, M., and Gustafsson, Ö.: Source apportionment of sulfate aerosols over South Asia using δ34S, EGU General Assembly 2024, Vienna, Austria, 14–19 Apr 2024, EGU24-15916, https://doi.org/10.5194/egusphere-egu24-15916, 2024.

EGU24-16015 | ECS | Posters on site | BG2.2

From over to under, a story about the vertical within-canopy variation of the leaf relative uptake rate of COS 

Felix M. Spielmann, Albin Hammerle, Katharina Scholz, Gil Putz, Lorenz Hänchen, Anna De-Vries, and Georg Wohlfahrt

The gross primary productivity (GPP), which represents the gross uptake of carbon dioxide (CO2) by plants, cannot be directly measured at the ecosystem level. It must instead be inferred either by applying models or by measuring proxies. A notable proxy is the trace gas carbonyl sulfide (COS), which is particularly interesting because it follows a pathway into plant leaves similar to CO2 and, unlike CO2, is generally not reemitted.

To utilize COS as a tracer for GPP, the leaf relative uptake (LRU)—the ratio of the deposition velocities of COS to CO2 at the leaf level—must be known a priori. Initial studies suggested that LRU values were relatively constrained, around 1.7. However, it has been observed that LRU varies between plant species and is influenced by environmental factors such as drought, vapor pressure deficit (VPD), and photosynthetically active radiation (PAR).

The variation in LRU related to PAR is due to COS primarily being catalyzed by the enzyme carbonic anhydrase in a light-independent reaction, contrasting with CO2 uptake via photosynthesis, which is dependent on PAR. Consequently, LRU increases under lower light conditions, even when stomatal control on both gases is similar.

This light dependency prompts questions about LRU variation within canopies. While most LRU chamber measurements have been conducted under laboratory conditions or in canopy crowns, additional data on LRU variability within canopies, particularly in lower light conditions, are necessary. A comprehensive understanding of LRU, encompassing both crown and shadow-adapted leaves at various canopy positions and considering stand species composition, is essential for accurately calculating GPP at the ecosystem scale using eddy covariance (EC) measurements.

To investigate how LRU varies within the canopy, particularly in response to environmental factors like PAR and VPD, and to compare the LRUs from different chamber measurements to EC measurements, we conducted a measurement campaign in an Austrian Pine forest. This included ongoing eddy covariance measurements of COS, CO2, and H2O, supplemented by manual measurements of the same gases using branch chambers at three levels within the Pinus sylvestris canopy and three additional chambers of Juniperus communis.

Above 400 µmol photons m² s PAR, where we consider the LRU to be light independent, the LRU reached 1.61±0.3 at the top of the crown and decreased to 1.55±0.4 and 1.56±0.3 going consecutively deeper into the canopy of Pinus sylvestris. In contrast, the LRU of Juniperus communis in the understory was notably lower, at 1.41±0.4. Between 100 and 400 µmol photons m² s PAR, the LRUs increased to 1.81±0.3 and 1.69±0.5 for the upper and middle canopy layers, respectively, while decreasing to 1.43±0.2 and 1.19±0.2 in the lower parts of Pinus sylvestris and Juniperus communis, respectively. This decrease in LRU deeper within the canopy is attributed to a greater reduction in COS compared to CO2 deposition velocity of the leaves. The median LRU above 800 µmol photons m² s PAR, based on classical daytime flux partitioning for the summer month of 2022, was 2.5±0.7, indicating the need for further investigation into the observed discrepancy in LRU.

How to cite: Spielmann, F. M., Hammerle, A., Scholz, K., Putz, G., Hänchen, L., De-Vries, A., and Wohlfahrt, G.: From over to under, a story about the vertical within-canopy variation of the leaf relative uptake rate of COS, EGU General Assembly 2024, Vienna, Austria, 14–19 Apr 2024, EGU24-16015, https://doi.org/10.5194/egusphere-egu24-16015, 2024.

EGU24-16376 | ECS | Orals | BG2.2

Development and verification of preconcentrator to measure clumped isotopologues (Δ13CH3D and Δ12CH2D2) of methane from the atmosphere and sources 

Sara Defratyka, Chris Rennick, Freya Wilson, Matthieu Clog, Andrew Houston, and Tim Arnold

Bulk isotopic signatures (δ13C-CH4 and δD-CH4) are widely used for determination of methane source types and relative contributions. For example, these measurements are implemented as additional tracers in top-down studies. However, for some sources, for example certain fossil fuels sources in Europe and waste sector, the bulk isotopic signatures are overlapping, thus some methane sources remain indistinguishable1–4.

The multiply substituted (clumped) isotopes can be used as additional tracers to better distinguish methane sources, and potentially, better understand methane sinks. Measurement of methane clumped isotopes, Δ13CH3D and Δ12CH2D2 is more challenging than measurements of bulk isotopes and requires more advanced instruments 3,5–8. Currently, a NERC project called POLYGRAM aims to develop the sample preparation (automated preconcentration) and measurement infrastructure to measure atmospheric air samples using High Resolution - Isotope Ratio Mass Spectrometer (HR-IRMS), to determine clumped isotopes from air samples collected at the world-recognised global monitoring sites at Cape Point, South Africa and station Zeppelin, Svalbard. Moreover, the project also aims to determine the clumped isotopes ratios of methane sources, like wetlands, agriculture or coal mines, as currently clumped isotopes database is constrained.

Use of custom-built preconcentrator is a key step in the measurement chain, as HR-IRMS requires ultra-pure methane samples to measure clump isotopes. For ambient air studies, our aim is to obtain, at ambient pressure, a 150 ml sample containing at least 1% of methane from hundreds of litres of ambient air, where CH4 mole fraction is less than 2 ppm. To achieve it, we aim to concentrate methane in our sample by up to 62500 times. Additionally, we develop our preconcentrator to prepare samples containing at least 1% of methane from gas samples containing <1% CH4, like air in coal mines, landfill emissions, etc. During the conference, we will be focused on overcoming technical and scientifical challenges and made progress in developing CH4 preconcentrator. We will present the results of validation exercises to ensure repeatability and lack of fractionation effects, both for ambient air and methane source samples.

References:

  • Turner, A. J., Frankenberg, C. & Kort, E. A. Interpreting contemporary trends in atmospheric methane. Proc. Natl. Acad. Sci. 116, 2805–2813 (2019).
  • Saunois, M. et al. The Global Methane Budget 2000–2017. Earth Syst. Sci. Data 12, 1561–1623 (2020).
  • Chung, E. & Arnold, T. Potential of Clumped Isotopes in Constraining the Global Atmospheric Methane Budget. Glob. Biogeochem. Cycles 35, (2021).
  • Menoud, M. et al. New contributions of measurements in Europe to the global inventory of the stable isotopic composition of methane. Earth Syst. Sci. Data 14, 4365–4386 (2022).
  • Douglas, P. M. J. et al. Methane clumped isotopes: Progress and potential for a new isotopic tracer. Org. Geochem. 113, 262–282 (2017).
  • Haghnegahdar, M. A., Schauble, E. A. & Young, E. D. A model for 12CH2D2 and 13CH3D as complementary tracers for the budget of atmospheric CH4. Glob. Biogeochem. Cycles 31, 1387–1407 (2017).
  • Sivan, M. & Röckmann, T. Extraction, purification, and clumped isotope analysis of methane (Δ13CDH3 and Δ12CD2H2) from sources and the atmosphere. (2023).
  • Haghnegahdar, M. A. et al. Tracing sources of atmospheric methane using clumped isotopes. 120, (2023).

How to cite: Defratyka, S., Rennick, C., Wilson, F., Clog, M., Houston, A., and Arnold, T.: Development and verification of preconcentrator to measure clumped isotopologues (Δ13CH3D and Δ12CH2D2) of methane from the atmosphere and sources, EGU General Assembly 2024, Vienna, Austria, 14–19 Apr 2024, EGU24-16376, https://doi.org/10.5194/egusphere-egu24-16376, 2024.

EGU24-20240 | Posters on site | BG2.2

Pros and cons of methane clumped isotope analysis by high-resolution isotope-ratio mass spectrometry and laser absorption spectroscopy 

Naizhong Zhang, Ivan Prokhorov, Nico Kueter, Stefano Bernasconi, Mayuko Nakagawa, Alexis Gilbert, Yuichiro Ueno, Béla Tuzson, Lukas Emmenegger, and Joachim Mohn

Bulk isotope analytical methods of CH4 quantify carbon and hydrogen isotope ratios (δ13C and δD) to provide information on the sources and sinks of CH4 in natural environments. A more extensive tracing of CH4 pathways, especially when multiple processes and sources are involved, has been realized by novel measurements techniques capable of methane clumped isotope analysis (termed as Δ13CH3D and Δ12CH2D2) during the past decade. These paired datasets can either be used as proxy for exploring CH4 formation temperatures under thermodynamic equilibrium, or studying contributions of kinetically controlled processes during CH4 formation and consumption1.

Currently, methane clumped isotope analysis is performed by two different techniques: isotope-ratio mass spectrometry (e.g. 253 Ultra from Thermo Fisher Scientific2 or Panorama from Nu Instruments1) or laser absorption spectroscopy (e.g. QCLAS from Aerodyne Research3,4), both of which have demonstrated a precision better than 0.5‰ for Δ13CH3D and 1.5‰ for Δ12CH2D2, which is sufficient for most applications. This work will provide insights about the main instrumental features, measurement protocols and performance of the 253 Ultra HR-IRMS at Tokyo Institute of Technology (Japan)2,5, and the QCL absorption spectrometer at Empa (Switzerland)4. Furthermore, advantages and limitations of both techniques during current applications in natural methane samples are discussed. Finally, perspectives for future applications at low CH4 concentrations, such as atmospheric monitoring, are provided.


References:

  • Young et al., 2017, Geochimica et Cosmochimica Acta; 2. Dong et al., 2020, Thermo Scientific white paper; 3. Gonzalez et al., 2019, Analytical Chemistry; 4. Prokhorov and Mohn, 2022, Analytical Chemistry; 5. Zhang et al., 2021, Geochimica et Cosmochimica Acta

How to cite: Zhang, N., Prokhorov, I., Kueter, N., Bernasconi, S., Nakagawa, M., Gilbert, A., Ueno, Y., Tuzson, B., Emmenegger, L., and Mohn, J.: Pros and cons of methane clumped isotope analysis by high-resolution isotope-ratio mass spectrometry and laser absorption spectroscopy, EGU General Assembly 2024, Vienna, Austria, 14–19 Apr 2024, EGU24-20240, https://doi.org/10.5194/egusphere-egu24-20240, 2024.

EGU24-20419 | ECS | Orals | BG2.2

Stratospheric observations of carbonyl sulfide using AirCore and LISA 

Alessandro Zanchetta, Steven van Heuven, Jin Ma, Maarten Krol, and Huilin Chen

Carbonyl sulfide (COS) is a long-lived sulfur compound present in the atmosphere with an average mole fraction of around 450-500 ppt, and is considered as a potential tracer to partition gross primary production (GPP) and net ecosystem exchange (NEE) in plants’ photosynthesis, possibly by satellite observations. However, its sources and sinks  are not fully understood, and remote sensing observations of COS still require validation and need to be linked with a reference measurement scale, e.g., NOAA’s. In this work, we present vertical profiles of COS mole fractions obtained in Trainou, France (47°58' N, 2°06' E) in June 2019, in Kiruna, Sweden (67°53' N, 21°04' E) in August 2021, and in Sodankylä, Finland (67°22'N, 26°37'E) in August 2023 using AirCore samplers and two versions of the lightweight stratospheric air (LISA) sampler. Additionally, simultaneous measurements of CO2, CO, CH4 and N2O have been made. Measurement methods (i.e., LISA vs AirCore) will be compared. Moreover, the retrieved COS profiles will be compared with COS FTIR remote sensing observations and COS simulations from the TM5-4DVAR modeling system, to get a better understanding of the behavior of these species in the stratosphere, i.e., the sources and the sinks of COS, as well as vertical structures due to atmospheric transport. Furthermore, these stratospheric observations could be used to estimate the stratospheric lifetime of COS. These findings will improve our understanding of the budget and the variabilities of COS in the stratosphere, and advance the use of remote sensing observations of COS from satellite and ground-based spectrometers to study the global cycle of COS.

How to cite: Zanchetta, A., van Heuven, S., Ma, J., Krol, M., and Chen, H.: Stratospheric observations of carbonyl sulfide using AirCore and LISA, EGU General Assembly 2024, Vienna, Austria, 14–19 Apr 2024, EGU24-20419, https://doi.org/10.5194/egusphere-egu24-20419, 2024.

EGU24-21410 | ECS | Posters on site | BG2.2

Characterization of the isotopic signature in methane from several biogenicsources in the central Amazon 

Santiago Botía, Shujiro Komiya, Sam P. Jones, Ingrid Chanca, Viviana Horna, Gisela Dajti, Getachew A. Adnew, Sipko Bulthuis, Jochen Schöngart, Maria Teresa Fernandez Piedade, Florian Wittmann, Daniel Magnabosco Marra, Michael Rothe, Heiko Mossen, Armin Jordan, Thomas Röckmann, Jost Lavric, Carlos Sierra, Susan Trumbore, and Hella van Asperen

The decreasing global trend in 𝛿13𝐶 − 𝐶𝐻4 suggests that rising biogenic sources of methane are a plausible explanation for the current methane atmospheric growth rate. Furthermore, tropical wetlands represent one of the largest sources of uncertainty in the global methane budget and the Amazon basin plays a crucial role in this context as approximately 20% of its area is annually flooded. However, the availability of methane isotopic composition data for tropical wetlands is scarce, undermining our understanding of these tropical sources.

In this study, we present results from two sampling campaigns during the dry season, one in September 2019 and the other in August 2022. During each campaign, we collected air samples at different locations within the area around the Amazon Tall Tower Observatory (ATTO), such as in a black-water seasonally flooded forest (i.e. igapó), in an upland swampy valley (i.e. baixio), at the Uatumã black-water river and on the 80-m tower located on the upland terra-firme forest at the ATTO site. Air samples were collected with pressurized glass flasks and pre-evacuated vials and were analyzed for the isotopic composition of methane (𝛿13𝐶 and 𝛿𝐷 ) with gas source isotope ratio mass spectrometer. We estimated isotopic source signatures of CH4 emissions from the four different sites using the intercept of an orthogonal fit in a Keeling plot.

Relative to the Amazon atmospheric background value of -59 ‰ per mill (Beck et al., 2012), our isotopic source signatures are more depleted in 𝛿13𝐶 ranging from -60 ‰ to -68 ‰, which confirms -as expected- a strong wetland-related biogenic source. Within this range, methane source signatures from areas near the Uatumã river (-68 ‰) and a periodically flooded valley (representing small streams of the region) have more depleted signatures (- 66 ‰). Using this range of source 𝛿13𝐶 signatures we explore the possibility of identifying different biogenic sources at the Tower based on continuous measurements (in-situ) of

𝛿13𝐶 − 𝐶𝐻4 and a Lagrangian atmospheric transport model to obtain the isotopic background (i.e. the isotopic signature of the air masses before entering the continent). Our results contribute valuable insights into the methane isotopic signature for different ecosystem types in central Amazonia, which could serve as a reference for measurement-based source attribution studies as well as a based on measurements and also for atmospheric transport modeling estimates.

How to cite: Botía, S., Komiya, S., Jones, S. P., Chanca, I., Horna, V., Dajti, G., Adnew, G. A., Bulthuis, S., Schöngart, J., Fernandez Piedade, M. T., Wittmann, F., Marra, D. M., Rothe, M., Mossen, H., Jordan, A., Röckmann, T., Lavric, J., Sierra, C., Trumbore, S., and van Asperen, H.: Characterization of the isotopic signature in methane from several biogenicsources in the central Amazon, EGU General Assembly 2024, Vienna, Austria, 14–19 Apr 2024, EGU24-21410, https://doi.org/10.5194/egusphere-egu24-21410, 2024.

EGU24-3149 | ECS | PICO | AS3.35

Long-term observations of halogen oxides in the Arctic: project overview and first results 

Bianca Lauster, Sebastian Donner, Udo Frieß, Ulrich Platt, Lucas Reischmann, William Simpson, Steffen Ziegler, and Thomas Wagner

Halogen chemistry is a central element of tropospheric ozone depletion events (ODEs) during polar spring. However, key processes such as source mechanisms of reactive halogen species, their transport, and interhalogen interactions are still not fully understood. Further, a quickly changing Arctic climate is expected to have a strong impact on halogen activation and ODEs, but more research is needed to make meaningful predictions about these changes.

We deployed a Long-Path Differential Optical Absorption Spectroscopy (LP-DOAS) instrument in Utqiagvik (formerly Barrow), Alaska, in December 2023. The instrument was originally purpose-built for its previous deployment at the German research station Neumayer, Antarctica, where it operated successfully for more than two years (Nasse, 2019). In the Arctic, seasonal atmospheric transport and the township’s proximity to the observation site will lead to a larger anthropogenic influence by air pollution. Also, the different climatic conditions are likely to lead to further insights into the complex interactions between halogens and other trace gases, such as NO2.

To improve the data quality, the instrumental set-up was extensively tested and optimised accordingly using the knowledge gained from the previous campaign in Antarctica. An overview of the instrument characteristics as well as the project outline will be presented. Moreover, first results of the LP-DOAS data will be shown focusing on data quality and data analysis.

How to cite: Lauster, B., Donner, S., Frieß, U., Platt, U., Reischmann, L., Simpson, W., Ziegler, S., and Wagner, T.: Long-term observations of halogen oxides in the Arctic: project overview and first results, EGU General Assembly 2024, Vienna, Austria, 14–19 Apr 2024, EGU24-3149, https://doi.org/10.5194/egusphere-egu24-3149, 2024.

EGU24-4642 | ECS | PICO | AS3.35

Development of analytical method to measure halogenated volatile organic compounds in the Amazon rainforest 

Christoph Hartmann, Joseph Byron, Giovanni Pugliese, Jos Lelieveld, and Jonathan Williams

Halogenated volatile organic compounds (XVOCs) are volatile hydrocarbons that have at least one halogen atom. These substances are of global importance because their relatively long atmospheric lifetimes enable transport of halogen atoms to the stratosphere leading to stratospheric ozone depletion. Since the regulation of anthropogenic XVOC emissions through the Montreal Protocol and subsequent amendments, the importance of naturally formed XVOCs has been increasing. Chloromethane (CH3Cl), for example, represents the largest natural source of chlorine in the stratosphere, currently contributing to approximately 16% of stratospheric ozone depletion, with plants suggested to be its major source. Other XVOCs like Chloroform (CHCl3) can influence atmospheric chemistry more on a local scale due to their shorter atmospheric lifetimes.

In this work, we present the implementation of an instrumentational setup for long-term in-situ XVOC monitoring at the Amazon Tall Tower Observatory (ATTO) site. The 325 m tall tower, located in the pristine Amazon rainforest (circa 150 km NE of Manaus, Brazil), enables measurements of natural XVOC emissions almost free of anthropogenic influence due to its remote location.

The analytical setup consists of the tower inlet system and a Multi-Capillary Column Trapping System (MCCTS) coupled to GC-MS. Here we show several days of preliminary data for methyl chloride, isoprene and several CFC species as a proof of concept. Furthermore, we examine the applicability of simultaneous CFC measurements as a “natural internal standard” for the correction of systematic errors like MS sensitivity changes.

The presented analytical method is able to provide data in form of atmospheric mixing ratios of the desired XVOC compounds at four different heights (ground level, 80 m, 150 m and 320 m) with a time resolution of approximately two hours per height. It has the potential to open up new opportunities to better quantify the XVOC net production and consumption of the Amazon Basin ecosystem and to understand the underlying processes, especially with respect to future ecosystem transformations due to climate and land use changes.

How to cite: Hartmann, C., Byron, J., Pugliese, G., Lelieveld, J., and Williams, J.: Development of analytical method to measure halogenated volatile organic compounds in the Amazon rainforest, EGU General Assembly 2024, Vienna, Austria, 14–19 Apr 2024, EGU24-4642, https://doi.org/10.5194/egusphere-egu24-4642, 2024.

EGU24-5922 | PICO | AS3.35

Surface snow bromide and nitrate at Eureka, Canada in early spring and implications for polar boundary layer chemistry 

Xin Yang, Kimberly Strong, Alison Criscitiello, Marta Santos-Garcia, Kristof Bognar, Xiaoyi Zhao, Pierre Fogal, Kaley Walker, Sara Morris, and Peter Effertz

This study explores the role of snowpack in polar boundary layer chemistry, especially as a direct source of reactive bromine (BrOX=BrO+Br) and nitrogen (NOX=NO+NO2) in the Arctic springtime. Surface snow samples were collected daily from a Canadian high Arctic location at Eureka, Nunavut (80°N, 86°W) from the end of February to the end of March in 2018 and 2019. The snow was sampled at several sites representing distinct environments: sea ice, inland close to sea level, and a hilltop ~600 m above sea level.  At all sites, snow sodium and chloride concentrations increase by almost tenfold from the top 0.2 cm down to a depth of ~1.5 cm. Surface snow bromide at sea level is significantly enriched, indicating a net sink of atmospheric bromine. Moreover, surface snow bromide at sea level has an increasing trend over the measurement period, with mean slopes of 0.024 mM d-1 in the 0-0.2 cm layer and 0.016 mM d-1 in the 0.2-0.5 cm layer. Surface snow nitrate at sea level also shows a significant increasing trend, with mean slopes of 0.27, 0.20, and 0.07 mM d-1 in the top 0.2 cm, 0.2-0.5 cm, and 0.5-1.5 cm layers, respectively. Using these trends, an integrated net deposition flux of bromide of (1.01±0.48)×107 molecules cm-2 s-1 and an integrated net deposition flux of nitrate of (2.6±0.37)×108 molecules cm-2 s-1 were derived. In addition, the surface snow nitrate and bromide at inland sites were found to be significantly correlated (R=0.48-0.76) with the [NO3-]/[Br-] ratio of 4-7 indicating a possible acceleration effect of reactive bromine in atmospheric NOX-to-nitrate conversion. This is the first time such an effect has been seen in snow chemistry data obtained with a sampling frequency as short as one day.

BrO partial column (0-4 km) data measured by MAX-DOAS show a decreasing trend in March 2019, which agrees with the derived surface snow bromide deposition flux. This indicates that bromine in the Eureka atmosphere and surface snow did not reach a photochemical equilibrium state and that the photochemical release flux of reactive bromine from snow must be a weak process and smaller than the derived bromide deposition flux of ~1×10⁷ molecules cm-2 s-1.

How to cite: Yang, X., Strong, K., Criscitiello, A., Santos-Garcia, M., Bognar, K., Zhao, X., Fogal, P., Walker, K., Morris, S., and Effertz, P.: Surface snow bromide and nitrate at Eureka, Canada in early spring and implications for polar boundary layer chemistry, EGU General Assembly 2024, Vienna, Austria, 14–19 Apr 2024, EGU24-5922, https://doi.org/10.5194/egusphere-egu24-5922, 2024.

EGU24-8488 | ECS | PICO | AS3.35

Global environment impacts of enhanced chlorine emissions for methane removal through chemistry-climate interactions 

Daphne Meidan, Qinyi Li, Peter Hess, Juan A. Añel, Carlos A. Cuevas, Scott Doney, Rafael P. Fernandez, Maarten van Herpen, Lena Höglund-Isaksson, Matthew S. Johnson, Douglas E. Kinnison, Jean-François Lamarque, Thomas Röckmann, Natalie M. Mahowald, and Alfonso Saiz-Lopez

Atmospheric methane is a potent greenhouse gas that is photochemically active. The addition of chlorine to the atmosphere has been proposed to mitigate global warming through methane reduction by increasing its chemical loss. However, the potential environmental impacts of such climate mitigation remain unexplored. We explore the possible effects of increasing reactive chlorine emissions on the methane budget, atmospheric composition and radiative forcing. Due to non-linear chemistry we found that achieving effective methane reduction require a minimum 3-fold increase in chlorine atoms compared to present-day levels. Our highest scenario, 50-fold present-day chlorine levels, led to a reduction of the surface temperature by 0.6°C in the year 2050. Beyond the direct effects on methane and temperature, our results show significant alterations in other climate forcers, particularly a large decrease in tropospheric ozone. This translates into a reduction in radiative forcing of a similar magnitude as of the methane removed. Additionally, the Antarctic stratosphere ozone burden during September and October was reduced by up to 40% with the highest chlorine addition. Consequently, the implementation of such strategies requires careful consideration of various factors, including the quantity and method of chlorine addition, as well as potential environmental impacts on air quality and ocean acidity. 

How to cite: Meidan, D., Li, Q., Hess, P., Añel, J. A., Cuevas, C. A., Doney, S., Fernandez, R. P., van Herpen, M., Höglund-Isaksson, L., Johnson, M. S., Kinnison, D. E., Lamarque, J.-F., Röckmann, T., Mahowald, N. M., and Saiz-Lopez, A.: Global environment impacts of enhanced chlorine emissions for methane removal through chemistry-climate interactions, EGU General Assembly 2024, Vienna, Austria, 14–19 Apr 2024, EGU24-8488, https://doi.org/10.5194/egusphere-egu24-8488, 2024.

EGU24-8981 | PICO | AS3.35

Establishment and verification of HFC-134a-gridded emission inventory in China 

Jing Wu, Tong Wang, Shan Ding, Minde An, Zehua Liu, and Lin Peng

Hydrofluorocarbon-134a (HFC-134a) has been experiencing an annual increase in global emissions and atmospheric concentration in recent years, as a major substitute for ozone-depleting substances (ODSs). It has attracted considerable global attention owing to its double environmental effects, including high global warming potential and degradation to form trifluoroacetic acid (TFA). There are discrepancies in the results of existing top-down and bottom-up studies, and existing studies have only estimated the total HFC-134a emissions at national or regional scales. The lack of methods for building and verifying high-spatial-resolution emissions inventories makes it difficult to analyze the spatial distribution of emissions and regional contributions, as well as to identify emission hotspot grids. This study utilized emission factors and an atmospheric dispersion model to establish a methodology for calculating and validating a gridded emission inventory of HFC-134a, and evaluated its dual environmental impacts. This study focused on China and calculated a gridded emission inventory of HFC-134a for the period from 1995 to 2020. The results showed that the banks and emissions of HFC-134a increased from 0.9 kt and 0.1 kt yr-1 in 1995 to 301 kt (273-332 kt) and 48 kt yr-1 (39-56 kt yr-1) in 2020, respectively. Guangdong, Jiangsu, and Shandong provinces in eastern China had the largest cumulative emissions, with a total cumulative emission amount of 98 kt, accounting for 28% of the national emissions, and were also the provinces where the hotspot grids were mainly distributed. The high spatial resolution emission inventories can provide important input data for atmospheric models to simulate transport and transformation processes and assess environmental impacts, thus improving the accuracy of modelling and prediction. In addition, prediction results showed that if HFC-134a was phased out solely in accordance with the emission reduction requirements of the Kigali Amendment, there would still be HFC-134a banks and emissions in China by the year 2060. If emissions were reduced according to the carbon-neutral emission reduction path proposed in this study to meet a high consumption demand for HFC-134a, it was feasible to achieve nearly zero emissions in 2060. Nevertheless, if HFO-1234yf and R-513A were selected as substitutes for HFC-134a, it could result in the production of more TFA through atmospheric degradation, which could have an adverse impact on the aquatic ecosystem and plants. Therefore, it is necessary to actively explore more environmentally friendly alternatives in the future.

How to cite: Wu, J., Wang, T., Ding, S., An, M., Liu, Z., and Peng, L.: Establishment and verification of HFC-134a-gridded emission inventory in China, EGU General Assembly 2024, Vienna, Austria, 14–19 Apr 2024, EGU24-8981, https://doi.org/10.5194/egusphere-egu24-8981, 2024.

EGU24-9794 | PICO | AS3.35

Long-term (2015-2023) observations of tropospheric BrO from two research sites in Antarctica 

Cristina Prados-Roman, Laura Gómez-Martín, Olga Puentedura, Jose Antonio Adame, Mónica Navarro-Comas, Héctor Ochoa, and Margarita Yela

Reactive halogens compounds (i.e., those containing bromine, iodine, chlorine) are known to be key species for the oxidizing capacity of the atmosphere affecting e.g. the lifetime of relevant species such ozone, HOx or NOx and also to have an impact on the climate through interactions with other trace gases and aerosols.
In the polar regions reactive halogens play a particular role since e.g. the auto-catalytic release of bromine from sea ice into the atmosphere may lead to the depletion of tropospheric ozone even below instrumental detection limit and, also, to the deposition of toxic mercury into the polar ecosystem.
In order to infer vertical profiles of relevant tropospheric trace gases, within the framework of several nationally funded projects (including the current GARDENIA project) and in collaboration with the Argentinian National Antarctic Direction, INTA has being performing multi-axis DOAS (MAXDOAS) observations from Antarctica for nearly a decade. One of the gases retrieved through the MAXDOAS technique is bromine monoxide (BrO), a reactive form of bromine.
The work presented herein expands the 1-year study of Prados-Roman et al. (2018) to a 8-year study of the presence of tropospheric BrO at two research sites in Antarctica: Belgano II (77°52' S, 34°7' W) and Marambio (64°13' S, 56°37' W). We will present tropospheric BrO data from the two research sites that expands from 2015 to last year 2023, with values as high as nearly 40 pmol/mol. We will discuss the tropospheric BrO vertical and  latitudinal distribution as well its seasonal evolution throughout all these years.
Note that a similar work but based on observations of iodine monoxide from Antarctica will be presented at EGU2024 in the work of Puentedura et al. (2024).

How to cite: Prados-Roman, C., Gómez-Martín, L., Puentedura, O., Adame, J. A., Navarro-Comas, M., Ochoa, H., and Yela, M.: Long-term (2015-2023) observations of tropospheric BrO from two research sites in Antarctica, EGU General Assembly 2024, Vienna, Austria, 14–19 Apr 2024, EGU24-9794, https://doi.org/10.5194/egusphere-egu24-9794, 2024.

EGU24-10042 | PICO | AS3.35

Tropospheric Iodine monoxide distribution from MAXDOAS observations at three Antarctic stations during the 2015-2023 period. 

Olga Puentedura, Cristina Prados-Roman, Laura Gomez-Martin, Monica Navarro-Comas, Hector Ochoa, and Margarita Yela

The tropospheric distribution of iodine monoxide (IO) in Antarctica remains an open question, as there are some uncertainties concerning, for example, its geographical and vertical distribution. Accurate long-term measurements of IO are important to understand its role in the tropospheric composition of this region, where continuous ground-based observations of IO are very rare and satellite observations have some limitations.


INTA's Antarctic activities include MAXDOAS measurements since 2011 in the framework of several nationally funded projects such as MARACA, VIOLIN, HELADO, VHODCA and currently GARDENIA. The collaboration with the Argentinean National Antarctic Directorate has allowed MAXDOAS measurements at three different locations: Ushuaia (54ºS), located in Tierra del Fuego and at the Antarctic stations of Marambio (64ºS) and Belgrano (78ºS). This paper presents the vertical distribution of tropospheric IO obtained from MAXDOAS measurements at the aforementioned sites over a nine-year period (2015-2023).

Note that a similar work but based on observations of bromine monoxide from Antarctica will be presented here at EGU2024 in the work of Prados-Román et al. (2024).

How to cite: Puentedura, O., Prados-Roman, C., Gomez-Martin, L., Navarro-Comas, M., Ochoa, H., and Yela, M.: Tropospheric Iodine monoxide distribution from MAXDOAS observations at three Antarctic stations during the 2015-2023 period., EGU General Assembly 2024, Vienna, Austria, 14–19 Apr 2024, EGU24-10042, https://doi.org/10.5194/egusphere-egu24-10042, 2024.

EGU24-13726 | ECS | PICO | AS3.35

Mysterious emissions of Halon-2402 in eastern Asia drive the global trend 

Haklim Choi, Luke M. Western, Jooil Kim, Jens Mühle, Rona Thompson, Gawon Lee, Peter K. Salameh, Christina M. Harth, Ray F. Weiss, Matthew Rigby, and Sunyoung Park

1,2-Dibromotetrafluoroethane (C2Br2F4, Halon-2402, H-2402) is used as a fire suppressant due to its stability because it maintains a liquid state at room temperature with a relatively high boiling point. However, H-2402, containing bromine (Br), was identified as a potent ozone-depleting substance, with a destructive capacity six times higher than that of CFC-11. Therefore, under the Montreal Protocol, its production and consumption were phased out globally in 2010, with developed countries starting their phase out in 1994. Russia, the primary producer of H-2402, reportedly ceased production after 2000. For essential uses where no alternatives are available (e.g., military fire extinguishers, oil and gas pipelines), existing or recycled supplies of H-2402 are permitted to be used. Despite H-2402 being under strict international regulation, accurate reporting and statistical information on essential production and consumption by countries remain limited.

This study analyzes the atmospheric mole fractions records of H-2402 measured from 2008 to 2020 at Gosan station, South Korea. While the background mole fractions of H-2402 at Gosan station are gradually decreasing at -0.01 ppt/yr, similar to the global decreasing trend, high pollution cases were continuously observed throughout the entire period. Also, the frequency of occurrence also increased by more than three times in 2020 compared to 2008. This increase in pollution signals, not observed at major Northern Hemisphere background monitoring stations (such as Mace Head, Trinidad Head, and Jungfraujoch), suggests potential regional emissions in eastern Asia. Based on long-term atmospheric observations, and a combined analysis using the Lagrangian particle dispersion model (FLEXPART) and the Bayesian inverse framework (FLEXINVERT+), we have estimated the annual regional emissions in eastern Asia. We present observation-based results on the long-term, regional-scale variability of H-2402 emissions over eastern Asia and their significant contributions from a global perspective.

How to cite: Choi, H., M. Western, L., Kim, J., Mühle, J., Thompson, R., Lee, G., K. Salameh, P., M. Harth, C., F. Weiss, R., Rigby, M., and Park, S.: Mysterious emissions of Halon-2402 in eastern Asia drive the global trend, EGU General Assembly 2024, Vienna, Austria, 14–19 Apr 2024, EGU24-13726, https://doi.org/10.5194/egusphere-egu24-13726, 2024.

EGU24-14827 | ECS | PICO | AS3.35

Vertical and spatial distribution of Chloromethane and Bromomethane from boundary layer to upper troposphere over the Amazon rainforest 

Bianca Krumm, Lisa Ernle, Jos Lelieveld, and Jonathan Williams

Chloromethane (CH3Cl, average ambient mixing ratio 546 ppt (1)) and Bromomethane (CH3Br, average ambient mixing ratio 6.52 ppt (1)) are the most abundant chlorine-, respective bromine-containing atmospheric trace gases from natural origin. Due to their relatively long tropospheric lifetimes (0.9 y; 0.8 y respectively (2)), they are significant carriers of chlorine and bromine into the stratosphere, where they are photolyzed and contribute to the catalytic destruction of ozone. Chloromethane is mainly emitted by tropical vegetation and soils, biomass burning and from oceans. Vegetation and soils have been shown to act as both, source and sink for Chloromethane. Bromomethane has anthropogenic and biogenic sources, including oceans, fumigation, biomass and fossil fuel burning, crops and vegetation. For both methyl halides the known tropospheric sinks, such as reaction with hydroxyl radicals, loss to soils and oceans, and loss to the stratosphere, do not balance the currently known sources. In particular the strengths of the tropical sources still have substantial uncertainties. Due to the Montreal Protocol, anthropogenic emissions of chlorine and bromine compounds are declining. Therefore, biogenic contributions will become an even more important fraction of the global budget in the following decades. A better understanding of the mechanisms behind emission and tropospheric distribution of Chloro- and Bromomethane is essential to improve predictions of future stratospheric ozone levels.

Here, we present the first airborne measurements of Chloromethane and Bromomethane over a tropical forest covering altitudes from the planetary boundary layer to the upper troposphere (300 – 14000 m). The measurements were conducted in Dec 2022 and Jan 2023 over the Amazon Rainforest with the German research aircraft HALO (High Altitude Long Range) in the scope of the CAFE-Brazil campaign. Chloromethane, Bromomethane and other Halocarbons and VOC were measured with Fast GC-MS with a time resolution of 3 minutes. On average elevated levels of both species were found in the boundary layer. Interestingly, the vertical distribution of both compounds also showed a layer with elevated mixing ratios in the upper troposphere, generating a C-shaped profile. The mean Chloromethane mixing ratio reached a maximum of 590 ± 30 ppt between 11 - 12 km altitude, whereas for Bromomethane the maximum appears to be higher than 14 km (where 11.8 ± 1.9 ppt were observed) and thus outside the covered altitude range. The high local convective activity and that of the more distant ITCZ may explain these observations. Surprisingly, high variability of mixing ratios in the boundary layer (300 – 1000 m) with seasonal and regional trends for both methyl halides was observed. Chloromethane mixing ratios between 499 and 686 ppt were observed, in agreement with earlier works which report that the rainforest (including vegetation and soil) can act as source and sink of Chloromethane. Bromomethane mixing ratios in the boundary layer varied between 6.0 to 20.9 ppt, indicating the rainforest to be a source of Bromomethane.


(1) World Meteorological Organization (WMO). Scientific Assessment of Ozone Depletion: 2022. Geneva; 2022. Report No.: 278.

(2) World Meteorological Organization (WMO). Scientific Assessment of Ozone Depletion: 2018. Geneva; 2018. Report No.: 58.

How to cite: Krumm, B., Ernle, L., Lelieveld, J., and Williams, J.: Vertical and spatial distribution of Chloromethane and Bromomethane from boundary layer to upper troposphere over the Amazon rainforest, EGU General Assembly 2024, Vienna, Austria, 14–19 Apr 2024, EGU24-14827, https://doi.org/10.5194/egusphere-egu24-14827, 2024.

EGU24-14976 | ECS | PICO | AS3.35

Halogen activation in volcanic plumes: Studies at Mt Etna (Italy) 2022 and 2023 

Bastien Geil, Nicole Bobrowski, Niklas Karbach, Jonas Kuhn, Alexander Nies, Tjarda Roberts, Peter Hoor, and Thorsten Hoffmann

Halogens in volcanic plumes are important for both volcanic and environmental research. For example, changes in the composition of the volcanic plume can be an indication of changes in the activity of the volcano. Volcanic emissions consist mainly of emitted H2O, CO2 and SO2 and are rapidly mixed with surrounding background atmosphere. Additionally, HF, HCl and HBr are also significant constituents of volcanic emissions.

The halogens are of particular interest for atmospheric chemistry. They are oxidized by mixing with the atmosphere. In this context, BrO should be mentioned as it is one of the oxidation products and like SO2, can be measured spectroscopically using remote sensing technique and therefore making it nearly ideal for surveillance of volcanoes. However only, if the oxidation process is understood, the composition of the volcanic plume at the emission site can be traced and thus possibly the changes in volcanic activity can be understood.

Furthermore, these results are essential for the improvement of the atmospheric impact of volcanic halogens.

Currently, several methods are used to detect the various halogen compounds. Remote sensing methods exist for only a few (in general BrO, OClO, HCl, HF). We use in-situ sampling methods such as cis-Stilbene coated syringe filter and aqueous alkaline traps to collect reactive and total halogen species, respectively.

In this presentation, we will show quantitative results of samples taken in July 2022, June 2023 and in August 2023 for Cl2, Br2, BrCl, total bromine and sulfur from measurements of the Bocca Nuova and South East crater plume, Mt. Etna, Italy using UAV based in situ measurements in various distances to those emission sources. The results confirm the increase of reactive bromine and show for the first time the differentiation into Cl2, Br2, BrCl and total bromine and sulfur. Also BrO/SO2 values analyzed from DOAS measurements taken further downwind during the campaign will be presented.

How to cite: Geil, B., Bobrowski, N., Karbach, N., Kuhn, J., Nies, A., Roberts, T., Hoor, P., and Hoffmann, T.: Halogen activation in volcanic plumes: Studies at Mt Etna (Italy) 2022 and 2023, EGU General Assembly 2024, Vienna, Austria, 14–19 Apr 2024, EGU24-14976, https://doi.org/10.5194/egusphere-egu24-14976, 2024.

EGU24-16447 | PICO | AS3.35

Assessment of the potential of high temperature halogen chemistry in volcanic plumes for the oxidation of mercury 

Tjarda Roberts, Alexander Nies, Jonas Kuhn, Bastien Geil, Luca Terray, and Jeroen Sonke

Volcanoes contribute as a natural source to the global emission of mercury into the atmosphere. The emission of mercury takes place mainly in the gas phase, predominately as elemental mercury. But, several observations show different degrees of mercury oxidation in early-stage volcanic plumes. During the first seconds of volcanic plume evolution, hot magmatic gases mix with the atmosphere and the in-mixture of atmospheric oxygen triggers fast oxidation processes. These change the chemical composition of the volcanic plume drastically and lead to the conversion of hydrogen halides (e.g. hydrogen bromide and hydrogen chloride) into reactive halogen species. These reactive halogen species are well known to interact with mercury and promote the oxidation of elemental mercury towards divalent gaseous mercury.

We present model studies investigating the first seconds of the evolution of a volcanic plume assessing the degree of mercury oxidation through reactive halogen chemistry. We utilize a new chemical box model that simulates chemical kinetics alongside cooling and dilution of the plume. The model is based on a chemical combustion mechanism coupled to an atmospheric chemistry mechanism, including sub-mechanisms for reactive halogens and mercury.  It shows that high-temperature halogen chemistry can potentially cause an oxidation of mercury in the percent range depending on emission temperature and mixing scenario. We compare these model calculations to mercury speciation measurements performed in near-source plumes at Mt Etna and Vulcano island in August/September 2023, where we find a relative abundance of divalent mercury of 5% and 37%, respectively. As well as showing evidence for rapid mercury oxidation, the field-observations at Vulcano indicate the potential for subsequent plume processes to cause mercury reduction.

Model simulations in combination with field-measurements illustrate a complex behavior of volcanic mercury and halogens going from the hot emission to the cooled plume.

How to cite: Roberts, T., Nies, A., Kuhn, J., Geil, B., Terray, L., and Sonke, J.: Assessment of the potential of high temperature halogen chemistry in volcanic plumes for the oxidation of mercury, EGU General Assembly 2024, Vienna, Austria, 14–19 Apr 2024, EGU24-16447, https://doi.org/10.5194/egusphere-egu24-16447, 2024.

EGU24-220 | Posters on site | AS3.36 | Highlight

What is polluting Delhi’s air? A quantitative review from 1990 to 2022 

Sarath Guttikunda, Sai Krishna Dammalapati, Gautam Pradhan, and Puja Jawahar

“How bad is Delhi’s air quality?” and “What are the main sources of Delhi’s air pollution problem?” are perennial questions in India, despite Delhi being the most studied city. Delhi’s air pollution peaks during the winter months starting with Diwali and post-harvest agricultural waste burning in late October and early November and deteriorates further with lower surface temperatures resulting in an increase in demand for space heating. The pollution levels are the lowest during the monsoon months of July and August, but not negligible. This cyclical nature also overlaps with the overall interest in the topic of air pollution and efforts to address the issue, peaking at the start of the winter pollution episodes, with the most the media coverage (based on the number of articles published), public interest (based on social media activity and google search trends), and political will (based on the number of political statements made). This review of Delhi’s air quality from 1990 to 2022 from data, sectoral, judicial, and institutional perspectives is published as an open access data resource and covers databases and story lines on (a) geography and meteorology (b) changes in ambient air quality (as PM2.5 concentrations) using information from ground measurements, reanalysis fields, and satellite retrievals (c) source apportionment studies (d) sectoral history of road transport, agricultural waste burning, residential (cooking and heating) emissions, open waste burning, construction sector (including brick kilns), road dust, power generation and demand, and diwali fireworks and (e) judicial and institutional engagement. All the data resources collated for this review are accessible @ https://www.urbanemissions.info

How to cite: Guttikunda, S., Dammalapati, S. K., Pradhan, G., and Jawahar, P.: What is polluting Delhi’s air? A quantitative review from 1990 to 2022, EGU General Assembly 2024, Vienna, Austria, 14–19 Apr 2024, EGU24-220, https://doi.org/10.5194/egusphere-egu24-220, 2024.

EGU24-465 | Orals | AS3.36

Deterioration of Air Quality in Delhi due to Crop Residue Burning in the Agricultural State of North-Western India 

Pallavi Saxena, Saurabh Sonwani, Anju Srivastava, and Madhavi Jain

Crop residue burning (CRB) over Northern India is an alarming issue and leads to human health effects. The present study aims to study the impact of PM10, PM2.5, NO2 and SO2, emitted during CRB activities in the agricultural state of North-western India i.e. Haryana on the air quality of Delhi. The transition from pre-burning to burning period, in both rabi and kharif seasons, shows considerable increase in pollutant concentrations. PM10 and PM2.5 concentrations exceeded NAAQS limits by 2–3 times, while NO2 and SO2 stayed within the limits. MODIS fire observations used to estimate CRB fire counts (confidence >80%) shows that rabi (burning period) fires in Haryana are ~3 times higher and more intense than in kharif. Furthermore, backward trajectories shows air mass movement from Haryana, Punjab and Pakistan. Thus, pollutants emitted reach Delhi via air masses, deteriorating its air quality. Meteorological conditions influence pollutant concentrations during both seasons. Frequent dust storms in rabi, and Dusshera and Diwali firework celebrations in kharif season exacerbate air pollution. In rabi, PM10 and PM2.5 have a significant negative association with (relative humidity) RH and positive association with (air temperature) AT. High AT during pre-monsoon, accompanied by low RH, loosens up soil particles and they can easily disperse. Stronger winds in rabi season promote NO2 and SO2 dispersion. In kharif, lower AT, higher RH and slower winds exist. Both PM10 and PM2.5 have a negative association with AT and (wind speed) WS. With lower temperature and slower winds during winter, pollutants are trapped within the boundary layer and are unable to disperse. As expected, NO2 has a significant negative association with AT in Haryana. However, in case of Delhi, the association is significant but positive, and could be due to the odd-even scheme imposed by the Delhi government. Strong initiatives are needed to mitigate the ill-effects of CRB activities over the region, in both rabi and kharif season. Large-scale farmer awareness camps and the use of sustainable CRB management practices are suggested.

How to cite: Saxena, P., Sonwani, S., Srivastava, A., and Jain, M.: Deterioration of Air Quality in Delhi due to Crop Residue Burning in the Agricultural State of North-Western India, EGU General Assembly 2024, Vienna, Austria, 14–19 Apr 2024, EGU24-465, https://doi.org/10.5194/egusphere-egu24-465, 2024.

Air pollution is an important environmental issue prevailing in the urban landscape of Delhi, the capital city of India which is the 2nd most populous city and most polluted city in the world. The air pollution and land surface temperature (LST) are the most prominent environmental issues in the urban areas. However, there is no comprehensive analysis of the relationship between LST and air pollutants. The objective of the present study is to investigate: (a) the spatio-temporal distribution of LST (diurnal) and the criteria pollutants of carbon monoxide (CO), nitrogen dioxide (NO2), ozone (O3), particle matter (PM2.5, PM10) and Sulphur dioxide (SO2) and (b) the relationship between LST and air pollutants concentration during different seasons in Delhi and its surroundings during 2003–2023. In this study, Landsat satellite data (ETM and OLI) and MODIS satellite data are used to extract the LST for the period 2003-2023. The satellite-based air pollution data is obtained from TROPOMI and MODIS, and ground-based data are obtained from the Central Pollution Control Board (CPCB) monitoring station. Our result reveals that in the spatio-temporal analysis, the LST has increased significantly while the air pollution increased (decreased) over the period. It is observed that there is a strong relationship between LST and air pollutants during winter among all seasons. SO2 has a significant correlation with LST (R2 = 0.74). Additionally, PM2.5 and PM10 are identified as the main air pollutants affecting LST variations during the winter season (R2 = 0.59 to 0.64). Our results conclude that variation in the LST is not only dependent on its surface properties but also on the associated meteorological conditions. The findings of this study have significant implications for future scientific research as this study provides the integration of effective mitigation strategies to combat the challenges of increasing LST and air pollution in urban areas.

How to cite: Nahid, S. and Kumar, R. P.: Spatio-temporal distribution of air pollutants and their relationship with land surface temperature over Delhi and its surroundings, India
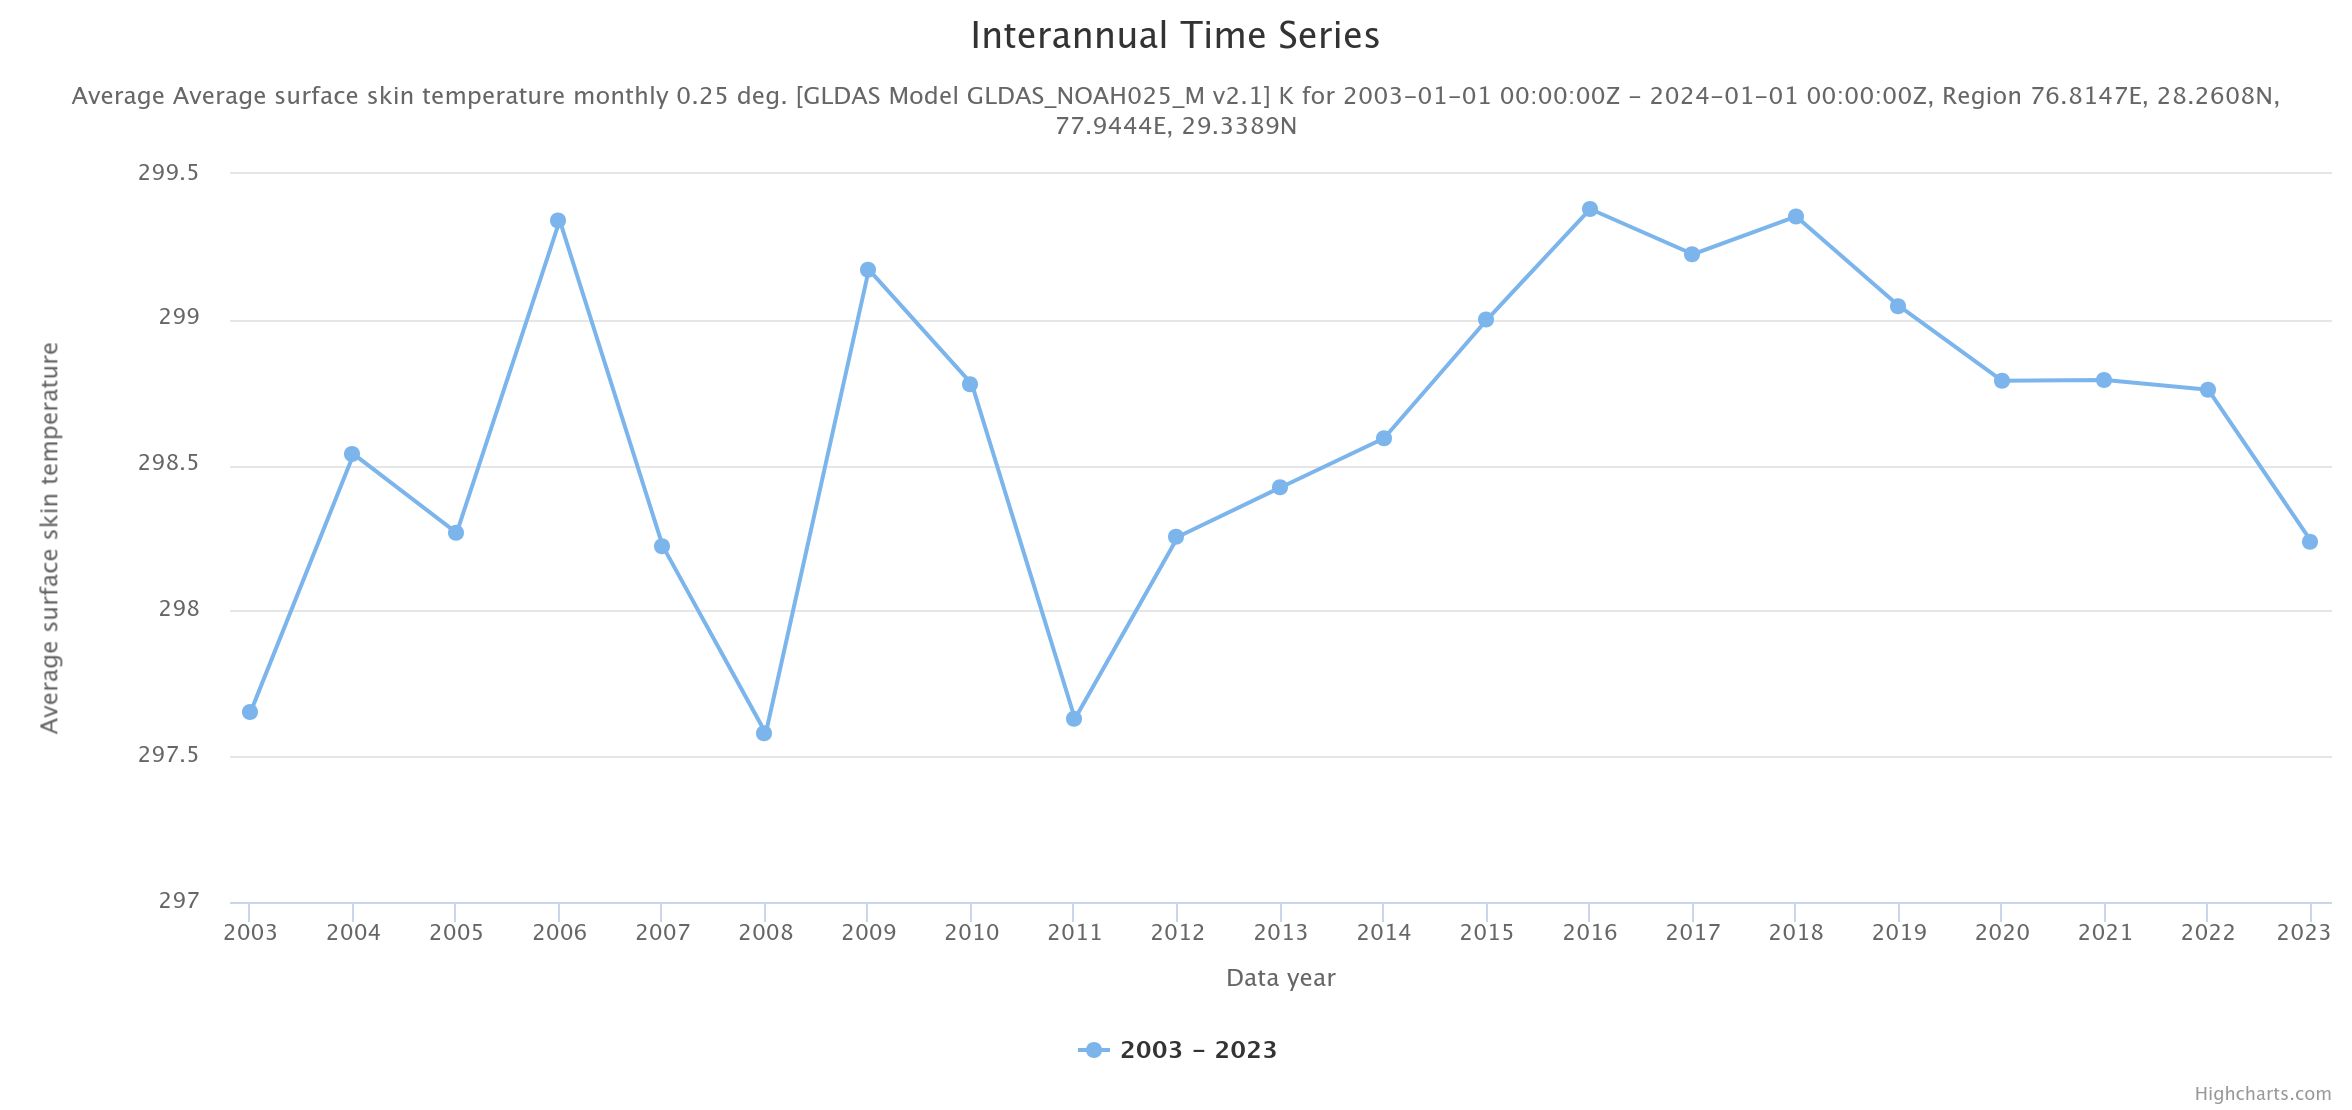
, EGU General Assembly 2024, Vienna, Austria, 14–19 Apr 2024, EGU24-776, https://doi.org/10.5194/egusphere-egu24-776, 2024.

Precise pollution control and source tracking have been commonly used due to the development of portable on-line sampling instruments. This study investigated the spatial distribution characteristics of pollution during a local pollution period in the Shuangliu district of Chengdu, China. The persistent particle size distributions and ozone concentrations in the Shuangliu district were recorded using a mobile observation platform. The three-dimensional spatial and temporal changes in the aerosol size distributions and ozone concentrations were obtained by means of a portable optical particle profiler (POPS), a PO3M ozone detector, a hand-held meteorological station, and a Laser wind lidar. The results indicate that during polluted episodes, the daily particle number concentration (PNC) values ranged from 7,967.63 to 16,342.31 #·cm-3, compared to 4,290.87 to 11,039.61 #·cm-3 during clean episodes. The results revealed that human activities and meteorological conditions were the primary causes of local pollution. Regarding regional transport, 80% of the total particle pollution was likely to occur under the influence of northerly winds and came from the industrial emissions and human activities in upwind areas. Indeed, there are certain relationships between the planetary boundary layer height, the vertical wind direction and speed, and between the planetary boundary layer height and the number concentrations of different particle size ranges. According to the backward trajectory analysis, the industrial cities in northeastern Chengdu, Chongqing Province, were identified as the major regional sources of particle emissions in winter. Our results provide a scientific basis for the control of particulate matter and ozone in the Shuangliu district, which enables targeted pollution prevention and control measures by the relevant departments.

How to cite: Hu, H. and Wu, H.: Mobile observations of air pollution characteristics and source tracking : the case of Megacity Chengdu, China, EGU General Assembly 2024, Vienna, Austria, 14–19 Apr 2024, EGU24-2620, https://doi.org/10.5194/egusphere-egu24-2620, 2024.

EGU24-3921 | Posters on site | AS3.36

Organic Pollutants and Chemicals of Emerging Concern at the atmospheric background stations of the German Environment Agency Air Monitoring Network 

Julian Rüdiger, Franziska Bachmeier, Cedric Couret, Michael Elsasser, and Bryan Hellack

Within the framework of multiple international conventions, Germany like other state parties is committed to monitor the air quality in the atmospheric background. Therefore, atmospheric measurements are realized by the German Environment Agency (Umweltbundesamt - UBA) with its network of 7 remote measurement stations throughout the rural background of Germany. These stations are operated by personnel and contribute data on pollutant deposition and transboundary long-range transport to the following monitoring programs: Global Atmosphere Watch (GAW), European Monitoring and Evaluation Program (EMEP), Convention on the Protection of the Marine Environment of the Baltic Sea Area (HELCOM), Convention for the Protection of the Marine Environment of the North-East Atlantic (OSPAR) and as well as to the EU commission within the directive on ambient air quality and cleaner air for Europe (2008/50/EC).

Some pollutants are measured continuously since the late 1960s, while other pollutants especially metals and semi-metals are monitored since the early 1990s. Organic pollutants such as PAHs and POPs are regularly monitored as well starting in the mid-1990s in precipitation and since the mid-2000s also in air and the aerosol phase. Therefore, the UBA air monitoring network contributes to the supervision of the Stockholm convention and the respective EU Regulation (2019/1021) on persistent organic pollutants.

Recently further chemicals of emerging concern were included to the list of substances that are measured at the UBA air monitoring stations. Within a three-year project period, fluorinated organics such as per- and polyfluorinated substances (PFAS) and a range of current used pesticides (CUP) will be measured for the next two years in precipitation and air. This work presents the history of PAH and POP measurements at the UBA air monitoring network and the novel compounds of interest with the applied techniques for their detection and monitoring over the coming years.

How to cite: Rüdiger, J., Bachmeier, F., Couret, C., Elsasser, M., and Hellack, B.: Organic Pollutants and Chemicals of Emerging Concern at the atmospheric background stations of the German Environment Agency Air Monitoring Network, EGU General Assembly 2024, Vienna, Austria, 14–19 Apr 2024, EGU24-3921, https://doi.org/10.5194/egusphere-egu24-3921, 2024.

Heatwaves (HWs) paired with higher ozone (O3) concentration at the surface level pose a serious threat to human health. Their combined modulation of synoptic patterns and urbanization remains unclear. Using 5 years of summertime temperature and O3 concentration observation in Beijing, this study explored potential drivers of compound HWs and O3 pollution events and their public health effects. Three favorable synoptic weather patterns were identified to dominate the compound HWs and O3 pollution events. These weather pat- terns contributing to enhance those conditions are characterized by sinking air motion, low boundary layer height, and high temperatures. Under the synergy of HWs and O3 pollution, the mortality risk from all non-accidental causes increased by approximately 12.31 % (95 % confidence interval: 4.66 %, 20.81 %). Urbanization caused a higher risk of HWs and O3 in urban areas than at rural stations. Particularly, due to O3 depletion caused by NO titration at traffic and urban stations, the health risks related to O3 pollution in different regions are charac- terized as follows: suburban stations > urban stations > rural stations > traffic stations. In general, favorable synoptic patterns and urbanization enhanced the health risk of these compound events in Beijing by 33.09 % and 18.95 %, respectively. Our findings provide robust evidence and implications for forecasting compound HWs and O3 pollution events and their health risks in Beijing or in other urban areas all over the world that have high concentrations of O3 and high-density populations.

How to cite: Zong, L.: Joint occurrence of heatwaves and ozone pollution and increased health risks in Beijing, China: role of synoptic weather pattern and urbanization , EGU General Assembly 2024, Vienna, Austria, 14–19 Apr 2024, EGU24-4393, https://doi.org/10.5194/egusphere-egu24-4393, 2024.

EGU24-5335 | ECS | Posters on site | AS3.36

Inverse Modeling of Air Pollutant Emissions Using Drone-based Air Monitoring Data 

Hui-Young Yun, Seung-Hee Han, Kyung-Hui Wang, Dong-Geon Kim, Peel-Soo Jeong, Eun-Seong Son, Hyeun-Soo Kim, and A-Leum Kim

Landfill gas, a major contributor to air pollution, results from anaerobic microbial decomposition of organic matter in waste. Classified as a greenhouse gas, it comprises over 99% methane and carbon dioxide, contributing to approximately 3–4% of annual anthropogenic methane emissions. Landfills also release particulate matter (PM), carbon dioxide, non-methane volatile organic compounds, nitrous oxide, nitrogen oxides, odorous substances, and carbon monoxide.

In Korea, landfill emissions calculations primarily measure surface emissions using a flux chamber directly on the landfill surface or employ the First Order Decay (FOD) method. However, the method of measuring surface emission cannot simultaneously measure emissions that occur irregularly over a large area, and the FOD method also has the problem of making it difficult to accurately calculate the landfill gas generation rate constant (k) that reflects landfill characteristics. To address these issues, a supplementary approach to emission estimation is being introduced. This involves measuring microclimatic conditions and air pollutant concentrations within and around landfills, coupled with the application of atmospheric dispersion modeling techniques. This method, known as inverse modeling, aims to estimate emissions by accounting for irregularly occurring emissions over extensive areas.

This study aims to employ drones to measure air pollutants concentrations occurring irregularly over extensive areas and subsequently perform inverse modeling using atmospheric dispersion modeling. In terms of measurement method, drones have the advantage of being able to obtain data on air pollutants in a short period of time at altitudes and wide ranges that other equipment cannot access. By using Drone-based Air Monitoring, particulate matter, carbon dioxide, methane, Nitrogen Dioxide, Various measurements were made, including volatile organic compound, ozone, and water vapor concentrations. Utilizing the data collected through these measurements, inverse modeling with the CALPUFF model is intended. The CALPUFF model can represent changes in the wind field over time and space through the movement of the puff, and can relatively accurately implement the same unsteady state as the real thing. By using this to calculate emissions by performing ineverse modeling, it is expected that the accuracy of calculating methane gas and fine dust emissions from landfills will be improved.


Acknowledgments

This research was supported by Particulate Matter Management Specialized Graduate Program through the Korea Environmental Industry & Technology Institute (KEITI) funded by the Ministry of Environment (MOE)


How to cite: Yun, H.-Y., Han, S.-H., Wang, K.-H., Kim, D.-G., Jeong, P.-S., Son, E.-S., Kim, H.-S., and Kim, A.-L.: Inverse Modeling of Air Pollutant Emissions Using Drone-based Air Monitoring Data, EGU General Assembly 2024, Vienna, Austria, 14–19 Apr 2024, EGU24-5335, https://doi.org/10.5194/egusphere-egu24-5335, 2024.

EGU24-5411 | Posters on site | AS3.36 | Highlight

Economic growth and projected effects of air pollution on human health over Europe 

Jonilda Kushta, Elias Giannakis, Angelos Violaris, Niki Paisi, and Jos Lelieveld

In this work we analyze the effects of inter-industry linkages on air pollution and human health associated with the expected growth of economic sectors towards 2030. A combined toolbox consisting of environmentally-extended input-output models, a regional atmospheric chemistry model (WRF-Chem) and a global exposure mortality model (GEMM) is deployed to conduct an economy-wide assessment of air pollution and attributable mortality in the European Union (EU). Preliminary evaluation of the atmospheric model reveals the significance of the accurate representation of residential combustion activities and carbonaceous aerosols, especially under a differential toxicity framework. Direct and indirect air pollution intensities of the economic sectors included in the study exhibit significant differences across EU countries. The highest pollutant intensity per unit of economic output, is created by shipping and reaches more than 20 tonnes/million Euro for NOx. This valus is 4-5 times higher than the respective intensity for industry and power generation. However, industry and power generation lead to the largest (direct and indirect) increases in PM2.5 concentrations in absolute terms. The most affected areas, in terms of surface PM2.4 levels, influenced by substantial effects of the projected industrial growth, are found in Germany and northern Italy. While the greatest impacts of the energy sector’s expansion will occur in central Europe, Finland, Estonia and major urban areas in southern Europe. Subsequently, the mortality burden of air pollution towards 2030 is primarily localized in the central and northern parts of Europe. These integrated analyses can help focus tailored mitigation efforts in sectors with significant (direct and indirect) emission intensities, rather than those with relatively low emission intensities and substantial economic contributions.

How to cite: Kushta, J., Giannakis, E., Violaris, A., Paisi, N., and Lelieveld, J.: Economic growth and projected effects of air pollution on human health over Europe, EGU General Assembly 2024, Vienna, Austria, 14–19 Apr 2024, EGU24-5411, https://doi.org/10.5194/egusphere-egu24-5411, 2024.

EGU24-5952 | ECS | Posters on site | AS3.36

Matching opportunistic column measurements of CO2 with pixel-wise scaled emission tracers from a forward model for the urban area of Thessaloniki – Can we detect strong sources? 

Lena Feld, Pablo Schmid, Frank Hase, Roland Ruhnke, Marios Mermigkas, Dimitrios Balis, and Peter Braesicke

A rapid reduction in greenhouse gas emissions is critical to limit global warming. In order to act effectively, it is important to be able to monitor emissions and their changes over time. A special interest lies in the monitoring of urban areas due to their significant contribution to the amount of global anthropogenic emissions. However, the heterogeneous structure of urban areas makes it difficult to attribute observed changes in atmospheric concentrations of e.g. CO2 to localized emission sources.

Here, we present results from an opportunistic measurement campaign in the framework of the COllaborative Carbon Column Observing Network (COCCON) in Thessaloniki, Greece. During the campaign period in October 2021 and summer 2022, XCO2 amounts were observed with two EM27/SUN FTIR spectrometers located at different places in the city. A total of 20 days of co-observations at different locations were recorded, with differences between the measurement locations of up to 2 ppm.

These observations are compared to regional hindcasts generated with the NWP forward model ICON-ART using emissions from the high resolution ODIAC inventory. The agreement between pairs of observed and simulated XCO2 columns obtained in this way is often limited, while other meteorological quantities are well represented in the model. Assuming that the largest source of the XCO2 discrepancies is originating from the inventory, we fragment the urban area of the inventory into different pixels, simulating the contribution of each individual pixel as a separate tracer within the model. The pixel-wise emitted tracers are scaled after run time to optimize the agreement with the observations. In this linear superposition the re-weighting of tracers imply which pixels need to be assigned with higher emissions than stated by the ODIAC inventory. As expected, the agreement between measured and modeled XCO2 columns can be significantly improved with this method, while regions with potentially high emissions (e.g. the harbor area) receive an upscaling.

This demonstrates that even smaller datasets without strong emission signatures can contain extractable emission information when processed carefully in conjunction with a good meteorological forward model.

How to cite: Feld, L., Schmid, P., Hase, F., Ruhnke, R., Mermigkas, M., Balis, D., and Braesicke, P.: Matching opportunistic column measurements of CO2 with pixel-wise scaled emission tracers from a forward model for the urban area of Thessaloniki – Can we detect strong sources?, EGU General Assembly 2024, Vienna, Austria, 14–19 Apr 2024, EGU24-5952, https://doi.org/10.5194/egusphere-egu24-5952, 2024.

EGU24-6293 | ECS | Orals | AS3.36

Assessing ultrafine particle concentrations in the Rotterdam region using modelling and measurements 

Luka Denk, Astrid M.M. Manders, Janot Tokaya, Antoon Visschedijk, and Alexander Los

Population in urbanized areas is consistently exposed to elevated concentrations of ultrafine particles (UFP). Due to limited UFP measurement data, a modelling approach can help fill the gaps in both spatial and temporal coverage of the observation network. This study utilizes the LOTOS-EUROS model and measurements to characterize UFP concentrations within the urban area of Rotterdam, The Netherlands. Rotterdam is a particularly interesting location as it contains a variety of UFP sources (shipping, industry, traffic, airport).

The LOTOS-EUROS model is extended with the SALSA2 module for particle dynamics. Currently nucleation is not taken into account in LOTOS-EUROS and measurements are used to provide background conditions for the 1x1 km2 resolution model domain. Within the domain, a new UFP emission inventory for this area is used. The model results are compared with measurements obtained from a 1-month summer campaign from the Rijnmond Central Environmental Management Service (DCMR) and from the Ruisdael Observatory. Measurement locations include Veldkersweg (urban background with influence of road and airport) and Nieuwe Maas (urban background, influenced by shipping) and the rural Cabauw observatory.

We will provide a joint analysis of measurements and model results that provides valuable insight in the behaviour of UFP in the Rotterdam region. As expected, both urban locations, Veldkersweg and Nieuwe Maas, exhibit consistently higher PNC compared to the more remote Cabauw observatory. Model results clearly show the large contributions from shipping in the area. Comparison with observations reveal that background values are modelled reasonably well but that the model can currently not represent the higher values of two urban observation stations measuring UFP. Further model development is needed to include nucleation. In addition, more research is needed to quantify the competing effects of coagulation and deposition close to the source, which relates to the questions how emissions as reported in the emission inventory can be used in a model like LOTOS-EUROS, where instant dilution applies.


How to cite: Denk, L., Manders, A. M. M., Tokaya, J., Visschedijk, A., and Los, A.: Assessing ultrafine particle concentrations in the Rotterdam region using modelling and measurements, EGU General Assembly 2024, Vienna, Austria, 14–19 Apr 2024, EGU24-6293, https://doi.org/10.5194/egusphere-egu24-6293, 2024.

EGU24-6448 | ECS | Orals | AS3.36

Enhancing Urban PM2.5 Predictions: An Innovative Machine Learning Approach to Address Data Gaps 

Arunik Baruah, Dimitris Bousiotis, Seny Damayanti, Alessandro Bigi, Grazia Ghermandi, Roy M. Harrison, and Francis D. Pope

PM2.5 (Particulate matter < 2.5 mm in diameter) pollution is a significant environmental and public health concern in Europe. According to the European Environmental Agency (EEA, 2023), 97% of the urban population are exposed to concentrations over the World Health Organization's (WHO) 2021 annual limit of 5 µg m-3. Various models predict PM levels, such as Chemical Transport Models (CTMs) and statistical approaches based on meteorological variables. Machine Learning (ML) tools, particularly tree based alogorithms, outperform linear models due to the non-linear response of atmospheric species to environmental conditions and emissions.

Our research aims to introduce a novel methodology for predicting PM2.5 levels at fine spatial and temporal scales using ML tools. The primary objective is to showcase the methodology's capability in estimating missing PM2.5 measurements in urban areas where direct observations are unavailable. To achieve this, we compiled a hybrid dataset using inputs from an intensive aerosol campaign conducted in the Selly Oak neighbourhood of Birmingham, UK, spanning from April 15th to June 20th, 2023. This campaign focused on a 1×1 km² block, housing approximately 10,000 university students. Four low-cost Optical Particle Counters (OPC-N3, Alphasense, UK) were strategically placed at fixed locations within the study area, measuring particle number size distribution (PNSD) in 24 bins from 0.35 – 40 µm, as well as PM1, PM2.5, and PM10 mass concentrations. An additional four OPC-N3 devices were employed for aerosol mapping through a mobile backpack-based arrangement. Data collection adopted a citizen science approach, collaborating with local businesses and schools for static sensors and engaging university students for the deployment of mobile sensors. All sensors underwent calibration by collocating with research-grade instruments at the Birmingham Air Quality Supersite (BAQS), both before and after the campaign.

For a detailed analysis of PM2.5 distribution along different road segments, the network was divided into 30-meter segments, and the centroid was computed for each segment. Spatially resolved proxy variables of atmospheric emissions were assigned to each centroid, including population data, average traffic count by vehicle, road rank, and the average frequency distribution of vehicle speed. The hybrid dataset also integrated meteorological parameters from BAQS (wind speed, wind direction, atmospheric pressure, relative humidity, atmospheric temperature) and aerosol properties from reference instruments at BAQS.

Three distinct calibration approaches were employed: 1) Standard Random Forest Regression (RF) with an 80-20 train-test split to predict PM2.5 levels based on input features (R2 = 0.85, MBE = -0.01 µg m-3). 2) Sensor Transferability Evaluation: Calibrating the RF on a specific OPC unit and evaluating its performance on an independent OPC (best performance R2 = 0.65, MBE = 0.43 µg m-3). This approach assesses the model's generalization across different sensors. 3) Road Transferability Evaluation: Calibrating the model on one road and evaluating its performance on a different new road (R2 = 0.71, MBE = -1.14 µg m-3). This approach explores the model's ability to generalize across different road types.

This methodology holds significant potential for improving spatial resolution beyond regulatory monitoring infrastructure, refining air quality predictions, and enhancing exposure assessments critical for investigating health impacts.


How to cite: Baruah, A., Bousiotis, D., Damayanti, S., Bigi, A., Ghermandi, G., Harrison, R. M., and Pope, F. D.: Enhancing Urban PM2.5 Predictions: An Innovative Machine Learning Approach to Address Data Gaps, EGU General Assembly 2024, Vienna, Austria, 14–19 Apr 2024, EGU24-6448, https://doi.org/10.5194/egusphere-egu24-6448, 2024.

EGU24-6478 | ECS | Posters on site | AS3.36 | Highlight

Assessment of NO2 and PM2.5 exposure with air quality sensors 

Miriam Chacon-Mateos, Erika Remy, Uta Liebers, Christian Witt, Frank Heimann, and Ulrich Vogt

According to the World Health Organization, poor air quality contributes heavily to the Global Burden of Disease, causing more than 6.7 million deaths each year due to both ambient air pollution and household air pollution. With advances in air pollution monitoring technology, evidence on the adverse health effects of air pollution has been increasing. Still, the understanding of personal exposure is limited by the low spatial resolution of fixed outdoor monitoring stations. Low-cost sensors have the potential to enhance personal exposure prediction at scales required for population-based research.

In this study, we carried out a pilot project to evaluate the feasibility of using low-cost sensors at fixed-locations for epidemiological investigations. Stationary sensor systems for NO2 and PM2.5 were custom-built and deployed both in- and outside the homes of individuals diagnosed with asthma or chronic obstructive pulmonary disease (COPD). Measurements were taken for approximately 30 days at each participant’s home. The study was designed to evaluate the performance of the air quality sensors over a longer timeframe, which so far has not been thoroughly studied (Sesé et al. 2023). Participants self-reported symptom data to study the relationship between indoor air quality and health. Participants recorded their daily activities as well, as part of examining the exposure estimates and indoor pollutant sources. To evaluate the exposure misclassification, the potential dose was calculated using the data of an outdoor monitoring station and the indoor sensors, as well as the generic and the activity-specific inhalation rate. Steps completed prior to this analysis include a study on a low-cost dryer for the PM sensor to prevent the overestimation of the mass concentration due to the hygroscopic growth of particles (Chacón-Mateos et al. 2022), and processing of the NO2 data using machine learning to evaluate the uncertainty, reproducibility, reliability, and sensitivity of the sensors. The results of this work highlight the importance of monitoring indoor air quality and activity patterns to avoid exposure misclassification. With the appropriate methodology and a robust calibration, air quality sensors can provide us with useful information and show promise for epidemiological investigations.

References:

Sesé, L.; Gille, T.; Pau, G.; Dessimond, B.; Uzunhan, Y.; Bouvry, D. et al. (2023): Low-cost air quality portable sensors and their potential use in respiratory health. In Int. J. Tuberc. Lung Dis. 27 (11), pp. 803–809. DOI: 10.5588/ijtld.23.0197.

Chacón-Mateos, Miriam; Laquai, Bernd; Vogt, Ulrich; Stubenrauch, Cosima (2022): Evaluation of a low-cost dryer for a low-cost optical particle counter. In Atmos. Meas. Tech. 15 (24), pp. 7395–7410. DOI: 10.5194/amt-15-7395-2022

How to cite: Chacon-Mateos, M., Remy, E., Liebers, U., Witt, C., Heimann, F., and Vogt, U.: Assessment of NO2 and PM2.5 exposure with air quality sensors, EGU General Assembly 2024, Vienna, Austria, 14–19 Apr 2024, EGU24-6478, https://doi.org/10.5194/egusphere-egu24-6478, 2024.

As a hotspot for greenhouse gas emissions, cities also represent a major opportunity for mitigating greenhouse gases including methane. However, city-scale methane emissions are often inadequately resolved in most of existing global/national “bottom-up” inventories, because of coarse-resolution and biased activity data or proxies used for constructing these inventories. The observation-based “top-down” inversion method provides an alternative approach to detect and quantify city-scale methane emissions, but it is often limited by the availability of useful city observations. Here, we construct a city-scale inversion system using a high-resolution (4 km) WRF-GHG transport model for a megacity, Hangzhou, in the densely populated Yangtze River Delta of China. We perform an observing system simulation (OSSE) to assess the ability of different observation systems (including ground-site, mobile, satellite observations, and their combinations) to constrain and resolve methane emissions from Hangzhou. The construction of “true” observations in OSSE accounts for main characteristics of different observations systems, e.g., temporally continuous but spatially sparse ground-site observations, spatially continuous but temporally sparse mobile observations, and coarse-resolution and low-precision satellite column observations. The results show that ground-level observations (including ground sites and mobile observations), though taken within the city, largely reflect signals from up-wind adjacent regions with large methane emission. The small local signals in the sparse ground-level observations have little constraining in the inference city posterior emissions and lead to large uncertainties. Joint inversion of ground and satellite observations with a wider modeling domain leads to a more accurate posterior emission of the targeted city, as it better captures and distinguish the contribution from surrounding regions. This result also underscores the accuracy of model transport for the city-scale emission estimation.

How to cite: Wang, X., Zhang, Y., Wang, R., and Zhao, S.: Quantifying city-scale methane emissions based on ground-site, mobile, and satellite observations: an observing system simulation experiment (OSSE), EGU General Assembly 2024, Vienna, Austria, 14–19 Apr 2024, EGU24-7169, https://doi.org/10.5194/egusphere-egu24-7169, 2024.

EGU24-7420 | ECS | Orals | AS3.36

Estimation of CO2 fluxes in the city of Zurich using the mesoscale atmospheric transport and inversion model ICON-ART-CTDAS  

Nikolai Ponomarev, Michael Steiner, Erik Koene, Lionel Constantin, Pascal Rubli, Stuart Grange, Lukas Emmenegger, and Dominik Brunner

To support the European Green Deal and to assist cities in reaching net-zero emissions, we have developed an urban CO2 emission monitoring system combining a mesoscale atmospheric transport and inversion model with measurements from dense sensor networks. We have set up such a system for the city of Zurich, which includes a comprehensive measurement network and intensive campaigns conducted in the framework of the ICOS Cities project to provide a rich dataset for data assimilation and model validation. The network includes low- and mid-cost CO2 sensors and a tall flux tower. For CO2 data assimilation, we primarily use observations from the 21 mid-cost sensors, in particular the 14 sensors installed on rooftops, as they are easier for the model to reproduce. Additionally, we used measurements from three background sites located outside the city, as well as wind speed and temperature observations from meteorological sensors installed at most of the rooftop sensor locations.

            The atmospheric transport model ICON-ART was set up at a high resolution of about 600 m to resolve the complex topography of the area. The model domain extends about 60 km in the north-south and east-west directions, encompassing the city and all background stations. CO2 background concentrations at the domain boundaries were taken from a separate European-wide simulation, which itself was nested into global inversion-optimized CO2 simulations from the Copernicus Atmospheric Monitoring Service (CAMS). Prior anthropogenic emissions were based on the TNO-GHGco inventory for the European domain and on a composite of three inventories of increasing detail for the high-resolution domain, TNO-GHGco, a Swiss national inventory, and a Zurich city inventory. Another important source and sink of CO2 is the exchange with vegetation, which was calculated online in ICON-ART using the Vegetation Photosynthesis and Respiration Model (VPRM). Based on comparisons with observations, we continuously improved the forward simulations by introducing high-quality land-cover data, emissions from human respiration, and temporal profiles for the heating sector accounting for daily temperatures.

            Anthropogenic emissions and biospheric fluxes (respiration and gross photosynthetic production separately) are inversely estimated by coupling ICON-ART with the “CarbonTracker Data Assimilation Shell” (CTDAS), which employs an ensemble Kalman smoother to optimize a large number of flux scaling factors. Here we present our initial inversion experiments with both synthetic and real observations. The idealized setup with synthetically generated observations was used to optimize the system before applying it to real observations. Fluxes were estimated on a weekly scale at a grid cell level for multiple months between July 2022 and July 2023. The simulations show generally good agreement with the observations, but estimating anthropogenic emissions is challenging due to uncertainties in the biospheric fluxes and background CO2 concentrations. In its current state of development, the combination of measurements and the model allow reliable emission estimations mainly in winter when the regional anthropogenic CO2 signal is at its highest (20 – 50 ppm) and the biospheric signal is at its lowest.

Acknowledgements: ICOS-Cities/PAUL, has received funding from the European Union's H2020 Programme under grant agreement No. 101037319

How to cite: Ponomarev, N., Steiner, M., Koene, E., Constantin, L., Rubli, P., Grange, S., Emmenegger, L., and Brunner, D.: Estimation of CO2 fluxes in the city of Zurich using the mesoscale atmospheric transport and inversion model ICON-ART-CTDAS , EGU General Assembly 2024, Vienna, Austria, 14–19 Apr 2024, EGU24-7420, https://doi.org/10.5194/egusphere-egu24-7420, 2024.

EGU24-7437 | Posters on site | AS3.36 | Highlight

Research on monitoring illegal air pollution using Scanning Lidar System 

Seong-min Kim, Dasom Lee, Jeong-min Park, Gahye Lee, Sangcheol Kim, Youndae Jung, Ilkwon Yang, and Kwanchul Kim

The Scanning Lidar System (SMART MK-II) analyzes light backscattered by particles in the air and calculates information about fine dust mass concentration with distance. fine dust concentration in real time and continuously was observed with a resolution of 30 m within a radius of 5 km using the Scanning Lidar System, and used to analyze air quality around industrial complexes. The observation location was the rooftop of the Tech University of Korea second campus building located in Siheung, Korea (37.32792, 126.6892). The optimal measurement site for the Scanning Lidar System was selected and the surrounding air pollution was observed horizontally by adjusting the height. This is a study to build advanced monitoring system that tracks illegal emission sources, focusing on areas(heat-map) with high concentrations of fine dust. Instead of randomly cracking down on illegally businesses and factories emissions source, the crackdown system was changed to focus on areas with high air quality concentration and high emissions by the advanced air monitoring system. The final goal of this study is to use the Scanning Lidar System visualization program to provide location notification services for areas with high fine dust concentration and suspicious air emission sources. It was used to crack down on illegal air emissions projects and inspect air pollution prevention facilities, and had the effect of reducing health damage caused by fine dust and improving air quality.

Acknowledgement: This research was supported by a grant (2023-MOIS-20024324) of Ministry-Cooperation R&D Program of Disaster-Safety funded by Ministry of Interior and Safety (MOIS, Korea) and Metropolitan Environment Management Office in Gyeonggi-do Province, Korea.

How to cite: Kim, S., Lee, D., Park, J., Lee, G., Kim, S., Jung, Y., Yang, I., and Kim, K.: Research on monitoring illegal air pollution using Scanning Lidar System, EGU General Assembly 2024, Vienna, Austria, 14–19 Apr 2024, EGU24-7437, https://doi.org/10.5194/egusphere-egu24-7437, 2024.

EGU24-7808 | Posters on site | AS3.36 | Highlight

Multiple lines of evidence help identify the sources of Nitrogen and Carbon in particulate matter sampled in the historical center of Naples (Italy) 

Mauro Rubino, Carmina Sirignano, Elena Chianese, Miguel Anguel Hernández-Ceballos, and Angelo Riccio

Attribution of nitrogen (N) and carbon (C) origin in atmospheric particulate matter (PM) is one of the main focuses of scientific research in the field of air pollution. Here we show how using multiple pieces of information from different techniques, including concentrations of major ions (NO3-, NH4+, NO-, SO42-, etc…), concentration and isotopic composition of total N (δ15N) and total C (δ13C), characterization of the meteorology, and using state of the art models of atmospheric circulation (Hysplit) and weather prediction (WRF) help understand the causes of PM change in the atmosphere sampled over the historical town of Naples (Italy).

PM samples were collected in May 2016 and November 2016 – January 2017 within the ARIASaNa project. The project was led by the Italian National Research Center (CNR), in collaboration with the Parthenope University and was aimed to monitor air pollution in the main towns of the Campania region. Fine particles with diameter < 2.5 μm (PM2.5) and < 10 μm (PM10) were collected for 24h on pre-cleaned (700 °C for 2 h) quartz filters (Whatman, 47 mm diameter) on top of the historical building complex in Largo San Marcellino (lat. 40.85° N; long. 14.26° E, 53 m.a.s.l.).

The results show some key features:

  • All species (major ions and isotopic compositions) measured in autumn-winter samples are much less variable than those measured in spring. This seems to be related to a change in weather pattern which is caused by the land-sea breeze mechanism.
  • A significant change of the main species measured is found around the middle of May 2016. This change occurs at the same time as a change in the meteorology of the area, going from high to low pressure.
  • The change found in May 2016 is characterized by a strong positive relationship between ammonium (NH4+) concentration and the isotopic composition of nitrogen (δ15N), suggesting that the dominant factor of change in atmospheric N chemistry is the NH4+ origin.

We will discuss the results obtained in terms of influence of the meteorology on atmospheric chemistry of N and C, and will try to disentangle the changes due to secondary atmospheric processes from those caused by a change in the primary source of N and C.

How to cite: Rubino, M., Sirignano, C., Chianese, E., Hernández-Ceballos, M. A., and Riccio, A.: Multiple lines of evidence help identify the sources of Nitrogen and Carbon in particulate matter sampled in the historical center of Naples (Italy), EGU General Assembly 2024, Vienna, Austria, 14–19 Apr 2024, EGU24-7808, https://doi.org/10.5194/egusphere-egu24-7808, 2024.

EGU24-9138 | ECS | Posters on site | AS3.36

A single instrument for the simultaneous monitoring of greenhouse gases and air pollutants 

Jonas Bruckhuisen, Marco Brunner, Oleg Aseev, and Morten hundt

Urban air pollution and greenhouse gas emissions can be attributed to a variety of sources, such as transportation, heating and buildings, waste management, industrial and agricultural production, natural events such as forest fires and many others. Monitoring air pollutants and GHG simultaneously with high selectivity and sensitivity enables to detect and evaluate their sources and sinks and to discover the interaction between them. Precise measurements at various spatial and temporal scales are required for modelling and validation of emission inventories or satellite observations. 

Solutions to monitor air pollutants or GHG with high precision and temporal resolution were commonly offered as “one-species-one-instrument”, leading to large, immobile measurement setups with high energy consumption. We provide a new compact laser absorption spectrometer that combines several mid-IR lasers. Our solution allows simultaneous high-precision measurements of the greenhouse gases CO2, N2O, H2O and CH4, the pollutants CO, NO, NO2, O3, SO2 and NH3 and the trace gases OCS, HONO and CH2O within a single instrument. With a time resolution of up to 10Hz is therefore well suited to detect the relations of the co-emitted pollutants and GHGs.

In our contribution, we will demonstrate examples of our instruments’ applications for mobile monitoring of 10 GHGs and air pollutants in urban areas and airborne measurements with airships. Furthermore, we will present the results of parallel monitoring with our instrument and standard conventional gas analysers used for GHG and air pollutant measurements. It demonstrates the ability of our instrument to serve as an all-in-one solution and to replace up to 7 standard gas analysers opening a wide range of new mobile multi-compound gas monitoring applications, for example, in (small) airplanes or cars.


Key words: multicomponent gas analysers, mid-IR laser absorption spectroscopy, mobile monitoring, GHG monitoring

How to cite: Bruckhuisen, J., Brunner, M., Aseev, O., and hundt, M.: A single instrument for the simultaneous monitoring of greenhouse gases and air pollutants, EGU General Assembly 2024, Vienna, Austria, 14–19 Apr 2024, EGU24-9138, https://doi.org/10.5194/egusphere-egu24-9138, 2024.

EGU24-9261 | ECS | Posters on site | AS3.36 | Highlight

Air quality monitoring across Europe using IoT/low-cost sensors within the AD4GD project 

Christian Borger, Julie Letertre, Thomas Hodson, Ulrike Falk, Cristina Ananasso, and Vincent-Henri Peuch

Despite longstanding awareness of its risks, air pollution remains one of the biggest challenges for humanity with profound health impacts affecting the lives of billions globally. However, while effective monitoring of air pollution is critically important, it is still inadequate: on one hand ground-based measurement networks of air pollutants often lack sufficient spatial coverage, partly due to the high costs and maintenance requirements involved; on the other hand the process complexity in air chemistry complicates modelling of regional air quality on high-resolution. This is a pressing issue particularly in urban areas where pollutant levels can vary drastically.

In this context, measurements from Internet of Things (IoT)/low-cost sensors, for instance from citizen science projects, offer a valuable opportunity to overcome these challenges and can provide deeper insights into local-scale air pollution.

In a pilot study of the Horizon Europe project "All Data 4 Green Deal" (AD4GD), the objective is to explore how existing IoT data from various sources can be effectively utilized and how they might contribute to air quality monitoring, particularly regarding health impacts.

Here, we present the first preliminary results of this pilot study, highlighting the effectiveness of IoT sensors in selected cities across Europe. We also compare our results with various reference datasets from in situ and analysis models, demonstrating that IoT sensors can significantly improve coverage in these specific urban areas. Furthermore, we discuss the challenges associated with these sensors and potential strategies for addressing them.

How to cite: Borger, C., Letertre, J., Hodson, T., Falk, U., Ananasso, C., and Peuch, V.-H.: Air quality monitoring across Europe using IoT/low-cost sensors within the AD4GD project, EGU General Assembly 2024, Vienna, Austria, 14–19 Apr 2024, EGU24-9261, https://doi.org/10.5194/egusphere-egu24-9261, 2024.

EGU24-9475 | Orals | AS3.36 | Highlight

Using small sensors to measure the effect of mobility policies on urban air pollution 

Erika von Schneidemesser, Sean Schmitz, Alexandre Caseiro, and Andreas Kerschbaumer

Small sensors have the potential to provide valuable complementary measurements to established air quality monitoring stations in urban areas. The flexible deployment options of small sensors also allow for short- or longer-term deployment to e.g., accompany policy implementations. Here we present the results from a number of case studies in Berlin where we used a combination of small sensors and reference instrumentation to assess individual policy’s impacts on local air quality, a metric important to policymakers’ assessments of their success. These measurement campaigns included both the stationary and mobile deployment of small sensors, in collaboration with the city. Data generated by the small sensors were calibrated using co-locations and the open-source 7-step methodology developed in our group (Schmitz, et al. 2021, ACP). Measurements deployed alongside the implementation of several policies captured before-after measurements of nitrogen oxides (NOx) and particulate matter (PM). Data from the urban monitoring network was used to account for changes in meteorology and city-wide changes to assist in isolation of the signal from the policy implementations. Through the implementation of a new bike lane, cyclists’ exposure to NO2 was reduced by 20%; in another case, the closure of a street to vehicle traffic reduced local air pollution to the levels of the urban background. These results were subsequently accounted for by policymakers when determining the success of each measure, considering the implications for human health.

How to cite: von Schneidemesser, E., Schmitz, S., Caseiro, A., and Kerschbaumer, A.: Using small sensors to measure the effect of mobility policies on urban air pollution, EGU General Assembly 2024, Vienna, Austria, 14–19 Apr 2024, EGU24-9475, https://doi.org/10.5194/egusphere-egu24-9475, 2024.

EGU24-9758 | Orals | AS3.36

Spatial downscaling of CAMS surface pollutants using Machine Learning 

Athanasios Tsikerdekis, Michail Tsikerdekis, and Henk Eskes

In order to monitor regional pollution over Europe, the Copernicus Atmosphere Monitoring Service (CAMS) coordinated by the European Centre for Medium-Range Weather Forecasts (ECMWF) implemented an operational multi-model air quality forecast system over Europe. CAMS regional products provide a 5-day forecast of several chemical species (e.g. NO2, CO, PM2.5, PM10) from the surface up to 5 km with a spatial resolution of 10 km. In addition, CAMS global services provide similar products globally in a coarser resolution of 0.4° (40 km approximately).

Motivated by the fact that air pollution is a global problem and responsible for millions of premature deaths each year, combined with the lack of a 10 km global air quality forecast system, we train a convolutional neural network (CNN) in order to downscale the spatial resolution of CAMS surface NO2 from 40 km to 10 km. Since most pollutants are affected by meteorological conditions and topographic characteristics, we use as input several meteorological variables (e.g. wind, temperature, humidity, boundary layer height) from ECWMF high-resolution forecasts (HRES) as well as surface elevation and emission information of several pollutants. All inputs are available at 10 km resolution globally.

In order to validate if there is an added value in our downscaled results, we evaluate against observations collected by a network of surface stations. Our downscaling efforts in this study focus over the European domain, where the reference of a high-resolution chemistry is available from the CAMS regional services, but we aim to train a model that will be general enough for global application.

How to cite: Tsikerdekis, A., Tsikerdekis, M., and Eskes, H.: Spatial downscaling of CAMS surface pollutants using Machine Learning, EGU General Assembly 2024, Vienna, Austria, 14–19 Apr 2024, EGU24-9758, https://doi.org/10.5194/egusphere-egu24-9758, 2024.

EGU24-10157 | ECS | Orals | AS3.36

One-year eddy covariance CO2 fluxes at short and tall towers in the Paris area 

Laura Bignotti, Jérémie Depuydt, Pedro Herig Coimbra, Patrick Stella, Pauline Buysse, Carmen Kalalian, Guillaume Nief, Michel Ramonet, and Benjamin Loubet

Nowadays, around 50% of the global population lives in cities and this percentage is expected to increase to 70% by 2050 (UN-Habitat, Word City Report 2022). As a result, cities have become a major source of greenhouse gases, and were estimated to account for over 70% of global GHG energy-related emissions (IEA, 2008). A correct quantification of these emissions is crucial for developing climate action plans and monitoring their effectiveness. To this purpose, the PAUL project was designed to develop systematic observations of GHG fluxes in three pilot cities of different size: Zurich, Paris and Munich.

In this framework, eddy covariance measurements of CO2 fluxes were started in February 2023 at two urban sites in the Paris area and are currently running to capture the seasonal and spatial variation of fluxes along a gradient of urbanisation. The two sites: a short tower on the rooftop of a university building in the city centre of Paris (Jussieu) and a tall tower (~100 m) on the NE periphery of the city (Romainville) are characterised by a different land cover composition within their footprint: in Jussieu, the smaller footprint spans a densely urbanised area, while in Romainville the wider footprint covers a less densely urbanised area with some vegetated patches.

Overall, one-year measurements confirmed the city was a source of CO2, as both sites showed a net positive CO2 flux. However, daily flux patterns were different: While in the city centre (Jussieu) the CO2 emission was highest during the diurnal hours [ FCO2 ~ 5 µmol m-2 s-1] and close to zero during the night, on the contrary, in the periphery (Romainville) positive fluxes with highest intensity were observed during the night [ FCO2 ~ 5 – 7 µmol m-2 s-1], while a decrease of CO2 emission were measured in the middle of the day. Romainville was indeed closer to the diurnal net CO2 flux patterns observed at the ICOS ecosystem sites in the south and west of Paris (FR-FON forest, FR-GRI crop).

People’s habits were found to play an important role on the observed fluxes in Jussieu as distinct daily patterns were seen between weekdays and weekends. This was not the case for Romainville where uniform daily flux cycles were observed along the week. 

Visible seasonal differences in the monthly diurnal patterns evidenced the influence of multiple anthropogenic and biogenic drivers which played a key role in different periods of the year and the day. 

How to cite: Bignotti, L., Depuydt, J., Herig Coimbra, P., Stella, P., Buysse, P., Kalalian, C., Nief, G., Ramonet, M., and Loubet, B.: One-year eddy covariance CO2 fluxes at short and tall towers in the Paris area, EGU General Assembly 2024, Vienna, Austria, 14–19 Apr 2024, EGU24-10157, https://doi.org/10.5194/egusphere-egu24-10157, 2024.

EGU24-11294 | Posters virtual | AS3.36

Stable isotope composition and airborne concentration of CO2 in Rome capital city (Italy) 

Maria Luisa Carapezza, Roberto Di Martino, Giorgio Capasso, Fabio Di Gangi, Massimo Ranaldi, and Luca Tarchini

Airborne CO2 has played a pivotal role in maintaining the Earth's atmospheric temperature at reasonable levels throughout its history. Since the onset of the industrial revolution, the level of airborne CO2 has surged due to the combustion of hydrocarbons, leading to global warming. Hydrocarbon consumption is predominantly concentrated in metropolitan areas, driven by various human activities. Estimations of CO2 emissions into the atmosphere rely on the growth of electrical power generation through hydrocarbon combustion. This study presents the outcomes of direct measurements of stable isotope concentrations in airborne CO2 in the urban area of Rome, Italy. We focused on Rome capital city, because i) it is the most populous municipality in Italy (2.8 millions inhabitants), ii) it is the European municipality with the largest surface of green areas and iii) in its south-east sector it borders the Colli Albani quiescent volcano. The dataset encompasses stable isotope compositions and airborne CO2 concentrations gathered to investigate variations in CO2 emissions across space and time. The spatial survey conducted throughout Rome's urbanized area, on a 250 km long path, aims to pinpoint the relevant sources of CO2 based on the stable isotope signature. Results reveal that the combustion of fossil fuels, stemming from urban mobility and household heating, constitutes the predominant source for the excess of airborne CO2 across a wide area of Rome centre. On the contrary, within the Rome south-east sector, including Colli Albani periphery, the carbon isotopic signature of airborne CO2 discloses the endogenous origin of the gas emissions. Continuous monitoring was carried out by the installation of an isotope analyser in three specific points of interest throughout Rome: the busiest area of the city centre, the woodland urban park of Villa Ada and the endogenous gas emission of Cava dei Selci. Findings unveil cyclic variations in human-related CO2 emissions in the city centre. The highest concentrations of airborne CO2 coincide with rush hours during morning and evening. The urban park is not affected by anthropic CO2 and its trend displays the typical day-night cycle. At Cava dei Selci we found high CO2 concentrations by a volcanic source and variations in the urban area correlate with changes in environmental conditions, such as wind speed and direction.

How to cite: Carapezza, M. L., Di Martino, R., Capasso, G., Di Gangi, F., Ranaldi, M., and Tarchini, L.: Stable isotope composition and airborne concentration of CO2 in Rome capital city (Italy), EGU General Assembly 2024, Vienna, Austria, 14–19 Apr 2024, EGU24-11294, https://doi.org/10.5194/egusphere-egu24-11294, 2024.

EGU24-11346 | Orals | AS3.36 | Highlight

Short-term effects of ultrafine particles on mortality 

Vanessa N. Dos Santos and the RI-URBANS contributors

Particulate matter (PM) was estimated to cause 4.2 million deaths worldwide in 2019; however, evidence on which components are responsible for its effects on mortality remains inconsistent. Ultrafine particles (UFP, < 100 nm in diameter), the smallest fractions of PM, have the potential to individually harm health as they are small enough to reach multiple organs of the human body in contrast to larger fractions. To efficiently decrease the effects of PM on health, it is crucial to understand which PM components pose the highest health risks and to tackle them in future regulations.

In this study, we aim to quantify the short-term effects of PM properties and components on mortality from natural, cardiovascular and respiratory causes. We associated daily concentrations of different PM properties and components (including UFP size fractions, UFP sources, black carbon, lung deposition surface area, PM2.5 (<2.5µm) and PM10 (<10µm)) with daily counts of mortality from 12 EU cities using quasi-Poisson single and multi-pollutant regression models (Generalized non-linear model framework). The models were adjusted for seasonal and long-term trends, temperature (cold and warm days), relative humidity, bank holidays and day of the week. The effects of lagged exposure (0-7 days) and lagged temperature were also evaluated. To minimize the impact of different analytical methodologies, measurements were conducted following a standardised protocol in all cities, particles were size classified consistently, and all the data was treated by the same research team.

A random effect meta-analysis was carried out to average the effects across all EU cities. The preliminary results reported here focus on the health effects of different particle size fractions and are based on seven cities (Athens, Barcelona, Budapest, Granada, Helsinki, Madrid and Zurich). The remaining cities will be analysed in situ and included in the meta-analysis soon.

Our meta-analysis of single pollutant models suggests that nearly all particle size modes (e.g., nucleation (10-25 nm), Aitken (25-100nm), UFP (<100nm), Ntotal (>10nm) and N25 (>25 nm) are associated with significant increases in relative risk (RR) of natural and cardiovascular disease mortality, at lags 0 to 3. For example, an interquartile range increase in UFP (IQR: 3804 particles/cm3) was associated with a 0.8% [95% confidence interval: 0.2%, 1.5%] increase in natural mortality and 1% (95% confidence interval: 0.2%, 1.8%) in cardiovascular mortality. A significant risk of cardiovascular mortality was also observed 4-6 days after exposure to most particle size modes. We did not find significant associations between particle modes and respiratory mortality.

The Nucleation, Aitken, UFP and Ntotal (>10 nm) modes showed similar results, indicating that both UFP and Ntotal (>10 nm) could potentially be used as indicators for the health effects of the smallest aerosol size fractions, dominant in number. The health effects of the UFP mode remained statistically significant for natural mortality after adjusting for PM2.5. Similarly, the effects of the UFP mode remained significant for natural and cardiovascular mortality after individually adjusting for PM10 and NO2.

Our preliminary results suggest that the smallest aerosol particle size fractions (e.g., UFP) may independently impact health.

How to cite: N. Dos Santos, V. and the RI-URBANS contributors: Short-term effects of ultrafine particles on mortality, EGU General Assembly 2024, Vienna, Austria, 14–19 Apr 2024, EGU24-11346, https://doi.org/10.5194/egusphere-egu24-11346, 2024.

EGU24-12180 | ECS | Posters on site | AS3.36 | Highlight

Bicycle-based aerosol measurements in the inner city of Budapest 

Ágoston Vilmos Tordai and Róbert Mészáros

Atmospheric aerosol pollution in densely populated urban areas is a pressing concern. Complex building patterns, local circulation systems and widely varying sources of pollution make traditional aerosol measurements insufficient. However, using portable OPCs and low-cost, fixed and mobile sensors enables researchers to obtain high spatial and temporal resolution air quality data in urban areas.

In recent years, the popularity of cycling and other forms of public transport has increased in Budapest, the capital city of Hungary, raising concerns about individual aerosol exposure and its health effects. In our study, calibrated instruments mounted on bicycles are used to assess aerosol pollution along some of the most important bicycle routes in Budapest. The objectives of this project are to create a quality-assured reference database for further research (e.g. human health-related calculations), to identify trends and hotspots of air pollution, to develop a measurement methodology for mobile measurements by low-cost instruments, and to develop a relevant metadata structure.

Two DustTrak™ II Aerosol Monitor 8532 instruments equipped with physical impactors were used to measure PM10 and PM2.5 in parallel. Air temperature and relative humidity were recorded using a Testo 635-2 datalogger with additional sensor shielding; both were sampled at 2-second resolution and averaged over 10 seconds. Detailed GPS data was recorded using a mobile phone application at a 1-second resolution. About 150 measurement datasets were recorded on pre-selected routes. The data is processed using a primarily automated algorithm written in Matlab. In order to allow comparison of individual routes and further statistical calculations, the data is projected onto a domain of 0.2° × 0.2° covered by a regular geographic grid with 200 grid cells in each direction (one grid cell measuring approximately 110 × 110 meters).

This study outlines the measurement setup, the gridded dataset and demonstrates the applicability of our database through case studies. The ratio of PM2.5/PM10 and its spatial and temporal patterns are assessed using the entire dataset and in selected situations. Additionally, the percentage deviation of each PM fraction from the median for an entire measurement route and the spatial distribution of the deviations are presented.

The research was funded by the National Multidisciplinary Laboratory for Climate Change, RRF-2.3.1-21-2022-00014 project.

How to cite: Tordai, Á. V. and Mészáros, R.: Bicycle-based aerosol measurements in the inner city of Budapest, EGU General Assembly 2024, Vienna, Austria, 14–19 Apr 2024, EGU24-12180, https://doi.org/10.5194/egusphere-egu24-12180, 2024.

EGU24-12190 | ECS | Orals | AS3.36

Comparative Analysis of High-Resolution Urban Biogenic CO2 Fluxes Using Multiple Versions of the Vegetation Photosynthesis and Respiration Model (VPRM) 

Junwei Li, Jia Chen, Theo Glauch, Stavros Stagakis, Haoyue Tang, Dominik Brunner, and Julia Marshall

The concentration of CO2 in the atmosphere is strongly influenced by vegetation photosynthesis, respiration, and soil activity. To accurately estimate urban anthropogenic CO2 emissions, it is essential to understand the carbon flux of vegetation in the city. Compared with rural areas, vegetation inside the cities is distributed more inhomogeneously and sometimes shows different behaviours. Therefore, we have tested and updated different versions of VPRM to achieve accurate high-resolution biogenic CO2 fluxes for urban areas.

In the framework of the ICOS Cities project, we have tested multiple VPRM models with 10-meter spatial and hourly temporal resolution for the cities of Munich and Zurich. This involved deriving vegetation indices from Sentinel-2 satellite products, generating a detailed vegetation land cover dataset by merging multiple land cover and geospatial datasets, and using temperature and shortwave radiation fields from the Weather Research and Forecasting model (WRF). Additionally, we recalibrated the VPRM parameters using observations from flux towers across Europe.

We tested three existing versions of VPRM, namely the standard VPRM (Mahadevan et al., 2008), UrbanVPRM (Hardiman et al., 2017), and a modified VPRM (Gourdji et al., 2022). While the standard VPRM was developed for non-urban vegetation, the UrbanVPRM and the modified VPRM were specifically designed to better represent vegetation and soil respiration. We thus expect them to be more capable of describing biogenic fluxes in cities. The results of all models are cross compared in the urban areas and evaluated using various observational data. This includes CO2 flux measurements from eddy covariance towers, sap flux density of selected trees and soil and grass respiration inside cities, among other metrics.

Our research findings will contribute to precise estimation of high-resolution biogenic CO2 fluxes, specifically in the urban areas.


Reference

Mahadevan, Pathmathevan, et al. “A satellite‐based biosphere parameterization for net ecosystem CO2 exchange: Vegetation Photosynthesis and Respiration Model (VPRM).” Global Biogeochemical Cycles 22.2 (2008).

Hardiman, Brady S., et al. "Accounting for urban biogenic fluxes in regional carbon budgets." Science of the Total Environment 592 (2017): 366-372.

Gourdji, Sharon M., et al. "A modified Vegetation Photosynthesis and Respiration Model (VPRM) for the eastern USA and Canada, evaluated with comparison to atmospheric observations and other biospheric models." Journal of Geophysical Research: Biogeosciences 127.1 (2022): e2021JG006290.

How to cite: Li, J., Chen, J., Glauch, T., Stagakis, S., Tang, H., Brunner, D., and Marshall, J.: Comparative Analysis of High-Resolution Urban Biogenic CO2 Fluxes Using Multiple Versions of the Vegetation Photosynthesis and Respiration Model (VPRM), EGU General Assembly 2024, Vienna, Austria, 14–19 Apr 2024, EGU24-12190, https://doi.org/10.5194/egusphere-egu24-12190, 2024.

EGU24-12349 | Posters on site | AS3.36 | Highlight

Urban network of cost-efficient particulate matter measurement devices: Performance against reference observations and scientific benefit 

Roland Schrödner, Honey Alas, and Jens Voigtländer

22 cost-efficient (aka ‘low-cost’) commercially available particulate matter (PM) measurement devices were installed in a diverse urban area in Leipzig, Germany. The instruments measure mostly PM2.5, some additionally PM10, and are equipped with methods for quality assurance such as conditioning to a defined temperature and regular internal calibration. In order to investigate the spread between the instruments and to enable a pre-campaign calibration, all instruments were setup in the laboratory and the outside air and compared against the same reference measurements.

After calibration the measurement network was installed and run for 14 months. It covers roughly 2x2 km2 and holds different urban features like residential and commercial buildings, important main roads, city parks, and small open building gaps. Within the network there is an official air quality monitoring station located directly at a main road. In addition, at two further monitoring stations instruments were installed to study the long-term performance, dependence on meteorological conditions and comparison to reference measurements.

The cost-efficient instruments perform generally quite well after the calibration. In particularly for higher PM loads > 10 µg m-3 the agreement against references is mostly satisfying, where the relative spread between instruments (while mounted in the same location) is often far below 50 %. Under very high relative humidity (RH > 95 %), which were only observed for cold temperatures during the campaign, reference observations were overestimated. Below this RH threshold no additional deviation between reference and sensors was found, hence, suggesting a stable signal. Overall, the chosen instruments have the potential for application in monitoring of air quality limit values, i.e. the answer the question how frequently are certain limit values exceeded.

Furthermore, differences between different local features in the observation area could be observed in e.g., the diurnal cycle but also peak and mean concentrations. Due to the high time resolution (10s raw data), short peak events such as New Year’s fireworks or summer barbeque can be detected and compared to ‘background’ conditions at other stations in the network.

How to cite: Schrödner, R., Alas, H., and Voigtländer, J.: Urban network of cost-efficient particulate matter measurement devices: Performance against reference observations and scientific benefit, EGU General Assembly 2024, Vienna, Austria, 14–19 Apr 2024, EGU24-12349, https://doi.org/10.5194/egusphere-egu24-12349, 2024.

EGU24-12535 | ECS | Orals | AS3.36

The continuous growth of newly formed particles in urban environments 

Wei Du, Qiaozhi Zha, Jing Cai, Chao Yan, Feixue Zheng, Yishuo Guo, Tom Kokkonen, Yongchun Liu, Veli-Matti Kerminen, and Markku Kulmala

New particle formation events (NPF) are observed to take place in all environments, including megacities where the concentrations of pre-existing particles acting as sink are exceptionally high. NPF produces high number concentration of small particles, which can act as seed particles suitable for the accumulation of particle mass after their subsequent growth. However, the reason of the frequently observed NPF in urban environments is still unclear, and the contribution of NPF and subsequent growth to air pollution is still controversial.

To improve the understanding of the link between air pollution and NPF, comprehensive observations, including gaseous precursors, size distributions and chemical compositions of atmospheric aerosols, as well as meteorological conditions, were conducted in the west campus of Beijing University of Chemical and Technology (BUCT, 39o 56’31” N, 116o17’50” E), near the West Third Ring Road of Beijing, China. We also performed simultaneous measurements of aerosol composition and particle number size distributions at ground level and at 260 m based on the 325 m Beijing meteorological tower.

We divided NPF events into two types based on whether the newly formed particles grow continuously or not. By comparing the meteorological conditions, gaseous precursors, and chemical composition between these two types, we investigated the conditions favour the continuous growth of new formed particles. Our results also showed that the continuous particle growth could contribute to the formation of haze. Due to the stronger emission of gaseous precursors near ground coupled with the less effective boundary layer mixing, particles originating from NPF continue to grow at ground level while their mean diameter remains relatively stable at a higher altitude, resulting in the more severe haze pollution at ground level than at high altitude.

How to cite: Du, W., Zha, Q., Cai, J., Yan, C., Zheng, F., Guo, Y., Kokkonen, T., Liu, Y., Kerminen, V.-M., and Kulmala, M.: The continuous growth of newly formed particles in urban environments, EGU General Assembly 2024, Vienna, Austria, 14–19 Apr 2024, EGU24-12535, https://doi.org/10.5194/egusphere-egu24-12535, 2024.

EGU24-13414 | ECS | Posters virtual | AS3.36

Air Quality Changes in Lahore, One of the Most Polluted City Worldwide During COVID 19 Lockdowns 

Irfan Karim and Bernhard Rappenglueck

Lahore with an annual average of PM2.5 concentrations of 86.5 μg/m3 in 2021 was ranked among the top polluted cities of the world (https://www.iqair.com/us/world-air-quality-ranking). The COVID-19 pandemic altered the human mobility and economic activities immensely, as authorities enforced unprecedented lock down regulations. In order to reduce the spread of COVID-19, a complete lockdown was observed between 24 March – 31 May, 2020 in Pakistan. This paper aims at investigating the PM2.5, AOD and column amounts of six trace gases (NO2, SO2, CH4, HCHO, C2H2O2, and O3) by comparing periods of reduced emissions during lockdown periods with reference periods without emission reductions over Lahore, Pakistan. HYSPLIT cluster trajectory analyses were performed, which confirmed similar meteorological flow conditions during lockdown and reference periods. This provides confidence that any change in air quality conditions would be due to changes in human activities and associated emissions. The results show about 38% reduction in ambient surface PM2.5 levels during the lockdown period. This change also positively correlated with MODISDB and AERONETAOD data with a decrease of AOD by 42% and 35%, respectively. Reductions for tropospheric columns of NO2 and SOwere about 20% and 50%, respectively during a semi lockdown period, while no reduction in the CH4, C2H2O2, HCHO and Olevels occurred. During the lockdown period NO2, Oand CHwere about 40%, 45% and 25% lower, respectively, but no reduction in SO2, C2H2O2 and HCHO levels were noticed compared to the reference lockdown period for Lahore. HYSPLIT cluster trajectory analysis revealed the greatest impact on Lahore air quality through local emissions and regional transport from the east (agricultural burning and industry).

How to cite: Karim, I. and Rappenglueck, B.: Air Quality Changes in Lahore, One of the Most Polluted City Worldwide During COVID 19 Lockdowns, EGU General Assembly 2024, Vienna, Austria, 14–19 Apr 2024, EGU24-13414, https://doi.org/10.5194/egusphere-egu24-13414, 2024.

EGU24-13554 | Posters on site | AS3.36

Metal and PAH content in PM10 measured in Bristol in 2021.  

James Matthews, Anwar Khan, Rayne Holland, Prem Perumal, Adam Laycock, Atallah Elzein, and Dudley Shallcross

Particulate matter in the atmosphere is a major health concern, and the chemical composition of particles will affect its toxicology. Chemical composition of PM10 can indicate likely sources of pollutants; high concentrations of metals can come from fuel mixtures, lubricants, abrasion and engine wear from cars [1], while polycyclic aromatic hydrocarbons (PAH) are produced by combustion sources [2]. Measurements can be interpreted through use of air flow measurements within the city and supported modelling [3].

PM10 samples were collected weekly, every Thursday, for 24 hours from a 1st floor balcony at the We the Curious science museum in central Bristol, UK. Samples were collected using a Sven Leckel LVS3 PM10 sampler on a 47 mm quartz filter and weighed to calculate the mass concentration. Quartz filters were halved and analysed for metals using ICP-MS and for PAH using GC-MS. Local meteorology was measured on the roof using a Gill Maximet 501 weather station.

Measurements took place from February 2021 until February 2022. Within the UK the third COVID-19 lockdown started on 6th January 2021 and was incrementally lifted from 8th March until 21st June when all restrictions were removed.

Taking the average of samples that were detected above noise average metal concentrations from lowest (Co, 40 ng/m3) to highest (Fe 195 µg/m3) were Co < Li < Ce < Cd < La < Rb < Bi < Se < V < Sb < As < Sr < Sn < Pb < Mn < Ba< Cu < Zn < Al < Mg< Fe. Average PAH concentrations from lowest to highest were Anthracene < Fluoranthene < Pyrene < Acenaphthene < Dibenzo-a,h-Anthracene <  Benzo[k]Fluoranthene < Indeno-123-cd-Pyrene < Chrysene < Benzo[a]Pyrene < Benzo-ghi-Perylene < Benzo[a]Anthracene < Benzo[b]Fluoranthene, average total PAH concentration was 4.8 ng/m3).

For the sample collected from 13th January 2022, many metals and PAH levels were elevated. This coincided with a multivehicle fire in Totterdown, around 2 km South East of the measurement position, that started in the evening of the 13th. Total PAH, Mn, Co, Cu, As, Rb, Cd, Sn, Sb, Ba, Ce, Pb and Bi were more than 2 standard deviations higher than the weekly mean concentrations, many showing a 2-3 fold increase. Measurements of Nitric Oxide from the UK government AURN air quality site in St Pauls, ~2 km from the We the Curious site ~3 km north of the incident site, confirmed that pollutants were dispersed city wide, not local to the measurement position. The predominant wind direction was south westerly on the 13th January, but air masses can spread through a complex city terrain against wind directions [3].

Measurements in a single location can provide information on pollution in the city, extreme peaks in concentrations were identified with fires being a likely source.

[1] Pulles T, van der Gon HD, Appelman W, Verheul M 2012. Atmos Environ 61, 641–651.

[2] Jang, E., Alam, M.S. and Harrison, R.M., 2013. Atmospheric Environment, 79, 271-285.

[3] Matthews, J.C., Wright, M.D., Martin, et al. 2020. Boundary-Layer Meteorology, 175, 113-134.

How to cite: Matthews, J., Khan, A., Holland, R., Perumal, P., Laycock, A., Elzein, A., and Shallcross, D.: Metal and PAH content in PM10 measured in Bristol in 2021. , EGU General Assembly 2024, Vienna, Austria, 14–19 Apr 2024, EGU24-13554, https://doi.org/10.5194/egusphere-egu24-13554, 2024.

EGU24-13613 | Posters on site | AS3.36

Studies related to PM2.5 and PM1 using AS-LUNG Sensor in Kuala Lumpur, Malaysia 

Murnira Othman, Mohd Talib Latif, and Muhammad Ikram A Wahab

Low-cost sensors are new emerging technologies that has been applied in research related to air pollution. Low-cost sensor for particulate matter was produced by Academia Sinica Taiwan and widely used in Asia due to the research collaboration under Advanced Institute on Health Investigation and Air Sensing for Asian Pollution (AI on Hi-ASAP). Low-cost sensor named AS-LUNG outdoor and portable has been deployed in several studies in Malaysia where AS-LUNG has been used for cooking exposure studies, ambient air studies and indoor air studies. AS-LUNG sensor also managed to record parameters such as PM2.5, PM1, temperature and humidity. AS-LUNG outdoor sensor is usually used for ambient PM measurement while AS-LUNG portable can be used for both indoor and outdoor. The result of studies related low-cost sensor applications especially AS-LUNG sensor definitely shows accurate PM concentration which highest PM concentration was observed during in indoor environment such as dormitory in Kuala Lumpur City Centre.


How to cite: Othman, M., Latif, M. T., and A Wahab, M. I.: Studies related to PM2.5 and PM1 using AS-LUNG Sensor in Kuala Lumpur, Malaysia, EGU General Assembly 2024, Vienna, Austria, 14–19 Apr 2024, EGU24-13613, https://doi.org/10.5194/egusphere-egu24-13613, 2024.

EGU24-14092 | Orals | AS3.36 | Highlight

Air Quality in Mexico-City: Emissions, Transport, and Chemical Transformation 

Bernhard Rappenglück, Tanzina Akther, Mateen Ahmad, Jahirul Alam, Olabosipo Osibanjo, Armando Retama, and Olivia Rivera-Hernández

During the period March 12-17, 2016, Mexico-City experienced its most severe smog episode since 2007. The Metropolitan Index of Air Quality (IMECA) for Mexico-City surpassed the value of 200, indicating an extremely bad situation. Hourly peak values for both, NO2 and O3, exceeded 200 ppb, while for CO more than 2 ppm were observed. Restrictions on traffic and industrial activities, among other emergency measures, were imposed. We describe results from Positive Matrix Factorization (PMF) for source apportionment based on a commixture of gasphase compounds (VOCs, CO, NO, NO2, SO2, NH3) along with equivalent black carbon (eBC), and ions (Na+, Mg2+, Ca2+, NO3-, NH4+) in combination with an analysis of regional meteorological processes and boundary layer conditions retrieved from continuous microwave radiometer measurements. Apart from more traditional emission sources, the PMF analysis also deciphered a geogenic source. Continuous boundary layer height data was used to normalize mixing ratios of pollutants representative for each source factor. This procedure allowed the retrieval of diurnal variations of pollutants predominantly determined by emissions and removal mechanisms. The results show prolonged daytime emissions of O3 precursors beyond the typical morning rush hour, an important information to optimize O3 mitigation strategies. Propylene Equivalent and Maximum Incremental Reactivity (MIR) methods identified isoprene and ethylene as the highest oxidant and O3 forming species which indicates some interchange of individual top VOC contributors to ozone formation in that city over the last decades. This presentation concludes with results from air quality modeling including Machine Learning approaches. While the Deep Neural Network, Random Forest and Gradient Tree Boosting models are depicting diurnal O3 levels nicely, as long as O3 mixing ratios are at moderate levels (≤120 ppb) only the Deep Neural Network may capture peak ozone values (>160 ppb), which are most critical with regard to public health.

How to cite: Rappenglück, B., Akther, T., Ahmad, M., Alam, J., Osibanjo, O., Retama, A., and Rivera-Hernández, O.: Air Quality in Mexico-City: Emissions, Transport, and Chemical Transformation, EGU General Assembly 2024, Vienna, Austria, 14–19 Apr 2024, EGU24-14092, https://doi.org/10.5194/egusphere-egu24-14092, 2024.

EGU24-14347 | ECS | Posters virtual | AS3.36

A high-resolution emission inventory of anthropogenic pollutants for an industrial city in Eastern India 

shubham patel, Shamjas ibrahim, and Dr. Shubha verma

A high-resolution emission inventory was prepared for the anthropogenic sources of primary air pollutants with a spatial resolution of 1km×1km for the Haldia region in the Indian state of West Bengal. The Haldia region is a core of major petrochemical industries, oil refineries, and port activities. For the preparation of the emission inventory, the source sectors were divided into residential, industrial, transportation, marine, crematoria, thermal power plants, solid waste burning, and brick kilns. The emissions of seven primary pollutants, sulfur dioxide (SO2), nitrogen oxides (NOx), particulate matter (PM2.5), black carbon (BC), organic carbon (OC), and non-methane volatile organic compounds (NMVOC) were estimated. To collect activity-based information, municipal authority, annual reports of industries, and publicly accessible data were consulted. Emission factors from various literature were used for the estimation of emissions. The emission inventory was developed using a bottom-up approach for base year 2021 and the spatial maps were prepared using ArcGIS.

The transportation sector was responsible for 71%, 42%, and 75%, respectively of NOx, BC, and NMVOC emissions. Industries and thermal power plants were the primary contributors to SO2 emissions, accounting for 38% and 36%, respectively of total SO2 emissions. In addition, the residential sector accounted for 53%, 40%, and 44% of OC, PM2.5, and CO emissions respectively. The Haldia Municipality wards 5, 6, 9, 11, and 13 were identified as emission hotspots. Terapakhya town was the hotspot for all pollutants except NOx and NMVOC emissions. Traffic intersections at city centre and ranichak were the highest emitters of NOx emissions.

This emission inventory serves as the first baseline information for the emissions in the region and can be further utilized to perform initial air quality studies for the Haldia region. A comprehensive plan to eliminate air pollution in Haldia and the encompassing area can be developed with the use of this emission inventory.

How to cite: patel, S., ibrahim, S., and verma, Dr. S.: A high-resolution emission inventory of anthropogenic pollutants for an industrial city in Eastern India, EGU General Assembly 2024, Vienna, Austria, 14–19 Apr 2024, EGU24-14347, https://doi.org/10.5194/egusphere-egu24-14347, 2024.

EGU24-14540 | Posters on site | AS3.36

CFD simulations on Vertical Forest’s Effects in a Step-up Street Canyon 

Dong-Hyeon Kim, Ju-Hwan Rho, Geon Kang, Woo-Sok Moon, and Jea-Jin Kim

The expansion of urban areas has heightened air pollution and exacerbated the urban heat island effect, giving rise to urgent environmental and health challenges. In dense urban landscapes where traditional urban greening solutions prove insufficient, the adoption of vertical forests, incorporating vegetation on building facades, balconies, and rooftops, has emerged as a critical strategy. These innovative green spaces plays a particularly vital role in street canyons, where they have possess the potential to significantly impact air quality and thermal comfort. We conducted an investigation into the effects of vertical forests on airflow and pollutant dispersion in step-up street canyons, utilizing dry deposition in a computational fluid dynamics (CFD) model. For validation, we compared the performance of the dry deposition effect in the CFD model with a wind tunnel experiment. Despite a substantial reduction in fine particles through dry deposition, there was an observed increase of 20-25% in fine particle concentrations within lower layer of the street canyon. This increase was attributed to a 14-20% reduction in wind speed in the street canyon.

Acknowledgments

This research was supported by Particulate Matter Management Specialized Graduate Program through the Korea Environmental Industry & Technology Institute(KEITI) funded by the Ministry of Environment(MOE)

How to cite: Kim, D.-H., Rho, J.-H., Kang, G., Moon, W.-S., and Kim, J.-J.: CFD simulations on Vertical Forest’s Effects in a Step-up Street Canyon, EGU General Assembly 2024, Vienna, Austria, 14–19 Apr 2024, EGU24-14540, https://doi.org/10.5194/egusphere-egu24-14540, 2024.

EGU24-14906 | ECS | Orals | AS3.36

Size fractionated carbonaceous and iron oxides particles in urban environments in France and Senegal associated with intense emission sources. 

Laurence Delville, Jean-François Léon, Mélina Macouin, Yann-Philippe Tastevin, Mayoro Gueye, Arnaud Proietti, Laure Laffont, Sonia Rousse, Maria Dias-Alves, François Demory, Pierre Rochette, Pedro Henrique da Silva Chibane, Andrea Teixera Ustra, and Loïc Drigo

Atmospheric aerosols in urban areas are the result of a complex mixture of different anthropogenic sources. The chemical and granulometric profile of urban aerosols varies according to the level of economic and technological development of cities around the world. In particular, road traffic emits carbon compounds (organic and elemental) and metal oxides through combustion, braking and tyre abrasion. Our study focuses on the respective particle size distributions of the carbon and iron oxide fractions using magnetic investigations.

We investigated the size distribution of anthropogenic tracers of particulate matter (PM), particulate total carbon (TC) concentration, and saturation isothermal remanent magnetization (SIRM) in two urban settings in France (Toulouse) and Senegal (Sebikotane). Using a cascade impactor, particles were segregated into 5 fractions spanning from PM10 to PM0.01. Particle mass concentration within each size range was determined via gravimetric methods, particulate carbon concentrations were assessed using thermo-optical techniques, and magnetic signals were measured through isothermal induced magnetization acquisitions.

Our results showed high concentrations of particulate mass in the coarse fraction (particles larger than 1 µm). The coarse fraction showed a significantly higher magnetic signal than for finer fractions, accounting for 73% in France and 80% in Senegal of the total SIRM. In the ultrafine fraction (<0.2 µm), we noted significantly higher concentrations of TC than for other fractions, representing 41% in France and 36% in Senegal of the total particulate carbon concentration.

Electron microscope observations revealed the presence of iron oxide particles in the <0.5 µm fraction however associated with a weak SIRM. Such iron particles may be produced by combustion or abrasion while we suspect that emissions by abrasion process produce larger particles.

How to cite: Delville, L., Léon, J.-F., Macouin, M., Tastevin, Y.-P., Gueye, M., Proietti, A., Laffont, L., Rousse, S., Dias-Alves, M., Demory, F., Rochette, P., Henrique da Silva Chibane, P., Teixera Ustra, A., and Drigo, L.: Size fractionated carbonaceous and iron oxides particles in urban environments in France and Senegal associated with intense emission sources., EGU General Assembly 2024, Vienna, Austria, 14–19 Apr 2024, EGU24-14906, https://doi.org/10.5194/egusphere-egu24-14906, 2024.

EGU24-15018 | Posters virtual | AS3.36

Lichens as bioindicators of air pollution assessment - a case study from the Upper Silesia region (Poland) 

Ewa Szram, Leszek Marynowski, and Monika Fabiańska

The primary source of air pollution in the Upper Silesia region (Poland) is anthropogenic emissions, including municipal, domestic, and traffic emissions. However, the main problem that arises is to identify the dominating pollution sources and eliminate them. Since lichens absorb even small amounts of anthropogenic organic compounds from the air, they are useful as bioindicators of environmental pollution. For the study, lichen samples were taken from trees growing close to single-family housing estates and near roads with heavy traffic in the Zabrze town, Poland. The lichen samples were analyzed by GC-MS (Agilent gas chromatograph 7890A coupled with a mass spectrometer 5975C XL MDS). Moreover, the concentration of trace elements was determined using an S8 TIGER Series 2 WDXRF spectrometer.

The studied lichen samples are a source of information about air contamination with polycyclic aromatic hydrocarbons (PAHs), which come from fossil fuel combustion and have carcinogenic and mutagenic properties. Identified PAHs include phenanthrene, anthracene, fluoranthene, pyrene, benz[a]anthracene, triphenyl, chrysene, benzo[b]fluoranthene, benzo[k]fluoranthene, benzo[j]fluoranthene, benzo[a]fluoranthene, benzo[e]pyrene, benzo[a]pyrene, perylene, indeno[1,2,3-cd]pyrene, benzo[ghi]perylene. The phenyl-, and methyl- derivatives of polycyclic aromatic hydrocarbons were also found in the samples. Phenyl derivatives of polycyclic aromatic hydrocarbons (PhPAHs) include phenylnaphtalenes (naphthalene, 1-phenyl-; naphthalene, 2-phenyl-) and terphenyls (o-terphenyl; m-terphenyl; p-terphenyl) as well as phenylphenanthrenes (phenanthrene, 9-phenyl-; phenanthrene, 1-phenyl-; phenanthrene, 3-phenyl-; phenanthrene, 2-phenyl-). Moreover, binaphtyls (1,1’-binaphthyl; 2,2’-binaphtyl) were also found in most of the samples. Among methyl derivatives of polycyclic aromatic hydrocarbons including methylphenanthrenes (3-metyl-; 2-metyl-; 4+9-metyl-; 1-metyl-) and anthracene, 2-methyl- have been identified. Phenols like o-cresol, m-cresol, p-cresol and phenol, 2-nitro- were also determined. It is worth mentioning that exposure to phenol may cause damage to the central nervous system, heart and kidneys.

Heavy metals like lead (av. of 1720 ppm), strontium (av. of 260 ppm), nickel (av. of 30 ppm), and vanadium (av. of 10 ppm) were marked among the elements toxic to human health.

Moreover, the lichens selectively absorb organic compounds like dehydroabietane and simonellite, which are characteristic of immature organic matter and may indicate low-quality coal combustion. Biomarkers investigated comprised pentacyclic triterpenoids (hopanes and moretanes) and steranes. Their distributions show distinctive differences indicating coal combustion in domestic furnaces (steranes absence or very low concentrations and short hopanes distribution) and traffic emission (cholestanes-rich distribution of steranes and long hopanes distribution up to C35). In conclusion, the research points out the usefulness of lichens as bioindicators regarding both organic and inorganic substances of anthropogenic origin.

The authors acknowledge financial support from the Polish National Science Centre 2022/06/X/ST10/00338 grant.

How to cite: Szram, E., Marynowski, L., and Fabiańska, M.: Lichens as bioindicators of air pollution assessment - a case study from the Upper Silesia region (Poland), EGU General Assembly 2024, Vienna, Austria, 14–19 Apr 2024, EGU24-15018, https://doi.org/10.5194/egusphere-egu24-15018, 2024.

EGU24-15027 | Posters on site | AS3.36

Source apportionment of PM2.5 in a major city in an Alpine valley during the cold season: the effects of atmospheric dispersion and inversion dynamics 

Mauro Masiol, Gianni Formenton, Flavia Visin, Alessandro Bonetto, Manuela Rovea, Silvia Ficotto, Elisa Danesin, Tommaso Toffanin, Anita Maggiulli, Maria Battistel, Giovanna Mazzi, Andrea Gambaro, Rossano Piazza, and Philip K. Hopke

Urban areas in mountain environments are generally located on valley floors surrounded by slopes, where mountain orography drives peculiar meteorology and atmospheric circulation. Also, persistent inversion dynamics may occur strongly affecting air pollution. This study characterised the PM2.5 pollution in a major city located in an Alpine valley (Belluno, Northeastern Italy) during the cold season (Autumn-Winter). Major aerosol species (elemental and organic carbon, major inorganic ions) and minor/trace elements conventionally used as tracers for source apportionment were analysed, including oxalate and specific PM2.5-bound tracers for biomass burning (K+, levoglucosan, mannosan, galactosan) and for primary biogenic organic aerosol (arabitol, mannitol, glucose). The major aerosol components are reconstructed through mass closure, while the major sources are identified through positive matrix factorization and a series of post-processing tools. Results indicate that biomass burning, mostly emitted by residential wood combustion for domestic heating, is the major PM2.5 source (52% PM2.5 mass concentration), followed by secondary aerosol, biogenic aerosol, traffic, and dust resuspension. The source contributions are therefore handled by accounting for the local meteorology. Insights on the dispersion or buildup of PM2.5 sources were then investigated by dispersion normalization. In addition, the possible effects of persistent thermal inversion events occurring across the Alpine valley are evaluated by assessing the inversion strength from temperature profiles measured from multiple ground-based weather stations at different elevations with respect to the air quality sampling station. Data analysed in this study reflects typical autumn/winter air pollution in a major Alpine valley. Significantly higher concentrations are recorded in colder months, i.e., when the newly proposed maximum daily concentrations for PM2.5 (25 μg m-3 not to be exceeded more than 18 times per calendar year, according to the Proposal for a Directive COM(2022) 542 final/2, 2022/0347(COD)) or the newest WHO air quality guidelines are frequently breached, posing serious concerns for meeting the forthcoming European air quality standard for PM2.5. Beyond the indication of which emission sources require further mitigation actions, this study also analyses the potential effects of local meteorology on PM2.5 pollution and air mass transport from the nearby Po Valley. This study is supported by the project iNEST (Interconnected North-Est Innovation Ecosystem) funded by the European Union Next-Generation EU.

How to cite: Masiol, M., Formenton, G., Visin, F., Bonetto, A., Rovea, M., Ficotto, S., Danesin, E., Toffanin, T., Maggiulli, A., Battistel, M., Mazzi, G., Gambaro, A., Piazza, R., and Hopke, P. K.: Source apportionment of PM2.5 in a major city in an Alpine valley during the cold season: the effects of atmospheric dispersion and inversion dynamics, EGU General Assembly 2024, Vienna, Austria, 14–19 Apr 2024, EGU24-15027, https://doi.org/10.5194/egusphere-egu24-15027, 2024.

EGU24-15161 | ECS | Posters on site | AS3.36

Impact of Urbanization and Agriculture cycles on Urban Heat Island Patterns and Aerosol Optical Depth over a City in Indo-Gangetic Plain, India 

Rohit Kumar Singh and Achanta Naga Venkata Satyanarayana

The present study explores the complex dynamics of land utilization, urbanization, and environmental factors within the Kanpur (26.4499° N, 80.3319° E) region, situated amidst the extensive agricultural landscapes of the Indo-Gangetic Plain (IGP). By examining various land classes, including vegetation, built-up areas, barren/fallow lands, and water bodies, during cultivation and harvest periods, we unveil a dynamic interplay influenced by seasonal agricultural cycles on urban heat island patterns. These transitions in land cover significantly impact Land Surface Temperature (LST) and Aerosol Optical Depth (AOD). Analysis of LST during cultivation and harvest periods reveals distinct temperature patterns, consistently higher in the city during cultivation but shifting to fallow and barren areas post-harvest. The UHI intensity exhibits dynamic variations during both cultivation and harvest periods, with UHI hotspots moving from the city to the outskirts, closely aligning with changes in land cover. Similarly, AOD patterns vary during cultivation and harvest, indicating increased AOD post-harvest, particularly in agricultural areas without crops. Higher AOD values during the harvest underscore the influence of land use land cover (LULC) changes on atmospheric aerosols. Concurrent with UHI trends, the Urban Air Pollution Index (UAPI) demonstrates that pollution hotspots shift from the city to the suburbs during the harvest. The study provides insights into the influence of urbanization on increasing zones of UHI and pollution hotspots within cities for proper environmental management practices.

How to cite: Kumar Singh, R. and Satyanarayana, A. N. V.: Impact of Urbanization and Agriculture cycles on Urban Heat Island Patterns and Aerosol Optical Depth over a City in Indo-Gangetic Plain, India, EGU General Assembly 2024, Vienna, Austria, 14–19 Apr 2024, EGU24-15161, https://doi.org/10.5194/egusphere-egu24-15161, 2024.

EGU24-15259 | Orals | AS3.36 | Highlight

Simulating air quality management policies in Europe with the SHERPA-Cloud model 

Enrico Pisoni, Davide De Marchi, Alberto Di Taranto, Bertrand Bessagnet, Stefano Zauli Sajani, Alexander De Meij, and Fabio Monforti-Ferrario

This presentation deals with the SHERPA-Cloud online simplified air quality model. Based on a previous version of the offline SHERPA model, this new online model can be used a) to simulate the impact of emission reduction scenarios on air quality, and b) to understand the main (sectoral and geographical) sources impacting air pollution for a given EU region or city.

From a methodological point of view, the model implements a set of SRR - source-receptor relationships (meta-model of the EMEP Chemistry Transport Model) and it is able to simulate the impact of an air policy in few seconds, with a good level of accuracy.

From the IT infrastructure and technologies points of view, the SHERPA-Cloud is based on an on-premise cloud system called BDAP (Big Data Analytics Platform) which provides a JupyterLab service and the tools to create dashboards from Jupyter notebooks using the Voilà plugin.

Thanks to its simple and easy-to-use interface, SHERPA-Cloud allows for various types of users, policy makers, citizens, NGOs and industries, to quickly test how air quality can changes when implementing new emission reduction strategies, and to focus efforts to the most efficient actions to improve air quality, in terms of geographical and sectoral policies. SHERPA-Cloud can also be used to support cities when dealing with the ‘Covenant of Mayor’ or the ‘Climate Neutral Cities’ initiatives, to evaluate the side-effects on air quality of climate mitigation measures.

The SHERPA-Cloud web application is available at this link: https://jeodpp.jrc.ec.europa.eu/eu/dashboard/voila/render/SHERPA/Sherpa.ipynb. The access to the application requires first a EUlogin account, the European Commission’s user authentication service.

How to cite: Pisoni, E., De Marchi, D., Di Taranto, A., Bessagnet, B., Zauli Sajani, S., De Meij, A., and Monforti-Ferrario, F.: Simulating air quality management policies in Europe with the SHERPA-Cloud model, EGU General Assembly 2024, Vienna, Austria, 14–19 Apr 2024, EGU24-15259, https://doi.org/10.5194/egusphere-egu24-15259, 2024.

EGU24-15261 | ECS | Posters on site | AS3.36

Analysing O3 levels and formation conditions via TROPOMI NO2 and HCHO retrievals for the Aegean Region 

Sedef Bayram and Burcak Kaynak

Tropospheric Ozone (O3) is a secondary pollutant formed via non-linear chemistry in the atmosphere with significant impacts on human health, ecosystem and crop production. The spatial distributions of HCHO and NO2 are strongly correlated with emissions of VOCs and NOx, O3 precursors, therefore, a proxy ratio of HCHO/NO2 (FNR) can be an indicator to understand the O3 formation where VOC/NOx ratios are not available. Changes in meteorological conditions, such as wind speed and direction, temperature, and relative humidity can affect the spatial and temporal patterns of O3 and its precursors. The Aegean Region of Turkey with its geographical location, urbanization and industry, and vegetation and agriculture, experiences high O3 levels, given its high number of sunny days throughout the years. However, a comprehensive study in this regard has not been conducted in the region previously. The aim of this study is to investigate the spatial and temporal changes of O3 and to understand the O3 production regime and the relationship with its precursors in the southern Aegean Region.

Within the study scope, ground-based NO2 and O3 measurements from the national monitoring network were used for understanding O3 pollution from 2019 to 2023. O3 and NOx (NO, NO2) are measured together at 33 air quality monitoring stations (AQMSs) in the Aegean Clean Air Region of Türkiye. 18% of the AQMSs exceeded EU limit for MDA8 O3 (maximum daily average 8-hr O3 >120 µg/m3, more than average of 25 days exceedance over recent 3 years) while almost 70% of the AQMSs exceeded World Health Organization (WHO) guidelines (>100 µg/m3 as MDA8 O3) in 2023. Manisa-Alasehir, Aydın-Efeler, and Izmir-Seferihisar AQMSs have consistently recorded the highest number of days, exceeding 100 days per year, according to the WHO guidelines. However, NO2 exceedances are limited in the AQMSs with O3 exceedances. Time series and pollution roses of O3 and NO2 were prepared to understand temporal changes along with meteorological parameters for stations with significant O3 problem. TROPOMI NO2 and HCHO retrievals within 6 km of AQMSs were processed, and FNR values were calculated for the same time period. O3 concentrations were examined by FNR values in order to explain O3 formation regimes. FNR values widely ranged in the region and the ozone season (May-September) average FNR values were estimated as 4.0<FNR<7.2 with maximum in Manisa-Alasehir, followed by Izmir-Seferihisar, and Aydın-Efeler, caused by high HCHO levels. In addition, correlation analysis of TROPOMI retrievals, ground-based measurements and meteorological parameters were performed.

The results of this study will contribute greatly to understand the ozone formation regime in the Aegean Region, to identify the areas with high O3 formation potential and finally to determine appropriate mitigation strategies and policies for air quality management for the control O3 and its precursors.

Keywords: Tropospheric O3, NO2, HCHO, FNR, the Aegean Region

How to cite: Bayram, S. and Kaynak, B.: Analysing O3 levels and formation conditions via TROPOMI NO2 and HCHO retrievals for the Aegean Region, EGU General Assembly 2024, Vienna, Austria, 14–19 Apr 2024, EGU24-15261, https://doi.org/10.5194/egusphere-egu24-15261, 2024.

EGU24-16233 | Posters on site | AS3.36

An analysis of the chemical composition of PM10 in Piedmont, Italy using Raman spectroscopy to determine the seasonal and geographic variation  

Rossana Bellopede, Lia Drudi, Paola Marini, Camila Mori De Oliveira, Milena Sacco, Francesco Matera, and Federica Pognant

Particulate Matter (PM) has a significant impact on the quality of life for an increasing number of people worldwide, especially in urban environments. Even though air quality control represents a crucial and actual problem, particulate analysis is often performed exclusively by the investigation of size distribution and concentration, providing limited information on the chemical composition and the origin of pollutants.

In this study it has been chosen to analyse PM10 samples coming from five air quality monitoring stations (Torino-Rebaudengo, Torino-Lingotto, Oulx, Ceresole Reale and Cavallermaggiore) of Regional Agency for the Protection of the Environment (Arpa Piemonte) spread in the Piedmont region. In particular, two stations (Torino-Rebaudengo and Torino-Lingotto) are located in the urban context of Turin (traffic and a background station) which is one of the most polluted city in Europe especially during winter when atmospheric stability condition combined to low precipitation and slow ventilation cause contaminant stagnation.

The analysis has been carried out using primarily Raman Spectroscopy to identify the main PM component. Scanning Electron Microscopy (SEM) equipped with an Energy- Dispersive X-ray (EDX) has been also used to obtain further information about the elemental composition and the size distribution, and to confirm the Raman results. A representative amount of particles with a geometric size between 1 μm and 10 μm has been analyzed to investigate the different PM composition and evaluate the chemical and seasonal variation in the PM composition. The main compound found are amorphous carbon, nitrate salts, sulfate salts, iron oxides, quartz and other silicate compounds, pollen but also few particles of titanium oxide and graphite.

Nitrate and sulfate content are directly related to warm and cold seasons; while amorphous carbon and iron oxides are strictly related to specific site features (geographic variation).


How to cite: Bellopede, R., Drudi, L., Marini, P., Mori De Oliveira, C., Sacco, M., Matera, F., and Pognant, F.: An analysis of the chemical composition of PM10 in Piedmont, Italy using Raman spectroscopy to determine the seasonal and geographic variation , EGU General Assembly 2024, Vienna, Austria, 14–19 Apr 2024, EGU24-16233, https://doi.org/10.5194/egusphere-egu24-16233, 2024.

EGU24-17610 | ECS | Posters on site | AS3.36

Applying a high-resolution atmospheric inversion framework to CO2 observations using GRAMM/GRAL 

Robert Maiwald, Thomas Lauvaux, Jani Strömberg, and Sanam N. Vardag

As urban areas encompass more than 70% of anthropogenic CO2 emissions, they are a crucial target for effective climate change mitigation. To monitor and verify CO2 mitigation strategies, atmospheric CO2 measurements can be assimilated into a Bayesian inversion framework to infer CO2 fluxes. Bayesian inversions combine knowledge of prior fluxes with atmospheric measurements under consideration of the atmospheric transport and its associated uncertainties to obtain CO2 fluxes. It is particularly interesting to constrain sub-urban and sector-specific CO2 fluxes for urban areas to pinpoint relevant emissions and to frame specific mitigation strategies. 

However, this approach requires the simulation of atmospheric transport processes at high-resolution to account for urban geometries and heterogeneities in emission patterns. We, therefore, use the GRAMM/GRAL model to simulate the atmospheric transport. GRAMM/GRAL computes concentration fields at high-resolution (e.g. 10x10m) using the Reynolds-Averaged Navier-Stokes equations together with a catalogue approach to pre-compute a set of meteorological situations (May et al., 2023). The catalogue approach allows the simulation of high-resolution concentration fields over long time periods because the computation time is decoupled from the simulation time. Therefore, the model is well suited for synthetic inversion studies conducted within an observing system simulation experiment (OSSE).

We developed a framework for high-resolution observing system simulation experiments (OSSE's) to analyse different urban network configurations with varying number, precision and location of sensors. We tested this framework over the city of Heidelberg, Germany, and evaluated different potential measurement network configurations to constrain the fossil fuel CO2 emissions (Vardag and Maiwald, 2023). Building on this development, we now seek to apply this framework to the Paris metropolitan area, where an actual CO2 measurement network has already been deployed (Horizon Europe, PAUL project). The network consists of multiple sensors of different types, which allows us to analyse different subsets of the sensors and compare their performances. We will present an outlook on the capabilities and shortcomings of our high-resolution inversion framework using the actual measurement network to estimate CO2 emissions. The results will provide insight on possible measurement network improvements, as well as on technical improvements of the framework.

May, Maximilian, Simone Wald, Ivo Suter, Dominik Brunner, and Sanam N. Vardag. 2024. “Evaluation of the GRAMM/GRAL Model for High-Resolution Wind Fields in Heidelberg, Germany.” Atmospheric Research 300 (April): 107207. https://doi.org/10.1016/j.atmosres.2023.107207.

Vardag, Sanam N., and Robert Maiwald. 2023. “Optimising Urban Measurement Networks for CO2 Flux Estimation: A High-Resolution Observing System Simulation Experiment Using GRAMM/GRAL.” Geoscientific Model Development Discussions, October, 1–28. https://doi.org/10.5194/gmd-2023-192.

How to cite: Maiwald, R., Lauvaux, T., Strömberg, J., and Vardag, S. N.: Applying a high-resolution atmospheric inversion framework to CO2 observations using GRAMM/GRAL, EGU General Assembly 2024, Vienna, Austria, 14–19 Apr 2024, EGU24-17610, https://doi.org/10.5194/egusphere-egu24-17610, 2024.

EGU24-17691 | ECS | Orals | AS3.36 | Highlight

Microscale modelling of NOx concentrations in a real urban hot-spot for several meteorological and traffic conditions 

Alejandro Rodríguez-Sánchez, José Luis Santiago, Marta G. Vivanco, Esther Rivas, Beatriz Sánchez, Alberto Martilli, Fernando Martín, Mark R. Theobald, Victoria Gil, Juan Luis Garrido, and Coralina Hernández

Recently, air quality has become a major concern for policy makers around the world, which has led to the implementation of mitigation measures. In urban areas, most measures affect the road transport sector, as this is one of the main contributors to air pollution in those areas. Due to the fact that spatial variability of urban air pollution is very heterogeneous, high spatial resolution modelling is necessary. In this context, this study aims to evaluate the air quality impacts of several measures applied to the traffic network around a real urban hot-spot (Plaza Elíptica, Madrid) at high spatial resolution.

The methodology used is based on Computational Fluids Dynamics (CFD) modelling, but uses different modelling tools to obtain all the necessary input data. The SUMO microscopic traffic simulator is used to obtain a dataset of traffic flows for each scenario selected in the study. This dataset represents the regular traffic during the week, avoiding the cost of computational time and resources to run simulations for each hour. Emissions are computed for each timestep of the simulations (0.75 s) using the emissions model PHEMLight5 coupled with SUMO. A set of steady-state CFD simulations are previously performed for all wind direction sectors and scenarios, using the previously described emissions. The horizontal spatial resolution of these simulations is of 5x5 m2, which higher resolutions (up to 1x1 m2) near buildings. Relevant meteorological variables are obtained from WRF simulations using the urban parameterization BEP-BEM. These are necessary for both selecting the appropriate CFD simulations from the dataset according to the observed wind direction at each hour and estimating NOx maps from pre-calculated CFD simulations based on the wind speed observed at each hour. Finally, background NOx concentrations are obtained from an urban background air quality monitoring station (AQMS) in Madrid, located 1.6 km NW from the AQMS of Plaza Elíptica.

Using this methodology, we have studied four scenarios:

  • Base scenario. (Year 2016)
  • Reorganization of traffic flows by changing traffic directions in some streets. (Year 2019)
  • The initial phase of the implementation of a Low Emissions Zone (ZBE) affecting the most polluting vehicles; with still some reduction of traffic due to the COVID-19 pandemic. (Year 2022)
  • The recovery of traffic after the COVID-19 pandemic. (Year 2023)

Results were evaluated for February 2016, 2019, 2022 and 2023 using the observed concentrations at the AQMS in the study area. The impacts of the traffic variations are investigated for different meteorological conditions.

How to cite: Rodríguez-Sánchez, A., Santiago, J. L., Vivanco, M. G., Rivas, E., Sánchez, B., Martilli, A., Martín, F., Theobald, M. R., Gil, V., Garrido, J. L., and Hernández, C.: Microscale modelling of NOx concentrations in a real urban hot-spot for several meteorological and traffic conditions, EGU General Assembly 2024, Vienna, Austria, 14–19 Apr 2024, EGU24-17691, https://doi.org/10.5194/egusphere-egu24-17691, 2024.

EGU24-18065 | ECS | Posters on site | AS3.36 | Highlight

The Growing Influence of Transportation Sector on PM10 Pollution in Warsaw metropolitan area (2019-2021) 

Aleksandra Starzomska, Jacek W. Kamiński, Grzegorz Jeleniewicz, Joanna Strużewska, and Aleksander Norowski

Air quality in urban areas is currently one of the most severe problems. High exposure to air pollution is due to high population density and higher pollutant concentrations than outside urban areas. A pollutant that exceeds limit concentrations in urban areas in Poland is PM10. The transport sector's contribution to air pollution throughout Warsaw (the capital of Poland) for PM10 particulate matter is 19%.

A modelling study carried out in Warsaw shows that the transportation sector is one of the important sources of pollution. We will present PM10 concentrations in Warsaw metropolitan area from 2019-2021. Based on the scenarios calculated with the "brute-force" approach, the contributions of line sources from transport, automobiles, railroads and airports were assessed.

The transportation sector's share in total emissions of PM10 is increasing annually. Over 3 years, the transportation sector's share in the Warsaw district increased by 5%. The largest share occurred in the two districts located in the centre and north of the city, an increase of 6 and 7%. Invariably, the lowest share of the territory of districts on the outskirts of the town is about 4%. In the 2019-2021 period, the transport sector's share increased in the Warsaw district by 4% and in districts adjacent to the city border by 3 %. In the districts located farther from the city centre, the increase in the share of emissions from the transport sector ranged from 1.5% to 0.5%.

How to cite: Starzomska, A., Kamiński, J. W., Jeleniewicz, G., Strużewska, J., and Norowski, A.: The Growing Influence of Transportation Sector on PM10 Pollution in Warsaw metropolitan area (2019-2021), EGU General Assembly 2024, Vienna, Austria, 14–19 Apr 2024, EGU24-18065, https://doi.org/10.5194/egusphere-egu24-18065, 2024.

EGU24-18993 | Orals | AS3.36

Multi-scale chemistry-transport modelling of the 2022 extreme Sahara dustevent over Paris 

Konstantin Kuznetsov, Abhinna Kumar Behera, Cheng Chen, Pavel Litvinov, and Oleg Dubovik

Mineral dust aerosol, predominantly soil-based particles, is a significant and ubiquitous component in the atmosphere, influencing both air quality and regional to global radiative balance. Accurately representing its impact at an urban scale, particularly with resolutions down to a few meters, remains challenging. To enhance our understanding of the global dust cycle, including transport, deposition, and the life cycle of dust aerosol, we adopt a multi-scale modelling approach. This study focuses on simulating the movement of Sahara dust across different scales: from the regional (Europe) to the urban (Paris).

For the regional scale analysis, we utilize the WRF-CHEM model, offering detailed insights into the movement of Sahara dust towards Europe. This model diverges from the conventional practice of using climatology data from inventories. Instead, we initialize and set boundary conditions for gas species and aerosols using CAMS reanalysis data, while ERA-5 reanalysis data provide the meteorological input. WRF-CHEM, an atmospheric chemistry model, incorporates the physics, chemistry, and morphology of dust aerosol, achieving a high resolution of 1km around Paris through a four-tiered grid nesting system (27 km², 9 km², 3 km², and 1 km²). The WRF model is refined hourly with ERA-5 data and every three hours with CAMS data at the boundary of the largest domain. Although the nested grids derive their initial conditions from their parent domain, they do not undergo further nudging.

On the urban scale, we employ code_saturne, a general-purpose CFD open-source solver developed by EDF R&D, to assess air flow and pollutant dispersion around buildings in central Paris. Outputs from the regional scale WRF-CHEM model serve as the initial and boundary conditions for these local scale simulations. A notable challenge in urban modelling is accessing complete and open building geometry data. OpenStreetMaps stands out as a comprehensive source for such geometrical data. To incorporate geometry from various sources (e.g., LiDAR measurements or shape files from the Institut Géographique National of France), we convert these into a point cloud format. This data then feeds into an internal mesh generator, based on the API of code_saturne, allowing us to create meshes with a spatial resolution of 2 meters near buildings and approximately 60 meters at the calculation domain's border. Comparisons with ground-based measurements show a qualitative alignment.

How to cite: Kuznetsov, K., Kumar Behera, A., Chen, C., Litvinov, P., and Dubovik, O.: Multi-scale chemistry-transport modelling of the 2022 extreme Sahara dustevent over Paris, EGU General Assembly 2024, Vienna, Austria, 14–19 Apr 2024, EGU24-18993, https://doi.org/10.5194/egusphere-egu24-18993, 2024.

The imperative reduction of anthropogenic greenhouse gas (GHG) emissions, coupled with the implementation of adaptation and mitigation strategies against climate change, stand as paramount objectives for developed societies and particularly for the big urban areas within the European Union.

Conducting a comprehensive quantitative analysis of urban GHG emissions beyond the official inventories remains as challenging issue. The absence of exhaustive, quantitative, contrasted and methodologically consistent GHG emission data from some urban activities and zones prevent a reliable documentation of actual emissions, avoiding the scientific understanding of their consequences at urban level and, eventually, the definition and application of effective mitigation policies..

Madrid City and its metropolitan area is the biggest and most densely populated zone in Spain. It is located in the center of the Iberian Peninsula enough far from other cities and it should play a pivotal role as a reference site for meticulous greenhouse gas monitoring in urban areas. To achieve this objective, a GHG monitoring station was launched in CIEMAT facilities in May 2023 equipped with a Picarro G2301 cavity ring-down spectrometer (CRDS), enabling real-time monitoring of CO2, CH4 and H2O with a 1-second time resolution. The ICOS protocol for its installation was strictly followed. This GHG station is located at the CIEMAT campus in Madrid  (coordinates: 40.456582, -3.725690) away from direct pollutant sources and very close to the Madrid-CIEMAT ACTRIS atmospheric monitoring station equipped with advanced instrumentation for aerosol monitoring, gaseous pollutants and meteorology.

During the initial phase of operation of this station, significant variations in GHG concentrations have been documented, as expected, including clear cyclical changes (daily, weekly and monthly). These evolutions are associated to local and regional air mases flows and further detailed investigation will provide valuable information about the contribution of urban GHG sources and the role of natural areas. Ongoing database in the coming months will reveal important details for understanding the evolution of these concentration levels, providing essential information for comparative assessments with other urban centers, and to quantify the contribution of primary urban sources to background concentrations.

Another objective for the middle term is to integrate Madrid-CIEMAT GHG station as an active part of ICOS Cities network.

How to cite: Pujadas, M., Dominguez, A., and Benitez, L.: The Madrid-CIEMAT GHG Station:  the first monitoring site for surveilling the influence of urban activities on GHG background levels in Spain, EGU General Assembly 2024, Vienna, Austria, 14–19 Apr 2024, EGU24-19528, https://doi.org/10.5194/egusphere-egu24-19528, 2024.

EGU24-19691 | Orals | AS3.36

EO data and AI techniques for measuring PM concentration and exposure at intra-urban scale: the APEMAIA Project 

Maria Adamo, Mariella Aquilino, Marica De Lucia, Silvana Fuina, Sabino Maggi, Cristina Tarantino, Francesco Carbone, Nicola Pirrone, Roberto Bellotti, Alfonso Monaco, Roberto Cilli, Alessandro Fania, Ester Pantaleo, Vincenzo Campanaro, Francesca Intini, Angela Morabito, Alessandra Nocioni, Ilenia Schipa, and Annalisa Tanzarella

A large number of medical research studies have shown that particulate air pollution poses a significant risk to health. In urban areas, where 55% of the global population now resides, a figure that according to the United Nations will rise to 70% by 2050, this correlation is under careful evaluation and requires further investigation.

According to the international framework of the Sustainable Development Goals of the United Nations 2030 Agenda (target 11.6 on reducing the environmental impact of cities) and the World Health Organisation guidelines, PM concentrations in urban areas must be weighted by population data to assess the impact of particulate matter on the population. This approach is crucial because certain areas may have high PM concentrations without being densely populated, or conversely, areas with lower concentrations may be predominantly inhabited by groups vulnerable to health risks.

In this context, it would be essential to be able to obtain information on PM concentrations as well as risk exposure assessments for different population groups at the intra-urban scale. This would help to identify those areas at higher health risk than others due to characteristics related to land use, urban morphology, socio-economic conditions and meteorological conditions.

The estimation of PM concentration from satellite data has emerged as a priority objective for upcoming Earth observation missions outlined by major space agencies. This includes the joint NASA/JPL and ASI program set to launch the Multi-Angle Imager for Aerosols (MAIA) sensor into orbit by 2024. This sensor represents a pioneering tool designed to estimate Aerosol Optical Depth (AOD) at the 1 km scale. Subsequent processing of the acquired data will yield measurements of PM concentrations.

As part of this collaboration and in response to the above-mentioned needs, ASI has decided to fund the APEMAIA project (Assessment of PM Exposure at the intra-urban scale in preparation for the MAIA mission). The project is designed to investigate the potential of MAIA by developing a multi-modular system for extracting PM concentrations at the intra-urban scale using Artificial Intelligence (AI) techniques. AOD maps derived from the integration of multi-source high-resolution (such as PRISMA, Sentinel-2, Sentinel-3) and medium-resolution data (MISR, MODIS, VIIRS, and simulated data from the upcoming MAIA mission) will be considered. In addition, the system will incorporate additional informative layers related to meteorological variables, land cover, and urban morphology.

Furthermore, the dasymetric method will be employed to disaggregate population data, initially provided for wider census areas, and reallocate them to cells within a final reference grid at a higher spatial resolution. The aim is to provide spatialised demographic data both as input for training AI models and for quantifying population exposure to PM at the intra-urban scale. Time series of PM concentrations measured by in-situ monitoring networks will also be used for training and validation of the AI models.

The study areas include the metropolitan area of Rome, a primary target for MAIA, and the urban areas of Taranto and Bari, designated as secondary targets.

How to cite: Adamo, M., Aquilino, M., De Lucia, M., Fuina, S., Maggi, S., Tarantino, C., Carbone, F., Pirrone, N., Bellotti, R., Monaco, A., Cilli, R., Fania, A., Pantaleo, E., Campanaro, V., Intini, F., Morabito, A., Nocioni, A., Schipa, I., and Tanzarella, A.: EO data and AI techniques for measuring PM concentration and exposure at intra-urban scale: the APEMAIA Project, EGU General Assembly 2024, Vienna, Austria, 14–19 Apr 2024, EGU24-19691, https://doi.org/10.5194/egusphere-egu24-19691, 2024.

EGU24-19886 | Posters on site | AS3.36 | Highlight

Paris Mid-cost CO2 sensor network. 

Olivier Laurent, Mali Chariot, Jinghui Lian, Hervé Utard, and Michel Ramonet

In the framework of the ICOS-Cities project, a network of more than 25 Midcost CO2 sensors has been deployed at the roof level in the Paris urban and suburban area. The purpose of such dense CO2 monitoring network is to feed an atmospheric inversion system for the quantification of CO2 emissions at the sub-city scale and/or discern specific sectors.

The presentation will mainly deal with the sensor characterization and the calibration strategy. It will focus on corresponding sensor performance in the field. It will then attempt to discuss the pertinence of such monitoring approach and its suitability for the city CO2 emission quantification.

How to cite: Laurent, O., Chariot, M., Lian, J., Utard, H., and Ramonet, M.: Paris Mid-cost CO2 sensor network., EGU General Assembly 2024, Vienna, Austria, 14–19 Apr 2024, EGU24-19886, https://doi.org/10.5194/egusphere-egu24-19886, 2024.

EGU24-20479 | ECS | Posters on site | AS3.36

Long-term measurements of greenhouse and reactive gases, and aerosols, at Saclay/SIRTA observatory in the Ile de France Region as part of ICOS and ACTRIS   

Laura Bouillon, Valérie Gros, Jean-Eudes Petit, Nicolas Bonnaire, Michel Ramonet, Morgan Lopez, Carole Philippon, and Camille Yver Kwok

Today, around 7 million deaths a year worldwide are linked to air pollution. Moreover, urban planning projections show that by 2050, there will be 2 billion more people in cities, further increasing the contribution of cities to rising CO2 emissions. In addition, this could lead to health problems linked to deteriorating air quality.

Our study focuses on the city of Paris and the Ile de France region, where the main pollutant and CO2 emission sectors are road traffic and the residential sector. Depending on the emission sector, there is co-emission between pollutants and greenhouse gases which can be used to link atmospheric observations of those components to a particular sector. This so-called multi-component atmospheric approach can therefore complement the information provided by sectorial inventories. This study uses data measured on the Saclay peri-urban site to analyze long-term time series of CO2 and pollutants with meteorological conditions and surface emissions.

At Saclay, the ACTRIS SIRTA station measures reactive gases, and aerosol while the ICOS tall tower measures greenhouse gases. The two stations are not co-located but are only 2 km apart. The compounds chosen for this study are CO2, CO, CH4, from the ICOS tower, and NOx, O3, and black carbon (BC) from the SIRTA site. The BC has been separated into wood burning (BCwb) and fossil fuel (BCff) contributions. The data from the two stations cover more than ten years of measurements for all the compounds mentioned. Since Saclay is located about 20km from southwest Paris, it was necessary to distinguish between two geographical sectors. An urban sector with the main contribution from Paris and a rural sector for comparison with concentrations close to background levels. The two sectors account for more than 44% of total data.

The diurnal cycles of the studied compounds show similar patterns in the urban and rural sectors but with very contrasted amplitudes. The NO2, BCff, and CO cycles in the urban sector are strongly driven by the traffic with morning and evening peaks corresponding to the rush hours. On the other hand, BCwb diurnal cycle peaks mainly in the evening as expected with the timing of the residential heating, and contrary to other species the amplitudes of the maximum are higher in the rural sector. This can be explained by the larger use of wood burning in the rural areas, whereas it is strictly regulated in Paris.

The diurnal cycle of CO2 peaks in the morning mainly due to photosynthesis, but a share comes from emissions from transport or the tertiary sector. Species ratios, such as CO/CO2 and NO2/CO2, are calculated for further study and comparison with emission inventories.

The study will also include analysis of seasonal cycles and long-term trends for the two geographical sectors.

How to cite: Bouillon, L., Gros, V., Petit, J.-E., Bonnaire, N., Ramonet, M., Lopez, M., Philippon, C., and Yver Kwok, C.: Long-term measurements of greenhouse and reactive gases, and aerosols, at Saclay/SIRTA observatory in the Ile de France Region as part of ICOS and ACTRIS  , EGU General Assembly 2024, Vienna, Austria, 14–19 Apr 2024, EGU24-20479, https://doi.org/10.5194/egusphere-egu24-20479, 2024.

EGU24-20857 | ECS | Orals | AS3.36 | Highlight

Sensors as a component of urban air quality management planning: a case study with AirGradient OpenAir PM monitors from Accra, Ghana. 

Collins Gameli Hodoli and the Network for Atmospheric and Air Quality Research (NAAQR)

Millions of premature deaths across Africa every year are attributed to air pollution. Of specific mention is exposure to fine particles, PM2.5. We present in this study a novel concept using the non-parametric wind regression approach and low-capital-cost (LCC) air sensor data to identify sources of PM2.5 pollution. This study is based on PM2.5 data collected at the University of Ghana (Afri-Set), Accra using the AirGradient OpenAir PM2.5 monitor from June 01 to September 15, 2023. Using the raw, calibrated, and regulatory grade data from the Teledyne API PM Mass Monitor T640, we found a good agreement between the identified sources of PM2.5. Additionally, we observed that high PM2.5 levels (21 µgm-3) were experienced during S, W, SW and SE winds. At low wind speeds (≤ 1 ms-1), PM2.5 pollution was high suggesting a possible local source. Although there were differences in concentrations comparing the raw and the reference grade data, our results showed that PM2.5 sources were similar. A diurnal pattern of the observed PM2.5 also shows a high similarity between the 3 sets of data. Peak levels (15-20 µgm-3) were observed at 07:00 to 14:00 hrs and 18:00 to 23:00 hrs associated with SW winds. Between 00:00 and 04:00 hrs, low levels (below 15 µgm-3) were observed and associated with W and SW winds. Southerly observations were below 15 µgm-3 with high levels  (15-20 µgm-3) easterly between 04:00 and 08:00 hrs.  This indicates that the raw data from the LCC PM air sensor is suitable for developing and tracking air pollution mitigation strategies, especially in environments with similar characteristics, with some caveats. We recommend a further investigation of the site tied to prevailing background activities to provide a vivid understanding of the potential contributing factors from the observed wind directions.

Keywords: Air Pollution; Source Identification; Air Sensors; Ghana; PM2.5

How to cite: Hodoli, C. G. and the Network for Atmospheric and Air Quality Research (NAAQR): Sensors as a component of urban air quality management planning: a case study with AirGradient OpenAir PM monitors from Accra, Ghana., EGU General Assembly 2024, Vienna, Austria, 14–19 Apr 2024, EGU24-20857, https://doi.org/10.5194/egusphere-egu24-20857, 2024.

EGU24-2091 | Posters on site | AS3.37

A reference facility for the comparison of CO2 in Air isotope ratio standards 

Edgar Flores, Tiphaine Choteau, Philippe Moussay, Han Jun Eun, Colin Allison, and Robert I. Wielgosz

The commercial development of laser-based instruments over the last decade that can measure real-time isotopic ratio variations of greenhouse gases, and notably CO2, has allowed their application across a wide range of scientific and technical disciplines. Precise measurements can be achieved, and appropriate calibration strategies [1] and standards need to be applied to achieve accurate results and consistency with traditional mass spectrometric measurement methods. For CO2, calibration strategies can be based on using CO2 in air standards with the same isotopic ratios but containing different amount fractions, or the same amount fraction and different isotope ratios. This has resulted in the availability of calibration standards containing different isotope ratios at different amount fractions, which may or may not contain nitrous oxide. An international comparison programme at the BIPM (BIPM.QM-K4) is in development to demonstrate the equivalence of such standards, which would allow them to be used interchangeably by operators.

The BIPM’s comparison facility is based on a dual inlet isotope ratio mass spectrometer with a custom built (BIPM) Air Trapping system (BAT) to extract CO2 from air mixtures using cryogenic separation for determination of δ13Cand δ18O-CO2, with a correction for the N2O present in the sample. A procedure for regularly determining the relative ionization efficiency of N2O in relation to CO2 has been developed and is applied as a function of the amount fraction of N2O in the sample. Metrological traceability is achieved through a hierarchy of low-pressure CO2 standards with δ13C values nominally at -1 ‰, -35 ‰ and -43 ‰, calibrated on the VPDB scale via IAEA 603 carbonate standard material. Initial validation of the performance of the facility has been performed with the extraction of CO2 from gas mixtures within the range of 380 μmol mol−1 to 800 μmol mol−1 and δ13C and δ18O-CO2 values from 1 ‰ to -43 ‰ and -7 ‰  to -35 ‰, respectively. The method demonstrates excellent reproducibility, with standard deviations of 0.005% and 0.05%. for δ13C  and δ18O-CO2, respectively. In addition, the robustness of the N2O correction has been demonstrated by comparing δ13C  and δ18O-CO2 values from standards produced from the same CO2 source gas but at differing amount fractions. The performance and validation of the facility will be described.


[1] Flores, E., Viallon, J., Moussay, P., Griffith, D. W. T. & Wielgosz, R. I. Calibration strategies for FT-IR and other isotope ratio infrared spectrometer instruments for accurate δ13C and δ18O measurements of CO2 in air. Anal. Chem. 89, 3648–3655 (2017).

How to cite: Flores, E., Choteau, T., Moussay, P., Eun, H. J., Allison, C., and Wielgosz, R. I.: A reference facility for the comparison of CO2 in Air isotope ratio standards, EGU General Assembly 2024, Vienna, Austria, 14–19 Apr 2024, EGU24-2091, https://doi.org/10.5194/egusphere-egu24-2091, 2024.

EGU24-2131 | Posters virtual | AS3.37

METAS: the new WMO-GAW Central Calibration Laboratory for halogenated VOCs 

Tobias Bühlmann and Diana Roos

Many halogenated volatile organic compounds (VOCs) are found in the atmosphere in the pmol/mol range. These halogenated VOCs have negative impacts on the environment as they are strong greenhouse gases and/or contribute to the depletion of the stratospheric ozone layer or their degradation products may have a negative impact on the environment. This underpins the importance to accurately measure the amount fractions of these substances in the atmosphere on the long-term.
The Global Atmosphere Watch (GAW) Programme of the World Meteorological Organization (WMO) is a long-term international global programme that coordinates observations and analysis of atmospheric composition changes. The GAW Programme is a collaboration of more than 100 countries and it relies fundamentally on the contributions of its members to help to build a single, coordinated global understanding of atmospheric composition and its change. For most substances there is a Central Calibration Laboratory (CCL) that is responsible for maintaining and distributing the WMO references for instrument calibration for a specified gas in air. However, until summer 2023 there was no CCL for halogenated VOCs. METAS applied successfully for the CCL function for a total of ten halogenated VOCs because METAS' gas analysis laboratory has a decade of experience in the production of reference gas mixtures for halogenated VOCs. Here, we will present our new function as CCL including our services, the work done in the past and the planned work for the next years.

How to cite: Bühlmann, T. and Roos, D.: METAS: the new WMO-GAW Central Calibration Laboratory for halogenated VOCs, EGU General Assembly 2024, Vienna, Austria, 14–19 Apr 2024, EGU24-2131, https://doi.org/10.5194/egusphere-egu24-2131, 2024.

EGU24-6528 | Posters on site | AS3.37

Assessment of spectroscopic instruments for continuous atmospheric nitrous oxide monitoring 

Lukas Emmenegger, Christoph Zellweger, and Martin Steinbacher

In recent years, the field of laser spectroscopy has witnessed significant progress, leading to major advancements in the detection of atmospheric trace gases. This technological evolution is reflected in a growing number of commercial implementations, especially for prevalent atmospheric gases, such as carbon dioxide (CO2) and methane (CH4). The spectrum of detectable trace gases continues to expand, and manufacturers offer instruments with increasing performance in term of selectivity, sensitivity, power consumption, compactness and cost-effectiveness.

In this presentation, we focus on recent instruments for the observation of atmospheric nitrous oxide (N2O). N2O is a major long-lived greenhouse gas which plays an important role in stratospheric ozone depletion, but still suffers from inadequate global data coverage. Therefore, the advent of more economical yet resilient instruments, demanding less space and power compared to conventional models, presents a welcome opportunity to broaden the N2O monitoring network.

We provide an overview of laboratory tests carried out at Empa on a variety of commercial models. The evaluated techniques include (i) Mid-IR Tunable Diode Laser Spectrometry (TDLAS) with Interband Cascade Lasers (ICLs) and Quantum Cascade Lasers (QCL), (ii) Optical Feedback – Cavity Enhanced Absorption Spectroscopy (OF-CEAS), (iii) Off-Axis Integrated Cavity Output Spectroscopy (OA-ICOS), and (iv) Cavity Ringdown Spectroscopy (CRDS).

The tests assessed the suitability of the instruments for precise atmospheric N2O monitoring and provide insights into the operation, data handling and quality assurance / quality control procedures required for long-term operation. Particular attention was paid to the evaluation of the short-term precision and stability of the instrument response and the repeatability within days to weeks.

Overall, the instrument performance is still superior for the most-established CRDS and OA-ICOS analyzers, which are widely used in the Global Atmosphere Watch (GAW) programme and the European Integrated Carbon Observation System Research Infrastructure (ICOS-RI). Nevertheless, the latest generation of TDLS and OF-CEAS instruments are cost-efficient alternatives, which may be suited for more extensive networks, such as the ones to be designed under the umbrella of World Meteorological Organization's new Global Greenhouse Gas Watch (G3W) programme. However, great care needs to be taken in terms of quality assurance and quality control (QA/QC) to ensure long-term accuracy and traceability. The most cost-efficient instrumental components still need to be identified as a function of the scientific targets and the related network design.

How to cite: Emmenegger, L., Zellweger, C., and Steinbacher, M.: Assessment of spectroscopic instruments for continuous atmospheric nitrous oxide monitoring, EGU General Assembly 2024, Vienna, Austria, 14–19 Apr 2024, EGU24-6528, https://doi.org/10.5194/egusphere-egu24-6528, 2024.

EGU24-9997 | ECS | Posters on site | AS3.37

Status of Traceability in BC Measurements: Need of an Agreed Method 

Arpit Malik and Shankar G. Aggarwal

The accurate measurement of Black Carbon (BC) holds significant importance for regulatory compliance and for effectively identifying sources to mitigate associated health and climate effects. Presently, BC measurement techniques can be broadly classified into three categories: (i) Optical Absorbance, (ii) Evolved Carbon, and (iii) Laser-Induced Incandescence. Among these, photometers based on optical absorbance principle are widely used for continuous, long-term measurements due to their operational simplicity and ability to provide near real-time data. However, there is a lack of consensus on the traceable calibration procedures for commercially available optical absorbance-based photometers (e.g., aethalometer, COSMOS (continuous soot monitoring system), MAAP (multi-angle absorption photometer), and PSAP (particle soot absorption photometer)). Moreover, there is inconsistency in critical measurement parameters, despite all photometers being working on the same Beer-Lambert principle.

  Optical photometers are generally calibrated by comparing them against a reference instrument of higher accuracy. However, there is no agreement upon instrument or method which should serve as a reference standard. Researchers utilize different methods, including laser-induced incandescence (Malik et al., 2022), the evolved carbon (Li et al., 2023), and photoacoustic spectrometry (Malik and Aggarwal, 2021), each grounded in distinct measurement principles, resulting in inconsistent calibrating procedures. Furthermore, there is no consensus on reference BC particles, as various material like Aqua Dag, fullerene soot, glassy carbon spheres, as well as BC core mass from the diesel engines are being used for calibrating these reference instruments (Malik and Aggarwal, 2021). These ambiguities and variability in calibration protocol poses a challenge to traceability of BC measurements by optical photometers.

  Apart from traceability issue, there exists an inconsistency in different parameters involved in absorption coefficient (which is ultimately converted into BC maas) measurement by optical photometers. Firstly, there is ambiguity regarding the optimal wavelength for measuring the absorption coefficient to derive BC mass concentrations. For example, the absorption coefficient derived at 880 nm wavelength channel of Aethalometer is used to derive the BC mass concentration, whereas in other photometers the measurements are done at 565 nm (COSMOS, PSAP), and 630 nm (MAAP). Additionally, there is no uniformity in defining the particulate matter (PM) size cutoff for BC measurement, nor in the selection of filter media (quartz, glass etc.) for PM mass collection.

  Addressing these ambiguities highlights the need of standardization of measurement method for continuous long-term measurement of BC. Additionally, establishing a traceable calibration method is essential to ensure uniformity in BC measurements. 

References

Li, W., Wang, Y., Yi, Z., Guo, B., Chen, W., Che, H., Zhang, X., 2023. Evaluation of MERRA-2 and CAMS reanalysis for black carbon aerosol in China. Environmental Pollution 123182.

Malik, A., Aggarwal, S.G., 2021. A Review on the Techniques Used and Status of Equivalent Black Carbon Measurement in Two Major Asian Countries. Asian Journal of Atmospheric Environment (AJAE) 15.

Malik, A., Aggarwal, S.G., Ohata, S., Mori, T., Kondo, Y., Sinha, P.R., Patel, P., Kumar, B., Singh, K., Soni, D., Koike, M., 2022. Measurement of Black Carbon in Delhi: Evidences of Regional Transport, Meteorology and Local Sources for Pollution Episodes. Aerosol Air Qual Res 22, 220128. 


How to cite: Malik, A. and G. Aggarwal, S.: Status of Traceability in BC Measurements: Need of an Agreed Method, EGU General Assembly 2024, Vienna, Austria, 14–19 Apr 2024, EGU24-9997, https://doi.org/10.5194/egusphere-egu24-9997, 2024.

EGU24-10485 | ECS | Posters on site | AS3.37

Recommendations for reporting equivalent Black Carbon (eBC) concentration based on long-term pan-European in-situ observations 

Marjan Savadkoohi, Marco Pandolfi, Andres Alastuey, and Xavier Querol

To incorporate Equivalent Black Carbon (eBC) as a new variable in air quality (AQ) guidelines and to develop effective mitigation strategies, it is crucial to estimate its mass concentration consistently throughout the AQ monitoring networks (AQMNs) with minimal uncertainties. A reliable determination of eBC mass concentrations derived from filter absorption photometers (FAPs) measurements depends on the appropriate quantification of the mass absorption cross-section (MAC) for converting the absorption coefficient (babs) determined from FAPs measurements to eBC. Several studies have shown substantial variability in MAC due to local and regional variability in e.g., eBC sources, burning conditions, and eBC internal mixing among others. This MAC variability may lead to considerable uncertainty in eBC estimation. This study investigates the spatial-temporal variability of the MAC obtained from simultaneous elemental carbon (EC) measurements and babs determination performed following the ACTRIS procedures at 22 sites. We compared different methodologies for retrieving eBC integrating different options for calculating MAC, including locally derived MAC, median MAC value calculated from 22 sites, and site-specific rolling regression MAC. The eBC concentrations that underwent corrections using these methods were identified as MeBC (median MAC), LeBC (local MAC), and ReBC (Rolling MAC) respectively. These corrected eBC concentrations were compared with eBC as directly provided by FAPs (NeBC; nominal instrumental MAC). The median MAC values were 7.8 ± 3.4 m2 g−1 from 12 aethalometers at 880 nm, and 10.6 ± 4.7 m2 g−1 from 10 MAAPs at 637 nm. Combining datasets obtained from these two types of FAPs resulted in a median value of about 10.7 ± 4.8 m2 g−1 at 637 nm. However, the experimental MAC values showed significant site and seasonal dependencies, with heterogeneous patterns between summer and winter in different regions. Pronounced differences (up to more than 50%) were observed between NeBC from FAPs and ReBC due to the differences observed between the experimental and nominal MAC values. Moreover, long-term trend analysis revealed a statistically significant (s.s.) decreasing trend in EC mass concentrations. Interestingly, we show that the corresponding corrected eBC trends are not independent of the way eBC is calculated, due to the variability of MAC. NeBC and EC decreasing trends were consistent at sites with no significant trend in experimental MAC. Conversely, where MAC showed a s.s. trend, the NeBC and EC trends were not consistent while ReBC concentration followed the same pattern as EC. These results underscore the importance of accounting for MAC variations when deriving eBC measurements from FAPs and emphasize the necessity of incorporating EC observations to constrain the uncertainty associated with eBC. Thus, this study recommends the use of co-located measurements of babs and EC mass concentrations by expanding monitoring networks to include regular EC sampling. However, in situations where EC observations are unavailable, we recommend applying the default MAC value of around 10 m2 g−1 recommended by ACTRIS when babs is provided by MAAP at 637 nm and the MAC value of 7.8 m2 g−1 when babs is provided by aethalometers at 880 nm.

How to cite: Savadkoohi, M., Pandolfi, M., Alastuey, A., and Querol, X.: Recommendations for reporting equivalent Black Carbon (eBC) concentration based on long-term pan-European in-situ observations, EGU General Assembly 2024, Vienna, Austria, 14–19 Apr 2024, EGU24-10485, https://doi.org/10.5194/egusphere-egu24-10485, 2024.

Agricultural processes are the main source of ammonia emissions, and they are a significant source of methane emissions. For quantification of emissions from livestock animal housings onsite measurements for these gases are needed in parallel with certified reference standards that enable SI-traceability of the measurement results. We have developed dynamic reference gas generation method that is suitable for onsite use when calibrating the analysers and sensors applied either inside or outside the animal housings, for determination of ammonia concentrations in large enough concentration range spanning several orders of magnitude. In combination with static reference gas mixtures for greenhouse gases that are measured in parallel with ammonia, this method is used to calibrate and validate measurements of these most important molecular emissions from agriculture. We present the results of application of this methodology onsite for calibration of different types of sensors and analysers that provide the primary concentration data used in calculations sourcing data for corresponding emissions inventory reports.

How to cite: Rajamäki, T.: Traceable onsite measurement of ammonia and greenhouse gas emissions from livestock production, EGU General Assembly 2024, Vienna, Austria, 14–19 Apr 2024, EGU24-12088, https://doi.org/10.5194/egusphere-egu24-12088, 2024.

EGU24-13177 | Posters virtual | AS3.37

Realisation of primary mixtures of CO2 in air at known isotopic composition 

Francesca Rolle, Francesca Durbiano, Stefano Pavarelli, Francesca Romana Pennecchi, and Michela Sega

The monitoring of the increasing levels of CO2 in atmosphere, together with the discrimination between the natural and anthropogenic sources of CO2, is of utmost importance to support climate change studies and the reduction of the CO2 emissions from human activities in the close future. The involvement of the metrological community is essential to achieve the comparability of results over space and time, to assure accuracy and metrological traceability, linking all the individual measurement results to common and stable reference standards.

The availability of sound and affordable reference materials for the measurement of the isotopic composition of CO2 at ambient amount fraction is foreseen to support the researchers operating in the isotope measurement field, by means of spectroscopic techniques, to assure the metrological traceability for the determination of the isotopic composition of CO2 in air. Reference gas mixtures at known isotopic composition produced by means of primary methods, such as gravimetry, represent a good opportunity for this purpose.

At INRiM, the Italian National Metrology Institute, the realization of gaseous reference materials of CO2 in air at known δ13C-CO2 started within the European Joint Research Project (JRP) 16ENV06 SIRS, and continued with the JRP 19ENV05 STELLAR.

The reference mixtures are realized by the gravimetric method, following the ISO standard 6142-1, in high-pressure cylinders of aluminum alloy, obtaining low preparation uncertainties of 0.33 % for the CO2 amount fraction at atmospheric level. These mixtures are prepared from parent mixtures at higher amount fraction, realized at INRiM from different pure CO2 sources.

Non Dispersive Infrared Spectroscopy (NDIR ABB URAS 14, Switzerland) is used to verify the mixtures for their amount fraction values while Fourier Transform Infrared Spectroscopy (FTIR Thermo Scientific Nicolet iS50, USA) is used for the δ13C-CO2 value assignment. The δ13C-CO2 values of the gravimetric mixtures span in the range from +1.3 ‰ to -42 ‰.

Recently, a Cavity Ring-Down Spectrometer (CRDS G2131i Picarro, USA) was acquired to double-check the isotopic composition of the prepared mixtures. Preliminary tests were carried out for the metrological characterization of the instrument, followed by the set-up of the analytical methodology for the confirmation of the isotopic composition of some mixtures prepared within the STELLAR project and sent to other project partners for analysis in the past two years. The results of the tests carried out are presented in this work, together with some future perspectives for the realization of primary reference mixtures of CO2 in air at know isotopic composition on a larger scale.


How to cite: Rolle, F., Durbiano, F., Pavarelli, S., Pennecchi, F. R., and Sega, M.: Realisation of primary mixtures of CO2 in air at known isotopic composition, EGU General Assembly 2024, Vienna, Austria, 14–19 Apr 2024, EGU24-13177, https://doi.org/10.5194/egusphere-egu24-13177, 2024.

The Proton-transfer-reaction mass spectrometer (PTR-MS) has become an important tool for real-time monitoring of volatile organic compounds (VOCs) in the atmosphere. PTR-MS is semi-quantitative in untargeted analysis if the transmission of the analytes is well constrained. The transmission at different m/z is determined by using commercial calibration standards.

We present an additional method to constrain the instrument transmission using well-monitored ozone-depleting substances in the atmosphere. Ozone-depleting substances such as chlorofluorcarbons (CFCs)  are banned and monitored through the Montreal Protocol, but their concentration in the atmosphere is relatively stable, and due to their long lifetime they are well mixed. Two of these banned substances can be detected using PTR-MS, namely Trifchloroluoromethane (CFC-11) and carbon tetrachloride (CCl4). Their major ion CCl3+ is measured at m/z 116.906. A clear signal at this mass is observed in all atmospheric measurements. Since the concentrations of CFC-11 and CCl4 in the atmosphere are measured frequently by global monitoring networks, they can be used to determine the transmission at m/z 116.906. We experimentally determined the pseudo-reaction rate constants of CFC-11 and CCl4. Utilizing this, the transmission of m/z 116.906 can be determined using any atmospheric measurements in the past or present. This innovative approach can be a useful tool for quality control of PTR-MS data and checking instrument performance during measurements.

How to cite: Holzinger, R. and Notø, H. Ø.: CFC-11 and CCl4 in the Atmosphere: A free calibration standard for Proton-Transfer-Reaction Mass-Spectrometry (PTR-MS), EGU General Assembly 2024, Vienna, Austria, 14–19 Apr 2024, EGU24-17820, https://doi.org/10.5194/egusphere-egu24-17820, 2024.

EGU24-17994 | ECS | Posters on site | AS3.37

First Synthetic Isotopic Methane Gas Reference Materials for Optical Isotope Ratio Spectroscopy 

Emily Hopkinson, Emmal Safi, Chris Rennick, Aimee Hillier, Eric Mussell-Webber, Heiko Moossen, Freya Wilson, Ruth Hill-Pearce, David Worton, Paul Brewer, and Tim Arnold

Isotope ratio is a powerful tool for discriminating between sources and sinks of greenhouse gases, enabling their source apportionment. We have produced the first high volume and high-pressure methane (CH4) gas reference materials with a certified δ13C-CH4 and δ2H-CH4 in a synthetic air matrix. This matrix contained ambient amount fractions of the major air components and key greenhouse gases CO2 and N2O.

The SI traceable methane in air reference materials were gravimetrically produced in 10 L cylinders at a pressure of 100 bar to fulfil the high-volume calibration requirements of optical isotope ratio spectroscopy (OIRS) techniques. The methane sources were chosen to span the observed atmospheric δ13C-CH4 and will be used to monitor the isotope ratio of atmospheric methane at sites across Europe.

The δ13C-CH4 and δ2H-CH4 of pure methane sources and diluted methane references were measured via isotope ratio mass spectrometry (IRMS). The diluted methane reference materials were used to characterise an OIRS (Aerodyne Research Inc.) analyser fitted with an in-house built pre-concentrator. Further methane sources were characterised for δ13C-CH4 and δ2H-CH4 after dilution on the calibrated Aerodyne to create a suite of reference materials with δ13C-CH4 values spanning -51.94 to -39.19 ‰ and -202.56 to – 182.04 ‰ for δ2H-CH4.

Uncertainty budgets for the diluted reference materials will be presented with gravimetric amount fraction uncertainties aiming towards the World Metrological Organization Global Atmosphere Watch (WMO-GAW) compatibility goal of 2 nmol mol-1 across the amount fraction range of 1.75-2.10 µmol mol-1. Reference materials were produced at a range of amount fractions (1.7 to 569 µmol mol-1) required to calibrate different OIRS techniques. Commonly interfering matrix components Ar, O2, CO2 and N2O were added at ambient amount fractions (420 µmol mol-1 and 335 nmol mol-1 for CO­2 and N2O respectively). Approximately 30 reference materials, each containing around 1000 litres of gas were distributed to seven partners in the EMPIR Metrology for European emissions verification on methane isotopes (isoMET) project. Measurements using these reference materials will enable comparability of isotopic methane data collected as part of national and international monitoring networks.

How to cite: Hopkinson, E., Safi, E., Rennick, C., Hillier, A., Mussell-Webber, E., Moossen, H., Wilson, F., Hill-Pearce, R., Worton, D., Brewer, P., and Arnold, T.: First Synthetic Isotopic Methane Gas Reference Materials for Optical Isotope Ratio Spectroscopy, EGU General Assembly 2024, Vienna, Austria, 14–19 Apr 2024, EGU24-17994, https://doi.org/10.5194/egusphere-egu24-17994, 2024.

EGU24-18482 | Posters on site | AS3.37

Meeting the demand for δ13C-CO2, δ18O-CO2, δ13C-CH4 and δ2H-CH4 Reference Materials for Climate Monitoring 

Ruth Hill-Pearce, Eric Mussell-Webber, Aimee Hillier, and Paul Brewer

The introduction of widely available optical isotopic ratio spectroscopy (OIRS) has enabled in-field measurements of isotopologues of carbon dioxide and methane (CO2 and CH4), allowing the source apportionment of greenhouse gases through distinguishing between natural and anthropogenic emissions of CO2 and CH4. At present, there are no existing internationally accepted reference materials which provide traceability for the calibration of δ¹³C-CO2, δ¹³C-CH4, δ2H-CH4 and δ¹8O-CO2 OIRS measurements which meet the World Metrological Organisation’s data compatibility goals to underpin global measurements.

We present the latest progress achieved during the EMPIR project Stable Isotope Metrology to Enable Climate Action and Regulation (STELLAR), on the development of primary reference materials (PRMs) which are traceable to the SI for amount fraction and existing isotope ratio scales. The production and certification of pure and ambient amount fraction reference materials is discussed alongside the sensitivities of the production and sampling process to isotopic fractionation. Methodologies for mitigating fractionation during PRM production and sampling will be outlined.

The production of the air matrix and the effects of trace gases and water vapour in the air matrix on the isotope ratio of the ambient PRMs is presented. The effects of trace gases in the matrix on the measurement of the isotope ratio of the ambient amount fraction CO2 and CH4 PRMs is also discussed for OIRS techniques.

We demonstrate achievement of the targeted uncertainties in δ¹³CVPDB-CO2 of ± 0.1 ‰ and ± 0.5 ‰ for δ¹8OVPDB-CO2. Uncertainty budgets are presented and the main contributions to the uncertainty budget are highlighted. The stability of the isotope ratio of the PRMs with pressure and time (2 years) is also discussed alongside comparisons with existing scales for amount fraction.

How to cite: Hill-Pearce, R., Mussell-Webber, E., Hillier, A., and Brewer, P.: Meeting the demand for δ13C-CO2, δ18O-CO2, δ13C-CH4 and δ2H-CH4 Reference Materials for Climate Monitoring, EGU General Assembly 2024, Vienna, Austria, 14–19 Apr 2024, EGU24-18482, https://doi.org/10.5194/egusphere-egu24-18482, 2024.

EGU24-19027 | ECS | Posters on site | AS3.37

Intercomparison of greenhouse gas measurements using whole air and synthetic standards at UK tall tower sites  

Emmal Safi, Chris Rennick, Grant Forster, Simon O'Doherty, Joe Pitt, Eric Mussell-Webber, Ruth Hill-Pearce, Aimee Hillier, Dave Worton, Paul Brewer, Kanokrat Charoenpornpukdee, and Tim Arnold

Greenhouse gas (GHG) measurements are crucial for understanding climate change. Therefore, the World Meteorological Organisation (WMO) identified them as critical for global monitoring. There is a need for an infrastructure that can provide traceable atmospheric measurements to underpin the fulfilment of internationally agreed emissions reduction targets.    

High accuracy gas Reference Materials (RMs) are required to underpin GHG composition measurements for long term temporal and spatial trend analysis. These are prepared by compressing whole-air into high pressure cylinders for direct use following measurement by a central calibration laboratory (CCL) to provide traceability to international scales. A span of GHG amount fractions targeted for assessing instrument linearity can be made by addition of pure gases or removal from whole-air. Synthetic RMs, traceable to the SI, prepared gravimetrically from individual components to a target amount fraction, offer a potential alternative way to compare instrument performance without the difficulties of preparing certified whole air standards. However, use of synthetic RMs present their own challenges, namely in adequately matching the matrix to atmospheric composition in order to prevent measurement biases from pressure broadening when using techniques such as Cavity Ring Down Spectroscopy (CRDS).  

The UK-DECC network is comprised of tall tower monitoring sites measuring amount fractions of major GHGs using whole-air calibrated CRDS instruments. Whole-air RMs have been previously used to understand site-to-site differences and study possible instrumental reasons for differences. However, the use of synthetic-air RMs to quantify variations between monitoring sites in reported amount fractions has not been reported previously for this network.  

In this work a set of synthetic-air and whole-air RMs containing CH4, CO2 and N2O were prepared and measured in an intercomparison at UK-DECC network sites. The results show promise for the use of synthetic RMs in efficiently explaining measurement offsets across a network. Synthetic RMs, prepared appropriately, offer a potentially cost effective and more convenient route to help quality control atmospheric monitoring programmes. 

How to cite: Safi, E., Rennick, C., Forster, G., O'Doherty, S., Pitt, J., Mussell-Webber, E., Hill-Pearce, R., Hillier, A., Worton, D., Brewer, P., Charoenpornpukdee, K., and Arnold, T.: Intercomparison of greenhouse gas measurements using whole air and synthetic standards at UK tall tower sites , EGU General Assembly 2024, Vienna, Austria, 14–19 Apr 2024, EGU24-19027, https://doi.org/10.5194/egusphere-egu24-19027, 2024.

EGU24-19252 | Posters on site | AS3.37

Novel, optimized and compact gas handling system for the HUN tall tower ICOS station 

Mihaly Molnar, Balazs Aron Barath, Tamas Varga, Istvan Major, Sandor Ban, and Laszlo Haszpra


The main goal of ICOS Hungary was to expand the geographical coverage of the ICOS network towards Eastern Europe. As Hungary is located in the zone of westerlies winds in Europe, adding measurement stations East of the existing ICOS network may significantly reduce the uncertainty of the continental atmospheric CO2 and CH4 budget models. Since the joining of HUN it is (almost) the easternmost ICOS atmospheric background station.

ICOS has high expectations for all the stations seeking to join the observation system. These expectations include ensuring the highest quality and employing state-of-the-art equipment available in the stations. Atmospheric stations wishing to connect to the network has to develop their gas handling systems themselves. This requirement places additional responsibility on the operators of stations to create their own systems, allowing them to tailor gas handling processes to their unique needs and in accordance with ICOS network specifications.

The gas handling system for the HUN station, was built in the collaboration between ATOMKI and Isotoptech Zrt., that has been developed for the possibility of commercial use also. This developed system has been operational in Hegyhatsal since the spring of 2022. The core of the system's is a Picarro analyzer (CO2, CH4 and H2O), that requires properly filtered and semidried air for operation. According to the expectations, the developed system meets all the ICOS requirements, including minimized response time, addressing memory effects, and ensuring appropriate flushing capacity. It operates in five independent sampling height (at HUN connected to elevations at 115m, 82m, 50m, 10m and a spare one) with a sampling rate of 10 l/min. Each line uses 2-micron filters before the Picarro, and one multiport VALCO rotary valve runs for efficient and precise environmental GHG gas analysis. For the purpose of ensuring analytical security, high-performance KNF inert pumps are employed for sample transfer/flushing in order to maintain the integrity and reliability of the analytical process.

From 2022 the monitoring station continuously measures atmospheric concentrations of CO2, CH4, and other trace gases at the four sampling levels.

The entire novel, compact gas handling equipment (made by Isotoptech) has stand-alone design, with a footprint of less than 1 m2, 2 m height, integrates all the components, and is designed for easy mobility. The gas handling system has undergone one year of routine operation with minimal maintenance requirements, proving to be reliable and consistently operational even while it is managed remotely from a distance of 500 km, without significant disruptions.

Prepared with the professional support of the Doctoral Student Scholarship Program of the Cooperative Doctoral Program of the Ministry of Innovation and Technology financed from the National Research, Development and Innovation Fund and supported by the PARIS project (Grant Agreement No. 820846), which is funded by the European Commission through the Horizon 2020 research programme.

How to cite: Molnar, M., Barath, B. A., Varga, T., Major, I., Ban, S., and Haszpra, L.: Novel, optimized and compact gas handling system for the HUN tall tower ICOS station, EGU General Assembly 2024, Vienna, Austria, 14–19 Apr 2024, EGU24-19252, https://doi.org/10.5194/egusphere-egu24-19252, 2024.

EGU24-19727 | ECS | Posters on site | AS3.37

A Comprehensive Tropospheric Pollutant Concentration Database for the Mediterranean Basin: Addressing Data Gaps and Enhancing Air Quality Assessment 

Francisco Sánchez Jiménez, Leandro Segado-Moreno, Eloisa Raluy-López, Ester García-Fernández, Pedro Jiménez-Guerrero, and Juan Pedro Montávez
The Mediterranean basin is a region particularly vulnerable to atmospheric pollution. At the tropospheric level, pollutants such as ozone (O3), nitrogen dioxide (NO2), nitrogen monoxide (NO), and particulate matter (PM10 and PM2.5) are particularly harmful. Therefore, it is necessary to have observational air quality databases of sufficient completeness and quality to be able to analyze and extract valuable information regarding the mitigation of air pollution on the population, environment and economy.
 
In this regard, what the scientific literature provides is that existing air quality databases have notable weaknesses such as lack of inclusion of data from areas close to emission sources, exclusion of cities whose population does not exceed a threshold (Schwela et al., 2020) or the challenge of comparing values due to the presentation of air quality information using city-specific air quality indices (Baldasano et al., 2003).
 
This study presents a database of tropospheric pollutant concentrations in the Mediterranean basin for the last two decades. The database was constructed from pollution records acquired from thousands of automated air quality stations throughout the European region, through AirBase, provided by the European Environmental Agency (EEA) through the European Air Quality Portal. The data were evaluated using a rigorous quality control process that included detecting manipulation errors, verifying consistency and coherence limits, and assessing spatio-temporal coherence.
 
The analysis of the database revealed that ozone measurements are the most complete and consistent. Particulate matter stations exhibit more localized behavior, as isolated pollution spikes are more common. With regard to nitrogen oxides, a downward trend in tropospheric pollution has been observed in recent years.
 
In particular, 3323 measurement stations have been treated for O3, 4727 for PM10, 2317 for PM2.5, 3446 for NO and 4933 for NO2. The quality control employed allows to have available air quality records sufficiently dense and robust for further analysis, achieving a homogenization that allows to reduce the weaknesses presented by other databases. In addition, it is intended in further research to extend these records to a higher spatial resolution by means of interpolation methods.
 
References
 
Baldasano J. M., Valera E., Jim ́enez P. (2003). Air quality data from large cities. Science of the Total Environment 307 (1-3), 141–165.

Schwela D. H., Haq G., et al. (2020). Strengths and weaknesses of the who global ambient air quality database. Aerosol and Air Quality
Research 20(5), 1026–1037

How to cite: Sánchez Jiménez, F., Segado-Moreno, L., Raluy-López, E., García-Fernández, E., Jiménez-Guerrero, P., and Montávez, J. P.: A Comprehensive Tropospheric Pollutant Concentration Database for the Mediterranean Basin: Addressing Data Gaps and Enhancing Air Quality Assessment, EGU General Assembly 2024, Vienna, Austria, 14–19 Apr 2024, EGU24-19727, https://doi.org/10.5194/egusphere-egu24-19727, 2024.

EGU24-20676 | ECS | Posters on site | AS3.37

Quantification of Oxygenated Volatile Organic Compounds using Collision-Induced-Dissociation during the AEROMMA Campaign 

Milan Roska, Chelsea Stockwell, Lu Xu, Matthew M. Coggon, Kelvin Bates, Carsten Warneke, and Georgios I. Gkatzelis

A current bottleneck in accurately predicting the impacts of urban emissions on secondary pollution, including ozone and secondary organic aerosol, is the quantification of oxygenated volatile organic compounds (OVOCs). In this work, a voltage scanning (VS) method for quantifying OVOCs, utilizing collision-induced dissociation, is developed using the VOCUS chemical ionization mass spectrometer operated with ammonium as reagent ions. The method is optimized in laboratory studies and tested in the most challenging environment aboard a scientific aircraft during the AEROMMA 2023 campaign to quantify OVOCs in plumes over the Chicago metropolitan area. Voltage scans are optimized to produce for the first-time outcomes down to within a 5-second time resolution. Several OVOCs are quantified that originate from unconventional emerging pollution sources in urban air including cooking and daily household chemicals, in particular solvents and fragrances. Furthermore, the VS method is used to successfully quantify oxidation products within these emissions, notably organic nitrates, traditionally difficult to calibrate. Importantly, we determine the sensitivity of a prevalent organic nitrate in urban air, laying the foundation for refining chemical transport models. This study therefore demonstrates the voltage scanning method’s versatility and effectiveness in quantifying complex compounds during field measurements, particularly in urban environments.

Figure 1: In the left time series of C6H6O2 ionized by NH4+, the data points used for the VS (Voltage Scanning) fitting are indicated. The ∆E50kin results for the respective VS data section are displayed on the second y-axis. ∆E50kin is the kinetic energy of the cluster at half signal strength derived from a VS measurement, where an increase in electric field strength in a scanning region results in a reduction of signal due to collision induced dissociation. The size and opacity of the ∆E50kin markers are adjusted based on the r2 of the fit, with the number of the VS labeled in circles for easier identification. The Violin plot on the right illustrates the sensitivities corresponding to these ∆E50kin values together with the measured sensitivity to Ethylene Glycol in the lab (orange). In the violin plot, the median and values for the upper and lower quartiles are presented.

How to cite: Roska, M., Stockwell, C., Xu, L., Coggon, M. M., Bates, K., Warneke, C., and Gkatzelis, G. I.: Quantification of Oxygenated Volatile Organic Compounds using Collision-Induced-Dissociation during the AEROMMA Campaign, EGU General Assembly 2024, Vienna, Austria, 14–19 Apr 2024, EGU24-20676, https://doi.org/10.5194/egusphere-egu24-20676, 2024.

EGU24-1562 | ECS | Posters on site | AS3.38

Radiocarbon Inventories of Switzerland (RICH): Investigations into fossil CO2 emissions from cement factories and urban areas 

Dylan Geissbühler, Thomas Laemmel, Philip Gautschi, Lukas Wacker, and Sönke Szidat

The RICH (Radiocarbon Inventories of Switzerland) project aims to build the first database and model of the distribution and cycling of 14C at a national scale across the atmosphere, soils, rivers and lakes C pools. The subproject presented here (RICH-Air) will serve to construct complementary monitoring and snapshots approaches of atmospheric 14CO2 measurement in this larger scope.

Radiocarbon measurements of atmospheric CO2 provide unique information on its sources and subsequent transport. It allows the apportionment between biogenic and fossil sources, which are close to the contemporary atmospheric background and 14C-free, respectively. The determination of the fossil CO2 fraction in air samples, can be used to identify fossil fuel emission patterns from a local to a regional scale. These efforts can then be used to plan and enforce future CO2 emissions mitigation steps.

Presented here are preliminary results from investigations regarding the fossil factor in emissions of 3 Swiss cement factories and the urban area of Bern, Switzerland. The radiocarbon content of emissions were studied in multiple ways:

  • Direct and downwind measurement of 14CO2 emissions at cement factories
  • Measurement of 14C content in tree leaves around cement factories and the urban area of Bern

The 14CO2 results show that downwind emissions from cement factories are only accurate if the choice of local background is appropriate. Measured values, both direct and indirect, show that the fossil fraction of emissions is at least of 2/3, which is within the theoretical range for cement production. Also, different facilities seem to have contrasting mean fossil content in their emissions, probably due to their individual fuel mix. Finally, leaf samples show a gradient in 14C values, more depleted closer from the source, both for cement factories or the urban area, which is consistent with previous studies.

How to cite: Geissbühler, D., Laemmel, T., Gautschi, P., Wacker, L., and Szidat, S.: Radiocarbon Inventories of Switzerland (RICH): Investigations into fossil CO2 emissions from cement factories and urban areas, EGU General Assembly 2024, Vienna, Austria, 14–19 Apr 2024, EGU24-1562, https://doi.org/10.5194/egusphere-egu24-1562, 2024.

EGU24-3664 | ECS | Posters on site | AS3.38

Quantifying Methane Emissions Using Satellite Data: Integrated Methane Inversion (IMI) Model Application for Denmark 

Angel Vara-Vela, Christoffer Karoff, Noelia Rojas Benavente, and Janaina Nascimento

After decades of steady growth, even reaching a growth rate of approximately zero from 2000 to 2006, the atmospheric methane (CH4) has returned to values observed in the second half of the twentieth century, and in recent years it has increased at a faster rate (Palmer et al., 2021). In this context, major initiatives involving the use of satellite-based inversion approaches have been implemented to respond to a growing demand from the climate community. One of this initiatives is the Integrated Methane Inversion (IMI, Varon et al., 2022). IMI is a cloud-based facility developed to infer regional CH4 emissions at 0.25° × 0.3125° resolution, with dynamic boundary conditions from a global archive of smoothed TROPOspheric Monitoring Instrument (TROPOMI) data. Three monthly IMI simulations were conducted over Denmark to estimate CH4 emissions before (June 2018), during (June 2020), and after (June 2021) the COVID-19-related lockdowns. The calculated a posteriori emissions for these periods were 0.579 Tg yr-1, 0.396 Tg yr-1, and 0.553 Tg yr-1, respectively. The approximately 31% emission reduction in June 2020 was almost swiftly reversed in June 2021, with a reduction of emissions in June 2021 by less than 5% compared to the same period in 2018. As many months other than June do not frequently meet the IMI preview configuration (a model feature to rate the quality of a proposed inversion without actually performing the inversion), multi-period simulations are being conducted to characterize CH4 emissions across the country. The new CH4 emissions data set will serve as a benchmark to evaluate the model performance of the Aarhus University Methane Inversion Algorithm (AUMIA, Vara-Vela et al., 2023). Currently under development, AUMIA is a satellite-based tool designed to quantify CH4 emissions over Europe, with a specific focus on anthropogenic activities.

References

Palmer, P. L., Feng, L., Lunt, M. F., Parker, R. J., Bosch, H., Lan, X., Lorente, A., and Borsdorff, T.: The added value of satellite observations of methane for understanding the contemporary methane budget, Philos. T. R. Soc. A., 379, 2210, https://doi.org/10.1098/rsta.2021.0106, 2021.

Vara-Vela, A. L., Karoff, C., Benavente, R. N., and Nascimento, J. P.: Implementation of a satellite- based tool for the quantification of CH4 emissions over Europe (AUMIA v1.0) – Part 1: forward modelling evaluation against near-surface and satellite data, Geosci. Model Dev., 16, 6413-6431, 2023.

Varon, D. J., Jacob, D. J., Sulprizio, M., Estrada, L. A., Downs, W. B., Shen, L., Hancock, S. E., Nesser, H., Qu, Z., Penn, E., Chen, Z., Lu, X., Lorente, A., Tewari, A., and Randles, C. A.: Integrated Methane Inversion (IMI 1.0): a user-friendly, cloud-based facility for inferring high- resolution methane emissions from TROPOMI satellite observations, Geosci. Model Dev., 15, 5787-5805, 2022.

How to cite: Vara-Vela, A., Karoff, C., Rojas Benavente, N., and Nascimento, J.: Quantifying Methane Emissions Using Satellite Data: Integrated Methane Inversion (IMI) Model Application for Denmark, EGU General Assembly 2024, Vienna, Austria, 14–19 Apr 2024, EGU24-3664, https://doi.org/10.5194/egusphere-egu24-3664, 2024.

EGU24-4894 | ECS | Orals | AS3.38

Indonesia's Multifaceted Approach to Navigating the Challenges of Greenhouse Gas Observations  

Alberth Nahas, Muhammad Rezza Ferdiansyah, and Ardhasena Sopaheluwakan

In Indonesia, the monitoring of Greenhouse Gases (GHGs) is a vital part of the nation's planning strategy, primarily spearheaded by the Meteorological, Climatological, and Geophysical Agency (BMKG) in response to the World Meteorological Organization's (WMO) mandate through the Global Atmosphere Watch (GAW) program. This initiative is of paramount importance as it aims to provide comprehensive and robust GHG monitoring to support global and national efforts in understanding and combating climate change. Despite existing efforts, there remains a pressing need to expand these services to ensure more accurate and extensive data collection, which is crucial for informing government policies and international climate negotiations. Indonesia's approach to GHG monitoring is multifaceted, encompassing global, national, and sub-national strategies to provide a comprehensive understanding of GHG dynamics and contribute effectively to global efforts. At a global and regional level, Indonesia boasts the longest GHG dataset in Southeast Asia, as well as in the equatorial region, from Bukit Kototabang. This data is invaluable, feeding into the WMO GAW international network and providing insights that aid in refining GHG inventories worldwide. It represents a significant contribution to the global understanding of GHG trends and helps position Indonesia as a critical player in international climate dialogues, especially concerning carbon budgeting and emission reduction strategies. Additionally, the implementation plan for the Global Greenhouse Gas Watch (G3W) program, a WMO initiative for a GHG monitoring effort worldwide,  is incorporated in the nation’s GHG monitoring plan, aiming for a more inclusive and extensive GHG monitoring network. Nationally, Indonesia's strategy leverages the potential of satellite-driven information.  This approach can be considered as complementary as it offers an advantage in providing better spatial resolution, and fully representing the differences in land-cover types. At a sub-national level, the focus is on atmospheric-based monitoring to provide localized GHG estimates through a roadmap for the adoption of the Integrated Global Greenhouse Gas Information System (IG3IS). This ambitious program aims to monitor atmospheric GHGs in an integrated manner, combining this with atmospheric modeling to yield a range of benefits. It enables the estimation of carbon emissions across various sectors and complement in calculating carbon sequestration, particularly in forestry initiatives. Together, these strategies illustrate Indonesia's nuanced and robust approach to GHG monitoring. By continuously enhancing its GHG monitoring plans, adopting advanced satellite technology, and focusing on localized atmospheric monitoring, Indonesia not only contributes valuable data to the global scientific community but also strengthens its own capacity to address climate change. This integrated approach is crucial for developing a comprehensive understanding of GHG dynamics, informing policy and international negotiations, and ultimately guiding the nation towards a sustainable and resilient future in the face of global environmental challenges. 

How to cite: Nahas, A., Ferdiansyah, M. R., and Sopaheluwakan, A.: Indonesia's Multifaceted Approach to Navigating the Challenges of Greenhouse Gas Observations , EGU General Assembly 2024, Vienna, Austria, 14–19 Apr 2024, EGU24-4894, https://doi.org/10.5194/egusphere-egu24-4894, 2024.

EGU24-5069 | ECS | Posters on site | AS3.38

Development of Bayesian inverse modeling framework to verify CO2 emissions in Seoul 

Sojung Sim and Sujong Jeong

The Bayesian inverse method, combined with measurements of atmospheric carbon dioxide (CO2) and a transport model, can serve as an independent verification approach to improve the precision of emission estimates. This study utilized the Bayesian inverse model, along with ground- and space-based measurements, to validate CO2 emissions in Seoul. A Bayesian inverse modeling framework was developed, integrating crucial input data such as anthropogenic CO2 emissions, biogenic CO2 fluxes, atmospheric CO2 measurements, a Lagrangian transport model, and error covariances for both prior emissions and observations. The averages of posterior emissions decreased after the inversion run, with a correction of approximately -8.69%. This suggests that the prior emissions were overestimated. There was an average 9.7% reduction in posterior emission uncertainties compared to prior uncertainties. The most substantial reductions in uncertainty were observed in areas with concentrated observation sites. The performance of the inverse model was thoroughly investigated through sensitivity analysis, encompassing different background representations, prior uncertainty levels, temporal and spatial uncertainties, and observational network configurations. Additionally, we quantified spatiotemporal changes in CO2 emissions due to COVID-19. The abundance of ground and space observations in Seoul provided robust constraints on urban CO2 emissions, allowing for an objective evaluation of the effectiveness of carbon reduction policies.

This work was supported by Korea Environmental Industry & Technology Institute (KEITI) through "Project for developing an observation-based GHG emissions geospatial information map", funded by Korea Ministry of Environment(MOE)(RS-2023-00232066).

How to cite: Sim, S. and Jeong, S.: Development of Bayesian inverse modeling framework to verify CO2 emissions in Seoul, EGU General Assembly 2024, Vienna, Austria, 14–19 Apr 2024, EGU24-5069, https://doi.org/10.5194/egusphere-egu24-5069, 2024.

EGU24-5221 | ECS | Orals | AS3.38

Design, operation, and insights from Zürich city's mid- and low-cost CO2 sensor network 

Stuart K. Grange, Pascal Rubli, Andrea Fischer, Christoph Hueglin, Nikolai Ponomarev, Dominik Brunner, and Lukas Emmenegger

As a part of the ICOS Cities project, a dense CO2 sensor network was deployed across Zürich city in July 2022 that will remain operational until July 2024. The network comprises 250 NDIR (nondispersive infrared) CO2 sensors from three manufacturers (Senseair, Vaisala, and Licor) at 87 monitoring sites. The sensors can be classified into low- and mid-cost groups (~€500 and ~€7000 respectively). Most mid-cost sensors were installed with rooftop inlets, while most low-cost sensors were deployed near ground level, i.e. near sources of biogenic activities, human respiration, and fossil fuel burning. All data are transferred using LoRaWan and Picarro CRDS (cavity ring-down spectroscopy) gas analysers with traceable reference gases are used for calibration and the assessment of the sensors’ performance before field deployment.
The mid-cost CO2 sensors run on mains power, are placed inside maintenance rooms or measurement cabins, and make use of two calibration gases that are tested daily. After accounting for air pressure, humidity and the reference gas tests, the mid-cost CO2 sensors achieve an accuracy of 1.5 ppm of root mean square error (RMSE) and a mean bias that is within ± 1 ppm when considering hourly means in field conditions. The low-cost sensors are battery-powered and require an initial calibration period to address potential deficiencies with their factory calibration. During field deployment, an algorithm for drift correction is applied that considers meteorological conditions and data provided by the mid-cost sensors in the network. The low-cost sensors achieve a mean RMSE of 15 ppm under field conditions when compared to pseudo-reference time series provided by mid-cost sensors, and on average, they show no systematic bias.
The sensor measurement performance is adequate to resolve site-specific differences and interesting source-sink processes – especially those related to traffic and the biosphere. Mean CO2 dry air mole fractions ranged between 432 and 460 ppm across the network with some sites displaying large CO2 diurnal ranges (up to 70 ppm) due to confinement of biogenic emissions in the very early hours of the morning. The network’s background CO2 is highly variable, indicating that Zürich’s ambient CO2 levels are strongly influenced by regional scale processes as well as emissions and sinks within the city’s boundary. In a first attempt to quantify CO2 emissions, the rooftop sensors are combined with inventory data and simulations of biogenic activity using ICON-ART at a spatial resolution of 600 m. In contrast, the low-cost sensors will be employed in combination with highly-resolved urban emission data and GRAMM/GRAL, a building-resolved transport model. In collaboration with the city government, we expect this to become a long-term, actionable contribution to address urban emissions and the city's net-zero commitment.

How to cite: Grange, S. K., Rubli, P., Fischer, A., Hueglin, C., Ponomarev, N., Brunner, D., and Emmenegger, L.: Design, operation, and insights from Zürich city's mid- and low-cost CO2 sensor network, EGU General Assembly 2024, Vienna, Austria, 14–19 Apr 2024, EGU24-5221, https://doi.org/10.5194/egusphere-egu24-5221, 2024.

EGU24-5321 | ECS | Orals | AS3.38

Towards CO2 emission estimation in urban areas using a dense sensor network and the high-resolution GRAMM/GRAL model 

Anna Sommani, Maximilian May, Alexander J. Turner, Ronald C. Cohen, and Sanam N. Vardag

Urban areas are responsible for about 70% of anthropogenic CO2 emissions and are therefore an important system in which to develop mitigation strategies to reduce emissions. To assess these strategies and monitor mitigation efforts, independent knowledge of urban CO2 sources is required. A measurement-based estimation of emissions can be obtained using CO2 measurements, along with prior information on emissions from inventories and a high-resolution transport model.

Here we use the forward model system GRAMM/GRAL. This consists of two nested models, a prognostic mesoscale model (GRAMM), and a microscale computational fluid dynamics and Lagrangian dispersion model (GRAL). We run GRAL on a 15 km x 15 km grid over the city of Oakland, California, at a horizontal resolution of 10 m x 10 m. This resolution of 10 meters is sufficient to resolve street canyon effects. We utilize the Berkeley Atmospheric CO2 Observation Network (BEACO2N), a unique high-density network of CO2 monitoring stations consisting of mid-cost sensors. To optimize computational time, GRAMM/GRAL is run in a steady-state mode where we compute hourly steady-state wind and concentration fields, corresponding to different synoptic meteorological situations. To infer the temporal evolution of the simulated CO2 concentration over a whole year we then use a match-to-observation algorithm that for each hour chooses the hourly steady-state wind field which minimizes the difference between the simulated wind and the observed wind time series from an urban network of wind measuring stations (May et al. 2024).

In our study, we assess the performance of the GRAMM/GRAL model in Oakland and compare the modelled and measured wind and concentration fields over a year. In general, we find a good agreement between modelled and observed wind fields. Comparing the time series of simulated CO2 concentration to the observed CO2 concentration from the BEACO2N network, we analyze the agreement and difference between the modelled and simulated CO2 concentration and propose possible improvements in the modelling framework. Finally, we propose an inversion set-up to infer emission estimates at high resolution given the observations and discuss remaining challenges and limitations.

How to cite: Sommani, A., May, M., Turner, A. J., Cohen, R. C., and Vardag, S. N.: Towards CO2 emission estimation in urban areas using a dense sensor network and the high-resolution GRAMM/GRAL model, EGU General Assembly 2024, Vienna, Austria, 14–19 Apr 2024, EGU24-5321, https://doi.org/10.5194/egusphere-egu24-5321, 2024.

EGU24-5727 | Posters on site | AS3.38

The U.S. Greenhouse Gas Center: Extending Accessible and Integrated GHG Information from U.S. Government and Non-Public Sources to meet user needs 

Shanna Combley, Argyro Kavvada, Lesley Ott, Kevin Bowman, Manil Maskey, Robert Green, William Irving, Melissa Weitz, Vanda Grubisic, Ariel Stein, James Whetstone, Annmarie Eldering, Erin McDuffie, and Alix Kashdan

The newly established United States Greenhouse Gas Center (U.S. GHG Center) is a multi-agency partnership between the National Aeronautics and Space Administration (NASA), the Environmental Protection Agency (EPA), the National Oceanic and Atmospheric Administration (NOAA) and the National Institute of Standards and Technology (NIST) that aims to accelerate the production and delivery of actionable, trusted greenhouse gas (GHG) information from the federal government and non-public sector to a variety of users through a coordinated data system, reflecting transparency and open source science principles in both data and methods. The US GHG Center acts as an enabler of collaboration with networks of interagency, international, intergovernmental and private sector partners to increase confidence in setting, assessing, and meeting climate change mitigation goals, with a preliminary focus on carbon dioxide and methane. The US GHG Center is also a critical element in the implementation of the “National Strategy to Advance an Integrated US Greenhouse Gas Measurement, Monitoring, and Information System”.  Initial focus areas include 1) Gridded anthropogenic greenhouse gas emissions, 2) Natural sources and sinks, and 3) New Observations for tracking large emission events. The US GHG Center web portal includes a prototype data catalogue, exploratory data analysis capabilities, a collaborative science environment for data analysis and exploration, as well as an interactive visual interface for storytelling. Examples of products currently available on the GHG Center portal include methane and carbon dioxide concentration anomalies and emissions from airborne and space-based instruments, including from NASA’s Earth Surface Mineral Dust Source Investigation (EMIT) imaging spectrometer in orbit on the International Space Station, EPA’s gridded U.S. anthropogenic methane greenhouse gas inventory data, gridding methodologies and visualizations, NOAA’s Observation Package (ObsPack) data products that bring together atmospheric greenhouse gas observations from a variety of sampling platforms, as well as multi-model land flux and ecosystem exchange estimates. 

How to cite: Combley, S., Kavvada, A., Ott, L., Bowman, K., Maskey, M., Green, R., Irving, W., Weitz, M., Grubisic, V., Stein, A., Whetstone, J., Eldering, A., McDuffie, E., and Kashdan, A.: The U.S. Greenhouse Gas Center: Extending Accessible and Integrated GHG Information from U.S. Government and Non-Public Sources to meet user needs, EGU General Assembly 2024, Vienna, Austria, 14–19 Apr 2024, EGU24-5727, https://doi.org/10.5194/egusphere-egu24-5727, 2024.

EGU24-6185 | ECS | Orals | AS3.38

Using TROPOMI observations to derive methane emissions and its driving factors over Lake Chad 

Mengyao Liu, Ronald van der A, Ruoqi Liu, Michiel van Weele, Geli Zhang, Jos de Laat, and Pepijn Veefkind

Wetland methane emissions are an important source of uncertainty in the methane budget due to their significant spatial and temporal variabilities. The Lake Chad Basin is located in central Africa and comprises a number of transboundary waters, which exhibit dramatic expansion and contraction. However, methane emissions from Lake Chad seem not to be properly captured in bottom-up emission inventories. An improved divergence method has been developed to estimate gridded methane (CH4) emissions from satellite observations of the TROPOspheric Monitoring Instrument (TROPOMI). Significant annual methane emissions over the Lake Chad Basin are identified by both the official reprocessed (S5P_RPRO_L2__CH4) and WFM-DOAS (TROPOMI/WFMD v1.8) XCH4 products. The maximum methane emissions appear from December to February while the minimum emissions are found during June to August. We further extract the monthly surface water areas using Landsat satellite imagery and wetland areas based on the MODIS vegetation index. The monthly variations of methane emissions are consistent with monthly surface water areas and wetlands areas but in contrast to the monthly rainfall. The seasonal emissions during the period of 2018 to 2022 over the Lake Chad Basin have been studied to better understand the role of driving factors such as rainfall, temperature, and waterlogged soils.

How to cite: Liu, M., van der A, R., Liu, R., van Weele, M., Zhang, G., de Laat, J., and Veefkind, P.: Using TROPOMI observations to derive methane emissions and its driving factors over Lake Chad, EGU General Assembly 2024, Vienna, Austria, 14–19 Apr 2024, EGU24-6185, https://doi.org/10.5194/egusphere-egu24-6185, 2024.

EGU24-6957 | Orals | AS3.38

Greenhouse gas and short-lived pollutants in the Baltimore, MD and Washington, DC area: Coordinated measurements and models 

Russell Dickerson, Xinrong Ren, Anna Karion, Paul Shepson, Phil Stratton, Jiayang Sun, Sahu Sayatan, Hao He, and Hannah Daley

The cities of Baltimore, MD and Washington, DC generate substantial amounts of air pollutants with adverse effects on health and climate, but the magnitude and origins of these contaminants remain uncertain.  The State of Maryland has committed to reducing statewide greenhouse gas emissions by 60% (relative to 2006 levels) by the year 2031. A team of scientists from the Maryland Department of the Environment (MDE), the National Institute of Standards and Technology (NIST), the National Oceanic and Atmospheric Administration (NOAA), the University of Maryland, and Stony Brook University have established a coordinated program of measurements and models to quantify and allocate emissions.  These include observations from aircraft, a mobile laboratory, a tower array, and surface monitors as well as Lagrangian and Eulerian models.  Results thus far indicate that methane emissions substantially exceed initial, traditional, bottom-up, inventory data and that leakage from the natural gas delivery system and landfills are major sources.  Urban methane emissions show a strong seasonality, consistent with natural gas usage – the flux in winter was 44% greater than in summer.  Model inversions suggest urban methane emissions in Washington and Baltimore decreased by 4-5%/yr between 2018 and 2021.  Mobile laboratory measurements of GHGs and air pollutants such as black carbon with high temporal and spatial resolution reveal a variety of sources in densely populated urban residential areas related to traffic and industry and with implications for environmental justice.  Analysis of long-term monitoring data with clustering of trajectories identified dominant transport pathways and sources in upwind states that likely contribute in a major way to ambient methane concentrations in the Baltimore/Washington area – these include the Marcellus oil and gas plays in Pennsylvania and West Virginia as well as swine production in North Carolina.  Ongoing and future work includes developing a landfill as a testbed for emissions quantification and control and use of carbon and hydrogen isotopes to partition fossil and biogenic emissions and biogenic losses.  The combination of State, federal, and university resources makes for a powerful tool to tackle air quality and climate problems. 


How to cite: Dickerson, R., Ren, X., Karion, A., Shepson, P., Stratton, P., Sun, J., Sayatan, S., He, H., and Daley, H.: Greenhouse gas and short-lived pollutants in the Baltimore, MD and Washington, DC area: Coordinated measurements and models, EGU General Assembly 2024, Vienna, Austria, 14–19 Apr 2024, EGU24-6957, https://doi.org/10.5194/egusphere-egu24-6957, 2024.

Quantifying methane emissions in Gippsland, Victoria, Australia is challenging due to the presence of multiple emission sources, resulting in overlapping emissions and considerable uncertainty in estimation. To address this challenge, our study investigates the potential to reduce uncertainties in methane emissions in Gippsland through the combination of in-situ data, models, and prior information using a Bayesian inverse modeling and variational approach. We employ a four-dimensional variational in-situ data assimilation technique built around the Community Multiscale Air Quality (CMAQ) model at 2 km resolution for four months in 2019.

Initially, we used the Emission Database for Global Atmospheric Research (EDGAR) as a baseline but identified a number of shortcomings in capturing local emissions. To address this issue, we introduced prior estimates from the "openmethane" prior at https://openmethane.org/. We evaluated the underlying Weather Research and Forecasting Model (WRF) meteorological predictions against nearby weather station data, revealing good performance at most times. We validated the performance of our concentration model by comparing it with observational data at the three sites used in the study.

We will discuss the results and present the reductions in emission uncertainties. Next steps in the study will integrate these findings to further rectify biases and improve the accuracy of methane emission estimates in the Gippsland region, especially during the intense fire period of 2019-2020.

How to cite: Aghdasi, S., Rayner, P., Deutscher, N., and Silver, J.: Investigating high-resolution methane emission uncertainty reduction in Gippsland using in-situ data: A Bayesian inverse modeling and variational assimilation approach, EGU General Assembly 2024, Vienna, Austria, 14–19 Apr 2024, EGU24-7180, https://doi.org/10.5194/egusphere-egu24-7180, 2024.

EGU24-7288 | ECS | Orals | AS3.38

Satellite-based monitoring of methane emissions from China's rice hub 

Ruosi Liang and Yuzhong Zhang

Rice cultivation is one of the dominant anthropogenic methane sources in China and globally. However, it is often challenging to accurately quantify national and regional rice methane emissions. Conventional bottom-up methods often rely on a small number of ground-based flux measurements to derive emission factors or to calibrate process-based models, despite of inherently high heterogeneity in rice methane emission intensities. Satellite observations provide an independent regional-scale constraint on the magnitude of rice methane emissions. We apply atmospheric methane observations from the Tropospheric Monitoring Instrument (TROPOMI) to a high-resolution (0.625° × 0.5°) inversion to estimate monthly methane emissions for 2021 from Heilongjiang province in Northeast China, which is the country’s largest rice province. Our optimal estimate of annual rice methane emissions is 0.89 (0.57 – 1.04) Tg a−1, a factor of 2 or more higher than various bottom-up estimates. The results show that rice methane emissions in Heilongjiang peak during the tillering stage in June, consistent with intermittent flooding as the primary practice of water-regime management. This one-peak seasonality differs from the two-peak pattern in the prior estimate of the inversion (EDGAR v6.0) but agrees with flux measurements taken at a site in the region. Finally, our results are used to evaluate and improve process-based models of rice methane emissions.

How to cite: Liang, R. and Zhang, Y.: Satellite-based monitoring of methane emissions from China's rice hub, EGU General Assembly 2024, Vienna, Austria, 14–19 Apr 2024, EGU24-7288, https://doi.org/10.5194/egusphere-egu24-7288, 2024.

EGU24-7594 | Orals | AS3.38

The Integrated Greenhouse gas Monitoring System (ITMS) for Germany: Update on recent progress 

Christoph Gerbig, Andrea Kaiser-Weiss, Heinrich Bovensmann, Ralf Kiese, Clemens Scheer, Rachael Akinyede, Beatrice Ellerhoff, Maximilian Reuter, Hannes Imhof, Christian Plaß-Dülmer, and Andreas Fix

The Integrated Greenhouse Gas Monitoring System for Germany (ITMS) is a national initiative to establish an operational service for the provision of independent estimates of GHG fluxes for Germany. The main aim is to enhance transparency in reporting of emissions and natural fluxes on the path to net zero emissions. ITMS is a highly interdisciplinary project, bringing together diverse scientific communities involved in atmospheric observations, satellite observations, biosphere and agriculture research, inventory experts, and atmospheric transport and inverse modelling. ITMS utilizes observational datastreams from research infrastructures such as ICOS and IAGOS, and tailored remote sensing products, to constrain Germany’s GHG fluxes into the atmosphere using inverse atmospheric transport modelling. Detailed a priori emissions are generated consistent with UNFCCC reported emissions, while priors for natural fluxes are based on various process based as well as diagnostic models. Inverse modelling is deployed at mesoscale resolution, using the CarboScope-Regional (CSR) inversion system operated at the MPI-BGC as a back-bone and reference system, while developing ICON-ART based data assimilation for future operational services. The presentation will give an overview of recent progress and show some research highlights achieved so far.

How to cite: Gerbig, C., Kaiser-Weiss, A., Bovensmann, H., Kiese, R., Scheer, C., Akinyede, R., Ellerhoff, B., Reuter, M., Imhof, H., Plaß-Dülmer, C., and Fix, A.: The Integrated Greenhouse gas Monitoring System (ITMS) for Germany: Update on recent progress, EGU General Assembly 2024, Vienna, Austria, 14–19 Apr 2024, EGU24-7594, https://doi.org/10.5194/egusphere-egu24-7594, 2024.

EGU24-8039 | ECS | Posters on site | AS3.38

GHG-KIT project: Inverse modelling of Vienna’s CH4 and CO2 emissions using in-situ and remote observations 

Antje Hoheisel, Christian Maurer, Marie D. Mulder, Peter Redl, Stefan Schneider, Jia Chen, Andreas Luther, Bradley Matthews, Andrea Watzinger, Kathiravan Meeran, and Marcus Hirtl

The Austrian Flagship Project “GHG-KIT: Keep it traceable” aims to prototype an Austrian, Earth Observation-Integrated GHG measurement and modelling system, which can support national GHG emission monitoring. Among other aims, the project is working toward an Austrian inverse modelling framework to produce top-down estimates of national and subnational CO2 and CH4 fluxes that are independent of the current bottom-up system of the Austrian GHG inventory.
This conference contribution will present the GHG-KIT progress on inverse modelling of subnational CO2 and CH4 emissions, using Vienna as a case study. Vienna is the most populated city in Austria with around 2 million inhabitants, corresponding to slightly more than a fifth of the total Austrian population. To estimate the GHG emissions in Vienna the inversion framework FLEXINVERT is used. The atmospheric back trajectories for GHG measurements carried out in Vienna are calculated using the Lagrangian dispersion model FLEXPART-WRF, which is driven by WRF meteorology. The a priori fluxes of GHGs, used in FLEXINVERT, are prepared using WRF-GHG and are based on data from the Copernicus Atmosphere Monitoring Service (CAMS), among others. WRF-GHG is a Weather Research and Forecasting (WRF) model version that is coupled with chemistry modules as well as the GHG flux module and considers urban building features. Atmospheric ground-based observations of CO2 and CH4 mole fractions from the Vienna Urban Carbon Laboratory are included in the inverse modelling. These include in-situ observations from a tall-tower, as well as total column measurements at four locations from a 2022 summer campaign performed by the Technical University of Munich. Furthermore, the usability of satellite measurements over Vienna as an additional observation constraint will be investigated. This includes GHGSat measurements from Vienna that are carried out as part of the GHG-KIT project, as well as synthetic or possibly authentic observations from satellite missions (such as CO2M and MethaneSAT) that will be launched during the course of this project or shortly thereafter.

How to cite: Hoheisel, A., Maurer, C., Mulder, M. D., Redl, P., Schneider, S., Chen, J., Luther, A., Matthews, B., Watzinger, A., Meeran, K., and Hirtl, M.: GHG-KIT project: Inverse modelling of Vienna’s CH4 and CO2 emissions using in-situ and remote observations, EGU General Assembly 2024, Vienna, Austria, 14–19 Apr 2024, EGU24-8039, https://doi.org/10.5194/egusphere-egu24-8039, 2024.

EGU24-8915 | ECS | Posters on site | AS3.38

High-resolution meteorological CO2 enhancements of German metropolitan areas using WRF 

Lukas Pilz, Christopher Lüken-Winkels, Michał Gałkowski, David Ho, Fei Chen, and Sanam N. Vardag

Verifying greenhouse gas (GHG) mitigation efforts of governments using atmospheric observations is a task which is rapidly gaining scientific interest and attention. The United Nations Framework Convention on Climate Change (UNFCCC) requires the compilation of National Inventory Reports and recommends augmenting them with observational data. The joint project ITMS (Integriertes Treibhausgas-Monitoringsystem für Deutschland) is Germany's national contribution to the World Meteorological Organization’s Integrated Global Greenhouse Gas Information System (IG3IS). It will establish the scientific basis and methodology for integrating GHG observations into the national emissions inventories. Our focus within the ITMS joint project is to optimize observation strategies for monitoring fossil CO2 emissions in German urban and metropolitan areas using synthetic studies. Focusing on cities is especially relevant as cities are substantial contributors to total anthropogenic CO2 emissions. 

Our study uses the Weather Research and Forecasting model (WRF v4.3.3) with ECMWF-ERA5 as meteorological input and boundary conditions. As a first step, we have optimized model transport such that our results are representative of real-world conditions as much as possible. Within comprehensive sensitivity studies, we have analyzed the optimal model settings for German urban areas. Our sensitivity studies focus on the Rhine-Neckar region and compare 16 different physics configurations of WRF for 4 months of 2020, representative of the four seasons. Modeled meteorological variables were compared against 19 meteorological observation stations operated by the German Weather Service and 2 radiosonde stations. We found the setup using Mellor-Yamada-Janjic boundary layer, Noah MP land surface, Monin-Obukhov surface layer and BEP urban parametrization scheme has the overall best performance for our use case. 

Using the optimal setup for urban areas in WRF, we have generated a year-long, 1km resolved dataset of German metropolitan areas. This dataset contains meteorological and sector specific CO2 enhancement data for the year 2018. These metropolitan areas include the Rhine-Neckar, Berlin, Rhine-Ruhr, Nuremberg and Munich metropolitan areas. We showcase the usefulness of the dataset by comparison to actual observations in cities.

How to cite: Pilz, L., Lüken-Winkels, C., Gałkowski, M., Ho, D., Chen, F., and Vardag, S. N.: High-resolution meteorological CO2 enhancements of German metropolitan areas using WRF, EGU General Assembly 2024, Vienna, Austria, 14–19 Apr 2024, EGU24-8915, https://doi.org/10.5194/egusphere-egu24-8915, 2024.

EGU24-9044 | ECS | Posters on site | AS3.38

Novel source localization method from observed peak emissions in time series using LPDM transfer functions 

Friedrich Klappenbach, Jia Chen, Ronald C. Cohen, Jonathan Franklin, Taylor Jones, Moritz Makowski, and Seven Wofsy

We developed a novel method to estimate from an observations-time series the upwind distance as well as the emission strength of an unknown source, which releases a gas into the atmosphere (top-down). For this purpose, we used LPDM-modeled particle trajectories to infer the transfer function of the source region. The transfer function that matches the observed enhancement best, identifies the potential source region. In a second step, we infer the source strength using the particle ensemble.

We developed this method with a data set obtained during a six-week campaign in the San Francisco Bay Area. Aim was, to infer greenhouse gas emissions, specifically carbon dioxide and methane, from total column abundances.

At the UC-Berkeley site, one particular instrument recorded a strictly periodic peak-enhancement of approximately 10ppb methane within a consecutive 12-minute interval. Co-emitted species showed no correlation with this pattern. Therefore, we assumed a singular, point, and puff-emitting source of methane.

Due to favorable meteorological conditions, we were able to analyze a total of 14 peaks during a three-hour time-span in the forenoon. We estimated the average emission strength during the emission period to be 1.8+/-0.5 g(CH4)/s (equivalent to 6.48+/-1.80 kg/hr). Although we were unable to identify the source in the field, we concluded that methane ventilation from the natural gas supply, a so-called blow-down, could be a plausible explanation.

How to cite: Klappenbach, F., Chen, J., Cohen, R. C., Franklin, J., Jones, T., Makowski, M., and Wofsy, S.: Novel source localization method from observed peak emissions in time series using LPDM transfer functions, EGU General Assembly 2024, Vienna, Austria, 14–19 Apr 2024, EGU24-9044, https://doi.org/10.5194/egusphere-egu24-9044, 2024.

EGU24-9996 | ECS | Posters on site | AS3.38

High-resolution inversion of Berlin city emissions – A synthetic study using FLEXPART-WRF for network optimization within ITMS 

Christopher Lüken-Winkels, Lukas Pilz, Massimo Cassiani, Ignacio Pisso, and Sanam N. Vardag

Urban areas are significant contributors to anthropogenic carbon dioxide (CO2) emissions, responsible for approximately 70% of the total anthropogenic CO2 emissions. In the years to come, it is expected that urban areas will increase their efforts to mitigate CO2 emissions. To independently verify these reductions, atmospheric measurements of CO2 and other tracers can be used within an inversion framework to estimate emissions. While there are some cities which have established measurement networks for this purpose, many urban centers are still lacking the necessary measurement infrastructure for high-resolution inverse modeling. It is an open question how a measurement network should be designed to maximize the information content of the urban emissions. 

In our study, we conduct Observing System Simulation Experiments (OSSEs) to evaluate the potential of different measurement network configurations for the city of Berlin, Germany. The approach involves utilizing meteorological data at a spatial resolution of 1 km, computed using the Weather Research & Forecasting Model (WRF), to model the relationship between emissions and measured concentrations (footprints). The footprints are calculated using the Lagrangian Particle Dispersion Model FLEXPART-WRF. Concentration enhancements of WRF and FLEXPART-WRF are compared throughout a year. 

We assess various in-situ network configurations, considering both preexisting meteorological networks and a gridded approach for potential measurement locations. Using a Bayesian inversion for the prediction of emissions, different subsets of these networks are selected to constrain total emissions as well as anthropogenic and biogenic CO2 fluxes. The tested measurement configurations encompass variations in the number and quality of stations, allowing for the identification of both efficient and effective networks.  

In conclusion, our findings provide insights into the strategic deployment of CO2 measurement networks in Berlin, supporting ongoing efforts to refine greenhouse gas monitoring. The available meteorological data will additionally enable comparable studies for further German metropolitan areas as planned in the German project “Intergiertes Treibhausgas Monitoring System (ITMS)”. 

How to cite: Lüken-Winkels, C., Pilz, L., Cassiani, M., Pisso, I., and Vardag, S. N.: High-resolution inversion of Berlin city emissions – A synthetic study using FLEXPART-WRF for network optimization within ITMS, EGU General Assembly 2024, Vienna, Austria, 14–19 Apr 2024, EGU24-9996, https://doi.org/10.5194/egusphere-egu24-9996, 2024.

EGU24-11113 | ECS | Posters on site | AS3.38

A combined dataset of path-averaged and in-situ measurements of greenhouse gases to inform on the sensitivities to localized source patterns and transport effects in the urban atmosphere. 

Tobias D. Schmitt, Lukas Pilz, Robert Maiwald, Maximilian May, Benedikt A. Löw, Ralph Kleinschek, Julia B. Wietzel, Jonas Kuhn, Stefan Schmitt, Martina Schmidt, Sanam N. Vardag, Frank Hase, David W. T. Griffith, and André Butz

Urban areas are a major and growing contributor to anthropogenic greenhouse gas (GHG) emissions and are thus an important target for emission reduction efforts. However, measurement-based information for planning, implementing, and monitoring such reduction efforts on city scales is rarely available to policymakers and stakeholders. Such monitoring systems typically rely on three key components: measurements of GHG concentrations (or turbulent fluxes), modeling of the atmospheric transport and prior information on the spatial and/or temporal structure of the emissions. The high spatial and temporal heterogeneity of urban areas and their emissions is especially challenging for atmospheric transport models and gridded inventories, which are currently pushed to resolutions of kilometers and below in an effort to accurately represent these effects. However, GHG concentration measurements are often performed by in-situ systems and are thus not necessarily representative for the kilometer scales on which measurements, transport modeling and prior information are typically compiled. This becomes increasingly important with the ever-improving quality of measurements, models, and inventories themselves.

We present a dataset of urban path averaged concentration measurements of CO2 and CH4 and their comparison to co-located in-situ measurements. The path averaged measurements are taken along a 1.55 km long path over the city of Heidelberg, Germany. The observatory utilizes FTIR spectroscopy and is now in continuous operation since February 2023. Analysis of the path averaged and co-located in-situ measurements reveals differences of up to 20 ppm in CO2 for specific wind directions, which are most likely a result of a local atmospheric transport phenomenon. Further, the two measurements show differences in CH4, which are likely a result of different sensitivities to local emissions. Overall, the data indicate a clear but different sensitivity of either measurement approach to localized source patterns. Thus, the dataset enables the assessment of the representativeness of the different measurement approaches and of the performance of atmospheric transport models and emission inventories in the urban environments.

How to cite: Schmitt, T. D., Pilz, L., Maiwald, R., May, M., Löw, B. A., Kleinschek, R., Wietzel, J. B., Kuhn, J., Schmitt, S., Schmidt, M., Vardag, S. N., Hase, F., Griffith, D. W. T., and Butz, A.: A combined dataset of path-averaged and in-situ measurements of greenhouse gases to inform on the sensitivities to localized source patterns and transport effects in the urban atmosphere., EGU General Assembly 2024, Vienna, Austria, 14–19 Apr 2024, EGU24-11113, https://doi.org/10.5194/egusphere-egu24-11113, 2024.

EGU24-11352 | ECS | Orals | AS3.38

Evidence of ongoing SF6 emissions in Germany 

Katharina Meixner, Andreas Engel, Tanja J. Schuck, Thomas Wagenhäuser, Cedric Couret, Frank Meinhardt, Kieran M. Stanley, Alistair J. Manning, Armin Jordan, Xochilt Gutièrrez, Tobias Kneuer, Dagmar Kubistin, Matthias Lindauer, and Jennifer Mueller-Williams

Sulfur hexafluoride (SF6) is a greenhouse gas with an estimated atmospheric lifetime of about 850-1280 years and a global warming potential of 24,700 over 100 years. As this strong greenhouse gas continues to be used in switchgear, circuit breakers, transformers and in other applications; monitoring emissions worldwide is essential. Some global and regional measurement networks, including the AGAGE, NOAA and ICOS programmes, have been measuring surface-based SF6 for several years. Through these measurements and inverse modelling, it has been shown that there are still significant SF6 emissions in western Europe, the largest source estimated to be in southern Germany.

Here we present the first time series of all available SF6 observations in Germany to localise the most important source regions of SF6. Data from the following stations were used: Taunus Observatory (AGAGE), Zugspitze / Schneefernerhaus (UBA Germany, GAW, ICOS), Karlsruhe (DWD, ICOS), Hohenpeissenberg (DWD, GAW, ICOS), Lindenberg (DWD, ICOS), Ochsenkopf (MPI-BGC, ICOS), Steinkimmen (ICOS), Gartow (ICOS) and Schauinsland (UBA Germany, GAW, ICOS). This distribution of observation sites provides good resolution of SF6 emissions in Germany. Despite the annual National Inventory Reports to the UNFCCC suggesting a decline in SF6 emissions in Germany, observations show continued episodes of elevated mixing ratios. This is indicative of continuing local emissions in Germany. Depending on wind direction, the highest levels of SF6 were measured at Zugspitze, Schauinsland, Karlsruhe and the Taunus Observatory, consistent with a source in southern to south-western Germany.  The Karlsruhe station stands out in particular, with maximum mixing ratios of more than 70 ppt. In addition to an analysis of such pollution events, the observations are also used in the top-down inverse model InTEM (Inversion Technique for Emission Modelling) coupled to the atmospheric transport model NAME (Numerical Atmospheric Dispersion Modelling Environment).

How to cite: Meixner, K., Engel, A., Schuck, T. J., Wagenhäuser, T., Couret, C., Meinhardt, F., Stanley, K. M., Manning, A. J., Jordan, A., Gutièrrez, X., Kneuer, T., Kubistin, D., Lindauer, M., and Mueller-Williams, J.: Evidence of ongoing SF6 emissions in Germany, EGU General Assembly 2024, Vienna, Austria, 14–19 Apr 2024, EGU24-11352, https://doi.org/10.5194/egusphere-egu24-11352, 2024.

EGU24-11669 | Posters on site | AS3.38

Analytical regional inversion system for CO2 fluxes in Poland – first results from CoCO2 project 

Mirosław Zimnoch, Michał Gałkowski, and Piotr Sekuła

In order to accurately and precisely estimate anthropogenic greenhouse gas (GHG) emissions at different spatial and temporal scales, independent tools based on atmospheric observations are required as a necessary source of information for mitigation climate change efforts to be successful. Bayesian inversion systems utilizing state-of-the-art atmospheric transport models constitute a key element of anthropogenic emissions monitoring and verification systems, allowing for mathematically-grounded method of assessing emissions based on observed mole fractions.

Poland, the fifth largest economy in the EU, is simultaneously the fourth largest emitter of GHGs in terms of CO2 equivalent, owing primarily to only slowly decreasing reliance on coal for power generation.  Here, we present first results of the developmental inversion framework consisting of the WRF-GHG model run at 5 km spatial resolution over Central Europe, coupled with an analytical system in order to explain total emissions of CO2 for selected months (February and July) over Poland and Germany, the largest emitter of CO2 in Europe, for comparison. We also compare results for both 2018 and 2021 in an attempt to capture changes in emission patterns following the implementation of the various policies both before and after Paris Agreement. We also focus on the ability of the inversion system to capture changes in biogenic and anthropogenic emissions and address challenges stemming from the limited ground-based observation network in Poland.

Furthermore, we also discuss the ability of the system to distinguish emissions on the national, voivodeship (admin level 1) and city scale, thanks to the additional high-resolution simulations and in-situ observations in the city of Kraków.


The presented work was funded by the CoCO2 project, which has received funding from the European Union's Horizon 2020 research and innovation programme under Grant Agreement No. 958927 and the "Excellence Initiative - Research University" programme at AGH University of Kraków. We also gratefully acknowledge Polish high-performance computing infrastructure PLGrid (HPC Centres: ACK Cyfronet AGH) for providing computer facilities and support within computational grant no. PLG/2022/015860.

How to cite: Zimnoch, M., Gałkowski, M., and Sekuła, P.: Analytical regional inversion system for CO2 fluxes in Poland – first results from CoCO2 project, EGU General Assembly 2024, Vienna, Austria, 14–19 Apr 2024, EGU24-11669, https://doi.org/10.5194/egusphere-egu24-11669, 2024.

EGU24-12782 | ECS | Orals | AS3.38

Pin-pointing and quantifying anthropogenic CH4 emissions from two landfill sites in Madrid, Spain, observed by a combination of passive, active, and in situ airborne measurements during the HALO CoMet 2.0 mission 

Sven Krautwurst, Christian Fruck, Jakob Borchardt, Oke Huhs, Sebastian Wolff, Konstantin Gerilowski, Michał Gałkowski, Mathieu Quatrevalet, John P. Burrows, Christoph Gerbig, Andreas Fix, Hartmut Bösch, and Heinrich Bovensmann

To reduce and mitigate anthropogenic greenhouse gas surface fluxes from industrial sites, their sources must be, firstly, identified or localized and, secondly, accurately quantified. For methane (CH4), the second most important anthropogenic greenhouse gas, the quantification of its diverse emitters is still a challenge. Due to their nature, these emitters can reach dimensions from point sources to hundreds of square kilometres for fossil fuel (gas, oil, coal) exploitation sites or up to several square kilometres in case of waste disposal sites. Although, CH4 emissions from, e.g., waste disposal sites can be computed from activity data combined with landfill models, a high potential for unintended and poorly quantified leakages remain due to, e.g., potential ruptures in the landfill cover. Consequently, the exact localization and quantification of those leakages is a necessary step towards reducing CH4 emissions from waste disposal sites.

To have better knowledge and insights into anthropogenic and natural greenhouse gas emissions, a team of scientists has assembled a comprehensive suite of instruments aboard the German Research aircraft HALO (High Altitude and Long Range Research Aircraft) during the CoMet 2.0 Arctic mission conducted in Canada in August and September 2022. Although the campaign was primarily intended to observe and quantify CH4 and CO2 emissions and disentangle anthropogenic from natural sources at the high northern latitudes of Canada, a test flight over Spain revealed unexpectedly high and still persistent emissions from two landfills in Madrid - Valdemingomez and Pinto, previously also pointed out in an ESA story based on satellite observations. Both were investigated by means of passive and active remote sensing, as well as in situ airborne techniques.

The measurements of the passive airborne remote sensing instrument MAMAP2D-Light, developed at the University of Bremen, delivers atmospheric concentration anomaly maps of CH4 and CO2. Here, its imaging capabilities are used to pin-point the origin of the CH4 emissions across the targeted landfills and to quantify their emissions. MAMAP2D-Light’s concentration maps are combined with highly accurate CH4 column concentration measurements from the integrated-path differential-absorption lidar CHARM-F (CO2 and CH4 Remote Monitoring-Flugzeug), developed by German Aerospace Center (DLR) in Oberpfaffenhofen. Additionally, airborne CH4 in situ mole fractions were measured by the Jena Instrument for Greenhouse Gases (JIG) and supplemented with wind data within the emission plume in order to complement the remote sensing observations.

This contribution will present top-down emission estimates from measurements of all aforementioned instruments, operated quasi-simultaneously, i.e. within a time span of approximate 2 hours, over the targeted area in Madrid in August 2022.

How to cite: Krautwurst, S., Fruck, C., Borchardt, J., Huhs, O., Wolff, S., Gerilowski, K., Gałkowski, M., Quatrevalet, M., Burrows, J. P., Gerbig, C., Fix, A., Bösch, H., and Bovensmann, H.: Pin-pointing and quantifying anthropogenic CH4 emissions from two landfill sites in Madrid, Spain, observed by a combination of passive, active, and in situ airborne measurements during the HALO CoMet 2.0 mission, EGU General Assembly 2024, Vienna, Austria, 14–19 Apr 2024, EGU24-12782, https://doi.org/10.5194/egusphere-egu24-12782, 2024.

EGU24-12805 | Posters on site | AS3.38

Comparison of global high-resolution fossil fuel CO2 emissions data products to Vulcan v4.0: sector differences, urban geographies, and methodological guidance 

Kevin Gurney, Pawlok Dass, Huilin Sun, anna kato, Lech Gawuc, and Modeste Nematchoua

New global greenhouse gas emission products have emerged in recent years providing emissions estimation at increasing fine space/time scales. Furthermore, these efforts are moving away from traditional forms of proxy linear downscaling and toward the use of machine learning and integration of some forms of “bottom-up” data. In terms of application, there is interest in applying these data products to the city-scale, assisting and supporting mitigation activities in the global urban governance level.


However, it is also acknowledged that developing these very high-resolution efforts at the global scale come with particular challenges associated with data availability, method limitations, and data quality variations. Here we use a very high-resolution data product developed in the United States, the Vulcan version 4.0 emissions, as a point of comparison with two of the new global very high-resolution efforts: Climate Trace, and GRACED. The ‘Vulcan Project’ is an effort to compute bottom-up CO2 emissions from fossil fuel combustion (FFCO2) and cement production for the entire USA. Vulcan v4.0 quantifies emissions from 2010 to 2021 for multiple sectors to the point, line, and polygon spatial scale.


We use detailed comparison with Vulcan to illuminate and inform aspects of the global efforts that many warrant further investigation or methodological development. We upscale Vulcan to match the resolution of the global data products and aggregate as necessary to isolate sectoral matches. Using statistical analysis techniques we isolate differences that may be systematic and explainable via alternative methodologies and/or data sources. Our aim is to strengthen and improve all high-resolution efforts at multiple scales and recommend where scale limitation may exist.

How to cite: Gurney, K., Dass, P., Sun, H., kato, A., Gawuc, L., and Nematchoua, M.: Comparison of global high-resolution fossil fuel CO2 emissions data products to Vulcan v4.0: sector differences, urban geographies, and methodological guidance, EGU General Assembly 2024, Vienna, Austria, 14–19 Apr 2024, EGU24-12805, https://doi.org/10.5194/egusphere-egu24-12805, 2024.

EGU24-14036 | ECS | Orals | AS3.38

Mitigating Methane Emissions: A Comprehensive Measurement Study of Canadian Landfills 

Afshan Khaleghi, Evelise Bourlon, Athar Omidi, Jordan Stuart, Rebecca Martino, Donya Ghasemi, Chelsea Fougere, Andrea Darlington, Sebastien Ars, Lawson Gillespie, Mathias Goeckede, and David Risk

Canada’s waste sector contributes 23% toward national methane emission totals. Recently Canada committed to a 50% reduction in waste sector methane emissions by 2030 from 2020 levels, as part of its Global Methane Pledge action plan. Achieving this ambitious goal will certainty requires that regulators to be armed with an accurate and measurement-informed understanding of landfill methane emissions. In 2022 we carried out a snapshot methane emissions quantification campaign targeting 125 landfills across Canada, followed in 2023 by more detailed source-level measurements across seasons at selected landfills in various climate zones. Snapshot measurements were carried out by vehicle-based surveying coupled with Gaussian and Lagrangian flux inversion, and aircraft mass balance measurements. Repeating source-based measurements were conducted in 2023 across seasons at 12 landfills for 3 climatic regions using vehicle-based surveys, stationary tripod deployments, and drone measurements of plumes, from on-site and off-site locations. Source-specific flux rates were generated based on triangulation, Lagrangian backtrajectory analysis, and a Gaussian dispersion model, and were assessed for magnitude and temporal variability.  In snapshot measurement campaigns across the country, we saw generally good agreement between aircraft mass balance and truck measurements, with a moderate but consistent low bias in the truck emission rate estimates. Lagrangian methods to derive flux rate were comparable as long as input data was limited to exclude highly enriched onsite samples. Throughout a varied population of landfills across Canada, we found that emission rate estimates from measurement campaigns were generally in-line with operator-submitted values to the Canadian Greenhouse Gas Reporting Program, whereas a First Order Decay model used by the federal government for planning purposes tended to over-estimate landfill emissions. Climate zone was a clear predictor of methane generated per waste in place. In more detailed source studies, we found that numerous features on landfill operations could emit methane, most expected, but some unexpected. Management practice was a strong predictor of whether source types emitted significantly, or not. Meteorology and seasonal changes in climate were also strong predictor of emissions over time. These large-scale studies provide a wealth of data upon which Canada can base regulatory development and will be beneficial to countries with similar waste sector patterns and climates.

How to cite: Khaleghi, A., Bourlon, E., Omidi, A., Stuart, J., Martino, R., Ghasemi, D., Fougere, C., Darlington, A., Ars, S., Gillespie, L., Goeckede, M., and Risk, D.: Mitigating Methane Emissions: A Comprehensive Measurement Study of Canadian Landfills, EGU General Assembly 2024, Vienna, Austria, 14–19 Apr 2024, EGU24-14036, https://doi.org/10.5194/egusphere-egu24-14036, 2024.

EGU24-14046 | ECS | Orals | AS3.38

Resolving Auckland’s CO2 budget: urban biosphere, diurnal cycle and constraints from isotopes 

Stijn Naus, Sara Mikaloff-Fletcher, Beata Bukosa, Jocelyn Turnbull, Timothy Hilton, Elizabeth Keller, Stuart Moore, Daemon Kennett, Vanessa Monteiro, Gordon Brailsford, Sally Gray, Rowena Moss, and Sylvia Nichol

Carbon dioxide (CO2) is the single largest contributor to anthropogenic radiative forcing, with 70% of global CO2 emissions originating from urban areas. New Zealand has set ambitious greenhouse gas emission reduction targets, and its largest city, Auckland, will play a key role in achieving those reductions as it houses over 25% of the national population. To meet reduction targets, it is vital to understand current emissions and monitor the impact of implemented policies (e.g., planting trees). For these reasons, we are developing the first observation-constrained, urban-scale emission estimation framework for Auckland. This work is part of the New Zealand CarbonWatch-NZ project that also includes emission estimation at the national scale.

A new and developing atmospheric observation network is operated in and around Auckland to measure CO2, 14CO2, CO, CH4, and COS. The combination of trace gases is useful in distinguishing between source sectors, especially biosphere from anthropogenic fluxes. This is important for Auckland: a green city with a year-round growing season. High-resolution bottom-up emission estimates have been developed specifically for anthropogenic (Mahuika-Auckland) and biospheric (UrbanVPRM) CO2 fluxes in Auckland. We combine bottom-up estimates and atmospheric CO2 observations in an inverse emission estimation framework that includes atmospheric transport simulations with the Lagrangian NAME-III model, driven by meteorological data from the 333-m horizontal resolution Auckland Numerical Weather Prediction model. Use of such high-resolution meteorological data is unique and helps interpret atmospheric measurements in the heterogeneous landscape of Auckland, especially when combined with our high-resolution bottom-up estimates. Finally, we explore the value and difficulties of including the full diurnal cycle of CO2 data. The resulting emission product will be a policy-relevant instrument that can help evaluate and meet New Zealand’s emission reduction targets.

How to cite: Naus, S., Mikaloff-Fletcher, S., Bukosa, B., Turnbull, J., Hilton, T., Keller, E., Moore, S., Kennett, D., Monteiro, V., Brailsford, G., Gray, S., Moss, R., and Nichol, S.: Resolving Auckland’s CO2 budget: urban biosphere, diurnal cycle and constraints from isotopes, EGU General Assembly 2024, Vienna, Austria, 14–19 Apr 2024, EGU24-14046, https://doi.org/10.5194/egusphere-egu24-14046, 2024.

EGU24-16000 | Orals | AS3.38

Improving the spatiotemporal representation of anthropogenic CO2 and co-emitted species to support verification using earth observations 

Marc Guevara, Carles Tena, Oriol Jorba, Stijn Dellaert, Hugo Denier van der Gon, and Carlos Pérez García-Pando

A correct representation of the spatial and temporal distribution of anthropogenic emissions is important for verification of global CO2 emissions through current and future satellite emission monitoring. This work presents the results derived from the CoCO2 and CORSO Horizon Europe projects on improving the spatiotemporal representation of CO2 and co-emitted anthropogenic bottom-up emissions (i.e., CO, NOx) as part of the CO2 Monitoring and Verification Support capacity (CO2MVS) developments. The global CO2MVS system is envisioned to become a part of the European Union’s Copernicus Atmosphere Monitoring Service (CAMS). To improve the emission timing, we built a new set of activity and meteorology based global temporal profiles for the road transport, residential combustion, aviation, shipping and energy industry sectors. Their associated uncertainty is quantified by creating an ensemble of profiles from different years / countries / oceans and seas, so that the full range of possibilities is included. Regarding the improvement of the spatial representation, we constructed a global point source emission catalogue that contains emission information for individual facilities at their exact geographical location. The two developed datasets were compared against state-of-the-art bottom-up emission inventories that are widely used in modelling efforts, including the Emissions Database for Global Atmospheric Research (EDGAR), as well as independent TROPOMI satellite-based estimates for the co-emitted species. Main discrepancies between datasets were found in developing regions where information to derive bottom-up emissions such as energy use or pollution control strategies is still poorly characterized, indicating the need to complement the information with top-down estimates.

How to cite: Guevara, M., Tena, C., Jorba, O., Dellaert, S., Denier van der Gon, H., and Pérez García-Pando, C.: Improving the spatiotemporal representation of anthropogenic CO2 and co-emitted species to support verification using earth observations, EGU General Assembly 2024, Vienna, Austria, 14–19 Apr 2024, EGU24-16000, https://doi.org/10.5194/egusphere-egu24-16000, 2024.

EGU24-16432 | Posters on site | AS3.38

The International Methane Emissions Observatory (IMEO):  Integration of methane data across scales for policy-relevant results 

Cynthia Randles, Daniel Zavala-Araiza, Marci Baranski, Andrea Calcan, Claudio Cifarelli, Meghan Demeter, James France, Luis Guanter, Itziar Irakulis-Loitxate, Marc Watine-Guiu, Stefan Schwietzke, Manfredi Caltigirone, and Steven Hamburg

UNEP’s International Methane Emissions Observatory (IMEO) was established to provide reliable, public, and policy-relevant data to facilitate actions to reduce methane emissions.  IMEO is collecting and integrating diverse methane emissions data streams that will help to fill gaps in knowledge and refine global understanding of the location and magnitude of emissions across sectors.  Together these data streams – which include satellite remote sensing data, detailed analyses from multi-scale measurement campaigns, bottom-up inventory data, and measurement-based industry reporting – complement one another and provide a fuller characterization of the spatial and temporal variability in emissions than they do individually.  Knowledge of this variability is key to understanding the emissions of different populations of emitters and to identifying key mitigation opportunities for specific populations of emitters.  Such data can also be used as cross-verification points for other estimates of population-scale emissions – such as from inverse modelling or elsewhere reported emissions.  In this work, we will summarize IMEO’s efforts to assemble and integrate spatio-temporally dynamic methane emissions data including insights from measurement campaigns across the world, high-resolution methane emissions data from satellites, and developing standards for company-reported, measurement-based source- and site-level emission from the Oil and Gas Methane Partnership 2.0 (OGMP2.0). 

How to cite: Randles, C., Zavala-Araiza, D., Baranski, M., Calcan, A., Cifarelli, C., Demeter, M., France, J., Guanter, L., Irakulis-Loitxate, I., Watine-Guiu, M., Schwietzke, S., Caltigirone, M., and Hamburg, S.: The International Methane Emissions Observatory (IMEO):  Integration of methane data across scales for policy-relevant results, EGU General Assembly 2024, Vienna, Austria, 14–19 Apr 2024, EGU24-16432, https://doi.org/10.5194/egusphere-egu24-16432, 2024.

EGU24-16466 | Posters on site | AS3.38

EYE-CLIMA: A Horizon Europe project to support national inventories for emissions of climate forcers 

Rona Thompson, Andreas Stohl, Philippe Peylin, Philippe Ciais, Hartmut Boesch, Tuula Aalto, Antoine Berchet, Maria Kanakidou, Wilfried Winiwarter, Glen Peters, Dmitry Shchepashchenko, Jean-Pierre Chang, Roland Fuss, Ignacio Pisso, Richard Engelen, Almut Arneth, Nina Buchmann, Stefan Reimann, Stephen Platt, and Nalini Krishnankutty

National greenhouse gas inventories (NGHGIs) and Biennial Transparency Reports (BTRs) on emissions and removals are crucial elements of the Paris Agreement and its Global Stocktake. However, NGHGIs are subject to significant uncertainties, owing to uncertain emission factors and/or insufficient activity data, thus there is a need for their independent verification. One method to do this is through atmospheric inversions, which use atmospheric observations in a statistical optimization framework to estimate surface-to-atmosphere fluxes. This method of verification is referred to in the 2006 IPCC Guidelines on national reporting and in their 2019 refinement. However, atmospheric inversions have been hitherto considered too complex and inaccurate at national scales to be widely used for this purpose.

EYE-CLIMA is a Horizon Europe project that aims to develop the atmospheric inversion methodology to a level of readiness where it can be used to support the verification of NGHGIs. The overarching goals are to: i) develop a best practice in atmospheric inverse modelling for estimating emissions at national scale, including a full assessment of the uncertainties, ii) develop the methodology on how to prepare sectorial emission estimates from atmospheric inversions and make these comparable to what is reported in NGHGIs, iii) work together with NGHGI agencies on projects piloting the EYE-CLIMA methodology of emissions verification and iv) develop international best practices for the quality control of NGHGIs. EYE-CLIMA covers CH4, N2O, 5 HFC species, SF6, and the black carbon (BC) aerosol. This presentation will focus on the set-up of the EYE-CLIMA project and provide an overview of the first results in support of NGHGI verification.

How to cite: Thompson, R., Stohl, A., Peylin, P., Ciais, P., Boesch, H., Aalto, T., Berchet, A., Kanakidou, M., Winiwarter, W., Peters, G., Shchepashchenko, D., Chang, J.-P., Fuss, R., Pisso, I., Engelen, R., Arneth, A., Buchmann, N., Reimann, S., Platt, S., and Krishnankutty, N.: EYE-CLIMA: A Horizon Europe project to support national inventories for emissions of climate forcers, EGU General Assembly 2024, Vienna, Austria, 14–19 Apr 2024, EGU24-16466, https://doi.org/10.5194/egusphere-egu24-16466, 2024.

EGU24-17381 | Posters on site | AS3.38

PARIS, AVENGERS, EYE-CLIMA - Verification and reconciliation of estimates of climate forcers 

Sylvia Walter, Anita Ganesan, Marko Scholze, Rona Thompson, and Thomas Röckmann

PARIS, AVENGERS, and EYE-CLIMA represent initiatives funded under the EU Horizon call focused on "Verification and reconciliation of estimates of climate forcers." Drawing expertise from diverse fields such as atmospheric science, ecology, computer science, systems analysis, climate, and emissions reporting, these projects collaborate with the shared objective of refining estimates of greenhouse gas (GHG) emissions through observation-based methodologies. This collaborative effort not only aims to enhance the precision of GHG emission estimates but also facilitates meaningful exchanges with stakeholders involved in policymaking, national greenhouse gas inventories (NGHGIs), government bodies, and non-governmental organizations.

Utilizing atmospheric inversion models, the projects establish connections between surface-atmosphere GHG exchanges and atmospheric concentrations. The emissions estimates derived through this method directly correlate with atmospheric observations, remaining independent of activity data and emission factors. Consequently, this approach supports the independent verification of NGHGIs. In essence, PARIS, AVENGERS, and EYE-CLIMA strive to reconcile emissions information to contribute to the effective implementation of the Paris Agreement. Beyond atmospheric inversion methods, the projects incorporate land-surface models, which simulate the processes governing GHG exchanges between the land surface and atmosphere, along with data-driven models. 

This presentation will provide a comprehensive overview of the three projects, delving into their individual objectives and highlighting the overarching efforts aimed at verifying and reconciling estimates of climate forcers.

How to cite: Walter, S., Ganesan, A., Scholze, M., Thompson, R., and Röckmann, T.: PARIS, AVENGERS, EYE-CLIMA - Verification and reconciliation of estimates of climate forcers, EGU General Assembly 2024, Vienna, Austria, 14–19 Apr 2024, EGU24-17381, https://doi.org/10.5194/egusphere-egu24-17381, 2024.

EGU24-18491 | ECS | Posters on site | AS3.38

Improving Consistency in Methane Emission Quantification from the Natural Gas Distribution System across Measurement Devices 

Judith Tettenborn, Daniel Zavala-Araiza, Daan Stroeken, Hossein Maazallahi, Arjan Hensen, Ilona Velzeboer, Pim van den Bulk, Felix Vogel, Lawson Gillespie, Sebastien Ars, James France, and Thomas Röckmann

Efficient and cost-effective mitigation of methane emissions from local gas distribution systems requires full characterization of leaks across an urban region. Mobile real-time measurements of ambient CH4 provide a fast and effective approach to identify and quantify methane leaks. The objective of such methodologies is to relate emission rates to parameters obtained during mobile measurements. These parameters encompass the maximum methane enhancement detected while crossing a methane plume and the integrated area of the associated peak. The maximum enhancement is currently used for emission quantification in mobile measurements, but was suggested to exhibit inconsistency among various measurement devices. Based on controlled release experiments conducted in four cities (London, Toronto, Rotterdam, and Utrecht), emission estimation methodologies were evaluated. Integrated plume area was found to be a more robust metric across different methane gas analyzer devices than the maximum methane enhancement. A statistical function based on integrated plume area is proposed for more consistent emission estimations when using different instruments. Nevertheless, large temporal variations in CH4 concentration enhancements were observed for the same release rate in line with previous experiments. Evaluation of repeated measurements to address this uncertainty and enable differentiation among various leak sizes was included. This study recommends a minimum of three repeated measurements and an optimal range of 5-7 plume transects for effective emission quantification to prioritize repair actions.

How to cite: Tettenborn, J., Zavala-Araiza, D., Stroeken, D., Maazallahi, H., Hensen, A., Velzeboer, I., van den Bulk, P., Vogel, F., Gillespie, L., Ars, S., France, J., and Röckmann, T.: Improving Consistency in Methane Emission Quantification from the Natural Gas Distribution System across Measurement Devices, EGU General Assembly 2024, Vienna, Austria, 14–19 Apr 2024, EGU24-18491, https://doi.org/10.5194/egusphere-egu24-18491, 2024.

EGU24-18574 | Posters on site | AS3.38

A high-resolution European emission inventory of anthropogenic direct and indirect N2O emissions 

Hugo Denier van der Gon, Sophie van Mil, Rianne Dröge, Xinxuan Zhang, and Junjie Wang

Nitrous oxide (N2O) is the third most important long-lived greenhouse gas (GHG) and an important stratospheric ozone-depleting substance. We present the first version of a new high-resolution European emission inventory of anthropogenic direct and indirect N2O emissions. This inventory is developed to achieve one of the special objectives of the AVENGERS project, namely to advance the provision of high-resolution prior emissions by use of innovative activity data. AVENGERS is a Research and Innovation project funded under the Horizon Europe program of the European Union whose objective is to reconcile reported GHG emissions with independent information from atmospheric observations using top-down methods and process-based models, and thereby reduce the most important uncertainties of national emission inventories. To be able to compare national reported emission data against observations and model estimates, these reported emissions need to be available in a gridded form including essential emission characteristics such as emission timing and emission height. Our emission inventory starts from the reporting by European countries in their National Inventory Reports (NIR) to UNFCCC. Emissions are collected at the highest sectoral level. Each (sub)sector is connected to a specific spatial proxy, whereafter a consistent spatial distribution is applied for Europe at a resolution of 0.05 × 0.1 grid resolution (~6x6km). To support inverse modelling over a longer period where measurements are available, the inventory covers the period 2010-2021. Differences in country-specific choices in emission reporting to UNFCCC, e.g., in the waste sector, may lead to inconsistent emission estimates; we provide options for harmonization of these discrepancies. We pay special attention to understanding the role of indirect N2O emissions that may be equivalent to 15-20% of the total anthropogenic N2O emissions. Indirect emissions involve nitrogen that is emitted by anthropogenic activities and/or removed from agricultural soils and animal waste management systems via volatilization, leaching, runoff, or harvest of crop biomass, leading to N2O formation elsewhere. The reported indirect emissions, emitted from natural ecosystems and/or waterbodies are compared against process-model based emission estimates. The ultimate objective of this research is to reduce uncertainties in the key sources of N2O and support the implementation of top-down methods in support of the UNFCCC’s NIR preparation in collaboration between inverse modellers and inventory compilers.

How to cite: Denier van der Gon, H., van Mil, S., Dröge, R., Zhang, X., and Wang, J.: A high-resolution European emission inventory of anthropogenic direct and indirect N2O emissions, EGU General Assembly 2024, Vienna, Austria, 14–19 Apr 2024, EGU24-18574, https://doi.org/10.5194/egusphere-egu24-18574, 2024.

EGU24-18939 | ECS | Posters on site | AS3.38

Bridging the gap between plot and continental scale: A landscape scale greenhouse gas observation system based on a tall tower eddy covariance. 

Konstantinos Kissas, Anastasia Gorlenko, Charlotte Scheutz, and Andreas Ibrom

Due to its urgency, curbing greenhouse gas (GHG) emissions as fast as possible is pivotal for all countries. Mitigation measures are being initiated and a need for monitoring verification and reporting (MVR) of their efficacy arises. Currently existing science based MVR strategies are either too fine scale, e.g. traditional eddy covariance, or very coarse scale, e.g., atmospheric model inversion from high precision continental scale concentration fields. Integral methods to estimate GHG budgets of landscapes and cities are in the state of development. One element of such systems are turbulent flux measurements from tall tower platforms. To be able to document the green transition of Denmark in terms of reducing GHG budgets, we proposed a network of tall tower GHG flux measurements covering representative urban and remote landscapes. In the first step of the project, we designed and built a prototype of such system and applied it in a rural area close to the Danish Capital of Copenhagen.

In this presentation, we define criteria for a successful tall tower based GHG flux observation system for MVR of a change in net GHG emissions. We provide a brief overview how we optimized the design to meet these criteria. Finally, we present some key results from the first five months of continuous observation to demonstrate how well we actually met the criteria with our system and conclude on the future prospects of the proposed tall tower GHG observation network.

The results include net fluxes of all major long living GHG (CO2, CH4 and N2O) and two indicator gasses, i.e. carbonyl sulfide (COS) and carbon monoxide (CO). These indicator gases were chosen to represent photosynthesis and to estimate fossil CO2 fluxes from combustion processes. Important results are how accurate the data represent the landscape and what the detection limits for flux estimations of the different GHGs are.

How to cite: Kissas, K., Gorlenko, A., Scheutz, C., and Ibrom, A.: Bridging the gap between plot and continental scale: A landscape scale greenhouse gas observation system based on a tall tower eddy covariance., EGU General Assembly 2024, Vienna, Austria, 14–19 Apr 2024, EGU24-18939, https://doi.org/10.5194/egusphere-egu24-18939, 2024.

EGU24-19167 | ECS | Posters on site | AS3.38

Evaluating the national CO2 budgets of East Asian countries (2015-2022) using the top-down approach 

Yeon Bae, Sujong Jeong, and Jeongmin Yun

he precise estimation and verification of country-specific net carbon exchange are growing in importance for meeting greenhouse gas reduction targets outlined in the Paris Agreement. In the East Asian region, carbon dioxide emissions account for more than one-third of global emissions; however, the values remain highly uncertain. This study aims to calculate the country-specific Net Carbon Exchange (NCE) for the years 2015–2022 in three East Asian countries—Korea, Japan, and China—using a top-down assessment approach. We utilize the atmospheric inversion system developed based on Geos-Chem adjoint v35j to assimilate OCO-2 XCO2 retrievals, generating net carbon flux. These values compare with national emission inventory data reported to the IPCC and forest growing stock form the National Forest Inventory. We evaluate the national CO2 budgets for the three East Asian countries and analyze the spatial and temporal variations in carbon fluxes.

How to cite: Bae, Y., Jeong, S., and Yun, J.: Evaluating the national CO2 budgets of East Asian countries (2015-2022) using the top-down approach, EGU General Assembly 2024, Vienna, Austria, 14–19 Apr 2024, EGU24-19167, https://doi.org/10.5194/egusphere-egu24-19167, 2024.

EGU24-19215 | ECS | Orals | AS3.38

Estimates of HFC-134a Emissions over Europe informed by observations show a recent increase 

Saurabh Annadate, Michela Maione, Rita Cesari, Serena Falasca, Umberto Giostra, Barbara Gonella, Federica Moricci, and Jgor Arduini

Hydrofluorocarbons (HFCs) are a class of greenhouse gases (GHGs) primarily used as substitutes for ozone-depleting substances like chlorofluorocarbons (CFCs) and hydrochlorofluorocarbons (HCFCs), phased out under the Montreal Protocol. However, HFCs significantly impact global warming due to their high global warming potential. In light of the pressing need to tackle climate change and mitigate the effects of GHG emissions, the United Nations Framework Convention on Climate Change (UNFCCC) has established rigorous commitments on emission reduction. As a commitment to the UNFCCC, Annex-I countries need to report their national emission estimates for regulated GHGs, including HFCs, based on the methodologies reported in the IPCC guidelines (Intergovernmental Panel on Climate Change). According to the guidelines, the comparison of estimates with top-down (models based on atmospheric measurements) is indicated as an effective tool for verifying the accuracy of inventories and there is a growing need for independent verification of these estimates. This study reports the most recent update on emissions of 1,1,1,2-Tetrafluoroethane (CH2FCF3) from 2008 to 2023, employing inverse modelling within the European domain, with a specific focus on Italy. CH2FCF3, commercially known as HFC-134a, stands as the most prevalent HFC on a global scale. Its thermodynamic properties, akin to those of dichlorodifluoromethane (CFC-12), render it an effective refrigerant for the RAC (refrigeration and air conditioning) sector. This study reveals a notable decline in HFC-134a emissions over the past decade, followed by a recent resurgence. Specifically, Italian emissions in 2020 show a 48% reduction compared to the levels of 2011 and a subsequent increase, with emissions rebounding by 25% in 2022. The availability of near real-time validated observations combined with the most recent inversion frameworks -such as Flexpart/flexinvert+ used here, could be a valuable tool to support the Inventories used to track progress and the effectiveness of the mitigation policies adopted by each country for this class of compounds (that could be extended to others major GHGs) to maximise the effectiveness of their investments.

How to cite: Annadate, S., Maione, M., Cesari, R., Falasca, S., Giostra, U., Gonella, B., Moricci, F., and Arduini, J.: Estimates of HFC-134a Emissions over Europe informed by observations show a recent increase, EGU General Assembly 2024, Vienna, Austria, 14–19 Apr 2024, EGU24-19215, https://doi.org/10.5194/egusphere-egu24-19215, 2024.

EGU24-19246 | ECS | Orals | AS3.38

Using atmospheric measurements to evaluate recent bottom-up trends and seasonal patterns in U.K. and Swiss N2O emissions 

Eric Saboya, Alistair J. Manning, Peter Levy, Stephan Henne, Kieran M. Stanley, Joseph Pitt, Dickon Young, Daniel Say, Aoife Grant, Tim Arnold, Chris Rennick, Sam J. Tomlinson, Edward J. Carnell, Yuri Artoli, Ann Stavart, T. Gerard Spain, Simon O'Doherty, Matthew Rigby, and Anita Ganesan

Atmospheric trace gas measurements can be used to independently assess national greenhouse gas inventories through inverse modelling. Here, atmospheric nitrous oxide (N2O) measurements are used to derive monthly U.K. N2O emissions for 2013-2022 – using the InTEM and RHIME inverse methods – and Swiss N2O emissions for 2017-2022 – using the ELRIS inverse method. We find mean U.K. emissions of 90.5±23.0 and 111.7±32.1 Gg N2O yr-1 for 2013-2022 and corresponding trends of -0.68±0.48 and -2.10±0.72 Gg N2O yr-2, respectively, derived using InTEM and RHIME. The 2013-2022 mean U.K. N2O emissions as reported by the U.K. National Atmospheric Emissions Inventory were relatively constant at 74 Gg N2O yr-1 across this period, which is 14-33% smaller than the U.K. emissions derived from atmospheric data. Top-down Swiss emissions of 10.8±3.8 Gg N2O yr-1 derived using atmospheric measurements were very comparable to those reported in the Swiss National Inventory: 11.5 (8.3 to 14.9) Gg N2O yr-1 over 2017-2021. Pronounced seasonal N2O emissions cycles are inferred in the U.K. and Swiss data with similar seasonal magnitudes observed in both countries. In the U.K., the primary seasonal peak occurs in the spring with a second smaller peak occurring in the late summer for certain years. The springtime peak has a long seasonal decline that contrasts with the sharp rise and fall of N2O emissions estimated from the bottom-up U.K. Emissions Model (UKEM). Similarly, Swiss seasonal N2O emissions peak during the summer with a second smaller peak also occurring in the late summer/early autumn for certain years. Bayesian inference is used to minimize the U.K. seasonal cycle mismatch between the average top-down (atmospheric data-based) and UKEM bottom-up (process model and inventory-based) seasonal emissions at a sub-sector level. Increasing agricultural manure management and decreasing synthetic fertiliser N2O emissions reduces some of the discrepancy between the average U.K. top-down and bottom-up seasonal cycles. Other possibilities could also explain these discrepancies, such as missing emissions from NH3 deposition, but these require further investigation.

How to cite: Saboya, E., Manning, A. J., Levy, P., Henne, S., Stanley, K. M., Pitt, J., Young, D., Say, D., Grant, A., Arnold, T., Rennick, C., Tomlinson, S. J., Carnell, E. J., Artoli, Y., Stavart, A., Spain, T. G., O'Doherty, S., Rigby, M., and Ganesan, A.: Using atmospheric measurements to evaluate recent bottom-up trends and seasonal patterns in U.K. and Swiss N2O emissions, EGU General Assembly 2024, Vienna, Austria, 14–19 Apr 2024, EGU24-19246, https://doi.org/10.5194/egusphere-egu24-19246, 2024.

EGU24-19389 | Orals | AS3.38

The Global Greenhouse Gas Watch 

Gianpaolo Balsamo and Lars Peter Riishojgaard

Greenhouse gas emissions, greenhouse gas concentrations and global mean temperature all continue to rise, and in order to stay within the temperature limits stipulated in the text of the Paris Agreement, mitigation action is becoming increasingly urgent However, the fact that we cannot quantitatively and reliably predict future GHG concentrations – and therefore climate scenarios – from assumed future emission pathways is a complicating factor when designing mitigation action. Even more problematic is the assessment the impact or effectiveness of many current or proposed mitigation activities, since it often has to be based on indirect measures such as avoided emissions with respect to a hypothetical baseline, or carbon stored, e.g. in the land or ocean biosphere, neither of which can be directly linked to atmospheric concentrations.

In order to provide robust, actionable data that will help Parties to the UNFCCC and other stakeholder design and develop mitigation action and monitor its effectiveness, the World Meteorological Congress in May 2023 endorsed the Global Greenhouse Gas Watch (G3W) as an internationally coordinated framework to provide near-real time GHG (CO2, CH4 and N2O) flux estimates based on atmospheric modelling and atmospheric observations.  At COP28 in Dubai, the G3W was formally recognized by the Subsidiary Body for Scientific and Technological Advice (SBSTA-59) to the UNFCCC.

Currently a G3W implementation plan is in development, with the aim of submitting it for approval by the WMO Executive Council by mid-2024. Some of the key elements of the plan are a significant strengthening of the global GHG observing capabilities, improved near-real time exchange of both observational data and flux estimates, and routine intercomparision of model output among all participating flux estimation centers.

The presentation will introduce the overall G3W development timeline which aims for a full operational capability to be ready for the Second Global Stocktake in 2027-28, with the main focus on the near-time activities planned for 2024-25.

How to cite: Balsamo, G. and Riishojgaard, L. P.: The Global Greenhouse Gas Watch, EGU General Assembly 2024, Vienna, Austria, 14–19 Apr 2024, EGU24-19389, https://doi.org/10.5194/egusphere-egu24-19389, 2024.

The Po valley, situated in Northern Italy, is a flat region with mountains on the northern and southern ends, characterized by intensive animal farming and agriculture practices (including rice cultivation), all of which are significant sources of methane (CH4) emissions. Although both sources and sinks of strong greenhouse gases are well identified, large uncertainties still remain in estimating the CH4  budget. However, inverse modeling is an observation-based approach that can be used independently to verify existing emission inventories.
The objective is to estimate CH4  surface-atmosphere fluxes in Northern Italy for the year 2019 over a nested grid covering the Po valley at 0.1°x0.1° horiz. grid res. using the atmospheric inversion framework FLexInvert+. The framework integrates atmospheric CH4  mixing ratios from 17 ICOS sites, background mixing ratios using the CAMS inversion product, prior information (with total emissions of 594 Tg y-1), and an atmospheric transport model to optimize surface fluxes to best match the observation. The FlexPart model is used to simulate the source-receptor relationship using ECMWF ERA5 windfields at 0.5°x0.5° horiz. res., and relates the surface fluxes to the changes in CH4  mixing ratios. Modeling the dispersion of particles over complex terrain, i.e. the Alps, is challenging due to processes interacting with the orography, and a coarse model resolution smoothens the slope and elevation of the mountain. Hence, a sensitivity analysis was carried out for the six mountain sites >1000 m a.s.l. located within the nested domain to assess the optimal particle release height using 7-days backtrajectories. The inversion results from three different release heights were examined using 1) the original sampling height of CH4 a.s.l., 2) the pressure-based height, determined by identifying the model-level height that minimized the difference between the modeled pressure and observed pressure at the receptor site, and 3) the potential temperature-based height, determined by matching the modeled potential temperature with observations to identify the model-level height. The hypsometric equation was applied to obtain the release height, and an averaged particle release height was selected for the entire year based on nighttime observations. Initial findings highlight significant differences in posterior estimates among the three release heights and hold promising prospects for achieving improved inversion results.

How to cite: Dahl, L., L. Thompson, R., and Bigi, A.: Estimating methane fluxes in Northern Italy by inverse modeling: Evaluating optimal particle transport release heights in mountainous regions, EGU General Assembly 2024, Vienna, Austria, 14–19 Apr 2024, EGU24-19900, https://doi.org/10.5194/egusphere-egu24-19900, 2024.

EGU24-22504 | Orals | AS3.38

The US global and regional observing and analysis systems strategies for monitoring and delivering GHG natural and anthropogenic emissions estimates 

Colm Sweeney, Vanda Grubisic, Alryn Andrews, John Miller, Lesley Ott, Rik Wanninkhof, Anna Karion, and Sourish Basu

Direct and remote observations of ocean and atmospheric greenhouse gases (GHGs) provide a critical constraint on global atmospheric burden of GHGs as well as the key natural and anthropogenic processes that transfer GHGs between atmosphere and land and ocean reservoirs. The United States (US) has played a large role in providing observations that span global to local scale in both the ocean and the atmosphere relying on both direct measurements of the atmosphere and ocean from ground, tower, ship, balloon and aircraft-based platforms and remote measurements from satellite, upward looking spectrometers, floats and ocean profilers. While these networks have been instrumental in providing a basic understanding of the carbon cycle there are many gaps that need to be filled over the next decade to assess interannual variability in both natural and anthropogenic sources and sinks of GHGs. With no planned US satellite missions for carbon dioxide in this time period there is an urgent need to take advantage of other gap filling opportunities. For methane, the focus on large point sources for satellites also represents a gap that many assumed would be filled in the next decade. These gaps in planned remote sensing satellite missions reinforce the need to focus development of new planforms, networks and tracers for observing atmospheric and ocean GHGs gradients and processes driving these gradients. These processes include climate/carbon feedbacks as well as changes in anthropogenic emissions across multiple scales that allow stakeholders in pursuit of GHG mitigation and carbon capture efforts to be informed and act with the most up-to-date understanding of critical processes in the global and local carbon budgets. We provide an overview of the observing, analysis and information systems that build on "bottom up" systems that currently inform the Global Stocktake. We also will report on efforts to make this information more actionable for emissions mitigation.

How to cite: Sweeney, C., Grubisic, V., Andrews, A., Miller, J., Ott, L., Wanninkhof, R., Karion, A., and Basu, S.: The US global and regional observing and analysis systems strategies for monitoring and delivering GHG natural and anthropogenic emissions estimates, EGU General Assembly 2024, Vienna, Austria, 14–19 Apr 2024, EGU24-22504, https://doi.org/10.5194/egusphere-egu24-22504, 2024.

EGU24-22506 | Orals | AS3.38

Quantification of CH4 Emissions from the EMIT and AVIRIS-3 Imaging Spectrometers 

Red Willow Coleman, Philip Brodrick, K. Dana Chadwick, Adam Chlus, Michael Eastwood, Clayton Elder, Jay Fahlen, Sergio Gomezbeltran, Francesca Hopkins, David Thompson, Andrew Thorpe, and Robert Green

Spaceborne and airborne imaging spectrometers can identify methane (CH4) plumes and enable emission quantification and direct sectoral attribution necessary to better constrain methane emissions and inform mitigation strategies. We will show CH4 emission quantification results and accompanying uncertainty products for CH4 plume observations from NASA’s Earth surface Mineral dust source InvesTigation (EMIT) imaging spectrometer onboard the International Space Station, as well as the recently developed Airborne Visible/Infrared Imaging Spectrometer 3 (AVIRIS-3). The differing spatial resolution and instrument sensitivity of the EMIT and AVIRIS-3 sensors are highly complementary for tiered CH4 plume detection and quantification. The large spatial coverage from EMIT allows us to identify and quantify previously unknown emissions from CH4 point sources across large regions of the Earth’s surface, while AVIRIS-3 has higher sensitivity and increased spatial resolution for characterizing CH4 emissions below EMIT’s detection limit.

Building on a legacy of greenhouse gas retrievals first developed for airborne imaging spectrometers (e.g., AVIRIS, AVIRIS-NG), we use a matched filter approach to retrieve CH4 enhancements and the per-plume integrated mass enhancement (IME) method with windspeed data to estimate hourly CH4 emission rates. We take a two-pronged approach to validating our CH4 emission detection and quantification method: (1) an AVIRIS-3 CH4 controlled release experiment with multiple flow rates, and (2) evaluation of a simultaneous collection of AVIRIS-3 and EMIT in West Texas’ Permian Basin oil-and-gas producing region. This validation work will help provide confidence in EMIT’s plume quantification approach, which is important as imaging spectrometers are necessary for more comprehensive understanding of global CH4 point source emissions and greenhouse gas budgets, particularly in areas with limited reporting requirements. Lastly, the EMIT greenhouse gas portal (https://earth.jpl.nasa.gov/emit/data/data-portal/Greenhouse-Gases/) is actively distributing methane data products in support of NASA’s Open Source Science Initiative and AVIRIS-3 data will soon be publicly available for interested decision-makers and users (e.g., U.S. Greenhouse Gas Center).

How to cite: Coleman, R. W., Brodrick, P., Chadwick, K. D., Chlus, A., Eastwood, M., Elder, C., Fahlen, J., Gomezbeltran, S., Hopkins, F., Thompson, D., Thorpe, A., and Green, R.: Quantification of CH4 Emissions from the EMIT and AVIRIS-3 Imaging Spectrometers, EGU General Assembly 2024, Vienna, Austria, 14–19 Apr 2024, EGU24-22506, https://doi.org/10.5194/egusphere-egu24-22506, 2024.

EGU24-22508 | Posters on site | AS3.38

NOAA Carbon Monitoring, Research, and Innovation: Long-Standing Foundation to Support Climate Mitigation 

Vanda Grubišić, Ariel Stein, Monica Kopacz, and Annarita Mariotti

NOAA has over 50 years of experience monitoring global atmospheric levels of greenhouse gasses (GHG) emitted to the atmosphere by human activities and natural sources. This includes most notably measurements of atmospheric abundances of CO2 and other long-lived GHGs at its Global Greenhouse Gas Reference Network (GGGRN). The goal of GGGRN is to provide measurements of GHGs and their large-scale spatial and temporal distributions as precisely and accurately as possible to be able to determine spatial gradients in GHGs and inform changes in emissions and sinks. Success at meeting this goal requires long-term continuity of measurements and measurement quality. To that end, NOAA is largely responsible for the World Meteorological Organization (WMO) standard for CO2 and several other GHG measurements, providing a solid foundation for well-calibrated global atmospheric GHG measurements. The NOAA carbon monitoring covers both the atmosphere and the oceans and its unique multi-platform approach to observing GHGs, includes the ocean observing capabilities of air-sea carbon fluxes and pCO2 measurements, among other key assets. While these networks have been instrumental in providing a basic understanding of the carbon cycle, there are many gaps that need to be filled over the next decade to assess interannual variability in both natural and anthropogenic sources and sinks of GHGs. This presentation will highlight the latest developments in NOAA carbon monitoring, including the development of new planforms, networks, and tracers for observing atmospheric and ocean GHGs gradients and processes driving these gradients. Innovative research supported by NOAA has leveraged long-term GHG monitoring to accelerate the development of global GHG models, and advanced GHG research and accounting on urban, regional, and global scales. NOAA’s GHG capabilities span measurements, process research, modeling, data assimilation and data products such as the Annual Greenhouse Gas Index (AGGI) as well as future climate projections for IPCC reports and the National Climate Assessment. NOAA uniquely includes research and service capabilities under one roof. Decades of experience in carbon cycle research, including GHG monitoring, modeling and data assimilation provide the ideal foundation to accelerate national and international efforts for carbon measurement, monitoring, reporting and verification (MMRV) in support of climate mitigation.

How to cite: Grubišić, V., Stein, A., Kopacz, M., and Mariotti, A.: NOAA Carbon Monitoring, Research, and Innovation: Long-Standing Foundation to Support Climate Mitigation, EGU General Assembly 2024, Vienna, Austria, 14–19 Apr 2024, EGU24-22508, https://doi.org/10.5194/egusphere-egu24-22508, 2024.

EGU24-2140 | ECS | Posters on site | BG1.3 | Highlight

Enhanced methane concentrations measured over the Amazon rainforest 

Linda Ort, Lenard Lukas Röder, Peter Hoor, Jos Lelieveld, and Horst Fischer

Recently, global mean methane concentrations have increased strongly. Methane is one of the most important greenhouse gases and plays a key role in atmospheric chemistry. Especially, due to its long lifetime of approx. 10 years and its significant effect on Earth’s climate change, a detailed knowledge of its source regions and their temporal evolution is crucial.

In this study, we present a unique data set of methane measured in situ over the Amazon rainforest region during the wet season in the CAFE Brazil (Chemistry of the Atmosphere Field Experiment) aircraft campaign from December 2022 to January 2023 in Manaus, Brazil. Methane was measured with an infrared quantum cascade laser absorption spectrometer on board the High Altitude and LOng-range aircraft (HALO). These observations show enhanced concentrations of methane in and above the boundary layer of the Amazon rainforest. Locally, dry air mixing ratios of up to approx. 2100 ppbv could be measured up to 4 km of altitude. Detailed analysis shows only a small contribution from anthropogenic sources. Especially over permanent wetlands and deforested areas, the methane concentrations were enhanced. Furthermore, the data has been compared to satellite measurements from the National Oceanic and Atmospheric Administration (NOAA), indicating good agreement in the free troposphere. Nevertheless, the mean levels directly above the Amazon rainforest are approx. 100 ppbv higher than the global background. Moreover, a global distribution based on airborne data from several campaigns (PHILEAS 2023, CAFE Brazil 2022/23, SouthTrac 2019, CAFE Africa 2018, WISE 2017, ATom 2016/17, OMO 2015, ESMVal 2012) shows that the methane surface concentrations over the Amazon rainforest has a local maximum. This calls for more detailed investigations of methane near the surface in the Amazon and raises an important question: Have we underestimated the Amazon rainforest as a significant source of the global methane budget?

How to cite: Ort, L., Röder, L. L., Hoor, P., Lelieveld, J., and Fischer, H.: Enhanced methane concentrations measured over the Amazon rainforest, EGU General Assembly 2024, Vienna, Austria, 14–19 Apr 2024, EGU24-2140, https://doi.org/10.5194/egusphere-egu24-2140, 2024.

Land and freshwater ecosystems play a significant role in affecting the global methane budget. With future warming, the increase of methane emissions could create large positive feedbacks to the global climate system.  We have used observation data of methane fluxes from diverse land and freshwater ecosystems to calibrate and evaluate extant land and freshwater biogeochemistry models of the Terrestrial Ecosystem Model (TEM) and the Arctic Lake Biogeochemistry Model (ALBM) to quantify the global methane emissions for the past few decades and the 21st century in a temporally and spatially explicit manner. Land ecosystems could emit methane from wetlands while uplands could uptake atmospheric methane. TEM simulates that global wetlands emissions are 212 ± 62 and 212 ± 32 Tg CH4 yr−1 due to uncertain parameters and wetland type distribution, respectively, during 2000–2012. After combining the global upland methane consumption of −34 to −46 Tg CH4 yr−1, we estimate that the global net land methane emissions are 149–176 Tg CH4 yr−1 due to uncertain wetland distribution and meteorological input. During 1950–2016, both wetland emissions and upland consumption increased during El Niño events and decreased during La Niña events. For freshwater ecosystems, we find that current emissions are 24.0 ± 8.4 Tg CH4 yr−1 from lakes larger than 0.1 km2. Future projections under the RCP8.5 scenario suggest a 58–86% growth in emissions from lakes.  Warming enhanced methane oxidation in lake water can be an effective sink to reduce the net release from global lakes. Additionally, these studies identify the key biogeochemical and physical processes of controlling methane production, consumption, and transport in various hotspot emission regions.  We also highlight the need for more in situ methane flux data, more accurate wetland and lake type and their area distribution dynamics information to better constrain the quantification uncertainty of global biogenic methane emissions across the landscape.

How to cite: Zhuang, Q.: Quantifying global biogenic methane emissions from land and freshwater ecosystems across the landscape , EGU General Assembly 2024, Vienna, Austria, 14–19 Apr 2024, EGU24-2178, https://doi.org/10.5194/egusphere-egu24-2178, 2024.

EGU24-2479 | ECS | Posters on site | BG1.3

The UFLUX ensemble of multiple-scale carbon, water, and energy fluxes. 

Songyan Zhu and Jian Xu

In light of the challenges posed by climate change, global governments, including the United Kingdom (UK), have committed to addressing and mitigating the impacts of climate change, emphasizing the pursuit of Net Zero objectives. The terrestrial ecosystems on a global scale, functioning as pivotal carbon reservoirs, assume a critical role in climate change mitigation, especially within the context of an imminent scenario marked by accelerated warming and drying conditions. Recognizing that the carbon sequestration capacity of ecosystems is intricately linked to their energy and water cycling dynamics, this study presents the Uniform FLUXes (UFLUX)-ensemble dataset (https://sites.google.com/view/uflux) that accurately quantifies carbon, water, and energy fluxes across ecosystems in a consistent and mutually comparable manner. The UFLUX ensemble, relying on the upscaling of in-situ eddy covariance (EC) tower measurements using satellite vegetation proxies and meteorology reanalysis, constitutes the methodological foundation of this research.

The UFLUX originated from our prior investigations into filling gaps in EC fluxes. This is due to the analogous nature of the procedures involved in flux gap-filling and upscaling, wherein both entail the interpolation/extrapolation of fluxes, albeit in the temporal and spatial domains, respectively. The fluxes in UFLUX are upscaled through the application of a uniform set of algorithms and environmental determinants, aiming to mitigate the sources of uncertainty. The UFLUX methodology has demonstrated effectiveness in capturing the global CO2 fertilization effect. Furthermore, it has exhibited resilience to agricultural management interventions and has adeptly captured flux variability at a high spatial resolution of 20 meters in southwest England. These accomplishments lay the groundwork for generating the UFLUX-ensemble dataset.

The resulting UFLUX-ensemble dataset incorporates 60 members considering specific advantages of multiple satellite and meteorology reanalysis products. Aligned with the Net Zero vision articulated by nations, and recognizing the imperative of addressing data storage requirements, the dataset is made available on three scales: 1) daily 100-m resolution for the UK, 2) half-yearly 100-m resolution for Europe, and 3) monthly 0.25°×0.25°resolution for the entire globe. This diverse data provision is designed to assist climate actions, particularly in countries grappling with specific socio-economic challenges. A rigorous technical validation underscores the merits of the UFLUX ensemble, demonstrating its ability to capture 0.8 % of the flux variability with errors amounting to 0.76 g C m-2 d-1 and 11.67 W m-2. The UFLUX-ensemble dataset serves as a valuable resource, offering insights to inform land management practices, including nature-based solutions, with the overarching objective of augmenting carbon sequestration in terrestrial ecosystems and contributing to the realization of a carbon-neutral future.

How to cite: Zhu, S. and Xu, J.: The UFLUX ensemble of multiple-scale carbon, water, and energy fluxes., EGU General Assembly 2024, Vienna, Austria, 14–19 Apr 2024, EGU24-2479, https://doi.org/10.5194/egusphere-egu24-2479, 2024.

EGU24-2492 | Orals | BG1.3

Future CH4 budgets as modelled by a fully coupled Earth system model using prescribed GHG concentrations vs. interactive CH4 sources and sinks 

Ulas Im, Kostas Tsigaridis, Susanne Bauer, Sabine Eckhardt, Drew Shindell, Lise Lotte Sørensen, and Simon Wilson

We have used the NASA Goddard Institute for Space Studies (GISS) Earth system model GISS-E2.1 to study the future budgets and trends of global and regional CH4 under different emission scenarios. GISS-E2.1 is one of the few ESMs that can be driven by anthropogenic CH4 emissions, as well as interactive natural sources such as wetlands, and can simulate the tropospheric CH4 chemistry. In frame of the recent short-lived climate forcers (SLCFs) assessment by the Arctic Monitoring and Assessment Programme (AMAP), we used the GISS-E2.1 model with prescribed long-lived greenhouse gas (GHG) concentrations. In the present study, we have supplemented these simulations using the interactive CH4 sources and sinks in order to quantify the model performance and the sensitivity to CH4 sources and sinks. We have used the Current Legislation (CLE) and the Maximum Feasible Reduction (MFR) emission scenarios from the Eclipse V6b emission database to simulate the future chemical composition and climate impacts from 2015 to 2050. We have also simulated 1995-2014 in order to evaluate the model performance following the AMAP-SLCF protocol.

The prescribed GHG version underestimates the Global Atmospheric Watch (GAW) surface CH4 observations during the period between 1995 and 2023 by 1% [-8.4%-2.0%], with a correlation (r) of 0.71 [-0.41 0.99]. The largest underestimations are over the continental emission regions such as North America, Europe, and Asia, while biases are smallest over oceans. On the other hand, the simulation with interactive sources and sinks underestimates the GAW observations more than the prescribed simulation, by 18.5% [-25% -10.4%], with a lower r of 0.36 [-0.82 0.93]. Opposite to the prescribed simulation, the biases are largest over oceans and smaller over the continents, however they are still larger over land than the prescribed simulation. The interactive simulation, with large sources virtually over land and strong sink over oceans, has a land/ocean ratio larger than 1 while the prescribed simulation has this ratio equal to 1 as it distributes the global prescribed CH4 concentration equally in longitude over a given latitude. This clearly shows that the interactive sources and sinks should be represented in models in order to realistically simulate the chemical composition and the oxidative capacity of the atmosphere.

As expected, the MFR scenario simulates lower global surface CH4 concentrations and burdens compared to the CLE scenario, however in both cases, global surface CH4 and burden continue to increase through 2050 compared to present day.  In the CLE scenario, increases are largest over the equatorial belt, in particular over India and East China, while the MFR scenario shows increases over the whole Southern Hemisphere, however much smaller compared to CLE. Finally, the interactive simulation shows that the chemical CH4 sink increases in the CLE scenario, while it slightly decreases in the MFR, leading to a larger CH4 lifetime in the MFR scenario compared to in the CLE scenario.

How to cite: Im, U., Tsigaridis, K., Bauer, S., Eckhardt, S., Shindell, D., Sørensen, L. L., and Wilson, S.: Future CH4 budgets as modelled by a fully coupled Earth system model using prescribed GHG concentrations vs. interactive CH4 sources and sinks, EGU General Assembly 2024, Vienna, Austria, 14–19 Apr 2024, EGU24-2492, https://doi.org/10.5194/egusphere-egu24-2492, 2024.

Radiocarbon can be used as an independent and objective tracer to evaluate fossil fuel CO2 (CO2ff) emissions, because of its complete depletion in fossil fuel sources. Here, we present a study on the CO2ff emissions reduction during the COVID-19 lockdowns in 2020 based on atmospheric Δ14CO2 observation at Chinese background sites. We observed obvious enhancements (several per mill to dozens of per mill) of atmospheric Δ14CO2 during the COVID-19 lockdowns compared with that in the same period. A preliminary analysis showed that these enhancements indicate several percepts to dozens of percents CO2ff emissions reduction from Eurasia (exclude China) and different parts in China during the COVID-19 lockdowns.

How to cite: Niu, Z.: Decrease in fossil fuel CO2 emissions during COVID-19 lockdowns based on  Δ14CO2 observation, EGU General Assembly 2024, Vienna, Austria, 14–19 Apr 2024, EGU24-3721, https://doi.org/10.5194/egusphere-egu24-3721, 2024.

EGU24-4150 | ECS | Posters on site | BG1.3

Satellite-driven model to upscale Irish CO2 Net Ecosystem Exchange (ICONEEx) 

Wahaj Habib and John Connolly

Climate change poses a significant environmental challenge for humanity, and accurately predicting its intensity as well as its impact on terrestrial ecosystems is crucial. To achieve this, monitoring, modelling, and mapping greenhouse gas (GHG) exchanges between the biosphere and the atmosphere is essential. Monitoring is also important to achieve the European Union’s goal to achieve a balance between GHG emissions and removals by 2050 and maintain negative emissions thereafter. While in situ measurement techniques, such as the eddy covariance flux tower (ECFT), have been used for decades to measure ecosystem-level exchanges of carbon, such as Net Ecosystem Exchange (NEE) of CO2, their footprint is limited to only 1 km². To overcome this limitation, satellite remote sensing data has been used to upscale these measurements to regional and global scales, but previous work has relied on low-resolution remote sensing data, such as the Moderate Resolution Imaging Spectroradiometer (MODIS) sensor (at 250m or 500m spatial resolution).


This study aims to use a combination of high-resolution remote sensing data and measurements from in situ ECFT data to model the NEE of CO2 across ~92% of Ireland's terrestrial area, covering major land covers such as wetlands (coastal and peatlands), grassland, and forestry. The model will integrate datasets from both ESA (Copernicus Sentinel-1 and 2) and NASA (MODIS PAR) with the light response curve parameters derived from the ECFT data in Ireland, to model NEE CO2 at a national scale. The results will be useful for monitoring, reporting, and verifying NEE across a range of ecosystems in Ireland. They can also be used to enhance National Inventory Reporting and national ambitions on climate, influence targeted policymaking, and verify land management decisions.

How to cite: Habib, W. and Connolly, J.: Satellite-driven model to upscale Irish CO2 Net Ecosystem Exchange (ICONEEx), EGU General Assembly 2024, Vienna, Austria, 14–19 Apr 2024, EGU24-4150, https://doi.org/10.5194/egusphere-egu24-4150, 2024.

EGU24-4196 | Orals | BG1.3

Drivers of ocean carbon sink variability across spatial scales 

Galen McKinley, Amanda Fay, Dustin Carroll, and Dimitris Menemenlis

Since the preindustrial era, the ocean has removed roughly 40% of fossil CO2 from the atmosphere, and it will eventually absorb at least 80% of human CO2 emissions. While there is no doubt that the ocean is a critical player in the global carbon cycle, many uncertainties remain and the drivers and magnitude of interannual-to-decadal timescale variability remain poorly constrained. A key question is the extent to which external forcing, specifically the variability of the atmospheric pCO2 growth rate, or internal ocean variability is the dominant mechanism of variability. We use a suite of experiments from the ECCO-Darwin data-assimilative ocean biogeochemistry model to isolate and explore the impact of these two drivers. We demonstrate that at the global scale, external and internal variability equally drive ocean sink variability. However, as the spatial scale becomes more regional, internal variability becomes increasingly dominant. To diagnose the future evolution of the global-scale ocean carbon sink in response to a changing atmospheric growth rate, both skillful observation-based products and data-assimilative models will be required.   

How to cite: McKinley, G., Fay, A., Carroll, D., and Menemenlis, D.: Drivers of ocean carbon sink variability across spatial scales, EGU General Assembly 2024, Vienna, Austria, 14–19 Apr 2024, EGU24-4196, https://doi.org/10.5194/egusphere-egu24-4196, 2024.

EGU24-4472 | Posters on site | BG1.3

Greenhouse gas emissions and their trends over the last three decades across Africa 

Mounia Mostefaoui, Philippe Ciais, Matthew Joseph McGrath, Philippe Peylin, Prabir K. Patra, and Yolandi Ernst

 A key goal of the Paris Agreement (PA) is to reach net-zero greenhouse gas (GHG) emissions by 2050 globally, which requires mitigation efforts from all countries. Africa’s rapidly growing population and gross domestic product (GDP) make this continent important for GHG emission trends. In this project we study the emissions of carbon dioxide (CO2), methane (CH4) and nitrous oxide (N2O) in Africa over 3 decades. We compare bottom-up (BU) approaches, including United Nations Convention Framework on Climate Change (UNFCCC) national inventories, FAO, PRIMAP-hist, process-based ecosystem models for CO2 fluxes in the land use, land use change and forestry (LULUCF) sector and global atmospheric inversions. For inversions, we applied different methods to separate anthropogenic CH4 emissions. The BU inventories show that, over the decade 2010–2018, fewer than 10 countries represented more than 75 % of African fossil CO2 emissions. With a mean of 1373 Mt CO2 yr−1, total African fossil CO2 emissions over 2010–2018 represent only 4 % of global fossil emissions. However, these emissions grew by +34% from 1990–1999 to 2000–2009 and by +31% from 2000–2009 to 2010–2018, which represents more than a doubling in 30 years. This growth rate is more than 2 times faster than the global growth rate of fossil CO2 emissions. The anthropogenic emissions of CH4 grew by 5 % from 1990–1999 to 2000–2009 and by 14.8 % from 2000–2009 to 2010–2018. The N2O emissions grew by 19.5 % from 1990–1999 to 2000–2009 and by 20.8 % from 2000–2009 to 2010–2018. When using the mean of the estimates from UNFCCC reports (including the land use sector) with corrections from outliers, Africa was a mean source of greenhouse gases of 2622 (min: 2186, max: 3239) Mt CO2 eq. yr−1 from all BU estimates (the min–max  indicate range uncertainties) and of +2637 (min: 1761, max: 5873) Mt CO2 eq. yr−1 from top-down (TD) methods during their overlap period from 2001 to 2017. Although the mean values are consistent, the range of TD estimates is larger than the one of the BU estimates, indicating that sparse atmospheric observations and transport model errors do not allow us to use inversions to reduce the uncertainty in BU estimates. The main source of uncertainty comes from CO2 fluxes in the LULUCF sector, for which the spread across inversions is larger than 50 %, especially in central Africa. Moreover, estimates from national UNFCCC communications differ widely depending on whether the large sinks in a few countries are corrected to more plausible values using more recent national sources following the methodology of Grassi et al. (2022). The medians of CH4 emissions from inversions based on satellite retrievals and surface station networks are consistent with each other within 2 % at the continental scale. The inversion ensemble also provides consistent estimates of anthropogenic CH4 emissions with BU inventories such as PRIMAP-hist. For N2O, inversions systematically show higher emissions than inventories, either because natural N2O sources cannot be separated accurately from anthropogenic ones in inversions or because BU estimates ignore indirect emissions and underestimate emission factors. 

How to cite: Mostefaoui, M., Ciais, P., McGrath, M. J., Peylin, P., Patra, P. K., and Ernst, Y.: Greenhouse gas emissions and their trends over the last three decades across Africa, EGU General Assembly 2024, Vienna, Austria, 14–19 Apr 2024, EGU24-4472, https://doi.org/10.5194/egusphere-egu24-4472, 2024.

EGU24-5271 | ECS | Orals | BG1.3

Peatland IPCC emission factors in the light of new EC carbon flux time series 

Nicolas Behrens, Klaus-Holger Knorr, and Mana Gharun

Peatlands are the world’s largest storage of soil organic carbon. While natural peatlands act as sinks of atmospheric carbon, drainage and disturbance (e.g., due to land use and climate change) turn peatlands into net carbon sources. Greenhouse gas (GHG) emissions from drained peatlands are therefore part of national GHG-emission reports, guided by the IPCC wetlands supplement. Herein, default emission factors (EF) are defined both for drained and rewetted peatlands, the former split into tropical and boreal/temperate wetlands, the latter further sub-categorized into nutrient poor and rich peatlands. These default emission factors are to date largely based on a limited number of static chamber-based studies, many measured over relatively short periods of time (1-3 years). As carbon flux measurements on peatlands have gained more attention, recent publications have added several new datasets to the EF calculations, significantly reducing the EF and narrowing confidence intervals. However, the final values are still almost entirely derived from chamber-based measurements with inherent limitations and uncertainties.

The Eddy-Covariance (EC) method is an alternative, established method to quantify carbon fluxes from ecosystems, spatially and temporally integrated (typically every 30 min throughout the year, representing a “flux-footprint” covering a whole ecosystem). As EC-based measurements are increasingly applied and such data are now available from several disturbed peatlands over several years, it is plausible to revise the default EFs. In this study we compile global EC time series for CO2 fluxes from disturbed peatlands of different land use categories with a focus on drained and rewetted peatlands affected by no or by  minor extensive management practices.  We investigate the diurnal, seasonal and annual variability of the fluxes. The net carbon emissions are compared to the EFs currently in use. With available ancillary data such as climate, water table depths, nutrients, ecosystem type and (succession-) state of the ecosystem we asses controlling factors for carbon fluxes. This investigation yields important context to evaluate the uncertainty and reliability of default emission factors for disturbed peatlands. Additionally, we apply a process-based model (CoupModel) to an own study-site to generate a higher-tier emission factor, including seasonality and climate variations.

How to cite: Behrens, N., Knorr, K.-H., and Gharun, M.: Peatland IPCC emission factors in the light of new EC carbon flux time series, EGU General Assembly 2024, Vienna, Austria, 14–19 Apr 2024, EGU24-5271, https://doi.org/10.5194/egusphere-egu24-5271, 2024.

EGU24-5576 | ECS | Orals | BG1.3

The greenhouse gas budget of terrestrial ecosystems in China since 2000 

Yuanyi Gao, Xuhui Wang, Kai Wang, Yuxing Sang, Yilong Wang, Yuzhong Zhang, Songbai Hong, Yao Zhang, Wenping Yuan, and Shilong Piao

As one of the world’s economic engine and the largest greenhouse gases (GHGs) emitter of fossil fuel in the past two decades, China has expressed the recent ambition to reduce GHG emissions by mid-century. The status of GHG balance over terrestrial ecosystems in China, however, remains elusive. Here, we present a synthesis of the three most important long-lived greenhouse gases (CO2, CH4 and N2O) budgets over China during the 2000s and 2010s, following a dual constraint bottom-up and top-down approach. We estimate that China’s terrestrial ecosystems act as a small GHG sink (-29.0 ± 207.5 Tg CO2-eq yr-1 with the bottom-up estimate and -75.3 ± 496.8 Tg CO2-eq yr-1 with the top-down estimate). This net GHG sink includes an appreciable land CO2 sink, which is being largely offset by CH4 and N2O emissions, predominantly coming from the agricultural sector. Emerging data sources and modelling capacities have helped achieve agreement between the top-down and bottom-up approaches to within 25% for all three GHGs, but sizeable uncertainties remain. 

How to cite: Gao, Y., Wang, X., Wang, K., Sang, Y., Wang, Y., Zhang, Y., Hong, S., Zhang, Y., Yuan, W., and Piao, S.: The greenhouse gas budget of terrestrial ecosystems in China since 2000, EGU General Assembly 2024, Vienna, Austria, 14–19 Apr 2024, EGU24-5576, https://doi.org/10.5194/egusphere-egu24-5576, 2024.

EGU24-6021 | Orals | BG1.3

Non-intuitive differences in Ninos-driven CO2 flux variability and long-term changes in the tropical Pacific and Atlantic 

Jerry Tjiputra, Shunya Koseki, and Pradeebane Vaittinada Ayar

Both the tropical Pacific and Atlantic upwelling systems are modulated by their respective Ninos (ENSO and Atlantic Nino), which significantly affect the regional and global climate variability. Coincidentally, two of largest ocean carbon outgassing systems are also located in these domains. As a result, the interannual variability of ocean CO2 fluxes in these regions have predominant imprint on the globally integrated variations (Landschutzer et al., 2016). In contrast to the effect of anomalously cold surface temperature, the upwelling of deep-water rich in dissolved inorganic carbon is understood to be the main driver for the mean CO2 outgassing. In the tropical Pacific, El Nino (La Nina) leads to a suppressed (stronger) upwelling condition and an anomalously weaker (stronger) carbon outgassing. On the other hand, the Atlantic Nino and Nina exert considerable variability in the surface freshwater and temperature, which leads to spatially heterogeneous responses in the contemporary CO2 fluxes. In both systems, we discover a critical role of subsurface alkalinity in regulating the observed variability, primarily through altering the surface buffering capacity (Koseki et al., 2023). We show that bias in CMIP6 Earth system models in simulating the mean contemporary alkalinity state in the tropical Pacific leads to contrasting future impacts (Vaittinada Ayar et al., 2022) and could have ramifications on the climate carbon cycle feedback. 


References

Koseki, S., J. Tjiputra, F. Fransner, L. R. Crespo, and N. S. Keenlyside (2023), Disentangling the impact of Atlantic Nino on sea-air CO2 fluxes, Nature Communications, 14, 3649, https://doi.org/10.1038/s41467-023-38718-9.

Landschützer, P., N. Gruber, and D. C. E. Bakker (2016), Decadal variations and trends of the global ocean carbon sink, Global Bio- geochem. Cycles, 30, 1396–1417, http://doi.org/10.1002/2015GB005359.

Vaittinada Ayar, P., L. Bopp, J. R. Christian, T. Ilyina, J. P. Krasting, R. Séférian, H. Tsujino, M. Watanabe, A. Yool, and J. Tjiputra (2022), Contrasting projections of the ENSO-driven CO2 flux variability in the equatorial Pacific under high-warming scenario, Earth Syst. Dynam., 13, 1097–1118, https://doi.org/10.5194/esd-13-1097-2022.

How to cite: Tjiputra, J., Koseki, S., and Vaittinada Ayar, P.: Non-intuitive differences in Ninos-driven CO2 flux variability and long-term changes in the tropical Pacific and Atlantic, EGU General Assembly 2024, Vienna, Austria, 14–19 Apr 2024, EGU24-6021, https://doi.org/10.5194/egusphere-egu24-6021, 2024.

EGU24-7267 | ECS | Posters on site | BG1.3

Recent increasing trend of global CO2 growth rate due to a slowdown in terrestrial carbon uptake 

Chaerin Park and Sujong Jeong

The global atmospheric CO2 growth rate is a product of the combined effects of emissions and uptake from both anthropogenic and natural carbon sources. Therefore, an evaluation of the global CO2 growth rate should be preceded to understand the global carbon-climate process. In this study, we analyzed the long-term changes in the global CO2 growth rate from 1991 to 2020, using data from 42 global sites and model simulations to assess recent changes in the global carbon-climate feedback process. Our results indicate that the annual CO2 growth rate has increased by 0.032 ppm yr-2 since the 2000s. A comprehensive assessment of carbon cycle components contributing to atmospheric CO2 growth rate changes reveals that the strengthening of this rate is linked to a decline in terrestrial carbon absorption over the last decade. This decline is primarily associated with a slowdown in the increasing trend of Net Primary Productivity. Consequently, the reduced terrestrial carbon uptake in recent decades contributed to an approximately 3 ppm increase in global CO2 concentration by 2020. Our findings highlight that the vegetation's carbon uptake capacity can no longer offset anthropogenic CO2 emissions, underscoring the importance of achieving global carbon neutrality in climate change mitigation.


This work was supported by Korea Environment Industry & Technology Institute(KEITI) through Project for developing an observation-based GHG emissions geospatial information map, funded by Korea Ministry of Environment(MOE) (RS-2023-00232066)

How to cite: Park, C. and Jeong, S.: Recent increasing trend of global CO2 growth rate due to a slowdown in terrestrial carbon uptake, EGU General Assembly 2024, Vienna, Austria, 14–19 Apr 2024, EGU24-7267, https://doi.org/10.5194/egusphere-egu24-7267, 2024.

EGU24-7366 | Orals | BG1.3

Quantifying permafrost C-cycling by fusing process-models and observations  

Luke Smallman and Eleanor Burke

Globally permafrost soils store huge quantities of carbon (C) in dead organic matter (DOM). Currently, the permafrost region is estimated to be a small net C sink. However, as the climate warms permafrost soils have begun to thaw, making a massive quantity of DOM available for potential decomposition and likely shifting the region to a net source of C. Process-models of terrestrial ecosystems are a vital tool in evaluating our understanding of ecosystem function, but also in generating forecasts of C emissions under varied climate change scenarios in support of decision support. But different models contain competing hypothesise of ecosystem functioning, leading to divergent forecasts despite convergent estimates of contemporary net C emissions. These process-models also result in contrasting estimates of the internal C-cycling. We currently lack a consistent, rigorous observational constraint on ecosystem C-stocks and dynamics (particularly below ground) due to varied challenges across both in-situ and satellite-based Earth Observation (EO). Here, we present a Bayesian model-data fusion approach (CARDAMOM) which combines diverse observations of terrestrial ecosystems (e.g. leaf area, soil C, biomass, net C exchange) to calibrate an intermediate complexity model (DALEC). CARDAMOM generates a probabilistic estimates of DALEC parameters at pixel scale based on local information. Using these local calibrations, DALEC offers a probabilistic, data-constrained estimate of current ecosystem C-cycling including its internal dynamics, which can be used to evaluate large scale process-models. We evaluate process-model estimates of key ecosystem properties, e.g. DOM residence time, and their climate sensitivity. Through this process we can identify and exclude process-models which are inconsistent with data from forecast analyses.

How to cite: Smallman, L. and Burke, E.: Quantifying permafrost C-cycling by fusing process-models and observations , EGU General Assembly 2024, Vienna, Austria, 14–19 Apr 2024, EGU24-7366, https://doi.org/10.5194/egusphere-egu24-7366, 2024.

EGU24-8175 | Orals | BG1.3

Estimating methane emissions at high northern latitudes using regional data and global inverse modelling 

Luana Basso, Christian Rödenbeck, Victor Brovkin, Goran Georgievski, and Mathias Göckede

Atmospheric methane levels (the second largest contributor to climate change) have more than doubled over the last 200 years, though with highly variable trends over time. The relative contribution of different sources and sinks to the global CH4 budget remains uncertain despite ongoing efforts to improve the estimates based on various approaches, and particularly the causes for an accelerated increase in recent years remain unclear. Therefore, understanding and quantifying methane sources at global to regional scales is essential to reduce uncertainties in the global methane budget and its feedback with the climate system.

Within the Arctic region, wetlands and lakes constitute a major natural source of methane. With temperatures rising at rates at least twice the global average over the last decades, Arctic permafrost is increasingly thawing. Associated disturbance processes hold the potential to increase methane emissions, and as a consequence result in a positive feedback to climate change. However, until now neither observations nor model estimates could provide clear evidence of such a trend in emissions. As a consequence, current and possible future contributions of Arctic ecosystems to the accelerated increase in the global atmospheric methane levels remain highly uncertain.

To help reduce methane emission uncertainties in the high northern latitudes, we estimated global CH4 fluxes to the atmosphere using the Jena CarboScope Global Inversion System, with a strong focus of our analysis on the Arctic region. We used wetland flux from JSBACH model as prior and assimilated atmospheric observations from regional networks available over the last years for the region above 60°N latitude (a total of 23 towers) to quantify the methane emissions over this region between 2010 to 2020. We found a clear seasonal pattern with emission peaks during July and August. As a sensitivity test to evaluate the improvement to constrain the Arctic methane fluxes with the assimilation of the regional data, we also conducted an inversion using just the global background surface stations (a total of 30 global stations). We found higher mean annual methane flux to the atmosphere when assimilating the regional data, with the largest difference between May to August. These estimates were finally evaluated against an ensemble of inverse model estimates from Global Methane Project available for the period between 2010 to 2017.

How to cite: Basso, L., Rödenbeck, C., Brovkin, V., Georgievski, G., and Göckede, M.: Estimating methane emissions at high northern latitudes using regional data and global inverse modelling, EGU General Assembly 2024, Vienna, Austria, 14–19 Apr 2024, EGU24-8175, https://doi.org/10.5194/egusphere-egu24-8175, 2024.

EGU24-8349 | ECS | Posters on site | BG1.3

Drivers and trends in Land-use change and associated carbon emissions over Indonesia 

Ida Bagus Mandhara Brasika, Pierre Friedlingstein, Stephen Sitch, and Michael O'Sullivan

Indonesia is currently known as one of the three largest contributors of carbon emissions from land and land cover change (LULCC) globally, together with Brazil & the Democratic Republic of Congo. However, there is a limited reliable data on LULCC across Indonesia, leading to a lack of agreement on drivers and trends in carbon emissions. This can also be seen in the annual global carbon budget (GCB). Here, we assess the new satellite-based land cover dataset from Mapbiomas over Indonesia to illustrate how changes in forest and agriculture (mainly palm oil) areas across Indonesia determine trends in carbon emissions from land use change (ELUC). ELUC is simulated with a process-based Dynamic Global Vegetation Model, JULES-ES using annually varying LULCC maps from Mapbiomas as input. Our results show that the forest loss and agriculture expansion have a strong correlation and trend in the last two decades. Furthermore, palm oil plantation is the major contribution to the forest-agriculture dynamics, mainly appearing in Kalimantan & Sumatera island. This dynamic has a major impact on Indonesia ELUC with a positive trend in ELUC of 0.06 PgC/yr2 since 2000 . The use of the satellite-based dataset, Mapbiomas, is shown to improve our understanding of the LULCC dynamics over Indonesia, hopefully contributing to a reduction of the ELUC uncertainty for Indonesia and the SE Asia region.

How to cite: Brasika, I. B. M., Friedlingstein, P., Sitch, S., and O'Sullivan, M.: Drivers and trends in Land-use change and associated carbon emissions over Indonesia, EGU General Assembly 2024, Vienna, Austria, 14–19 Apr 2024, EGU24-8349, https://doi.org/10.5194/egusphere-egu24-8349, 2024.

EGU24-8601 | ECS | Posters on site | BG1.3

Estimation of methane emissions at European scale with a special focus on Austria 

Sophie Wittig, Anjumol Raju, Seyed Omid Nabavi, Martin Vojta, Peter Redl, Antje Hoheisel, Marcus Hirtl, Christine Groot Zwaaftink, and Andreas Stohl

In recent years, methane (CH4) has attracted increasing scientific attention as the second most abundant anthropogenic greenhouse gas (GHG) in the atmosphere. Due to the high reduction potential and the relatively short atmospheric lifetime of around 9 years, mitigation measures can become effective within a relatively short period of time. However, the current estimates of CH4 fluxes from emission inventories are still subject to uncertainties at both global and regional scale.

An effort to reduce uncertainties from those bottom-up flux estimates is given by inverse modelling, which provides a robust tool to verify GHG emissions by combining GHG observations as well as atmospheric transport modelling and statistical optimization.

In this study, we use an inverse modelling approach to estimate CH4 fluxes at European scale for the year 2022. Additionally, we use the European in-situ observation network to explore the feasibility of reducing uncertainties in CH4 fluxes in Austria, a European country with a limited availability of stationary observations. This work is part of the Austrian ASAP18 flagship project “GHG-KIT: Keep it traceable”.

Hereby, the inverse modelling tool FLEXINVERT is used, which is based on the backward simulations of the Lagrangian particle dispersion model FLEXPART (FLEXible PARTicle). In particular, we investigate to what extent prolonged backward trajectories of 50 to 100 days contribute to better constrain the CH4 fluxes. In an attempt to estimate background concentrations as accurately as possible, we use global CH4 concentration fields obtained with the chemical transport model FLEXPART (CTM).

How to cite: Wittig, S., Raju, A., Nabavi, S. O., Vojta, M., Redl, P., Hoheisel, A., Hirtl, M., Groot Zwaaftink, C., and Stohl, A.: Estimation of methane emissions at European scale with a special focus on Austria, EGU General Assembly 2024, Vienna, Austria, 14–19 Apr 2024, EGU24-8601, https://doi.org/10.5194/egusphere-egu24-8601, 2024.

EGU24-9459 | Posters on site | BG1.3

The methane record at the ICOS background station at Plateau Rosa: identification of source areas in Europe 

Giulia Zazzeri, Francesco Apadula, Andrea Lanza, and Stephan Henne

Methane and carbon dioxide mole fractions are measured continuously at the atmospheric station at Plateau Rosa since 2018, with a Picarro cavity ring down spectrometer G2301. The station, at 3480 meter MSL, represents an ideal location for, on one hand, measurements of background air and, on the other hand, intercepting air with recent boundary layer contact. Since 2021 the site contributes as an atmospheric station to the ICOS network.

In this study we present the methodology used to filter background data, and we provide an analysis of the continuous record of CH4 since 2018. We used Hysplit back trajectories and the FLEXPART atmospheric transport model coupled with EDGAR inventories to identify source areas in Europe. We focused our analysis on April 2022, when the CH4 increment above the baseline was consistently high.

We demonstrate how the CH4 mole fraction data measured at the station at Plateau Rosa provide information on the global CH4 trend, and that, with our continuous record, we can detect high emissions events over Europe.

How to cite: Zazzeri, G., Apadula, F., Lanza, A., and Henne, S.: The methane record at the ICOS background station at Plateau Rosa: identification of source areas in Europe, EGU General Assembly 2024, Vienna, Austria, 14–19 Apr 2024, EGU24-9459, https://doi.org/10.5194/egusphere-egu24-9459, 2024.

EGU24-9609 | ECS | Posters on site | BG1.3

Terrestrial Carbon Flux Dynamics in the Southern American Temperate Region: Insights from Dynamic Global Vegetation Models and GOSAT XCO2 Measurements   

Sanam Noreen Vardag, Lukas Artelt, Eva-Marie Metz, Sourish Basu, Martin Jung, and André Butz

Understanding terrestrial carbon fluxes is a prerequisite for accurately predicting the global biospheric uptake and release of CO2 under climate change and other environmental stressors. Terrestrial carbon fluxes in the southern hemisphere still exhibit quite large uncertainties due to limited measurements and a lack of comprehensive process understanding. This study focuses on the South American Temperate (SAT) region, employing various Dynamic Global Vegetation Model (DGVM) models (TRENDY v9) to investigate carbon flux dynamics. We find significant discrepancies between these DGVM models in terms of both phasing and magnitude. To address this, atmospheric XCO2 measurements from the Greenhouse Gases Observing Satellite (GOSAT) during the period 2009-2018 are incorporated into an atmospheric inversion using the model TM5-4DVar to obtain net CO2 fluxes. We identify DGVM models that match the inversion results, particularly showing the same phasing and similar magnitude of net ecosystem exchange (NEE) as the inversion results. The matching DGVMs show that the increase in NEE during the mid of the year is driven by an early increase in heterotrophic respiration whereas the autotrophic respiration remains in phase with the gross primary production (GPP) and is delayed with respect to heterotrophic respiration. The observed flux behavior is linked to the onset of rainfall in the semi-arid regions of SAT, resembling findings in Australia by Metz et al. (2023). We hypothesize that soil rewetting processes in semi-arid areas play an important role in constraining the global carbon budget and should be represented more accurately in global carbon cycle models to improve the estimation of the global carbon budget.  


Metz, E.-M., Vardag, S.N., Basu, S., Jung, M., Ahrens, B., El-Madany, T., Sitch, S., Arora, V.  K., Briggs, P. R., Friedlingstein, P., Goll, D.S., Jain, A.K.,  Kato, E., Lombardozzi, D., Nabel,J .E. M. S., Poulter, B., Séférian, R., Tian, H., Wiltshire, A., Yuan, W., Yue, X., Zaehle, S.,  Deutscher, N.M.,  Griffith, D.W.T., Butz, A. Soil respiration–driven CO2 pulses dominate Australia’s flux variability. Science, 379, 1332-1335, https://doi.org/10.1126/science.add7833, 2023. 

How to cite: Vardag, S. N., Artelt, L., Metz, E.-M., Basu, S., Jung, M., and Butz, A.: Terrestrial Carbon Flux Dynamics in the Southern American Temperate Region: Insights from Dynamic Global Vegetation Models and GOSAT XCO2 Measurements  , EGU General Assembly 2024, Vienna, Austria, 14–19 Apr 2024, EGU24-9609, https://doi.org/10.5194/egusphere-egu24-9609, 2024.

EGU24-10840 | ECS | Orals | BG1.3 | Highlight

A new synthesis of Arctic-boreal carbon fluxes for improved carbon budget estimates 

Anna Virkkala, Isabel Wargowsky, Judith Vogt, McKenzie Kuhn, Susan Natali, Brendan Rogers, Mathias Goeckede, Kyle Arndt, Jennifer Watts, Tiffany Windholz, and Simran Madaan

The Arctic-boreal zone and its permafrost regions have historically been sparsely measured for carbon dioxide and methane fluxes. This data sparsity has created significant uncertainties in Arctic-boreal carbon budget estimates. However, over the past decade, the availability of Arctic-boreal carbon flux data has increased substantially. Yet, it remains scattered across different repositories, papers, and unpublished sources, making it hard to estimate more accurate Arctic-boreal carbon budgets. To address this research gap, we have compiled a database of Arctic-boreal carbon fluxes (ABCFlux v2) from flux repositories, literature, and site principal investigators, which will be openly distributed. The database includes carbon dioxide fluxes of gross primary production, ecosystem respiration, and net ecosystem exchange, and plant-mediated, diffusive, ebullitive, and storage methane fluxes measured with eddy covariance and chamber techniques with supporting methodological and environmental metadata from terrestrial (including wetland) and freshwater ecosystems. It has in total over 12,000 site-months and 30,000 unique monthly flux values, therefore almost doubling earlier synthesis efforts in the region. Here, we present preliminary results on carbon flux magnitudes across key land cover types and multidecadal trends based on the in-situ data and machine-learning based upscaling. These indicate, for example, that the Arctic-boreal region has been an increasing annual terrestrial net ecosystem CO2 sink with the boreal biome primarily driving this trend. This collaborative initiative, involving contributions from over 100 researchers, serves as an important step in reducing uncertainties in Arctic-boreal carbon budgets and enhancing our understanding of climate feedbacks.

How to cite: Virkkala, A., Wargowsky, I., Vogt, J., Kuhn, M., Natali, S., Rogers, B., Goeckede, M., Arndt, K., Watts, J., Windholz, T., and Madaan, S.: A new synthesis of Arctic-boreal carbon fluxes for improved carbon budget estimates, EGU General Assembly 2024, Vienna, Austria, 14–19 Apr 2024, EGU24-10840, https://doi.org/10.5194/egusphere-egu24-10840, 2024.

EGU24-11622 | Orals | BG1.3

Constraining atmosphere-terrestrial-aquatic carbon cycle processes at national and ecoregional scales with radiocarbon data: Introducing the Radiocarbon Inventories of Switzerland (RICH) project 

Timothy Eglinton, Heather Graven, Frank Hagedorn, Soenke Szidat, Alexander Brunmayr, Margaux Duborgel, Dylan Geissbuehler, Thomas Laemmel, Luisa Minich, Benedict Mittelbach, Timo Rhyner, and Margot White

New constraints on carbon exchanges between atmospheric, terrestrial and aquatic systems are needed to reduce uncertainty in future predictions of the global carbon cycle and climate change. Radiocarbon is a powerful tool for studying the carbon cycle due to its to its ~5700-year half-life that sheds light on processes occuring on centennial to millenial timescales, as well as the 14C “bomb spike” resulting from above-ground nuclear weapons testing in the mid-20th Century that serves as a tracer of carbon flow among more rapidly cycling pools. The “Radiocarbon Inventories of Switzerland” (“RICH”) project is a collaborative initiative that involves undertaking a first-of-its-kind, national-scale 14C survey spanning all major carbon pools and encompassing the five different Swiss ecoregions. The project is acquiring a comprehensive “snapshot” of 14C measurements for carbon species in the atmosphere, soils and the hydrophere (e.g. 14C in atmospheric and soil-derived gas samples, 14C in bulk samples and different sub-fractions of soil, water and sediment samples), and developing historical context through 14C analysis of natural archives and of archived samples spanning the pre-bomb era to the present. The measurements are being used to study various carbon cycle processes, including turnover rates of different soil carbon fractions, budgets of riverine carbon, and anthropogenic emissions of CO2 and CH4. New, integrated atmospheric-terrestrial-aquatic carbon cycle models are being developed and calibrated, and existing models are being evaluated. This presentation will outline the goals and scope of the RICH project, and provide illustrations of the information that is now flowing from this collaborative undertaking. The project structure is envisioned to serve as template that can be  adapted in carbon cycle studies on regional to global scales, and the scientific outcomes will be relevant not only to Switzerland but also to the broader understanding of carbon cycle processes.

How to cite: Eglinton, T., Graven, H., Hagedorn, F., Szidat, S., Brunmayr, A., Duborgel, M., Geissbuehler, D., Laemmel, T., Minich, L., Mittelbach, B., Rhyner, T., and White, M.: Constraining atmosphere-terrestrial-aquatic carbon cycle processes at national and ecoregional scales with radiocarbon data: Introducing the Radiocarbon Inventories of Switzerland (RICH) project, EGU General Assembly 2024, Vienna, Austria, 14–19 Apr 2024, EGU24-11622, https://doi.org/10.5194/egusphere-egu24-11622, 2024.

EGU24-12156 | Posters on site | BG1.3

Constraining CO2 fluxes over Europe using FLEXINVERT and in-situ measurements 

Anjumol Raju, Sophie Wittig, Martin Vojta, Omid Nabavi, Peter Redl, Antje Hoheisel, Marcus Hirtl, Christine Groot Zwaaftink, and Andreas Stohl

Atmospheric carbon dioxide (CO2) is a significant greenhouse gas, and its concentration has increased by 51% compared to the pre-industrial value. Concerning its impact on the earth’s climate system, there is an urge to reduce CO2 emissions, hence mitigating global warming and climate change. This requires adequate knowledge of its source-sink distribution and quantification of the CO2 budget. Inverse modeling has emerged as an effective tool to constrain greenhouse gas (GHG) fluxes using the spatiotemporal pattern of atmospheric concentration measurements. In this regard, this study focuses on estimating CO2 fluxes over Europe using the Bayesian inverse modelling framework FLEXINVERT during the year 2021. In-situ CO2 concentrations were taken from various locations across Europe (World Data Centre for Greenhouse Gases, WDCGG) and data were averaged every 3 hours. The Lagrangian Particle Dispersion Model FLEXPART (FLEXible PARTicle) is employed to calculate the source-receptor relationship (SRR). The FLEXPART model has been run backward in time to trace back the particles (released from the locations of observation sites) for 10 days. Background CO2 concentrations are calculated using the sensitivity of concentration at the termination points from FLEXPART and the global 3D concentration from the FLEXible PARTicle-chemical transport model (FLEXPART-CTM). The uncertainty reduction, calculated from posterior and prior flux uncertainties, indicates how well the prior fluxes are optimized. In addition, longer backward simulations can be carried out to assess the impact of transport on background CO2 concentrations and the uncertainty reduction.

How to cite: Raju, A., Wittig, S., Vojta, M., Nabavi, O., Redl, P., Hoheisel, A., Hirtl, M., Zwaaftink, C. G., and Stohl, A.: Constraining CO2 fluxes over Europe using FLEXINVERT and in-situ measurements, EGU General Assembly 2024, Vienna, Austria, 14–19 Apr 2024, EGU24-12156, https://doi.org/10.5194/egusphere-egu24-12156, 2024.

EGU24-12441 | ECS | Posters on site | BG1.3

Estimating methane sources and sinks by assimilating satellite data in a global atmospheric inverse system. 

Nicole Montenegro, Marielle Saunois, Antoine Berchet, Adrien Martinez, Philippe Bousquet, and Isabelle Pison

Methane (CH4) is the second most important greenhouse gas, contributing to approximately 30% of the additional greenhouse effect since 1750. Its varied sources and relatively short lifetime in the atmosphere (~9 years) offer interesting mitigation opportunities. To develop practical strategies for mitigating climate change, precise quantification of methane fluxes and a better understanding of its spatial distribution and biogeochemical cycling are imperative. The observations currently used to infer methane sources and sinks face limitations affecting calculation accuracy. Surface stations measuring CH4 are sparse and notably absent in major emitting regions. In contrast, satellite-derived data, while providing broader coverage, present systematic errors and estimate atmospheric composition with an accuracy range of 1-10%. Additionally, passive satellite shortwave infrared (SWIR) measurements exhibit higher sensitivity near surface emission sources but are less effective in high latitude regions. Conversely, passive satellite thermal infrared (TIR) measurements have a higher sensitivity between the free troposphere and the stratosphere.Current worksare currently being developed to integrate TIR and SWIR to obtain consolidated CH4 information on the vertical atmospheric profile. This studyaims on improving methane flux estimates using the top-down approach, which integrates observations, flux priors, and an atmospheric chemical transport model utilizing Bayesian methodology. This will be perfomed on the inversion system developed at the LSCE (Community Inversion Framework – CIF) using the global transport model LMDz. We analyze the information provided by different observing systems (TIR, SWIR and surface network) at the global scale and for a period between June 2018 and June 2020. In a first step, the sensitivity of the fluxes to the observations is estimated. In a second step, Observing System Simulation Experiments are performed to evaluate the performance of the different observations system to retrieve the target fluxes. Considering both steps, observing systems are chosen to provide the best information in terms of sensitivity and spatial representation (vertical and horizontal).

How to cite: Montenegro, N., Saunois, M., Berchet, A., Martinez, A., Bousquet, P., and Pison, I.: Estimating methane sources and sinks by assimilating satellite data in a global atmospheric inverse system., EGU General Assembly 2024, Vienna, Austria, 14–19 Apr 2024, EGU24-12441, https://doi.org/10.5194/egusphere-egu24-12441, 2024.

EGU24-12480 | ECS | Orals | BG1.3

Reassessing the pre-industrial air-sea carbon flux considering the ocean alkalinity budget 

Alban Planchat, Laurent Bopp, and Lester Kwiatkowski

Disparities in estimates of the ocean carbon sink, whether derived from global ocean biogeochemical models or from data products based on observations of surface ocean pCO2, question our ability to accurately assess ocean carbon uptake and its trend over recent decades. A potential factor contributing to the inconsistency between data products and model-based estimates is the pre-industrial air-sea carbon flux that is required to isolate the anthropogenic component from the total air-sea carbon flux estimated from observations. This pre-industrial air-sea carbon flux is thought to stem at the global scale from an imbalance between riverine carbon discharge to the ocean and sediment carbon burial.  Using a mass-balanced approach and comprehensive estimates of carbon inputs to the ocean by rivers and groundwater as well as carbon burial in marine sediments, Regnier et al. (2022) estimated that the pre-industrial ocean was outgassing 0.65 ± 0.30 petagrams of carbon per year. This updated estimation was used in the latest Global Carbon Budget (Friedlingstein et al., 2023) to derive an estimate of the ocean carbon sink over recent decades. In this study, we use a series of ocean biogeochemical pre-industrial simulations with varying assumptions related to carbon riverine input and burial to develop a theoretical framework to determine the ocean carbon outgassing and its spatial distribution. Building upon previous efforts, we integrate a carbon mass-balance approach with consideration of the ocean alkalinity budget. While conventionally assumed that the global alkalinity inventory was in equilibrium during the pre-industrial era — with riverine alkalinity discharge offset by CaCO3 burial — we demonstrate that an imbalance in the pre-industrial ocean alkalinity budget could significantly affect the carbon outgassing flux. This novel conceptual framework allows us to reestimate the pre-industrial carbon flux while considering the ocean alkalinity budget. Furthermore, it provides a simple method to reevaluate this flux in light of new assessments of carbon or alkalinity sources and sinks, while also covering their uncertainty ranges.

How to cite: Planchat, A., Bopp, L., and Kwiatkowski, L.: Reassessing the pre-industrial air-sea carbon flux considering the ocean alkalinity budget, EGU General Assembly 2024, Vienna, Austria, 14–19 Apr 2024, EGU24-12480, https://doi.org/10.5194/egusphere-egu24-12480, 2024.

EGU24-12481 | Orals | BG1.3 | Highlight

Methane’s record rise 2020-2023: likely causes, impacts and consequences 

Martin R. Manning, Euan G. Nisbet, Sylvia E. Michel, Xin Lan, Ed Dlugokencky, David Lowry, Rebecca E. Fisher, and James L. France

From 2020, the atmospheric methane burden has grown at the fastest rate in the detailed observational record. This rise has been accompanied by an unprecedented plunge in d13C(CH4). The causes of recent accelerated growth are as yet uncertain but the geographic spread of growth and the rapid isotopic plunge suggest strong rises in isotopically light emissions from both Tropical and Boreal wetlands. These emissions may be due to rising precipitation and temperatures in parts of the tropics, and by rising temperatures in northern Canada, Siberia, and Europe. Over the longer period since 2007, methane’s actual growth is comparable to methane’s growth in the ‘worst case’ very high baseline emission scenario RCP8.5 (8.5 W/m2 forcing increase relative to pre-industrial). If the recent trend were to continue for more than another decade it could make the 2°C target as hard to achieve as the 1.5°C target is now. Natural feedbacks to climate warming in wetlands need to be included in future modelling and should be incorporated in climate modelling projects such as CMIP7. Methane’s recent accelerated growth also has wide implications for climate negotiations as it reduces the permissible total anthropogenic greenhouse gas emissions if the Paris Agreement is to be achieved. Strong growth in non-anthropogenic methane emissions, driven by feedback impacts on natural and quasi-natural sources, was not expected in modelling at the time of the Paris Agreement and shows the urgency of improving our understanding of the feedback impacts of climate change. The simplest way to limit methane’s growth is for all nations,  including non-signatory countries, to cut anthropogenic emissions urgently and sharply, meeting or exceeding the targets of the Global Methane Pledge.

How to cite: Manning, M. R., Nisbet, E. G., Michel, S. E., Lan, X., Dlugokencky, E., Lowry, D., Fisher, R. E., and France, J. L.: Methane’s record rise 2020-2023: likely causes, impacts and consequences, EGU General Assembly 2024, Vienna, Austria, 14–19 Apr 2024, EGU24-12481, https://doi.org/10.5194/egusphere-egu24-12481, 2024.

EGU24-12756 | Posters on site | BG1.3

Identifying the origins of the global carbon budget imbalance using oxygen 

Nicolas Mayot, Corinne Le Quéré, and Andrew Manning

Despite major advances in the estimation of all fluxes in the global cycles of carbon and oxygen, mathematical imbalances continue to arise when these fluxes are combined. Between 1997 and 2022, the global budget imbalances (BIM) for CO2 and O2 budgets – a quantification of the missing sources and/or sinks of CO2 and O2 – are -18 Tmol/yr and 41 Tmol/yr, respectively. The CO2 BIM has tended to become increasingly negative over the last decade, while the O2 BIM has tended to become increasingly positive. To identify the origins of the BIMs, we carried out a systematic analysis of the combination and permutation of all available individual flux estimates provided by a sub-set of contributors to the Global Carbon Budget 2023 update. We first examine the possibility that inaccuracies in the ocean air-sea fluxes contributes to the CO2 and O2 BIM. We show that the interannual variability of the air-sea O2 flux required for a reduction of the O2 BIM tends to be close to that simulated by several ocean models. An in-depth analysis of the Southern Ocean has confirmed their ability to simulate reasonable interannual variability in the air-sea fluxes of O2 and CO2. We conclude that in order to simultaneously reduce the negative trend in CO2 BIM and the positive trend in O2 BIM in the recent decade, a reduction in the increasing trend in the terrestrial CO2 sink over the last decade is most likely required.

How to cite: Mayot, N., Le Quéré, C., and Manning, A.: Identifying the origins of the global carbon budget imbalance using oxygen, EGU General Assembly 2024, Vienna, Austria, 14–19 Apr 2024, EGU24-12756, https://doi.org/10.5194/egusphere-egu24-12756, 2024.

EGU24-13094 | ECS | Posters on site | BG1.3

High-Resolution Inversion Modeling of Carbon Dioxide and Methane Emissions in Europe: Assessing Accuracy and  Dynamics 

Anteneh Getachew Mengistu, Aki Tsuruta, Maria Tenkanen, Tiina Markkanen, Maarit Raivonen, Antti Leppänen, Antoine Berchet, Rona Thompson, Hannakaisa Lindqvist, and Tuula Aalto

Accurate estimation of critical greenhouse gas fluxes, particularly carbon dioxide (CO2) and methane (CH4), is vital for shaping effective climate change policies. Leveraging the state-of-the-art Community Inversion Framework (CIF), we estimate high-resolution emissions across Europe (-12°E to 37°E, 35°N to 73°N). Using the Lagrangian Particle Dispersion Model (FLEXPART) with ECMWF meteorological data, we calculate surface flux footprints at 0.2° × 0.2° resolution, enhancing comparisons with national inventories. Assimilating data from 40+ in-situ observations, including ICOS and non-ICOS stations, our 4-dimensional variational optimization refines prior high-resolution flux estimates. Diverse sources contribute to the total flux, including fossil fuel emissions, biomass burning, land emissions, air-sea exchange. Flux corrections enhance accuracy, yielding posterior estimates with reduced bias and heightened correlation. Major CH4 emitters (France, Germany, Italy, Spain, Poland, and the UK) collectively contribute 72% of total emissions. The EU27 + UK average is 16.47 ± 1.33 Tg CH4/yr. Posterior anthropogenic emissions reveal a regional mean reduction of > 5 gC/m2/month in summer compared to prior estimates, highlighting seasonal emission dynamics.

How to cite: Mengistu, A. G., Tsuruta, A., Tenkanen, M., Markkanen, T., Raivonen, M., Leppänen, A., Berchet, A., Thompson, R., Lindqvist, H., and Aalto, T.: High-Resolution Inversion Modeling of Carbon Dioxide and Methane Emissions in Europe: Assessing Accuracy and  Dynamics, EGU General Assembly 2024, Vienna, Austria, 14–19 Apr 2024, EGU24-13094, https://doi.org/10.5194/egusphere-egu24-13094, 2024.

EGU24-13246 | ECS | Posters on site | BG1.3

Recent methane surges reveal heightened emissions from tropical inundated areas 

Xin Lin, Shushi Peng, Philippe Ciais, Didier Hauglustaine, Xin Lan, Gang Liu, Michel Ramonet, Yi Xi, Yi Yin, and Zhen Zhang and the Coauthors

Record breaking atmospheric methane growth rates were observed in 2020 and 2021 (15.2±0.4 and 17.6±0.5 ppb yr-1), reaching their highest level since the commencement of ground-based observations in the early 1980s. Here we use an ensemble of atmospheric inversions informed by surface or satellite methane concentration observations to infer emission changes during these two years relative to 2019. We found a global increase of methane emissions of 20.3±9.9 Tg CH4 in 2020 and 24.8±3.1 Tg CH4 in 2021. The emission rise was dominated by tropical and boreal regions with inundated areas, as a result of elevated groundwater table. Strong, synchronous, and persistent emission increases occurred in regions such as the Niger River basin, the Congo basin, the Sudd swamp, the Ganges floodplains and Southeast Asian deltas and the Hudson Bay lowlands. These regions alone contributed about 70% and 60% of the net global increases in 2020 and 2021, respectively. Comparing our top-down estimates with simulation of wetland emissions by biogeochemical models, we find that the bottom-up models significantly underestimate the intra- and inter-annual variability of methane sources from tropical inundated areas. This discrepancy likely arises from the models’ limitations in accurately representing the dynamics of tropical wetland extents and the response of methane emissions to environmental changes. Our findings demonstrate the critical role of tropical inundated areas in the recent surge of methane emissions and highlight the value of integrating multiple data streams and modeling tools to better constrain tropical wetland emissions.

How to cite: Lin, X., Peng, S., Ciais, P., Hauglustaine, D., Lan, X., Liu, G., Ramonet, M., Xi, Y., Yin, Y., and Zhang, Z. and the Coauthors: Recent methane surges reveal heightened emissions from tropical inundated areas, EGU General Assembly 2024, Vienna, Austria, 14–19 Apr 2024, EGU24-13246, https://doi.org/10.5194/egusphere-egu24-13246, 2024.

EGU24-13846 | Posters on site | BG1.3

Reduced Southern Ocean CO2 uptake due to the positive SAM trend 

Laurie Menviel, Paul Spence, Andrew Kiss, Matthew Chamberlain, Hakase Hayashida, Matthew England, and Darryn Waugh

While the Southern Ocean (SO) provides the largest oceanic sink of carbon, some observational studies have suggested that the SO total CO2 (tCO2) uptake exhibited large (~0.3 GtC/yr) decadal-scale variability over the last 30 years, with a similar SO tCO2 uptake in 2016 as in the early 1990s. Here, using an eddy-rich ocean, sea-ice, carbon cycle model, with a nominal resolution of 0.1°, we explore the changes in total, natural and anthropogenic SO CO2 fluxes over the period 1980-2021 and the processes leading to the CO2 flux variability.

The simulated tCO2 flux exhibits decadal-scale variability with an amplitude of ~0.1 GtC/yr globally in phase with observations. Notably, two stagnation in tCO2 uptake are simulated between 1982 and 2000 as well as since 2012, while a re-invigoration is simulated between 2000 and 2012. This decadal-scale variability is primarily due to changes in natural CO2  (nCO2) fluxes south of the polar front associated with variability in the Southern Annular Mode (SAM). Positive phases of the SAM lead to enhanced SO nCO2 outgassing due to higher surface natural dissolved inorganic carbon (DIC) brought about by a combination of Ekman-driven vertical advection and DIC diffusion at the base of the mixed layer. The pattern of the CO2 flux anomalies indicate a dominant control of the interaction between the mean flow south of the polar front and the main topographic features. While positive phases of the SAM also lead to enhanced anthropogenic CO2 (aCO2) uptake south of the polar front, the amplitude of the changes in aCO2 fluxes is only 25% of the changes in nCO2 fluxes. Due to the larger nCO2 outgassing compared to aCO2 uptake as the SH westerlies strengthen and shift poleward, the SO tCO2 uptake capability thus reduced since 1980 in response to the shift towards positive phases of the SAM.


How to cite: Menviel, L., Spence, P., Kiss, A., Chamberlain, M., Hayashida, H., England, M., and Waugh, D.: Reduced Southern Ocean CO2 uptake due to the positive SAM trend, EGU General Assembly 2024, Vienna, Austria, 14–19 Apr 2024, EGU24-13846, https://doi.org/10.5194/egusphere-egu24-13846, 2024.

EGU24-14038 | ECS | Orals | BG1.3

Sea surface pCO2 variability on different time scales in the East China Sea based on high-frequency time-series observations 

Yaohua Luo, Zhirong Zhang, Jinshun Chen, Yi Xu, Fuqing Cao, Tao Huang, Xianghui Guo, and Minhan Dai

We examined the sub-seasonal to interannual variability and multi-year trend of sea surface CO2 partial pressure (pCO2) and air-sea CO2 flux at a coastal site of the East China Sea (31⁰N, 122.8⁰E) based on high-frequency time-series data collected by a buoy since 2013. Seasonal average sea surface pCO2 was highest in autumn, but the lowest value can appear in winter or spring, depending on the biological productivity in spring. The seasonal amplitude of pCO2 was up to 123 μatm. Based on property-property relationships and a simple mass budget model, we found that temperature change, biological activity, water mixing and air-sea CO2 exchange all made significant contributions to the seasonal variation of pCO2. From winter to summer, seasonal warming and atmospheric CO2 uptake elevated the pCO2, while net biological production, weakened vertical mixing and the retreat of the Yellow Sea Coastal Water (YSCW) lowered the pCO2. Conversely, from summer to winter, seasonal cooling and CO2 emission lowered the pCO2, while respiration, enhanced vertical mixing and the YSCW intrusion raised them up. Over short-term timescale, biological production and respiration frequently drew down or elevated the pCO2 by 150-400 μatm within 5-10 days during warm months. When biological activity was suppressed during cold months, such short-term variations were dominated by water mixing with a smaller pCO2 amplitude of 5-60 μatm within 2-6 days. This site was a sink of atmospheric CO2 in winter and spring, but a CO2 source in summer and autumn. Annually, it was a moderate CO2 source in 2014 (air-sea CO2 flux was 2.88 ± 11.02 mmol m2 d1), a weak CO2 sink in 2016 (-0.21 ± 12.23 mmol m2 d1), and a weak CO2 source in the combined year of the first half of 2017 and the second half of 2018 (0.40 ± 9.11 mmol m2 d1). The relatively high CO2 source in 2014 was likely due to the weaker biological production in spring and more typhoon passage in autumn. From 2013 to 2019, the wintertime sea surface pCO2 didn’t follow the increasing trend of the atmospheric pCO2, leading to an enhancing carbon sink in winter.

How to cite: Luo, Y., Zhang, Z., Chen, J., Xu, Y., Cao, F., Huang, T., Guo, X., and Dai, M.: Sea surface pCO2 variability on different time scales in the East China Sea based on high-frequency time-series observations, EGU General Assembly 2024, Vienna, Austria, 14–19 Apr 2024, EGU24-14038, https://doi.org/10.5194/egusphere-egu24-14038, 2024.

EGU24-14545 | ECS | Posters on site | BG1.3

Soil CH4 and N2O fluxes from drained and undrained peatland forests in the Baltic region. 

Muhammad Kamil Sardar Ali, Thomas Schindler, Hanna Vahter, Ain Kull, Ülo Mander, Andis Lazdiņš, Ieva Līcīte, Arta Bārdule, Aldis Butlers, Dovilė Čiuldienė, Egidijus Vigricas, Jyrki Jauhiainen, Raija Laiho, and Kaido Soosaar

Peatland ecosystem degradation and changes made in hydrology by artificial drainage may affect the biogeochemistry of peatlands and, together with projected global warming, may lead to significant changes in greenhouse gas (GHG) fluxes. Drainage of peatlands increases organic matter's aerobic decomposition, changes native vegetation, and may decrease the storage of C. The vegetative characteristics of forest ecosystem types may change a net GHG sink peatland to a source in drained organic soils.

However, soil CH4 and N2O fluxes in peatlands are spatially and temporally (interannual, seasonal) variable, and detailed data from drained nutrient-rich organic soils in the hemiboreal zone is lacking. We conducted a study spanned over two years comprising drained (n=18) and undrained (n=7) peatland forests with dominant tree species of Scots pine (Pinus sylvestris), Norway spruce (Picea abies), birch (Betula sp.), and black alder (Alnus glutinosa) spread across Estonia, Latvia, and Lithuania. Instantaneous fluxes of CH4 and N2O were measured monthly for the whole year using the manual static chamber method. Environmental parameters in soil, such as soil water level (WTL), moisture, and temperatures at depths (0-40 cm), were monitored continuously, and detailed soil chemical analyses were conducted. To constrain the factors regulating temporal fluxes of various environmental conditions and differentiate annual emissions between land use in the Baltic region.

The results show that all drained forest soils were annual CH4 sinks (−37.0 ± 4.5 μg C m−‍2 h−‍1), while undrained forests were emitters on average 388.5 ± 142. Mean annual CH4 uptake is significantly higher in deep-drained soils −45.5 ± 3.6 μg C m−‍2 h−‍1 (WTL > −50cm) than in poorly drained soils (p<0.05), regardless of dominant tree species. The in situ and annual CH4 fluxes statistically correlated with soil water level and temperature. Most of the drained sites emitted N2O (49.4 ± 17.8 μg N m−‍2 h−‍1); drained wet forest sites were higher emitters (84.7 ± 32.4) than drier sites (23.67 ± 15.6) in comparison to tree species. The instantaneous N2O fluxes were directly controlled by soil surface temperature and oxygen concentration of soil water, whereas variability in annual N2O emissions was associated with soil water content. Moreover, soil nutrient status regulated by specific ground vegetation functional groups has significantly impacted the emissions of nutrient-rich organic soils.

This research was supported by the LIFE programme project "Demonstration of climate change mitigation potential of nutrients-rich organic soils in the Baltic States and Finland" (2019-2023, LIFE OrgBalt, LIFE18 274CCM/LV/001158).

How to cite: Sardar Ali, M. K., Schindler, T., Vahter, H., Kull, A., Mander, Ü., Lazdiņš, A., Līcīte, I., Bārdule, A., Butlers, A., Čiuldienė, D., Vigricas, E., Jauhiainen, J., Laiho, R., and Soosaar, K.: Soil CH4 and N2O fluxes from drained and undrained peatland forests in the Baltic region., EGU General Assembly 2024, Vienna, Austria, 14–19 Apr 2024, EGU24-14545, https://doi.org/10.5194/egusphere-egu24-14545, 2024.

EGU24-14672 | Orals | BG1.3

Multiple approaches for quantifying fuels, combustion dynamics, and regional fire emissions in the Amazon and Cerrado 

Matthias Forkel, Christine Wessollek, Niels Andela, Jos de Laat, Vincent Huijnen, Daniel Kinalczyk, Christopher Marrs, Dave van Wees, Ana Bastos, Philippe Ciais, Dominic Fawcett, Johannes W. Kaiser, Erico Kutchartt, Carine Klauberg, Rodrigo Vieira Leite, Wei Li, Carlos Silva, Stephen Sitch, Jefferson Goncalves De Souza, and Stephen Plummer

Fires in the Amazon are of great concern because they threaten the integrity of the tropical forest biome, the carbon cycle, and air quality. Fire emissions depend on the burning behaviour of vegetation biomass, woody debris, and litter. However, the effects of fuels on the combustion process and on the composition of fire emissions are simplified in current fire emission inventories and models. Several new fire emission approaches have recently been developed to better quantify fire emissions by either making use the improved spatial resolution of modern satellite observations or by developing new modelling approaches. 

Here we compare several current and novel approaches to quantify fuel consumption and fire emissions for the Amazon and Cerrado for the fire season in 2020. The approaches include the widely used GFAS, a top-down approach based on Sentinel-5p observations (KNMI.S5p), a bottom-up approach based on active fire observations from VIIRS (GFA.S4F), two bottom-up approaches based on MODIS burned area data (500-m version of GFED, REFIT.AC), a data-model fusion approach with dynamic emission factors that integrates several Earth observation products (TUD.S4F), and three dynamic global vegetation models in diagnostic mode with prescribed burned area. The different approaches to estimate fire emission show that forest and deforestation fires dominate the regional total fire emissions. However, large differences exist in the very high emissions of individual fires that mainly contribute to the regional total fire emissions. We found a higher agreement in estimated CO and NOx emissions between approaches for savannah fires (normalised RMSE < 20%) than for forest and deforestation fires (nRMSE 30%). We estimate that only 10% of all fire events contribute between 85% and 97% of the regional total fire emissions. By using the TUD.S4F data-model fusion approach with dynamic emission factors, we show that most fire CO emissions originate from the burning of woody debris, which burns with low combustion efficiency and hence has higher emission factors for CO. Comparisons with regional field-based investigations show, however, large differences in estimates of surface fuel loads and fuel consumption. Our results demonstrate the advantage of exploring several complementary fire emission approaches to better understand the underlying processes and to account for regional to global fire emissions and their uncertainties.

How to cite: Forkel, M., Wessollek, C., Andela, N., de Laat, J., Huijnen, V., Kinalczyk, D., Marrs, C., van Wees, D., Bastos, A., Ciais, P., Fawcett, D., Kaiser, J. W., Kutchartt, E., Klauberg, C., Leite, R. V., Li, W., Silva, C., Sitch, S., Goncalves De Souza, J., and Plummer, S.: Multiple approaches for quantifying fuels, combustion dynamics, and regional fire emissions in the Amazon and Cerrado, EGU General Assembly 2024, Vienna, Austria, 14–19 Apr 2024, EGU24-14672, https://doi.org/10.5194/egusphere-egu24-14672, 2024.

EGU24-14775 | ECS | Orals | BG1.3

Global coastal ocean CO2 trends over the 1982–2020 period 

Alizee Roobaert, Pierre Regnier, Peter Landschützer, and Goulven G. Laruelle

The development of high-quality controlled databases of sea surface partial pressure of CO2 (pCO2) combined with robust machine learning-based mapping methods that fill pCO2 gaps in time and space, enable us to quantify the oceanic air-sea CO2 exchange and its spatiotemporal variability only based on in-situ observations (pCO2-products). However, most existing pCO2-products do not explicitly include the coastal ocean or have a spatial resolution that is too coarse (e.g., 1°) to capture the highly heterogeneous spatiotemporal dynamics of pCO2 in these regions thus limiting our ability to resolve long-term trends and the interannual variability of the coastal air-sea CO2 exchange (FCO2).

To address this limitation, we updated the global coastal pCO2-product of Laruelle et al. (2017) using a 2-step machine learning interpolation technique (relying on Self Organizing Maps and a Feed Forward neural Network) combined with the most extensive monthly time series for coastal waters from the Surface Ocean CO2 Atlas (SOCAT), spanning from 1982 to 2020 to reconstruct monthly high spatial resolution (0.25°) continuous coastal pCO2 maps. This updated coastal pCO2-product is then used to reconstruct the temporal evolution of the global coastal FCO2 based on observations.

Our results show that since 1982, the extended coastal ocean, covering an area of 77 million km² in this study, has been acting as an atmospheric CO2 sink, removing -0.4 Pg C yr-1 (-0.2 Pg C yr-1 with a narrower coastal domain roughly equivalent to continental shelves) from the atmosphere. Moreover, the intensity of this CO2 sink has been increasing over time at a rate of 0.1 Pg C yr-1 per decade (0.03 Pg C yr-1 decade-1 in the narrower domain). The long-term change in the air-sea CO2 flux is largely driven by the air-sea pCO2 gradient, dominated by the sea surface pCO2, however wind speed and sea-ice coverage play significant roles, regionally. This new coastal pCO2-product provides a valuable constraint for understanding the strengthening of the global coastal ocean CO2 sink, fill the coastal gap in synthesis studies such as the Global Carbon Budget and serves as a benchmark for evaluating emerging results of ocean biogeochemical models.

How to cite: Roobaert, A., Regnier, P., Landschützer, P., and Laruelle, G. G.: Global coastal ocean CO2 trends over the 1982–2020 period, EGU General Assembly 2024, Vienna, Austria, 14–19 Apr 2024, EGU24-14775, https://doi.org/10.5194/egusphere-egu24-14775, 2024.

EGU24-15244 | Orals | BG1.3

A consistent budgeting of terrestrial carbon fluxes  

Julia Pongratz, Lea Dorgeist, Clemens Schwingshackl, and Selma Bultan

As the remaining carbon budget to limit global warming in line with the Paris Agreement is rapidly shrinking, accurate estimates of the emissions from land-use and land cover change (ELUC) and the terrestrial natural CO2 sinks (SLAND) are crucial. In current carbon budgeting approaches, the ELUC and SLAND estimates are conceptually not consistent, since they stem from two different model families that differ in how CO2 fluxes are attributed to environmental or land-use changes. Consequently, anthropogenic and natural budget terms are not fully distinguished. ELUC is estimated by bookkeeping models, which typically use time-invariant carbon densities representing contemporary environmental conditions. They thus assume a steady environmental state and neglect changes in environmental conditions preceding or succeeding a land-use change event, e.g., denser growing forests in response to rising atmospheric CO2 concentrations, which emit more when cleared for agricultural land. SLAND is estimated by dynamic global vegetation models, which account for environmental changes but assume that the land cover distribution remained at its pre-industrial state. They thus include carbon sinks in forests that in reality were cleared decades ago. Here we suggest an approach for consistent budgeting of ELUC and SLAND by integrating the response of vegetation and soil carbon to environmental changes, derived from dynamic global vegetation models, into a spatially explicit bookkeeping model (BLUE). A set of dedicated simulations allows us to disentangle and re-attribute environmental and land-use components of the land-atmosphere CO2 exchange. Our results show that land is a cumulative net source of CO2 since 1850, which contrasts current global carbon budgets indicating a net sink. The underlying reason is both a higher estimate of ELUC than previously suggested as well as a smaller land sink: The implementation of environmental changes increases global ELUC over time (14% compared to current estimates for 2012-2021) mainly due to increased emissions from deforestation and wood harvest, which are only partly offset by increased sinks through reforestation/afforestation and other regrowing vegetation. Our SLAND estimate calculated under actual land cover amounts to 3.0 GtC yr-1 for 2012-2021, which is substantially lower both globally and regionally compared to estimates assuming pre-industrial land cover: we find a SLAND is smaller by 0.7 GtC yr-1 in 2012-2021, i.e., 19% lower as compared to the conventional approach using pre-industrial land cover. The overestimate of SLAND under pre-industrial land cover is particularly pronounced in regions with strong ecosystem degradation, such as Southeast Asia, Brazil, and Equatorial Africa. The consistent estimation of terrestrial carbon fluxes is thus essential not only to provide a tangible estimate to monitor the progress of net-zero emission commitments and the remaining carbon budget, but also to highlight the need to protect remaining natural ecosystems for climate regulation. Our approach provides greater consistency with atmospheric inversions and provides a finer split of anthropogenic and natural fluxes useful for a direct comparison of global carbon cycle models to national greenhouse gas inventories.

How to cite: Pongratz, J., Dorgeist, L., Schwingshackl, C., and Bultan, S.: A consistent budgeting of terrestrial carbon fluxes , EGU General Assembly 2024, Vienna, Austria, 14–19 Apr 2024, EGU24-15244, https://doi.org/10.5194/egusphere-egu24-15244, 2024.

EGU24-16495 | Orals | BG1.3

Mean, Seasonal Cycle, Trends, and Storage of the Southern Ocean carbon cycle in the RECCAP2 assessment (1985-2018) 

Lavinia Patara, Judith Hauck, Luke Gregor, Cara Nissen, Mark Hague, Precious Mongwe, Seth Bushinsky, Scott C. Doney, Nicolas Gruber, Corinne Le Quéré, Manfredi Manizza, Matthew Mazloff, and Pedro M. S. Monteiro

The Southern Ocean has long been known to be an important region for ocean CO2 uptake, and one which is especially sensitive to changes in the overlying climate. Here we assess the Southern Ocean CO2 uptake (1985–2018) using data sets gathered in the REgional Carbon Cycle Assessment and Processes Project Phase 2 (RECCAP2). These include global ocean biogeochemical models (GOBMs), surface ocean pCO2-products, data-assimilated models, and interior ocean biogeochemical observations. Over this period the Southern Ocean acted as a sink for CO2, with magnitudes which are roughly half of those reported by RECCAP1 for the same region and timeframe. Close agreement is found between GOBMs and pCO2-products, partly due to some compensation of seasonal and regional differences. Seasonal analyses revealed agreement in driving processes in winter (with uncertainty in the magnitude of outgassing), whereas discrepancies are more fundamental in summer, when GOBMs exhibit difficulties in simulating the balance of non-thermal processes of biology and mixing/circulation. The data sets emphasize strong latitudinal variations in the mean and seasonality of the CO2 flux and asymmetries in the mean and amplitude of the CO2 flux between Atlantic, Pacific and Indian sectors. The present-day net uptake is to first order a response to rising atmospheric CO2. This drives large amounts of anthropogenic CO2 (Cant) into the ocean, thereby overcompensating the loss of natural CO2 to the atmosphere driven by the changing climate. The GOBMs show, however, a 20% spread and an overall underestimate of Cant storage in the ocean interior. An apparent knowledge gap is the increase of the sink since 2000, with pCO2-products suggesting a growth that is more than twice as strong and uncertain as that of GOBMs. This is despite nearly identical pCO2 trends in GOBMs and pCO2-products when both products are compared only at the locations where pCO2 was measured.

How to cite: Patara, L., Hauck, J., Gregor, L., Nissen, C., Hague, M., Mongwe, P., Bushinsky, S., Doney, S. C., Gruber, N., Le Quéré, C., Manizza, M., Mazloff, M., and Monteiro, P. M. S.: Mean, Seasonal Cycle, Trends, and Storage of the Southern Ocean carbon cycle in the RECCAP2 assessment (1985-2018), EGU General Assembly 2024, Vienna, Austria, 14–19 Apr 2024, EGU24-16495, https://doi.org/10.5194/egusphere-egu24-16495, 2024.

EGU24-16630 | ECS | Posters on site | BG1.3

Methane emissions from Dutch peatlands measured by a national eddy covariance network 

Alexander Buzacott, Bart Kruijt, Laurent Bataille, Hanne Berghuis, Jan Biermann, Quint van Giersbergen, Christian Fritz, Reinder Nouta, Merit van den Berg, Ype van der Velde, and Jacobus van Huissteden

Drained peatlands need to be rewetted to reduce carbon dioxide (CO2) emissions caused by microbial peat oxidation and to limit soil subsidence. Raising groundwater levels will subsequently increase the chance of methane (CH4) emissions, a much more potent greenhouse gas (GHG) gas than CO2. While intact peatlands are long-term carbon sinks and have a net cooling effect, despite the CH4 emissions, how disturbed peatlands will respond to rewetting is less certain. There are several rewetting strategies outside of returning the land to unproductive uses, such as paludiculture (agriculture on inundated soils) and installing water infiltration systems (WIS) in pastures.

In the Netherlands, more than 85% of the peatlands are used for agriculture and have been extensively drained. Rewetting these peatlands is necessary to reduce CO2 emissions, however the effect this will have on CH4 emissions needs to be understood such that optimal rewetting strategies can be chosen to minimise GHG emissions. In this presentation, we report our efforts into monitoring CH4 emissions across Dutch peatlands with a network of eddy covariance (EC) systems since 2020 for the Netherlands Research Programme on Greenhouse Gas Dynamics in Peatlands and Organic Soils (NOBV) project. Fluxes of CO2 and CH4 have been observed across 20 field sites that cover the current Dutch peatland extent using a combination of permanent and mobile (alternating between two paired sites) EC towers that measured the land uses of paludiculture, semi-natural, pastures with WIS, pastures with high and low groundwater levels, and a lake. We focus on the main drivers of CH4 emissions in Dutch peatlands, evaluate the impact of land use on annual CH4 emissions, and emission upscaling.

How to cite: Buzacott, A., Kruijt, B., Bataille, L., Berghuis, H., Biermann, J., van Giersbergen, Q., Fritz, C., Nouta, R., van den Berg, M., van der Velde, Y., and van Huissteden, J.: Methane emissions from Dutch peatlands measured by a national eddy covariance network, EGU General Assembly 2024, Vienna, Austria, 14–19 Apr 2024, EGU24-16630, https://doi.org/10.5194/egusphere-egu24-16630, 2024.

EGU24-18116 | Orals | BG1.3

Reviewing differences and uncertainties in land-use CO2 flux estimates 

Wolfgang Obermeier, Clemens Schwingshackl, Raphael Ganzenmüller, Ana Bastos, Philippe Ciais, Giacomo Grassi, Ingrid Luijkx, Stephen Sitch, and Julia Pongratz

CO2 fluxes from land use and land-use change (FLUC) are a major source of carbon to the atmosphere. They are composed of gross emissions, mainly from deforestation, peat burning, and peat drainage, and gross removals, mainly from re- and afforestation. The importance of FLUC for climate change mitigation strategies is increasing due to the potential of storing large carbon amounts via re- and afforestation, harvested wood products, and other vegetation-based carbon dioxide removal methods, such as bioenergy with carbon capture and storage. Yet, FLUC estimates remain largely uncertain and show substantial discrepancies between different quantification methods, which makes it challenging to provide reliable projections of their potential future evolution.


Here, we review the main characteristics, uncertainties, and discrepancies of individual methods used to estimate FLUC, and we highlight promising steps to reduce FLUC uncertainties and to harmonize the various FLUC estimates. Differences between the approaches are mainly due to differing definitions and assumptions, such as the definition of anthropogenic fluxes and managed land (leading to a gap in FLUC of ~1.8 GtC/yr in 2000-2020 between FLUC estimates by bookkeeping models used in the Global Carbon Project and inventory-based estimates reported by countries to the United Nations Framework Convention on Climate Change) and the inclusion of environmental effects on carbon stocks (leading to a gap of ~0.4 GtC/yr in 2000-2020 between FLUC estimates from dynamic global vegetation models and bookkeeping models). Furthermore, the individual estimation methods have large uncertainties, mainly arising from the usage of differing land-use forcing data, missing observational constraints, differences in how models implement individual processes, and the degree of implementation of land use practices in models.


To improve the confidence in the individual FLUC estimates, we argue for a systematic model evaluation and an improved parametrization of models, in particular regarding land-use forcing data, carbon densities of vegetation and soils, and the represented processes. Alongside, remaining framework inconsistencies, such as a precise and consistent definition of FLUC and the consideration of transient C densities need to be resolved. This undertaking requires developments in several directions. Earth observations may provide data on carbon densities in vegetation and soil at high spatial resolution, improved estimates of forest regrowth rates as well as impacts of forest management. Models need to be further improved to consider all relevant land-use processes and provide more fine-granular output to guarantee that the different estimates are comparable and/or translatable into each other.


Providing harmonized and more accurate FLUC estimates is essential to improve the stocktake of countries' land use-related CO2 emissions, to provide an accurate budget of the global carbon cycle, and to effectively plan and monitor land-based carbon dioxide removal methods.

How to cite: Obermeier, W., Schwingshackl, C., Ganzenmüller, R., Bastos, A., Ciais, P., Grassi, G., Luijkx, I., Sitch, S., and Pongratz, J.: Reviewing differences and uncertainties in land-use CO2 flux estimates, EGU General Assembly 2024, Vienna, Austria, 14–19 Apr 2024, EGU24-18116, https://doi.org/10.5194/egusphere-egu24-18116, 2024.

EGU24-19922 | Posters on site | BG1.3

Ocean biogeochemical reconstructions to estimate historical ocean CO2 uptake 

Raffaele Bernardello, Valentina Sicardi, Vladimir Lapin, Pablo Ortega, Yohan Ruprich-Robert, Etienne Tourigny, and Eric Ferrer

Given the role of the ocean in mitigating climate change through CO2 absorption, it is important to improve our abil ity to quantify the historical ocean CO2 uptake, including its natural variability, for carbon budgeting purposes. In this study we present an exhaustive intercomparison between two ocean modelling practices that can be used to reconstruct the historical ocean CO2 uptake. By comparing the simulations to a wide array of ocean physical and biogeochemical observational datasets, we show how constraining the ocean physics towards observed temperature and salinity results in a better representation of global biogeochemistry. We identify the main driver of this improvement to be a more realistic representation of large scale meridional overturning circulation together with improvements in mixed layer depth and sea surface temperature. Nevertheless, surface chlorophyll was rather insensitive to these changes, and, in some regions, its representation worsened. We identified the causes of this response to be a combination of a lack of robust parameter optimization and limited changes in environmental conditions for phytoplankton. We conclude that although the direct validation of CO2 fluxes is challenging, the pervasive improvement observed in most aspects of biogeochemistry when applying data assimilation of observed temperature and salinity is encouraging; therefore, data assimilation should be included in multi-method international efforts aimed at reconstructing the ocean CO2 uptake.

How to cite: Bernardello, R., Sicardi, V., Lapin, V., Ortega, P., Ruprich-Robert, Y., Tourigny, E., and Ferrer, E.: Ocean biogeochemical reconstructions to estimate historical ocean CO2 uptake, EGU General Assembly 2024, Vienna, Austria, 14–19 Apr 2024, EGU24-19922, https://doi.org/10.5194/egusphere-egu24-19922, 2024.

EGU24-20295 | Orals | BG1.3

A water mass transformation method applied to diagnosing ocean carbon uptake 

Neill Mackay, Jan Zika, Taimoor Sohail, Tobias Ehmen, and Andrew Watson

The ocean is a strong sink for anthropogenic CO2, absorbing around a quarter of emissions since the industrial era. Quantifying the ocean carbon sink is necessary for constraining the global carbon budget; however, discrepancies remain between estimates of the ocean carbon sink over the last 30 years from observation-based data products and those from numerical models. Moreover, larger regional uncertainties highlight the need for a better understanding of the drivers of ocean carbon sink variability, to help improve models and to better constrain future climate projections. A comprehensive understanding of the sink must include knowledge of (1) the air-sea flux of CO2, (2) the accumulation of carbon in the ocean interior, and (3) how it is redistributed within the ocean by changes in the physical circulation. This characterisation is typically achieved using numerical models, which are constrained by resolution and the need to parameterise processes including physical mixing at the sub-grid scale.

We present a novel method for characterising the ocean carbon sink from a combination of oceanographic datasets, and for reconciling our knowledge of the ocean’s uptake of CO2 with that of interior carbon storage rates. Our Optimal Transformation Method (OTM) uses a water mass framework to diagnose the transport and mixing of tracers such as heat, salt, and carbon consistent with observed interior changes and estimates of boundary forcings. The water mass framework has the advantage that the transport and mixing of conservative tracers are diagnosed exactly, with no need for parameterisation. We validate OTM using outputs from a data-assimilating biogeochemical ocean model and demonstrate its ability to recover the model’s ‘true’ air-sea CO2 fluxes when initialised with biased priors. OTM reduces root-mean-squared errors between diagnosed air-sea CO2 fluxes and the model truth from prior to solution by up to 71%, while simultaneously estimating inter-basin transports of heat, freshwater, and carbon consistent with the model. Following successful validation, we apply OTM to a combination of observational data products to diagnose estimates of the ocean’s uptake and redistribution of carbon since 1990, utilising reanalyses of air-sea heat and freshwater fluxes, interior temperature and salinity, air-sea CO2 fluxes, and machine-learning reconstructions of interior ocean carbon.

How to cite: Mackay, N., Zika, J., Sohail, T., Ehmen, T., and Watson, A.: A water mass transformation method applied to diagnosing ocean carbon uptake, EGU General Assembly 2024, Vienna, Austria, 14–19 Apr 2024, EGU24-20295, https://doi.org/10.5194/egusphere-egu24-20295, 2024.

EGU24-20413 | Posters on site | BG1.3

Quantifying unaccounted greenhouse gas emissions due to the war in Ukraine – driver analysis, emission estimation, and implications to emission reporting 

Rostyslav Bun, Gregg Marland, Tomohiro Oda, Linda See, Enrique Puliafito, Zbigniew Nahorski, Matthias Jonas, Vasyl Kovalyshyn, Iolanda Ialongo, Orysia Yashchun, and Zoriana Romanchuk

Quantifying greenhouse gas (GHG) emissions is a critical task for climate monitoring and mitigation actions.  Under the Paris Agreement, for example, accounting and reporting of GHG emissions are mandatory for Parties.  Reported emissions are often calculated using activity data approaches.  The robustness of the activity data collection is a key for obtaining accurate emission estimates; however, in a period of open conflict or war, the systems for data collection can be desperately damaged and destroyed and thus the ability of achieving robust GHG estimates and transparent reporting can be significantly hampered.  Also, military emissions, which are thought to be often poorly quantified, should increase significantly than peace times. 

We attempted to quantify GHG emissions during the first 18 months of the 2022/2023 full-scale war in Ukraine.  We first identified major, war-related, emission drivers and processes from the territory of Ukraine.  We analyzed publicly available data and used expert judgment to estimate emissions from (1) the use of bombs, missiles, barrel artillery, and mines; (2) the consumption of oil products for military operations; (3) fires at petroleum storage depots and refineries; (4) fires in buildings and infrastructure facilities; (5) fires on forest and agricultural lands; and (6) the decomposition of war-related garbage/waste.  Those sources are often not covered by current GHG inventory guidelines, and thus are not likely to be included in national inventory reports. 

Our estimate of the war-related emissions of carbon dioxide (CO2), methane, (CH4) and nitrous oxide (N2O) for the first 18 months of the war in Ukraine is 77 MtCO2-eq. with a relative uncertainty of ±22 % (95 % confidence interval).  It is important to note that these emissions are considered to be emissions from Ukraine in reporting because the emissions occurred within the territory of Ukraine.  The current emission accounting system (e.g. UNFCCC) is not designed to account war/conflict time emissions adequately.  The uncertainties due to the unaccounted emissions are also aliasing to our global and regional carbon budget calculations.

How to cite: Bun, R., Marland, G., Oda, T., See, L., Puliafito, E., Nahorski, Z., Jonas, M., Kovalyshyn, V., Ialongo, I., Yashchun, O., and Romanchuk, Z.: Quantifying unaccounted greenhouse gas emissions due to the war in Ukraine – driver analysis, emission estimation, and implications to emission reporting, EGU General Assembly 2024, Vienna, Austria, 14–19 Apr 2024, EGU24-20413, https://doi.org/10.5194/egusphere-egu24-20413, 2024.

EGU24-20466 | Orals | BG1.3 | Highlight

Fire-precipitation interactions control biomass carbon and net biome production across the world’s largest savanna 

Mathew Williams, David Milodowski, Smallman Luke, Iain McNicol, Kyle Dexter, Casey Ryan, Mike O'Sullivan, Aude Valade, Gabi Hegerl, and Stephen Sitch

Miombo woodlands are the world’s largest savanna, covering 2-3 M km2, and are the dominant land cover in the dry tropics of southern Africa. Here we quantify the dynamics of the miombo region carbon cycle, diagnosing stocks and fluxes and their interactions with climate and disturbance, and evaluate their representation in Trendy land surface models (LSMs). We produce a constrained multi-year analysis (2006-2017) using earth observation time series of total wood C (Cwood) and leaf area index to calibrate an intermediate complexity ecosystem model forced with observed climate, deforestation and burned area. Statistical analyses determine the relationships between carbon cycling, environmental and disturbance variables, and evaluate LSMs. The analysis suggests that the regional net biome production is neutral, 0.0 Mg C ha-1 yr-1 (95% Confidence Interval -1.7 - 1.6), with fire emissions contributing ~1.0 Mg C ha-1 yr-1 (95% CI 0.4-2.5). Spatial variation in biogenic fluxes and C pools is strongly correlated with mean annual precipitation. Burned area is also positively correlated with these pools and fluxes. Areas that are more frequently burned tend to have greater precipitation, and shorter residence time of Cwood. Fire-related mortality from Cwood to dead organic matter likely exceeds fire-related emissions from Cwood to atmosphere, and likely exceeds natural rates of Cwood mortality. LSMs match the biogenic fluxes of the analysis, but diverge on C stocks, timings of heterotrophic respiration and magnitude of fire emissions. The analysis suggests that climate, through precipitation, drives spatial variability in Cwood and GPP across the region. Fire disturbance is the major driver of losses from Cwood. Larger annual precipitation is correlated with both greater GPP and greater fire disturbance. These factors have opposing but unbalanced impacts on Cwood, but the precipitation-GPP effect dominates. Patterns of C cycling across the region are a complex outcome of climate controls on production, and vegetation-fire interactions.

How to cite: Williams, M., Milodowski, D., Luke, S., McNicol, I., Dexter, K., Ryan, C., O'Sullivan, M., Valade, A., Hegerl, G., and Sitch, S.: Fire-precipitation interactions control biomass carbon and net biome production across the world’s largest savanna, EGU General Assembly 2024, Vienna, Austria, 14–19 Apr 2024, EGU24-20466, https://doi.org/10.5194/egusphere-egu24-20466, 2024.

EGU24-3351 | ECS | Posters on site | AS3.40

Isotopic fractionation of N and O in N2O from denitrification: insights from the comparative analysis of Pseudomonas strains with distinct nitrite reductase enzymes 

Noémy Chénier, Paul M. Magyar, Lukas Emmenegger, Moritz F. Lehmann, and Joachim Mohn

Nitrous oxide (N2O), a potent greenhouse gas, primarily stems from oxidative (e.g. nitrification) and reductive (e.g., denitrification) microbial processes in aquatic and terrestrial environments. To better understand spatial and temporal N2O production, the isotopic composition of N2O, specifically 15N/14N and 18O/16O ratios, and the intramolecular distribution of 15N (i.e., site preference, SP), are typically used[1]. Distinguishing multiple concurrent processes with three isotope parameters (δ15N, δ18O, SP) remains, however, a challenge, especially in light of uncertainties regarding the isotope effects for individual processes.

Here, we study the isotope effects of N2O production imparted by denitrification, focusing specifically on the intermediate step of nitrite (NO2-) reduction to nitric oxide (NO), which is catalyzed by various nitrite reductases. We study three bacterial denitrifiers: Pseudomonas chlororaphis subsp. aureofaciens, Pseudomonas chlororaphis, and Pseudomonas stutzeri. These bacteria utilize similar nitric oxide reductases (NorB) enzymes, but different nitrite reductase variants (NirS vs. NirK). We anticipate similarities in SP values, mostly controlled by NorB, but differences in δ15N-bulk and δ18O values for generated N2O, given the distinct nitrite reductase enzymes[2]. P. stutzeri strain JM300, expressing both NirS and NirK genes[3], offers a unique opportunity for studying each enzyme's distinct functions and isotopic signatures.

Selected strains are incubated in batch experiments of a 0.5 L bioreactor using nitrate as a substrate. The bioreactor's headspace is continuously purged with N2. We monitor bacterial growth, NO2- concentrations, dissolved O2, pH, and temperature throughout the experiment. Simultaneously, we daily collect one sample for nitrite and nitrate N and O isotope analysis. After removing CO2 and water, N2O concentrations are monitored with Fourier-transform infrared spectroscopy. The isotopic composition of N2O is measured online using quantum-cascade-laser spectroscopy, providing real-time analysis with high precision (< 0.1 ‰). This enables real-time tracking of changes in the N and O isotope systematics (i.e., fractionation), in response to changing reaction kinetics.

The preliminary data that we present will lay the basis for future investigations into the constraints on systematic heavy-isotope clumping (i.e., relative abundance of doubly substituted N2O isotopologues 15N15N16O, 14N15N18O, 15N14N18O) associated with microbial N2O production. Specifically, we will verify direct and indirect enzymatic controls (i.e., type of Nir; N-O bond equilibration with water) on the clumped-isotope abundance of 14N15N18O.


[1] Toyoda, S., et al. (2017). Isotopocule analysis of biologically produced nitrous oxide in various environments. Mass Spectrometry Reviews, 36(2), 135-160.

[2] Martin, T. S., et al. (2016). Nitrogen and oxygen isotopic fractionation during microbial nitrite reduction. Limnology and Oceanography, 61(3), 1134-1143.

[3] Wittorf, L., et al. (2018). Expression of nirK and nirS genes in two strains of Pseudomonas stutzeri harbouring both types of NO-forming nitrite reductases. Research in microbiology, 169(6), 343-347.

How to cite: Chénier, N., Magyar, P. M., Emmenegger, L., Lehmann, M. F., and Mohn, J.: Isotopic fractionation of N and O in N2O from denitrification: insights from the comparative analysis of Pseudomonas strains with distinct nitrite reductase enzymes, EGU General Assembly 2024, Vienna, Austria, 14–19 Apr 2024, EGU24-3351, https://doi.org/10.5194/egusphere-egu24-3351, 2024.

EGU24-3765 | Posters on site | AS3.40

Unveiling urban atmospheres: a comprehensive study on CO2 dynamics, air quality, and volcanic impacts in Napoli and Pozzuoli 

Roberto Di Martino, Sergio Gurrieri, Antonio Paonita, Stefano Caliro, and Alessandro Santi

The atmospheric concentration of CO2 is crucial in urban areas due to its connection with air quality, pollution, and climate change. Monitoring airborne CO2 concentrations is vital for environmental management and public safety.  In the lower 50 meters of the atmosphere, CO2 emissions impact human health and ecosystems, making data at this level essential for addressing carbon-cycle and public-health questions. In volcanic zones, CO2 variations may correlate with volcanic activity, impacting local ecosystems and human health. In certain regions with high natural CO2 emissions, geogenic CO2 profoundly affects the environment. Despite volcanoes' local impact may be important, hydrocarbon combustion is the primary driver of increased atmospheric CO2 and global warming climate.

This study presents survey results on stable isotope composition of carbon and oxygen of CO2 and airborne CO2 concentration in the Campi Flegrei caldera, a high volcanic risk area threatening the Naples metropolitan area. In the last 50 years, two major volcanic unrests (1969–72 and 1982–84) were monitored using seismic, deformation, and geochemical data. The current unrest started in 2005, involving pressurization of the underlying hydrothermal system as a causal factor of the current uplift in the Pozzuoli area.

This research illustrates the use of a mobile laboratory to better understand emissions dynamics and quantify volcanic-origin emissions. Results shows that CO2 levels in Napoli's urban area exceed background atmosphere levels, indicating an anthropogenic origin from fossil fuel combustion. Conversely, in Pozzuoli's urban area, the stable isotope composition reveals a volcanic origin of the airborne CO2. This study demonstrates how a spatial survey of stable isotope composition of airborne CO2 is crucial for understanding emission dynamics. Distinguishing geogenic from anthropogenic emissions is challenging, especially through air CO2 concentration measurements alone. The findings emphasize the importance of monitoring atmospheric CO2, especially in areas with volcanic risks, contributing valuable insights for environmental and public health management.

How to cite: Di Martino, R., Gurrieri, S., Paonita, A., Caliro, S., and Santi, A.: Unveiling urban atmospheres: a comprehensive study on CO2 dynamics, air quality, and volcanic impacts in Napoli and Pozzuoli, EGU General Assembly 2024, Vienna, Austria, 14–19 Apr 2024, EGU24-3765, https://doi.org/10.5194/egusphere-egu24-3765, 2024.

EGU24-6317 | ECS | Posters on site | AS3.40

Enhancing Methane Source Attribution through Co-Assimilation of Ethane Observations in Atmospheric Inversion Methods 

Adrien Martinez, Marielle Saunois, Antoine Berchet, Isabelle Pison, and Philippe Bousquet

Estimating methane emissions using atmospheric inversion methods that assimilate only methane observations presents challenges in accurately attributing methane sources and sinks to specific emission sectors.

We explore the potential of co-assimilating observations of co-emitted species alongside methane observations to address this challenge and provide improved sectoral distribution of methane emissions.

Ethane is a promising candidate for this purpose. It is primarily co-emitted with methane in the fossil fuel emission sector, particularly through fugitive emissions from natural gas extraction, and is also co-emitted in the biomass and biofuel burning emission sectors, with negligible emissions in other sectors.

To assess the potential of co-assimilating ethane observations with methane observations, we use a global chemistry-transport model, LMDZ-SACS, with the Community Inversion Framework (CIF) to perform response functions analysis on methane and ethane emissions over a multi-year period.

We utilize the response functions results to meaningfully construct full source-receptor relationship matrices at available observation site, as well as, error covariance matrices for a control vector that includes both species emissions and initial conditions, and perform a large set of analytical inversions that assimilate in-situ and flask observations of both methane and ethane, as well as methane-only observations.

This methodology can not only provide improved estimates of the sectoral distribution of methane sources and sinks, but also extends the scope of the analysis to include ethane emissions.

How to cite: Martinez, A., Saunois, M., Berchet, A., Pison, I., and Bousquet, P.: Enhancing Methane Source Attribution through Co-Assimilation of Ethane Observations in Atmospheric Inversion Methods, EGU General Assembly 2024, Vienna, Austria, 14–19 Apr 2024, EGU24-6317, https://doi.org/10.5194/egusphere-egu24-6317, 2024.

EGU24-6754 | Orals | AS3.40

A top-down assessment of CO2 and CH4 atmospheric variability and emission sources in the Aix-Marseille metropolis area, France. 

Irène Xueref-Remy, Ludovic Lelandais, Aurélie Riandet, Pierre-Eric Blanc, Alexandre Armengaud, Sonia Oppo, Gregory Gille, Sanne Palstra, Bert Scheeren, Huilin Chen, Bert Kers, Pauline Bosio, Marvin Dufresne, Stéphane Sauvage, and Thérèse Salameh

The Aix-Marseille metropolis is the second most populated urbanized area of France. It aims at reaching carbon neutrality in 2050. Located in the south-east of France under a Mediterranean climate, this area is known as a hot-spot regarding climate change. Its west part is strongly industrialized. The local air quality monitoring agency  ATMOSUD delivers a high resolved greenhouse gas emissions inventory that represents the reference for local stakeholders in matter of emissions trajectory. However, this inventory is still quite uncertain and requires independent assessments. In this aim, in the framework of the ANR COoL-AMmetropolis projet (2019-2025) we set-up a local greenhouse gas monitoring network based on Cavity Ring Down Spectrometry analyzers. This local network comprises the OHP ICOS-France station, located 80 km north of Marseille city. Local meteorological features such as sea and land breezes impact local greenhouse gas concentrations through advection and boundary layer dynamical processes. Isotopic analysis of 14C and 13C in CO2, as well as CO2 correlations with NOx, CO, black carbon and SO2, show a strong impact of fossil fuel emissions on the CO2 local urban greenhouse gas atmospheric plumes. The identified fossil sources are mostly traffic, building, industrial and maritime activities. Modern sources such as wood burning may account for a larger part than assessed by the local inventory.

How to cite: Xueref-Remy, I., Lelandais, L., Riandet, A., Blanc, P.-E., Armengaud, A., Oppo, S., Gille, G., Palstra, S., Scheeren, B., Chen, H., Kers, B., Bosio, P., Dufresne, M., Sauvage, S., and Salameh, T.: A top-down assessment of CO2 and CH4 atmospheric variability and emission sources in the Aix-Marseille metropolis area, France., EGU General Assembly 2024, Vienna, Austria, 14–19 Apr 2024, EGU24-6754, https://doi.org/10.5194/egusphere-egu24-6754, 2024.

EGU24-7562 | ECS | Orals | AS3.40 | Highlight

Evolution of atmospheric methane clumped isotope anomalies since the 1990s reconstructed from firn air measurements 

Malavika Sivan, Jiayang Sun, Thomas Röckmann, Patricia Martinerie, James Farquhar, Maarten C. Krol, Sudhanshu Paandey, Malika Menoud, Bibhasvata Dasgupta, Mojhgan A. Hagnegedar, Carina van der Veen, and Maria Elena Popa

The global atmospheric methane mole fractions have risen since the pre-industrial times, primarily attributed to anthropogenic emissions, overlayed by significant multi-annual variability. Atmospheric methane is influenced by different methane sources, variations in the atmospheric OH concentration and other sink reactions. Understanding the contribution of each of these factors is crucial for a comprehensive understanding of the methane cycle.

Recent modelling studies have suggested that measurements of clumped isotopologues (13CH3D and 12CH2D2) can help constrain the global methane budget [1,2]. The first measurements of present ambient air (2022-23) show that the clumping anomalies of atmospheric methane have distinct signatures of about 1 ± 0.3 ‰ for Δ13CH3D and 44 ± 3 ‰ for Δ12CH2D2, strongly enriched in Δ12CH2D2 compared to all known sources [3,4].

We have measured the bulk and clumped isotope composition of methane from firn air samples (~ 500 L volume) collected at the East Greenland Ice core Project (EGRIP) site in high-pressure cylinders. At this location, open porosity allows the collection of air samples from firn down to a depth of 70 m, dating back to the 1990s.

These are the first-ever measurements of the clumped isotopic composition of atmospheric methane from the past. Results of bulk isotope measurements are in line with the known temporal evolution, supporting the integrity of the sampling and analysis procedure. The clumped isotope results reveal a clear increase of 10 ± 2 ‰ for Δ12CH2D2 over the last 30 years (~1993 to 2018), while Δ13CH3D remains constant within the experimental uncertainty. We use a 2-box atmospheric model to investigate source and sink scenarios that are consistent with this trend in the clumped isotope anomalies as well as the bulk isotopic composition of methane.

References:

1.https://doi.org/10.1029/2020GB006883

2.https://doi.org/10.1002/2017GB005655

3.https://doi.org/10.1073/pnas.2305574120

4.https://doi.org/10.5194/egusphere-2023-1906

How to cite: Sivan, M., Sun, J., Röckmann, T., Martinerie, P., Farquhar, J., Krol, M. C., Paandey, S., Menoud, M., Dasgupta, B., Hagnegedar, M. A., Veen, C. V. D., and Popa, M. E.: Evolution of atmospheric methane clumped isotope anomalies since the 1990s reconstructed from firn air measurements, EGU General Assembly 2024, Vienna, Austria, 14–19 Apr 2024, EGU24-7562, https://doi.org/10.5194/egusphere-egu24-7562, 2024.

EGU24-7845 | ECS | Posters on site | AS3.40

Methane and carbon dioxide observations at Debrecen, Hungary: mole fraction and isotope ratio measurements in three different seasons 

Tamás Varga, István Major, Sándor Bán, Balázs Áron Baráth, Thomas Röckmann, Jacoline van Es, Carina van der Veen, and Mihály Molnár

The increasing level of atmospheric greenhouse gases and the effect of this trend, climate change, is one of the greatest environmental issues of the anthropogenic era. The increasing trend of greenhouse gas levels after industrialization is related to urban environments, where industrial and traffic-related activity and emissions are concentrated. In response to this, the European system, the ICOS (Integrated Carbon Observation System) was established and started the ICOS cities program, where coordinated greenhouse gas observations are carried out besides the regional background measurements and samplings. Similarly to this program, atmospheric air samples were collected at the Institute for Nuclear Research, Debrecen. During the sampling campaigns in three different seasons (winter, spring and summer), a minimum of 23 samples were collected in the morning and afternoon during weekdays and weekends as well. The samples are processed within a collaboration between Utrecht University, where the stable isotope composition of CO2 and CH4 were measured, and the Institute for Nuclear Research, Hungary, where the mole fraction of CO2 and CH4 and radiocarbon ratio of CO2 were measured. Based on the isotope composition results and stable isotope fingerprint of carbon dioxide and methane sources, the differentiation of the possible emission sources of these gases can be made. Using the radiocarbon, we can estimate the fossil CO2 contribution in urban areas. The preliminary results show that there is a great fossil contribution to the CO2 fraction, on the other hand, a great local biological contribution was observed in the CH4 fraction in every season. Based on measurements and literature, the source of the massive biological discharge could be the sewage pipeline system, even in winter. Our dataset shows that this kind of CH4 emitter can exceed fossil sources in Debrecen, Hungary.

How to cite: Varga, T., Major, I., Bán, S., Baráth, B. Á., Röckmann, T., van Es, J., van der Veen, C., and Molnár, M.: Methane and carbon dioxide observations at Debrecen, Hungary: mole fraction and isotope ratio measurements in three different seasons, EGU General Assembly 2024, Vienna, Austria, 14–19 Apr 2024, EGU24-7845, https://doi.org/10.5194/egusphere-egu24-7845, 2024.

EGU24-7848 | Orals | AS3.40 | Highlight

Analysis of radiocarbon in atmospheric methane: technological advances and interpretation of measurements 

Giulia Zazzeri, Lukas Wacker, Negar Haghipour, and Heather Graven

Radiocarbon (14C) is an optimal tracer of methane emissions, as 14C measurements enable distinguishing fossil from biogenic methane. However, we are not yet applying these measurements in monitoring programs for quantification of sources contribution, because of the technical challenges associated with the 14C analysis and the bias introduced by 14C emissions from nuclear power plants.

Studies in London and in Switzerland demonstrate how the nuclear influence should be accurately modelled for a quantitative interpretation of 14C measurements and that a robust uncertainty estimate of the fossil and biogenic proportion of CH4 emissions is highly needed.

Here we present the technological advances in the 14CH4 analysis, including the achievement of high precision 14CH4 measurements (5 ‰) using a new portable sampler developed at the laboratory of Ion Beam Physics, and the potential of expanding these measurements for an improved understanding of sources. We will present the first quantification of fossil methane emissions in London using 14C, demonstrating that, by increasing the measurement capability, we can use 14C to constrain the methane budget at regional scale.

How to cite: Zazzeri, G., Wacker, L., Haghipour, N., and Graven, H.: Analysis of radiocarbon in atmospheric methane: technological advances and interpretation of measurements, EGU General Assembly 2024, Vienna, Austria, 14–19 Apr 2024, EGU24-7848, https://doi.org/10.5194/egusphere-egu24-7848, 2024.

EGU24-8275 | ECS | Posters on site | AS3.40

Stable isotope analysis of atmospheric CO2 using a Gasbench II – Cold Trap – IRMS setting 

Simon Leitner, Kathiravan Meeran, and Andrea Watzinger

The measurement of the stable carbon and oxygen isotope ratio of (atmospheric) carbon dioxide (CO2) is a useful technique for the investigation and identification of the sources and sinks of the most abundant greenhouse gas by far. For this reason, we are presenting a measuring system here that enables a wide range of users to carry out stable isotope analysis of atmospheric CO2 using off the bench hard- and software.

The fully automated system uses cryogenic and gas chromatographic separation to analyse CO2 from 12 mL whole air samples and consists of an autosampler, a Gasbench II, a downstream cryo trap and a continuous flow gas interface feeding into a sector field mass spectrometer (GC Pal/Gasbench II/Cold Trap/Conflo IV/DeltaV Plus). The evaluation of the system performance was based on the analysis of samples prepared from eight CO2 sources (four CO2 reference gases and four artificial air tanks).

The overall measurement uncertainty (averaged single standard deviation (1σ) of measurement replicates from each CO2 source) in the determination of the carbon and oxygen isotope ratio was 0.04 ‰ and 0.09 ‰ (n=24). Furthermore, we were able to show that the measurement data also allowed for the quantification of the CO2 mole fraction, with a precision of 1.2 µmol mol-1 in the analysis range of 400 to 500 µmol mol-1.

The method to be presented was summarized and published in the form of a protocol (DOI: 10.1002/rcm.9647) providing a detailed description of the measurement setup and the analysis procedure, how raw data should be evaluated and gives recommendations for sample preparation and sampling to enable a fully automated whole air sample analysis. We look forward to further discussion with interested users to elaborate on potential improvements/extensions/application options.

How to cite: Leitner, S., Meeran, K., and Watzinger, A.: Stable isotope analysis of atmospheric CO2 using a Gasbench II – Cold Trap – IRMS setting, EGU General Assembly 2024, Vienna, Austria, 14–19 Apr 2024, EGU24-8275, https://doi.org/10.5194/egusphere-egu24-8275, 2024.

EGU24-9424 | ECS | Orals | AS3.40

Continuous monitoring of the isotopic composition of methane in Cluj-Napoca. 

Jacoline van Es, Carina van der Veen, Malika Menoud, Calin Baciu, Mustafa Hmoudah, Stephan Henne, and Thomas Rockmann

Methane (CH4) plays a crucial role in the Earths’ radiative balance, since it
is a potent greenhouse gas with a shorter lifetime compared to CO2. Mitigating
methane emissions could help mitigate climate change in a short time frame.
This requires a solid understanding of the emissions on the location, strength and
the type of the source. Isotopic analysis can help with the source partitioning
since different sources emit CH4 with slight but significant differences in the
isotopic composition.
Utrecht University developed an isotope ratio mass spectrometer (IRMS)
system capable of measuring δ13C and δD of CH4 at high precision with ap-
proximately hourly time resolution for both isotope signatures. Under the Hori-
zon Europe project PARIS (Process Attribution of Regional Emissions) we ex-
panded the coverage of high time resolution isotope measurements in Europe by
deployment of this system in Cluj-Napoca. The goal is to investigate the typical
source mix of methane in this region and investigate whether the observations
agree with emission inventories. This data is combined with a mobile surveys
to investigate suspected sources.
The work performed on the continuous data-series indicate that the night
time accumulation has an important role in the mixing ratio and the signatures
of both the δD and δ13C. Furthermore it suggest that the enhancements can be
explained by a combination of leakages from the gas network, combined with
microbial sources. Wind directions indicates that the city centre has significant
contributions to these emissions.

How to cite: van Es, J., van der Veen, C., Menoud, M., Baciu, C., Hmoudah, M., Henne, S., and Rockmann, T.: Continuous monitoring of the isotopic composition of methane in Cluj-Napoca., EGU General Assembly 2024, Vienna, Austria, 14–19 Apr 2024, EGU24-9424, https://doi.org/10.5194/egusphere-egu24-9424, 2024.

EGU24-10170 | ECS | Posters on site | AS3.40

Continuous in-situ measurements of atmospheric CH4 at the Port-de-Bouc urban-industrial station (south-east of France): a two-year analysis of CH4 spatio-temporal variability and source identification using co-emitted species. 

Pauline Bosio, Irène Xueref-Remy, Pierre-Éric Blanc, Aurélie Riandet, Grégory Gille, Alexandre Armengaud, and Sonia Oppo

Methane (CH4) is the second most important direct anthropogenic greenhouse gas after carbon dioxide (CO2). Its lifetime is 10 times shorter than that of CO2, and its warming potential 80 times greater over a 20-year period. Reducing methane emissions therefore represents a lever for rapid action on global warming. The Sud-PACA region (south-eastern France), classified by IPCC as a climate "hotspot", is part of these efforts to reduce CH4 emissions, with the aim of achieving carbon neutrality by 2050. To achieve this, it is essential to reduce the uncertainties of regional CH4 emissions. Although over 50% of regional methane is estimated to be emitted in the south-western part of the region, there are few CH4 measurements in this highly urbanized and industrialized area. With a view to filling this gap and better characterizing anthropogenic sources of CH4, a PICARRO G2401 CRDS analyser and meteorological station were set up in May 2021 as part of the ANR COol-AMmetropolis project at Port-de-Bouc (43°24'7.056''N; 4°58'55.459''E), surrounded by numerous petrochemical industries. This station continuously measures CH4, CO2 and CO concentrations to study the variability of these species for the different wind sectors.  The spatio-temporal variability of CH4 concentration and the identification of its sources using co-emitted species will be presented. All these data represent the first measurements of CH4 in this industrial area and will also be used to independently verify regional inventories. 

How to cite: Bosio, P., Xueref-Remy, I., Blanc, P.-É., Riandet, A., Gille, G., Armengaud, A., and Oppo, S.: Continuous in-situ measurements of atmospheric CH4 at the Port-de-Bouc urban-industrial station (south-east of France): a two-year analysis of CH4 spatio-temporal variability and source identification using co-emitted species., EGU General Assembly 2024, Vienna, Austria, 14–19 Apr 2024, EGU24-10170, https://doi.org/10.5194/egusphere-egu24-10170, 2024.

EGU24-10553 | ECS | Orals | AS3.40

Evaluating the impact of using Δ14CO2 observations in quantifying fossil CO2 emissions over Europe 

Carlos Gómez-Ortiz, Guillaume Monteil, Ute Karstens, Sourish Basu, and Marko Scholze

CO2 is one of the most important greenhouse gases responsible for global climate change. Today’s atmospheric CO2 concentration has risen by nearly 49% compared to pre-industrial times, mainly caused by fossil fuel combustion and cement production. CO2 emission reports under the Paris Agreement are crucial in understanding the main sources responsible for these emissions, and spatial and temporal distributed emission inventories such as EDGAR and ODIAC have been important tools to gain additional insights about when and where these emissions happen. However, increasing the resolution comes with an increment in the uncertainty at sub-annual and sub-national scales. One way to improve the knowledge on these emission inventories is by inverting in situ observations of CO2 and Δ14CO2 at regional scales. Radiocarbon (14C) is the radioactive isotope of carbon, and due to its half-life time of ~5730 years, it is not present in fossil fuels, making it a good tracer for the natural carbon cycle.

In this study, we evaluate the impact of incorporating Δ14CO2 observations from the Integrated Carbon Observation System (ICOS) network and its sampling strategy over Europe into the Lund University Modular Inverse Algorithm (LUMIA) for optimizing fossil CO2 and the biosphere fluxes in a horizontal grid of 0.5° x 0.5° and on a weekly temporal resolution. Δ14CO2 is currently mostly measured in 2-weekly integrated samples. As part of the EU-funded CORSO (CO2MVS Research on Supplementary Observations) Project, an intensive campaign collecting 1-hour flask samples every third day at 10 Western/Central European sampling stations will be performed during 2024. W perform a series of Observing System Simulation Experiments (OSSEs) using various model products (EDGAR/ODIAC, LPJ-GUESS/VPRM) as prior fluxes and as assumed true fluxes for fossil and biosphere fluxes to generate a time series of synthetic observations. We first demonstrate the impact of adding Δ14CO2 observations in addition to the CO2 observations to recover the true fossil and biosphere flux time series and the assumed true total CO2 annual budget over Europe. Further, we assess the impact of the sampling strategy by comparing a simulation using only Δ14CO2 integrated samples against a simulation including the CORSO sampling strategy. In the latter case, we find a notable improvement in recovering the fossil CO2 emissions in Western/Central Europe and countries such as Germany and France. We also evaluate other sampling strategies, such as selecting observations with the largest apportionment of fossil CO2 and the lowest impact of nuclear emissions. Such approaches seem to be a promising way to improve the quantification of fossil CO2 emissions in regions with a dense sampling network and neighbouring regions such as Eastern Europe.

How to cite: Gómez-Ortiz, C., Monteil, G., Karstens, U., Basu, S., and Scholze, M.: Evaluating the impact of using Δ14CO2 observations in quantifying fossil CO2 emissions over Europe, EGU General Assembly 2024, Vienna, Austria, 14–19 Apr 2024, EGU24-10553, https://doi.org/10.5194/egusphere-egu24-10553, 2024.

EGU24-11447 | ECS | Posters on site | AS3.40

Further Cryogenic Separation and Mass Spectrometry Developments: Towards Ambient Air Methane Clumped Isotopes Measurements  

Andrew Houston, Orestis Gazetas, Sara Defratyka, Tim Arnold, and Matthieu Clog

The multiply-substituted isotopologues of methane are of significant interest due to their increased ability to distinguish between methane formation and destruction processes, in comparison to singly-substituted isotopologues, as shown previously by Thiagarajan et al.(2022) and Sivan et al.(2022). Methane isotopologues, unlike the isotopologues of carbon dioxide, do not easily transition towards thermodynamic equilibrium in the atmosphere and therefore, ambient air methane isotopologues, offer constraints on the atmospheric methane sources and sinks (Chung and Arnold, 2021). These processes potentially offer new insight into the causes of variation in methane concentrations in the last two decades.

We present developments in the separation of the components of air, using a helium-cooled cryostat. Working on both pre-concentrated air mixtures and laboratory created gas mixtures, we extract methane from the contaminants and other atmospheric gases using the cryostat, applicable to a minimum methane concentration of ~1% (Stolper et al., 2015), then we analyse using a TFS Ultra HR-IRMS. We demonstrate that our cryostat separations successfully extract methane and krypton from laboratory gas mixtures containing the components of atmospheric air, without causing methane fractionation.

We also present further developments in measuring and calibrating the isotopologues of methane by high-resolution mass spectrometry. We successfully created thermodynamically equilibrated samples of methane in the 250-500oC range using a nickel catalyst and are working on the 1-250oC range using a γ-Al2O3 catalyst (Eldridge et al., 2019). It is essential to have an extensive calibration curve to best constrain the effects of scale compression on the calculated deltas and therefore reduce sources of further error, hence the extension of this calibration range.

Further work will add additional reference and sample points to the absolute reference frame created by the equilibrated samples, optimise the cryogenic/gas chromatographic purification methods for more complex gas mixtures, and optimise the IRMS workflow to reduce the necessary air sample sizes.


References:

  • Chung, E. and Arnold, T., 2021. Potential of clumped isotopes in constraining the global atmospheric methane budget. Global Biogeochemical Cycles, 35(10), p.e2020GB006883.
  • Eldridge, D.L., Korol, R., Lloyd, M.K., Turner, A.C., Webb, M.A., Miller III, T.F. and Stolper, D.A., 2019. Comparison of Experimental vs Theoretical Abundances of 13CH3D and 12CH2D2 for Isotopically Equilibrated Systems from 1 to 500 C. ACS Earth and Space Chemistry, 3(12), pp.2747-2764.
  • Liu, Q., Li, J., Jiang, W., Li, Y., Lin, M., Liu, W., Shuai, Y., Zhang, H., Peng, P. and Xiong, Y., 2024. Application of an absolute reference frame for methane clumped-isotope analyses. Chemical Geology, p.121922.
  • Sivan, M., Röckmann, T., Slomp, C.P., van der Veen, C. and Popa, M.E., 2022, May. Isotopic characterization of methane: insights from clumped isotope (13CDH3 and CD2H2) measurements. In EGU General Assembly Conference Abstracts (pp. EGU22-4029).
  • Stolper, D.A., Martini, A.M., Clog, M., Douglas, P.M., Shusta, S.S., Valentine, D.L., Sessions, A.L. and Eiler, J.M., 2015. Distinguishing and understanding thermogenic and biogenic sources of methane using multiply substituted isotopologues. Geochimica et Cosmochimica Acta, 161, pp.219-247.
  • Thiagarajan, N., Pedersen, J.H., Brunstad, H., Rinna, J., Lepland, A. and Eiler, J., 2022. Clumped isotope constraints on the origins of reservoir methane from the Barents Sea. Petroleum Geoscience, 28(2), pp.petgeo2021-037.

How to cite: Houston, A., Gazetas, O., Defratyka, S., Arnold, T., and Clog, M.: Further Cryogenic Separation and Mass Spectrometry Developments: Towards Ambient Air Methane Clumped Isotopes Measurements , EGU General Assembly 2024, Vienna, Austria, 14–19 Apr 2024, EGU24-11447, https://doi.org/10.5194/egusphere-egu24-11447, 2024.

EGU24-11996 | Posters on site | AS3.40

Production of standard gases for routine calibration of stable isotope ratios of N2 and N2O  

Reinhard Well, Caroline Buchen-Tschiskale, Joachim Burbank, Michael Dannenmann, Dominika Lewicka-Szczebak, Joachim Mohn, Lena Rohe, Clemens Scheer, Salvatore Tuzzeo, and Benjamin Wolf

There is need to calibrate raw data of N2 and N2O isotopocules due to effects of non-linearity, instability, matrix effects and interference with trace gases. Our objective was thus to supply a variety of suitable standard gases for members of the DASIM research unit (www.DASIM.de) and their partners in sufficient amount for routine use to enable calibration for extended time. In total 23 different mixtures were produced to cover all isotopic approaches to study N2 and N2O production and cycling in soils with stable isotopes and suitable for IRMS and laser spectroscopy.

Standards for the 15N gas flux method should mimic mixtures of N2 and N2O emitted from highly 15N enriched nitrate in soil and atmospheric background. These must thus contain unlabelled, single-labelled  as well as double-labelled N2 and N2O.

N2O standards for natural abundance must cover a range of N2O concentrations and isotopocule values typically found in field flux and laboratory incubation studies to correct for non-linearity and bias.

Premixtures were prepared by mixing isotopically enriched or depleted gases which were either commercially available or produced in the lab. Moreover, pure N2O of natural abundance was supplied from a previous project (Mohn et al., 2022, https://doi.org/10.1002/rcm.9296). Premixtures were diluted in artificial atmospheres and compressed in commercial tanks.

We will explain the production of mixtures, give an overview of the manufactured mixtures and show first results of analysis in comparison with ideal values.

How to cite: Well, R., Buchen-Tschiskale, C., Burbank, J., Dannenmann, M., Lewicka-Szczebak, D., Mohn, J., Rohe, L., Scheer, C., Tuzzeo, S., and Wolf, B.: Production of standard gases for routine calibration of stable isotope ratios of N2 and N2O , EGU General Assembly 2024, Vienna, Austria, 14–19 Apr 2024, EGU24-11996, https://doi.org/10.5194/egusphere-egu24-11996, 2024.

EGU24-13083 | ECS | Posters on site | AS3.40

Investigating the impact of COVID-19 on the atmospheric 14C trend and fossil carbon load at urban and background sites in Hungary 

Balázs Áron Baráth, Tamás Varga, István Major, László Haszpra, Danny Vargas, and Mihály Molnár

The global impact of COVID-19 on communities and economies has led to questions about decreasing environmental risks and pollution due to the decreased industrial and transport activity. One of the key concerns revolves about the atmospheric rise in CO2 levels and the associated arising fossil carbon load, constituting the global climate change. The quantification of fossil-origin atmospheric carbon load is addressed through the use of natural radiocarbon (14C), a unique scientific tool. Fossil sources lack 14C activity, while recent biogenic carbon contains radiocarbon. This study centers on revealing long-term trends in atmospheric 14C levels, particularly during the year of the pandemic, in comparison to the preceding five years in Hungary. Atmospheric CO2 and tree rings from the studied six years were subjected to 14C analysis from three distinct locations.

One of the examined cities, Budapest - Hungary's capital - is a highly urbanized land with a reported 1.7 million population. Despite the city's extensive vehicular and human activity, a "state of danger" was in effect in Hungary from March to June 2020 due to the first wave of COVID-19. The sampling sites had been characterized by a busy urban environment, with a mix of vehicular activities contributing to the local atmosphere.

The second urban sampling site is Debrecen, a smaller but evolving city that can be found in the eastern part of Hungary. It’s the second largest Hungarian city - around 200 thousand citizens – and it is currently experiencing an industrial revolution by the construction of major factories. Significant contribution to pollution in this area come from urban vehicular traffic and the surrounding agricultural regions.

The background 14C signal used in the study is from the easternmost Integrated Carbon Observation System(ICOS) atmospheric regional background station (HUN) and NOAA background site, at Hegyhátsál. Mole fraction has been continuously monitored at four elevations at HUN station since September 1994. For this research integrated atmospheric 14CO2 samples, supplemented with CO2 mole fraction measurements, were used from October 2014 to December 2020. The data was studied from the aspect of temporal variation and altitudinal differences. CO2 mole fraction data of the free tropospheric background ICOS station at Jungfraujoch (Switzerland) were used. The outcomes of the trend analysis reveal the fluctuations in atmospheric fossil carbon load throughout the pandemic, which offers valuable insights into the environmental effects of reduced human activities in Hungary.

Prepared with the professional support of the Doctoral Student Scholarship Program of the Co-operative Doctoral Program of the Ministry of Innovation and Technology financed from the National Research, Development and Innovation Fund and supported by the PARIS project (Grant Agreement No. 820846), which is funded by the European Commission through the Horizon 2020 research programme.

How to cite: Baráth, B. Á., Varga, T., Major, I., Haszpra, L., Vargas, D., and Molnár, M.: Investigating the impact of COVID-19 on the atmospheric 14C trend and fossil carbon load at urban and background sites in Hungary, EGU General Assembly 2024, Vienna, Austria, 14–19 Apr 2024, EGU24-13083, https://doi.org/10.5194/egusphere-egu24-13083, 2024.

Observations indicate accelerating growth of atmospheric CH4, creating a challenge for meeting the Global Methane Pledge that aims to achieve 30% cuts in global emissions by 2030. A recent UNEP report proposes that feasible CH4 emission cuts could result in a 45% reduction in anthropogenic emissions, avoiding 0.3 ºC of warming by mid-century while having a positive impact on human health through air quality improvements. However, given that the most feasible methane emissions reductions are in the oil and gas sector, it will be difficult to achieve the goals of the Global Methane Pledge with current signatories without also considering emissions from agriculture and waste. It is therefore important to be able to quantify and monitor anthropogenic and natural microbial emissions.

Measurements of the 13C stable isotope of CH4 could be useful for partitioning emissions between fossil fuel and microbial sources, and global analyses imply that recent increases in atmospheric growth are dominated by microbial sources. Atmospheric observations of methane and 13CH4 were used to constrain the NOAA CarbonTracker-CH4 inversion modeling system. Results show that the largest share of recent growth in CH4 is due to increasing microbial and fossil fuel emissions in the developing economies of Asia. A smaller contribution to the recent growth in atmospheric CH4 is also from increasing microbial emissions in tropical South America and Africa, possibly a combination of emissions from natural wetlands and agriculture. At global scale there is little change in fossil fuel emissions, however this result is highly dependent in how stable isotope measurements are used in the inversion. In this presentation we highlight uncertainties associated with using isotope measurements and how they affect our understanding of the atmospheric methane budget.

How to cite: Bruhwiler, L. and Oh, Y.: What do we learn about regional and global methane budgets using stable methane isotope measurements in a global inverse model?, EGU General Assembly 2024, Vienna, Austria, 14–19 Apr 2024, EGU24-13985, https://doi.org/10.5194/egusphere-egu24-13985, 2024.

EGU24-14041 | ECS | Posters on site | AS3.40

Thirty-two years of high precision data on the stable isotopes of carbon dioxide from a successful collaboration between NOAA and INSTAAR  

Sylvia Englund Michel, Pieter Tans, John Miller, John Ortega, Kerstin Braun, Taline Leon, Bruce Vaughn, Reid Clark, Jianghanyang Li, and James White

Monitoring the long-term changes in the stable carbon isotope ratio of carbon dioxide (expressed as δ13C-CO2) is a useful tool to track the fate of atmospheric CO2 and variations in the global carbon cycle. Due to the small but significant change in global mean atmospheric δ13C-CO2 of approximately -0.75‰ over the last three decades, a robust and traceable method is required to track the long-term change in δ13C-CO2 globally. The Stable Isotope Lab at the INSTAAR of the University of Colorado Boulder has been partnering with NOAA’s Global Monitoring Laboratory since 1990 to measure CO2 stable isotopes within the Global Greenhouse Gas Reference Network. Here, we present our latest data product, globally distributed observations of δ13C-CO2 in the past 32 years. We have improved our traceability by moving our data onto the CO2 -in-air JRAS-06 isotopic scale (a representation of V-PDB). We also have established robust quality management systems and have improved our methods of quantifying uncertainty.  Our data demonstrate how the interactions among the atmosphere, the biosphere and anthropogenic activities had been recorded in δ13C-CO2 from more than 70 sites worldwide. The data reveal distinct seasonal variations of δ13C-CO2 that change with latitude, highlighting spatial differences in the influence of anthropogenic activities, net photosynthesis, and ocean-atmosphere CO2 exchange. Long-term observations also show that the spatiotemporal patterns of δ13C-CO2 vary interannually, which is mainly related to the impact of climate variability on the terrestrial biosphere. We are actively engaged in using these data in complex modeling frameworks to better understand the inter-relationships between climate and the global carbon cycle.

How to cite: Michel, S. E., Tans, P., Miller, J., Ortega, J., Braun, K., Leon, T., Vaughn, B., Clark, R., Li, J., and White, J.: Thirty-two years of high precision data on the stable isotopes of carbon dioxide from a successful collaboration between NOAA and INSTAAR , EGU General Assembly 2024, Vienna, Austria, 14–19 Apr 2024, EGU24-14041, https://doi.org/10.5194/egusphere-egu24-14041, 2024.

EGU24-15126 | ECS | Posters on site | AS3.40

Advances in clumped isotope measurements of nitrous oxide by laser spectroscopy 

Paul Magyar, Ivan Prokhorov, Simone Brunamonti, Noémy Chénier, Lukas Emmenegger, Béla Tuzson, and Joachim Mohn

Nitrous oxide (N2O), a greenhouse gas and ozone-depleting molecule with a 116-year atmospheric lifetime, is accumulating in the atmosphere at an accelerating pace. While it is known that the conversion of anthropogenic nitrogen pollutants to N2O by the environmental nitrogen cycle predominately drives this accumulation, essential questions remain regarding the spatial and temporal balance of N2O production and consumption. Stable isotope measurements of δ15N, δ18O, and 15N site preference (SP) in N2O provide valuable constraints on its sources and sinks. Given the complex array of nitrogen cycle processes and their overlapping isotopic signatures, they are often not sufficient to deconvolve them completely. The ‘clumped’, or multiply-substituted, isotopologues 14N15N18O, 15N14N18O, and 15N15N16O provide three additional independent constraints on N2O sources and processing, with potential to provide insight into source partitioning and reaction mechanisms.

Spectroscopic approaches have emerged as central tools for quantification of N2O isotopes in atmospheric and environmental samples due to their sensitivity, suitability for continuous or on-site measurement, and isotopologue-specificity. We present an updated approach to the measurement of the eight most abundant isotopic variants of nitrous oxide, including these rare clumped isotopologues, using a quantum cascade laser absorption spectrometer with a 36 m multipass cell. A dual-laser system offers the opportunity to choose a pair of spectral windows that contains strong ro-vibrational absorption lines of the rarest isotopologues, enabling precise clumped isotope ratio measurements on relatively small (<10 µmol) sample amounts. Samples are introduced to the spectrometer and compared to reference materials through a customized gas inlet system, which enables fast switching between samples and references, thereby maximizing reproducibility and sample throughput. Nitrous oxide heated in the presence of γ-alumina at 200 ºC has previously been found to approach equilibrium compositions of 15N14N18O, 14N15N18O, and SP. We constrain the controls on this catalytic reaction by varying temperature, pressure, substrate and catalyst concentrations, and catalyst activation conditions; and we confirm the equilibrium nature of this reaction under various conditions by heating reference gases prepared gravimetrically to have 15N14N18O, 14N15N18O, 15N15N16O, and 14N14N18O elevated above natural abundances. Finally, equilibrating N2O at several distinct temperatures gives multiple anchor points to an absolute reference scale for clumped and position-specific isotope measurements, enabling future measurement of samples from natural sources.

How to cite: Magyar, P., Prokhorov, I., Brunamonti, S., Chénier, N., Emmenegger, L., Tuzson, B., and Mohn, J.: Advances in clumped isotope measurements of nitrous oxide by laser spectroscopy, EGU General Assembly 2024, Vienna, Austria, 14–19 Apr 2024, EGU24-15126, https://doi.org/10.5194/egusphere-egu24-15126, 2024.

EGU24-16736 | Posters on site | AS3.40

Measurement of atmospheric methane and ethane at a suburban site using mid-IR absorption spectroscopy 

Joachim Mohn, Kerstin Zeyer, Michelle J Müller, Paul Schlauri, Martin K. Vollmer, Daniela Brito Melo, and Stephan Henne

Methane (CH4) is the second most significant greenhouse gas after carbon dioxide. The concentration of methane in the atmosphere has been continuously increasing for several years and is currently at almost 2000 ppb. Methane emissions arise from a variable mix of thermogenic sources, such as oil, natural gas, and coal mining, or biogenic sources, such as wetlands and agriculture. Co-emitted gases such as ethane (C2H6) and other hydrocarbons can be utilised as a tracer to discern thermogenic (co-emission of ethane) and biogenic (no ethane is emitted) methane sources (Commane et al., 2023, https://doi.org/10.5194/amt-16-1431-2023).

Ethane concentrations in the Northern hemisphere were decreasing between 1970 and 2010, which was attributed to better emission controls from oil and gas production, storage, and distribution, as well as exhaust emissions from cars and trucks. However, emissions are currently on the rise once again, linked to additional emissions from oil and gas production for example from the Eastern USA, (D Helmig et al., 2016, https://doi.org/10.1038/ngeo2721).

In November 2023 we started CH4 / C2H6 measurements in ambient air from a rooftop air inlet (approx. 15 m above ground) at the Empa research campus in Dübendorf, Switzerland using a MIRA Ultra analyser (AERIS Technologies, USA). To correct for drift effects and to calibrate the analyser, two cylinders of compressed air were analysed in regular time intervals. To minimize interferences of water vapour, sample and calibration gases were dehumidified. Concentration measurements were compared to results of a CRDS analyser (model 2401, Picarro, USA) for CH4 and to a GC-MS system (model 5975C, Agilent Technologies, USA) for C2H6.

Compressed air measurements demonstrate that the MIRA Ultra gas analyser meets the manufacturer's specifications of sensitivity for CH4 and C2H6 of < 1 ppb/s and < 500 ppt/s, respectively. We will present a comparison of C2H6/CH4 data from the MIRA ULTRA analyser and GC-MS / CRDS. We foresee to complement CH4/C2H6 measurements with CH4 isotope analysis (δ13C, δD-CH4) by TREX-QCLAS and relate temporal variations to differences in CH4 source contributions by means of FLEXPART simulations.

How to cite: Mohn, J., Zeyer, K., Müller, M. J., Schlauri, P., Vollmer, M. K., Brito Melo, D., and Henne, S.: Measurement of atmospheric methane and ethane at a suburban site using mid-IR absorption spectroscopy, EGU General Assembly 2024, Vienna, Austria, 14–19 Apr 2024, EGU24-16736, https://doi.org/10.5194/egusphere-egu24-16736, 2024.

EGU24-16750 | ECS | Orals | AS3.40

A high resolution gridded European Atmospheric Potential Oxygen (APO) inventory 2005 - 2020 

Marya el Malki, Antoon Visschedijk, and Hugo Denier van der Gon

Accurately attributing CO2 emissions is key to mitigating greenhouse gas (GHG) emissions under the European Green Deal. However, this poses significant challenges. To this end, the CO2MVS Research on Supplementary Observations (CORSO) project will support establishing the new European anthropogenic CO2 emissions Monitoring and Verification Support capacity (CO2MVS), which is being implemented within the Copernicus Atmosphere Monitoring Service (CAMS). To better separate the contribution of fossil fuels and natural sources to atmospheric CO2 emissions, CORSO will be using supplementary observations focused on co-emitted species, as well as other auxiliary observations, such as gaseous tracers. One such tracer is Atmospheric Potential Oxygen (APO), that integrates both emitted CO2 and the corresponding O2 uptake through the derivation of an oxidative ratio (OR). Here we present  the development and further refinement of a regional APO inventory that spans the European domain from 2005 to 2020 at a resolution of 6 x 6 km. The inventory builds upon earlier work conducted under the CO2 Human Emissions (CHE) project for the year 2015, leveraging CO2 and co-emitted species emissions from the CAMS-REG-v4 dataset produced by TNO. It expands on the methodology used to develop the COFFEE global dataset (Steinbach et al., 2011) by introducing several improvements. Oxygen consumption from fossil fuel combustion is dominated by CO2 but we also incorporated the O2 uptake from the production of the co-emitted species NOx, CO and SOx. Furthermore, the oxidative ratios associated with sea shipping are refined using detailed fuel classification data from the Finnish Meteorological Institute (FMI). We will compare the results against global APO datasets, including COFFEE and GridFED, and drawing conclusions on consistency across the different inventories. Finally, we aim to collaborate closely with end-users of the inventory under the CORSO project, to assess the interpretability of results and ascertain the dataset’s relevance in supporting robust modelling practices. Through these refinements, we aim to contribute to the growing body of knowledge dedicated to more accurately quantify anthropogenic CO2 emissions, to help inform effective policies that support nations in achieving their objectives under the European Green Deal.

How to cite: el Malki, M., Visschedijk, A., and Denier van der Gon, H.: A high resolution gridded European Atmospheric Potential Oxygen (APO) inventory 2005 - 2020, EGU General Assembly 2024, Vienna, Austria, 14–19 Apr 2024, EGU24-16750, https://doi.org/10.5194/egusphere-egu24-16750, 2024.

EGU24-17480 | ECS | Posters on site | AS3.40

Challenges in N2O isotope measurements using CRDS analysers 

Julius Havsteen, Mehr Fatima, Simone Brunamonti, Thomas Hausmaninger, Andrea Pogány, Reinhard Well, and Joachim Mohn

Nitrous oxide (N2O) has a significant global warming potential of about 300 times that of CO2 and a steadily rising atmospheric concentration. Therefore, understanding N2O production and consumption pathways in major source ecosystems, such as agricultural soils, coupled with accurate quantification of associated N2O emissions, is critically important in the context of climate change.

The relative abundance of 15N and 18O substituted N2O isotopocules (e.g.,14N15N16O, 15N14N16O, 14N14N18O) to the predominant isotopic form (14N14N16O) serves as valuable tracers for the distinction between important biogeochemical soil processes, such as nitrification and denitrification, which in turn enhances our understanding of N2O emissions. In this regard, advances in cavity-ring-down-spectroscopy (CRDS) have enabled precise measurement of isotopic species in ambient N2O, which holds key advantages over isotope ratio mass spectrometry in its ability to measure online, on-site and site-specific with respect to 15N substitution in the N2O-molecule.

Despite the CRDS technique's ease in measuring the isotopic composition of N2O-isotopocules, the apparent isotope data requires significant post-processing, since spectral fitting is controlled by a complex interplay between fundamental physical parameters, instrumental parameters, gas matrix composition, instrumental drift, and fitting algorithms, some of which also depend on the absolute N2O concentration. Therefore, to retrieve accurate and comparable results, it is necessary to apply appropriate reference gases with minimal differences in gas composition to the sample in the measurement sequence. Remaining deviations between sample and reference have to be post-corrected using predefined, analyser-specific correction functions.

This work provides a comprehensive and detailed correction and calibration protocol, exemplified by the reduction of N2O isotopic data obtained from a Picarro G5131-i isotopic and gas concentration analyser. This protocol outlines the theoretical and mathematical framework for the necessary corrections and suggests a logical order for applying these corrections. Moreover, the protocol provides a standalone MATLAB code for streamlined and automatic data reduction that can be employed once the required analyser-specific correction functions are established. The developed algorithms were validated on a suite of target gases, which accounts for concentration-based interferences from various species.

With this protocol, we aim to enable researchers to accurately and efficiently acquire high-quality N2O isotope data from CRDS instruments and similar devices and contribute to standardized community guidelines for post-processing N2O isotope data. In a prototype application, we analysed N2O from automated flux chambers to track biogeochemical processes in agricultural soils. Subsequently, these insights will be integrated into soil biogeochemical models, to enable upscaling of emission data.

How to cite: Havsteen, J., Fatima, M., Brunamonti, S., Hausmaninger, T., Pogány, A., Well, R., and Mohn, J.: Challenges in N2O isotope measurements using CRDS analysers, EGU General Assembly 2024, Vienna, Austria, 14–19 Apr 2024, EGU24-17480, https://doi.org/10.5194/egusphere-egu24-17480, 2024.

EGU24-17623 | Posters on site | AS3.40

Calibration uncertainty of optical isotope ratio spectroscopy measurements of methane and field comparison with mass spectrometry 

Christopher Rennick, Cameron Yeo, Freya Wilson, Emmal Safi, Emily Hopkinson, Aimee Hillier, Ruth Pearce, James France, Mathias Lanoiselle, David Lowry, and Tim Arnold

The stable isotopic signatures of atmospheric methane (CH4) – carbon δ 13C(CH4) and hydrogen δ 2H(CH4) – are tracers that can help distinguish the relative contributions from different emissions sources. Optical isotope ratio spectrometers (OIRS) deployed at atmospheric monitoring stations have the capability for continuous measurements, providing time series data that can complement sampling campaigns using isotope ratio mass spectrometry (IRMS). OIRS instruments, however, require larger volumes of calibration gases than IRMS and the measurement is of the isotopologues directly (12CH4, 13CH4 and 12CH3D) rather than conversion to CO2 and H2. Here, we demonstrate the calibration method for Boreas, a preconcentrator-OIRS system deployed at an atmospheric monitoring station in the South of England and show that these measurements are compatible with those made by IRMS. Measurements with Boreas are referenced to a whole air working standard that is sampled in sequence with air, following the principle of identical treatment. We show the results of a field comparison to IRMS measurements of bag samples taken from the same air inlet simultaneously with the preconcentrator.

The calibration method uses mixtures prepared gravimetrically at a range of amount fractions from a single high-purity CH4 parent that has been characterised for δ 13C and δ 2H by IRMS. This method is capable of calibration over a wide range of amount fraction and isotopic composition. A rigorously derived uncertainty budget shows that the major contributions are from the uncertainty in the assignment of δ 13C and δ 2H of the methane parent and the spectrometer, with minimal contribution from uncertainty in the amount fraction of the standards.

How to cite: Rennick, C., Yeo, C., Wilson, F., Safi, E., Hopkinson, E., Hillier, A., Pearce, R., France, J., Lanoiselle, M., Lowry, D., and Arnold, T.: Calibration uncertainty of optical isotope ratio spectroscopy measurements of methane and field comparison with mass spectrometry, EGU General Assembly 2024, Vienna, Austria, 14–19 Apr 2024, EGU24-17623, https://doi.org/10.5194/egusphere-egu24-17623, 2024.

EGU24-18380 | Orals | AS3.40

Carbon isotope measurements of methane for UK sources: spatial and temporal changes and implications for inventories and model inputs 

David Lowry, Rebecca Fisher, James France, Mathias Lanoisellé, Semra Bakkaloglu, Julianne Fernandez, Giulia Zazzeri, Aliah al-Shalan, Ceres Woolley Maisch, and Euan Nisbet

The carbon isotopic signature (ð13C) of CH4 fugitive emissions to atmosphere has been measured in downwind plumes from nearly 400 sources in the United Kingdom by the RHUL group since first measurements of the natural gas supply in 1998. The isotopic measurements have the ability to distinguish the main source categories, separating combustion, fossil fuels, waste and agriculture. Further isotopic subdivisions are possible between solid and gaseous fuels, and between different types and methods of waste processing, such that signatures can be assigned to the categories used for the UK reporting to UNFCCC and in production of mapped inventory products.

For many source categories the current spread of ð13C signatures is small, such as onshore natural gas distribution at -39.3 ±2.6‰ (171), or landfill sites at -57.1 ±2.5‰ (54). This has allowed production of isotopic prediction maps and an assessment of the changing source mix isotopic signature emitted by the UK, which contributes to long-range transport and eventually the changing signatures recorded at background measurement sites. The predicted ð13C for averaged UK emission of CH4 changed from -50.5‰ in 1990 to -59.3‰ in 2021 based on the most recent NAEI inventory. Approximately 75% of this 13C depletion is explained by changing proportions of the different sources, particularly emissions reduction from coal mining, landfill sites and gas leaks, but 25% is the result of changing signatures within source categories, particularly in gas distribution with the switch from southern North Sea fields to sources further north, and from changes in landfill practice. This signature is depleted by 3‰ compared to the lowest signature calculated by Miller-Tans analysis of multi-year UK background records, suggesting discrepancies between actual emissions and the inventory source mix. Isotopic mass balance of sources to match observations would require additional fossil fuel emissions, unless there are enrichments rather than depletions occurring in other source sectors.

Changes to sources in the last decade, particularly within the agricultural sector and agricultural waste, has created added complexities to the sector isotopic separations and potential isotopic enrichments. These include C4 plant supplements to diets of animals such as maize that enriches the eructation in 13C, whereas the grass-fed and sustainable cattle have a tightly constrained eructation ð13C signature of -70.5 ±1.7‰ (14). Even more extreme is the range of signatures generated by the burgeoning ‘green’ biogas industry fed by energy crops such as maize at one end of the spectrum with ð13C up to -35‰ to NH3-mediated CH4 production from chicken waste feedstock with signatures around -80‰. Surveys in 2023 highlighted emissions underestimation and the preponderance of maize use in this expanding sector. New isotopic data changed the assigned sector source signature by +1.5‰.

How to cite: Lowry, D., Fisher, R., France, J., Lanoisellé, M., Bakkaloglu, S., Fernandez, J., Zazzeri, G., al-Shalan, A., Woolley Maisch, C., and Nisbet, E.: Carbon isotope measurements of methane for UK sources: spatial and temporal changes and implications for inventories and model inputs, EGU General Assembly 2024, Vienna, Austria, 14–19 Apr 2024, EGU24-18380, https://doi.org/10.5194/egusphere-egu24-18380, 2024.

EGU24-18802 | Posters on site | AS3.40

Quantifying and empirically correcting apparent gas matrix effects:Example measurements for two CRDS analyzers for CO2 and CH4 amount fractions and 13/12C isotope ratios  

Javis A. Nwaboh, Jelka Braden-Behrens, Anas Emad, Henning Bohlius, and Volker Ebert

Accurate measurements of amount fractions and isotopic compositions of greenhouse gas such as carbon dioxide (CO2) and methane (CH4) provide valuable insights on their atmospheric composition and origin. Commonly used field deployable commercial laser spectrometers that measure amount fractions and isotopic ratios are often calibrated with reference gases with certified amount fractions and/or isotopic composition. Reference gases, also known as calibration reference materials (CRMs), can be for example synthetic mixtures of e.g. CO2 in N2, where the gas matrix N2 does not match that of the sample (e.g. ambient air) to be measured. A mismatch in the composition of the gas matrix of a CRM and sample can lead to a considerable bias in the amount fraction or isotopic ratio results of the sample due to changes in the measured spectra which e.g. are not perfectly captured by the analysers’ fitting routine.

In this work, we demonstrate the quantification of matrix effects for two commercial CRDS analysers measuring CO2 and CH4 amount fractions and isotope ratios. In our experiments with synthetic air gas matrix where the O2 concentration was varied, we measured (for a 1 % change in the O2 concentration in the gas matrix) a relative change of 0.15 % for the amount fractions of two major CO2 isotopologues and 0.07 % for the amount fractions of two major CH4 isotopologues. Similarly, in terms of isotopic δ13C values, we found matrix effects larger than 0.2 for both CO2 and CH4. We present options for correcting the gas matrix effects and discuss the underlying assumptions made during the analysis. Amount fraction results for CO2 and CH4 are reported including δ13C isotope ratio results. Our work concludes that a matrix mismatch when using a commercial laser spectrometer can lead to considerable biases in amount fraction and isotope ratio results, and appropriate correction approaches have to be applied in order to achieve accurate and reliable results.

Acknowledgements: This work has received partial funding from the EMPIR programme (19ENV05 STELLAR project) co-financed by the Participating States and from the European Union's Horizon 2020 research and innovation programme. Part of this work has also received funding from the European Partnership on Metrology (21GRD04 isoMET project), co-financed from the European Union’s Horizon Europe Research and Innovation Programme and by the Participating States. 


How to cite: Nwaboh, J. A., Braden-Behrens, J., Emad, A., Bohlius, H., and Ebert, V.: Quantifying and empirically correcting apparent gas matrix effects:Example measurements for two CRDS analyzers for CO2 and CH4 amount fractions and 13/12C isotope ratios , EGU General Assembly 2024, Vienna, Austria, 14–19 Apr 2024, EGU24-18802, https://doi.org/10.5194/egusphere-egu24-18802, 2024.

EGU24-19065 | Posters on site | AS3.40

Source apportionment of methane using δ13C and δ2H  

Rebecca Fisher, Ceres Woolley Maisch, Dave Lowry, James France, Julianne Fernandez, Nicola Warwick, and Euan Nisbet

Use of both δ13C and δ2H measurements can be used to constrain methane sources. δ13C isotopes have been used to help identify the reasons for the continued growth in atmospheric methane, which since 2007 has coincided with a decline in δ13C. δ2H could offer a third dimension to help constrain the global methane budget, but its use has been limited because less data are available. There is a need for better identification of δ2H isotopic source signatures, and more long-term atmospheric data records.

We present results of field campaigns carried out in a variety of source regions to characterise isotopic signatures and consider complexities in constraining source signatures for some categories. We also consider use of methane isotopic measurements at different scales for source partitioning.

The isotopic signatures of urban emissions of methane have been characterised in London, Bucharest and Ho Chi Minh City. Methane sources in these cities are very different, with emissions being mostly from gas leaks in London, from wastewater and gas leaks in Bucharest, and from waste and traffic in Ho Chi Minh City.

Measurements of cattle methane emissions in Jersey and Kenya show different isotopic signatures in methane from manure and eructation. Cattle diet, the age of manure and waste management practices cause variability in the isotopic signature of emitted methane.

Wetland methane emissions from sites across Finland and Canada were collected in summer 2022. The Finnish boreal wetland methane isotopic signatures were δ2H -326 ± 19 ‰ and δ13C -68 ± 4 ‰, comparable with the results from Canada. Both δ2H and δ13C  in methane from boreal wetlands tends to be more depleted in the heavier isotope than in tropical wetland methane emissions.

Both δ13C and δ2H can be used in the UM-UKCA chemistry climate model which includes multiple methane tracers tagged by isotopic composition and source type. It is hoped that better characterisation of the regional variability in isotopic signatures of some sources will help improve the ability to model the global methane budget.

How to cite: Fisher, R., Woolley Maisch, C., Lowry, D., France, J., Fernandez, J., Warwick, N., and Nisbet, E.: Source apportionment of methane using δ13C and δ2H , EGU General Assembly 2024, Vienna, Austria, 14–19 Apr 2024, EGU24-19065, https://doi.org/10.5194/egusphere-egu24-19065, 2024.

EGU24-19775 | ECS | Posters on site | AS3.40

Use of multiple atmospheric chemistry transport models to interpret high frequency methane isotope ratio measurements at independently managed sites 

Eunchong Chung, Tim Arnold, Chris Rennick, Emmal Safi, Dafina Kikaj, Brett Thornton, Alistair Manning, Stephan Henne, Anita Ganesan, and Ute Karstens

Greenhouse gas (GHG) emissions require accurate quantification for the development of effective mitigation strategies. Top-down methods to estimate GHG emissions combine ambient GHG measurements, atmospheric chemical transport models (ACTMs), and prior independent information on what is understood of fluxes (including isotopic source signatures where applicable). High frequency stable isotope ratio measurements of δ13C-CH4 and δH-CH4 have potential to help differentiate changes in the sources of CH4 emissions at regional scales. While independent efforts to make in situ, high frequency observations are being made at multiple locations, currently there is no network of harmonised measurements across Europe (with each site using different calibration and traceability strategies tailored to their specific analytical setup).


In this work we study CH4 isotope ratio measurements made at independently managed sites (Heathfield, UK; Heidelberg, Germany; and Zeppelin, Norway) using three different combinations of ACTMs and associated meteorology: NAME with the UK Met Office Unified Model; FLEXPART with ECMWF IFS analysis and short-term forecasts; and STILT with ECMWF IFS analysis and short-term forecasts. The use of multiple models aims to investigate the magnitude of simulated differences to evaluate model uncertainty in this system. We will demonstrate the extent to which model simulations can be used to investigate analytical problems (e.g. measurement offsets between sites) as well as provide initial results on the potential for a network of high-frequency in situ isotope ratio measurements to understand changes in European CH4 emissions over the coming decades.

How to cite: Chung, E., Arnold, T., Rennick, C., Safi, E., Kikaj, D., Thornton, B., Manning, A., Henne, S., Ganesan, A., and Karstens, U.: Use of multiple atmospheric chemistry transport models to interpret high frequency methane isotope ratio measurements at independently managed sites, EGU General Assembly 2024, Vienna, Austria, 14–19 Apr 2024, EGU24-19775, https://doi.org/10.5194/egusphere-egu24-19775, 2024.

EGU24-19794 | ECS | Orals | AS3.40

Towards a better understanding of the constraints and biases of atmospheric methane inversions 

Bibhasvata Dasgupta, Malika Menoud, Carina van der Veen, Ceres Maisch, James France, Stephen Platt, Cathrine Myhre, Ingeborg Levin, Heiko Moossen, Sylvia Michel, Sudhanshu Pandey, Sander Houwelling, Nicola Warwick, Euan Nisbet, Ryo Fujita, and Thomas Roeckmann

Atmospheric models, ranging from simple box models to advanced 3-D transport models, play a crucial role in interpreting observations related to atmospheric pollution and global warming. Their ubiquitous use has provided valuable insights, yet understanding the trade-offs and benefits of model complexity requires careful consideration, as the specific limitations and advantages depend on the application at hand. In an attempt to monitor atmospheric levels of methane with a 2-box inversion model, powered by global CAMS inventories for 5 major emission categories namely Agriculture, Wetlands, Pyrogenic, Fossils and Waste, sink specific lifetimes for troposphere, stratosphere and soil, hemispheric gradients and 40 years of polar observations of methane mole fraction and isotope composition from 10 stations, we identified several caveats of the methane budget. This work investigates the production and consumption of methane at source and sinks respectively, by the optimization of either CH4 emissions exclusively or both emissions and the isotopic signatures from the five emission categories. In addition, the significance of model parameters such as source isotopic composition, sink kinetic isotopic effects, errors associated with emissions and isotopic measurements, as well as model spin-up/spin-down criteria and the mutual controls of the tracers are evaluated to understand the dynamics of the atmospheric methane cycle. Incorporation of δ2H alongside methane mole fraction (χ(CH4)) and δ13C into inversion models has improved our understanding of the methane sources and sinks significantly, however the simplifications and assumptions need to be tested for model sensitivity to yield more accurate results as well as build more robust models. 

How to cite: Dasgupta, B., Menoud, M., van der Veen, C., Maisch, C., France, J., Platt, S., Myhre, C., Levin, I., Moossen, H., Michel, S., Pandey, S., Houwelling, S., Warwick, N., Nisbet, E., Fujita, R., and Roeckmann, T.: Towards a better understanding of the constraints and biases of atmospheric methane inversions, EGU General Assembly 2024, Vienna, Austria, 14–19 Apr 2024, EGU24-19794, https://doi.org/10.5194/egusphere-egu24-19794, 2024.

EGU24-20557 | Posters on site | AS3.40

Isotope Analysis as a tool for climate metrology at PTB: a novel approach to oxygen-17 correction 

Olav Werhahn, Lukas Flierl, and Olaf Rienitz

The isotopic composition of carbon dioxide is a powerful tool in many scientific areas and normally reported as isotope δ’s, viz. δ13CVPDB in case of carbon and δ18OVPDB-CO2 in case of oxygen. These two isotopic quantities must be calculated from the measured molecular quantities. This includes an 17O correction, which is an important step in data evaluation. Due to the measurement conditions, typically available experimental information is insufficient on 17Oand the calculative correction must be done iteratively. The fact that there is no analytical solution complicates the calculation of δ13CVPDB and δ18OVPDB-CO2 as well as the calcuation of the associated uncertainties. Therefore, Brand et al. [1] suggested a linear approximation which performs quite well. Moreover, Brand et al. presented a simplified scheme for uncertainty estimation. Here, we present an alternative approximation [2] which outperforms the established one leading to much smaller deviations from the exact solutions and to uncertainty calculations according to the Guide to the Expression of Uncertainty in Measurement (GUM) [3]. These approximations are implemented in an EXCEL Add-in, which allows potential users to gain full control over their data evaluation and to check the data received from commercial IRMS software in a spreadsheet.

This work is embedded in PTB’s commitment to the metrology for environment and climate which is overseen by the Innovation Cluster Environment & Climate [4].

References

[1]

W. A. Brand, S. S. Assonov und T. B. Coplen, „Correction for the 17O interference in δ(¹³C) measurements when analyzing CO₂ with stable isotope mass spectrometry (IUPAC Technical Report),“ Pure Appl. Chem., Bd. 82, p. 1719–1733, January 2010.

[2]

L. Flierl und O. Rienitz, „OCEAN – an EXCEL Add-in for 17O Correction using a novel Approximation,“ MethodsX, p. 102529, 2023.

[3]

Joint Committee for Guides in Metrology, „JCGM 100: Evaluation of Measurement Data - Guide to the Expression of Uncertainty in Measurement,“ 2008.

[4]

Physikalisch-Technische Bundesanstalt, „Innovation Cluster Environment & Climate,“ [Online]. Available: https://www.ptb.de/cms/en/research-development/ptbs-innovation-clusters/innovationscluster-umwelt-klima.html.


How to cite: Werhahn, O., Flierl, L., and Rienitz, O.: Isotope Analysis as a tool for climate metrology at PTB: a novel approach to oxygen-17 correction, EGU General Assembly 2024, Vienna, Austria, 14–19 Apr 2024, EGU24-20557, https://doi.org/10.5194/egusphere-egu24-20557, 2024.

EGU24-20560 | ECS | Posters on site | AS3.40

The isoMET project on ambient CH4 monitoring, source signature information and modelling 

Mehr Fatima, Javis Nwaboh, Joachim Mohn, Tim Arnold, and Volker Ebert

Methane (CH4) is a greenhouse gas (GHG) with both anthropogenic and natural sources. It also contributes to air quality problems through its role in tropospheric ozone formation. Key source categories of anthropogenic CH4 emissions in Europe are the agricultural sector (~50 %), waste (~22 %), and energy (~15 %), which makes them the focus of intense research for developing mitigation actions. Stable isotope ratio measurement in CH4 provide the information needed to verify emissions by source type. To provide comparable and accurate atmospheric CH4 isotope ratios, there is an increasing need to develop metrological harmonized measurements protocols and procedures. In addition, there is a lack of a metrological infrastructure for source signature information needed to interpret atmospheric isotope ratio measurements, as well as an assessment of uncertainties in atmospheric transport models and inverse estimates of Europe's CH4 emissions.

Here, we present the isoMET project that aims to (a) develop a harmonised in situ CH4 isotope dataset of ambient air in Europe to resolve compatibility issues of measurements of δ13C or δ2H in CH4 across multiple laboratories, b) develop a sustainable metrological infrastructure for a dataset for δ13C(CH4) and δ2H(CH4)-emissions source measurements in Europe and to evaluate the potential for source apportionment through clumped isotopes, c) use atmospheric chemistry transport modelling to inform the work in (a) and (b), creating estimates of the minimum measurement requirements for deployed instruments.


References

[1] isoMET project available at: https://www.npl.co.uk/21grd04-isomet

[2] J. A. Nwaboh, J. Mohn, M. Fatima, T. Arnold, V. Ebert, Metrology for European emissions verification on methane isotopes (isoMET), CCQM GAWG-IRWG Workshop on Carbon Dioxide and Methane Stable Isotope Ratio Measurements, LATU (Uruguay), 2023

Acknowledgements: The project 21GRD04 isoMET project has received funding from the European Partnership on Metrology, co-financed from the European Union’s Horizon Europe Research and Innovation Programme and by the Participating States.  Empa has received funding from the Swiss State Secretaritat for Education, Research and Innovation (SERI).


How to cite: Fatima, M., Nwaboh, J., Mohn, J., Arnold, T., and Ebert, V.: The isoMET project on ambient CH4 monitoring, source signature information and modelling, EGU General Assembly 2024, Vienna, Austria, 14–19 Apr 2024, EGU24-20560, https://doi.org/10.5194/egusphere-egu24-20560, 2024.

Top-down constraints of CO2 emissions from coal-fired power plants are critical to improving the accuracy of CO2 emission inventory and designing carbon reduction strategies. Different top-down models based on satellite observation have been proposed in previous studies, but discrepancies between these models and the underlying drivers are rarely explored, limiting the confidence of their application to monitor point-source CO2 emissions from satellite. Here, we apply three top-down models to estimate CO2 emissions from individual coal-fired power plants in the United States (US) and China in 2014-2021 from Orbiting Carbon Observatory 2 (OCO-2) satellite observations. The first one applies the Gaussian plume model to optimize emissions by fitting modeled CO2 enhancement to the observation. The second and third methods apply the same inversion framework, but with WRF-Chem and WRF-FLEXPART as forward models, respectively. We evaluate consistency between the three methods in estimating emissions of 10 power plants in the US, using daily reported values from the US Environmental Protection Agency (EPA) as a benchmark, and then apply the three methods to quantify emissions of 13 power plants in China. Results show that the WRF-Chem and WRF-FLEXPART based inversion results are more consistent with the EPA reported emission rates compared to the Gaussian plume model method, with correlation coefficients of 0.76 and 0.89 and mean biases of 4.06 and 3.22 ktCO2/d relative to EPA reports at 10 power plants, respectively. This is because application of high-resolution three-dimensional wind fields better captures the shape of observed plumes, compared to the Gaussian plume model which relies on wind field at a single point, and thus the Gaussian plume model has difficulty to optimize emissions under inhomogeneous wind fields or when observations are far away from the power plant. In general, using the WRF-FLEXPART model as the forward model in the inverse analysis shows the best consistency with the EPA’s reports, likely due to its capability to simulate narrow-shape plumes in the absence of numerical diffusion which is inherent in Eulerian model such as WRF-Chem. Emissions estimated by the three top-town methods show a moderate consistency at 13 coal-fired power plant cases in China, with 8 of 13 cases showing differences of less than 30% between at least two methods. However, large differences emerge when wind fields are inhomogeneous and number of available observations is limited. Using different meteorological wind fields and OCO-2 data versions can also bring substantial differences to the posterior emissions for all three approaches. We find that the posterior CO2 emissions, though only reflecting instantaneous emission rates at satellite overpass time, are not proportional to the reported capacities of these power plants, indicating that attributing CO2 emissions simply based on the capacity of power plants in some bottom-up approaches may have significant discrepancies. Our study exposes the capability and limitation of different top-down approaches in quantifying point-source CO2 emissions, advancing their application for better serving increasing constellations of point-source imagers in the future.

How to cite: He, C., Lu, X., and Fan, S.: Revisiting the quantification of power plant CO2 emissions in the United States and China from satellite: a comparative study using three top-down approaches., EGU General Assembly 2024, Vienna, Austria, 14–19 Apr 2024, EGU24-1269, https://doi.org/10.5194/egusphere-egu24-1269, 2024.

EGU24-10050 | PICO | AS3.41

Sectoral differentiation of CH4 footprints by using the ICON-ART model – A feasibility study 

Buhalqem Mamtimin, Thomas Rösch, Beatrice Ellerhoff, Diego Jiménez de la Cuesta Otero, and Andrea K. Kaiser-Weiss

In this study, we present an ICON-ART (ICOsahedral Non-hydrostatic Aerosols and Reactive Trace gases) model based sectoral differentiation of CH4 concentration in terms of a feasibility study. ICON-ART is an extension of the numerical weather prediction model ICON used by DWD. The physical parameterizations and numerical methods of ICON used in ICON-ART, which simulated the interactions between trace subtances and the state of the atmosphere.

The motivation for the sectoral differentiation based on the model is directed towards the comparison of the field measurements, with the assumption that the modeled simulations could represent a response signal of how each sector contributes to the measured concentration on the Integrated Carbon Observation System (ICOS) stations of interest.

The CH4 concentrations for various economic sectors of Europe and of Germany are simulated using ICON-ART model. In order to compare the model results and against measurements  from the Integrated Carbon Observation System (ICOS) stations, the model equivalents have been extracted at the locations of the ICOS monitoring stations. We test our experimenal setup in a feasibility study, which shows benefits of using the ICON-ART model to comprehend emissions from various sectors.

How to cite: Mamtimin, B., Rösch, T., Ellerhoff, B., Jiménez de la Cuesta Otero, D., and Kaiser-Weiss, A. K.: Sectoral differentiation of CH4 footprints by using the ICON-ART model – A feasibility study, EGU General Assembly 2024, Vienna, Austria, 14–19 Apr 2024, EGU24-10050, https://doi.org/10.5194/egusphere-egu24-10050, 2024.

EGU24-10117 | ECS | PICO | AS3.41 | Highlight

An atmospheric data assimilation system combining biomass and atmospheric CO₂ data for constraining biosphere carbon fluxes 

Auke Van Der Woude, Joram Hooghiem, Remco De Kok, Ingrid Luijkx, Marnix Van de Sande, Aleya Kaushik, John Miller, and Wouter Peters

Quantification of the long-term carbon uptake by the land biosphere is of key importance for climate action. Traditional methods of estimating the carbon sink include atmospheric inversions, which use CO₂  measurements to reduce inherent biases in simulations of the land biosphere. The atmospheric  CO₂ measurements used are informative on different time scales from days to decades, which are often difficult to separate from the data. Additional data sources can be used to separate the decadal change in sink magnitude from the shorter-term impacts of e.g. droughts. An example is the use of remotely-sensed above-ground biomass changes that have recently gained traction to estimate the stock change of carbon at the surface (Δbiomass), caused by months and years of integrated Net Ecosystem Exchange (NEE). We therefore built a Bayesian framework in which we constrain decades of daily NEE with both atmospheric CO2 observations as well as satellite-based Δbiomass products. With this integration we aim to better constrain the magnitude, inter-annual variability and location of land carbon sinks and sources. We focus the initial tests of the system on European carbon fluxes and find that Europe is a small long-term sink of CO₂, albeit with large regional differences. Most notably, vegetation of central European comes out as a net source of CO₂  into the atmosphere in our system, a finding that is supported by both by the Δbiomass product and the atmospheric CO₂ data. In this presentation we further explore the limits of the attempted integration, aiming to pave the way for future syntheses of atmospheric inversions with novel data products.

How to cite: Van Der Woude, A., Hooghiem, J., De Kok, R., Luijkx, I., Van de Sande, M., Kaushik, A., Miller, J., and Peters, W.: An atmospheric data assimilation system combining biomass and atmospheric CO₂ data for constraining biosphere carbon fluxes, EGU General Assembly 2024, Vienna, Austria, 14–19 Apr 2024, EGU24-10117, https://doi.org/10.5194/egusphere-egu24-10117, 2024.

EGU24-10496 | PICO | AS3.41

Evaluating ICON-ART-LAM vertical profiles and columns of CH4 for May-June 2018 over Europe 

Anne-Marlene Blechschmidt, Buhalqem Mamtimin, Thomas Rösch, and Andrea Kaiser-Weiss

A greenhouse gas satellite data assimilation system is currently being developed for the ICOsahedral Nonhydrostatic (ICON) - Aerosols and Reactive Trace gases (ART) - Limited Area Mode (LAM) model at the German Weather Service. This work is part of the modelling module of the Integrated Greenhouse Gas Monitoring System project (ITMS-M). A first step towards the satellite data assimilation system is the derivation of vertical columns of methane from ICON-ART-LAM simulations that can be compared to column retrievals of CH4 from satellite sensors such as the TROPOspheric Monitoring Instrument (TROPOMI) on board of the Copernicus Sentinel-5 Precursor satellite. As the ICON-ART-LAM simulations are limited to about 20 km altitude, vertical columns cannot directly be derived from the model output alone.

In this presentation, the potential of adding CH4 concentrations from the Copernicus Atmosphere Monitoring Service (CAMS) egg4 greenhouse gas reanalysis and CAMS inversion optimized products above the ICON-ART-LAM upper boundary is evaluated for the time period May-June 2018 and a domain covering Europe (6.5 x 6.5 km2 horizontal grid spacing). The vertical profiles of ICON-ART-LAM are investigated for consistency with the CAMS simulations and ICON-ART-LAM vertical columns derived from the model output will be compared against CH4 vertical columns from TROPOMI. For the latter, the satellite orbit and the sensitivity of the satellite sensor towards retrieving CH4 in different layers of the atmosphere are considered.

How to cite: Blechschmidt, A.-M., Mamtimin, B., Rösch, T., and Kaiser-Weiss, A.: Evaluating ICON-ART-LAM vertical profiles and columns of CH4 for May-June 2018 over Europe, EGU General Assembly 2024, Vienna, Austria, 14–19 Apr 2024, EGU24-10496, https://doi.org/10.5194/egusphere-egu24-10496, 2024.

EGU24-11312 | ECS | PICO | AS3.41

Evaluating Boreal Wetland Methane Emissions in Fennoscandia using MAGIC2021 airborne measurements and Atmospheric Modelling 

Félix Langot, Cyril Crevoisier, Thomas Lauvaux, Charbel Abdallah, Antoine Berchet, Klaus-Dirk Gottschaldt, Alina Fiehn, Jérôme Pernin, Axel Guedj, Thomas Ponthieu, Anke Roiger, Sophie Wittig, Marielle Saunois, and Xin Lin

Boreal wetlands are components of the terrestrial carbon cycle, acting as significant natural sources of methane (CH4) in circumpolar regions. With accelerated Arctic warming, emissions from these ecosystems become hard to predict with high uncertainties on future hydrological regimes, wetland/permafrost extent, and organic matter decomposition rates, subsequently affecting CH4 emissions. Validation of accurate quantification methods for these emissions is therefore pivotal in order to better understand and manage potential climate feedbacks.

In this context, the MAGIC2021 international large-scale field campaign's airborne measurements provide key empirical data to assess CH4 emissions from boreal wetlands in Fennoscandia. Led by CNRS and CNES, the campaign took place in August 2021 and involved 70 scientists from 14 international research teams. More than twenty instruments were deployed, onboard research aircraft (in-situ and lidars), as well as on stratospheric balloons (AirCores) and on the ground (EM27/SUN). In particular, obtaining CH4 concentrations from aircraft flights within the boundary layer allowed to directly capture the signatures of wetland emissions, offering a robust dataset for model validation.

Our study employs two Lagrangian models, FLEXPART driven by ERA5 data and WRF-LPDM, to estimate wetland CH4 fluxes from these measurements. The use of these distinct Lagrangian approaches allows for cross-validation of results, enhancing the reliability of our findings. The derived fluxes are compared with outputs from two bottom-up emission models, WetCHARTs and JSBACH-HIMMELI, which simulate wetland CH4 dynamics at different scales and resolutions. This comparative analysis not only benchmarks the performance of these models against observational data but also sheds light on discrepancies in modelled bottom-up fluxes that can guide future improvements.

Contributions of this study to the session include:

  • A high resolution assessment of boreal wetland CH4 emissions and atmospheric distribution, using state-of-the-art airborne observational techniques.
  • Integration of multiple Lagrangian modelling frameworks to validate and corroborate CH4 flux estimates.
  • A critical evaluation of bottom-up models WetCHARTs and JSBACH-HIMMELI against empirical data, advancing our understanding of model uncertainties and informing on possible enhancements in wetland CH4 emission.

This research aims to further improve our understanding of methane emission processes from boreal wetlands, which helps improve predictions about these important ecosystems. The outcomes contribute to a more accurate global methane budget and underscore the importance of synergistic observational and modelling strategies in environmental science.

How to cite: Langot, F., Crevoisier, C., Lauvaux, T., Abdallah, C., Berchet, A., Gottschaldt, K.-D., Fiehn, A., Pernin, J., Guedj, A., Ponthieu, T., Roiger, A., Wittig, S., Saunois, M., and Lin, X.: Evaluating Boreal Wetland Methane Emissions in Fennoscandia using MAGIC2021 airborne measurements and Atmospheric Modelling, EGU General Assembly 2024, Vienna, Austria, 14–19 Apr 2024, EGU24-11312, https://doi.org/10.5194/egusphere-egu24-11312, 2024.

EGU24-13160 | ECS | PICO | AS3.41

Optimal network designs of in situ atmospheric CO2 stations over continental France 

Carla D'Angeli, Thomas Lauvaux, David Matajira Rueda, Charbel Abdallah, Hassan Bazzi, Philippe Ciais, Morgan Lopez, Michel Ramonet, and Léonard Rivier

The global Stocktake, a fundamental component of the Paris Agreement tracking progress on national mitigation actions, collects the Nationally Determined Contributions (NDCs) generated through the means of annual national inventories. Greenhouse gases (GHG) inventories are prone to uncertainties, especially when considering sub-national scales, sub-annual frequencies, or the natural component of GHG budgets, lacking verification and transparency. Atmospheric observations assimilated through the inverse approach can help constrain both the natural and anthropogenic components of national carbon budgets. Here, we aim at quantifying the carbon dioxide (CO2) fluxes over continental France by combining atmospheric greenhouse gas concentrations from the ICOS (Integrated Carbon Observation System) measurement network and a high-resolution inversion system.

We present an assessment of the observational constraint from the current ICOS network. We also determine the optimal locations and number of additional stations to monitor CO2 fluxes from human activities and different ecosystems. The CO2 concentration measurements influenced by surface CO2 fluxes are analyzed using a Lagrangian Particle Dispersion (LPDM) model. LPDM is run backward in time with meteorological inputs from the Weather Research Forescating (WRF) model, at 3km resolution over continental France. We infer the origin of the CO2 using the TNO high-resolution fossil fuel inventory and biogenic CO2 fluxes produced by the Vegetation Photosynthesis Respiration Model (VPRM). The VPRM model simulates both the CO2 uptake from photosynthesis and the release from respiration using meteorological re-analysis products and surface remote sensing data.

We start by evaluating the improved model performances at high resolution compared to low resolution simulations. Then we analyze the influence of biogenic and fossil fuel sources at each tower of the ICOS network, and finally we explore which areas are constrained by atmospheric stations using different criteria: by ecosystem type, by land cover, and in terms of net carbon fluxes and fossil fuel emissions. We discuss here how our future inversion system could help constrain the regional distribution of CO2 fluxes, sub-annual variations at seasonal and monthly timescales to track current climate change impacts (forest fires, droughts), and the effects of emission mitigation policies.

How to cite: D'Angeli, C., Lauvaux, T., Matajira Rueda, D., Abdallah, C., Bazzi, H., Ciais, P., Lopez, M., Ramonet, M., and Rivier, L.: Optimal network designs of in situ atmospheric CO2 stations over continental France, EGU General Assembly 2024, Vienna, Austria, 14–19 Apr 2024, EGU24-13160, https://doi.org/10.5194/egusphere-egu24-13160, 2024.

EGU24-14255 | ECS | PICO | AS3.41

Study on energy and CO2 flux in a monsoon temperate rice paddy and soybean field in Korea 

Mingu Kang, Kyo-moon Shim, Yongseok Kim, Jina Hur, Sera Jo, Eungsup Kim, and Sueng-gil Hong

  Unlike natural ecosystems, agricultural ecosystems are unique ecosystems in which artificial factors play a significant role. The material cycling within an agricultural ecosystem is influenced by factors such as agricultural activities, weather, and soil conditions. Understanding the material cycling and energy flow in these ecosystems is important to cope with climate change. In this study, we measured energy and carbon dioxide flux using the eddy covariance method to assess material cycling in rice paddy and soybean field ecosystems with similar weather conditions but different vegetation. Additionally, growth surveys were conducted every two weeks to analyze crop development. During the summer, the weather and soil conditions in rice paddy and soybean field were comparable, resulting in similar levels of latent heat flux for both ecosystems. In July 2020, despite the rainy season, the water use efficiency(WUE) of rice paddy was higher than that of other periods, influenced by vegetation and weather conditions. WUE during the summer resembled that of the cropping period, indicating a potential impact on overall crop grain weight.

How to cite: Kang, M., Shim, K., Kim, Y., Hur, J., Jo, S., Kim, E., and Hong, S.: Study on energy and CO2 flux in a monsoon temperate rice paddy and soybean field in Korea, EGU General Assembly 2024, Vienna, Austria, 14–19 Apr 2024, EGU24-14255, https://doi.org/10.5194/egusphere-egu24-14255, 2024.

EGU24-18123 | PICO | AS3.41

WRF-Chem CO2 simulation over a medium sized city: An evaluation across grey-zone resolutions 

Charbel Abdallah, Thomas Lauvaux, Lilian Joly, Cyril Crevoisier, Bruno Grouiez, Delphine Combaz, Nicolas Dumelié, Yao Té, Hao Fu, Morgan Lopez, Frank Hase, Neil Humpage, Caroline Bès, Axel Guedj, Jérôme Pernin, and Aurélien Bourdon

Metropolitan areas are known to be anthropogenic “hot spots” of Greenhouse Gas (GHG) fluxes. To track the effectiveness of climate mitigation policies and emission reduction objectives, large metropolitan areas like Munich and Paris regions are currently being instrumented with dense atmospheric GHG networks, further assimilated in inversion systems with high-resolution inventories, also complementing the data collected by remote sensing instruments on the ground and in space. To study medium-sized cities, where a large fraction of the global population lives, spaceborne measurements often fail to quantify fossil fuel emissions since the atmospheric signatures are below the detection threshold of current instruments. For the past two years (2022 and 2023), two large-scale campaigns of the MAGIC initiative led by CNRS and CNES (https://magic.aeris-data.fr) have been taking place in Reims, France, a city with a population of 300,000 inhabitants (207 hab./km2) located to the East of Paris (approx. 100 km away). During these two intensive measurement campaigns, a wide range of ground-based instruments have been deployed around the city to measure CO2 concentrations, in addition to instrumented balloons and aircraft. The goal of these campaigns was to evaluate CO2 emissions from the area and to assess the detection capabilities of current satellite instruments.

In our study, we simulated the atmospheric CO2 mixing ratios using the Weather Research Forecast model coupled to a chemistry transport model (WRF-Chem) at 4 horizontal resolutions (9 km, 3 km, 1 km, and 333 m). Typically, mesoscale models are used for resolutions coarser than 1 km while microscale Large-Eddy Simulation models (LES) are used for resolutions finer than 100m. In between, i.e. the grey-zone, turbulent motions are not resolved explicitly but high resolutions might offer a better representation of fine plume structures. Here, we present the results of a multi-scale multi-instrument comparison between the model and the observations to characterize the model performances and the ability of the model to reproduce the observed variations in concentrations. We found that the detectability of the various CO2 plumes remains challenging. First, the strength of the anthropogenic signals from the city remains low compared to gradients from nearby sources, whether industrial or metropolitan, hence making the city plume hard to study. We also showed that improvements in the modelling of CO2 plumes were not significant between the 1 and 0.3 km horizontal resolution scales, thus suggesting that LES models might be better suited for such studies.

How to cite: Abdallah, C., Lauvaux, T., Joly, L., Crevoisier, C., Grouiez, B., Combaz, D., Dumelié, N., Té, Y., Fu, H., Lopez, M., Hase, F., Humpage, N., Bès, C., Guedj, A., Pernin, J., and Bourdon, A.: WRF-Chem CO2 simulation over a medium sized city: An evaluation across grey-zone resolutions, EGU General Assembly 2024, Vienna, Austria, 14–19 Apr 2024, EGU24-18123, https://doi.org/10.5194/egusphere-egu24-18123, 2024.

EGU24-18698 | ECS | PICO | AS3.41

Analysis of atmospheric radon for uncertainty evaluation in regional-scale greenhouse gas emissions estimation  

Dafina Kikaj, Mareya Saba, Alistair Manning, Peter Andrews, Edward Chung, Grant Foster, Angelina Wenger, Simon O’Doherty, Matt Rigby, Chris Rennick, Joseph Pitt, and Tim Arnold

Atmospheric transport model (ATM) uncertainty continues to be a significant constraining factor in making confident top-down (inverse model based) GHG emission estimates. Despite its importance, accurately gauging model uncertainty and capturing its temporal fluctuations remains a challenge. Inversion frameworks typically involve an empirical selection of data to be assimilated whereby only the data from periods where the ATM has the lowest uncertainties are used for the inversion.  There are numerous data filtering methods, that often depend on modelled parameters (mixing height, wind speed, potential temperature), which could result in data selection bias.

To address this, we present analysis of radon measurements, a natural radioactive noble gas with simple and well-constrained source and sink. Radon’s unique characteristics make it an ideal tracer to study the transport and mixing of air and thus has potential to act as an independent metric to evaluate ATM performance. A new approach involves utilising measured and modelled radon (calculated using the Met Office Numerical Atmospheric Modelling Environment (NAME) dispersion model and radon flux map) to classify the ATM output uncertainty as either high (poor performance) or low (the best performance). This approach could be universally applied to any location measuring radon from a single inlet height and in conjunction with any other dispersion modelling scenarios.  

To evaluate the effectiveness of the radon selection method, we assess the methane (CH4) emissions across the UK using four tall tower sites (part of the Deriving Emissions linked to Climate Change - DECC network): Heathfield, Ridge Hill, Tacolneston and Weybourne. The CH4 emissions are estimated by the Met Office’s inversion modelling system – Inversion Technique for Emission Modelling (InTEM). We will compare how emissions sensitivity varies between our radon-based approach and the current selection method, which relies on model parameters and the vertical gradient of CH4 measurements. This comparative analysis aims to demonstrate the potential advantages of using radon as a tool for improving the accuracy of ATM performance assessments in GHG emission estimates.

How to cite: Kikaj, D., Saba, M., Manning, A., Andrews, P., Chung, E., Foster, G., Wenger, A., O’Doherty, S., Rigby, M., Rennick, C., Pitt, J., and Arnold, T.: Analysis of atmospheric radon for uncertainty evaluation in regional-scale greenhouse gas emissions estimation , EGU General Assembly 2024, Vienna, Austria, 14–19 Apr 2024, EGU24-18698, https://doi.org/10.5194/egusphere-egu24-18698, 2024.

EGU24-19625 | ECS | PICO | AS3.41 | Highlight

Artificial intelligence for dynamic and intelligent methane inventory  

Jade Eva Guisiano, Thomas Lauvaux, Zitely Tzompa Sosa, Éric Moulines, and Jérémie Sublime


Atmospheric methane contributes to approximately 20-30% of the current global radiative forcing by greenhouse gases. Despite the potential for a 39% reduction in emissions from the oil and gas sector at no net cost, the lack of dependable emission data hinders governments from implementing timely and impactful mitigation actions aligned with the Global Methane Pledge. Existing regulations rely on national methane emission inventories, significantly underestimating methane sources across various emission sectors as revealed by recent studies. The primary cause of this discrepancy is the exclusion of super-emitters in these inventories. Super-emitters, characterized by high emission rates, collectively account for an average of 40% of total methane emissions. To implement effective regulations for reducing methane emissions, a novel, reliable, and accurate inventory methodology is needed. We propose here a framework for an innovative dynamic and intelligent inventory based on artificial intelligence tools.  The dynamic component involves the collection and automatic association, over time, of methane plume detections from satellite source points with the oil and gas infrastructures at their origin. The intelligent part of the inventory enables automatic statistical and forecasting analyses contributing to the definition of multi-level emission profiles in near real-time, spanning country, region, basin, operator, site, and infrastructure levels. The proposed framework is divided into two main parts, the first part focusing on instantiated detection of potentially methane-emitting infrastructures, without recourse to fixed inventories of oil and gas (O&G) infrastructures. As the landscape of O&G infrastructures is constantly evolving, the use of an emission inventory produced at time t can quickly become inaccurate. The principle of snapshot instantiation is essential for building up an up-to-date inventory of infrastructures especially in the context of quasi-continuous monitoring. This first part is based on the use of object detection algorithms to automatically detect and recognize O&G infrastrucutres for each methane plume detection with an accuracy of over 94%. The second part of the framework consists in matching the infrastructure closest to that of the detected plume, using the K-nearest-neighbor algorithm. Carried out successively in time, this method allows to build up a time series of the rate and frequency of methane emissions by O&G infrastructures which form the basis for methane emissions spatio-temporal analysis and forecasting. To show how this framework can be used, we present a study case that consists in estimating a methane emissions inventory for compressors, tanks and wells in the Permian Basin (USA).

How to cite: Guisiano, J. E., Lauvaux, T., Tzompa Sosa, Z., Moulines, É., and Sublime, J.: Artificial intelligence for dynamic and intelligent methane inventory , EGU General Assembly 2024, Vienna, Austria, 14–19 Apr 2024, EGU24-19625, https://doi.org/10.5194/egusphere-egu24-19625, 2024.

Climate change and air pollution are arguably two most pressing environmental issues facing the world today. This talk gives an overview of recent studies relating the two at the decadal to multi-decadal time scale. The first part focusing on interactions will review recent works on how global warming affects aerosol distribution (Banks et al., 2021; Fiore et al., 2022), and in turn, how aerosols affect mean and extreme precipitation (Xu et al., 2022) and circulation changes (Diao and Xu, 2022), which could consequently impact air pollution itself (Wang et al., 2021), completing an intrinsic two-way feedback loop.

The second part will address the joint occurrence of heat extremes and air pollution, including haze (Xu et al., 2020) and ozone (Xiao et al., 2022), raising awareness of their broader impact on human health and crop yield. Some concluding thoughts are given on how to mitigate the near-term warming rates by achieving co-benefits of air quality improvement (Ocko et al., 2021), while avoiding the temporary shock of aerosol unmasking (Dreyfus et al., 2022). A novel yet simple integrated human-Earth modeling framework is introduced to further demonstrate the importance of cutting non-CO2 pollutants to stabilize global warming (Xu and Ramanathan, in review).

How to cite: Xu, Y.: Decadal trends of global climate and air pollution: two-way interactions, joint impacts and synergistic mitigation, EGU General Assembly 2024, Vienna, Austria, 14–19 Apr 2024, EGU24-4129, https://doi.org/10.5194/egusphere-egu24-4129, 2024.

EGU24-4267 | Posters on site | AS3.42

Biogeochemical feedback effects on future wetland methane emissions and implications for global mitigation 

Lu Shen, Shushi Peng, Zhen Zhang, Chuan Tong, Jintai Lin, Yang Li, Huiru Zhong, Shuang Ma, Minghao Zhuang, and Vincent Gauci

Natural wetlands account for one-third of global methane (CH4) emissions and so profoundly influence climate. However, existing estimates of future changes in CH4 usually neglect feedbacks associated with global biogeochemical cycles. Here, we employ data-driven approaches to estimate both current and future wetland emissions that consider the effects of changing meteorology and biogeochemical feedbacks arising from sulfate deposition and CO2 fertilization. We report intensified wetland emissions from 2000-2100, with biogeochemical effects explaining 30% of emissions growth by 2100. Our results suggest that 8-15% more aggressive cuts to anthropogenic methane emissions are needed if we are to stay within the Paris Agreement guardrails of 1.5°C warming.

How to cite: Shen, L., Peng, S., Zhang, Z., Tong, C., Lin, J., Li, Y., Zhong, H., Ma, S., Zhuang, M., and Gauci, V.: Biogeochemical feedback effects on future wetland methane emissions and implications for global mitigation, EGU General Assembly 2024, Vienna, Austria, 14–19 Apr 2024, EGU24-4267, https://doi.org/10.5194/egusphere-egu24-4267, 2024.

EGU24-4953 | Posters on site | AS3.42

Unraveling the sources of uncertainty in China's top-down methane emission estimates 

Huiru Zhong, Lu Shen, and Meng Qu

Accurate quantification of methane emissions is critical for setting and tracking the mitigation goals. However, previously estimated anthropogenic methane emissions in China differ by up to 50% among different studies. Satellite observations are expected to reduce the uncertainty, but large discrepancies still exist in earlier quantifications. Here, using satellite observations from the blended TROPOMI+GOSAT product, we conducted an ensemble of high-resolution (~50 km) inversions to assess the sources of uncertainty in the quantification. Overall, satellite observations can provide robust constraints on China’s total emissions but are less effective in quantifying individual sources with lower emission magnitudes. Of all sectors, emissions from coal mines and livestock can be well constrained due to frequent satellite observations, higher emission magnitudes, and lower prior uncertainty. Furthermore, we constructed marginal cost curves for emission reductions from each source to better inform future mitigation measures.

How to cite: Zhong, H., Shen, L., and Qu, M.: Unraveling the sources of uncertainty in China's top-down methane emission estimates, EGU General Assembly 2024, Vienna, Austria, 14–19 Apr 2024, EGU24-4953, https://doi.org/10.5194/egusphere-egu24-4953, 2024.

In 2021, the World Health Organization (WHO) introduced for the first time the standard for the peak season ozone (six-month mean MDA8 ozone) of no more than 60 μg m-3. Typically, the warm season from April to October is often considered as the peak ozone season. However, the highly polluted North China saw the prolonged ozone pollution season based the national surface network measurement, which is threatening public health and the mitigation of PM2.5 pollution. In order to accurately quantify the risk of this ozone season exposure, here this study proposes some methods to quantitatively characterize the active ozone photochemistry season based on the Ox (NO2+O3) and ozone-temperature relationship. Firstly, we found that the active ozone photochemistry season has extended by about four weeks in the course of fast emission reductions from 2014-2022. Then, combined with atmospheric chemical modeling and future SSP scenarios, it is found that deep emission reductions and climate warming will significantly increase the length of peak ozone season over the North China Plain.

How to cite: Li, K. and Liao, H.: Future prolonged ozone pollution season over the North China Plain driven by emission reductions and climate change, EGU General Assembly 2024, Vienna, Austria, 14–19 Apr 2024, EGU24-5923, https://doi.org/10.5194/egusphere-egu24-5923, 2024.

EGU24-10071 | Posters virtual | AS3.42

Towards seamless prediction of Earth system feedbacks to air quality under climate change: Challenges and new modeling capabilities 

Meiyun Lin, Larry Horowitz, John Dunne, Paul Ginoux, Sergey Malyshev, Elena Shevliakova, Lucas Harris, Ming Zhao, Arman Pouyaei, and Steven Smith

With rising temperatures and shifting rainfall patterns, compound drought and heatwaves are increasing in frequency and intensity under climate change. Future air quality is vulnerable to large land-biosphere feedbacks, such as reduced ozone removal by drought-stressed vegetation, increasing wildfire and dust emissions, and varying BVOC emissions from plants amidst changing land cover. These interactions are poorly represented in the CMIP6 global chemistry-climate models, limiting our ability to accurately predict future air quality and design effective mitigation strategies. In this presentation, we will discuss recent and ongoing research at NOAA’s Geophysical Fluid Dynamics Laboratory (GFDL) to address these challenges. Specifically, we present a new variable-resolution global chemistry-climate model (AM4VR) designed for a seamless prediction of global dimensions to US climate and air quality across times scales from days to decades, with particular focus on integrating physical, chemical, and biological components. In contrast with the global models contributing to CMIP6, AM4VR features more than 10 times finer spatial resolution over the contiguous US (13 km), allowing it to better represent US climate mean patterns and variability, including hydroclimate extremes, drought, fire weather, and air pollution meteorology over complex terrain. With the resolution gradually reducing to 25-50 km over Europe and 50-100 km over Asia, we achieve multi-decadal simulations with prescribed SSTs at 50% of the computational cost for a 25 km uniform-resolution grid. With increased interactivity of atmospheric composition with vegetation dynamics and reactive nitrogen partitioning in wildfire plumes, AM4VR features much improved representation of US air quality extremes during compound events. We are conducting a suite of century-long  (2000-2100) AMIP simulations under SSP1-2.6, SSP2-4.5 and the Global Methane Pledge to assess compounding climate and air pollution risks under 1.5, 2.0, and 3.0 °C of warming. 

How to cite: Lin, M., Horowitz, L., Dunne, J., Ginoux, P., Malyshev, S., Shevliakova, E., Harris, L., Zhao, M., Pouyaei, A., and Smith, S.: Towards seamless prediction of Earth system feedbacks to air quality under climate change: Challenges and new modeling capabilities, EGU General Assembly 2024, Vienna, Austria, 14–19 Apr 2024, EGU24-10071, https://doi.org/10.5194/egusphere-egu24-10071, 2024.

Fine particulate matter (PM2.5) pollution threatens human lives and wellbeing worldwide. Agricultural ammonia (NH3) is a key precursor of PM2.5. To examine how food consumption, production, and trade in different countries and regions affect global air quality, we derived a half-century (1962–2018) crop- and livestock-specific agricultural NH3 emission inventory and used it to conduct numerical experiments with the GEOS-Chem chemical transport model to estimate the impacts of food production, consumption, and trade in nine major food-importing and food-exporting countries or regions (China, India, Japan, Russia, Argentina, Brazil, Canada, European Union, USA) on PM2.5 pollution in themselves and in other countries via both atmospheric transport and food trade. We further performed sensitivity experiments by deducting NH3 emissions related to different food items that are consumed domestically vs. exported for each major country or region. We found that the rise in domestic food and feed crop consumption contribute significantly to PM2.5 pollution in China and India (up to ~40% of the total PM2.5 increase from all sources), among which ~40% is driven by meat production and consumption, highlighting the environmental impacts of dietary changes. We also found that even though China and India consume substantial amount of food imported from other countries, it is not a major contributor to PM2.5pollution in the exporting countries (e.g., ~1% of total PM2.5 in the food trading partners), mostly because the majority of domestic food demand is still satisfied by domestic production, and food import is diversified among a basket of exporting countries. Furthermore, agricultural NH3 is found to have a crucial modulating influence on PM2.5; e.g., the increase in PM2.5 due to agricultural NH3 could partly offset the decrease in PM2.5 induced by other anthropogenic emissions in North America after 1990, and such a phenomenon is expected for China as significant controls of non-agricultural emissions are underway. Our study highlights the significance of food consumption, production and trade in shaping PM2.5 worldwide, and it is important to incorporate sustainable food-system and agricultural strategies to simultaneously safeguard food security as well as the health of citizens and our planet.

How to cite: Tai, A. and Wong, A.: Effects of historical food production, consumption and trade on agricultural ammonia emissions and fine particulate matter (PM2.5) pollution worldwide: Implications for food-system mitigation strategies for a sustainable future, EGU General Assembly 2024, Vienna, Austria, 14–19 Apr 2024, EGU24-14068, https://doi.org/10.5194/egusphere-egu24-14068, 2024.

EGU24-14477 | ECS | Posters on site | AS3.42

Ozone pollution mitigation under China’s ‘Dual-Carbon’ scenario over the Guangdong-Hong Kong-Macao Greater Bay Area 

Danyang Li, Xingpei Ye, Lin Zhang, Xiaorui Liu, Chaoyi Guo, Kai Wu, and Hancheng Dai

As greenhouse gases and air pollutants are often co-emitted, the co-benefits on air quality improvement arising from implementing low-carbon policies are drawing much attention. Here we focus our research on the Guangdong-Hong Kong-Macao Greater Bay Area (GBA) in south-eastern China, the demonstration zone for air pollution prevention and control initiatives of China, while still contending with severe ozone pollution, particularly in autumn. This study assesses whether China’s ‘Dual-Carbon’ targets contribute to the GBA achieving the national ozone control goals and offers corresponding mitigation strategies. We developed an external module to softly couple an integrated assessment model IMEDCGE (Integrated Model of Energy, Environment, and Economy for Sustainable Development, Computable General Equilibrium) with the WRF-Chem atmospheric chemistry transport model. The fusion allows us to project the regional ozone pollution evolutions from the base year (2015) to 2050 under various future scenarios. We explore three anthropogenic emission reduction pathways, each reflecting different levels in climate change mitigation targets and end-of-pipe control policies, resulting in varied ozone precursor reduction patterns. The results show that implementing China’s ‘Dual-Carbon’ policies, combined with stringent end-of-pipe control measures, will substantially decrease the averaged MDA8 surface ozone across the GBA to below 90 μg m-3 by 2050. However, different ozone concentration trends emerge between the southern and northern regions due to spatial variations in ozone chemical regimes, as indicated by H2O2/HNO3 ratios. Overall, NOx emission reduction will become increasingly effective in curbing ozone pollution till 2050, while NMVOCs emission reduction, driven by strict end-of-pipe control policies, plays a pivotal role in the short term (before 2030). Even under the most ideal scenario, where more than 90% of local anthropogenic NOx and 85% of NMVOCs emissions are eliminated, our findings underscore the imperative of coordinated efforts across all sectors and collaborative emission reduction beyond the GBA to mitigate ozone pollution effectively.

How to cite: Li, D., Ye, X., Zhang, L., Liu, X., Guo, C., Wu, K., and Dai, H.: Ozone pollution mitigation under China’s ‘Dual-Carbon’ scenario over the Guangdong-Hong Kong-Macao Greater Bay Area, EGU General Assembly 2024, Vienna, Austria, 14–19 Apr 2024, EGU24-14477, https://doi.org/10.5194/egusphere-egu24-14477, 2024.

EGU24-20492 | Posters on site | AS3.42 | Highlight

Methane Emissions from Wildfires: Trends and Anomalies 

Shobha Kondragunta and AIhua Zhu

Biomass burning is an important source of aerosol emissions that greatly deteriorates air quality near the source and downwind regions. More importantly, large amounts of greenhouse gases (GHGs) such as carbon dioxide (CO2) and methane (CH4) are emitted from wildfires. A quantitative estimate of emissions from biomass burning is vital to understand the fire impacts on climate, weather, environment and public health because wildfires are projected to increase in frequency, severity, and extent in the warming climate. As one of the major climate drivers but with relatively short lifetime in the atmosphere, CH4 is an attractive mitigation target to restrict the pace of global warming. The estimation of spatially and temporally resolved CH4 emissions from the biomass burning sector provides critical information in developing measurement-informed CH4 inventories and assessing mitigation strategies and policy decision making. Satellite observations of fire radiative power is one pathway to investigate wildfires around the world. The Global Biomass Burning Emissions Product (GBBEPx) algorithm is employed to estimate long-term temporal variation and geographic distribution of CH4 emissions using satellite observations from Aqua and Terra Moderate Resolution Imaging Spectroradiometer (MODIS) and Suomi NPP and NOAA-20 Visible Infrared Imaging Radiometer Suite (VIIRS). Globally, about 23 teragrams of CH4 are emitted from biomass burning every year, with nearly 49% of it released from Africa alone. We will present inter-annual variability of CH4 emissions and describe the magnitude of emissions from notable big fires such as the 2020 gigafire in California and 2023 Canadian fires, to compare and contrast emissions from biomass burning source sector versus various anthropogenic sources.

How to cite: Kondragunta, S. and Zhu, A.: Methane Emissions from Wildfires: Trends and Anomalies, EGU General Assembly 2024, Vienna, Austria, 14–19 Apr 2024, EGU24-20492, https://doi.org/10.5194/egusphere-egu24-20492, 2024.

EGU24-2336 | Posters on site | AS3.43

A novel method for the determination of Personal Care Products (PCPs) in aerosol samples: occurrence in urban, mountain and coastal environments. 

Marco Vecchiato, Diego Costa, Elena Barbaro, Giovanna Mazzi, and Andrea Gambaro

Personal care products (PCPs) are compounds entering into the environment through direct discharges or ineffective removal in wastewater treatment plants. Recreational activities in lakes and beaches are additional direct sources of PCPs, especially during widespread use of sunscreens in the summer. However, even if PCPs are largely emitted into the water compartment, the atmosphere is particularly prone to the contamination of these compounds, both from direct inputs during on purpose use (e.g., perfumes and fragrances), or through re-volatilization from various environmental media acting as secondary sources. Moreover, the atmosphere represents a key environmental matrix to understand the environmental fate of these compounds: recent research showed that fragrances and UV-Filters are significantly distributed in the snow both from the Arctic and Antarctica, likely deriving from the cold-condensation of long-range transported aerosols. Nevertheless, the direct analysis of the occurrence of these PCPs in polar and remote air samples is missing, and even in urban and anthropized areas the knowledge on their distribution in atmospheric samples is still limited, in comparison to the studies reported for the water compartment.

In this work we developed and validated an innovative analytical method using a low-temperature (°40 C) Accelerated Solvent Extraction (ASE) procedure for the analyses of fragrances and UV-Filters in aerosol samples, including the particulate (quartz filter) and gaseous (Polyurethane foam – PUF) phases, avoiding the large solvent volumes needed for classical extraction. The method was applied to exploratory air samples collected during summer 2023 in low and high impacted areas of the Veneto region, including urban, mountain and coastal environments. Highest levels were detected in the venetian coastline, reflecting the high local use of sunscreen lotions containing UV-filters, but PCPs were occurring with a different pattern also in background areas of the Dolomites (Alps). Urban samples resulted at intermediate concentrations. Confirming our previous hypotheses and findings, PCPs, in particular Salicylates, are mainly distributed in the gas phase, with the exception of octacrylene, which is generally associated with the particulate. The analytical improvements developed with this method will be fundamental for the future understanding of the behaviour of PCPs in the atmosphere, including studies in remote and polar areas to confirm the long-range transport hypothesis.

Acknowledgements: IRIDE funding received by the Department of Environmental Sciences, Informatics and Statistics (DAIS) of the Ca’ Foscari University of Venice.

How to cite: Vecchiato, M., Costa, D., Barbaro, E., Mazzi, G., and Gambaro, A.: A novel method for the determination of Personal Care Products (PCPs) in aerosol samples: occurrence in urban, mountain and coastal environments., EGU General Assembly 2024, Vienna, Austria, 14–19 Apr 2024, EGU24-2336, https://doi.org/10.5194/egusphere-egu24-2336, 2024.

EGU24-2437 | ECS | Posters on site | AS3.43

Air-Water Exchange of Xenoestrogen in Surface Water in Suzhou of China and the Health Assessment 

Minhao Wang, Dongling Li, Ting Tong, Fang Wang, Kui Chen, Haifei Zhang, and Lei Han

Endocrine disruptors are widely present in the environment and are defined as a subset of endocrine disruptors due to the biological activity of environmental estrogens (xenoestrogens). These substances persist as trace environmental pollutants and contribute to the material cycle. Atmospheric transportation is regarded as the main source of xenoestrogens in inland lakes. However, previous research on the air-water exchange of ecological estrogens in freshwaters has been limited, and studies have indicated that sex differences may result in heterogeneity in the health effects of the same air pollutants. Consequently, this study aims to access the interface exchange process of selected xenoestrogens and the health risks associated with non-dietary exposure in adults.

The results showed significant differences in the direction of air-water exchange for various exogenous estrogens. The air-water exchange rate of dibutyl phthalate is closely correlated with temperature and humidity. Discrepancies in melting point and water solubility of other exogenous estrogens may contribute to differences in exchange rate. Moreover, the non-dietary intake of health hazards posed by six environmental estrogens in atmospheric fine particulate matter is within acceptable limits (Total Health Risk < 1). Among these, dioctyl phthalate, identified as a potential carcinogenic pollutant, also falls within an acceptable level of carcinogenic risk (<10-6). In Suzhou, men are found to face higher health risks from inhalation and skin-to-skin contact compared to women when outdoors. This finding contributes to a comprehensive understanding of the pollution profile and hazards associated with environmental estrogens in the Taihu Lake Basin. It supports the refinement and implementation of policies for ecological estrogen management.

How to cite: Wang, M., Li, D., Tong, T., Wang, F., Chen, K., Zhang, H., and Han, L.: Air-Water Exchange of Xenoestrogen in Surface Water in Suzhou of China and the Health Assessment, EGU General Assembly 2024, Vienna, Austria, 14–19 Apr 2024, EGU24-2437, https://doi.org/10.5194/egusphere-egu24-2437, 2024.

Non-traditional VOC emissions, including emerging pollutants, air toxics, and volatile chemical products (VPCs) span a range of volatilities and molecular structures that impact their reactivity in the atmosphere and eventual fate. However, little is known their source apportionment, temporal behavior, and relative importance to health impacts along with ozone and SOA formation. With the need to characterize these emissions, comprehensive measurement techniques that capture the unexpected but are also highly specific to detail molecular structure and provide compound quantification are needed.

The work presented in this study uses chemical ionization (CI) techniques (H3O+, NH4+, NO+, O2+) for the direct detection and quantification of VOCs considered to be hazardous air pollutants (HAPs). With our work, we show that the ionization patterns for these classes of compounds within each ionization scheme can be used to expand these methods to interpret unknown signals in complex environments. This detailed characterization was conducted by coupling in-situ gas chromatography (GC) to the CI-TOF-MS for pre-separation of the complex mixture. Our results show how the speciated data can be used to deconvolve the complexities of chemical ionization detection (including the presence of fragmentation, cluster formation, and mixed ionization schemes e.g. proton transfer, charge transfer, dehydration).

To apply these methods to ambient atmospheric measurements we need to reconcile the need for both continuous isomer specific quantification and high time resolution data. To accomplish this, we simultaneously coupled the in-situ GC with both CI and electron ionization (EI) TOF-MS. Resulting in the generation of three data sets (GC-EI, GC-CI, and direct-CI data) that offer continuous GC quantification, universal detection of speciated organics (EI), speciated CI data to constrain interferences, and direct-CI data for high time resolution data. This instrument combination was deployed in Spring 2023 for a 4-week mobile laboratory campaign in a region of southeast Louisiana, US that is dense with petrochemical production and industrial activity, to quantify hazardous air pollutants to gauge exposure for the local population. The combination of the in-situ GC, EI-TOF-MS, PTR-TOF-MS was used to provide highly specific, quantitative data on VOCs considered to be air toxics in the area, while also acquiring high time resolution PTR-TOF data that allowed the characterization of different point sources and their variability over time-of-day and day-of-week.

How to cite: Claflin, M., Lerner, B., Stark, H., Krechmer, J., and DeCarlo, P.: ­­Non-targeted VOC Quantification through the Simultaneous Coupling of an in-situ Gas Chromatograph to Electron and Chemical Ionization Time-of-Flight Mass Spectrometers, EGU General Assembly 2024, Vienna, Austria, 14–19 Apr 2024, EGU24-4171, https://doi.org/10.5194/egusphere-egu24-4171, 2024.

EGU24-6239 | ECS | Posters on site | AS3.43

Projections of emission, fate and impact of HFO-1234yf in China 

Yifei Wang, Lu Liu, and Jianbo Zhang

Hydrofluoroolefins (HFOs) are being used as substitutes for potent greenhouse gases hydrofluorocarbons (HFCs). However, the use and environmental impacts of HFOs are of great concern due to the rapid degradation of HFOs to produce persistent and phytotoxic trifluoroacetic acid (TFA), one of the per- and polyfluoroalkyl substances (PFAS). HFO-1234yf is the most widely used HFO and has the greatest formation potential of TFA. Here, we provided a comprehensive projection of HFO-1234yf emission in China during 2025-2060. GEOS-Chem was applied to simulate the atmospheric processes of HFO-1234yf and to characterize the distribution of the degradation product TFA. A water quality model was further adopted to assess the impact of HFO-1234yf emissions on surface terminal water body TFA concentrations in China. Under the Kigali Amendment to the Montreal Protocol, HFO-1234yf emission in China was estimated to increase from 1.5 to 79.0 kt in 2025-2060 with cumulative emission of 1.7 Mt. The annual deposition flux (dry plus wet) of TFA due to HFO-1234yf emission was expected to grow from 0.02 kg/km2/year in 2025 to 0.9 kg/km2/year in 2060, dominated by wet deposition. After continuous emission of HFO-1234yf from 2025 to 2060, the average concentration of TFA in terminal waters in China was projected to increase by 7.4 μg/L. The results of this study can provide scientific support for evaluating the environmental risks of HFOs uses and help in developing HFCs phase-out pathways for addressing climate change.

How to cite: Wang, Y., Liu, L., and Zhang, J.: Projections of emission, fate and impact of HFO-1234yf in China, EGU General Assembly 2024, Vienna, Austria, 14–19 Apr 2024, EGU24-6239, https://doi.org/10.5194/egusphere-egu24-6239, 2024.

EGU24-20039 | Posters on site | AS3.43 | Highlight

Why is the pesticide endosulfan not disappearing from the global environment after ban? 

Gerhard Lammel, Paulo C. Alarcon, Mohsen Padervand, Ulrich Pöschl, and Cornelius Zetzsch

Endosulfan is a persistent organochlorine pesticide that was globally distributed before it was banned in 2013, and it continues to cycle in the Earth system. The chemical kinetics of the gas-phase reaction of α-endosulfan with the hydroxyl radical (OH) was studied by means of pulsed vacuum UV flash photolysis and time resolved resonance fluorescence (FP-RF) as kOH = 5.8×10⁻¹¹ e(-1960 K/T) cm3 s-1 with an uncertainty range of 7×10-12 e(-1210 K/T) to 4×10⁻¹⁰ e(-2710 K/T) cm3 s-1. This corresponds to an estimated photochemical atmospheric half-life in the range of 3-12 months, which is much longer than previously assumed (days to weeks).

Comparing the atmospheric concentrations observed after the global ban of endosulfan with environmental multimedia model predictions, we find that photochemical degradation in the atmosphere is slower than biodegradation in soil or water, and that the latter limits the total environmental lifetime of endosulfan. We conclude that the lifetimes typically assumed for soil and aquatic systems are likely underestimated and should be revisited, in particular for temperate and warm climates. Moreover, the pollutant may persist in soil and sediment burdens disconnected from compartmental interfaces.

How to cite: Lammel, G., Alarcon, P. C., Padervand, M., Pöschl, U., and Zetzsch, C.: Why is the pesticide endosulfan not disappearing from the global environment after ban?, EGU General Assembly 2024, Vienna, Austria, 14–19 Apr 2024, EGU24-20039, https://doi.org/10.5194/egusphere-egu24-20039, 2024.

EGU24-20085 | ECS | Posters on site | AS3.43

Particle immobilisation techniques: Applications for microplastics and beyond 

Robin Lenz, Kristina Enders, Mareike Schumacher, Julia Lötsch, Matthias Labrenz, and Dieter Fischer

Emerging particulate pollutants, ranging from nanoparticles to microplastics, present multifaceted challenges in their detection and characterisation within the atmosphere. Particle immobilisation techniques, which we originally developed for the analysis of microplastics (MP), have demonstrated great versatility for experimental and methodological development, allowing per-particle manipulative investigations and sample persistence over extended periods under various treatments. These techniques may prove useful for wider applicability to other particulate pollutants.

We have been immobilising particles below 100 µm to for the evaluation of purification methods and for conducting interlaboratory analytical comparisons (ILCs). In purification method evaluation, our immobilisation approaches withstand chemical treatments, enabling pre-post comparisons while preserving particle integrity and aiding in method validation. By immobilising MP on suitable substrates, we have established a framework for serial ILCs where the same sample is measured by all ILC participants, reducing inter-participant analytical variation by up to 77% compared to a conventional parallel ILC design using suspended samples.

Beyond MP, these techniques have potential applications for atmospheric particulate pollutants such as soot or fly ash. The immobilisation concept, using filtration with inorganic adhesives, allows reproducibility in analytical assessments across different types of particulate matter. In addition, we discuss the opportunities and obstacles of particle immobilisations as routine procedures, which can help to build up persistent sample archives or to establish robust re-measureable QA/QC reference samples. Multi-method analyses such as correlative microscopy and microspectroscopy can benefit from the application of particle immobilisation techniques.

How to cite: Lenz, R., Enders, K., Schumacher, M., Lötsch, J., Labrenz, M., and Fischer, D.: Particle immobilisation techniques: Applications for microplastics and beyond, EGU General Assembly 2024, Vienna, Austria, 14–19 Apr 2024, EGU24-20085, https://doi.org/10.5194/egusphere-egu24-20085, 2024.

EGU24-7 | Orals | CL2.1

Trenberth’s (2022) Greenhouse Geometry 

Miklos Zagoni

“How Does a Greenhouse Effect Work?” asks Kevin Trenberth in his new book (The Changing Flow of Energy Through the Climate System, Cambridge University Press, 2022, Chapter 3, Sidebar 3.2). The answer is two plates in space, with sunlight shining on the first at a rate of 480 Wm-2; and four equations are presented to describe the resulting energy flow system (480, 320, and 160 Wm-2); see Fig. 3.3, panel 5 on page 30:

Since this structure is open at both sides, if we want to apply it for Earth-like conditions, a planetary surface should be introduced, and the equations have to be slightly modified to describe the surface-atmosphere geometry. After doing so, we have an energy flow system with incoming solar radiation (Wm-2) = 480, outgoing longwave radiation OLR = 480, and surface upward LW emission ULW = 720 = 1.5OLR. The greenhouse effect is G = ULW – OLR = 240 = OLR/2, and the normalized geometric greenhouse factor is g = G/ULW = 1/3. Here we show that these relationships are accurately satisfied by the real Earth’s clear-sky energy flow system. With the up-to-date CERES EBAF Edition 4.2 Version 2 data (release date 2-January-2024, global means 10/2000–09/2023): OLR = 265.95 Wm-2, ULW = 398.75 Wm-2, hence 1.5OLR = 398.92 Wm-2 (0.17 Wm-2 difference) and the greenhouse effect is G = 398.75 – 265.95 = 132.80 Wm-2 with OLR/2 = 132.97 Wm-2 (0.17 Wm-2 difference). The normalized greenhouse factor is g = 132.80/398.75 = 0.333. This parameter is one of the most stable from all climate data: its value was estimated as 0.33 in 1989 and determined as 1/3 in 2008; CERES EBAF Edition 2.8 (2017) found it as g = (398.40 – 265.59)/398.40 = 0.33336. — This close equivalence of the real Earth’s greenhouse factor and the GHG-independent geometric model implies that long-lived greenhouse gases do not play the role of the LW control knob that governs the greenhouse effect but produce a background on which water vapor and the lapse rate adjust and maintain the demanded greenhouse magnitude. In our talk, we present all the data needed to prove that Earth’s atmosphere follows this simple “plate-state” geometry. It can be shown [1] that not only the clear-sky greenhouse fluxes, but the whole annual global mean energy flow system, both clear-sky and all-sky, shortwave and longwave, at the TOA, within the atmosphere and at the surface, even the non-radiative flux components, may be derived from first principles without any reference to the atmospheric gaseous composition. Graeme Stephens’ idea could not be more timely: “Instead of the traditional paradigm of properties define processes, study how processes define property.” We would add: Study how principles define processes, then property. In this talk, we show how geometric principles define radiative processes to generate and maintain the required atmospheric state[2].

References:

[1] Zagoni, M. (2023) Arithmetic relationships in Earth's global mean energy flow system.
https://egusphere.copernicus.org/preprints/2023/egusphere-2023-698/

[2] https://earthenergyflows.com/Trenberths_greenhouse_geometry.html


How to cite: Zagoni, M.: Trenberth’s (2022) Greenhouse Geometry, EGU General Assembly 2024, Vienna, Austria, 14–19 Apr 2024, EGU24-7, https://doi.org/10.5194/egusphere-egu24-7, 2024.

EGU24-387 | ECS | Posters on site | CL2.1

Data-driven Estimation of Cloud Effects on Surface Irradiance atXianghe, a Suburban Site on the North China Plain 

Mengqi Liu, Jinqiang Zhang, Hongrong Shi, Disong Fu, and Xiangao Xia

Clouds are a dominant modulator of the energy budget. The cloud shortwave radiative effect at the surface (CRE) is closely related to the cloud macro- and micro-physical properties. Systematic observation of surface irradiance and cloud properties are needed to narrow uncertainties in CRE. In this study, 1-min irradiance and Total Sky Imager measurements from 2005 to 2009 at Xianghe in North China Plain are used to estimate cloud types, evaluate cloud fraction (CF), and quantify the sensitivities of surface irradiance with respect to changes in CF whether clouds obscure the sun or not. The annual mean CF is 0.50, further noting that CF exhibits a distinct seasonal variation, with a minimum in winter (0.37) and maximum in summer (0.68). Cumulus occurs more frequently in summer (32%), which is close to the sum of the occurrence of stratus and cirrus. The annual CRE is –54.4 W m–2, with seasonal values ranging from –29.5 W m–2 in winter and –78.2 W m–2 in summer. When clouds do not obscure the sun, CF is a dominant factor affecting diffuse irradiance, which in turn affects global irradiance. There is a positive linear relationship between CF and CRE under sun-unobscured conditions, the mean sensitivity of CRE for each CF 0.1 increase is about 1.2 W m–2 [79.5° < SZA (Solar Zenith Angle) < 80.5°] to 7.0 W m–2 (29.5° < SZA < 30.5°). When clouds obscure the sun, CF affects both direct and diffuse irradiance, resulting in a non-linear relationship between CF and CRE, and the slope decreases with increasing CF. It should be noted that, although only data at Xianghe is used in this study, our results are representative of neighboring areas, including most parts of the North China Plain.

How to cite: Liu, M., Zhang, J., Shi, H., Fu, D., and Xia, X.: Data-driven Estimation of Cloud Effects on Surface Irradiance atXianghe, a Suburban Site on the North China Plain, EGU General Assembly 2024, Vienna, Austria, 14–19 Apr 2024, EGU24-387, https://doi.org/10.5194/egusphere-egu24-387, 2024.

EGU24-1295 | Orals | CL2.1

Instantaneous Radiative Forcings of Greenhouse Gases   

William van Wijngaarden and Will Happer

The top of the atmsophere (TOA) instantaneous long wave radiative forcings resulting from increasing greenhouse gases such as CO2, CH4, N2O and various halogenated gases were found by solving the equation of transfer.  The observed altitude dependence of the greenhouse gas concentrations was used as well as the standard midlatitude temperature profile.  The calculations used the line intensities or absorption cross sections from the HITRAN database and also considered the effect of scattering by a cloud layer.  Various cloud properties were considered including altitude, optical depth and single scattering albedo for both isotropic and forward scattering.  The results show that a cloud layer reduces the TOA radiative forcing from its clear sky value.  The incremental forcing is even negative for an optically thick high altitude cloud.  This occurs because the temperature increases with altitude in the stratosphere.

How to cite: van Wijngaarden, W. and Happer, W.: Instantaneous Radiative Forcings of Greenhouse Gases  , EGU General Assembly 2024, Vienna, Austria, 14–19 Apr 2024, EGU24-1295, https://doi.org/10.5194/egusphere-egu24-1295, 2024.

EGU24-1782 | ECS | Orals | CL2.1

Effect of Uncertainty in Water Vapor Continuum Absorption on CO2 Forcing, Longwave Feedback, and Climate Sensitivity 

Florian E. Roemer, Stefan A. Buehler, Lukas Kluft, and Robert Pincus

We assess the effect of uncertainty in water vapor continuum absorption on CO2 forcing F, longwave feedback λ, and climate sensitivity S at surface temperatures Ts between 270K and 330K. We calculate this uncertainty using a line-by-line radiative-transfer model and a single-column atmospheric model, assuming a moist-adiabatic temperature lapse-rate and 80% relative humidity in the troposphere, an isothermal stratosphere, and clear skies. Emulating continuum uncertainty in observations, we hold total continuum absorption fixed at room temperature, but change its components: We assume a 10% decrease in self continuum absorption, which comprises interactions between water molecules, and a spectrally varying increase in foreign continuum absorption, which comprises interactions between water and non-water molecules. We find that continuum uncertainty mainly affects S through its effect on λ. Continuum uncertainty primarily impacts the surface feedback at Ts<290K and the atmospheric feedback at Ts>290 K. Under present-day conditions, those two effects have opposite signs and thus largely cancel each other, therefore the effect of continuum uncertainty on S is negligible (0.02K). At Ts>300K, however, the effect on S is much stronger (>0.2K). This is because at those Ts, the effects on λ of decreasing the self continuum and increasing the foreign continuum have the same sign. These results highlight the importance of a correct partitioning between self and foreign continuum to accurately determine the temperature dependence of Earth’s climate sensitivity.

How to cite: Roemer, F. E., Buehler, S. A., Kluft, L., and Pincus, R.: Effect of Uncertainty in Water Vapor Continuum Absorption on CO2 Forcing, Longwave Feedback, and Climate Sensitivity, EGU General Assembly 2024, Vienna, Austria, 14–19 Apr 2024, EGU24-1782, https://doi.org/10.5194/egusphere-egu24-1782, 2024.

EGU24-3518 | ECS | Orals | CL2.1

Photosynthetically Active Radiation Dynamics in Wetland Ecosystem: A Decadal Study in the Biebrza National Park, Poland 

Jan Górowski, Krzysztof Fortuniak, Mariusz Siedlecki, and Włodzimierz Pawlak

Photosynthetically active radiation (PAR) is one of the most important ecosystem steering factors. This study presents the results of 10-year (2013-2022) continuous measurements of incoming (PARd) and reflected (PARu) photosynthetically active radiation made at the Kopytkowo site (53°35′30.8′′ N, 22°53′32.4′′ E, 109 m ASL) within the Biebrza National Park in northeastern Poland.  The site represents a unique wetland ecosystem on a European scale. The assessment employed a PQS1 Quantum Sensor positioned at a height of 2.7 m AGL, capturing PAR with a time step of ten seconds. Subsequently, the data underwent averaging to establish a 5-minute time step used in the study. The results were expressed in photosynthetically active photon flux density (PPFD in µmol·m⁻²-·s⁻¹-).

Two distinct seasons corresponded to different PARd regimes in the Biebrza Basin. On average the first season (the warm part of the year) commences in the latter half of March and lasts until early October. Throughout this period, the development of convective cloudiness impacts daily photosynthetically active radiation values. The winter season, which lasts for the remainder of the year, is characterised by a higher proportion of cloudy days, influencing the reduced values of surveyed radiation. In general, the annual and daily PARd course reflects the incoming radiation on the top of the atmosphere and its attenuation in the atmosphere. On the contrary, the highest values of PARu manifest during the winter months, resulting from reduced vegetation development and snow cover present at the measurement site. Around mid-April values of PARu begin to drop due to vegetation growth and the assimilation of light.

Simultaneous measurement of PARd and PARu allowed the calculation of albedo in terms of photosynthetically active radiation, which was then used to trace changes in the growing season of plants and their growth dynamics in the study area. Research shows an average of about 210 days of increased absorption of photosynthetically active radiation per year, which falls during the vegetation development period (April to November). The first stage (rapid development) starts at the beginning of April and lasts until the middle of the month. It is characterized by a sharp decline in the proportion of PAR. This is followed by a period of stable expansion, which lasts until the end of May, after which the PARu/PARd ratio remains at a similar low level until mid-November. The highest values occur in January and February, due to the presence of snow cover, which increases the reflection of radiation, and due to reduced plant activity.

Acknowledgements: The National Science Centre, Poland provided funding for this research under project UMO-2020/37/B/ST10/01219 and the University of Lodz under project 4/IDUB/DOS/2021. The authors thank the authorities of the Biebrza National Park for allowing continuous measurements in the area of the Park.

How to cite: Górowski, J., Fortuniak, K., Siedlecki, M., and Pawlak, W.: Photosynthetically Active Radiation Dynamics in Wetland Ecosystem: A Decadal Study in the Biebrza National Park, Poland, EGU General Assembly 2024, Vienna, Austria, 14–19 Apr 2024, EGU24-3518, https://doi.org/10.5194/egusphere-egu24-3518, 2024.

Surface warming is directly associated with the surface energy balance, where downwelling longwave radiation is a critical factor influencing and reflecting surface temperature variations. Accurately identifying various forcing and feedback mechanisms is essential to making more realistic predictions about future climate change. Spectrally-resolved radiance measurements play an important role in this pursuit by leveraging the distinctive absorption features of atmospheric compositions. Only recently, the availability of comprehensive, long-term records of spectrally resolved radiation and atmospheric properties has enabled us to observe and quantify the forcing and feedback factors, such as the cloud feedback characterized by its high uncertainty.

This study initiated by homogenizing the 23-year record of downwelling longwave radiance (DLR) observed by the Atmospheric Emitted Radiance Interferometer (AERI) at the Southern Great Plains site. A detailed DLR record for diverse sky conditions was obtained, enabling the determination of long-term trends in both clear-sky and all-sky scenarios. These trends reveal distinct spectral signals associated with various meteorological variables, forming the basis for further climate change signal attribution analysis.

Subsequently, we develop and validate a novel spectral fingerprinting method tailored to constrain surface forcings and feedbacks from long-term DLR trends. Our analysis identifies positive CO2 and negative O3 surface forcings in both clear-sky and all-sky conditions. Moreover, we observe that changes in temperature and water vapor concentration over the 23-year period contribute to an increase in downwelling longwave radiation. Significantly, our study discovers a negative cloud feedback that offsets the increase in downwelling longwave radiation resulting from elevated CO2, water vapor, and atmospheric temperature. These attributions of radiation changes, derived from AERI observations using the fingerprinting method, are validated against the kernel method and compared with the simulations of Global Climate Models.

How to cite: Huang, Y., Liu, L., and Gyakum, J.: Climate change signals of radiative forcing and feedback unveiled from long-term trends of spectrally resolved surface longwave radiation, EGU General Assembly 2024, Vienna, Austria, 14–19 Apr 2024, EGU24-4120, https://doi.org/10.5194/egusphere-egu24-4120, 2024.


In the context of global warming, the radiation balance in the Tibetan Plateau region is closely linked to changes in the cryosphere, such as glacier retreat, reduced snow cover, and degradation of permafrost. The abnormal changes in radiation balance further impact the East Asian circulation and global climate change. In this study, based on 23 years (2000-2022) of data from the Clouds and the Earth's Radiant Energy System (CERES) for atmospheric and surface radiation fluxes, the temporal and spatial characteristics of solar radiation reflection at the top of the atmosphere (TOA) over the Tibetan Plateau (TP) and its components, including cloud, atmospheric, and surface components, were analyzed. The results showed that the average TOA solar radiation reflection over the TP was 128.5 W m-2, with cloud component contributing approximately 60.3 %, clear-sky atmospheric component contributing approximately 18.4 %, and surface component contributing approximately 21.3%. From 2000 to 2015, there was a significant decreasing trend in TOA solar radiation reflection over the TP, with a Sen's slope of -1.59 W m-2 10a-1. The interannual variability intensity (i.e., standard deviation of anomalies) was approximately 1.44 during this period. However, from 2016 to 2022, the interannual variability intensity increased to 3.62. The changes in interannual variability of TP solar radiation reflection were closely related to the changes in cloud, atmospheric, and surface parameters. Further analysis is needed to understand the reasons for the changes in radiation balance over the TP. This study plans to explore the impacts and contributions of various atmospheric circulation factors on the interannual changes in TP solar radiation reflection and its components using reanalysis meteorological data and synthesis analysis, aiming to reveal the possible mechanisms behind the abrupt change in interannual variability intensity around 2015.

How to cite: Jian, B. and Li, J.: Investigating the Causes of Interannual Variation in Solar Radiation Reflection at the Top of the Atmosphere over the Tibetan Plateau, EGU General Assembly 2024, Vienna, Austria, 14–19 Apr 2024, EGU24-4595, https://doi.org/10.5194/egusphere-egu24-4595, 2024.

EGU24-5330 | ECS | Orals | CL2.1

Ensuring the monitoring of ground heat storage with satellite data 

Francisco José Cuesta-Valero and Jian Peng

Global ground heat storage is the second largest term of the Earth heat inventory only after the ocean, representing a 4-5% of the total heat storage within the climate system. Furthermore, determining the heat storage and heat flux in the land subsurface is necessary for closing the surface energy budget and quantifying the total energy exchange between the lower atmosphere and the shallow continental subsurface. Global long-term estimates of ground heat storage have been retrieved from geothermal data, with measurements from Eddy-covariance stations as a complement. Nevertheless, these two databases are biased towards northern extratropical latitudes, and there are not enough records to obtain a global average of ground heat storage after the year 2000. For this reason, ground heat storage for the period 2000-2020 consists in an extrapolation of the trend from the previous 30 years.

We estimate ground heat storage from six remote sensing products provided by the Climate Change Initiative of the European Space Agency (ESA-CCI). The products consist in land surface temperatures derived from three single-sensor (ENVISAT, MODIS-Terra, and MODIS-Aqua) and three multi-sensor datasets (IRCDR, IRMGP, and SSMI-SSMIS), covering all land surface except Greenland and Antarctica. First, ground heat fluxes are derived from the satellite land surface temperatures using two different methods, and are then evaluated against in situ heat flux observations at Eddy-covariance stations from the FLUXNET, the Integrated Carbon Observation System (ICOS), and Ameriflux databases. The heat fluxes are accumulated to derive ground heat storage for each satellite product, and combined with the estimates from geothermal data to cover the period 1960-2020. This new estimate yields a heat storage of 20.9 ± 4.3 ZJ during the period 1960-2018, while previous estimates reached 24.0 ± 5.4 ZJ and 20.47 ± 0.19 ZJ for the same period. During the period without geothermal estimates, from 2000 to 2020, the new multi-satellite average reaches 10.5 ± 6.4 ZJ, a similar value to the one based on a linear extrapolation of geothermal values (10.18 ± 0.22 ZJ). Furthermore, satellite estimates provide spatial patterns of heat flux changes at the global scale with a high spatial (1 km) and temporal (monthly) resolutions, which will allow to perform analyses not possible with other, more coarse, datasets. Overall, these results reinforce the values obtained in previous analyses, while the methodology used here ensures the monitoring of global ground heat storage in the next decades.

How to cite: Cuesta-Valero, F. J. and Peng, J.: Ensuring the monitoring of ground heat storage with satellite data, EGU General Assembly 2024, Vienna, Austria, 14–19 Apr 2024, EGU24-5330, https://doi.org/10.5194/egusphere-egu24-5330, 2024.

EGU24-5679 | ECS | Orals | CL2.1

Efficacies, pattern effects & radiative feedback in a large ensemble of HadGEM3-GC3.1-LL historical simulations 

Harry Mutton, Timothy Andrews, Leon Hermanson, Melissa Seabrook, Doug Smith, Mark Ringer, Gareth Jones, and Mark Webb

Climate feedbacks over the historical period have been investigated in a 47 member ensemble of atmosphere-ocean general circulation model (AOGCM) simulations. Here, the model response to historical forcing, as well as individual forcing constituents such as aerosol and greenhouse gases separately, has been analysed. The analysis addresses the cause of differing feedbacks across the ensemble, the disparity between feedbacks seen in these AOGCM simulations and atmosphere-only GCM (AGCM) experiments prescribed with observed SSTs, and the different forcing efficacies of the respective forcing agents. It is found that much of the spread in feedbacks across ensemble members and different experiments can be explained through varying SST patterns. The level of polar amplification is shown to strongly control the amount of sea ice melt per degree of global warming, a mechanism responsible for the spread in shortwave clear sky feedback and a large contributor to the different forcing efficacies seen across the different forcing agents. The spread in feedbacks across the historical ensemble is also shown to be caused by both the level of tropical surface temperature warming, due to its influence on longwave clear sky feedback, and the response of  cloud feedbacks to local surface temperatures and large scale changes in tropospheric temperature. It is also shown that each of these processes discussed are partly responsible for the disparity in feedbacks seen between AOGCM simulations and  AGCM experiments prescribed with observed SSTs.

How to cite: Mutton, H., Andrews, T., Hermanson, L., Seabrook, M., Smith, D., Ringer, M., Jones, G., and Webb, M.: Efficacies, pattern effects & radiative feedback in a large ensemble of HadGEM3-GC3.1-LL historical simulations, EGU General Assembly 2024, Vienna, Austria, 14–19 Apr 2024, EGU24-5679, https://doi.org/10.5194/egusphere-egu24-5679, 2024.

The incoming surface solar radiation is an essential climate variable as defined by GCOS. Long term monitoring of this part of the earth’s energy budget is required to gain insights on the state and variability of the climate system. In addition, climate data sets of surface solar radiation have received increased attention over the recent years as an important source of information for solar energy assessments, for crop modeling, and for the validation of climate and weather models; all applications are requiring high-quality and temporally-consistent data records.

Gridded regional and global data records of the surface irradiance are available based on satellite measurements as well as derived from numerical models, e.g., reanalysis systems. For climatological analyses, long-term data records, covering multiple decades, are required. SARAH-3 and CLARA-A3, the satellite-based climate data records from the EUMETSAT Satellite Application Facility on Climate Monitoring (CM SAF), provide data for more than 4 decades already, starting in 1983 and 1979, respectively, and are providing temporally consistent near real-time data.

Here, we present the surface solar radiation data from the SARAH-3 and the CLARA-A3 climate data records for Europe. Evaluation results using surface reference data from BSRN / GEBA and other sources document the quality of the satellite-based data in terms of accuracy and temporal stability. The variability, the changes, and the trends in surface radiation are presented and discussed. Additional data, e.g., top-of-atmosphere fluxes and cloud coverage, are used to assess potential causes for the trends and variabilities found in the surface solar radiation in Europe.  

How to cite: Trentmann, J. and Pfeifroth, U.: Four decades (and counting) of Satellite-based Surface Solar Radiation data - The CM SAF SARAH-3 and CLARA-A3 Climate Data Records , EGU General Assembly 2024, Vienna, Austria, 14–19 Apr 2024, EGU24-6426, https://doi.org/10.5194/egusphere-egu24-6426, 2024.

Asian large-scale orography profoundly influences circulation in the North Hemisphere. Considerable spring top-of-the-atmosphere (TOA) radiative cooling over Southeast China (SEC) is very likely related to upstream orography forcing. Here we investigate the mechanical and thermal forcings of Asian large-scale orography, particularly the Tibetan Plateau (TP), on downstream East Asian cloud amount and atmospheric radiation budget during March-April using the Global Monsoons Model Intercomparison Project simulations. The thermal forcing drives significant surface heating and a low-level cyclone over the TP, pumping low-level air to the middle troposphere. Ascent and water vapor convergence triggered by the thermal forcing favor air condensation, low-middle clouds, and resultant strong spring cloud radiative cooling over SEC. Moreover, the thermal forcing moves the position of cloud radiative cooling westward towards the TP. The TP’s blocking role weakens low-level westerlies over SEC, but its deflecting role increases downstream high-level westerlies, dynamically favoring cloud formation over SEC and the eastward ocean. In addition, the TP can force ascent and increase cloud amounts over the western and central TP. The thermal forcing contributes to 57.1% of total cloud amount and 47.6% of TOA cloud radiative cooling induced by the combined orography forcing over SEC while the mechanical one accounts for 79.4% and 95.8% of the counterparts over the ocean to the east of SEC. Our results indicate that Asian large-scale orography shapes the contemporary geographical distribution of spring East Asian cloud amount and atmospheric radiation budget to a large extent.

How to cite: Li, J.: Mechanical and thermal forcings of Asian large-scale orography on spring cloud amount and atmospheric radiation budget over East Asia, EGU General Assembly 2024, Vienna, Austria, 14–19 Apr 2024, EGU24-6888, https://doi.org/10.5194/egusphere-egu24-6888, 2024.

EGU24-7893 | ECS | Orals | CL2.1

Projecting the Surface UV Radiation from CMIP6 Models and how Factors Influencing it are Changing 

Anthi Chatzopoulou, Kleareti Tourpali, Alkiviadis F. Bais, Dimitris Karagkiozidis, and Peter Braesicke

Links between stratospheric ozone depletion, climate change and UV variability reaching the ground have been established already in a number of studies. Apart from ozone variability and among other factors, aerosol properties, surface reflectivity and clouds are critical for the modulation of the surface UV radiation levels.

In the first part of the study, we examine the evolution of these variables through the years, as derived from simulations by models participating in the 6th Phase of the Coupled Model Intercomparison Project (CMIP6). The period of interest extends from the years before the peak of the ozone depletion (here we selected as reference period the years 1950-1960), up to the end of the 21st century. For a better understanding of future UV radiation levels, we selected three of the IPCC Shared Socioeconomic Pathways (SSPs); SSP1–2.6 as the most sustainable, SSP3–7.0 with high amounts of GHGs and SSP5–8.5 as the most extreme.

In the second part of the study, we provide an overview of the surface UV changes around the globe, with radiative transfer model (RTM) simulations of solar irradiance using libRadtran version 2.0.3. Monthly mean data of ozone, aerosol optical depth (AOD) at 550 nm and surface reflectivity from CMIP6 models are used as input data for the RTM simulations. Here we present changes of the local noon UV-Index (UVI), after weighting the simulations with the Commission Internationale de l'Éclairage (CIE) erythemal action spectra.

Some key changes in drivers and UVI will be discussed. After the middle of the 21st century there is an increasing trend of total ozone column, and more specifically over the Antarctic region, where the depletion is more pronounced, we find that ozone recovery is projected under SSP3–7.0 and SSP5–8.5, while this never fully occurs under SSP1–2.6. According to RTM simulations, reduction of UVI is expected due to the recovery of the ozone layer after the middle of the 21st century. AOD increases over the areas with strong emissions under the three SSPs, which leads to more scatter of irradiance and consequently to lower surface UVI. Finally, surface reflectivity simulations for the end of the 21st century show reductions under all SSPs, mostly over the high latitudes, mainly attributed to ice melt, resulting in decreases of surface UVI.

How to cite: Chatzopoulou, A., Tourpali, K., Bais, A. F., Karagkiozidis, D., and Braesicke, P.: Projecting the Surface UV Radiation from CMIP6 Models and how Factors Influencing it are Changing, EGU General Assembly 2024, Vienna, Austria, 14–19 Apr 2024, EGU24-7893, https://doi.org/10.5194/egusphere-egu24-7893, 2024.

EGU24-8223 | Orals | CL2.1

Robust increase in CO2 effective radiative forcing in warmer climates 

Chris Smith, Duncan Watson-Parris, Ryan Kramer, Timothy Andrews, Ada Gjermundsen, Harry Mutton, Jing Feng, David Paynter, Robin Chadwick, Hervé Douville, and Romain Roehrig

The effective radiative forcing (ERF) is a robust predictor of future equilibrium warming. It is generally assumed that the ERF depends only on changes in atmospheric constituents and is independent of the background climate state. Building on recent work demonstrating that, in contrast, the instantaneous radiative forcing (IRF) for CO2 is strongly state-dependent, we show that the ERF for CO2 also increases in warmer climate states. 

We analyse a 4×CO2 atmosphere-only forcing in both control and warmer climate states in eight CMIP6-era models. Four models participated in the Cloud Feedback Model Intercomparison Project (CFMIP) which used pre-industrial SSTs in its control state and SSTs from near the end of the same model’s coupled abrupt-4×CO2 run in its warm state. In the other four models we used an AMIP climatology as the control state and a uniform increase in SSTs of 4 K above this AMIP climatology in the warm state. All eight models show an increase in 4×CO2 ERF, ranging from 0.1-0.5 W m-2, translating to a relative increase of 0.02-0.09 W m-2 K-1 or 0.2-1.1 % K-1. The increase is statistically significant in five of the eight models.

Our findings have implications for derivation of simplified relationships of climate warming, for instance in the calculations of global warming metrics and in economic models, from which future climate change risks being underpredicted without a temperature adjustment.

We also run aerosol forcing experiments under the +4 K climate, for which there is less agreement between models, but some show large changes in aerosol ERF under the warmer climate state, with potential implications for our ability to discern transient warming even with a more accurate understanding of present-day aerosol forcing. 

How to cite: Smith, C., Watson-Parris, D., Kramer, R., Andrews, T., Gjermundsen, A., Mutton, H., Feng, J., Paynter, D., Chadwick, R., Douville, H., and Roehrig, R.: Robust increase in CO2 effective radiative forcing in warmer climates, EGU General Assembly 2024, Vienna, Austria, 14–19 Apr 2024, EGU24-8223, https://doi.org/10.5194/egusphere-egu24-8223, 2024.

In recent years, radiative feedbacks in the earth system have been strongly tied to the spatial pattern of sea surface temperatures (SSTs). This “pattern effect” has been strongly tied to the strength of cloud radiative feedbacks driven by atmospheric stability changes. SST patch Green’s functions experiments have revealed that the ratio of warming in deep convective tropical regions, versus outside, drives significant changes in atmospheric stability. These Green’s functions can be used to reconstruct feedbacks from given warming patterns. However, it remains unclear how different warming patterns arise. Different Green’s functions, prescribing surface heat fluxes in atmosphere-ocean coupled models instead of temperature changes in fixed SST experiments, may answer this question by showing how energy inputs translate into temperature changes.

Using a simplistic set of patches of applied surface heat fluxes in CESM2-CAM6 and HadCM3, we find that heat input into the tropics results in strongly negative radiative feedbacks from enhanced warm pool warming. This results in a small climate sensitivity to this tropical forcing. Conversely, heat fluxes input into the extratropics cause significantly less negative feedbacks that result in greater climate sensitivity to extratropical forcing.Furthermore, the response to tropical forcing occurs rapidly, with equilibrium roughly achieved within a few years both in slab ocean and fully coupled models. The response to extratropical forcing, by contrast, induces near-zero feedbacks in the first few years, followed by significantly weaker negative feedbacks than seen under tropical forcing, which leave this simulation far from equilibrium after 150 years in the fully coupled model.

These outcomes of forcing, from within the tropics and outside, can be combined to explain the early changes in feedbacks in response to global uniform forcing, or near-uniform global forcings such as from CO2. Reconstruction of the uniform case by summing the tropical and extra-tropical cases gives a good fit, except for an apparent temperature dependence in CESM2, and shows that extra-tropical component of surface forcing is driving the long-term feedbacks in the uniform forcing scenario.

Understanding the process of how the pattern of forcing results in different temperature change patterns may be key to comprehending future temperature changes, given that the pattern of future forcing evolves with the changing mix of anthropogenic forcing agents. Furthermore, exploring how models vary in their conversion of forcing into temperature change, even within the simple experimental design of this study, may highlight significant model feedback differences and contribute to narrowing the range in model predictions of future warming.

How to cite: Salvi, P., Gregory, J., and Ceppi, P.: Assessing the Impact of Surface Energy Inputs on Radiative Feedbacks in Tropical and Extra-tropical Regions: Strength, Evolution, and Timescales, EGU General Assembly 2024, Vienna, Austria, 14–19 Apr 2024, EGU24-8514, https://doi.org/10.5194/egusphere-egu24-8514, 2024.

A variation of the solar energy received by the earth – quantified by the Total Solar Irradiance (TSI) – is a radiative forcing for climate changes on earth. Since the 1976 Science paper by J. Eddy, solar-climate research has been dominated by the paradigm that solar activity and TSI have been slowly increasing since the Maunder Minimum - extending from about 1645 to 1715 – and the present, which was believed to be a Modern Solar Maximum. If this paradigm were valid, over the last 50 years, when most of the global warming has occurred, this warming would be partly due to anthropogenic greenhouse gas warming, and partly due to natural solar warming.

However, evidence has been accumulating against the ‘Modern Solar Maximum paradigm’. Based on this evidence, recently a new reconstruction of the centennial TSI variation from 1700 to 2020 was published. This new centennial TSI reconstruction is nothing less than a paradigm shift for Sun-Climate research. Following the new TSI reconstruction, the TSI did not gradually increase over the last 320 years, but rather varied with a long term periodicity of 105 years, and currently we are near the minimum of this 105 year variation. Therefore over the last 50 years, the sun did not contribute to global warming, but rather tried to cool the earth, partly counteracting greenhouse gas warming. Since we are near the minimum of the 105 year variation, we can expect a trend reversal and for the next 50 years we can expect that the sun will contribute to global warming, making it more difficult for mankind to reach the goals of the Paris Climate Agreement, in order to avoid catastrophic climate change.

How to cite: Dewitte, S.: Centennial Total Solar Irradiance variation : a paradigm shift for Sun-Climate research., EGU General Assembly 2024, Vienna, Austria, 14–19 Apr 2024, EGU24-10211, https://doi.org/10.5194/egusphere-egu24-10211, 2024.

EGU24-10684 | ECS | Orals | CL2.1

Climate evolution in the spectral signatures of simulated and observed radiances 

Stefano Della Fera, Federico Fabiano, Quentin Libois, Lucie Leonarski, Guido Masiello, Piera Raspollini, Marco Ridolfi, Jost von Hardenberg, and Ugo Cortesi

Since the mid-2000s, stable hyperspectral observations of the mid-infrared (MIR) region (667 to 2750 cm-1) of the Earth’s emitted radiance have been provided by different space-based sensors (IASI, AIRS, etc.) producing a long-term dataset that has proven to be crucial for climatological studies. In addition, the FORUM mission, whose launch is planned for 2027, will provide unique spectrally resolved measurements extending down to the far-infrared (FIR) region (100 to 667 cm−1), thus filling the current observational gap of the Earth's emission spectrum measured from space. Since these measurements contain the spectral signatures of temperature, water vapour, clouds and gases concentration, they can be exploited to strictly test General Circulation Models (GCMs), to constrain the parametrizations of sub-grid-process and to monitor the evolution of the climate system.

In this work, 12 years (2008-2019) of IASI Metop-A measurements are compared to simulated spectral radiances provided by the EC-Earth GCM (ECE, version 3.3.3) based on the atmospheric and surface fields predicted in all-sky conditions by the model. An innovative strategy is adopted to consider the cloud variability within the large model grid cell (roughly 80-km grid spacing near the equator) and to optimally compare the climate model outputs with the higher spatial resolution (about 15 km of diameter) observations performed by the instrument. The spectral radiances are simulated online every 3 hours by the σ-IASI radiative transfer model, that has been previously embedded in the climate model through the Cloud Feedback Model Intercomparison Project (COSP) module. The comparison is performed on both low-resolution bands, between 190 to 2500 cm−1, and on selected high-resolution channels, that mimic IASI and FORUM observation in the MIR and in the FIR regions.   

Furthermore, spectral radiances are simulated by the EC-Earth climate models for two RCP climate scenarios (RCP 4.5 and RCP 8.5) spanning the time period from 2015 to 2035. 

The comparison between simulated and observed spectral radiances and the study of spectral trends within climate scenarios featuring distinct radiative forcing aids in elucidating the link with the evolution of key climate variables, to characterize relevant driving mechanisms and to determine how these observations can potentially help to identify biases in climate model simulations.


REFERENCES

Della Fera, S., Fabiano, F., Raspollini, P., Ridolfi, M., Cortesi, U., Barbara, F., and von Hardenberg, J.: On the use of Infrared Atmospheric Sounding Interferometer (IASI) spectrally resolved radiances to test the EC-Earth climate model (v3.3.3) in clear-sky conditions, Geosci. Model Dev., 16, 1379–1394, https://doi.org/10.5194/gmd-16-1379-2023, 2023 

Whitburn, S., Clarisse, L., Bouillon, M. et al. Trends in spectrally resolved outgoing longwave radiation from 10 years of satellite measurements. npj Clim Atmos Sci 4, 48 (2021). https://doi.org/10.1038/s41612-021-00205-7

HUANG, Xianglei, et al. A Synopsis of AIRS Global‐Mean Clear‐Sky Radiance Trends From 2003 to 2020. Journal of Geophysical Research: Atmospheres, 2022, 127.24: e2022JD037598. 

How to cite: Della Fera, S., Fabiano, F., Libois, Q., Leonarski, L., Masiello, G., Raspollini, P., Ridolfi, M., von Hardenberg, J., and Cortesi, U.: Climate evolution in the spectral signatures of simulated and observed radiances, EGU General Assembly 2024, Vienna, Austria, 14–19 Apr 2024, EGU24-10684, https://doi.org/10.5194/egusphere-egu24-10684, 2024.

EGU24-12717 | Orals | CL2.1

Potential impacts of launch and orbital debris re-entry emissions 

Karen Rosenlof and Christopher Maloney

The recent surge in rocket launch rates, including the proposal of large low earth orbit satellite constellations (LLC’s) has renewed interest into how space traffic may impact Earth’s climate. In the future.  The current annual mass flux from satellites vaporized in Earth’s middle atmosphere each year is ~0.4 Gg, well below the ~20 Gg/year natural mass emissions from meteor ablation. However, it is predicted that if all proposed LLC’s are implemented, the total number of satellites in low earth orbit (LEO) will balloon from ~5,000 to over 60,000 units. The corresponding annual emissions from satellite re-entry is also expected to increase and approach 10 Gg/yr. Although little is currently known about the composition of  aerosols released during satellite ablation, we assume a significant portion of the aerosol population is metallic aluminum that will convert to aluminum oxide (Al2O3). Here we present results from a study which focuses on the radiative impacts and atmospheric transport of hypothetical Al2O3 emissions from satellite re-entry. The WACCM6 global model coupled with the CARMA sectional model was run with a 10 Gg/year mass flux of alumina aerosol between 60 km and 70 km. We evaluate how aerosol size and latitude of emission may impact the overall transport, atmospheric burden, and radiative impacts from satellite re-entry.


How to cite: Rosenlof, K. and Maloney, C.: Potential impacts of launch and orbital debris re-entry emissions, EGU General Assembly 2024, Vienna, Austria, 14–19 Apr 2024, EGU24-12717, https://doi.org/10.5194/egusphere-egu24-12717, 2024.

EGU24-12777 | Orals | CL2.1 | Highlight | CL Division Outstanding ECS Award Lecture

The pattern effect: How radiative feedbacks depend on surface warming patterns and influence near-term projections  

Maria Rugenstein

Recent research has highlighted that radiative feedbacks — and thus climate sensitivity — are not constant in time but depend sensitively on sea surface temperature patterns. I will discuss three implications of this realization.

First, I will show how coupled climate models fail to reproduce observed surface warming patterns and global mean top of the atmosphere (TOA) radiation trends. I use large initial condition ensembles to compare observations to account for internal variability and model mean-state biases. For certain periods, not a single ensemble member can reproduce observed values of surface temperature trends and TOA radiation trends. Models which more greatly underestimate the observed local sensitivity of surface and TOA, and models with a weak variability in the Equatorial Pacific surface temperatures tend to have a higher equilibrium climate sensitivity. Despite these astonishing observation-model discrepancies their global-mean temperatures are simulated well which points to a common model problem in surface heat fluxes and ocean heat uptake.

Second, I will discuss the relevance of the pattern effect for climate change projections. Given that problems coupled models have in reproducing observed warming patterns, we should doubt their pattern evolution in projections. I will introduce “surface warming pattern storylines” starting from the observations and bridging to simulated future patterns in standard scenarios. I show that (CMIP) coupled climate models used ubiquitously for climate change projections underestimate the uncertainty of possible global-mean temperature evolutions due to their surface warming patterns throughout the 21st century.

Third, I will introduce how a feed-forward convolutional neural network (CNN) can be trained to learn the pattern effect and predict global-mean TOA radiation from surface warming patterns. I use explainable artificial intelligence methods to visualize and quantify that the CNN draws its predictive skill for physically meaningful reasons. Remarkably and different from traditional approaches, I can predict radiation under strong climate change from training the CNN on internal variability alone. This out-of-sample application works only when feedbacks are allowed to be non-linear or equivalent, changing in time, which is another, independent manifestation of the relevance of the pattern effect.

How to cite: Rugenstein, M.: The pattern effect: How radiative feedbacks depend on surface warming patterns and influence near-term projections , EGU General Assembly 2024, Vienna, Austria, 14–19 Apr 2024, EGU24-12777, https://doi.org/10.5194/egusphere-egu24-12777, 2024.

EGU24-12901 | Orals | CL2.1

Assessment of atmospheric and surface energy budgets using observation-based data products 

Michael Mayer, Seiji Kato, Michael Bosilovich, Peter Bechtold, Johannes Mayer, Marc Schroeder, Ali Behrangi, Shinya Kobayashi, Brent Roberts, and Tristan L'Ecuyer

Accurate diagnosis of regional atmospheric and surface energy budgets is a critical component for understanding the spatial distribution of the Earth’s Energy Imbalance (EEI). This contribution reviews frameworks and methods for consistent evaluation of key quantities of those budgets using observationally constrained data sets. It thereby touches upon assumptions made in data products which have implications for these evaluations. We evaluate 2001-2020 average regional total (TE) and dry static energy (DSE) budgets using satellite-based and reanalysis data. Uncertainties of the computed budgets are assessed through inter-product spread and evaluation of physical constraints. Furthermore, we infer fields of net surface energy flux by combining top-of-atmosphere radiative fluxes from satellites with reanalysis-based atmospheric TE budget terms (i.e., divergence and storage of energy). Results indicate biases <1 W/m2 on the global, <5 W/m2 on the continental, and ~15 W/m2 on the regional scale. Inferred surface energy fluxes exhibit reduced large-scale biases compared to surface flux data based on remote sensing and models. We use the DSE budget to infer atmospheric diabatic heating from condensational processes. Comparison to observation-based precipitation data indicates larger uncertainties (10-15 Wm-2 globally) in the DSE budget compared to the TE budget, which is reflected by increased spread in reanalysis-based fields. Continued validation efforts of atmospheric energy budgets are needed to document progress in new and upcoming observational products, and to understand their limitations when performing EEI research.

How to cite: Mayer, M., Kato, S., Bosilovich, M., Bechtold, P., Mayer, J., Schroeder, M., Behrangi, A., Kobayashi, S., Roberts, B., and L'Ecuyer, T.: Assessment of atmospheric and surface energy budgets using observation-based data products, EGU General Assembly 2024, Vienna, Austria, 14–19 Apr 2024, EGU24-12901, https://doi.org/10.5194/egusphere-egu24-12901, 2024.

EGU24-14006 | Posters on site | CL2.1

Assessing the Variability of Radiation, Water and Energy in the Deep Tropics Over the Last 3 Decades 

Paul Stackhouse, Stephen Cox, J. Colleen Mikovitz, Taiping Zhang, and Nicolas Leitmann-Niimi

Global surface energy closure and its variability depends heavily upon the surface radiative energy budget in the deep tropics.  A key process observed is the change in convection regimes from disorganized convection to organized deep convection.  During these periods an imbalance is observed between energy and water fluxes in terms of energy closure in some atmospheric reanalysis systems, implying that processes are not simulated well.  A recent paper by Hsaio et al (2023, pre-published version) found that the transition process has wind shear and longwave cloud radiative feedback signatures.  In this presentation, we assess the surface radiative budget in the deep tropics by comparing multiple data products (GEWEX SRB Rel4IP, CERES Ed4.1, ISSCP FH, etc.) and describing the variability across the deep tropics for the period from 1988 to near present.  We assess this variability of the radiative flux anomalies (including the net TOA, surface and the atmospheric divergence fluxes) against water vapor divergence, cloud properties (include ISCCP “Weather States, Tselioudis et al. 2021) and larger scale wind shear.  We include further analysis contrasting 6 key tropical oceanic regions (Indian Ocean east and west, tropical western, central and eastern Pacific Ocean, and Tropical Atlantic Ocean) and the sensitivity of the fluxes as a function of fluctuations in cloud types in response to various larger scale atmospheric processes (e.g. El Niño, Indian Ocean Dipole).  These are contrasted against the modeled radiative fluxes from ERA-5 and MERRA-2.  Ocean buoy measurements of radiative fluxes are utilized to help assess data radiative flux uncertainty over the nearly 40 year period.  In general, the variability for overlap periods of these various data products agrees well, but there are significant differences in the net fluxes that vary according to the rendering of surface, atmospheric, aerosol and cloud properties.  We conclude with recommendations for continuing work.

How to cite: Stackhouse, P., Cox, S., Mikovitz, J. C., Zhang, T., and Leitmann-Niimi, N.: Assessing the Variability of Radiation, Water and Energy in the Deep Tropics Over the Last 3 Decades, EGU General Assembly 2024, Vienna, Austria, 14–19 Apr 2024, EGU24-14006, https://doi.org/10.5194/egusphere-egu24-14006, 2024.

EGU24-14047 | ECS | Orals | CL2.1

A Spaceborne Camera To Augment Future Earth Radiation Budget Satellite Observations 

Jake Gristey and Sebastian Schmidt

Earth radiation budget (ERB) satellite observations require conversion of the measured radiance, which is a remotely-sensed quantity, to a derived irradiance, which is the relevant energy balance quantity routinely used in modelling and analysis of the climate system. The state-of-the-art approach for radiance-to-irradiance conversion taken by the Clouds and the Earth's Radiant Energy System (CERES) benefits from the exhaustive sampling of radiance anisotropy by multiple CERES instruments across many years. Unfortunately, the CERES approach is not easily extended to new ERB spectral channels that lack previous sampling, such as the “split-shortwave” planned to be part of the next-generation ERB mission: Libera. As an alternative approach, the capability of a monochromatic, wide-field-of-view camera to provide dense angular sampling in a much shorter timeframe is assessed. We present a general concept for how this can be achieved and quantify the proficiency of a camera to provide rapid angular distribution model (ADM) generation for the new Libera ultraviolet-and-visible (VIS) sub-band. A single mid-visible camera wavelength (555 nm) is shown to be ideal for representing the VIS sub-band, requiring only basic scene stratification for 555 nm to VIS conversion. Synthetic camera sampling with realistic operating constraints also demonstrates that the angular radiance field of various scenes can be well populated within a single day of sampling, a notable advance over existing approaches. These results provide a path for generating observationally-based VIS ADMs with minimal lag time following Libera’s launch. Coupled with efforts to utilize a camera for scene identification, this may also pave the way for future ERB satellite systems to develop stand-alone irradiance products for arbitrary sets of spectral channels, opening up new measurement and science possibilities.

How to cite: Gristey, J. and Schmidt, S.: A Spaceborne Camera To Augment Future Earth Radiation Budget Satellite Observations, EGU General Assembly 2024, Vienna, Austria, 14–19 Apr 2024, EGU24-14047, https://doi.org/10.5194/egusphere-egu24-14047, 2024.

EGU24-15022 | ECS | Orals | CL2.1

In-situ Measurements of the Emissivity of Ice and Snow surfaces in the Mid- and Far-infrared 

Laura Warwick, Jonathan Murray, Sanjeevani Panditharatne, Helen Brindley, Dirk Schuettemeyer, and Hilke Oetjen

Knowledge of the emissivity of the Earth’s surface is vital for understanding the Earth’s radiation budget. However, there is a lack of emissivity measurements in the far-infrared (wavenumbers less than 667 cm-1 or wavelengths greater than 15 μm) despite studies showing that the surface emissivity in these regions can have a discernible impact on the outgoing longwave radiation. In-situ measurements of surface emissivity in the far-infrared are also needed to support the upcoming far-infrared satellite missions; the Polar Radiant Energy in the Far-InfraRed Experiment (PREFIRE) developed by NASA and due to launch in spring 2024, and the European Space Agency’s Far-infrared Outgoing Radiation Understanding and Monitoring (FORUM) mission due to launch in 2027.

To fill this observational gap, the Far INfrarEd Spectrometer for Surface Emissivity (FINESSE) was developed at Imperial College London. FINESSE has a spectral range of 400 to 1600 cm-1 (6.25 to 25μm) and is designed for in-situ measurements of surface emissivity, particularly in cold climates.

In this presentation we present observations from the first deployment of FINESSE to the ALOMAR observatory in Northern Norway (69°16' N, 16° 0' E). We describe the campaign, the radiance measurements made by FINESSE and the auxiliary data taken. We then outline the method used to determine the surface temperature and emissivity and finally present the retrieved emissivity of the ice and snow surfaces.

How to cite: Warwick, L., Murray, J., Panditharatne, S., Brindley, H., Schuettemeyer, D., and Oetjen, H.: In-situ Measurements of the Emissivity of Ice and Snow surfaces in the Mid- and Far-infrared, EGU General Assembly 2024, Vienna, Austria, 14–19 Apr 2024, EGU24-15022, https://doi.org/10.5194/egusphere-egu24-15022, 2024.

EGU24-16988 | ECS | Orals | CL2.1

Assessing lidar ratio impact on CALIPSO retrievals utilized for estimating aerosol shortwave direct radiative effects over the NAMEE domain 

Anna Moustaka, Marios-Bruno Korras-Carraca, Kyriakoula Papachristopoulou, Michael Stamatis, Emmanouil Proestakis, Ilias Fountoulakis, Stelios Kazadzis, Vassilis Amiridis, Kleareti Tourpali, Stavros Solomos, Christos Spyrou, Christos Zerefos, and Antonis Gkikas

One of the most vulnerable regions to climate change is the NAMEE (North Africa Middle East Europe) domain, hosting a variety of aerosol species of both natural and anthropogenic origin. This is one of the reasons why NAMEE constitutes an ideal region for assessing the aerosol-induced direct radiative effects (DREs) within the Earth-Atmosphere system. The overarching goal of the present study is to estimate clear-sky shortwave DREs via a holistic approach involving spaceborne retrievals, radiative transfer simulations and aerosol/radiation observations. We emphasize on the importance and sensitivity of the aerosol-speciated lidar ratio (LR) on calculating DREs. Our main dataset consists of CALIOP-CALIPSO backscatter coefficient vertically resolved retrievals (Level 2, Version 4.20) extracted from the LIVAS (LIdar climatology of Vertical Aerosol Structure for space-based lidar simulation studies) database (2007-2020). Besides the CALIPSO aerosol optical depth (AOD) retrieval, the aerosol-speciated LRs based on the newly developed DeLiAn database, a collection of state-of-the-art ground-based measurements acquired by lidars operating at different regions of the world affected by various aerosol types, are also applied to the CALIPSO backscatter coefficient profiles for the calculation of a more representative AOD. Through a series of quality assurance filtering we conclude to 550 case studies collocated against ground-based AERONET stations characterized by either dust, marine, polluted continental/smoke, elevated smoke or clean continental aerosol layers according to the latest CALIPSO (V4) aerosol classification algorithm scheme. For the radiative transfer simulations, the libRadtran Radiative Transfer Model (RTM) is implemented for the spectral range of 250–5000 nm using a 4-stream plane parallel approximation. The CALIPSO aerosol-speciated AOD profiles at 532 nm along with lookup tables of spectrally resolved optical properties extracted from the AERONET almucantar retrievals make up the aerosol RTM inputs. For the surface inputs, the MODIS snow-free BRDF/albedo dataset and the libRadTran built-in IGBP albedo library are utilized. The columnar concentrations of ozone and water vapour are extracted from the MERRA-2 reanalysis. The simulated solar fluxes at TOA and at the surface are evaluated against satellite (CERES) and ground-based (BSRN) observations for cloudless conditions, respectively. Our key finding is that the consideration of the DeLiAn-based LR leads to more representative DREs and improves the simulated solar fluxes when mineral particles dominate.    

Acknowledgements: Authors acknowledge support by the Hellenic Foundation for Research and Innovation (H.F.R.I.) under the “2nd Call for H.F.R.I. Research Projects to support Post-Doctoral Researchers” (Project Acronym:  ATLANTAS, Project number:  544). Part of this work was supported by the COST Action Harmonia (CA21119) supported by COST (European Cooperation in Science and Technology)

How to cite: Moustaka, A., Korras-Carraca, M.-B., Papachristopoulou, K., Stamatis, M., Proestakis, E., Fountoulakis, I., Kazadzis, S., Amiridis, V., Tourpali, K., Solomos, S., Spyrou, C., Zerefos, C., and Gkikas, A.: Assessing lidar ratio impact on CALIPSO retrievals utilized for estimating aerosol shortwave direct radiative effects over the NAMEE domain, EGU General Assembly 2024, Vienna, Austria, 14–19 Apr 2024, EGU24-16988, https://doi.org/10.5194/egusphere-egu24-16988, 2024.

EGU24-17804 | ECS | Posters on site | CL2.1

Effects of long-term changes in anthropogenic aerosol emissions on shortwave radiative flux and cloud variables over the North Pacific 

Jingyi Liu, Ken Carslaw, Daniel Grosvenor, Xin Huang, and Aijun Ding

China's high-intensity anthropogenic emissions have strongly affected regional aerosols, weather and climate over recent decades. Affected by the typical circulations in the Asian monsoon region, aerosols over the North Pacific are closely related to emissions from China. However, how changes in aerosol emissions from China has affected changes in aerosols, clouds and radiation over the North Pacific on the timescale of decades have not been explored in detail.

In this study, using in situ and satellite observations together with model data, we investigate the long-term trends of anthropogenic emissions, aerosols, cloud properties and top-of-atmosphere (TOA) net downward shortwave radiation flux (Fsw↓) over China and the North Pacific, and discussed the potential effects of aerosol on changes in Fsw↓ over the North Pacific. Anthropogenic emissions in China have undergone significant changes in the past few decades, 1960-2020. They show a similar increasing trend before 2000 and then start to fluctuate and decline. The significant turning points of observed visibility and PM2.5 occur around 2000 and 2013 due to the successive implementation of clean air policies. The coefficient of correlation between the two regions is 0.857 for Aerosol Optical Depth (AOD) and 0.953 for Aerosol Index (AI), indicating that aerosols in the two regions are highly correlated.

We use the MERRA-2 model outputs to investigate the Fsw↓ trends and diagnose the potential impact of aerosols on shortwave radiative fluxes. The Fsw↓ over the North Pacific shows a faster decline trend (-0.16 W m-2 y-1) compared to the trend without aerosols (-0.11 W m-2 y-1) during 1980-2000 (defined as the pre-2000 period), which is mainly driven by the enhanced cooling effect of increasing aerosols associated with growth in the anthropogenic emissions of East China. However, the Fsw↓shows an upward trend (+0.12 W m-2 y-1) during 2000-2020 (the post-2000 period), accompanied by a downward trend of cloud droplet number concentration (decreased by 13.9% during 2003-2020). The cooling effect of aerosols causes an overall reduction in the annual mean values of Fsw↓ of 3.5 W m-2 in the pre-2000 period,and 2.9 W m-2 in the post-2000 period, indicating that the aerosol forcing is weakened by 17%. To understand the trends and explore the dominant driven factors of Fsw↓ in different periods, we use multiple simulations of the UK Earth System Model. We will show the contributions of anthropogenic emissions to trends in aerosol-radiation interactions (ARI) and aerosol-cloud interactions (ACI) over the North Pacific, and quantify how changes in aerosol and other climate variables have contributed to the observed trends in Fsw↓ over the North Pacific caused by changes in cloud droplet concentrations, cloud fraction and liquid water path.

How to cite: Liu, J., Carslaw, K., Grosvenor, D., Huang, X., and Ding, A.: Effects of long-term changes in anthropogenic aerosol emissions on shortwave radiative flux and cloud variables over the North Pacific, EGU General Assembly 2024, Vienna, Austria, 14–19 Apr 2024, EGU24-17804, https://doi.org/10.5194/egusphere-egu24-17804, 2024.

EGU24-17894 | ECS | Orals | CL2.1

A comprehensive study on the causes of Global Dimming and Brightening using a radiative transfer model and satellite and reanalysis input data  

Michael Stamatis, Nikolaos Hatzianastassiou, Marios Bruno Korras Carraca, Christos Matsoukas, Martin Wild, and Ilias Vardavas

Global Dimming and Brightening (GDB), which refers to the decrease/increase of incoming total solar radiation at the Earth's surface (or surface solar radiation, SSR) due to natural or anthropogenic composition changes of the Earth’s atmosphere, plays an important role in the Earth’s climate. According to the literature, the main drivers of the phenomenon are aerosols and clouds, contributing to GDB to different degrees depending on the world region and time period. This study aims, using a detailed spectral radiation transfer model (RTM), to identify and quantify the causes of GDB worldwide on a climatological scale. Specifically, it intends to determine their contribution to GDB as well as their spatio-temporal variability, performing detailed analyses on a monthly basis and a spatial latitude/longitude resolution of 0.5°x0.625°, all over the globe and for the 35-year period 1984-2018. The RTM required input data, such as those for cloud and aerosol optical properties, are taken from a synergy of satellite and reanalysis databases, namely the EUMETSAT’s CLARA-A2 and the NASA’s ISCCP-H and MERRA-2. Model runs, which are the main/base runs, are performed at the aforementioned spatial and temporal resolution and coverage to accurately calculate solar fluxes and GDB. Τhe contribution of clouds (cloud amount-CA and cloud optical thickness-COT of low, middle, high and total clouds), aerosol optical properties (aerosol optical depth-AOD, single scattering albedo-SSA and asymmetry parameter-AP), water vapor and ozone to GDB during the 35-year period 1984-2018 are calculated through RTM computations in which each parameter is kept ‘frozen’ at its initial conditions, namely the first year of the study period (namely 1984). Then, the contribution of a parameter P to the overall GDB is estimated from the difference between the GDB of the main RTM run, with all parameters being activated, and the GDB of the run with ‘frozen’ P parameter. In addition to the overall 35-year investigation, the study is also conducted on a decadal time scale, as well as on global, hemispherical, regional, and land/ocean spatial scales, in order to investigate the contribution of each parameter to GDB in more detail.

How to cite: Stamatis, M., Hatzianastassiou, N., Korras Carraca, M. B., Matsoukas, C., Wild, M., and Vardavas, I.: A comprehensive study on the causes of Global Dimming and Brightening using a radiative transfer model and satellite and reanalysis input data , EGU General Assembly 2024, Vienna, Austria, 14–19 Apr 2024, EGU24-17894, https://doi.org/10.5194/egusphere-egu24-17894, 2024.

The Global Energy Balance Archive (GEBA) was founded by Professor Atsumu Ohmura after the (meta)data collection started in the early 1980s. Maintained at ETH Zurich, GEBA stores worldwide measured energy fluxes at the Earth’s surface over several decades (Wild et al. 2017). The knowledge of their spatio-temporal distribution is essential for understanding the genesis and evolution of the Earth’s climate and required for practical applications in the sectors of renewable energy, agriculture, water management and tourism. GEBA currently contains more than 700,000 monthly mean entries for various energy balance components, the most widely represented one being global (incoming shortwave) radiation. The observations at more than 2700 stations come from a variety of sources in heterogeneous formats. Data accessed through GEBA have been used in numerous scientific publications dealing with e.g. the quantification of the Earth’s energy balance, the estimation of long-term trends, which enabled the detection of multi-decadal variations known as “global dimming” and “brightening”, and the evaluation of surface fluxes in climate models and satellite-derived products. First organized in an Oracle relational database, GEBA serves the climate community since 1991 and (meta)data, associated with quality flags, are available on the internet since 1997. Recently, GEBA necessitated a technical revision of its infrastructure dating back to the 1990s, process automation and update of its contents. The ongoing major re-design and operational maintenance work is co-​funded since 2019 by the Federal Office of Meteorology and Climatology (MeteoSwiss) within the framework of the Global Climate Observing System (GCOS) Switzerland, according to its climate monitoring principle #10 “Data management systems that facilitate access, use and interpretation of data and products should be included as essential elements of climate monitoring systems”.

This poster presents (i) the challenges of the recent migration of GEBA to an open-source PostgreSQL platform, (ii) the state-of-the-art re-implementation of the web access interface displaying up-to-date database content status and allowing, after registration, user-friendlier data search, (iii) the key role GEBA plays in various research applications, and (iv) opportunities for quality improvement and future expansion. The new flexible and history-aware relational model (schema) and processing layer for computing derived data strive to solve inconsistency and redundancy issues in (meta)data structure and meet standardization goals (ISO, WMO, WRR), developer and user needs. Feedback from experts and offers from potential data contributors will be welcome and integrated into the project’s evolution.

We gratefully acknowledge the (meta)data sources (including WRDC, BSRN, ARM, SURFRAD, national weather services, project reports, OSCAR/Surface) and many observers in the field. We are indebted to the IT Services of ETH Zürich and the ETH “DocJob” students.


Reference:

Wild, M., A. Ohmura, C. Schär, G. Müller, D. Folini, M. Schwarz, M. Z. Hakuba, A. Sanchez-Lorenzo (2017), The Global Energy Balance Archive (GEBA) version 2017: a database for worldwide measured surface energy fluxes, Earth System Science Data, 9, 601-613.

How to cite: Wild, M. and Smith, P.: The Global Energy Balance Archive (GEBA) – Recent Developments, Current Database Access, Use for Research, Future Expansion, EGU General Assembly 2024, Vienna, Austria, 14–19 Apr 2024, EGU24-18254, https://doi.org/10.5194/egusphere-egu24-18254, 2024.

EGU24-18872 | Orals | CL2.1

Singular Vector Decomposition (SVD) of satellite datasets: relation between cloud properties, radiative fluxes and climate indices. 

Elisa Carboni, Gareth Thomas, Richard Siddans, and Brian Kerridge

We describe a technique, singular vector decomposition (SVD), that can identify the spatial patterns that best describe the temporal variability of a global satellite dataset. These patterns, and their temporal evolution are then correlated with established climate indices. 
We apply this technique to datasets of cloud properties and radiative  fluxes over three decades ((A)ATSR/SLSTR, MODIS, IASI and CERES), but it can be more generically used to extract the pattern of variability of any regular gridded dataset such as different parameters from satellite retrieval and models.
Leading singular vector for independent global data sets on both cloud properties (cloud fraction, cloud-top height) 
and TOA radiative fluxes, from polar orbiting satellites, covering different time periods is strongly correlated with ENSO index.
SVD approach can provide incites into the underlying causes of observed changes in a particular dataset and provide a new tool in using global satellite observations in assessing global climate model (GCM) performance.

How to cite: Carboni, E., Thomas, G., Siddans, R., and Kerridge, B.: Singular Vector Decomposition (SVD) of satellite datasets: relation between cloud properties, radiative fluxes and climate indices., EGU General Assembly 2024, Vienna, Austria, 14–19 Apr 2024, EGU24-18872, https://doi.org/10.5194/egusphere-egu24-18872, 2024.

EGU24-19187 | ECS | Orals | CL2.1

Development of a hyperspectral spatio-temporal surface albedo dataset for Earth 

Giulia Roccetti, Luca Bugliaro, Felix Gödde, Claudia Emde, Mihail Manev, Michael Sterzik, Cedric Wehrum, and Ulrich Hamann
Surface albedo is a crucial component of accurate radiative transfer simulations of Earth's system, playing a key role in calculating the planet's energy budget. The MODIS Surface Reflectance dataset (MCD43C3, Version 6.1) provides detailed albedo maps across seven spectral bands, enabling the monitoring of daily and yearly changes in planetary surface albedo. However, a comprehensive set of albedo maps covering the entire wavelength range is essential for simulating radiance spectra and accurately retrieving atmospheric and cloud properties in Earth's remote sensing. Braghiere et al. (2023) highlighted the impact of simplistic assumptions on albedo maps in Earth System Models, estimating a 3.55 W m-2 divergence in radiative forcing when using hyperspectral albedo maps instead of the commonly employed two broadband albedo value approach. They find that omitting the hyperspectral nature of Earth’s surface causes deviation in many climatological patterns, such as precipitation and surface temperature, over regional scales.
 
We average the MODIS datasets over a 10-years period for different times of the year, obtaining a MODIS climatological dataset. Thanks to both high spatial and temporal resolution, we study albedo seasonal and spatial variability in the seven MODIS bands, obtaining estimates of the surface reflectivity as a function of space and time.
 
This MODIS climatological average is the starting point to generate hyperspectral albedo maps using a Principal Component Analysis (PCA) regression algorithm. Combining different datasets of hyperspectral reflectance laboratory measurements for various dry soils, vegetation surfaces, and mixtures of both, we reconstruct the albedo maps in the entire wavelength range from 400 to 2500 nm. We obtain hyperspectral albedo maps with a spatial resolution of 0.05° in latitude and longitude, a spectral resolution of 10 nm, and a temporal resolution of 8 days. The hyperspectral albedo maps are validated against SEVIRI and TROPOMI land surface products.
 
Using the spectral dimension of our albedo maps, we select different land surface types such as forests, deserts, cities and icy surfaces, and we integrate their spectral profiles over entire regions. In this way, it is possible to reconstruct regional spectral patterns which are the combination of typical vegetation and surface spectral features, like the Vegetation Red Edge. In addition, we study the seasonal variability of every region averaging spatially integrated spectra over three months period. From these seasonal spectra, we clearly see the impact of snow cover over different regions, the difference between wet and dry seasons over boreal forests and the formation of lakes over Greenland during the boreal summer. This hyperspectral albedo dataset will lead to more refined calculations of Earth's energy budget, its seasonal variability, and could be used to improve climate simulations.

How to cite: Roccetti, G., Bugliaro, L., Gödde, F., Emde, C., Manev, M., Sterzik, M., Wehrum, C., and Hamann, U.: Development of a hyperspectral spatio-temporal surface albedo dataset for Earth, EGU General Assembly 2024, Vienna, Austria, 14–19 Apr 2024, EGU24-19187, https://doi.org/10.5194/egusphere-egu24-19187, 2024.

EGU24-2928 | Orals | ST4.7

Long-term Solar Spectral Irradiance Observations by the TSIS-1 Spectral Irradiance Monitor 

Erik Richard, Odele Coddinton, Dave Harber, Peter Pilewskie, and Tom Woods

The NASA’s Total and Spectral Solar Irradiance Sensor (TSIS-1) launched on December 15th, 2017 and was integrated on the International Space Station (ISS) to measure long-term total solar irradiance (TSI) and solar spectral irradiance (SSI). The direct measurement of the SSI is made by the LASP Spectral Irradiance Monitor (SIM) and provides data essential to interpreting how the Earth system responds to solar spectral variability. Extensive advances in TSIS-1 SIM instrument design and new SI-traceable spectral irradiance calibration techniques have resulted in improved absolute accuracy with uncertainties of less than 0.5% over the continuous 200 to 2400 nm spectral range. Furthermore, improvements in the long-term spectral stability corrections provide lower trend uncertainties in SSI variability from those of the previous SORCE SSI instruments. We present the early mission results of the TSIS-1 SIM SSI observations for the first 5 years of operations – a time-period that includes the descending phase of solar cycle 24, the last solar minimum, and the ascending phase of solar cycle 25. Comparisons are made to previous spectral measurements both in the absolute scale of the solar spectrum and the time dependence of the SSI variability. The TSIS-1 SIM SSI spectrum shows lower IR irradiance (by as much as 6% near 2400 nm) and small visible irradiance increases (~0.5%) from the previous ATLAS3 and WHI reference solar spectra, but more consistent agreement with recent SCIAMACHY and SOLAR2 reanalysis results. We also show initial comparisons to current NRLSSI2 and SATIRE-S SSI model results both for short-term (solar rotation) spectral variability and, for the first time, the longer-term (near half solar cycle) spectral variability across the solar spectrum from the UV to the IR.

How to cite: Richard, E., Coddinton, O., Harber, D., Pilewskie, P., and Woods, T.: Long-term Solar Spectral Irradiance Observations by the TSIS-1 Spectral Irradiance Monitor, EGU General Assembly 2024, Vienna, Austria, 14–19 Apr 2024, EGU24-2928, https://doi.org/10.5194/egusphere-egu24-2928, 2024.

EGU24-5966 | Posters on site | ST4.7

The JSTIM-DARA  product derived from the TSI Observations Recorded by the FY3E/JTSIM/DARA Radiometer 

Jean-Philippe Montillet, Wolfgang Finsterle, Margit Haberreiter, Daniel Pfiffner, Ping Zhu, Duo Wu, Silvio Koller, Xin Ye, Dongjun Yang, Wei Fang, Jin Qi, and Peng Zhang

Since the late 1970s, successive satellite missions have been monitoring solar activity and recording Total Solar Irradiance (TSI) data. The Digital Absolute
Radiometer (DARA) on board the Chinese FY3E spacecraft was launched on July 4, 2021, and  has since been recording TSI observations. Here, we analyze these observations and assess the performance of DARA, including sensor degradation of 5 ppm after 2 years in orbit, resulting from exposure to ultraviolet and extreme ultraviolet radiation. Comparing the new dataset’s mean values with observations from active  instruments on other spacecraft (i.e., PMO6 on board the VIRGO/SOHO and the TIM/TSIS), along with the Solar Irradiance Absolute Radiometer (SIAR) also on board  FY3E/JTSIM, we find that DARA observations closely align with TIM/TSIS, with a difference of approximately 0.07 W/m2. Based on these findings, we generate a new TSI dataset (JTSIM-DARA product) at a 6-hour sampling interval. Finally, we have incorporated this new dataset into the TSI composite time series released by the PMOD/WRC. The results indicate that the inclusion of DARA-recorded observations does not alter the consistency, reliability, and stability of the time series.

How to cite: Montillet, J.-P., Finsterle, W., Haberreiter, M., Pfiffner, D., Zhu, P., Wu, D., Koller, S., Ye, X., Yang, D., Fang, W., Qi, J., and Zhang, P.: The JSTIM-DARA  product derived from the TSI Observations Recorded by the FY3E/JTSIM/DARA Radiometer, EGU General Assembly 2024, Vienna, Austria, 14–19 Apr 2024, EGU24-5966, https://doi.org/10.5194/egusphere-egu24-5966, 2024.

The accurate determination of sea surface height begins with the precise characterization of the orbit of altimetric satellites with respect to the Earth’s center of mass. To produce precise estimates of the orbital height of such altimetric satellites, Precision Orbit Determination (POD) combines satellite-tracking information with force models, including gravity, atmospheric drag, radiation, and others, which govern the motion of these satellites.
However, it’s important to note that uncertainties arising from the modeling of non-gravitational forces, stemming from the interaction between photons, molecules, atoms, and satellite surfaces, constitute a significant source of error.


With the goal of achieving radial orbit errors below 0.1 mm/year at regional and decadal time scales, an update in the modeling of non-gravitational forces, specifically addressing Earth radiation pressure, was performed. Indeed, the traditional model used in CNES' ZOOM orbit determination software was based on an average approach (Knocke et al., 1988) accounting for latitude and time dependent reflected/emitted radiations which did not consider the spatial and temporal complexity of reflection phenomena, such as cloud dynamics.


To address this issue, an approach involving the use of observations from Earth radiation fluxes, such as CERES (NASA) and ERA5 (ECMWF), was adopted and tested during the lifetime of the Sentinel-6A and CryoSat-2 satellites. These efforts led to substantial improvements in the dynamic modeling of satellite orbits. Comparisons were made between the resulting satellite orbits and those based on the legacy model, with the aim of assessing their impact on sea level measurements. Although a slight discrepancy was observed between the two derived orbits, this difference was attributed to the introduction of empirical forces, typically employed to correct dynamic modeling errors. Consequently, an analysis of these empirical forces confirmed their relevance and underscored the value of the new force model

How to cite: Nocet-Binois, M.: Enhancing satellite orbit accuracy for sea level monitoring through Earth radiation pressure modeling, EGU General Assembly 2024, Vienna, Austria, 14–19 Apr 2024, EGU24-6134, https://doi.org/10.5194/egusphere-egu24-6134, 2024.

EGU24-10172 | ECS | Orals | ST4.7

Lunar Imaging Earthshine Telescope, juLIET, for Earth Albedo Measurements  

Katcha Winther, Peter Thejll, and René Fléron

The average global temperature of Earth is governed by the energy balance equation, comparing energy entering and leaving the Earth system. A key parameter in this balance is the Earth’s albedo, determining the ratio of the Sun’s energy being reflected from or absorbed by Earth. The global albedo varies on several different timescales – daily due to changes in cloud cover, seasonally due to changes in foliage and snowfall, and on greater timescales a change in albedo is a reflection of our changing climate. To measure these changes, multi-decadal data is needed.

Data of top-of-the-atmosphere shortwave radiation used in albedo estimation, are primarily gathered by LEO satellites using absolute measurement techniques. These are however affected by the harsh space environment, especially radiation, which causes drift errors in the data, requiring in-flight calibration. The purpose of NASA’s and ESA’s upcoming missions CLARREO and TRUHTS respectively, is to provide state of the art calibration data to account for these errors. However, they do not remove the issue all together.

As an alternative to these absolute measurements, the space based earthshine telescope juLIET (ju Lunar Imaging Earthshine Telescope) aims to estimate the albedo through relative measurements. The Earthshine albedo technique is based on comparing the intensity of Moonlight coming from the visible dayside of the Moon and the Earthshine reflected off the visible nightside of the Moon. As a relative measurement, it is more resilient to calibration drift.

Albedo measurements using the Earthshine technique have been successfully carried out from Earth, but due to Moonlight being several magnitudes brighter than Earthshine, atmospheric scattering of Moonlight reduces the possible precision on the Earthshine intensity. While the issue of atmospheric scattering is removed by going into orbit, measuring the dim Earthshine with a sufficiently high precision to be used for albedo estimation, using the same sensor that measures the Moonlight, still poses a significant challenge, due to scattering and diffraction of Moonlight within the telescope.

To determine the feasibility of the juLIET instrument, an analysis of the optical noise of the telescope is conducted. This analysis is carried out using Zemax OpticStudio and MATLAB, where main contributors to the uncertainty of the measurement are isolated and quantified.

The results of this noise analysis will be extended to determine which lunar phases juLIET can provide measurements of the Earth albedo, during its mission time as primary payload on the small-sat ROMEO developed by IRS, University of Stuttgart. 

How to cite: Winther, K., Thejll, P., and Fléron, R.: Lunar Imaging Earthshine Telescope, juLIET, for Earth Albedo Measurements , EGU General Assembly 2024, Vienna, Austria, 14–19 Apr 2024, EGU24-10172, https://doi.org/10.5194/egusphere-egu24-10172, 2024.

EGU24-10791 | ECS | Posters virtual | ST4.7

A Novel Empirical EUV Model with Uncertainty Quantification 

Daniel Brandt and Aaron Ridley

The ubiquitous usage of solar proxies in the nowcasting and forecasting of ionospheric and thermospheric conditions has seen the application of a multitude of techniques to ensure high fidelity representation of the effects of solar EUV forcing on the atmospheric state. The inherent limitations of reliance on a single solar proxy have encouraged the development of numerous EUV irradiance models in which the EUV irradiance in multiple bands is reconstructed from F10.7 solar flux. These models have progressed from lower to higher resolution, as well as higher-fidelity parameterization of time-varying components of the EUV irradiance. We contribute to this development in presenting NEUVAC, a simple, but novel empirical solar EUV model trained on FISM2 data. NEUVAC models the solar EUV irradiance from F10.7 and 81-day averaged F10.7 in 59 wavelength bands between 1 and 1750 Angstroms using a nonlinear parameterization, and performs uncertainty quantification in each band with the assistance of exclusively data-driven methods that exploit the dynamical properties of EUV, and intercorrelations between irradiance in each band. The irradiances provided by NEUVAC highlight the success of the FISM2 program, are suitable for direct ingestion into global ionosphere-thermosphere models, and are structured so that ensembles of irradiance estimates can be generated for principled forecasting and statistical assessment of downstream parameters generated by ionosphere-thermosphere models.

How to cite: Brandt, D. and Ridley, A.: A Novel Empirical EUV Model with Uncertainty Quantification, EGU General Assembly 2024, Vienna, Austria, 14–19 Apr 2024, EGU24-10791, https://doi.org/10.5194/egusphere-egu24-10791, 2024.

EGU24-11445 | Orals | ST4.7

A change in solar radio spectrum during the decay of the Modern Maximum 

Kalevi Mursula, Alexei Pevtsov, Timo Asikainen, Ismo Tähtinen, and Anthony Yeates

The Sun experienced a period of unprecedented activity during solar cycle 19 in 1950s and 1960s, now called the Modern Maximum (MM). The decay of the MM has changed the Sun, the heliosphere and the planetary environments in many ways. However, this decay may not have proceeded synchronously in all solar parameters. One of the related key issues is if the relation between the two long parameters of solar activity, sunspot number and the solar 10.7cm radio flux, has remained the same during this decay. While a number of studies agree that this relation has indeed changed, no consensus on its validity exists. A recent study argues that there is an inhomogeneity in the 10.7cm radio flux in 1980, which led to a step-like jump ("1980 jump") in this relation. If true, this would imply that the 10.7cm radio flux is ineligible for long-term studies, which would seriously impede versatile studies of the Sun during the MM.

Here we use the 10.7cm radio flux and four other, independent radio flux measurements, the sunspot number, the MgII index and the number of solar active regions in order to study their mutual relations during the decay of MM. We find that all the five radio fluxes depict an increasing trend with respect to the sunspot number from 1970s to 2010s. This excludes the interpretation of the "1980 jump" as an inhomogeneity in the 10.7cm flux, and re-establishes the 10.7cm flux as a reliable and homogeneous long-term measure of solar activity.

We find that the fluxes of longer radio waves increased with respect to the shorter waves, which implies a long-term change in the solar spectrum at radio frequencies. We also find that both the MgII index and the number of active regions increased with respect to the sunspot number, indicating a difference in the long-term evolution in chromospheric and photospheric parameters.

Our results give evidence for important structural changes in solar magnetic fields and solar atmosphere during the decay of the MM when solar activity weakened considerably. These changes have not been reliably documented so far. We also emphasise that the changing relation between the different (e.g. photospheric and chromospheric) parameters should be taken into account when using sunspot number or any single parameter in long-term studies of solar activity.

How to cite: Mursula, K., Pevtsov, A., Asikainen, T., Tähtinen, I., and Yeates, A.: A change in solar radio spectrum during the decay of the Modern Maximum, EGU General Assembly 2024, Vienna, Austria, 14–19 Apr 2024, EGU24-11445, https://doi.org/10.5194/egusphere-egu24-11445, 2024.

EGU24-11721 | Orals | ST4.7

Radiation budget at the Baltic Sea surface in 2010 – 2023 from SatBałtyk System 

Tomasz Zapadka, Mirosława Ostrowska, Damian Stoltmann, and Marcin Paszkuta

Global climate change, which causes, among other things, an accumulation of energy in the oceans, may cause irreversible changes to their ecosystems. This can be particularly quickly apparent in bodies of water that are shallow and small in relation to the Oceans, such as the Baltic Sea. In the SatBałtyk System (http://www.satbaltyk.pl), which aims to observe the state of the Baltic Sea environment based on satellite data, maps of the distributions of values of a number of physical biological and chemical parameters of the sea are collected and made available. Within the framework of this System, the SBRB (SatBałtyk Radiation Budget) model was launched, determining data on radiation budget (NET) at the sea surface. Daily maps of the spatial distribution of the radiation budget  and its components at the Baltic Sea surface are created based on data from SEVIRI, AVHRR, MODIS, SBUV/2, TOVS radiometers, and forecast auxiliary models. The component algorithms of this model were developed and validated against empirical data measured directly in the Baltic Sea (Zapadka et al. 2020). The uncertainties in the estimation of the radiation budget for the monthly averages are: RMSD 4 Wm-2 and BIAS -0.5 Wm-2. The individual downward and upward shortwave radiation fluxes are determined with an accuracy of RMSD 3 Wm-2, 1 Wm-2, BIAS 3 Wm-2, 0.1 Wm-2 respectively, and downward and upward longwave radiation fluxes are RMSD 4.5 Wm-2, 3.7 Wm-2, BIAS -0.8 Wm-2, 2.6 Wm-2 respectively. The uniform methodology used since 2010 has enabled an analysis of the variability of the radiation budget and its components at the surface of the Baltic Sea covering 14 years. Despite the natural variation in NET values and its components year-on-year, the analyses showed an annual growth trend of c. 0.7 Wm-2. Interestingly, the increasing trend applies to all NET components. An analysis of the possible causes of the trend observed in recent years may confirm the role of the anthropological factor in these changes.

How to cite: Zapadka, T., Ostrowska, M., Stoltmann, D., and Paszkuta, M.: Radiation budget at the Baltic Sea surface in 2010 – 2023 from SatBałtyk System, EGU General Assembly 2024, Vienna, Austria, 14–19 Apr 2024, EGU24-11721, https://doi.org/10.5194/egusphere-egu24-11721, 2024.

EGU24-12284 | Posters on site | ST4.7

Towards Determining the Earth Energy Imbalance from Space - Outcome of a recent ISSI International Team 

Margit Haberreiter, Julien Amand, Edward Baudrez, Wolfgang Finsterle, Nigel Fox, Dave Harber, Norman Loeb, Mustapha Meftah, Jean-Philippe Montillet, Stijn Nevens, Peter Pilewskie, Bill Swartz, Martin Wild, Duo Wu, Xin Ye, and Ping Zhu

A positive Earth Energy Imbalance (EEI) is the energy, which is continuously stored by the Earth and will ultimately released to the atmosphere, causing global warming. The "imperative to monitor Earth’s energy imbalance” (von Schuckmann et al., 2016) has been continuously reported by the Earth’s climate community. The EEI has been identified to be around 0.5 to 1.0 Wm−2. To determine its exact value both the Total Solar Irradiance (TSI) and the Top of the Atmosphere (ToA) Outgoing Radiation (TOR) need to be measured with unprecedented accuracy and precision.However, so far, the EEI could not be determined as the measurements were not sufficiently accurate. This calls for improved instrument technologies as well as a traceable calibration chain of the space instrumentation. To pave the way in that direction, the ISSI International Team "Towards Determining the Earth Energy Imbalance from Space" has been established. We collect the current knowledge of ERB measurements and identify missing elements for measuring EEI from space. Specifically, we collect past and ongoing measurements of the ERB components obtained with instruments such as CLARA, RAVAN, SIMBA, GERB, and CERES. The goal is to evaluate the performance and uncertainty of each of the instruments to identify observational challenges that need to be overcome to be able to measure both TSI and the Earth’s outgoing radiation with the required accuracy to ultimately be able to determine the absolute level of EEI from space.

How to cite: Haberreiter, M., Amand, J., Baudrez, E., Finsterle, W., Fox, N., Harber, D., Loeb, N., Meftah, M., Montillet, J.-P., Nevens, S., Pilewskie, P., Swartz, B., Wild, M., Wu, D., Ye, X., and Zhu, P.: Towards Determining the Earth Energy Imbalance from Space - Outcome of a recent ISSI International Team, EGU General Assembly 2024, Vienna, Austria, 14–19 Apr 2024, EGU24-12284, https://doi.org/10.5194/egusphere-egu24-12284, 2024.

EGU24-13691 | Orals | ST4.7

AI to Enhance the Capabilities of EUV-observing Satellites and Estimate Spectral Irradiance 

Benoit Tremblay, Robert Jarolim, Anna Jungbluth, Andrés Munoz-Jaramillo, Kyriaki-Margarita Bintsi, Miraflor Santos, James P. Mason, Angelos Vourlidas, and Sairam Sundaresan

Multiple satellites capture images of the Sun in Extreme Ultraviolet (EUV) light. However, only the Solar Dynamics Observatory (SDO) was equipped with instruments that measure the Sun's EUV spectral irradiance (i.e., MEGS-A and MEGS-B onboard the Extreme Ultraviolet Variability Experiment (EVE) suite). The MEGS-A instrument malfunctioned in 2014, making it impossible to measure the full irradiance spectrum ever since. 


Using AI, we explore the translation of a set of EUV images of the Sun into spectral irradiance, effectively replacing the malfunctioning MEGS-A instrument onboard SDO. In other words, we generate a virtual irradiance instrument, MEGS-AI, for SDO. Using an Image-to-Image translation tool (ITI), this virtual instrument can also be trained and added on other EUV-observing satellites like STEREO, GOES, SolO, and the upcoming VIGIL satellite, enabling unprecedented irradiance estimates from additional satellite missions. In the case of the STEREO twin-satellites and VIGIL, this enables estimates of spectral irradiance prior to the Sun rotating into Earth’s view, which directly enables the forecast of enhanced irradiance. Additionally, we explore different combinations of images in different EUV channels and evaluate their contributions in estimating different irradiance channels. Finally, when combined with a neural radiance field model of the Sun (SuNeRFs), MEGS-AI can estimate spectral irradiance from any viewpoint in the solar system, enabling for the first time a complete 4pi spectral irradiance map of the Sun. This can be directly used to estimate the Sun’s impact on other planets in the solar system and to determine the total solar irradiance output in multiple EUV spectral bands.

How to cite: Tremblay, B., Jarolim, R., Jungbluth, A., Munoz-Jaramillo, A., Bintsi, K.-M., Santos, M., Mason, J. P., Vourlidas, A., and Sundaresan, S.: AI to Enhance the Capabilities of EUV-observing Satellites and Estimate Spectral Irradiance, EGU General Assembly 2024, Vienna, Austria, 14–19 Apr 2024, EGU24-13691, https://doi.org/10.5194/egusphere-egu24-13691, 2024.

One of the instruments on the Geostationary Operational Environmental Satellites is the Extreme and Ultraviolet Sensor (EUVS).  Channel C of EUVS measures the Magnesium II core-to-wing ratio with high signal-to-noise ratio at a cadence of three seconds.  This presentation will describe the design of the instrument and give an overview of the data collected so far.  Available data products range from the full-cadence operational data measured every three seconds to science-quality daily averages. 


The instrument measures the spectrum of the Sun from 275 to 285 nm with a spectral resolution of 0.1 nm.  It uses a diode array with a sampling width of 0.02 nm, providing five samples per slit width. 


The first of these instruments became operational in January 2017 and continues through the present.

How to cite: Snow, M. and McClintock, W.: High Precision, High Time Cadence Measurements of the Mg II Index of Solar Activity by the Extreme Ultraviolet Sensor aboard the NOAA GOES-R Series, EGU General Assembly 2024, Vienna, Austria, 14–19 Apr 2024, EGU24-15007, https://doi.org/10.5194/egusphere-egu24-15007, 2024.

EGU24-15999 | ECS | Orals | ST4.7

Sampling the diurnal and annual cycles of Earth’s energy imbalance with constellations of satellite-borne radiometers 

Thomas Hocking, Thorsten Mauritsen, and Linda Megner

The Earth’s energy imbalance (EEI), i.e. the difference between incoming solar radiation and outgoing reflected and emitted radiation, is the one quantity that ultimately controls the evolution of our climate system. Despite its importance, the exact magnitude of the energy imbalance is not well known, and because it is a small net difference of about 1 Wm−2 between two large fluxes (approximately 340 Wm−2), it is difficult to measure directly. There has recently been a renewed interest in applying wide-field-of-view radiometers onboard satellites to measure the outgoing radiation, and hence deduce the global annual mean energy imbalance.

Here we investigate how to sample with a limited number of satellite orbits, in order to correctly determine the global annual mean imbalance. Using observational and model data, we have investigated the importance of the local and global diurnal cycles, as they are observed by a satellite, in the determination of the EEI. We simulate satellites in polar (90° inclination), sun-synchronous (98°) and precessing orbits (73°, 82°), as well as constellations of these types of satellite orbits. We present the results of ongoing work concerning different orbits, and how they affect the estimated global annual mean EEI.

How to cite: Hocking, T., Mauritsen, T., and Megner, L.: Sampling the diurnal and annual cycles of Earth’s energy imbalance with constellations of satellite-borne radiometers, EGU General Assembly 2024, Vienna, Austria, 14–19 Apr 2024, EGU24-15999, https://doi.org/10.5194/egusphere-egu24-15999, 2024.

EGU24-16132 | Orals | ST4.7

Estimate of the global and regional Ocean Heat Content changes from space gravimetry and altimetry observations to assess the Earth Energy Imbalance variations and trend 

Robin Fraudeau, Florence Marti, Benoit Meyssignac, Alejandro Blazquez, Sebastien Fourest, Michael Ablain, Victor Rousseau, Gilles Larnicol, Marco Restano, Jérôme Benveniste, Roberto Sabia, and Gérald Dibarboure

The Earth energy imbalance (EEI) at the top of the atmosphere (TOA) is the cause of the energy accumulation in the climate system. Measuring the EEI is challenging because it is a globally integrated variable whose variations are small (0.5-1 W.m−2) compared to the amount of energy entering and leaving the climate system (~ 340 W.m-2). 91% of the excess of energy stored by the planet in response to the EEI is accumulated in the ocean in the form of heat making the ocean heat content (OHC) change an accurate proxy of EEI.

In this work, we adopt the space geodetic approach which relies on the sea level budget equation to estimate the OHC changes. The thermosteric sea level change is derived at regional scale from a combination of space altimetry and space gravimetry observations, and divided by the integrated expansion efficiency of heat  to estimate the OHC changes. The global OHC (GOHC) change is then estimated by a spatial integration of the regional OHC changes. The uncertainty in GOHC is estimated by propagation of the uncertainty of input data using the input data error variance-covariance matrix to account for the instrumental and post-processing errors and for the time correlation in errors.

Regional estimates of the OHC changes are validated over the Atlantic Ocean directly against data from in-situ Argo profiles and indirectly by an energy budget approach. In the energy budget approach, surface heat flux derived from ERA5 and CERES TOA radiation budget are combined with regional OHC changes to estimate the north Atlantic meridional heat transport which is then validated against in-situ RAPID and OSNAP estimates. Both validations show good agreement in terms of signal amplitudes and variability with time correlations above 0.6. 


Over the period 1993-2022, the GOHC shows a significant positive trend of 0.75 W m-2 [0.61, 1.04] at the 90% confidence level, indicating a positive mean ocean heat uptake or EEI. Comparisons with GOHC estimates based on in-situ ocean temperature measurements over the full ocean depth show good agreement over 2005-2019 (Marti et al. 2023, in review). Over 2000-2020, the ocean heat uptake presents a positive trend of 0.33 W/m²/decade, significant at the 90% confidence level and in agreement with CERES estimate. This EEI trend  reflects an acceleration in ocean warming.


The two space geodetic products based on space altimetry and space gravimetry are freely available on the AVISO website. One estimating the GOHC and EEI (https://doi.org/10.24400/527896/a01-2020.003), the other estimating regional OHC over the Atlantic Ocean (https://doi.org/10.24400/527896/a01-2022.012).

How to cite: Fraudeau, R., Marti, F., Meyssignac, B., Blazquez, A., Fourest, S., Ablain, M., Rousseau, V., Larnicol, G., Restano, M., Benveniste, J., Sabia, R., and Dibarboure, G.: Estimate of the global and regional Ocean Heat Content changes from space gravimetry and altimetry observations to assess the Earth Energy Imbalance variations and trend, EGU General Assembly 2024, Vienna, Austria, 14–19 Apr 2024, EGU24-16132, https://doi.org/10.5194/egusphere-egu24-16132, 2024.

The Earth energy imbalance (EEI) is a fundamental climate variable that characterizes the energy state of the climate system. When integrated over multiple years, EEI estimates provide the net energy gain (or loss) by the climate system. In addition, measuring accurately the EEI along with surface temperature and atmospheric composition is essential to separate the role of different radiative forcing from the role of feedbacks on the global energy budget enabling further to constraint effective and equilibrium climate sensitivities. In this presentation I review the current EEI observing system performance and uncertainty. I intercompare the different EEI datasets, originating from in-situ and space-based observing systems to evaluate their differences and to assess their uncertainty.

Since 2000 the Clouds and the Earth’s Radiant Energy System (CERES) project provides satellite-based observations of the Earth radiation budget and the EEI with the highest precision (±0.3W.m-2 -1s- on a monthly basis). Nevertheless, because of limitation in the absolute calibration of CERES radiometers the CERES final product needs a bias correction (of about ±2.5W.m-2 -1s-) on the EEI mean. The current best approach to estimating the mean EEI is to estimate the ocean heat uptake (OHU)  which represent 89% of the energy storage  due to the EEI.  Today, the OHU can be derived with the highest accuracy (±0.18W.m-2 -1s- on the mean OHU), from in situ ocean temperature measured by Argo or from the thermal expansion estimated by the difference between satellite altimetry sea level and ocean mass from GRACE. On 2-yr and longer time scales, OHU and CERES EEI estimates show good agreement in EEI variability. But OHU approaches cannot resolve the EEI variability below 1 yr because the energy gain (or loss) induced by EEI over such small time-scales is of the same order of magnitude as the global exchanges of energy between the atmosphere and the ocean.

The different EEI measurements have enabled since 2005 a robust estimate of the mean EEI of +0.75±0.18W.m-2 that is essentially due to anthropogenic emissions of greenhouse gases (GHG). They have also allowed to detect a significantly positive trend in EEI of 0.4±0.3W.m-2 per decade, leading to a doubling of the EEI during the past 20 years in response to continued increases in GHG emissions combined with decreases in aerosol emissions. In addition, on interannual time scales, they showed that the variability in EEI is mostly sensitive to low cloud variability, with ENSO controlling the ±0.5W.m-2 variability on the 4-7yr time scale.  Today, new scientific challenges related to EEI are emerging like the closure of the energy budget from top of the atmosphere to the bottom of the ocean at monthly to decadal time scales, the estimate of the current effective climate sensitivity, the monitoring of the physical climate system response to GHG mitigation policies and others. These new challenges lead to new requirements on the EEI observing system ranging from sustained continuity to higher precision and accuracy. I discuss briefly the need to refine these requirements and some opportunities to meet them in the future.

How to cite: Meyssignac, B.: Mean, Trend, variability and uncertainty in Earth's Energy Imbalance over the last two decades, EGU General Assembly 2024, Vienna, Austria, 14–19 Apr 2024, EGU24-16610, https://doi.org/10.5194/egusphere-egu24-16610, 2024.

TRUTHS (Traceable Radiometry Underpinning Terrestrial- and Helio-Studies) is an operational climate mission, aiming to enhance, up to an order-of-magnitude, our ability to estimate the Earth radiation budget, spectrally resolved to support attribution. Through direct measurements of incoming total and spectrally resolved solar irradiances and Earth reflected radiances, spatially resolved, it establishes ‘benchmarks’ against which change/trends can be detected in as short a time as possible. These fiducial reference data sets can be combined with data from other sensors and also serve as ‘gold standard’ references to anchor and upgrade the performance of other space sensors through in-orbit calibration.

TRUTHS will become a founding member of a new class of satellites called SITSats, SI-Traceable Satellites, with payloads explicitly designed to achieve and evidence an uncertainty, in-orbit, at a level commensurate with the exacting goals of long-time-base climate studies. SITSats also facilitate interoperability and enhanced trust in the data from the Earth observation system as a whole, helping to provide observational evidence-based confidence in actions addressing the climate emergency. 

The unprecedented uncertainty of TRUTHS’ globally sampled hyperspectral data underpins many additional applications:

  • Establishing an interoperable, harmonised Earth Observing system incorporating agency and commercial satellites: large and small
  • Top and Bottom of atmosphere reflectances impacting carbon cycle (e.g. land cover, ocean colour, vegetation, methane etc together with similar applications of other hyper/multi-spectral missions). Low uncertainty also facilitates improvements in retrieval algorithms.
  • Transferring radiometric reference values to existing Cal/Val infrastructure (e.g. RadCalNet, Pseudo-Invariant Calibration sites, In-situ ocean colour reference observations; selected surface reflectance test-sites (fluxnet, …), both nadir and multi-angular) and Moon observations.

The mission comprises an “agile” satellite capable to point and image the Earth, Moon and Sun from a 90°polar orbit by the Hyperspectral Imaging Spectrometer (HIS). The HIS provides spectrally continuous observations from 320 to 2400 nm, with a spectral sampling between 2 and 6 nm and a spatial sampling of 50 m. The payload utilises a novel SI-traceable on-board calibration system (OBCS), comprising of the Cryogenic Solar Absolute Radiometer (CSAR), able to realise SI-traceability in space and also measure incoming solar radiation. Together with other optical elements the OBCS links the HIS observations to the CSAR with a target expanded uncertainty 0.3% (k=2).

TRUTHS is implemented by the European Space Agency (ESA) as a UK-led Earth Watch mission in collaboration with Switzerland, Czech Republic, Greece, Romania and Spain. The mission was conceived by the UK national metrology institute, NPL, in response to challenges highlighted by the worlds space agencies, through bodies such as CEOS addressing observational needs of GCOS. The mission is under development by an industrial consortium led by Airbus Defence and Space UK, with a target launch date of 2030 and minimal operations life-time of 5 years with a goal of 8 yrs.

Together with FORUM (ESA) and IASI-NG (CNES/EUMETSAT) it will provide spectrally resolved Earth radiance information from the UV to the Far-Infrared in the coming decade, and in partnership with CLARREO-Pathfinder (NASA) and CSRB (CMA) inaugurate a future constellation of SITSats.

How to cite: Fox, N., Fehr, T., Marini, A., August, T., and Remedios, J.: Traceable Radiometry Underpinning Terrestrial- and Helio- Studies (TRUTHS) – A ‘gold standard’ imaging spectrometer in space for radiation imbalance and in support of the climate emergency , EGU General Assembly 2024, Vienna, Austria, 14–19 Apr 2024, EGU24-18864, https://doi.org/10.5194/egusphere-egu24-18864, 2024.

AS4 – Interdisciplinary Processes

EGU24-3232 | Posters on site | AS4.2

A climatological satellite view of marine cold air outbreaks in the northeast Atlantic 

Abhay Devasthale and Michael Tjernström

Given the high rate of sea ice loss and the Arctic amplification, the dynamical processes responsible for airmass transport into or out of the Arctic, thus affecting the seasonal melt and recovery of sea ice, need to be understood and scrutinized from different observational perspectives. In a classical, rather binary view of transport “into or out of the Arctic”, a lot of attention in the recent years has rightfully been given on understanding the role of heat and moisture transport into the Arctic in regulating the sea ice melt. However, the cold and dry Arctic airmasses with long residence times are more than occasionally transported out of the Arctic over the open ocean waters, creating one of the most spectacular air mass transformations: the marine cold air outbreaks (MCAOs). The most tangible manifestation of MCAOs are the convectively rolled, narrow cloud streets formed over open water off the edges of the Arctic sea ice in the Nordic and Barents Seas, seen vividly in visible satellite imageries. MCAOs can also locally influence the onset of sea ice melt as they often happen in spring.  

By combining nearly 20 years of remotely sensed data from the hyperspectral Atmospheric Infrared Sounder (AIRS), the Moderate Resolution Imaging Spectroradiometer (MODIS) and the Clouds and the Earth’s Radiant Energy System (CERES) instruments onboard NASA’s Aqua satellite, this study presents a climatological view of the vertical structure of atmosphere and the cloud radiative effects during MCAOs in the northeast Atlantic.

How to cite: Devasthale, A. and Tjernström, M.: A climatological satellite view of marine cold air outbreaks in the northeast Atlantic, EGU General Assembly 2024, Vienna, Austria, 14–19 Apr 2024, EGU24-3232, https://doi.org/10.5194/egusphere-egu24-3232, 2024.

EGU24-3662 | ECS | Orals | AS4.2

Non-conservative nature of Boron in low salinity Arctic ice and ice melt zones 

Samantha Rush, Chang-Ho Lee, Kitack Lee, Penny Vlahos, and Lauren Barrett

The Arctic Ocean is one of the most rapidly changing environments on the planet as sea ice extent and thickness have declined extensively over the last 40 years. It is predicted that by 2050, Arctic summers will become mostly ice-free, and the Arctic Ocean will be dominated by seasonally annual, rather than multiyear, sea ice. Arctic sea ice serves as a mediator of biogeochemical processes globally, though the impacts of increased ice melt and water column freshening on Arctic biogeochemistry are uncertain. Specifically, declining sea ice raises significant concerns regarding the future carbon uptake potential of the Arctic and the buffering capacity, or alkalinity, of seawater. Boron (B) is a major element in seawater, and in the form of the borate ion, it serves as the third largest contributor to alkalinity. Boron concentrations in the open ocean are typically conservative and accounted for through relationships with other water components, such as with salinity (S) in the boron to salinity ratio (B/S). Well established B/S ratios have been defined for the open ocean; however, salinity variability can create discrepancies in the open ocean boron corrections for alkalinity. In 2021, work in the marginal ice zone of the Bering and Chukchi Seas revealed non-conservative boron behavior and significant alkalinity system inaccuracies based on the deviation in computed B/S ratios in ice cores and brine. In this study, we investigate the B/S ratio in ice melt zone waters, snow, brine, annual, and multiyear sea ice from the eastern Arctic basin. A total of 169 samples were collected during the onset on melt (May-June 2023) on the ARTofMELT expedition across a range of salinities (2 - 63). High salinity samples (S>29) included 1 lead, 7 brine, 16 under-ice, and 28 open ocean water samples. Low salinity samples (S<29) included 1 brine, 10 snow, and 106 ice core samples. Excluding snow, results indicate deviations from the accepted open ocean B/S ratio (0.1336 mg/kg). For both the entire high salinity sample set and the open ocean subset within it, the B/S average value (0.1304 ± 0.001 mg/kg) was lower. For low salinity samples, the average B/S value (0.1328 ± 0.003) was higher than the high salinity sample value but still lower than the accepted field value. The range of B/S ratios was much larger in low salinity samples (0.1260-0.1425 mg/kg) than high salinity samples (0.1275-0.1350 mg/kg); however, both ranges were significantly smaller than the 2021 B/S ratio range (0.0900-0.1850 mg/kg). The smaller deviation from the accepted B/S ratio in this study resulted in carbon system analysis inaccuracies less than 2 µmol/kg across the entire salinity range. We present the computed B/S ratios and the differences in these datasets using the δ18O isotopic ratios to understand the heterogeneity of western, annual ice in the marginal ice zone and eastern, multiyear ice in pack ice regions. The marked distinction in the datasets allows potential insight into boron concentrations and the conversion of total alkalinity to carbonate alkalinity across current and future systemic climate-change shifts in the Arctic.

How to cite: Rush, S., Lee, C.-H., Lee, K., Vlahos, P., and Barrett, L.: Non-conservative nature of Boron in low salinity Arctic ice and ice melt zones, EGU General Assembly 2024, Vienna, Austria, 14–19 Apr 2024, EGU24-3662, https://doi.org/10.5194/egusphere-egu24-3662, 2024.

EGU24-4403 | ECS | Posters on site | AS4.2

Near-surface particle concentration profiles above the Arctic sea ice 

Theresa Mathes and Andreas Held

The Arctic region is warming rapidly, and aerosol-cloud-sea-ice interactions are considered to be one of the key features of the Arctic climate system. It is therefore crucial to identify Arctic particle sources and sinks in order to study their impact on cloud formation and properties. Scott and Levin (1972) were the first to describe open leads as potential sources of atmospheric particles and thus a local source of particle emissions in the central Arctic. Held et al. (2011) found that open leads and ice ridges in particular emit high levels of particles. Particle concentrations have also been shown to be altered by the intrusion of warm and moist air masses and can be strongly enhanced in turbulence-dominated cases (You et al., 2022). Despite significant progress in Arctic research in recent years, there is still a lack of information on near-surface particle concentrations over different surface types, especially before and during the ice-melting period.

Here, we present measurements of near-surface particle concentration profiles to help to quantify the vertical aerosol exchange between Arctic sea ice and the atmosphere. In spring 2023, during the research cruise ARTofMELT on board the icebreaker Oden, we successfully carried out vertical particle measurements. From 17 May to 9 June 2023, near-surface particle concentration profiles were measured during 16 individual measurement periods. Due to the early season, measurements could be taken both before and during the melting process.

For the profile measurements, an aersol inlet was automatically moved up and down by a 1.50 m linear actuator. A plate was attached to the lift to hold sensors for the distance, wind and temperature as well as the aerosol inlet. An  box containing the condensation particle counter (CPC 3007, TSI, St. Paul, MN, USA) was connected to the inlet. Total particle number concentrations with a lower cut-off diameter of 10 nm were then determined at six different heights from 6 cm above the surface to 1.30 m. These measurements were carried out on the ice close to an open lead or surrounded by a closed ice surface.

Figure 1 shows an example for two days of fluxes at 79.8 ° N and 1.9° W. Due to the proximity to the open lead, an emission (red) of aerosols predominates, which is partially alternated by a deposition (blue). The flow calculations are based on 26 height profiles measured on 17 May and 24 on 18 May.

We thank our colleagues from Leibniz Institute for Tropospheric Research, Stockholm University, Swedish polar research secretariat as well as all expedition participants who provided insight and expertise that greatly assisted the research.

Held, A., Brooks, I.M., Leck, C., and Tjernström, M. (2011) On the potential contribution of open lead particle emissions to the central Arctic aerosol concentration. Atmos.Chem.Phys. 11, 3093-3105.
Scott, W. D. and Z. Levin (1972) Open channels in sea ice as ion sources. Science 177, 425-426.
You, C., Tjernström, M., Devasthale, A. (2022) Warm and moist air intrusions into the winter Arctic: a Lagrangian view on the near-surface energy budgets. Atmos.Chem.Phys. 22, 8037–8057.

How to cite: Mathes, T. and Held, A.: Near-surface particle concentration profiles above the Arctic sea ice, EGU General Assembly 2024, Vienna, Austria, 14–19 Apr 2024, EGU24-4403, https://doi.org/10.5194/egusphere-egu24-4403, 2024.

EGU24-5124 | ECS | Orals | AS4.2 | Highlight

Is spring melting in the Arctic detectable by under-ice radiation? 

Philipp Anhaus, Christian Katlein, Marcel Nicolaus, Noémie Planat, and Martin Schiller

A trend towards earlier sea-ice melt is detected in many ice-covered regions in the Arctic. The timing of the melt onset has a strong impact on the sea-ice energy budget. Melt onset changes the radiative properties of the ice due to increasing snow wetness and meltwater. So far, satellite passive microwave data are used to detect the melt onset. We analyzed transmitted radiation spectra as collected underneath drifting sea-ice using a remotely operated vehicle during the ARTofMELT expedition in the Fram Strait in spring 2023. We colocated those spectra with measurements of snow depth, sea ice and surface topography, chlorophyll-a concentration in the water column, and with aerial images. This combined dataset enables us to track down possible subsurface pathways and accumulation pools of meltwater. Areas of low snow load and depressed surface topography are characterized by higher transmitted radiation compared to areas with a thick snow cover. Those areas overlapped with areas that showed the first signs of surface melt. Chlorophyll-a concentrations varied only slightly in magnitude and did not match with the heterogeneous pattern of snow depth and ice topography. Here we discuss how to disentangle the influences of chlorophyll a and the subsurface meltwater on the spectral shape of transmitted radiation. We propose that upon successful disentanglement, the spectra can be used as an indicator for subsurface melting. Our study suggests that sea-ice melting starts subsurface and that measurements of transmitted solar radiation spectra could be used to identify the melt onset prior to surface melting. This can provide an interesting complementary information on melt occurrence and on the location of the water in the snowpack in addition to satellite passive microwave data.

How to cite: Anhaus, P., Katlein, C., Nicolaus, M., Planat, N., and Schiller, M.: Is spring melting in the Arctic detectable by under-ice radiation?, EGU General Assembly 2024, Vienna, Austria, 14–19 Apr 2024, EGU24-5124, https://doi.org/10.5194/egusphere-egu24-5124, 2024.

EGU24-5372 | Orals | AS4.2

Impact of warm and moist intrusions on black carbon deposition and summer snow melt in the central Arctic 

Hélène Angot, Marion Réveillet, and Julia Schmale and the MOSAiC team

Warm and moist intrusions (WAMIs) into the central Arctic, predominantly observed in winter and early spring, are becoming more frequent, significantly affecting the region’s near-surface energy budget. This study focuses on the deposition pulses of black carbon (BC) triggered by WAMIs and their subsequent impact on snow properties and melting during the summer, using a modeling approach and comprehensive datasets from the 2019–2020 Multidisciplinary drifting Observatory for the Study of the Arctic Climate (MOSAiC) expedition. Our findings reveal that WAMIs induce episodes of intense BC wet deposition in the central Arctic shoulder season (Nov–Apr) due to transported pollution and moisture. We demonstrate that WAMIs result in exceptionally high BC deposition (> 4 orders of magnitude compared to typical winter/spring conditions) across an area of nearly 1 million km2, approximately 20% of the central Arctic Ocean. Furthermore, we establish a direct connection between these winter/spring BC deposition pulses and subsequent summer increases in absorbed solar energy (> 4 W/m2) and snowpack melt rate (+15%). Despite their sporadic occurrence (only 8% of the time), WAMIs play a significant role in the central Arctic surface energy budget through the BC snow albedo effect.

How to cite: Angot, H., Réveillet, M., and Schmale, J. and the MOSAiC team: Impact of warm and moist intrusions on black carbon deposition and summer snow melt in the central Arctic, EGU General Assembly 2024, Vienna, Austria, 14–19 Apr 2024, EGU24-5372, https://doi.org/10.5194/egusphere-egu24-5372, 2024.

EGU24-5901 | ECS | Posters on site | AS4.2

Aerosol-Cloud-Precipitation Interactions in the Arctic: Insights from the ARTofMELT Campaign 

Lea Haberstock, Julia Asplund, Almuth Neuberger, Luisa Ickes, Gabriel Freitas, Fredrik Mattsson, Darrel Baumgardner, Ilona Riipinen, and Paul Zieger

Aerosol-cloud interactions play a crucial role in the Arctic’s radiative budget. During the campaign ‘Atmospheric rivers and the onset of sea ice melt’ (ARTofMELT 2023) we aimed to improve our understanding of aerosol-cloud interactions by conducting in-situ measurements of microphysical and chemical properties of aerosols, cloud droplets, and precipitation in the Arctic during the onset of sea ice melt. A ground-based fog and aerosol spectrometer (GFAS) and a fog monitor (FM-120) from Droplet Measurement Technologies (DMT) were used to measure among other things droplet size, number concentration, and liquid water content. Precipitation was measured with a meteorological particle spectrometer (MPS, DMT). Throughout the campaign, we observed several fog and blowing snow events, along with occasional precipitation. These events provided an opportunity to investigate and compare the distinctive microphysical properties associated with each event. Our findings reveal significant variations in the size distribution and particle phase of blowing snow, precipitation, and fog.

How to cite: Haberstock, L., Asplund, J., Neuberger, A., Ickes, L., Freitas, G., Mattsson, F., Baumgardner, D., Riipinen, I., and Zieger, P.: Aerosol-Cloud-Precipitation Interactions in the Arctic: Insights from the ARTofMELT Campaign, EGU General Assembly 2024, Vienna, Austria, 14–19 Apr 2024, EGU24-5901, https://doi.org/10.5194/egusphere-egu24-5901, 2024.

EGU24-5950 | ECS | Posters on site | AS4.2

What we can learn from aerosol size distribution measurements over the spring Arctic pack ice 

Julia Asplund, Lea Haberstock, Jessica Matthew, Fredrik Mattson, Lovisa Nilsson, Erik Swietlicki, Megan Willis, Cort Zang, and Paul Zieger

Aerosol- cloud interactions remain among the most uncertain key parameters in the fast-changing Arctic climate system, in large part due to a lack of observational data from this hardly accessible region. The spring-summer transition is a particularly under sampled time period, due to harsh ice conditions. Here, we present five weeks of aerosol size distribution measurements over the spring Arctic pack ice, including more than 30 hours of in-cloud data, obtained during the ARTofMELT 2023 expedition. A setup of three inlets, including a whole-air, an interstitial, and a counterflow virtual impactor inlet, were used to cover the full aerosol population as well as both the activated and interstitial aerosol when in cloud. We will show an overview of the collected observations and the link between the size distribution properties and parallel measured aerosol parameters such as chemical tracers, as well as an air mass source analysis. Fog events were recorded during a range of aerosol conditions, allowing us to study the activated fraction when concentrations span from under 20 particles per cc, to over 150. The dataset also features several distinct regimes where different processes such as blowing snow, new particle formation, and secondary ice production dominate or influence the aerosol population, and we will demonstrate how the regimes are characterized by the dominant mode of the size distribution.

How to cite: Asplund, J., Haberstock, L., Matthew, J., Mattson, F., Nilsson, L., Swietlicki, E., Willis, M., Zang, C., and Zieger, P.: What we can learn from aerosol size distribution measurements over the spring Arctic pack ice, EGU General Assembly 2024, Vienna, Austria, 14–19 Apr 2024, EGU24-5950, https://doi.org/10.5194/egusphere-egu24-5950, 2024.

EGU24-6663 | Orals | AS4.2

Perspectives on limitations and mechanisms for atmospheric initiation of onset of the summer melt season over sea ice 

Christopher Cox, Amy Solomon, Ola Persson, Matthew Shupe, Michael Gallagher, Von Walden, Michael Town, Donald Perovich, Sarah Webster, and Jacob Anderson

Onset of surface melt over sea ice is a factor in the duration of the melt season. Onset is often triggered by advection of warm, moist air from lower latitudes. This is especially characteristic of early dates of onset, but such events have also been hypothesized to precondition the ice for an earlier onset even when they don’t act as the trigger. The importance of atmospheric advection to the melt season is well-recognized by the community. Less attention has been given to the potential limitations of these events and to what alternate mechanisms may also be important for initiation, which is the subject of this presentation. We discuss two case studies.

In the first case, atmospheric advection from the North Atlantic in late May 2020 caused onset to occur over a wide area of the sea ice north of Greenland, including the floe being measured by the Multidisciplinary drifting Observatory for the Study of Arctic Climate (MOSAiC) expedition. Approximately 6 weeks prior, in April, an anomalously warm advection event also impacted the MOSAiC floe and was responsible for ~40% of the total warming the ice underwent that spring. Using a diffusion model for the ice forced by surface temperatures that both include (observationally) and exclude (synthetically) the April event, we show that its influence relative to its absence was reduced by ~80% within 10 days. The result is explained by a negative feedback that suppresses conduction within the ice when warming events occur. Consequently, despite the apparent influential nature of the April event suggested by the observations, the ice temperatures would likely have been similar several weeks before onset if the April event had not occurred. This implies there are limitations to such events in preconditioning the sea ice for early onset.

Our second case examines data collected from a buoy in the Beaufort Sea during a regional onset event observed in June 2022. In this case, the air that caused melt at the buoy came from the north during a period of generally zonal flow of the polar jet (and lack of poleward moisture transport). Analysis of back trajectories indicates that the air had a residence time in the Arctic of 7-10 days prior to causing melt. The air began at mid-tropospheric levels near the pole then circulated around persistent, large-scale high pressure over the East Siberian Sea, descending along its track. Reanalysis data suggests the adiabatic contribution to the subsidence was sufficient to warm the air to the freezing point when it reached the surface, moving southward across the Beaufort Sea. This case indicates that subsidence is a mechanism internal to the Arctic that is capable of causing melt onset, though its climatological significance remains an open question.

How to cite: Cox, C., Solomon, A., Persson, O., Shupe, M., Gallagher, M., Walden, V., Town, M., Perovich, D., Webster, S., and Anderson, J.: Perspectives on limitations and mechanisms for atmospheric initiation of onset of the summer melt season over sea ice, EGU General Assembly 2024, Vienna, Austria, 14–19 Apr 2024, EGU24-6663, https://doi.org/10.5194/egusphere-egu24-6663, 2024.

EGU24-11158 | ECS | Orals | AS4.2

Synoptic situation during the ARTofMELT 2023 spring expedition 

Sonja Murto and Michael Tjernström

A 6-week long expedition ARTofMELT (Atmospheric rivers and the onset of Arctic sea-ice melt) with the Swedish Icebreaker Oden took place in the Arctic Ocean during late winter and spring of 2023. The aim was to collect observations and study processes leading up to the sea-ice melt onset. One of the targets was to assess the role of atmospheric rivers (ARs), i.e., southerly warm and moist-air injections, in advancing the melt-timing. This paper presents the synoptic situation during the expedition, based on observations measured onboard Oden and reanalysis data (ERA5). Additionally, the origin and paths of airmasses reaching Oden are determined using 7-day backward trajectories computed with the Lagrangian analysis tool LAGRANTO. The meteorological conditions were quite dynamic during these 35 days, strongly influenced by several (at least 6) surface cyclones passing Oden and only two warming events accompanied by rather weak ARs were observed, the latter one leading to the melt onset at the end of the expedition.


Based on meteorological conditions from 6-hourly launched radiosoundings, the expedition can be divided into six periods. The first short period encompasses the first days of the expedition, when Oden was located at the marginal ice zone. The winds were variable, mainly southerly, and it was moist with slightly below-freezing temperatures. As Oden was moving northwestwards, a one-week cold (~-15 - -10) and dry period followed. This period was mainly governed by northerly winds, guided by a persistent family of surface cyclones located over the Laptev and Kara Seas. The first major storm, that coincided with an atmospheric blocking over Scandinavia, was related to a cyclone forming to the southwest of Greenland and moving northeast, bringing winds over 25 m/s as it hit Oden on 13 May.  Northerly winds followed after the stormed had passed, guided by a surface pressure dipole between a high over Greenland and a low over the Arctic Ocean.


The first one-week long ice camp was built at the end of the second period, extending into the third period. A low-pressure over Greenland and high-pressure and an upper-level blocking over Scandinavia resulted in a pathway for a transient warm-air mass from the south, and melting was observed for the first-time. However, this warming was only temporary, as temperatures dropped below freezing after the AR had passed. Several weaker storms governed this third milder period, ending with the second major storm associated with a cyclone on 25 May. Again, winds turned northerly after the storm passed, which made the entry to the fourth longer, colder and drier period. The second 2-week long ice camp was established at the beginning of this period and expanded over the two last periods. These captured the forecasted (6 June) and the real melt onset (10 June). A surface pressure dipole with a high over Greenland and a low over the Arctic Ocean dominated at the beginning of the fifth period, and warm but dry air aloft was observed. As the winds turned southerly, the melt-onset period was characterized as warm and moist.

How to cite: Murto, S. and Tjernström, M.: Synoptic situation during the ARTofMELT 2023 spring expedition, EGU General Assembly 2024, Vienna, Austria, 14–19 Apr 2024, EGU24-11158, https://doi.org/10.5194/egusphere-egu24-11158, 2024.

EGU24-11515 | ECS | Posters on site | AS4.2

Overview of SMÄLTA: Secondary Marine Aerosol precursors and Links to aerosol growth at ice-melT onset in the Arctic 

Cort Zang, Megan Willis, Julia Asplund, Fredrik Mattsson, Paul Zieger, and Michael Tjernström

The sources, composition, and reactive transformation of reactive organic carbon (ROC, non-methane organic carbon) as well as the processing, abundances, and distribution of organosulfur compounds in the Arctic marine atmosphere are unconstrained partially due to a lack of targeted measurements.  Understanding the emission, transport and processing of ROC and organosulfur compounds is important for improving our understanding of the impacts of gaseous precursors on aerosol nucleation and growth, and atmospheric oxidation capacity. There is a shift in aerosol size distribution that occurs with the Arctic spring-to-summer transition period and there are very few Arctic marine measurements of trace gases during this same period. Constraining the composition of organosulfur compounds and ROC is important for understanding the drivers in the shift of aerosol size distribution.

We present shipborne gas-phase measurements of ROC and organosulfur compounds in the Arctic marine atmosphere as part of the Atmospheric Rivers and the onseT of sea ice MELT (ARTofMELT) campaign. ARTofMELT took place from May 7th to June 15th of 2023 over pack ice and within the marginal ice zone between 78 and 81°N in the Fram Strait. We deployed a reagent ion switching chemical ionization mass spectrometer to target ROC and organosulfur compounds using H­3O+ ionization for the detection of reduced compounds and NH4+ ionization for the detection oxidized species. The measurements encompass a variety of different conditions including ozone depleted air masses (<10ppbv), cloud influenced air masses, a range of aerosol concentrations, and air masses with southern and northern airmass history with influences from biologically rich marine regions as well as transport from over pack ice. Additionally, measurements of ROC show the presence of ≥C5 organics in the environment with implications for aerosol size and growth. Here, we show an overview of our measurements and some initial observations of the ROC present during the campaign.

How to cite: Zang, C., Willis, M., Asplund, J., Mattsson, F., Zieger, P., and Tjernström, M.: Overview of SMÄLTA: Secondary Marine Aerosol precursors and Links to aerosol growth at ice-melT onset in the Arctic, EGU General Assembly 2024, Vienna, Austria, 14–19 Apr 2024, EGU24-11515, https://doi.org/10.5194/egusphere-egu24-11515, 2024.

EGU24-12340 | ECS | Orals | AS4.2

Sea ice drift and wave pattern analysis of the early melt onset during the ARTofMELT cruise 2023 

Thibault Desjonquères, Leif E. B. Eriksson, Malin Johansson, Denis Demchev, Truls Karlsen, Timo Vihma, and Bing Cheng

In May-June 2023 the ARTofMELT 2023 expedition took place, with the aim to capture the melt onset in the Arctic Ocean. For the sea ice dynamics part of the cruise, in-situ observations were collected to co-inside with satellite observations, enabling studies of changes in drift patterns, capture the breakup of ice floes and studies of changes in backscatter signatures in satellite images as a consequence of melt onset. 

Seven OpenMETbuoys-v2021 and three SIMBA buoys, were placed on four first-year ice floes, away from the Marginal Ice Zone (MIZ). The OpenMETbuoys, equipped with GNSS (Global Navigation Satellite Systems), gyro, and accelerometer, facilitated horizontal motion, rotation, potential deformation, and wave action analysis. SIMBA buoys, with GNSS and thermistor strings, focused on temperature effects connected to melt onset. Three OpenMETbuoys and one SIMBA buoy were deployed on two larger floes. The two remaining drifters were deployed on individual floes. Deploying multiple buoys on each floe allowed detailed examination of small-scale drift changes, convergence, divergence, rotational patterns, frequencies, and connections to satellite Synthetic Aperture Radar (SAR) images. This deployment provides insights into the remaining wave energy in the pack ice. 

Low noise Radarsat Constellation Missions (RCM) SAR images in dual polarization (HH+VV or HH+HV) were acquired to overlap with the campaign in space and time. The temperature sensors onboard the SIMBA buoys enables us to connect changes in  backscatter values in the SAR images from the winter conditions into the early melt season and help define limitations for the SAR sea ice drift retrieval algorithm. 

Initial findings from wave and GNSS data offer insights into the condition of ice floes, including dislocation, disintegration, melting, and interactions with neighboring floes. The dislocation of the floes is indicated by the physical dissociation of the buoys present on the same floe. The OpenMETbuoys' recorded wave height and wave period indicate the drifter's location: on ice, in a transition phase on a small piece of ice or floating in the water between pieces of brash ice, or in open water.

Regarding the two bigger floes, on the first one, the drifters were launched 2023-05-22. An OpenMET drifter was dislocated from the rest of the floe on the 26th of May, and was in the transition phase on the 1st of July. The two remaining drifters were separated on the 29th of May. The last OpenMET drifter reached the transition phase on the 25th of May. The drifters on the second floe were launched 2023-05-28. The first dislocation occurred on the 8th of June, the second one on the 18th of June. The two remaining OpenMET drifters on this floe reached the transition phase on the 13th of June and 15th of June. The third floe contained a SIMBA drifter launched 2023-06-06 and the fourth one an OpenMETbuoy launched 2023-05-28. The latter reached the transition phase on the 10th of June.

How to cite: Desjonquères, T., Eriksson, L. E. B., Johansson, M., Demchev, D., Karlsen, T., Vihma, T., and Cheng, B.: Sea ice drift and wave pattern analysis of the early melt onset during the ARTofMELT cruise 2023, EGU General Assembly 2024, Vienna, Austria, 14–19 Apr 2024, EGU24-12340, https://doi.org/10.5194/egusphere-egu24-12340, 2024.

EGU24-15627 | Orals | AS4.2 | Highlight

Arctic spring and the onset of sea-ice melt: Early impressions from the ARTofMELT expedition 

Michael Tjernström, Paul Zieger, and Sonja Murto and the ARTofMELT Science Team

The spring season in the Arctic Ocean has gained relatively little attention with detailed observations from expeditions, due to difficulties to navigate in the ice at this time of the year. This paper reviews experiences from the ARTofMELT (Atmospheric rivers and the onset of sea-ice melt) expedition in spring of 2023.

ARTofMELT had two objectives: To study processes leading up to the onset of the sea-ice melt and to explore links to so-called atmospheric rivers (ARs). ARs are spatially and temporally distinct inflows of warm and moist air from farther south. To fulfill these goals, we instrumented the Swedish research icebreaker Oden and planned to locate her in the Atlantic sector of the Arctic Ocean north of Svalbard from early May to mid-June. Oden was equipped with advanced meteorological instrumentation including standard meteorology and 6-horly radiosoundings, radar and lidars for cloud and wind measurements, and a surface flux tower with eddy-covariance. An advanced suite of atmospheric chemistry and aerosol observations were also deployed along with water isotope measurements, and also sampled and profiled the upper ocean structure. To identify upcoming ARs, we used ensemble forecasts from the European Centre for Medium-Range Weather Forecasts (ECMWF) at lead time up to seven days, to allow time to navigate the icebreaker to optimal positions and establish ice camps. While carrying out most of the observations on board, in-situ observations on the ice provide valuable details on the impact of ARs on the ice. On ice camps we therefore deployed a surface energy budget station and an ROV surveying the ice from below and also flew a tethered balloon HELIKITE system from the aft of the ship. Additionally, we also used the helicopter to deploy scientists on the ice (sampling snow, ice and water) and deploying buoys, and for flying the HELIPOD instrument package.

ARTofMELT left Svalbard on 8 May and returned on 15 June. Starting with quite cold later winter conditions there was a brief warming period around mid-May, with an AR that brought air temperatures above the melting point twice (19 and 20 May). This was interrupted by a major storm, followed by a cooler period. From the end of May the surface started to gain heat, culminating in the onset of the melt at a second AR on 10 June. Both ARs were documented from ice stations.

A major uncertainty was the navigation in the ice during late winter and this also tuned out to be the most difficult part of the deployment. The ice was thick and hard to break, the size of the largest ice floes was much larger than expected and short-term variations of the ice pressure made navigation very difficult. The maximum latitude obtained was ~80.5 °N, hence, we stayed in the Fram Strait ice pack. Also, only two brief ARs were encountered, less than expected. In spite of this we were able to gain a large amount of unique observations, both from the icebreaker when in transit and from two ice camps.

How to cite: Tjernström, M., Zieger, P., and Murto, S. and the ARTofMELT Science Team: Arctic spring and the onset of sea-ice melt: Early impressions from the ARTofMELT expedition, EGU General Assembly 2024, Vienna, Austria, 14–19 Apr 2024, EGU24-15627, https://doi.org/10.5194/egusphere-egu24-15627, 2024.

EGU24-17193 | ECS | Orals | AS4.2

The composition and sources of airborne bacteria and proteinaceous Ice Nucleating Particles in the High Arctic marine region during Spring 

Jennie Spicker Schmidt, Marianne Glasius, Camille Mavis, Jessie Creamean, Gabriel Freitas, Paul Zieger, Kai Finster, and Tina Šantl-Temkiv

The Arctic is a particularly vulnerable region on Earth, where climate change takes place at an intense pace. Clouds represent an essential element within the Arctic atmosphere and play a crucial role in the regional radiative balance. The physical properties of clouds are tightly interlinked with the presence of aerosols that can serve as cloud condensation nuclei (CCN) and as ice nucleating particles (INPs), which facilitate the formation of cloud droplets and ice crystals, respectively. Consequently, they affect cloud thickness, lifetime, and albedo.

More studies propose that various biological aerosols e.g., aerosolized microbial cells, proteinaceous compounds and fragments actively contribute to cloud processes serving as INPs active at high subzero temperatures (>-15°C). However, our understanding of microorganisms responsible for producing compounds serving as INPs, their source environments, and their level of activity, remains highly uncertain.

Given the profound impact of climate change in the Arctic region, understanding the role of biological INPs in the atmosphere becomes particularly critical during Arctic melt season. Here, we present an overview of bioaerosol observations and sources tracking from the recent Arctic expedition ”Atmospheric rivers and the onset of Arctic melt” (ARTofMELT 2023).

Biological INPs are thought to originate from the ocean and meltwater sources during the Arctic Spring and Summer. To assess the potential contribution of these sources to INP active aerosols, aerosols were generated from bulk seawater and sea ice melt water with a temperature-controlled sea spray simulation chamber. The presence of microorganisms in the bulk water and aerosol was quantified using flow cytometry and qPCR while the composition of the microbial communities was determined by amplicon sequencing. Additionally, fluorescent bioaerosols generated by the chamber were  analyzed using a Multiparameter Bioaerosol Spectrometer (MBS). Simultaneously, ambient air samples were analyzed for the presence of microbial cells, bioaerosols, and the composition of the collected microbial community. The ice nucleating properties of water, sea ice melt, and aerosols from the chamber and ambient aerosol were also measured to determine their relevance for Arctic cloud formation.

Preliminary results from the ambient measurements revealed low concentrations of airborne bacterial cells and highly active INPs. From the sea spray simulations, we found that ice melt, snow melt and seawater samples generated a high flux of bacterial cells which were accompanied by INPs active predominantly at low freezing temperatures (<-15°C). Therefore, it seems that the local sea spray is not a likely source of proteinaceous INPs detected in the Arctic spring atmosphere, which will be further explored through bacterial community analysis. Our results will thus provide comprehensive insights into the contribution of local and long-range transported sources of bioaerosols to the Arctic.

How to cite: Schmidt, J. S., Glasius, M., Mavis, C., Creamean, J., Freitas, G., Zieger, P., Finster, K., and Šantl-Temkiv, T.: The composition and sources of airborne bacteria and proteinaceous Ice Nucleating Particles in the High Arctic marine region during Spring, EGU General Assembly 2024, Vienna, Austria, 14–19 Apr 2024, EGU24-17193, https://doi.org/10.5194/egusphere-egu24-17193, 2024.

EGU24-17589 | Posters on site | AS4.2

Intense formation of low liquid clouds over the Arctic sea-ice during May.   

Jean Lac and Hélène Chepfer

Low-liquid stratiform clouds are ubiquitous in the Arctic. Their high surface longwave warming induces change in the surface radiative budget that might have effects on the sea-ice melt especially during transitioning seasons. In particular, low liquid clouds formed in Spring may trigger early melt onset that might have an impact on the following evolution of the sea-ice during summer. 

However, relatively little is known about the existence and the drivers of such clouds in the early melt season. Here we used 13 years of space based lidar cloud profile observations with complementary data to show that the predominance of low clouds happens in May. First, we showed that the low cloud fraction reaches 75% of the Arctic Ocean in May over the sea-ice only with a low interannual variability. This cover increase in May seems to be homogeneous over the whole Arctic Ocean. Second, we investigated potential early summer drivers forming those low liquid clouds. One feature is the moisture sources that could explain the availability of such liquid droplets to form liquid clouds. While the other feature is the boundary layer structure, that might affect the stability and the ocean/atmosphere interaction over sea-ice leads.  

Overall, this study suggests a peak of Arctic low liquid clouds occurring in May that might impact the sea-ice summer melt by triggering early Spring melt. 

How to cite: Lac, J. and Chepfer, H.: Intense formation of low liquid clouds over the Arctic sea-ice during May.  , EGU General Assembly 2024, Vienna, Austria, 14–19 Apr 2024, EGU24-17589, https://doi.org/10.5194/egusphere-egu24-17589, 2024.

EGU24-17977 | ECS | Posters on site | AS4.2

Springtime observations of black carbon aerosols in and outside of low-level Arctic clouds 

Lovisa Nilsson, August Thomasson, Paul Zieger, Julia Asplund, Pontus Roldin, Fredrik Mattson, Erik Ahlberg, and Erik Swietlicki

Few expeditions have ventured into the Arctic to observe the processes that take place in the transition from winter to summer. Particularly, direct observations of aerosol-cloud interactions are scarce, and comprise a large source of uncertainty in radiative forcing estimations in the Arctic.

Light absorbing aerosol particles, such as black carbon (BC) from incomplete combustion, exert a positive forcing upon direct absorption of sunlight, and affect clouds by serving as cloud condensation nuclei (CCN). During the icebreaker expedition ARTofMELT in spring 2023, we measured BC with a multi-angle absorption photometer (MAAP) and a single particle soot photometer (SP2) for five weeks. The two instruments differ by principle and can be used to inform on complementary aspects of the light absorbing aerosol. For example, the MAAP provides the total mass concentrations of so-called equivalent BC (eBC), whereas the single particle instrument SP2 determines the mass of individual refractory BC (rBC) aggregates. Most of the time, the MAAP and SP2 sampled the total BC concentration on the same inlet (whole-air). However, during cloud-events, the SP2 measured downstream of a counterflow virtual impactor (CVI) inlet that samples just cloud droplets or ice crystals without the interstitial or non-activated aerosol.

Our first results indicate overall low out-of-cloud BC mass concentrations for both instruments (median and interquartile range, IQR: 4.4 (1.6-8.5) ngm-3 for the MAAP and 2.5 (1.2-4.7) ngm-3 for the SP2). The variation in mass concentration was small, although the tendency of a gradual decrease was observed towards the onset of the melt.

The SP2 instrument enables studies of the BC mass size distribution. For example, during a cloud event we observed that the geometric mean diameter (GMD, mass equivalent diameter) shifted from smaller (171 nm, whole-air inlet) to larger sizes (175-192 nm), as the SP2 switched to sampling the cloud-residual BC (CVI inlet). Further investigation is needed to examine the underlying causes for this observation (e.g. variation in airmass origin). 

The total aerosol concentration is influenced by local natural sources and production from gaseous precursors, as opposed to the BC concentration which is mainly affected by anthropogenic activities. BC source footprints from the Lagrangian dispersion model FLEXPART, indicate little influence from industrialized regions during the whole campaign. This may explain the comparably low median concentration of rBC-particles (1.1 cm-3, IQR: 0.5-2.1) to the total aerosol number concentration (in the range ~20-150 cm-3).

How to cite: Nilsson, L., Thomasson, A., Zieger, P., Asplund, J., Roldin, P., Mattson, F., Ahlberg, E., and Swietlicki, E.: Springtime observations of black carbon aerosols in and outside of low-level Arctic clouds, EGU General Assembly 2024, Vienna, Austria, 14–19 Apr 2024, EGU24-17977, https://doi.org/10.5194/egusphere-egu24-17977, 2024.

EGU24-19851 | ECS | Orals | AS4.2

Characteristics of natural Arctic aerosols emitted from a wide range of local sources during ARTofMELT2023 

Gabriel Freitas, Kouji Adachi, Julia Asplund, Jessie Creamean, Fredrik Mattsson, Camille Mavis, Lovisa Nilsson, Matthew Salter, Jennie Spiecker Schmidt, Tina Šantl-Temkiv, and Paul Zieger

The Arctic has been experiencing a rise in ambient temperature several times higher than the global average. This warming trend has led to a continuous decline in sea ice coverage and snowpack prevalence. Aerosol sources, such as those from the open ocean and tundra, have become more prevalent throughout the year. These sources emit primary biological aerosol particles (bioaerosols) some of which exhibit ice nucleating properties at high temperatures (>-15C). Ice nucleating particles (INPs) play a crucial role in cloud ice formation, affecting cloud physical and optical properties, as well as their lifetime. Consequently, this has a substantial impact on the Arctic climate. 

During the ARTofMELT2023 expedition (“Atmospheric Rivers and the Onset of Sea Ice Melt 2023”) conducted aboard the Swedish icebreaker Oden in the Atlantic sector of the Arctic Ocean, we assessed the relative importance of several natural bioaerosol sources, such as sea ice, snow melt (to simulate melt ponds) and bulk ocean water. This involved several sea spray simulation chamber and nebulizer experiments, referred to as “source experiments”. The aerosol particles generated in the 61 source experiments conducted were analyzed using single-particle ultraviolet fluorescence spectroscopy along with other complementary aerosol measurements. These included particle size, black carbon content, particle chemical composition, as well as the microbial community and INP concentration of emitted particles. Additionally, filter samples were obtained for transmission electron microscopy (TEM) analysis. 

Our findings indicate that sea ice and snow melt are more significant sources of bioaerosols compared to the bulk ocean water, including the sea surface microlayer, indicating the potential importance of melt ponds as a local Arctic bioaerosol source. Furthermore, we found significant differences in the chemical composition, black carbon content and size distribution of the various analyzed aerosol sources.

How to cite: Freitas, G., Adachi, K., Asplund, J., Creamean, J., Mattsson, F., Mavis, C., Nilsson, L., Salter, M., Spiecker Schmidt, J., Šantl-Temkiv, T., and Zieger, P.: Characteristics of natural Arctic aerosols emitted from a wide range of local sources during ARTofMELT2023, EGU General Assembly 2024, Vienna, Austria, 14–19 Apr 2024, EGU24-19851, https://doi.org/10.5194/egusphere-egu24-19851, 2024.

EGU24-19946 | Orals | AS4.2 | Highlight

Helicopter borne measurements during melt onset in the Fram strait as part of ARTofMELT23 

Falk Pätzold, Lutz Bretschneider, Magnus Asmussen, Barbara Altstädter, Evelyn Jäkel, Hendrik Stapel, Tim Sperzel, Manfred Wendisch, Birgit Wehner, Ralf Käthner, and Astrid Lampert

In the Arctic climate system, the onset of melting is a crucial point, and timing is still difficult to predict. Therefore, the expedition ARTofMELT was dedicated to exploring atmospheric conditions and processes that are involved in triggering the onset of melting.

The helicopter borne sensor system HELIPOD was deployed in this expedition to measure the spatial variability of atmospheric dynamics, radiation, aerosols, trace gases and surface properties on a horizontal scale up to 40 km around the icebreaker ODEN. During the ARTofMELT23 expedition, the HELIPOD conducted 12 measurement flights in the FRAM strait around 80° North and the prime meridian between 9 May and 9 June 2023 with 26.5 hours in the air. The flights covered an area of about 20 NM around the location of the icebreaker ODEN and a vertical range from 50 m to 2700 m above sea level. The flight patterns were aligned parallel and perpendicular to dominating directions as the sea ice edge and the wind direction. In one case a cloud layer edge apparently structured the atmospheric situation. The flights covered pre-melt onset conditions, refreezing situations and the melt onset. Synoptic air mass changes were probed as well.    

The presentation gives an overview of the temporal changes of the ambient conditions during the research flights, and a first assessment of the flights during transient weather situations.

How to cite: Pätzold, F., Bretschneider, L., Asmussen, M., Altstädter, B., Jäkel, E., Stapel, H., Sperzel, T., Wendisch, M., Wehner, B., Käthner, R., and Lampert, A.: Helicopter borne measurements during melt onset in the Fram strait as part of ARTofMELT23, EGU General Assembly 2024, Vienna, Austria, 14–19 Apr 2024, EGU24-19946, https://doi.org/10.5194/egusphere-egu24-19946, 2024.

EGU24-20594 | Posters on site | AS4.2

Sea ice, snow caps, and freshwater lenses: The hurdles local Arctic aerosols must overcome to become airborne 

Jessie Creamean and the MOSAiC and ARTofMELT field teams

Aerosol particles and clouds play a critical role in regulating radiation reaching the Arctic, which is warming faster than anywhere else globally. However, the magnitude of their effects is not adequately quantified, especially in the Arctic Ocean over sea ice. Specifically, particles generated from open leads, melt ponds, and the snow-covered sea ice surfaces remain poorly understood, yet could have significant impacts on cloud condensation nuclei (CCN) and ice nucleating particle (INP) concentrations, and thus, central Arctic cloud formation. While marine biological processes have been demonstrated to be potentially key primary aerosol sources in the Arctic summer, exact sources and emission processes of these particles remain highly uncertain. 

For this presentation, we provide an overview of aerosol observations from two recent Arctic field campaigns: the 2019–2020 Multidisciplinary drifting Observatory for Study of Arctic Climate (MOSAiC) and the 2023 Atmospheric rivers and the onset of Arctic melt (ARTofMELT) expeditions. We highlight preliminary findings focused on aerosols that have the potential to impact cloud phase and lifetime over the Arctic Ocean, specifically those from local sources in the early spring and summer melt periods. The evolution of open water within the pack ice in late spring and the Arctic melt season coincides with an increase in aerosol particle concentration, which may be attributed to biological activity within seawater and sea ice. However, the emission of aerosol particles is contingent on features like open leads and melt ponds, and whether they are covered by snow, freshwater melt layers, or ice lids. This integrative study involves the use of detailed aerosol, meteorological, oceanographic, and sea ice observations from MOSAiC and ARTofMELT. Overall, this work will enable us to assess local aerosol processes associated with cloud formation to better understand the Arctic system through a holistic approach.

How to cite: Creamean, J. and the MOSAiC and ARTofMELT field teams: Sea ice, snow caps, and freshwater lenses: The hurdles local Arctic aerosols must overcome to become airborne, EGU General Assembly 2024, Vienna, Austria, 14–19 Apr 2024, EGU24-20594, https://doi.org/10.5194/egusphere-egu24-20594, 2024.

EGU24-21926 | Posters on site | AS4.2

Water Isotope measurements contribute to the understanding of atmospheric, sea ice, ocean interactions during the ArtofMelt expedition, Fram Strait, spring 2023 

Jeff Welker, Ben Kopec, Eric Klein, Julia Muchowski, Timo Vihma, Paul Zieger, Falk Paetzold, Astrid Lampert, Penny Vlahos, John Prytherch, Valtteri Hyöky, and Truls Karlsen

Transitions periods between seasons in the Arctic are phases when the atmosphere-sea ice-ocean interactions are heightened, especially during these periods of exceptional warming.  These transition periods may be accompanied by shifts in atmospheric transport patterns, the distribution of sea ice and extreme events, such as atmospheric rivers.  Atmospheric Rivers may act as accelerants of sea ice melt and its redistribution, leading to spatial complexity in ice-ocean-atmosphere exchanges of mass and energy.

As part of an interdisciplinary team aboard the I/B Oden from early May to mid-June, four main water isotope measurement packages were collected to maximize collaborations and to resolve nuisances of the Arctic System throughout the cruise track between Svalbard and NE Greenland (Figure 1).  First, in order to delineate longitudinal distribution of the warm and salty W Svalbard current compared to the cold and fresh E Greenland current, we continuously measured the near surface water δ18O, δ2H and d-excess values. Second, in order to source water vapor and moisture sources from the warm, moist, and isotopically enriched subpolar & N Atlantic, compared to cold, dry and isotopically depleted Arctic air, we also continuously measured the δ18O, δ2H and d-excess values of water vapor collected from the ship’s, bow-mounted, eddy covariance tower. Third, in order to understand the horizontal and altitudinal patterns of water vapor parcels that surround the ship; in-situ water vapor isotopes were measured during fHeliPod flight lines that extended up to 30 km N-S-E-W of the Oden and from ~ 50 m above the sea ice and open water to over 2k in altitude.  Fourth, in order to delineate the source of moisture (sea water vs. meteoric water) throughout the sea ice core profiles and the patterns and sources of moisture in the snow pack profiles; ice cores and snow pits were collected (drilled) and dug at ~10 different locations and water isotope samples were analyzed for δ18O, δ2H and d-excess values back in the laboratory.

Four major discoveries will be presented: A) mixing of the surface W Svalbard and NE Greenland current is found to be farther east than previously reported and the surface water masses may differ by up to 5 ‰ δ18O during spring; B) water vapor isotopes responded at hourly time scales as moisture sources during Atmospheric River events begin with northward fluxes of warm, moist air masses but passing cyclones deliver N-S cold-dry, isotopically depleted water vapor in extreme Arctic-sourced storm events lasting a day or more; C) Horizontal and vertical transects during Heliopod flights captured horizontal and altitudinal variation in water vapor isotopes during periods when the weather of the ship was dominated by cold-dry Arctic air, interrupted by periods when the ship was experiencing pulses of warm, moist, and high humidity conditions; D) ice cores and snow packs exhibit vertical isotopic variation indicative of different moisture sources and morphogenesis processes.

How to cite: Welker, J., Kopec, B., Klein, E., Muchowski, J., Vihma, T., Zieger, P., Paetzold, F., Lampert, A., Vlahos, P., Prytherch, J., Hyöky, V., and Karlsen, T.: Water Isotope measurements contribute to the understanding of atmospheric, sea ice, ocean interactions during the ArtofMelt expedition, Fram Strait, spring 2023, EGU General Assembly 2024, Vienna, Austria, 14–19 Apr 2024, EGU24-21926, https://doi.org/10.5194/egusphere-egu24-21926, 2024.

EGU24-381 | ECS | Posters on site | CR7.7

Effects of Arctic sea-ice concentration on turbulent surface fluxes in four atmospheric reanalyses 

Tereza Uhlíková, Timo Vihma, Alexey Karpechko, and Petteri Uotila

A prerequisite for understanding the local, regional, and hemispherical impacts of Arctic sea-ice decline on the atmosphere is to quantify the effects of sea-ice concentration (SIC) on the turbulent surface fluxes of sensible and latent heat in the Arctic.

The best available information in data-sparse regions such as the Arctic is provided by global atmospheric reanalyses. Because each reanalysis uses its own forecast model, data-assimilation system, and often also different atmospheric and surface observations to create the data sets, their atmospheric and surface variables, and boundary conditions often differ. While the differences between reanalyses in variables SIC, latent and sensible heat flux have been demonstrated via comparisons against observations and inter-comparisons between reanalyses, how much these data sets scatter in the effects of SIC on surface turbulent fluxes is not known.

To fill these knowledge gaps, we analyse these effects utilising four global atmospheric reanalyses: ERA5, JRA-55, MERRA-2, and NCEP/CFSR (CFSR and CFSv2), and evaluate their uncertainties arising from inter-reanalysis differences in SIC and in the sensitivity of the turbulent surface fluxes to SIC.

Using daily field means in nine Arctic basins, the magnitude of the differences in SIC is up to 0.15, but typically around 0.05 during all four seasons. Bilateral orthogonal-distance regression analyses indicate that the greatest sensitivity of both the latent and the sensible heat flux to SIC occurs in the cold season, November to April. For these months, using daily means of data, the average sensitivity is 400 W m-2 for the latent heat flux and over 800 W m‑2 for the sensible heat flux per unit of SIC (change of SIC from 0 to 1, positive sign referring to the downward flux). The differences between reanalyses are as large as 300 W m-2 for the latent heat flux and 600 W m-2 for the sensible heat flux per unit of SIC. The sensitivity is highest for the NCEP/CFSR reanalysis. Comparing two study periods 1980–2000 and 2001–2021, we find that the effect of SIC on turbulent surface fluxes has weakened, due to the increasing surface temperature of sea ice and the sea-ice decline.

Multilateral ordinary-least-square regression analyses show that the effect of SIC on turbulent surface fluxes arises mostly via its effect on atmosphere-surface differences in temperature and specific humidity, whereas the effect of SIC on wind speed (via surface roughness and atmospheric-boundary-layer stratification) partly cancels out in the turbulent surface fluxes, as the wind speed increases the magnitude of both upward and downward fluxes.

How to cite: Uhlíková, T., Vihma, T., Karpechko, A., and Uotila, P.: Effects of Arctic sea-ice concentration on turbulent surface fluxes in four atmospheric reanalyses, EGU General Assembly 2024, Vienna, Austria, 14–19 Apr 2024, EGU24-381, https://doi.org/10.5194/egusphere-egu24-381, 2024.

EGU24-450 | ECS | Posters on site | CR7.7

Impact of stratospheric polar vortex variability on Antarctic surface climate and sea ice 

Bianca Mezzina, Froila M. Palmeiro, and Hugues Goosse

The interannual variability of Antarctic sea ice is considered to be mainly driven by tropospheric and oceanic processes. However, the stratosphere also constitutes a possible source of sea ice variability. The stratospheric variability in the southern high latitudes is dominated by the stratospheric polar vortex (SPV), an extremely cold air mass confined to the pole by strong westerly winds. The SPV is characterized by a large seasonal cycle, peaking in austral winter and breaking down in late spring (with the so-called stratospheric final warming, SFW), but also by interannual variations. While there is robust evidence of a downward impact of the polar stratospheric variability on the Northern Hemisphere surface climate, including sea ice, whether a similar link is present in the Southern Hemisphere is still unsettled.

Here, we perform a multi-model assessment of the impact of the dynamical state of the SPV on Antarctic surface climate and sea ice by applying the same experimental protocol to three state-of-the-art general circulation models (GCMs): EC-EARTH, CMCC-ESM and CanESM. The three GCMs have similar ocean and sea ice components but different atmosphere.

First, we examine 200-year control experiments and compare them to observations. To assess the impact of the SPV state on the surface and sea ice, we build composites of “strong” and “weak” SPV years based on the late-winter stratospheric conditions. We then compare the anomalous patterns of sea ice concentration during the following spring, as well as anomalies of atmospheric fields such as sea-level pressure and surface temperature. To detect the possible downward stratosphere-troposphere coupling, we also compute the temporal evolution of vertical profiles of zonal-mean zonal wind and temperature. A similar analysis is also carried out using composites based on the timing of the SFW (“early” versus “late”).

To further isolate the potential role of the polar stratosphere in driving Antarctic surface climate, we run an additional set of sensitivity experiments with suppressed stratospheric variability. For each model, we build 200-member ensembles of 1-year long runs initialized from the control experiment, with the polar stratosphere nudged to the models' climatology, while the troposphere and the extra-polar stratosphere evolve freely. We then compare the variability of Antarctic sea ice and surface climate in these sensitivity experiments to that of the control run and investigate changes in the suggested mechanisms for the stratospheric downward influence.

How to cite: Mezzina, B., Palmeiro, F. M., and Goosse, H.: Impact of stratospheric polar vortex variability on Antarctic surface climate and sea ice, EGU General Assembly 2024, Vienna, Austria, 14–19 Apr 2024, EGU24-450, https://doi.org/10.5194/egusphere-egu24-450, 2024.

EGU24-2610 | Posters on site | CR7.7

Similarities and differences in circulation beneath the Filchner-Ronne and Ross Ice Shelves: Lagrangian point of view 

Vladimir Maderich, Roman Bezhenar, Igor Brovchenko, Dias Fabio Boeira, Cecilia Äijälä, and Petteri Uotila

The two world’s largest ice shelves, the Filchner-Ronne Ice Shelf (FRIS) and the Ross Ice Shelf (RIS) account for half the area of Antarctic ice shelves. They play a key role in transforming water masses on the shelf and forming Antarctic Bottom Water.

The objective of the work was to study the similarities and differences of circulation under the FRIS and RIS using the data of numerical simulation of currents, temperature, and salinity in the Weddell and Ross Seas from the Whole Antarctica Ocean Model (WAOM). The modelling results were used to run the particle-tracking model Parcels for computing Lagrangian particle trajectories. Three Lagrangian characteristics were calculated for FRIS and RIS: (i) Visitation frequency is defined as the percentage of the particles P visited each 2x2 km grid column at least once in a period of modelling (20 y); (2) Representative particle trajectory is the particle trajectory which deviates least from rest of trajectories; (iii) The mean age is the age of particles visited each 2x2 km grid column at least once.

The representative particle trajectories show that anticyclonic circulation beneath the FRIS and RIS is caused by the inflow of High Salinity Shelf Water (HSSW) through troughs off the western coast of the Weddell and Ross Seas. Transformed into ISW water, it flows out through the troughs in these seas. Part of the transformed water under the FRIS flows out through the Filchner Trough between Berkner Island, while water under RIS flows into the Ross Sea in the strait between Roosevelt Island and the shore. The eastern part of RIS is not ventilated by water inflowing from Ross Island. It is slowly ventilated by water entering a trough between Roosevelt Island and the eastern coast of the Ross Sea. Visitation frequency and representative trajectories suggest similar paths for water mass entering RIS in all seasons. Except December-February particles in anticyclonic gyre can return under RIS. Meanwhile, for particles released in January-August, outflows from FRIS took place through both the Ronne and Filchner ice fronts. In the October-December release the outflow through the Ronne ice front essentially exceeds flow through the Filchner depression.

How to cite: Maderich, V., Bezhenar, R., Brovchenko, I., Fabio Boeira, D., Äijälä, C., and Uotila, P.: Similarities and differences in circulation beneath the Filchner-Ronne and Ross Ice Shelves: Lagrangian point of view, EGU General Assembly 2024, Vienna, Austria, 14–19 Apr 2024, EGU24-2610, https://doi.org/10.5194/egusphere-egu24-2610, 2024.

This study investigates the Arctic sea ice concentration trend during 1979-2021 and explores why the autumn Arctic sea ice loss is accelerated after 2002 and its trend declining center shifts from the Chukchi Sea to the Barents-Kara-Laptev Seas. Attribution analysis reveals that the enhanced summer sea ice concentration negative trend in large part explains the autumn sea ice concentration accelerating reduction, whereas it is the trend center shift of increased downward longwave radiation that accounts for mostly of the autumn sea ice concentration decline center shift. Further analysis suggests the downward longwave radiation trend is closely related to large-scale atmospheric circulation changes. A tendency towards a dipole structure with an anticyclonic circulation over Greenland and the Arctic Ocean and a cyclonic circulation over Barents-Kara Seas enhances (suppresses) the downward longwave radiation over Western (Eastern) Arctic by warming and moistening (cooling and drying) the lower troposphere during 1979-2001. In comparison, a tendency towards a stronger Ural anticyclone combined with positive phase of the North Atlantic Oscillation pattern significantly promotes the increase of downward longwave radiation over Barents-Kara-Laptev Seas during 2002-2021. Our results set new insights into the Arctic sea ice variability and deepen our understanding of the climate change.

How to cite: Jiang, Z.: Two distinct declining trend of autumn Arctic sea ice concentration before and after 2002, EGU General Assembly 2024, Vienna, Austria, 14–19 Apr 2024, EGU24-2781, https://doi.org/10.5194/egusphere-egu24-2781, 2024.

EGU24-5533 | ECS | Posters on site | CR7.7

Updated sea ice code and atmospheric forcing improve the Antarctic summer sea ice of an ocean model 

Cecilia Äijälä, Yafei Nie, Lucia Gutierrez-Loza, Chiara De Falco, Siv Kari Lauvset, Bin Cheng, and Petteri Uotila

The ocean and sea ice play an important role in the Antarctic climate system, and the atmosphere plays an important role in forcing the sea ice and the ocean. A better understanding of these interactions is needed to understand recent changes and anticipate future changes in the Antarctic. ​

We present a regional ocean model MetROMS-UHel for a quarter-degree resolution domain of the Antarctic Ocean. MetROMS-UHel is based on the MetROMS-Iceshelf model that uses ROMS (Regional Ocean Modeling System), with ocean-ice shelf thermodynamics. For the sea ice, MetROMS-Iceshelf uses CICE (Community Ice CodE) 5.1.2., while MetROMS-UHel has been updated to CICE 6.3.1. We run both models with two different atmospheric forcings, ERA-Interim (ECMWF Re-Analysis ERA-Interim from 1992 to 2018) and ERA5 (ECMWF Reanalysis v5 from 1992 to 2023). The atmospheric reanalysis plays an important role in the results, and this way we see which changes are due to the updated sea-ice model and which are from the updated atmospheric forcing.

The models simulate the interannual variability of the Antarctic sea ice extent reasonably well. The sea ice extent is similar for all model runs and close to observed in all seasons except JFM. In JFM the extent varies between the models especially in the Ross and Weddell Seas, with the largest, and closest to observed extent produced by the MetROMS-UHel CICE 6, ERA5 run. Important watermasses are well represented by the models, with cold waters being slightly fresher in the MetROMS-UHel runs.

How to cite: Äijälä, C., Nie, Y., Gutierrez-Loza, L., De Falco, C., Lauvset, S. K., Cheng, B., and Uotila, P.: Updated sea ice code and atmospheric forcing improve the Antarctic summer sea ice of an ocean model, EGU General Assembly 2024, Vienna, Austria, 14–19 Apr 2024, EGU24-5533, https://doi.org/10.5194/egusphere-egu24-5533, 2024.

EGU24-5813 | ECS | Orals | CR7.7

Antarctic sea ice sensitivity to the orographic gravity wave drag in a fully coupled climate model  

Maria Vittoria Guarino, Jeff Ridley, Riccardo Farneti, Fred Kucharski, and Adrian Tompkins

Low-level winds over Antarctica are overwhelmingly controlled by the local orography. They, in turn, exert a large control on sea ice formation and transport.

In Global Circulation Models, the influence of orography on the climate system is modelled via orographic gravity wave drag (OGWD) parameterizations. Models usually partition the drag exerted on the atmosphere by the sub-grid scale orography into two components due to flow blocking and gravity waves.

In this work, we investigate the relationship between Antarctic sea ice and the parameterized OGWD in the UK Earth System Model (UKESM). We present results from sensitivity tests performed using the UKESM-CMIP6 historical runs.
In these simulations, the partition between the “flow-blocking” component and the “gravity wave” component of the OGWD parameterization was altered to simulate “flow-over” and “flow-blocking” regimes. These experiments show that sea ice strongly responds to changes in the orographic gravity wave drag. The strong sea ice decline simulated by the control run from 1980 to 2015, not matched by the observational record, is halted and is delayed by 15-20 years (across the ensemble members) in our flow-blocking regime simulation. Conversely, in the flow-over regime simulation, sea ice begins declining about 10 years earlier than in the control run. The systematic response of the coupled system suggests the existence of a dynamical relationship between sea ice and OGWD.

The pan-Antarctic signal for sea ice decline derives from the Weddell Sea sector. The pathway through which OGWD influences sea ice is via modifications of the flow regime across the Antarctic Peninsula, and thus the surface wind stress across the Weddell Sea sector, which in turn alters the occurrence of oceanic deep convection. This happens because the flow regime across the Antarctic Peninsula is critical in determining the strength and pattern of the surface winds on both the windward side (Bellingshausen and Amundsen Seas sector) and the lee side (Weddell Sea sector) of the mountain ridge.

How to cite: Guarino, M. V., Ridley, J., Farneti, R., Kucharski, F., and Tompkins, A.: Antarctic sea ice sensitivity to the orographic gravity wave drag in a fully coupled climate model , EGU General Assembly 2024, Vienna, Austria, 14–19 Apr 2024, EGU24-5813, https://doi.org/10.5194/egusphere-egu24-5813, 2024.

EGU24-7523 | ECS | Posters on site | CR7.7

Amplified Interannual Variation of the Summer Sea Ice in the Weddell Sea, Antarctic After the Late 1990s 

Yuanyuan Guo, Xiaodan Chen, Sihua Huang, and Zhiping Wen

The sea-ice extent (SIE) in the Weddell Sea plays a crucial role in the Antarctic climate system. Many studies have examined its long-term trend, however whether its year-to-year variation has changed remains unclear. We found an amplified year-to-year variance of the Weddell Sea SIE in austral summer since 1998/1999 in observational datasets. Analyses of sea-ice concentration budget and surface fluxes indicate that it is the thermodynamic process that drives the amplification of SIE variations, rather than the sea-ice-drift- related dynamic process. Compared to 1979–1998, the Southern Annular Mode in the preceding spring shows a closer linkage with the Weddell Sea SIE in 1999–2021 through a stronger and more prolonged impact on sea surface temperature, which thermodynamically modulates local sea ice via changing surface heat and radiation fluxes. Our study helps advance the understanding of extreme low Antarctic-SIE records occurring in recent decades and improve future projections of the Antarctic sea-ice variability.

How to cite: Guo, Y., Chen, X., Huang, S., and Wen, Z.: Amplified Interannual Variation of the Summer Sea Ice in the Weddell Sea, Antarctic After the Late 1990s, EGU General Assembly 2024, Vienna, Austria, 14–19 Apr 2024, EGU24-7523, https://doi.org/10.5194/egusphere-egu24-7523, 2024.

EGU24-8422 | ECS | Posters on site | CR7.7

The impact of atmospheric forcing on wintertime sea-ice lead patterns in the Southern Ocean 

Umesh Dubey, Sascha Willmes, Alexander Frost, and Gunther Heinemann

Sea-ice leads are narrow, linear fractures in sea ice, and are an important basis for understanding the mechanism of the atmosphere-sea ice-ocean system in the Southern Ocean. We use monthly sea-ice lead frequencies based on satellite thermal imagery with 1 km2 grid resolution to investigate potential causes for the observed spatial and temporal variabilities of sea-ice leads during wintertime (April-September), 2003-2023, using ERA5 winds and sea level pressure, as well as climate indices El Niño–Southern Oscillation (ENSO) and Southern Annular Mode (SAM). The presented investigation provides evidence for correlations between mean monthly lead frequency and monthly wind divergence, as well as monthly sea level pressure across the majority of the circum-Antarctic regions (significantly in the Weddell Sea, Ross Sea and Amundsen & Bellingshausen Sea). Furthermore, our investigation evaluates the influence of wintertime ENSO and SAM on sea-ice lead patterns in the Southern Ocean. Results reveal a positive correlation between sea-ice leads and SAM, in the Weddell Sea and specific regions of the Ross Sea. Moreover, a positive correlation is found between sea-ice leads and ENSO, particularly in the Ross Sea, Western Pacific Ocean, and certain portions of the Indian Ocean. While the driving mechanisms for these observations are not yet understood in detail, the presented results can contribute to opening new hypotheses on atmospheric forcing and sea-ice interactions. The contribution of atmospheric forcing to regional lead dynamics is complex, and a more profound understanding requires detailed investigations in combination with considerations of ocean processes. This study provides a starting point for further research into the detailed relationships between sea-ice leads and atmosphere, ocean, combined effect of ENSO-SAM, respectively in the Southern Ocean.

How to cite: Dubey, U., Willmes, S., Frost, A., and Heinemann, G.: The impact of atmospheric forcing on wintertime sea-ice lead patterns in the Southern Ocean, EGU General Assembly 2024, Vienna, Austria, 14–19 Apr 2024, EGU24-8422, https://doi.org/10.5194/egusphere-egu24-8422, 2024.

EGU24-8652 | Posters on site | CR7.7

SSP3-7.0 projections of Antarctic sub-ice-shelf melting with the Energy Exascale Earth System Model 

Xylar Asay-Davis, Darin Comeau, Alice Barthel, Carolyn Begeman, Wuyin Lin, Mark Petersen, Stephen Price, Andrew Roberts, Irena Vankova, Milena Veneziani, Jonathan Wolfe, and Shixuan Zhang

To date, few Earth System Models (ESMs) have the ability to simulate the flow in the ocean cavities below Antarctic ice shelves and its influence on basal melting.  Yet capturing both this flow and the resulting melt patterns is critical for representing local, regional, and global feedbacks between the climate and sub-ice-shelf melting.  Here, we present a small ensemble of historical simulations and SSP3-7.0 projections in an ESM that includes Antarctic ice-shelf cavities, the Energy Exascale Earth System Model (E3SM) v2.1.  The simulations have active ocean, sea-ice, atmosphere, land and river components.  The model domain has 12 km horizontal resolution around Antarctica, which is adequate for capturing dynamics in the larger ice-shelf cavities, melt fluxes aggregated across Antarctic regions, and water masses across most of the Antarctic continental shelf. The projections show significant warming and freshening of water masses on the Antarctic continental shelf, a deepening and poleward shift of the Amundsen Sea Low (ASL), and a significant increase in Antarctic melting through the 20th and 21st centuries.  We also see a significantly more modest drift in water-mass properties and melt rates in our control simulation with constant 1950 conditions from which the historical runs were branched.  In addition to providing an estimate of future melting and other changes in regional and global climate under SSP3-7.0, these simulations are also a steppingstone to coupled ice sheet-ocean simulations planned for the near future.  We briefly discuss these plans and the coupling strategy that we are developing.

How to cite: Asay-Davis, X., Comeau, D., Barthel, A., Begeman, C., Lin, W., Petersen, M., Price, S., Roberts, A., Vankova, I., Veneziani, M., Wolfe, J., and Zhang, S.: SSP3-7.0 projections of Antarctic sub-ice-shelf melting with the Energy Exascale Earth System Model, EGU General Assembly 2024, Vienna, Austria, 14–19 Apr 2024, EGU24-8652, https://doi.org/10.5194/egusphere-egu24-8652, 2024.

EGU24-9796 | ECS | Posters on site | CR7.7

Development of Polar Lows in Future Climate Scenarios over the Barents Sea 

Ting Lin, Anna Rutgersson, and Lichuan Wu

Polar lows (PLs) are intense mesoscale cyclones that form over polar oceans during colder months. Characterized by high wind speeds and heavy precipitation, they profoundly impact coastal communities, shipping, and offshore activities. Amid the substantial environmental changes in polar regions due to global warming, PLs are expected to undergo noteworthy transformations. In this study, we investigate the response of PL development in the Barents Sea to climate warming based on two representative PLs. Sensitivity experiments were conducted including the PLs in the present climate and the PLs in a pseudo-global warming scenario projected by the late 21st century for SSP 2-4.5 and SSP 3-7.0 scenarios from CMIP6. In both warming climate scenarios, there is an anticipated decrease in PL intensity, in terms of the maximum surface wind speed and minimum sea level pressure. Despite the foreseen increase in latent heat release in the future climate, contributing to the enhancement of PL intensity, other primary factors such as decreased baroclinic instability, heightened atmospheric static stability, and reduced overall surface heat fluxes play pivotal roles in the overall decrease in PL intensity in the Barents Sea under warming conditions. The augmentation of surface latent heat flux, however, results in increased precipitation associated with PLs by enhancing the latent heat release. Furthermore, the regional steering flow shifts in the warming climate can influence the trajectory of PLs during their development.

How to cite: Lin, T., Rutgersson, A., and Wu, L.: Development of Polar Lows in Future Climate Scenarios over the Barents Sea, EGU General Assembly 2024, Vienna, Austria, 14–19 Apr 2024, EGU24-9796, https://doi.org/10.5194/egusphere-egu24-9796, 2024.

EGU24-10555 | ECS | Posters on site | CR7.7

Towards an improved Antarctic sea-ice representation in HadGEM3-GC5 

Tarkan Bilge, Kaitlin Naughten, Paul Holland, Edward Blockley, David Storkey, and Jeff Ridley

The historical runs of CMIP6-era coupled climate models generally exhibit negative biases in Antarctic sea ice, as identified across a range of models during the CMIP6 simulations (Roach et al. 2020). The UK's national coupled climate model, HadGEM3, has been no exception to this. The CMIP6 version, HadGEM3-GC3, underestimated Antarctic sea ice in historical simulations owing to a Southern Ocean warm bias (Andrews et al. 2020). As part of the DEFIANT (Drivers and Effects of Fluctuations in sea Ice in the ANTarctic) project, in this research we perform an analysis of the representation of sea ice in HadGEM3-GC5, a more recent version of the coupled model. Analysis of existing HadGEM3-GC5 simulations has identified unrealistic convection events associated with open water polynyas. We have started to perform a suite of sensitivity experiments to investigate the importance of the freshwater budget and ocean mixing parameterisation scheme on these convection events, and subsequently on pan-Antarctic sea ice. These initial experiments take the form of short simulations with constant year-2000 forcings, incorporating various parameter perturbations and modifications to freshwater input. We present evidence of the improved characterisation of pan-Antarctic sea ice in HadGEM3-GC5 compared to HadGEM3-GC3, and the preliminary analysis of perturbation simulations aimed at understanding and addressing the remaining challenges in the model coupled climate system.

How to cite: Bilge, T., Naughten, K., Holland, P., Blockley, E., Storkey, D., and Ridley, J.: Towards an improved Antarctic sea-ice representation in HadGEM3-GC5, EGU General Assembly 2024, Vienna, Austria, 14–19 Apr 2024, EGU24-10555, https://doi.org/10.5194/egusphere-egu24-10555, 2024.

EGU24-11497 | Orals | CR7.7

How well do the regional atmospheric, oceanic and coupled models describe the Antarctic sea ice albedo? 

Kristiina Verro, Cecilia Äijälä, Roberta Pirazzini, Damien Maure, Willem Jan van de Berg, Petteri Uotila, and Xavier Fettweis

A realistic representation of the Antarctic sea ice surface albedo, especially during the melting period, is essential to obtain reliable atmospheric and oceanic model predictions. Antarctic sea ice cover influences the atmosphere by reflecting solar radiation and acting as a barrier between the atmosphere and the ocean, for example. The Antarctic sea ice consists of ice floes of varying thickness, usually covered by snow, and broken up by cracks, leads and polynyas. Therefore, the optical properties of sea ice can vary greatly.

We use regional atmospheric (HCLIM-AROME), oceanic (MetROMS-UHel) and coupled (MAR-NEMO) models to compare the representation of the basic sea ice characteristics: sea ice albedo, snow and ice thickness, and meteorological data during the melt periods of two Antarctic domains with very different sea ice conditions, using data of the ISPOL and Marsden field campaigns. During the ISPOL campaign (Dec 2004; Hellmer et al. 2008) RV Polarstern was moored to an ice floe in the Weddell Sea, where snow-covered multi-year ice persists. The Marsden field campaign (Nov. 2022; Dadic et al. 2023) was established over 2.4m thick land-fast ice of McMurdo Sound, where snow thickness ranged from 0 to 40 cm in patches over the roughest ice. We aim to bridge the models to observations, by comparing model output to various levels of observations, from in-situ measurements of the ISPOL and Marsden campaigns to smaller/larger scale satellite observations over Weddell and Ross Seas. 

The first comparisons revealed that HCLIM, with a simplistic 1D thermodynamic sea ice scheme (SICE, Bartrak et al. 2018), was underestimating snow albedo up to 30%, and needed retuning for Antarctic conditions. Overall, preliminary results indicate that the models do well reproducing the snow-covered sea ice during the ISPOL campaign, when the weather was warm, with the air temperature mostly above −5◦C. MetROMS-UHel, which uses the Delta-Eddington multiple scattering radiative transfer model to calculate the sea ice albedo, even reproduced similar diurnal variability than observed. The Marsden field campaign took place in an area of complex topography, cold weather conditions, and greatly varying sea ice. The models tend to overestimate the albedo of the land-fast ice of the Marsden field campaign, as a uniform, instead of patchy, snow layer is modelled. Models also cannot reproduce the variety of sea ice, such as freshly formed ice, in the McMurdo Sound area apparent on the satellite images.

How to cite: Verro, K., Äijälä, C., Pirazzini, R., Maure, D., van de Berg, W. J., Uotila, P., and Fettweis, X.: How well do the regional atmospheric, oceanic and coupled models describe the Antarctic sea ice albedo?, EGU General Assembly 2024, Vienna, Austria, 14–19 Apr 2024, EGU24-11497, https://doi.org/10.5194/egusphere-egu24-11497, 2024.

EGU24-12637 | ECS | Orals | CR7.7

Does Strength Matter? An Exploration into Cyclone Strength and the Impact on Arctic Sea Ice 

Elina Valkonen, Chelsea Parker, and Linette Boisvert

Arctic cyclones are an integral part of the polar climate system. They import moisture and energy from the midlatitude and impact the underlying surface through dynamic adn thermodynamic interactions. The rapid warming and sea ice decline in the Arctic makes it more important than ever to understand the tightly coupled interactions between the Arctic sea ice and episodic weather events, such as cyclones.

In this presentation, we use a Lagrangian ice parcel database to study the impact different strength cyclones have on the Arctic Sea ice. The database includes daily 25km Arctic ice parcel tracks and associated atmospheric and sea ice conditions, including passing cyclone track data from 2002-2021. We divide these cyclone tracks into three distinctive groups based on their central pressure and average wind speed. After this, we split the ice parcel tracks and associated atmospheric data based on these cyclone groups: ice affected by weak cyclones, ice affected by normal cyclones, and ice affected by extreme cyclones.

We will then utilize these parcel groups to study the atmospheric conditions (precipitation, temperature, radiative balance) and sea ice changes for three days before, during, and three days after the cyclone passes. We will average the ice parcel and associated atmospheric variable data over the ice parcel life cycle and across the before, during, and after cyclone pass timescales. We will then apply statistical pattern recognition on these averaged sea ice and atmospheric variable fields. This analysis will allow us to better understand the role cyclone strength has in cyclone-sea ice interactions. We will present these results separately for individual seasons, locations, and surrounding SIC.

How to cite: Valkonen, E., Parker, C., and Boisvert, L.: Does Strength Matter? An Exploration into Cyclone Strength and the Impact on Arctic Sea Ice, EGU General Assembly 2024, Vienna, Austria, 14–19 Apr 2024, EGU24-12637, https://doi.org/10.5194/egusphere-egu24-12637, 2024.

EGU24-12913 | Orals | CR7.7

Do clouds care about aerosol from sea ice sources (blowing snow, open leads) during Arctic winter/ spring? – a case study from MOSAiC 2019-20 

Markus Frey, Floor van den Heuvel, Amélie Kirchgäßner, Simran Chopra, Thomas Lachlan-Cope, Ronny Engelmann, Albert Ansmann, Heike Wex, Ananth Ranjihkumar, Xin Yang, Jessica Mirrielees, Kerri Pratt, Ivo Beck, Julia Schmale, and Xianda Gong

Aerosols play a key role in Arctic warming via radiative direct and indirect effects. It is well-known that increased aerosol concentration due to Arctic haze raises cloud longwave emissivity, resulting in surface warming. Recently, a MOSAiC study demonstrated that blowing snow above sea ice generates fine sea salt aerosol, which results in up to tenfold enhancement of cloud condensation nuclei leading to potentially significant surface warming rivalling that due to Arctic haze. Yet, radiative properties of aerosol emitted by sea ice sources, vertical coupling and interaction with clouds remain major uncertainties in quantifying the aerosol impact on Arctic climate change.

We use MOSAiC observations to analyse the coupled ocean-ice/snow-atmosphere system and assess contributions of sea ice sources (blowing snow, open leads) to atmospheric cloud-forming particles in particular ice-nucleating particles (INP). Choosing the 2020 winter/spring transition with profound seasonal changes in sea ice and air mass origin, we discuss the importance of sea ice aerosol to low-level clouds in comparison to advected aerosol. We consider measurements of snow particles, physico-chemical properties and INP content of aerosol and snow on sea ice, vertical profiles linking ground observations to the level of cloud formation, and assess climate sensitivity using the UKESM model.

How to cite: Frey, M., van den Heuvel, F., Kirchgäßner, A., Chopra, S., Lachlan-Cope, T., Engelmann, R., Ansmann, A., Wex, H., Ranjihkumar, A., Yang, X., Mirrielees, J., Pratt, K., Beck, I., Schmale, J., and Gong, X.: Do clouds care about aerosol from sea ice sources (blowing snow, open leads) during Arctic winter/ spring? – a case study from MOSAiC 2019-20, EGU General Assembly 2024, Vienna, Austria, 14–19 Apr 2024, EGU24-12913, https://doi.org/10.5194/egusphere-egu24-12913, 2024.

EGU24-14392 | ECS | Orals | CR7.7

Impact of Weakened Antarctic Circumpolar Current on the Northern Hemisphere Climate 

Peixi Wang, Yuhui Han, Song Yang, Jun Ying, Zhenning Li, Xichen Li, and Xiaoming Hu

Recent findings show a remarkable linkage between the Northern Hemisphere and Southern Hemisphere climates. Previous studies have focused on the impact of the climate change in the northern high-latitudes on that in the Southern Hemisphere, but few studies concerned the impact of Southern Ocean circulation on the Northern Hemisphere, especially the Arctic climate. In this study, we close the Drake Passage (DP) to slow down the Antarctic Circumpolar Circulation (ACC) in the fully coupled Community Earth System Model, to investigate the impact of weakened ACC on the Northern Hemisphere.

Two model experiments, DP opened and DP closed experiments, are performed. Relative to the DP opened case, a warmer Antarctic with less sea ice cover but a colder Arctic with more sea ice cover appear in the DP closed case resulting from weaker ACC and Atlantic Meridional Overturning Circulation (AMOC). Especially, the changes in surface air temperature in the two poles are largest in winter.

Compared to the DP opened case, the anomalous southward heat transport by weakened ACC is largest in winter, contributing to the winter amplification in the Antarctic. However, the seasonal difference in AMOC change is insignificant. To understand the winter amplification in the Arctic, we further analyze local surface heat flux changes in the Arctic. The anomalous downward longwave radiation and sensible and latent heat fluxes are stored in the ocean in summer and released to the atmosphere in the following winter. Although the ocean heat content warms the surface, the upward sensible and latent heat fluxes cool the surface more significantly in winter. This local atmosphere-ocean-ice interaction contributes to the winter amplification in the Arctic. 

When DP is closed, the westerlies become stronger and move poleward in the Northern Hemisphere because of the increased meridional temperature gradients, especially in winter. The change in surface temperature also contribute to the weakening of Aleutian Low in winter. The warming in the Antarctic and the cooling in the Arctic leads to the notable weakening of Hadley circulation in the Southern Hemisphere. Additionally, compared to the DP opened case, the Intertropical Convergence Zone shifts southward and the Walker circulation and trade winds over the Pacific strengthen. These results shed light on understanding the interhemispheric interaction and the pole-to-pole connection.

How to cite: Wang, P., Han, Y., Yang, S., Ying, J., Li, Z., Li, X., and Hu, X.: Impact of Weakened Antarctic Circumpolar Current on the Northern Hemisphere Climate, EGU General Assembly 2024, Vienna, Austria, 14–19 Apr 2024, EGU24-14392, https://doi.org/10.5194/egusphere-egu24-14392, 2024.

During space reentry, satellites undergo ablation in the Mesosphere, leading to the dispersion of ablated material across the globe. The Mesospheric circulation efficiently concentrates this material into the polar winter stratosphere, from where its fate is not well known. Historically, the mass of satellite debris has been significantly smaller than that of naturally occurring meteoroids. The meteoric material also undergoes ablation and deposit similar material, which is transported to the poles and can be observed in Greenland ice cores. With the current exponential increase in the number of launched satellites, the mass of the satellite debris will go from negligible to surpassing the mass of natural meteoric material within the next few years. Here, the quantity and composition of material to be expected in the polar stratosphere the coming years are presented. The question is raised: What potential impacts will the drastic increase of satellite debris have on the polar atmosphere/cryosphere?

How to cite: Megner, L.: Should we worry about the massive increase of satellite reentry debris in the polar regions?, EGU General Assembly 2024, Vienna, Austria, 14–19 Apr 2024, EGU24-14537, https://doi.org/10.5194/egusphere-egu24-14537, 2024.

Cyclones are an important driver of heat and moisture transport into the Arctic and additionally cause high wind speeds and abrupt wind direction changes during their passage. The subsequent impacts on the Arctic sea ice cover consist of i) a thermodynamic stalling/enhancement of the seasonal sea-ice growth/melt, and ii) enhanced drift and deformation of sea ice. The statistical quantification of these cyclone impacts on the Arctic sea-ice cover is a very recent research topic.

By conducting a climatological monthly analysis based on the ERA5 reanalysis and a cyclone tracking algorithm, we reveal a distinct seasonal cycle of cyclone impacts on sea-ice concentration in the Atlantic Arctic Ocean (strong impacts from autumn to spring, but weak impacts in summer). We further demonstrate that the cyclone impacts have changed significantly throughout the last four decades in a warming Arctic, magnitude-wise strongest in the Barents Sea in autumn.

Still, open questions remain with respect to the impacts of cyclones on the Arctic sea ice in the present climate and regarding their possible changes in a warming Arctic. Specifically, the influence of cyclone passages on the formation of leads in the sea-ice cover has not been statistically analyzed so far. Thus, we extend our analysis to cyclone related changes in sea-ice lead fraction derived from horizontally high-resolved (down to 1km²) MODIS sea-ice observations.

Our results indicate that cyclone passages significantly increase sea-ice lead fraction in large parts of the central Arctic Ocean. Mixed results are found for the Arctic marginal seas. The analysis of particular cyclone cases further suggests that groups of consecutive cyclones traversing the sea ice within short time are particularly effective in driving changes in sea-ice concentration and lead fraction. The statistical quantification of the importance of such a temporal clustering of cyclones for their sea-ice impacts is topic of ongoing research.

How to cite: Aue, L. and Rinke, A.: Advancing the understanding of cyclone impacts on Arctic sea-ice concentration and sea-ice lead formation, EGU General Assembly 2024, Vienna, Austria, 14–19 Apr 2024, EGU24-15589, https://doi.org/10.5194/egusphere-egu24-15589, 2024.

EGU24-15744 | ECS | Orals | CR7.7

Topographically constrained tipping point for complete Greenland Ice Sheet melt 

Michele Petrini, Meike D. W. Scherrenberg, Laura Muntjewerf, Miren Vizcaino, Raymond Sellevold, Gunter Leguy, William H. Lipscomb, and Heiko Goelzer

A major impact of anthropogenic climate change is the potential triggering of tipping points, such as the complete loss of the Greenland Ice Sheet (GrIS). Currently, the GrIS is losing mass at an accelerated pace, mainly due to a steep decrease in its Surface Mass Balance (SMB, snow accumulation minus surface ablation from melt and associated runoff). Here, we investigate a potential SMB threshold for complete GrIS melt, the processes that control this threshold, and whether it exhibits characteristics commonly associated with tipping points, such as a non-linear response to external forcings. To do this, we adopt a semi-coupled approach, forcing the Community Ice Sheet Model v.2 (CISM2) with different SMB levels previously calculated at multiple elevation classes with the Community Earth System Model v.2 (CESM2). The SMB calculation in CESM2 and the elevation class method allow us to account for the SMB-elevation feedback based on snow/firn processes and energy fluxes at the ice sheet surface. We find a positive SMB threshold for complete GrIS melt of 230±84 Gt/yr, corresponding to a 60% decrease from the GrIS simulated pre-industrial SMB. The ice sheet shows a highly non-linear response to sustained melt, and its final state is determined by the effect of the SMB-height feedback in response to surface melt and Glacial Isostatic Adjustment (GIA). The GrIS is tipping from nearly 50% equilibrium volume towards complete melt when the ice margin in the central west unpins from a coastal region with high bedrock elevation and SMB. We find that this relatively small coastal region is important to determine the ice sheet stability in response to sustained warming. Based on the ice sheet geometry in previous modelling studies of the GrIS during the last interglacial, we suggest that a stabilizing effect of the bedrock topography in the central West might have occurred in the past.

How to cite: Petrini, M., Scherrenberg, M. D. W., Muntjewerf, L., Vizcaino, M., Sellevold, R., Leguy, G., Lipscomb, W. H., and Goelzer, H.: Topographically constrained tipping point for complete Greenland Ice Sheet melt, EGU General Assembly 2024, Vienna, Austria, 14–19 Apr 2024, EGU24-15744, https://doi.org/10.5194/egusphere-egu24-15744, 2024.

EGU24-15858 | ECS | Orals | CR7.7

Contrasting trends of marine bromoform emissions in a future climate 

Dennis Booge, Jerry Tjiputra, Dirk Olivié, Birgit Quack, and Kirstin Krüger

Bromoform (CHBr3) from the ocean is the most important organic compound for atmospheric bromine with an atmospheric lifetime of ~2-4 weeks. Natural production, being the main source of oceanic CHBr3, is high at the coasts and in open ocean upwelling regions due to production by macroalgae and phytoplankton. Although highly relevant for the future halogen burden and ozone layer in the stratosphere, the global bromoform production in the ocean and its emissions are still poorly constrained in observations and are mostly neglected in Earth System Model (ESM) climate projections. Anthropogenically forced climate change may lead to considerable changes in ocean temperature and ocean acidification, and will also influence primary productivity. Especially biogeochemical processes in the Arctic will be strongly influenced by climate change in the near future.  However, the future trend of the marine emissions of bromoform and other very short-lived substances (VSLS) remains unclear. Two studies projected an increase of the relative importance of brominated VSLS for stratospheric ozone loss in contrast to other ozone depleting substances, due to increasing oceanic emissions of the brominated VSLS. Both studies applied constant (observation based) oceanic concentrations for the emission calculations in a future warming ocean, which assumes a production increase. Thus, a consistent way of addressing the bromoform production and concentration in the global ocean, its air-sea gas exchange and concentration in the atmosphere with high spatial and temporal resolution is ultimately needed to further progress with our understanding of potential future climate trends.

Here, we show first model results of fully coupled ocean-atmosphere bromoform interactions in the Norwegian ESM (NorESM) with the ocean model BLOM and the ocean biogeochemistry component iHAMOCC for the period from 2015 to 2100 (SSP585 scenario). Model data for the historical period until 2014 is validated with oceanic and atmospheric observations listed in the HalOcAt (Halocarbons in the Ocean and Atmosphere) data base.

On global average, our model results indicate decreasing oceanic CHBr3 concentrations and emissions until the end of this century. In contrast, atmospheric CHBr3 mixing ratios are projected to increase during the same period. The results indicate that the lifetime of atmospheric CHBr3 increases until 2100 compared to current days as atmospheric loss due to photolysis and reaction with hydroxyl radicals is projected to decrease.

In contrast, bromoform in the Arctic shows an increasing trend of marine CHBr3 concentrations, their emissions and atmospheric mixing ratios. Moreover, annual mean Arctic marine bromoform concentrations in 2100 (5.2 pmol L-1) are projected to exceed global values (4.5 pmol L-1). Increasing sea surface temperature and sea ice retreat in the Arctic drives the higher CHBr3 productivity. The resulting emissions in the Arctic are projected to increase by 67% until 2100 indicating this region to be a significant source of brominated VSLS in a future climate. The relevance and uncertainties of the model results are discussed.

How to cite: Booge, D., Tjiputra, J., Olivié, D., Quack, B., and Krüger, K.: Contrasting trends of marine bromoform emissions in a future climate, EGU General Assembly 2024, Vienna, Austria, 14–19 Apr 2024, EGU24-15858, https://doi.org/10.5194/egusphere-egu24-15858, 2024.

EGU24-16385 | ECS | Posters on site | CR7.7

Simulating Arctic aerosol-cloud interactions in a warm air intrusion event during the MOSAiC campaign 

Ruth Price, Paul R. Field, Bjørg Jenny Kokkvoll Engdahl, Oskar Landgren, Annette Rinke, and Andrew Orr

Aerosols play a crucial role in determining the characteristics and radiative impacts of Arctic clouds. Parameterisations of aerosols and clouds in climate models remain uncertain, confounding efforts to improve our understanding of their behaviour both now and in the future. Moreover, model biases in cloud microphysics are compounded by interlinked biases in Arctic boundary layer structure, surface properties and large-scale meteorology. This interdependence among variables poses significant hurdles for modelers attempting to accurately simulate Arctic atmospheric processes.

In this study, we have used a regional atmospheric model, the UK Met Office Unified Model, coupled to a cloud microphysical model (Cloud Aerosol Interacting Microphysics, CASIM) and an aerosol-chemistry-climate model (UK Chemistry and Aerosols, UKCA). This integrated approach has been employed to investigate warm air intrusion events during April 2020 of the MOSAiC campaign. Our results provide vital information on the behaviour of model processes that have been tuned for mid-latitude regimes, such as cloud droplet activation, in the Arctic environment during warm air intrusion events that had clear impacts on the surface energy budget. 

How to cite: Price, R., Field, P. R., Engdahl, B. J. K., Landgren, O., Rinke, A., and Orr, A.: Simulating Arctic aerosol-cloud interactions in a warm air intrusion event during the MOSAiC campaign, EGU General Assembly 2024, Vienna, Austria, 14–19 Apr 2024, EGU24-16385, https://doi.org/10.5194/egusphere-egu24-16385, 2024.

EGU24-16632 | Posters on site | CR7.7

Bounding the contribution of open leads to sea spray aerosol emissions in the high Arctic 

Rémy Lapere, Jennie L. Thomas, Louis Marelle, and Pierre Rampal

In the Arctic ocean, open leads have the ability to release sea spray into the atmosphere. However, the magnitude and seasonality of this flux are relatively unknown, which is a limitation to our understanding of the polar climate. Most atmospheric models do not include sea spray from leads, because of the lack of existing parameterization. In this work we propose a parameterization for sea spray fluxes from open leads in the Arctic, which leverages aerosol flux measurements from a past campaign combined with the latest generation of sea ice modeling.

Based on our parameterization, the annual total emitted mass of sea salt from open leads, [0.1–1.5] Tg/yr, is comparable to emissions from blowing snow and to the transported mass of sea salt from open ocean coming from the lower latitudes. Furthermore, the seasonality of open lead and blowing snow sea salt emissions have opposite phases, and their spatial distribution across the Arctic is also different. Therefore, we find that including both open lead and blowing snow sea salt fluxes can improve the reproduction of the annual cycle of sea salt aerosol atmospheric concentration at high latitude stations.

Using sea ice concentration fields from the neXtSimv2 sea ice model and implementing our parameterization in the WRF-Chem chemistry-transport model, we evaluate the impacts of open lead emissions on sea salt concentrations and clouds in the high Arctic.

How to cite: Lapere, R., Thomas, J. L., Marelle, L., and Rampal, P.: Bounding the contribution of open leads to sea spray aerosol emissions in the high Arctic, EGU General Assembly 2024, Vienna, Austria, 14–19 Apr 2024, EGU24-16632, https://doi.org/10.5194/egusphere-egu24-16632, 2024.

EGU24-16827 | Orals | CR7.7

Ocean-driven basal channel growth at Fimbulisen 

Qin Zhou, Tore Hattermann, Chen Zhao, Rupert Gladstone, Ashely Morris, and Petteri Uotila

Small-scale basal features, such as channels and crevasses, are abundant on many ice shelves.  These features may, either directly or via modulating basal melting, impact ice shelf stability and, therefore, also global sea level. However, simulating the effect of these features on ice shelves at a hundred-meter scale or smaller is still challenging even for dedicated regional simulations, which typically ignore the small-scale features and smooth the ice draft. Fine-resolution (8 m) basal topography retrieved from the Reference Elevation Model of Antarctica (REMA) data reveals that channelized basal features of several tens of kilometers traverse the ice base both along and across the Jutulstraum ice stream on the Fimbulisen Ice Shelf (FIS). The FIS cavity is currently filled with fresh and cold Eastern Shelf Water (ESW), and recent observations have shown a sustained inflow of Warm Deep Water (WDW) since 2016. In this study, we first assess the effect of the basal channels on the cavity circulation and basal melting of the FIS with a fine-scale unstructured grid Finite-Volume Community Ocean Model (FVCOM) model of the FIS ice cavity. The grid resolution varies from 50 m in the focused region along the ice stream to 1500 m in the open ocean. Sensitivity studies are carried out using the high-resolution ice draft from REMA and a smoothed version of it, combined with varying proportions of WDW in the cavity. Our results show that the basal channels lead to (i) a redistribution of basal melting, (ii) a net melt increase at the deep ice area, and (iii) the entrapment of melt-modified WDW in the channels where WDW reaches the deep ice area. Using an idealized ice sheet model, we demonstrate that this entrapment of warm water in the channel results in a net melt increase with a preferential melt that promotes channel growth and migration, forming a positive feedback loop. We further investigate the positive feedback mechanism using an Elmer/Ice–FVCOM model setup with the same fine-scale mesh as the ocean model. This ocean-driven coupled evolution of the channelized system may occur on other shelves in East Antarctica where ESW and WDW coexist. Considering this coupled process in generating sea level projections could constrain East Antarctica's contribution to future sea level rise.


How to cite: Zhou, Q., Hattermann, T., Zhao, C., Gladstone, R., Morris, A., and Uotila, P.: Ocean-driven basal channel growth at Fimbulisen, EGU General Assembly 2024, Vienna, Austria, 14–19 Apr 2024, EGU24-16827, https://doi.org/10.5194/egusphere-egu24-16827, 2024.

EGU24-17682 | ECS | Posters on site | CR7.7

Changes of clouds and sea ice in EC-Earth- and ERA5-driven retrospective ensemble hindcasts with the fully coupled ice-sheet–ocean–sea ice–atmosphere–land circum-Antarctic model PARASO 

Florian Sauerland, Pierre-Vincent Huot, Sylvain Marchi, Hugues Goosse, and Nicole van Lipzig

We created 4 retrospective hindcasts using PARASO, a five-component (ice sheet, ocean, sea ice, atmosphere, and land) fully coupled regional climate model over an Antarctic circumpolar domain: a control run forced with reanalysis data from ERA5 and ORAS5, and an ensemble of 3 members forced by 3 different EC-Earth global hindcasts. We compare the ocean and sea ice properties of the ERA5-driven simulation to the ensemble mean of the EC-Earth-driven ones, to separate the impact of the different source of boundary conditions from internal variability generated by the different ensemble members. Moreover, we analyse if and how the different ocean temperatures and sea ice extents influence the formation of clouds. We compare the moisture and heat fluxes at the ocean surface between the EC-Earth-driven ensemble and the ERA5-driven hindcast, as well as the moisture and cloud water contents in the atmosphere. This not only provides information on the contribution of external and internal variability inside the PARASO domain for those variables, but by comparing the variability in fluxes to the variability of clouds, we can also estimate the importance of ocean-cloud-interactions. Our results also show that the increasing trend observed in Antarctic sea ice extent observed prior to 2015 is well represented in the ERA5-driven run, but not in the EC-Earth-driven ensemble, indicating a stronger influence of mid-latitude forcings compared to local processes. 

How to cite: Sauerland, F., Huot, P.-V., Marchi, S., Goosse, H., and van Lipzig, N.: Changes of clouds and sea ice in EC-Earth- and ERA5-driven retrospective ensemble hindcasts with the fully coupled ice-sheet–ocean–sea ice–atmosphere–land circum-Antarctic model PARASO, EGU General Assembly 2024, Vienna, Austria, 14–19 Apr 2024, EGU24-17682, https://doi.org/10.5194/egusphere-egu24-17682, 2024.

EGU24-17841 | ECS | Orals | CR7.7

Response of EC-Earth3 to Antarctic meltwater 

André Jüling, Erwin Lambert, Philippe Le Sager, and Sybren Drijfhout

Ice-sheet meltwater affects ocean stratification and circulation, sea ice, and ultimately the global climate through various feedback mechanisms. Most current generation global climate models do not include interactive ice sheets and as such do not capture the projected increases in additional meltwater under future emission scenarios. We use the EC-Earth3 coupled climate model to investigate the climate response to various scenarios of Antarctic meltwater input. With the idealized experiments of the Southern Ocean Freshwater Input from Antarctica Model Intercomparison Project (SOFIAMIP), as well as a plausible future meltwater release experiment, we investigate the sensitivity to both amount and location of the freshwater forcing in both the eddy-permitting (0.25°) and the standard, non-eddying (1°) resolution model versions. We find that the amount of freshwater strongly controls the sea ice with associated atmospheric adjustments and feedbacks. We also see that while inserting additional meltwater at the surface enhances stratification increasing sea ice cover, inserting it at depth decreases stratification and enables more ocean heat to be released at the surface. Our results represent improved model physics and support calls for using prescribed Antarctic meltwater input as forcing in the Coupled Model Intercomparison Project to, for example, improve modelled sea ice evolution and sea level trends.

How to cite: Jüling, A., Lambert, E., Le Sager, P., and Drijfhout, S.: Response of EC-Earth3 to Antarctic meltwater, EGU General Assembly 2024, Vienna, Austria, 14–19 Apr 2024, EGU24-17841, https://doi.org/10.5194/egusphere-egu24-17841, 2024.

The Filchner-Ronne Ice Shelf currently has a “cold” cavity with comparably low melt rates or refreezing at the ice-ocean interface. However, it has been shown that a switch to “warm” conditions under a very strong climate warming scenario is possible within this century (Hellmer et al., 2012). In this case, modified Circumpolar Deep Water that resides at intermediate levels offshore enters the cavity and fuels a 21-fold increase in aggregated melt rates (Naughten et al., 2021), with implications for ice-shelf buttressing and thereby the dynamics of tributary ice streams and glaciers. Interactions of resulting cavity changes with the ocean could furthermore amplify or weaken the increase in ice shelf melting. Here we investigate the influence of ice-ocean feedbacks on sub-shelf melt rates and the regime shift from a “cold” to a “warm” ice-shelf cavity using standalone and coupled configurations of the ice sheet model Úa and the ocean model MITgcm (De Rydt and Gudmundsson, 2016; Naughten et al., 2021). Furthermore, we test their influence on reversibility back to “cold” conditions, and the impact of a regime shift on grounded ice dynamics.

How to cite: Reese, R. and De Rydt, J.: Do ice-ocean feedbacks influence a regime shift of the Filchner-Ronne ice shelf cavity?, EGU General Assembly 2024, Vienna, Austria, 14–19 Apr 2024, EGU24-18887, https://doi.org/10.5194/egusphere-egu24-18887, 2024.

The estimation of reference evapotranspiration (ETo) holds significant importance for the hydrological cycle, necessitating an extensive understanding of the various climate variables and their influence on ETo variability. This study aims to examine spatio-temporal variations in Penman Monteith based ETo estimations and the factors contributing to their changes over the Indian subcontinent in the historic and future climate change. Using climate variables from the ERA5 reanalysis and CMIP6 simulations this study focuses on the changes in ETo across different aridity zones in the study area. Further, the partial least squares (PLS) regression was employed to determine the relative contribution of different climate variables on ETo trends. Results show that the majority (70%) of the areas in the subcontinent exhibited decreasing ETo trends in the historical past. Zonal analysis of ETo trends revealed all zones except the humid zone exhibited a significant decreasing trend for ETo. Contribution analysis shows that, across the study area, temperature and radiation are the most significant factors influencing ETo, followed by wind speed and relative humidity. Further, temperature and ETo were found to be having opposing tendencies, highlighting an “evapotranspiration paradox” that encompasses the majority of the study area. CMIP6 simulations show that ETo is projected to increase significantly across the Indian subcontinent, especially in the semi-arid and arid regions with temperature and radiation being the dominant factor contributing to increases in ETo.

How to cite: Varghese, F. C. and Mitra, S.: Spatio-temporal variation of reference evapotranspiration and its contributing factors over the Indian subcontinent under historic and future climate change, EGU General Assembly 2024, Vienna, Austria, 14–19 Apr 2024, EGU24-675, https://doi.org/10.5194/egusphere-egu24-675, 2024.

EGU24-878 | ECS | Orals | CL4.1

Land-Climate Nexus: Unravelling Extremes with Attention Networks 

suchismita subhadarsini, D. Nagesh Kumar, and S. Govindaraju Rao

The intricate interplay between land use, climate dynamics, and other contributing factors significantly influences the occurrence of extreme events such as droughts, floods, and heatwaves. Modeling this complex system in a high-dimensional space poses a formidable challenge, given incomplete understanding and limited availability of data. This study explores the application of deep learning approaches, specifically leveraging transformer architectures, to capture long-range dependencies in spatiotemporal data. These mechanisms are then employed to encapsulate the complex interactions between land use, climate, and other factors influencing extreme events. The proposed approach incorporates attention mechanisms, enhancing interpretability by highlighting crucial spatial and temporal features essential for forecasting. To evaluate the effectiveness of this methodology, a case study was conducted on the Godavari River Basin in India. Utilizing vegetation indices as a representation of crop type and land use, alongside climate data spanning from 2000 to 2020, the results provide valuable insights into the driving factors behind land use change and climate extremes in the region. The study not only demonstrates predictive capabilities of the proposed approach but also offers insights into the intricate relationships within the land-atmosphere feedback system. The extracted information is useful for making informed decisions related to land management, climate adaptation, and disaster risk reduction.

How to cite: subhadarsini, S., Kumar, D. N., and Rao, S. G.: Land-Climate Nexus: Unravelling Extremes with Attention Networks, EGU General Assembly 2024, Vienna, Austria, 14–19 Apr 2024, EGU24-878, https://doi.org/10.5194/egusphere-egu24-878, 2024.

EGU24-1608 | Orals | CL4.1

Forest Canopy Transpiration: A Key Moderator of Hydroclimate Variability and Extreme Rainfall in the Maritime Continent 

Min-Hui Lo, Ting-Hui Lee, Jason Hsu, Chun-Lien Chiang, and Yan-Ning Kuo

This study investigates the interannual variability of evapotranspiration (ET) in the Maritime Continent (MC), focusing on the dynamics behind its minimal fluctuations despite significant changes in precipitation due to the El Niño-Southern Oscillation. We analyze ET components - canopy evaporation (CE), canopy transpiration (CT), and soil evaporation (SE) - and uncover a self-compensating mechanism between CE and CT. During El Niño, increased CT offset decreased CE and SE, maintaining ET's stability. Conversely, La Niña shows an inverse pattern. Additionally, the research examines the impacts of deforestation on extreme precipitation in MC. Deforestation disrupts the ET balance by removing CT's stabilizing effect, amplifying ET variability, and altering precipitation patterns. Our findings propose a new precipitation paradigm in MC under deforestation: "rich-get-richer, poor-get-poorer, and the middle-class-also-get-poorer," marked by increased variability in extreme precipitation events. The study highlights the critical role of MC's forest canopy transpiration in moderating ET variability and its significant influence on the hydroclimatological cycle, especially under deforestation. This intricate interplay between deforestation, ET, and precipitation emphasizes the need to consider both local land use and broader climatic changes in understanding and managing the region's water cycle and extreme climate events.

How to cite: Lo, M.-H., Lee, T.-H., Hsu, J., Chiang, C.-L., and Kuo, Y.-N.: Forest Canopy Transpiration: A Key Moderator of Hydroclimate Variability and Extreme Rainfall in the Maritime Continent, EGU General Assembly 2024, Vienna, Austria, 14–19 Apr 2024, EGU24-1608, https://doi.org/10.5194/egusphere-egu24-1608, 2024.

EGU24-1973 | ECS | Orals | CL4.1

Global South most affected by socio-ecosystem productivity decline due to compound heat and flash droughts 

Lei Gu, Erich Fischer, Jiabo Yin, Louise Slater, Sebastian Sippel, and Reto Knutti

Flash droughts (FDs) and heatwaves are posing disproportionate biophysical and social losses worldwide, particularly threatening the disadvantaged communities in the Global South. However, the underlying physical mechanisms behind compound heat-flash drought (CHFD) events and their impacts on global socio-ecosystem productivity remain elusive. Here using satellites, reanalysis, reconstructions, and field measurements, we find more dry regions (53%~62%) with above-average ratios of FDs accompanied by extreme heat than humid regions (50%~57%), due to asymmetric effects by synoptic weather systems. The CHFDs associated with strong soil moisture-temperature coupling aggravate the constraint on plant photosynthesis in dry regions, whereas this coupling-related vegetation stress is not significant in humid regions. We further develop a global risk framework that integrates CHFD hazards, population/agriculture exposures, and vulnerability, and find the Global South is the primary region affected by CHFDs, contributing to greater-than-usual carbon uptake reduction, 90%~94% and 76%~86% of risks to world population and agriculture over the past four decades. We reveal the Global South is severely affected by the impacts of CHFDs on socio-ecosystem productivity decline and underscore the importance of efforts to monitor, predict, and mitigate the rise in CHFDs. 

How to cite: Gu, L., Fischer, E., Yin, J., Slater, L., Sippel, S., and Knutti, R.: Global South most affected by socio-ecosystem productivity decline due to compound heat and flash droughts, EGU General Assembly 2024, Vienna, Austria, 14–19 Apr 2024, EGU24-1973, https://doi.org/10.5194/egusphere-egu24-1973, 2024.

The land-atmosphere coupling is responsible for flash droughts as the reduced soil moisture increases sensible heat and consequently the lifting condensation level, which ultimately reduces convective precipitation. Meanwhile, the decrease in atmospheric humidity increases the evaporation demand, facilitates the drying of the land surface, and triggers flash droughts with rapid onset and devastating impact. However, whether the role of the land-atmosphere coupling is enhanced or weakened under climate change remains elusive, as previous studies are usually based on unconditional analysis without discriminating dry or wet extremes. Here, we start the investigation from a mega-flash drought occurred over the Yangtze River basin in southern China during the summer of 2022. Both the offline high-resolution land surface model simulations and the CMIP6 climate model data are used for the analysis. It is found that high temperature aggravates the 2022 flash drought onset speed and intensity, highlighting the importance of climate warming. Even under natural climate forcings, the land-atmosphere coupling increases the risks of flash drought intensity and onset speed. The synergy of coupling and anthropogenic climate change would further increase the risks. The synergistic effect on the long-term trends of flash droughts is also being explored, shedding light on the mechanism of flash droughts in a changing climate.

How to cite: Yuan, X.: Synergistic effect of land-atmosphere coupling and climate change on flash droughts, EGU General Assembly 2024, Vienna, Austria, 14–19 Apr 2024, EGU24-2848, https://doi.org/10.5194/egusphere-egu24-2848, 2024.

EGU24-3079 | ECS | Orals | CL4.1

Causal analysis of Heatwaves in India: Impact of Remote Soil Moisture 

Abhirup Banerjee, Armin Koehl, and Detlef Stammer

Heatwaves are a significant threat to human health, agriculture, and infrastructure; particularly in India, where they are prevalent during the pre-monsoon months. May is a critical period for heatwave occurrences, severely impacting the Indian subcontinent. This work delves into the underlying mechanisms driving heatwaves in India, specifically focusing on those that occur in May. Utilizing an intermediate complexity earth system model, PLASIM1, and its adjoint2 for sensitivity analysis3, we systematically investigate the causal role of remote soil moisture in heatwave formation. We find that variations in remote soil moisture significantly influence the strength and duration of pre-monsoon heat waves in India. Our analysis shows that at a lead time of 10-15 days, higher soil moisture particularly over the Middle East, can prolong heatwave conditions over India. On the other hand, high soil moisture over India suppresses the development of heatwaves with no lag. The delayed mechanism of remote soil moisture works through the altered atmospheric circulation patterns induced by heat flux forcing modulated by soil moisture anomalies, leading to enhanced subsidence and reduced moisture transport to India. Our study provides valuable insights into the mechanisms driving heatwaves in India, particularly those in May. These insights are crucial for developing effective early warning systems, enhancing disaster preparedness, and implementing mitigation strategies to reduce the adverse impacts of these extreme events.

1The Planet Simulator (PlaSim): a climate model of intermediate complexity for Earth, Mars and other planets.

2Marotzke, Jochem, et al. "Construction of the adjoint MIT ocean general circulation model and application to Atlantic heat transport sensitivity." Journal of Geophysical Research: Oceans 104.C12 (1999): 29529-29547.

3Köhl, Armin, and Andrey Vlasenko. "Seasonal prediction of northern European winter air temperatures from SST anomalies based on sensitivity estimates." Geophysical Research Letters 46.11 (2019): 6109-6117.

How to cite: Banerjee, A., Koehl, A., and Stammer, D.: Causal analysis of Heatwaves in India: Impact of Remote Soil Moisture, EGU General Assembly 2024, Vienna, Austria, 14–19 Apr 2024, EGU24-3079, https://doi.org/10.5194/egusphere-egu24-3079, 2024.

Assessing the impacts of anthropogenic land use and land cover change (LULCC) on climate extremes is of public concern, calling for the use of state-of-the-art experiments and datasets to update our knowledge. Here, we used the CMIP6-LUMIP experiment results to depict the realistic LULCC effects on extreme temperature and extreme precipitation over both historical and future periods. We pointed out some interesting findings over the historical period: Approximately 1oC decrease in the maximum temperature, and up to nearly 2oC decrease in the minimum temperature in the mid-high latitude of the North Hemisphere. About 10 annual heatwave days can be avoided by LULCC effects in 10% of specific LULCC-intense regions. Three LULCC-intense regions in the North Hemisphere have experienced cooling effects in intensity, frequency, and duration aspects. The precipitation displayed a clear contrast change between the North Hemisphere (wetter) and the South Hemisphere (drier), especially on light rainy days (R1mm). Results of the future period indicate that the tropical deforestation regions are projected to induce a remarkably hotter and drier trend. However, the climate responses averaged globally to deforestation have no obvious changes due to the colder and wetter compensation responses in other regions. The maximum temperature increase in deforestation regions is prominent in intensity, frequency, and duration aspects, while the drought is mainly manifested by frequency and duration reduction of precipitation. Seasonal cycle of changes in temperature indices can be discovered in the North Hemisphere mid-latitude deforestation region, tropical region shows year-round consistency. Changes in LULCC induced climate extremes are more obvious under the low-emission scenario in general. Our work is devoted to portraying the latest and more realistic picture of LULCC impacts on climate extremes and gives early warning information to policymakers and the public.

How to cite: Zhang, M. and Gao, Y.: Impacts of anthropogenic land use and land cover change on climate extremes based on CMIP6-LUMIP experiments, EGU General Assembly 2024, Vienna, Austria, 14–19 Apr 2024, EGU24-4834, https://doi.org/10.5194/egusphere-egu24-4834, 2024.

EGU24-5226 | Posters on site | CL4.1

Using HydroTiles to represent different hydrological regimes in a global Earth System model 

Tobias Stacke, Philipp de Vrese, Veronika Gayler, and Victor Brovkin

Land surface regions that are of crucial importance for climate dynamics, such as Arctic permafrost landscapes, are often extremely heterogeneous. In these areas, hydrological processes and heat fluxes, which are influenced by topographic features on the scale of a few meters, can affect processes such as permafrost thaw over large regions. Despite the emergence of Earth system models that can operate at a resolution down to one kilometer, hydrological heterogeneity at smaller scales is often overlooked. In addition, high-resolution models are computationally intensive, making them unsuitable for the time scales required to study the climate impacts of processes such as permafrost thaw.

In this study, we present an extension to the tiling infrastructure of the ICON Earth system model that enables the representation of different hydrological regimes within individual grid cells. This innovative approach facilitates the representation of lateral water flow connections between different areas within grid cells and the simultaneous representation of different surface water and soil moisture states, such as dry and wet conditions, within a single grid cell. The impact of this improvement is twofold. First, it provides a more accurate representation of surface and soil hydrology. Second, it is expected to improve the representation of land-atmosphere coupling, allowing us to better capture feedbacks across landscapes affected by strong hydrologic contrasts.

By enabling the representation of hydrological features in subgrids through tiles, which we call HydroTiles, we hypothesize that the HydroTiles setup could replicate some features of high-resolution simulations even at lower resolutions. This approach offers the potential to make simulations more computationally cost-efficient. In our presentation, we would like to highlight the advantages and disadvantages of the HydroTile setup compared to high-resolution simulations.

How to cite: Stacke, T., de Vrese, P., Gayler, V., and Brovkin, V.: Using HydroTiles to represent different hydrological regimes in a global Earth System model, EGU General Assembly 2024, Vienna, Austria, 14–19 Apr 2024, EGU24-5226, https://doi.org/10.5194/egusphere-egu24-5226, 2024.

EGU24-5392 | ECS | Posters on site | CL4.1

Examining the impact of extreme land surface temperature and land cover on heatwave occurrence: The case of MENA region  

Mohammadsaeed asghariian, Parvin Azizi, Milad Aminzadeh, and Nima Shokri

The increase in Land Surface Temperature (LST) in a changing climate is expected to alter the intensity and frequency of heatwaves by shifting the energy partitioning over the land surface. The relationship between LST and hot air temperatures, influenced by land cover and associated changes in surface properties is not fully understood, particularly in dry regions of the world experiencing prolonged droughts. Extremely high LSTs and their projected changes [1] may stress resilience and adaptive capacities of the growing population in the Middle East and North Africa (MENA). We thus investigate the evolution of extremely high LSTs in MENA over the past two decades to identify its coupling with hot air temperatures considering different land cover types. Our preliminary results highlight the difference in warming rates of LST and air temperature across different land covers thus enabling to identify the role of land temperature extremes in triggering heatwave events. We observed that variation of land temperature arising from land cover changes (affecting soil moisture dynamics and surface thermal and radiative properties) may significantly influence the occurrence and the intensity of heatwaves in this region. The study offers valuable insights into the complex interplay between land and air hot extremes that are particularly important in local climate investigations, agricultural practices, and ecosystem functions.

Reference

[1] Aminzadeh, M., Or, D., Stevens, B., AghaKouchak, A., & Shokri, N. (2023). Upper bounds of maximum land surface temperatures in a warming climate and limits to plant growth. Earth's Future, 11, e2023EF003755. https://doi.org/10.1029/2023EF003755

How to cite: asghariian, M., Azizi, P., Aminzadeh, M., and Shokri, N.: Examining the impact of extreme land surface temperature and land cover on heatwave occurrence: The case of MENA region , EGU General Assembly 2024, Vienna, Austria, 14–19 Apr 2024, EGU24-5392, https://doi.org/10.5194/egusphere-egu24-5392, 2024.

EGU24-5644 | ECS | Orals | CL4.1 | Highlight

The relationship between forest fragmentation and extreme high temperature 

Ran Du and Yanhong Gao

Warming lead to a surge in extreme climate events, including heatwaves, droughts, flooding, and wildfires. Numerous studies demonstrate that these occurrences have become more frequent, which exerts notable influences on socio-economic development and human health. Besides natural climate changes, land use and land cover changes (LULCC) play a crucial role in shaping extreme climates. As the most extensive land use type globally, forest has experienced great changes since the industrial evolution. Deforestation is one of the most notable global environmental issues. Besides the decrease of the coverage, fragmentation is one of the appearances of deforestation. Many studies have demonstrated that forest distribution shows high agreements with climate regimes generally, however, the relationship between forest fragmentation and extreme climate events remain unclear. This study analyzes the relation between forest fragmentation and main extreme high temperature indices in 2000-2020. Global continental areas are categorized into regions with increased and decreased forest fragmentation index. Regions with increased index, such as the southeast Amazon, Congo Basin, and parts of the Southeast Asia are emphasized. The 11 extreme temperature indices are analyzed responded to the forest fragmentation index change. This study could provide insights for forest management strategies adapting to climate change in the future.

How to cite: Du, R. and Gao, Y.: The relationship between forest fragmentation and extreme high temperature, EGU General Assembly 2024, Vienna, Austria, 14–19 Apr 2024, EGU24-5644, https://doi.org/10.5194/egusphere-egu24-5644, 2024.

The Vietnamese Mekong Delta (VMD) is the most productive region in Vietnam in terms of agriculture and aquaculture. Unsurprisingly, droughts have emerged as a persistent concern for stakeholders throughout the VMD in recent decades. In the evolution and intensification of droughts, local feedbacks in the Land-Atmosphere (LA) interactions were considered to play a crucial role. Previous studies mainly focused on the water cycle feedback loop (e.g., soil moisture-evaporation-precipitation) in the LA interactions. However, there is a noticeable gap in the feedback loop of coupled water and energy balances (e.g., soil moisture-sensible heat-precipitation) associated with the anomalies in sensible heat and precipitation. Therefore, deep understanding of the roles of key variables and their inter-relationships in the LA interactions is of great significance for local communities and authorities. In this study, a deep learning model, named Long- and Short-term Time-series Network (LSTNet), was applied to simulate the LA interactions over the VMD. With the ERA5 data as modelling inputs, the role of each key variable (e.g., soil moisture, sensible and latent heat) in the LA interactions over the past decade (2011-2020) was investigated, and the variations of these variables and their inter-relationships in the future period (2015-2099) were also analyzed based on the Coupled Model Intercomparison Project Phase 6 (CMIP6) data. The LSTNet model has demonstrated that the deep learning algorithm can effectively capture the relative importance of key variables in the LA interactions. We found it is crucial to evaluate the effect of coupled temperature and sensible heat on the LA interactions, particularly for the regions that are susceptible to concurrent droughts and heatwaves, as the co-occurrence of dry and hot weather conditions would inhibit the formation of precipitation and intensify the drought severity. Moreover, the decline in soil moisture and the rise in sensible heat under a changing climate are anticipated to further diminish precipitation in the future. This study would not only enhance our knowledge of the feedback mechanisms in the LA interactions during the drought evolution and intensification, but also provide valuable insights for further development and advancement of hydrologic models for drought monitoring and forecasting.

How to cite: Zhou, K., Shi, X., and Renaud, F.: Deep Learning-Based Analyses of Feedback Mechanisms in the Land-Atmosphere Interactions during Droughts over the Vietnamese Mekong Delta, EGU General Assembly 2024, Vienna, Austria, 14–19 Apr 2024, EGU24-5756, https://doi.org/10.5194/egusphere-egu24-5756, 2024.

EGU24-6099 | ECS | Orals | CL4.1

How strong is land-atmosphere coupling in global storm-resolving simulations? 

Junhong Lee and Cathy Hohenegger

The debate on the sign of land-atmosphere coupling has not been solved so far. On the one hand, studies using global coarse-resolution climate models have claimed that the land-atmosphere coupling is positive. But, such models use convective parameterizations, which is a source of uncertainty. On the other hand, studies using regional climate models with explicit convection have reported negative coupling. Yet, the large-scale circulation is prescribed in such models, and interactions with the ocean are neglected. In this study, we revisit the land-atmosphere coupling using a global fully coupled storm-resolving simulation that has been integrated at a grid spacing of 5 km over a full seasonal cycle, and we compare these results to a coarse-resolution climate model simulation using parameterized convection. We find that the coupling between soil moisture and precipitation is weaker and more negative in the storm-resolving than in the coarse-resolution simulation. Further analysis indicates that not only the feedback between soil moisture and evapotranspiration but also between evapotranspiration and precipitation is weaker in the storm-resolving simulation, in better agreement with observations. Reasons for the differences will be mentioned.

How to cite: Lee, J. and Hohenegger, C.: How strong is land-atmosphere coupling in global storm-resolving simulations?, EGU General Assembly 2024, Vienna, Austria, 14–19 Apr 2024, EGU24-6099, https://doi.org/10.5194/egusphere-egu24-6099, 2024.

EGU24-7942 | ECS | Orals | CL4.1

The cooling effect induced by the Three Gorges Reservoir operation in observations and model simulations 

hongbin li, weiguang wang, and giovanni forzieri

The Three Gorges Dam, the world's largest hydropower project, and its impoundment reservoir have notably modified land cover, with potential implications for regional hydroclimate. However, the seasonal dynamic climate feedbacks arising from variations in water body areas managed by the Three Gorges Reservoir (TGR) remains poorly understood. Based on data-driven analysis and regional climate simulations, we depict the impact of the TGR regulation activities on local land surface temperature (LST) and biophysical processes across different spatiotemporal dimensions, determine the spreading extent of this effect to external territories, and further identify the quantitative attributions between regional climate variabilities and the TGR operation. Results indicate that the TGR induces more pronounced daytime cooling from May to October, particularly in June-August (JJA) with -2.41±0.23 K. The influence of TGR on nighttime LST transitions to warming effects in most regions from November to April (NDJFMA). The significantly increased latent heat (LH) from evaporation growth dominates cooling effects, particularly during daytime, while in JJA, the effects of evaporation are constrained to some extent by abundant precipitation. Albedo exerts a comparatively significant dominance on the nighttime LST in NDJFMA. The TGR-induced surroundings LST changes are notably discernible within an approximately 10 km buffer. The simulations amplify the magnitude and extent of the TGR cooling effect. The simulation results reveal significant reductions in LST of 6.08% (-1.42 K, JJA) and 4.58% (-1.04 K, December-January-February, DJF). respectively, TGR-induced LH variations are dominant for cooling (contributions: -52.09% in JJA; -71.98% in DJF, respectively) among the diverse energy components. This study is valuable for providing scientific guidance in reservoir planning under changing climate.

How to cite: li, H., wang, W., and forzieri, G.: The cooling effect induced by the Three Gorges Reservoir operation in observations and model simulations, EGU General Assembly 2024, Vienna, Austria, 14–19 Apr 2024, EGU24-7942, https://doi.org/10.5194/egusphere-egu24-7942, 2024.

EGU24-8546 | Orals | CL4.1

Role of infiltration on land–atmosphere feedbacks in Central Europe: WRF-Hydro simulations evaluated with cosmic-ray neutron soil moisture 

Joel Arnault, Benjamin Fersch, Martin Schrön, Heye Reemt Bogena, Harrie-Jan Hendricks-Franssen, and Harald Kunstmann

The skill of climate models partly relies on their ability to represent land–atmosphere feedbacks in a realistic manner, through the coupling with a land surface model. However, these models often suffer from insufficient or erroneous information on soil hydraulic parameters. In this study, the land–atmosphere model WRF-Hydro driven with ERA5 reanalysis is employed to reproduce the regional climate over Central Europe with a horizontal resolution of 4 km, for the period 2017-2020 during which cosmic-ray neutron sensor (CRNS) soil moisture is available at three Terrestrial Environmental Observatories. The soil hydraulic parameter datasets referred to as SoilGrids and EU-SoilHydroGrids, together with Campbell and van Genuchten–Mualem retention curve equations, are used to assess the role of infiltration on modeled land–atmosphere feedbacks. After calibration of the percolation parameter to better capture observed discharge amounts in the observatories, it is found that WRF-Hydro with Campbell and SoilGrids gives the lowest mean temperature and mean precipitation differences compared to the E-OBS product from European Climate Assessment & Dataset, by reducing soil moisture in the rootzone, increasing temperature, and decreasing precipitation through a positive soil moisture–precipitation feedback process. WRF-Hydro with van Genuchten–Mualem and EU-SoilHydroGrids best reproduces CRNS soil moisture daily variations, despite enhanced positive biases that generate a larger proportion of convective precipitation favored over wet soils and spurious discharge peaks. The question remains open whether an infiltration modeling option that better captures CRNS soil moisture dynamics can also lead to a clear improvement of the simulated climate.

How to cite: Arnault, J., Fersch, B., Schrön, M., Bogena, H. R., Hendricks-Franssen, H.-J., and Kunstmann, H.: Role of infiltration on land–atmosphere feedbacks in Central Europe: WRF-Hydro simulations evaluated with cosmic-ray neutron soil moisture, EGU General Assembly 2024, Vienna, Austria, 14–19 Apr 2024, EGU24-8546, https://doi.org/10.5194/egusphere-egu24-8546, 2024.

EGU24-9084 | ECS | Posters on site | CL4.1

Sensitivity of the simulated regional climate to changes in the prescribed soil type distributions: Insights from Coupled Regional Climate Model EBU-POM 

Irida Lazic, Vladimir Djurdjevic, Ivana Tosic, and Milica Tosic

In previous studies, it was noticed that many high-resolution Regional Climate Models (RCMs) simulations within the state-of-the-art EURO-CORDEX multi-model ensemble tend to overestimate air temperature and underestimate precipitation in summer leading to the so-called summer drying problem. One of the possible and considerable sources of uncertainty in simulated regional climate is the choice of soil texture database and its soil parameter values. This is crucial because soil hydrophysical properties, influenced by such choices, have an impact on soil moisture and therefore affect the partitioning of surface fluxes [1]. These properties among others play a role in controlling the evolution of soil and air temperature, evapotranspiration, runoff, and precipitation. 

To better understand one of the possible reasons for this problem, we performed two simulations with the coupled regional climate model EBU-POM with two different prescribed soil type distributions. One simulation used the soil type dataset derived from the Zobler dataset and in the second simulation, we used FAO/STATSGO dataset. Two 11-year EBU-POM simulations were conducted, spanning the period from 2000 to 2010. These simulations were initiated in 1998, allowing a two-year spin-up time to reduce the impact of initial fields. The area of interest was Central Europe with a focus on Pannonian Basin because previous studies indicated pronounced dry and warm biases during summer and autumn in low-lying areas, especially in south-eastern Europe. 

The soil moisture capacity is influenced by its hydrophysical characteristics, wherein the size of soil grains plays a crucial role. In this investigation, we emphasized and analyzed the significance of soil hydrophysical properties in shaping surface fluxes. We performed the comprehensive analysis with a focus on the most common specific soil category transitions related to changes in soil parameters and bias changes in surface and near-surface variables and fluxes. The main goal of this study is not to inspect the accuracy of the soil texture map but rather to comprehend the impact on modeled surface and near-surface variables when employing one soil texture dataset versus the other. 

On the other hand, Seneviratne et al. [2] suggested that a new transitional zone characterized by strong land-atmosphere interactions shifted northwards to central and eastern Europe as a consequence of global warming. Their findings highlighted that increased temperature variability in this region is mainly due to land-atmosphere feedbacks. Hence, we analyzed bias in surface and near-surface variables and fluxes and their relation to extreme events such as the heat wave occurred in 2007 to determine their influence on heat wave formation.

[1] Dennis, E. J., and Berbery, E. H. (2021). The role of soil texture in local land surface–atmosphere coupling and regional climate. Journal of Hydrometeorology22(2), 313-330.

[2] Seneviratne, S. I., Lüthi, D., Litschi, M., and Schär, C. (2006). Land–atmosphere coupling and climate change in Europe. Nature, 443(7108), 205-209.

Keywords: regional climate modelling, soil moisture, soil texture, land-atmosphere interactions

Acknowledgement: This research was supported by the Science Fund of the Republic of Serbia, No. 7389, Project Extreme weather events in Serbia - analysis, modelling and impacts” - EXTREMES

How to cite: Lazic, I., Djurdjevic, V., Tosic, I., and Tosic, M.: Sensitivity of the simulated regional climate to changes in the prescribed soil type distributions: Insights from Coupled Regional Climate Model EBU-POM, EGU General Assembly 2024, Vienna, Austria, 14–19 Apr 2024, EGU24-9084, https://doi.org/10.5194/egusphere-egu24-9084, 2024.

EGU24-9091 | ECS | Orals | CL4.1

Analysis of trends in surface energy fluxes under hot conditions using remote sensing products 

Almudena García-García and Jian Peng

Studying land-atmosphere interactions is important for understanding the mechanisms leading to changes in temperature and precipitation extremes. However, the non-conservation of energy and water in most products and their coarse spatial and temporal resolution hamper the study of land-atmosphere feedbacks. The combination of remote sensing data and modelling frameworks allows to greatly improve the spatial coverage and resolution of data products. Here, we investigate trends in surface fluxes over Europe using the new data product generated with the high-resolution land surface fluxes from satellite and reanalysis data (HOLAPS) framework. HOLAPS is a one dimensional modelling framework that solves the energy and water balance at the land surface, providing consistent surface and soil variables derived from remote sensing data and reanalysis products as forcings. The evaluation of the HOLAPS product against eddy covariance measurements shows slightly better results than other ET and H products at daily scales in summer (KGE > 0.0 for ET and KGE > -0.3 for H) and during hot extremes (KGE > -0.15 for ET and KGE >-0.7 for H), while the state-of-the-art products show KGE > -0.49 for ET and KGE > -1.2 for H in summer and KGE > -0.49 for ET and KGE > -1.5 for H during hot extremes. These results together with the 1D conservation of energy and water in the modeling framework makes this product the perfect tool for the analysis of trends in surface energy and water fluxes during the last decades. Preliminary results for the period 2001-2016 reveals a larger increase in the energy reaching the surface during the hottest month of the year than during summer over central Europe and the Mediterranean coast. This extra energy is released as sensible heat over dry areas during the hottest month of the year. In areas where soil water is available, the extra energy available during the hottest month is released as latent heat flux, adding it to the already large latent heat flux during summer. These results support previous analyses indicating an increase of latent heat flux during hot conditions at monthly scales. However, trends at higher temporal resolutions should be examined to improve the robustness of this conclusion. 

How to cite: García-García, A. and Peng, J.: Analysis of trends in surface energy fluxes under hot conditions using remote sensing products, EGU General Assembly 2024, Vienna, Austria, 14–19 Apr 2024, EGU24-9091, https://doi.org/10.5194/egusphere-egu24-9091, 2024.

EGU24-11141 | ECS | Posters on site | CL4.1

The drought response of European ecosystem processes via multiple components of the hydrological cycle 

Christian Poppe Terán, Bibi Naz, Harry Vereecken, and Harrie-Jan Hendricks Franssen

Droughts have become more frequent and severe in Europe over the last decade - a trend expected to continue. Recent studies have shown widespread responses of energy, water, and carbon fluxes in ecosystems to single drought years from flux observations. 

However, to better understand how ecosystems react to droughts, we need to gain explicit knowledge about the different factors that influence their response. In this light, it is crucial to associate the influence of droughts on diverse ecosystem types with particular compartments of the hydrological cycle (atmosphere, surface, soil, and groundwater reservoirs). For instance, during a drought, atmospheric dryness might be the dominant factor in arid regions as opposed to dry soils in humid regions.

Here, we use states and fluxes of water and carbon (vapor pressure deficit, surface runoff, soil moisture, and water table depth) from the Community Land Model 5 in a 3 km resolution over Europe from 1995 to 2018 to determine the drought anomalies of ecosystem processes (gross primary production and evapotranspiration). Importantly, we apply a systematic drought concept integrating lags between deficits in a network of multiple sections of the hydrological cycle during a drought.

Our analyses indicate that the dominance of a particular water resource in controlling ecosystem processes converges regionally and is predominantly consistent across drought events. This finding emphasizes using more comprehensive drought indices incorporating time lags and multiple water resources when analyzing ecosystem responses. Lastly, it identifies areas potentially threatened by droughts and their controlling water resource.

How to cite: Poppe Terán, C., Naz, B., Vereecken, H., and Hendricks Franssen, H.-J.: The drought response of European ecosystem processes via multiple components of the hydrological cycle, EGU General Assembly 2024, Vienna, Austria, 14–19 Apr 2024, EGU24-11141, https://doi.org/10.5194/egusphere-egu24-11141, 2024.

EGU24-11163 | ECS | Orals | CL4.1

Examining the influence of forest changes on drought across time scales in Europe through multiple regional climate model simulations 

Yan Li, Bo Huang, Chunping Tan, Yi Liu, and Henning W. Rust

Land cover changes, notably forest alterations, have been observed across Europe due to extensive land management policies. These changes have significant influence on local climates through diverse biophysical mechanisms, given the crucial role of forests in the land ecosystem. While modeling studies have emphasized the impact of forest changes on regional temperature and precipitation in recent decades, their effects on drought conditions in this region remain largely unexplored. To address this gap, our study analyzes multiple simulations with regional climate models to comprehensively investigate how forest changes impact drought across various timescales in Europe. Specifically, we explored seven models, each simulated two extreme scenarios: maximum forest coverage and grass coverage in the region. The comparison between extreme forest coverage and grass coverage serves to evaluate the impact of deforestation on drought. The Standardized Precipitation Evapotranspiration Index was chosen as our metric to assess drought conditions. Our findings reveal considerable variation among the models in depicting the response to deforestation in terms of drought, particularly notable in Scandinavia and Eastern Europe. Our results suggest an increase in aridity on the Iberian Peninsula following deforestation. In Scandinavia the response varies during the year: winter months tend toward increased dryness, while summer months display a tendency toward greater wetness post-deforestation. Our primary objectives encompass quantifying the potential impacts of deforestation in Europe, identifying resilient model responses, and unraveling the sources of uncertainty within these simulated impacts. Through a meticulous analysis of model responses across regions and timescales, we aim to offer insights into the nuanced effects of forest change on drought conditions. This exploration is crucial in guiding future land management policies and devising strategies to mitigate potential adverse impacts of deforestation on regional drought susceptibility in Europe. Ultimately, our study seeks to contribute to informed decision-making regarding land use practices and their implications for climate and ecosystems.

How to cite: Li, Y., Huang, B., Tan, C., Liu, Y., and Rust, H. W.: Examining the influence of forest changes on drought across time scales in Europe through multiple regional climate model simulations, EGU General Assembly 2024, Vienna, Austria, 14–19 Apr 2024, EGU24-11163, https://doi.org/10.5194/egusphere-egu24-11163, 2024.

Extreme climate events such as droughts and heatwaves significantly impact the stability of ecosystem function and are expected to intensify in the future. The mid-high latitude regions of the Northern Hemisphere (23.5° to 90°N) exhibit pronounced seasonality and are highly sensitive to climate variations. However, further research is needed to understand the vegetation decline and its changing trends driven by extreme hydroclimatic and their compound events in this region. This study, based on multi-source data including NDVI, LAI, and GPP from 1982 to 2015 as vegetation growth indicators, amid to identify vegetation decline during the growing season and explore its temporal trends, and to further reveal the seasonal response. The research supported the importance of drought and high temperature compared to extreme wet and cold conditions. Due to the high frequency, wide impact and long duration of impact, independent low SM dominated the cumulative vegetation decline, followed by low SM and high VPD compound events. High VPD caused stronger negative impacts on vegetation growth than high T and that it was more strongly coupled to SM. We further found a turning point in vegetation decline. Because of the significant increase in VPD and its enhanced coupling with low SM, low SM and its compound events, especially SM- & VPD+ & T+ compound events, led to a significant enhancement of the vegetation decline after about the 21st century. Furthermore, the sensitivity of vegetation growth to extreme hydroclimatic has also significantly increased, with stronger intensity of vegetation decline. Seasonally, early growing season vegetation was more vulnerable (with the strongest continuous decline) due to experiencing the longest duration of negative impacts, while summer vegetation was more sensitive to extreme hydroclimatic, with the strongest intensity. Notably, compound events of high VPD and low SM primarily affected summer vegetation growth. Additionally, there was a significant lag time in vegetation response to extreme hydroclimatic, especially to high VPD and high T. In over half of the regions, the vegetation response to high T and high VPD had a lag time exceeding two months, which may be associated with seasonal legacy. In the context of global warming, further investigation is needed to explore the inter-seasonal connections. This research significantly contributes to a deeper understanding of ecosystem responses to extremes hydroclimatic and its future changes.

How to cite: Du, R. and Wu, J.: The turning point in vegetation decline in the Northern Hemisphere driven by hydroclimatic extremes, EGU General Assembly 2024, Vienna, Austria, 14–19 Apr 2024, EGU24-11693, https://doi.org/10.5194/egusphere-egu24-11693, 2024.

EGU24-12392 | ECS | Posters virtual | CL4.1

Heatwaves and Droughts in Europe: A multi-year analysis using MODIS Land Surface Temperature Anomalies 

Foteini Karinou, Ilias Agathangelidis, and Constantinos Cartalis

In recent decades, European societies and ecosystems have faced recurrent extreme temperatures that contribute to a significant number of impacts, such as wildfires, heat-related illnesses, and crop losses. As heat extremes are further projected to increase in frequency and intensity, a better understanding and close monitoring of these events is necessary. In this study, remotely-sensed Land Surface Temperatures (LSTs) from the Moderate Resolution Imaging Spectroradiometer (MODIS) are used to assess recent heatwaves and droughts in Europe (2003 – 2023). Our results reveal that surface heat extremes are intensifying and becoming more frequent. Moreover, a strong coupling is found between surface thermal extremes, heatwaves (based on near-surface air temperatures) and droughts. Finally, surface LST anomalies are investigated in the context of shifts in energy partitioning under heatwaves/droughts, using eddy covariance flux measurements from the Integrated Carbon Observation System network.

How to cite: Karinou, F., Agathangelidis, I., and Cartalis, C.: Heatwaves and Droughts in Europe: A multi-year analysis using MODIS Land Surface Temperature Anomalies, EGU General Assembly 2024, Vienna, Austria, 14–19 Apr 2024, EGU24-12392, https://doi.org/10.5194/egusphere-egu24-12392, 2024.

EGU24-12955 | ECS | Posters on site | CL4.1

The influence of temperature–moisture coupling on the occurrence of compound hot and dry events over South America: historical and future perspectives 

João L. Geirinhas, Ana Russo, Renata Libonati, Diego G. Miralles, Daniela C. A. Lima, Andreia F. S. Ribeiro, and Ricardo M. Trigo

The strong global warming observed in the past 50 years has intensified the Earth’s water cycle, triggering more frequent and severe rainfall and drought episodes, a trend that is expected to be aggravated in many regions1,2. Consequently, significant changes in the distribution of temperature, precipitation and evaporation are foreseen. Such changes will likely cause disturbances to the physical coupling between temperature and moisture and, ultimately, to the occurrence of compound hot and dry (CDH) extremes, leading to severe environmental and socio-economic impacts3–5. These coupling interactions can be conceptualized by (1) the correlation between temperature and precipitation to characterize atmospheric coupling, and (2) the correlation between temperature and evaporation, as a proxy for land–atmosphere coupling.

Data from ERA5 reanalysis and from a weighted CORDEX-CORE ensemble6 assuming two different emission scenarios (RCP2.6 and RCP 8.5), was used to assess, for seven climate regions in South America, the influence of these coupling interactions on the occurrence of CDH conditions.

Results obtained by applying multivariate regression models for the historical period (1980–2005) demonstrate that the dependence of CDH conditions on these two metrics of coupling varies considerably from region to region. While in some areas of South America a monotonical influence of a particular coupling mechanism dominates, in other regions of the continent a jointly impact of both coupling processes in the occurrence of CDH conditions is present.  We also investigate how the distribution levels of these two coupling processes will change in future due to long-term disturbances expected by climate change in temperature and in the water balance, and how a higher or lower occurrence of CDH episodes can be explained by changes in the type and strength of the dominant coupling mechanism.  

References

  • Chagas, V. B. P. et al. Climate and land management accelerate the Brazilian water cycle. Nat. Commun. 13, 5136 (2022).
  • Donat, M. G. et al. More extreme precipitation in the world’s dry and wet regions. Nat. Clim. Chang. 6, 508–513 (2016).
  • Berg, A. et al. Interannual Coupling between Summertime Surface Temperature and Precipitation over Land: Processes and Implications for Climate Change. J. Clim. 28, 1308–1328 (2015).
  • Miralles, D. G. et al. Land–atmospheric feedbacks during droughts and heatwaves: state of the science and current challenges. Ann. N. Y. Acad. Sci. 1436, 19–35 (2019).
  • Lesk, C. et al. Stronger temperature–moisture couplings exacerbate the impact of climate warming on global crop yields. Nat. Food 2, 683–691 (2021).
  • Lima, D. C. A. et al. A multi-variable constrained ensemble of regional climate projections under multi-scenarios for Portugal – Part I: An overview of impacts on means and extremes. Clim. Serv. 30, 100351 (2023).

Acknowledgments:

JG is grateful to Fundação para a Ciência e a Tecnologia I.P./MCTES (FCT) for the PhD Grant 2020.05198.BD. JG, AR, RMT, and DCAL also thank FCT I.P./MCTES through national funds (PIDDAC) – UIDB/50019/2020 (https://doi.org/10.54499/UIDP/50019/2020) and LA/P/0068/2020 (https://doi.org/10.54499/LA/P/0068/2020). AR, RMT, RL, JG and AFSR thank also FCT for project DHEFEUS (https://doi.org/10.54499/2022.09185.PTDC). AR was supported by FCT through https://doi.org/10.54499/2022.01167.CEECIND/CP1722/CT0006. DCAL was supported by FCT through https://doi.org/10.54499/2022.03183.CEECIND/CP1715/CT0004. DGM acknowledges support from the European Research Council (HEAT, 101088405).

How to cite: Geirinhas, J. L., Russo, A., Libonati, R., Miralles, D. G., Lima, D. C. A., Ribeiro, A. F. S., and Trigo, R. M.: The influence of temperature–moisture coupling on the occurrence of compound hot and dry events over South America: historical and future perspectives, EGU General Assembly 2024, Vienna, Austria, 14–19 Apr 2024, EGU24-12955, https://doi.org/10.5194/egusphere-egu24-12955, 2024.

EGU24-13027 | ECS | Posters on site | CL4.1

Unveiling the influences of soil moisture on moist heat stress extremes: a global assessment using CMIP6 data 

Jingwei Zhou, Dragan Milosevic, and Adriaan Teuling

Soil moisture is a key variable in land-atmosphere interactions, as it affects the partitioning of near-surface energy fluxes and thereby temperature and humidity of the lower atmosphere. Both ambient temperature and humidity play a crucial role in the removal of heat from the human body through direct heat transfer and sweat evaporation, therefore these two factors are commonly used in measuring moist heat stress. As moist heat stress describes the combined effects of temperature and humidity on human health and well-being, understanding the intricate relationship between soil moisture and moist heat stress is crucial for accurately assessing and mitigating moist heat extremes. Whereas the impact of soil moisture on temperature is well understood, previous research has found non-trivial and complex relations between soil moisture and moist heat stress due to humidity feedbacks. We selected two metrics among four widely used metrics which involve both temperature and humidity, indoor and open-air wet-bulb globe temperature, heat index, and humidex, to represent the heat stress in our study. We use different levels to describe the significance of the heat stress and tolerance level among the population.

In this study, we aim to investigate the impacts of soil moisture on moist heat stress at the global scale using the Land Surface, Snow and Soil moisture Model Intercomparison Project (LS3MIP) dataset within the sixth phase of the Coupled Model Intercomparison Project (CMIP6). We use the historical and future simulations from LS3MIP to analyze the spatial and temporal variations of soil moisture-heat stress coupling, and to identify the regions that are most susceptible to moist heat stress. Interactions between soil moisture and moist heat stress tend to be particularly pronounced in hot and humid regions,. These regions are likely to experience more frequent events with higher moist heat stress, posing serious challenges for human health and adaptation.

To our best knowledge, this study is the first to show a global picture of the interactions between soil moisture and moist heat stress using CMIP6 dataset. The pattern of heat stress in relation to soil moisture in perspectives of the time of day, season, and soil moisture regime will be investigated. Our study provides a novel insight into the role of soil moisture in modulating moist heat stress, and highlights the need for more accurate representation of land surface processes and feedbacks in climate models. The findings are crucial for developing effective strategies in managing moist heat stress risks and protecting vulnerable populations.

How to cite: Zhou, J., Milosevic, D., and Teuling, A.: Unveiling the influences of soil moisture on moist heat stress extremes: a global assessment using CMIP6 data, EGU General Assembly 2024, Vienna, Austria, 14–19 Apr 2024, EGU24-13027, https://doi.org/10.5194/egusphere-egu24-13027, 2024.

EGU24-13484 | ECS | Orals | CL4.1

Seasonal Variability of Deforestation-Induced Warming in the Congo Basin Using Remote-Sensing Data 

Coralie Adams and Luis Garcia-Carreras

Deforestation impacts in the Congo Basin remain significantly understudied compared to other tropical regions. The main driver of Congo Basin deforestation is small-scale industrial agriculture, which leads to the formation of the rural complex; a mosaic patch of deforested land comprising small fields at different stages of regrowth being deforested repeatedly. Transition from primary forest to rural complex may induce lesser changes in albedo, Bowen ratio, and surface roughness than primary forest to cropland, suggesting the impacts of deforestation on temperatures in the Congo Basin will differ from those in other rainforest regions. The Basin's long-term warming trend and possible ongoing drying could exacerbate warming due to deforestation. It is therefore essential that we understand how the specific nature of deforestation in the Congo Basin influences temperatures, and how this is affected by changes in the large-scale conditions driven by global climate change.

In this study, we used MODIS satellite data for LST and EVI, CHIRPS2 for rainfall, and the Global Forest Change dataset for deforestation analysis from 2000 to 2019 to assess how observed deforestation is affecting LST in the Congo Basin and how the deforestation-induced warming varies with climate anomalies, LST and rainfall (SPI), and Δ EVI (deforested EVI – surrounding forest EVI). Due to limited data availability, caused by the prevalence of cloud cover throughout much of the year, our focus narrowed to the most data-consistent dry season (DJF), where land-atmosphere interactions are also likely to be strongest.

We found a linear relationship between cumulative deforestation and warming over deforested land, which varied in intensity by month. A typical 1 km rural complex pixel within the region will warm by +0.33 °C in December, +0.85 °C in January, and +1.54 °C in February, relative to the surrounding forest. We then assessed the cause of the strong seasonal differences by looking at the deforestation-induced warming as a factor of the climate anomalies and Δ EVI. The amount of warming of a typical 1 km rural complex pixel did not show a relationship with the LST anomaly or SPI for the individual months. However, when considering all months collectively, a correlation emerged with the LST anomaly, suggesting a seasonal evolution where the LST anomaly acts as a proxy. We then found a link between the warming of a typical 1 km rural complex pixel and Δ EVI which is present for each month; this partially explains the interannual variability of the results, but it doesn’t explain the seasonal evolution. Comprehensive and high-quality observations are needed over the Congo Basin to fully untangle these relationships. Accurate soil moisture data could be crucial in understanding the pronounced seasonal differences in warming. These findings suggest that even though the rural complex differs from cropland, and might be expected to have a smaller impact, the additional warming can still be substantial (+1.54 °C), although it has a strong seasonal dependency.

How to cite: Adams, C. and Garcia-Carreras, L.: Seasonal Variability of Deforestation-Induced Warming in the Congo Basin Using Remote-Sensing Data, EGU General Assembly 2024, Vienna, Austria, 14–19 Apr 2024, EGU24-13484, https://doi.org/10.5194/egusphere-egu24-13484, 2024.

EGU24-14184 | ECS | Orals | CL4.1

Links between seasonal precipitation intermittency and soil moisture variability 

Woon Mi Kim, Isla Simpson, Clara Deser, Flavio Lehner, and Angeline Pendergrass

Precipitation is an important control of soil moisture on land. Thus, many studies have focused on understanding the influences of mean or total precipitation variability on soil moisture. However, the relationship between precipitation intermittency (the temporal distribution of rainfall events) and soil moisture variability remains largely underexplored. This question requires more attention as climate models are known to be deficient in their representation of precipitation intermittency (PI), and PI is projected to increase in a future warmer climate, potentially affecting soil moisture variability. In this study, we examine the associations between seasonal PI and soil moisture (SM) across the globe in observation-based datasets (ERA5, MSWEP, and GLEAM) and model simulations (CESM2 Large Ensembles – LENS2) for the period 1981–2020. As a methodology to quantify the associations between PI and SM, we use a conditional regression analysis of 10cm soil moisture onto a metric of PI (reverted number of wet days in a season) after the removal of the influence of total seasonal precipitation from each variable. 

The result suggests that in many regions, higher PI leads to decreases in SM under the same amount of seasonal precipitation. These associations are explained by increased runoff under higher PI. Therefore, the spatial patterns of the magnitude and sign of the linkage between PI and SM align with the global patterns of PI-runoff interactions. Additionally, the regions where evapotranspiration (ET)–SM correlations are high (>0.5) present higher SM sensitivity to changes in PI. CESM2 exhibits spatial consistency in the PI–SM associations with ERA5, although noticeable differences exist in the magnitudes of the regression coefficients between the two datasets. In general, the PI–SM associations are weaker in CESM2. This disparity is attributed to the different runoff sensitivity to changes in precipitation and PI. CESM2 exhibits reduced runoff sensitivity to PI than ERA5 over the entire globe. This finding implies that how runoff is modeled and constrained in climate models will affect future projections of soil moisture.

How to cite: Kim, W. M., Simpson, I., Deser, C., Lehner, F., and Pendergrass, A.: Links between seasonal precipitation intermittency and soil moisture variability, EGU General Assembly 2024, Vienna, Austria, 14–19 Apr 2024, EGU24-14184, https://doi.org/10.5194/egusphere-egu24-14184, 2024.

Land-atmosphere interactions are crucial in both weather and climate extremes. Studies have revealed certain large atmospheric circulation patterns such as amplified circumglobal wave 5 and 7 play important role in generating and maintaining surface extremes. These extremes can occur at the same time but different locations, for example in 2010, the wave 5 pattern was the driver for Russian heatwave and Pakistan flooding. But how soil moisture and land-atmosphere interactions affect the climatology states of jetstreams, amplified waves, and hence persistent extremes still remains unclear.

Here, we employ large ensemble simulations from climate model EC-Earth 3 to study the role of soil moisture in affecting large-scale atmospheric circulation for the period of 2009 to 2016. Three sets of experiments (each set has 100 ensemble members) are carried out with perturbed atmosphere-soil moisture interactions and one reference run (100 members) in which the interaction between the atmosphere and the land is fully interactive. We show that atmosphere-soil moisture interactions strongly influence the climatological mean states of atmospheric circulation in the Northern Hemisphere during the summer season (June to August) and especially in July. With the same soil moisture climatology, the reference run showed an overall land warming that led to poleward migration of jet and a more Arctic front jet state.

 Additionally, West Russia is chosen for the case study area as it is a hotspot for both amplified wave 5 and wave 7 heat extremes. We define the long duration heatwave event as near-surface temperature exceeding 30oC for at least eight days. The results show that with the soil-atmosphere interaction, the probability of such events increased from 2.2% to 5.8% for wave 5 and 0.47% to 4.5% for wave 7.

How to cite: Luo, F., Selten, F., and Coumou, D.: The role of soil moisture on summer atmospheric circulation climatology and persistent heatwaves in the Northern Hemisphere, EGU General Assembly 2024, Vienna, Austria, 14–19 Apr 2024, EGU24-14484, https://doi.org/10.5194/egusphere-egu24-14484, 2024.

EGU24-14774 | Orals | CL4.1

Drought Changes Growing Season Length and Vegetation Productivity 

Josh Gray, Eunhye Choi, Mark Friedl, and Patrick Griffiths

Meteorological droughts are increasing in intensity, frequency, and duration due to climate change. These events may have substantial impacts on vegetation productivity that influence the global carbon balance. Effects vary considerably, however, with the intensity of the drought as well as local abiotic and biotic conditions such as vegetation type, soil type, and the timing of the drought. Productivity is primarily reduced because droughts decrease the efficiency with which plants can convert atmospheric CO2 into carbohydrates, largely because of stomatal closure when energy is not limiting. However, another aspect by which droughts can reduce productivity is by shortening the growing season length (GSL). GSL reduction may be particularly pronounced in vegetation communities already sensitive to precipitation variability, in particular, short-rooted grassland and croplands ecosystems. Here, we use evidence from satellite observations of ecosystem activity, meteorological measurements, and data from eddy-covariance flux towers to reveal the impact of several large-scale meteorological droughts on vegetation productivity on natural and managed ecosystems. In particular, we show that the timing of the drought is important, with late droughts being particularly diminishing to productivity. We also demonstrate that while plant physiological responses to drought dominate the reduction in productivity, the diminishment of GSL plays an underappreciated role. These results have wide implications for the future carbon balance under a changing climate, and suggests that ecosystem models could better explain productivity by incorporating the effects of droughts on GSL.

How to cite: Gray, J., Choi, E., Friedl, M., and Griffiths, P.: Drought Changes Growing Season Length and Vegetation Productivity, EGU General Assembly 2024, Vienna, Austria, 14–19 Apr 2024, EGU24-14774, https://doi.org/10.5194/egusphere-egu24-14774, 2024.

EGU24-15546 | ECS | Orals | CL4.1

Challenges in simulating ground surface temperature based on remote sensing land surface temperature over mountain grasslands 

Raul-David Șerban, Giacomo Bertoldi, Paulina Bartkowiak, Mariapina Castelli, and Andrea Andreoli

Ground surface temperature (GST), measured at a depth of around 5 cm below the ground surface, is essential for understanding the climate change impacts in the Earth Critical Zone. Large spatiotemporal variations of GST have been reported in mountain regions due to the heterogeneity of surface cover and topography. This work aims to improve the monitoring of GST using a physical land-surface model driven by satellite-based land surface temperature (LST). In this regard, GST was simulated using the physical GEOtop model at 1500 m elevation in Matsch Valley, north-eastern Italian Alps, from 2014 to 2017 during the phenological cycle, between April and October. The model was forced only by the LST derived from the Terra MODerate resolution Imaging Spectroradiometer (MODIS). The 1-km MODIS LST was first downscaled to a finer spatial resolution of 250-m using data-driven sharpening from random forest algorithm. The simulated GSTs correlate well with the in-situ observations with a Pearson correlation of 0.88 and a coefficient of determination of 0.77. However, the model overestimated the GST for the whole period with a mean bias of 8.72 °C. These overestimations are similar to the differences between in-situ GST and MODIS LST which range from 4.8 to 19 °C with an average of 8.5 °C. They are mainly caused by the low temporal resolution of LST data with only one observation per day which is additionally limited by frequent cloud cover contamination and the low spatial resolution of the MODIS thermal channels. Modelling the damping of the LST signal in the first centimeters of soil to simulate GST in very heterogeneous areas like alpine pastures is still challenging. This is mainly due to the resolution mismatch between ground and remote sensing observations and the poor knowledge of soil and vegetation properties needed to parametrize physical models.

How to cite: Șerban, R.-D., Bertoldi, G., Bartkowiak, P., Castelli, M., and Andreoli, A.: Challenges in simulating ground surface temperature based on remote sensing land surface temperature over mountain grasslands, EGU General Assembly 2024, Vienna, Austria, 14–19 Apr 2024, EGU24-15546, https://doi.org/10.5194/egusphere-egu24-15546, 2024.

EGU24-16559 | Orals | CL4.1 | Highlight

Assessing extreme temperature volatilities across Germany between 1990 and 2022 

Elisa Jordan, Ankit Shekhar, and Mana Gharun

Climate change causes a global rise in mean air temperature and increased frequency of temperature extremes. Recent studies link sharp temperature changes between consecutive days to increased mortality, reduced economic growth, and negative effects on ecosystems. While climatological analyses predominantly focus on mean temperatures, extreme temperatures have higher impacts on human health. This study assesses the variability of the daily maximum air temperature between two consecutive days (i.e., volatility) across Germany from 1990 to 2022. We used observation-based raster data of the maximum daily temperature assessed volatility regarding: 1) magnitude, 2) seasonality, 3) the direction of temperature change, and 4) trends during the entire period. As changes of land use and land cover have a direct impact on local temperatures, we analysed the land cover changes during the same period and examine its correlation to extreme volatilities.

The results showed a higher magnitude of rapid temperature decreases compared to temperature increases. Extreme volatilities increased with further distance to the coast from north of Germany to south. Overall, abrupt day-to-day temperature changes occurred mostly during the warming half-year (from March to August). During the study period, significant trends of 0.5 °C and 0.2 °C per decade showed a widening range of extreme volatility in spring and autumn. Compared to unchanged areas, changing land cover was predominantly liked to increasing volatilities of up to 0.5 °C. Understanding rapid temperature changes is crucial for climate change mitigation strategies and limiting impacts on human health and on the environment.

How to cite: Jordan, E., Shekhar, A., and Gharun, M.: Assessing extreme temperature volatilities across Germany between 1990 and 2022, EGU General Assembly 2024, Vienna, Austria, 14–19 Apr 2024, EGU24-16559, https://doi.org/10.5194/egusphere-egu24-16559, 2024.

EGU24-16729 | ECS | Posters on site | CL4.1

Poleward migration of soil moisture–temperature coupling hotspots under global warming 

Daniel F.T. Hagan, Diego Miralles, Guojie Wang, Alan T. Kennedy-Asser, Mingxing Li, Waheed Ullah, and Shijie Li

Global hotspot regions where soil moisture (SM) constrains temperature changes are expected to migrate and change in intensity under climate change, impacting hydroclimatic events; however, the nature of these changes is still uncertain. Using multiple model outputs from the Coupled Model Intercomparison Project Phase 6 (CMIP6), we assessed potential future changes in the coupling between boreal summer SM and near-surface mean air temperature (T) across the globe under four Shared Socioeconomic Pathways (SSPs, 2015–2100). We find weakening SM impacts on T (SM-T coupling) in semi-arid, low-latitude regions with increasing emission scenarios due to reduced sensitivity of evaporation to SM. However, our results showed intensifying SM-T coupling primarily over humid regions with increasing precipitation yet decreasing SM due to increasing evaporation. We demonstrate that these changes could be linked to the poleward expansion of the Hadley cells and water-limiting conditions, shifting SM controls on partitioning the surface net radiation and subsequently on T under global warming. These results suggest a higher likelihood of extreme hydroclimatic events, such as heatwaves in higher latitudes associated with the SM–T coupling, which could impact food and water security.

How to cite: Hagan, D. F. T., Miralles, D., Wang, G., Kennedy-Asser, A. T., Li, M., Ullah, W., and Li, S.: Poleward migration of soil moisture–temperature coupling hotspots under global warming, EGU General Assembly 2024, Vienna, Austria, 14–19 Apr 2024, EGU24-16729, https://doi.org/10.5194/egusphere-egu24-16729, 2024.

EGU24-17393 | Orals | CL4.1

Investigating the Climate Impacts of Afforestation and Deforestation in Europe via 5 km climate model simulations 

Luca Caporaso, Gregory Duveiller, Matteo Piccardo, Emanuele Massaro, Caspar Roebroek, Mirco Migliavacca, and Alessandro Cescatti

In the context of the European Green Deal framework, understanding the intricate and varied impacts of afforestation and deforestation across different regions is paramount. A complex interplay of environmental factors shapes the resulting climate effects. Evaluating these impacts and their spatial variability is crucial for formulating effective and context-specific climate mitigation and adaptation strategies.

This study takes a comprehensive approach, investigating both local and non-local effects of afforestation and deforestation within Europe, with a specific emphasis on the radiative budget and temperature dynamics.  Utilizing the cutting-edge Regional Climate Model (RegCM5) in conjunction with the Community Land Model version 4.5 (CLM4.5), we conducted simulations at a fine-scale, convective-permitting resolution of 5 km. This granular approach allows for an in-depth understanding of climate dynamics, shedding light on the distinct climate responses to forest cover alterations at various locations.

We conducted three simulations spanning the period 2004-2014: a control run and two scenarios involving afforestation and deforestation.  We concentrated on analyzing climatic changes through variables such as land surface temperature, near-surface air temperature, and the energy fluxes at the Earth's surface and the top of the atmosphere (TOA). Results suggest that afforestation/deforestation can yield substantial impacts on the climate system. It underscores the critical importance of evaluating biophysical effects at a high resolution, emphasizing the need to incorporate such considerations into climate change mitigation strategies.

Recognizing the location-dependent nature of afforestation and deforestation climate impacts, combined with the capabilities of advanced modeling tools, underscores the importance of flexible and adaptable land use planning. The practical implications of our findings extend to policymaking, offering insights that can inform sustainable land use decisions. These insights can guide the formulation of resilient and sustainable land use policies, aligning with the ambitious objectives of the European Green Deal.

How to cite: Caporaso, L., Duveiller, G., Piccardo, M., Massaro, E., Roebroek, C., Migliavacca, M., and Cescatti, A.: Investigating the Climate Impacts of Afforestation and Deforestation in Europe via 5 km climate model simulations, EGU General Assembly 2024, Vienna, Austria, 14–19 Apr 2024, EGU24-17393, https://doi.org/10.5194/egusphere-egu24-17393, 2024.

EGU24-17662 | ECS | Orals | CL4.1

Large biases in soil moisture limitation across CMIP6 models 

Francesco Giardina, Ryan S. Padrón, Benjamin D. Stocker, Dominik L. Schumacher, and Sonia I. Seneviratne

Accurate soil moisture representation is crucial in climate modeling, due to its significant role in land-atmosphere interactions. Our study focuses on water storage dynamics and analyzes how soil moisture limitation is represented in simulations from the land component (land-hist experiment) of seven models within the Coupled Model Intercomparison Project phase 6 (CMIP6). We quantified the annual maximum depletion in soil moisture, contrasting model results with observations of terrestrial water storage from the Gravity Recovery and Climate Experiment (GRACE). Our analysis shows that CMIP6 models mostly underestimate these annual extremes in soil moisture reductions, with the Amazon consistently emerging as the most biased region. We further computed the critical soil moisture thresholds and quantified the frequency of soil moisture limitation in CMIP6 simulations, comparing model estimates against solar-induced fluorescence (SIF) and GRACE observations. We found consistent results with the annual maximum depletion in soil moisture, with models almost always overestimating the frequency of soil moisture limitation globally compared to observations. We validated our findings with data from 128 eddy-covariance sites from eight biomes worldwide. Our study illuminates the biases in soil moisture storage and dynamics between CMIP6 models and empirical observations, highlighting the importance of improving the representations of soil moisture and land-atmosphere interactions in Earth System Models.

How to cite: Giardina, F., Padrón, R. S., Stocker, B. D., Schumacher, D. L., and Seneviratne, S. I.: Large biases in soil moisture limitation across CMIP6 models, EGU General Assembly 2024, Vienna, Austria, 14–19 Apr 2024, EGU24-17662, https://doi.org/10.5194/egusphere-egu24-17662, 2024.

EGU24-17860 | Orals | CL4.1

The International Soil Moisture Network (ISMN): providing a permanent service for earth system sciences 

Matthias Zink, Fay Boehmer, Wolfgang Korres, Kasjen Kramer, Stephan Dietrich, and Tunde Olarinoye

Soil moisture is recognized as an Essential Climate Variable (ECV), because it is crucial to assess water availability for plants and hence food production. Having long time series of freely available and interoperable soil moisture data with global coverage enables scientists, practitioners (like farmers) and decision makers to detect trends, assess the impacts of climate change and develop adaptation strategies.

The collection, harmonization and archiving of in situ soil moisture data was the motivation to establish the International Soil Moisture Network (ISMN) at the Vienna University of Technology in 2009 as a community effort. Based on several project funding periods by the European Space Agency (ESA), the ISMN became an essential means for validating and improving global land surface satellite products, climate and hydrological models. In December 2022, the ISMN was transferred to a new hosting facility the International Centre for Water Resources and Global Change (ICWRGC) and the German Federal Institute of Hydrology (BfG) in Koblenz (Germany). ISMN data are successfully provided from the new host since then and will be for decades to come as the German government committed to its long-term funding.

This presentation is going to showcase the International Soil Moisture Network (ISMN). Beyond offering comprehensive in situ soil moisture data, ISMN freely disseminates additional environmental variables, including soil temperature, snow depth, snow water equivalent, precipitation, air temperature, surface temperature and soil water potential if they are available from our data providers. With a global reach, ISMN has already accumulated 3000 stations with observations at various depths, while about 1000 stations are updated on a daily basis. Ongoing efforts are concentrated on expanding the database by incorporating additional stations and networks from institutional or governmental sources. Substantial resources are directed towards fortifying the operational system and improve usability to better serve our users. Additional efforts are undertaken to include ISMN in the data-to-value chain by contributing to international initiatives like WMO, FAO and GCOS. One example is the contribution to WMO’s yearly Global State of the Water Resources report.

How to cite: Zink, M., Boehmer, F., Korres, W., Kramer, K., Dietrich, S., and Olarinoye, T.: The International Soil Moisture Network (ISMN): providing a permanent service for earth system sciences, EGU General Assembly 2024, Vienna, Austria, 14–19 Apr 2024, EGU24-17860, https://doi.org/10.5194/egusphere-egu24-17860, 2024.

EGU24-18231 | ECS | Orals | CL4.1

Summer Drought Prediction in Europe combining Climate Simulations and Remote Sensing 

David Civantos Prieto, Jesús Peña-Izquierdo, Lluis Palma, Markus Donat, Gonzalo Vilella, Mihnea Tufis, Arjit Nandi, Maria Jose Escorihuela, and Laia Romero

The occurrence of droughts is ruled by the interplay of complex processes with very different natures and spatio-temporal scales. Different modes of climate variability, like the North Atlantic Oscillation or ENSO (El Niño-Southern Oscillation), set the prevalence of distinct weather regimes providing sources of predictability at large-scale. On the other hand,  land-atmosphere feedbacks play a crucial role in climate extremes, and particularly, in the evolution and amplification of droughts. However, the weak predictability of the former large-scale variability in the extratropics together with the poor representation of these feedbacks in current seasonal predictive systems lead to a limited capability of predicting droughts months in advance. In this study (part of the AI4Drought project, funded by ESA), we aim to enhance summer drought prediction in Europe from spring conditions by the combination of state-of-the-art climate simulations and remote sensing.

A hybrid model combining climate simulations and high-resolution remote sensing data is proposed to boost the predictability signal at seasonal time-scale through the integration of two machine learning (ML) models. The first model (model-A) enhances large-scale predictability. It consists of a generative model (conditional variational auto-encoder, based on Pan et al., 2022), which is trained with 10.000s years of CMIP6 climate simulations to empirically learn the probability distributions between global spring fields; e.g., sea surface temperatures and 500 hPa geopotential height; and summer drought conditions (SPEI3). A local-scale model for extremes amplification is developed (model-B). A pixel-based (multi-layer neural network) model aims to capture land-atmosphere feedbacks; integrating local conditions from satellite-based products and reanalysis data, e.g. soil moisture (SM), temperatures and NDVI together with information from the large-scale predictions from model-A in order to predict SM anomalies for the whole summer season.

Preliminary results highlight the significance of local conditions in enhancing drought predictions, particularly in the Mediterranean region, where land-atmosphere feedbacks are pronounced. Experiments conducted under ideal conditions, knowing the future large-scale conditions in advance, demonstrate improved prediction skill when local conditions (e.g., soil moisture, NDVI) are included as predictors.

Moreover, a DeepSHAP analysis (eXplainableAI-based method) is performed to understand which are the most important drivers for the local-scale model prediction of summer SM anomalies. As expected, the spring’s SM anomalies are the most important input features; together with the large-scale conditions described by August SPEI-3. Additionally, temperature anomalies have a relatively high importance when predicting summer drought conditions.

This research underscores the potential of a hybrid approach integrating climate simulations and remote sensing data to advance the understanding and prediction of summer droughts in Europe.

How to cite: Civantos Prieto, D., Peña-Izquierdo, J., Palma, L., Donat, M., Vilella, G., Tufis, M., Nandi, A., Escorihuela, M. J., and Romero, L.: Summer Drought Prediction in Europe combining Climate Simulations and Remote Sensing, EGU General Assembly 2024, Vienna, Austria, 14–19 Apr 2024, EGU24-18231, https://doi.org/10.5194/egusphere-egu24-18231, 2024.

EGU24-18682 | ECS | Posters on site | CL4.1

Uncovering the moisture and heat sources to croplands during agricultural failure events 

Hao Li, Jessica Keune, and Diego Miralles

Dry and hot climate anomalies threaten rainfed agricultural productivity worldwide. Land–atmosphere feedbacks play a critical role during these abnormal weather events; for example, dry soils reduce evaporation and enhance sensible heating over the land surface, thereby amplifying air temperatures and water deficits for crops, consequently leading to agriculture failure. Moreover, these anomalies of moisture and heat upwind can be translated into downwind regions, thus leading to the spatial propagation of crop-adverse climate conditions. 

In this presentation, we analyse precipitation and temperature anomalies associated with crop failure events over the world’s largest 75 rainfed breadbaskets. Then the spatio-temporal origins of moisture and heat over these breadbaskets are determined using a novel atmospheric Lagrangian modelling framework along with satellite observations. Results indicate that upwind and local land–atmosphere feedbacks together cause lower moisture and higher heat transport into these breadbaskets, leading to decreases in yield of up to 40%. By zooming into the Southeastern Australia wheat belt as an example, known for experiencing recurrent droughts and heatwaves, we provide a detailed analysis of the anomalies of water and energy fluxes and atmospheric circulation and their impacts on moisture and heat sources. We find a substantial impact of advection of dry and hot air from upwind terrestrial regions, particularly during crop failure events, i.e., 1994, 2002, and 2006. Persistent high-pressure systems significantly alter moisture and heat imports into the wheat belt during these events, with upwind drought conditions intensifying rainfall deficits and heat stress in the agricultural region.

Our study suggests the potential for upwind land management to mitigate agricultural losses in rainfed, water-limited regions. Further understanding the intricate relationships between upwind and local influences on global breadbaskets, and specific regions like Southeastern Australia, may provide crucial insights for developing adaptive measures to avert food shortages in the face of a changing climate.

How to cite: Li, H., Keune, J., and Miralles, D.: Uncovering the moisture and heat sources to croplands during agricultural failure events, EGU General Assembly 2024, Vienna, Austria, 14–19 Apr 2024, EGU24-18682, https://doi.org/10.5194/egusphere-egu24-18682, 2024.

EGU24-19126 | Orals | CL4.1

Development of a land model for the next generation MIROC climate model and evaluation of its simulated land-atmosphere coupling 

Tomoko Nitta, Takashi Arakawa, Akira Takeshima, Dai Yamazaki, and Kei Yoshimura

We have been developing Integrated Land Simulator as a land model for the next generation of the MIROC climate model. Using a general-purpose coupler, ILS couples various land component models with minimum modifications and makes a land model independent from the atmospheric model. The major changes from the previous version of the land model in MIROC6 are the method of coupling land and atmosphere, the independent grid system and spatial resolution for the land model, and the river model. In MIROC6, the land model was part of the physical process of the atmospheric model and was run sequentially, but in the new model (MIROC-ILS), the land and atmospheric models are run in parallel. We have confirmed the MIROC-ILS meets the requirements such as water balance closure and computation time. In the presentation, we will show how the changes of land-atmosphere coupling method and coupling frequency affects the simulated atmosphere field.

How to cite: Nitta, T., Arakawa, T., Takeshima, A., Yamazaki, D., and Yoshimura, K.: Development of a land model for the next generation MIROC climate model and evaluation of its simulated land-atmosphere coupling, EGU General Assembly 2024, Vienna, Austria, 14–19 Apr 2024, EGU24-19126, https://doi.org/10.5194/egusphere-egu24-19126, 2024.

EGU24-19526 | ECS | Orals | CL4.1

Exploring the influence of land-atmosphere interactions on humid heat extremes in a convection permitting model simulation 

Guillaume Chagnaud, Chris Taylor, Cathryn Birch, Lawrence Jackson, John Marsham, and Cornelia Klein

Ambient humidity reduces the ability of the body to cool down through sweating, adding to the heat 
stress caused by elevated air temperature alone. Indeed, humid heat waves (HHWs) are already a threat
for humans, livestock and wildlife, and their impacts are projected to increase with global warming.
HHWs result from the combination of thermodynamic and dynamic processes interacting on a range of 
time and space scales and whose relative importance may vary according to location and time of year.

Africa is one continent where HHWs, defined here as extremes of wet-bulb temperature (Twb), are 
expected to become more important under global warming. Local-scale humid heat extremes may occur 
within more moderate larger-scale events across much of the continent. Yet, climatological 
characteristics of these smaller-scale events such as location and timing (in year and day) are poorly 
documented in the current climate, due to a lack of high-resolution data and research focus. Moreover, 
a comprehensive understanding of their meso- to synoptic-scale drivers is still lacking. Here, we explore 
these two issues using a 10-year pan-African convection-permitting model simulation that explicitly 
resolves land-atmosphere interactions, and particularly those involving moist processes that are 
instrumental to HHWs.

We find humid heat extremes in semi-arid regions occurring in the core of the rainy season, on length 
scales down to a few tens of kilometers. During HHWs, Twb peaks several hours 
later than the climatological peak in the late morning. This diurnal cycle shift is likely due to HHWs 
typically developing in the aftermath of a rainfall event: the resulting positive anomaly in soil moisture 
induces increased latent heat fluxes, low level divergence, and a reduced PBL height, all ingredients
displaying sharp spatial gradients conducive to locally high Twb values. These results have implications 
for the improvement of localized HHW predictability based on local soil moisture conditions, a key step 
towards climate change adaptation through e.g., early-warning systems.

How to cite: Chagnaud, G., Taylor, C., Birch, C., Jackson, L., Marsham, J., and Klein, C.: Exploring the influence of land-atmosphere interactions on humid heat extremes in a convection permitting model simulation, EGU General Assembly 2024, Vienna, Austria, 14–19 Apr 2024, EGU24-19526, https://doi.org/10.5194/egusphere-egu24-19526, 2024.

EGU24-20049 | ECS | Orals | CL4.1

Impact of soil moisture data assimilation on short-term numerical weather prediction 

Zdenko Heyvaert, Michel Bechtold, Jonas Mortelmans, Wouter Dorigo, and Gabriëlle De Lannoy

Land-atmosphere (LA) coupling describes the dynamic interaction between the Earth’s land surface and (the bottom of) the atmosphere. This coupling involves the exchange of energy, water, and momentum between the two systems and its strength varies depending on several factors (e.g., season, land cover, topography, and climate zone). Several metrics that quantify the strength of the LA coupling, both physical and statistical, have been developed and explored extensively in the literature.

Coupled systems that model the atmosphere, the land surface, and their interaction require an initialization of both the atmospheric and the land components. For the latter, a land surface model (LSM) is typically spun up in a so-called ‘offline’ manner, i.e., not coupled to the atmospheric model but forced by an atmospheric reanalysis product. So far, little research has focused on the potential impact of satellite-based soil moisture data assimilation (DA) during this spin-up period on the subsequent forecast by the coupled system. However, several studies in the land surface modeling community have demonstrated the potential benefit of soil moisture DA to improve estimates of hydrological variables and land surface fluxes in offline simulations.

In this study, soil moisture retrievals from the 36 km Soil Moisture Active/Passive (SMAP) Level 2 product are assimilated into the Noah-MP LSM with dynamic vegetation, forced by the MERRA-2 atmospheric reanalysis. This is done using a one-dimensional Ensemble Kalman Filter (EnKF) within the NASA Land Information System (LIS). The DA updates the moisture in each of the four soil layers of the LSM. The resulting land reanalysis provides consistent estimates of land surface variables and fluxes from 1 January 2016 through 31 December 2020 on an 18 km grid over the contiguous United States.

This land reanalysis is subsequently used to initialize the land component of an experiment where the Noah-MP LSM and the Weather Research & Forecasting (WRF) atmospheric model are coupled within the NASA Unified WRF (NU-WRF) framework. The atmospheric component is initialized with MERRA-2, which also serves as the boundary condition for the atmospheric model. We compare the results in terms of short-term atmospheric estimates (e.g., of evaporative fraction, growth of the planetary boundary layer, screen-level temperature and humidity) with an initialization that uses a purely model-based land spin-up. 

Our study allows the quantification of land DA impact during spin-up and the assessment of its relationship with the LA coupling strength. The results will provide important insights into where and when short-term atmospheric forecasts may benefit from assimilating satellite-based soil moisture retrievals.

How to cite: Heyvaert, Z., Bechtold, M., Mortelmans, J., Dorigo, W., and De Lannoy, G.: Impact of soil moisture data assimilation on short-term numerical weather prediction, EGU General Assembly 2024, Vienna, Austria, 14–19 Apr 2024, EGU24-20049, https://doi.org/10.5194/egusphere-egu24-20049, 2024.

Studies of the impacts of bioaerosol on atmospheric processes often focus on their role in ice nucleation, which is largely determined by their physicochemical properties. Living microorganisms may also play roles in chemical processes by interacting with organics and other molecules, in particular in clouds where condensed water promotes metabolic processes.

Our previous model studies suggest that such biodegradation by living microorganisms may lead to a significant loss of formic and acetic acids in addition to chemical sinks in the atmospheric multiphase system (Nuñez López et al., 2023).

The prior model studies are based on the assumption of a single type of bacteria at fixed number in a small subset of droplets. However, the diversity and abundance of airborne bacteria, and thus their metabolic capabilities, greatly vary with space and time.

Explicitly describing multiple types of bacteria in individual droplet classes within cloud models can become computationally expensive and may be unfeasible to implement in larger-scale models aimed at exploring the role of biodegradation as a sink of organics.

We present different model approaches of varying complexities to explore the conditions under which simplified expressions for the biodegradation of small organic compounds can be applied. This involves the use of averaged biodegradation rates or proxies for representative bacteria species. Box model simulations are performed for airborne bacterial populations of different diversity and abundance, as observed, e.g. in continental or marine scenarios. Our model studies result in recommendations on how to implement biodegradation into atmospheric models of various scales to account for biological sinks of organic compounds and to ultimately constrain atmospheric organic budgets.


Nuñez López, L., Amato, P., and Ervens, B.: Bacteria in clouds biodegrade atmospheric formic and acetic acids, EGUsphere [preprint], https://doi.org/10.5194/egusphere-2023-2270, 2023.

How to cite: Nuñez López, L., Amato, P., and Ervens, B.: Prediction of Biodegradation rates of Atmospheric Organics as a function of bacteria diversity using models of different complexity, EGU General Assembly 2024, Vienna, Austria, 14–19 Apr 2024, EGU24-1474, https://doi.org/10.5194/egusphere-egu24-1474, 2024.

EGU24-2630 | PICO | AS4.6 | Highlight

Aqueous photooxidation of live bacteria  

Theodora Nah, Yushuo Liu, and Patrick Lee

Live bacteria in atmospheric aqueous droplets are exposed to photooxidants such as hydroxyl radicals (·OH), organic triplet excited states (3C*) and singlet oxygen (1O2). These photooxidants are produced from photochemical processes involving organic matter present in atmospheric aqueous droplets. ·OH is the photooxidant known to drive many aqueous photochemical processes. Even though the ·OH photooxidation of organic matter in atmospheric aqueous droplets has been widely studied, equivalent investigations on the ·OH photooxidation of bioaerosols are limited. Little is known about the daytime encounters between ·OH and live bacteria in atmospheric aqueous droplets.

We investigated the aqueous ·OH photooxidation of four bacterial strains in microcosms composed of artificial cloud water that simulated the chemical composition of cloud water in South China. The survival rates for the four bacteria strains decreased to zero within 6 hours during exposure to 1 × 10⁻¹⁶ M of ·OH under artificial sunlight. Bacterial cell damage and lysis released biological and organic compounds, which were subsequently oxidized by ·OH. We used ultrafiltration to separate the water-soluble biological and organic compounds into different molecular weight fractions and found that the molecular weights of some of these biological and organic compounds were larger than 50 kDa. The biological and organic compounds were identified as proteinaceous-like and humic-like components by excitation emission matrix fluorescence spectroscopy with parallel factor analysis. High-resolution mass spectrometry measurements revealed that the O/C, H/C, and N/C elemental ratios increased at the initial onset of photooxidation. As the photooxidation progressed, there were little changes in the H/C and N/C, whereas the O/C continued to increase for hours after all the bacterial cells have died. The increase in the O/C was due to functionalization and fragmentation reactions, which increased the O content and decreased the C content, respectively. We observed that fragmentation reactions played particularly important roles in transforming the biological and organic compounds. These fragmentation reactions cleaved the C-C bonds of carbon backbones of higher molecular weight proteinaceous-like matter to form a variety of lower molecular weight compounds, including humic-like components of molecular weight <3 kDa and highly oxygenated organic compounds of molecular weight <1.2 kDa. We also investigated the propensity of the biological and organic compounds from the bacteria to produce ·OH, 1O2, and 3C* upon illumination with artificial sunlight. The steady-state concentrations and quantum yields of the three photooxidants produced varied among the different molecular weight-separated fractions due to the diversity of their chemical composition and optical properties. Using a variety of correlation analysis and machine learning techniques, we identified various chemical and optical parameters that correlated particularly well with the steady-state concentrations or quantum yields of the three photooxidants. Overall, our results provided new insights at the process level on the photooxidation of live bacteria in atmospheric aqueous droplets.

How to cite: Nah, T., Liu, Y., and Lee, P.: Aqueous photooxidation of live bacteria , EGU General Assembly 2024, Vienna, Austria, 14–19 Apr 2024, EGU24-2630, https://doi.org/10.5194/egusphere-egu24-2630, 2024.

Airborne microorganisms (bioaerosols), traveling across long distances, can significantly affect ecosystems, biogeochemical cycles, and human health. Dust events are a major source of bioaerosols, contributing to their global dispersion. Due to climate change-driven desertification and land-use changes, these events are projected to increase in intensity and frequency. Therefore, the transport of microorganisms over dust is expected to become more prominent. Hence, it is essential to understand the mechanisms allowing dust-borne microorganisms to survive in their atmospheric journy. Here we will present our findings on the impact of dust origins, meteorological conditions as well as diurnal sampling time on the microbial community composition and bioactivity through high throughput sequencing analysis. Our results show connectivity between bioactive groups. We will also present our findings on the distinctive characteristics of dust-borne prokaryotes isolated from dust events, showcasing diverse spore-forming bacteria with biofilm formation abilities. These findings indicate their possible preferential survival over dust, and open new paths to better understanding the survival strategies of dust-borne microorganisms.

How to cite: Lang-Yona, N.: Dust particles as a supportive environment for biofilm-forming prokaryotes, EGU General Assembly 2024, Vienna, Austria, 14–19 Apr 2024, EGU24-2684, https://doi.org/10.5194/egusphere-egu24-2684, 2024.

EGU24-4172 | ECS | PICO | AS4.6

Similar freezing spectra of particles in the phyllosphere as at mixed-phase cloud height 

Annika Einbock and Franz Conen

The phyllosphere is a major source of airborne microorganisms. Some of these microorganisms can act as ice nucleating particles (INPs) and initiate droplet freezing in supercooled clouds. Despite their role in this critical atmospheric process, little is known about the spatiotemporal variations of biological INPs at their source. We investigated this variation on the scale of single (or few) leaves about fortnightly from late summer throughout leaf senescence in two lime (Tilia platyphyllos), beech (Fagus sylvatica), cherry (Prunus avium), and walnut (Juglans regia) trees (n = 2 x 4 x 8 = 64) on a hillside (Gempen, 650 m a.s.l.) in north-western Switzerland. The overall result comprising all species shows an increasing trend in the median cumulative concentration of INPs active at -10 °C (INP-10) from 4 INPs cm-2 leaf area at the beginning of August to 38 INPs cm-2 in mid-November. Further, median INP-10 concentration was positively correlated with relative humidity throughout the 24 h prior to sampling (Spearman’s r = 0.90, p = 0.005, n = 8). Differential INP spectra between -3 °C to -10 °C displayed clearly defined patterns in 53 of the overall 64 samples. In 28 of these 53 samples (53%), the additional number of INPs activated with every 1 °C step in cooling increased steadily with decreasing temperature. In another 21% we observed a significant peak in the temperature step from -8 °C to -9 °C (i.e., around -8.5 °C), and in further 17% a peak around ‑7.5 °C. Interestingly, these types of spectra were similarly often found in air samples with clearly defined pattern (n = 53) at the high-altitude observatory Jungfraujoch (3580 m a.s.l., Switzerland) in summer 2022 (55% steady increase, 17% peak at -8.5 °C, 21% peak at -7.5 °C). This consistency in spectral pattern supports the notion that forests are a major source of biological INPs affecting atmospheric processes. It also prompts the question which parameter – perhaps leaf wetness duration? – could influence the abundance of biological INPs on both scales, on single leaves as well as in the airshed of a high-altitude observatory.

How to cite: Einbock, A. and Conen, F.: Similar freezing spectra of particles in the phyllosphere as at mixed-phase cloud height, EGU General Assembly 2024, Vienna, Austria, 14–19 Apr 2024, EGU24-4172, https://doi.org/10.5194/egusphere-egu24-4172, 2024.

EGU24-5231 | ECS | PICO | AS4.6

Sea surface microlayer mediated exchange between the aerobiome and the Pacific Ocean 

Or Argaman Meirovich and Dr. Naama Lang-Yona

Microbes are globally ubiquitous and play a crucial role in ecological network systems and global cycles (e.g., the carbon, nitrogen, water cycles). Hundreds of trillions of microorganisms are estimated to be exchanged between the marine and atmospheric environments, due to the vastness of the sea–air interface. The sea surface microlayer (SML) serves as the interface between the ocean and the atmosphere and is a unique ecosystem for microbial life. The aerosolized microbes may affect ocean ecology, global cycles, and promote genetic exchange between ecosystems. However, little is known about the mechanisms controlling microbial exchange between the environments, and the viable state and metabolic activity of marine bioaerosols. This study aims to characterize the microbial communities of the three environments (surface water-SML-atmosphere) and explore possible linkages between them, by developing a simple and repeatable technique for sampling the SML. We will present the validation of our new SML sampling method, based on surface water sub-sampling, using cell and genomic analyses. This method may provide a substantial improvement compared to direct sampling from the sea, ensuring stabilization without unexpected disturbances. In addition, we will present our results on the linkages between marine, SML and atmospheric microbial communities using our new SML sampling technique, from samples collected in the Pacific Ocean. Our results exhibit different clustering patterns for the three proximal environments, supports their identification as distinct environments with distinct microbial signatures. However, the SML is visualized as an “average” between surface water and air samples both in clustering tightness and location, displays its role as an exchange medium between the ocean water and the marine atmospheric boundary layer. This study contributes to improving understanding of the role of the SML in emission of primary aerosols, leading to better characterization of the ocean-atmosphere interactions and allows for better assessments of their contribution to global cycles and the marine ecosystem.

How to cite: Argaman Meirovich, O. and Lang-Yona, Dr. N.: Sea surface microlayer mediated exchange between the aerobiome and the Pacific Ocean, EGU General Assembly 2024, Vienna, Austria, 14–19 Apr 2024, EGU24-5231, https://doi.org/10.5194/egusphere-egu24-5231, 2024.

EGU24-6162 | PICO | AS4.6

Appearance of viral genomes with high GC base proportion in atmospheric samples from Europe and Antarctica 

Janina Rahlff, Luke Cockerton, Pierre Amato, David A. Pearce, and Manja Marz

Outdoor viruses from atmospheric ecosystems have rarely been investigated, and thus only a few viral genomes from the air can be found in public databases. Viruses and their hosts have positively correlating guanine-cytosine (GC) contents in their DNA1. High GC content was previously found in actinobacterial and betaproteobacterial isolates from the stratosphere2 as well as in aerosol and rainwater viruses3. This is proposed as an adaptation to harsh environmental conditions, primarily as protection against ultraviolet radiation. Here, we combine metagenomically derived viral operational taxonomic units (vOTUs) collected from aerosols and precipitation samples from the Swedish coast3, along with time-series data collected in Antarctica using different sampling devices. Additionally, cloud water samples from the Puy de Dôme in France4 were included. A total of 80 assembled vOTUs, of which 37 were predicted phages, across all samples, had a GC content between 55.2% and 70.3%, considered 'high GC.' Antarctic air vOTUs were found after sampling with the Coriolis µ (wet) but not with the Coriolis Compact (dry) air sampler. The time series indicates overlapping vOTUs between days and sampling height (sea-level or altitude). In Antarctic air, high GC vOTUs (mean GC = 59.6% ± 4.0) were detected on one of the seven days, while low GC viruses were absent in this sample. On other days, the GC of vOTUs was <39%. Thirteen high GC vOTUs from Sweden and Antarctica clustered in a proteomic tree analysis with known high GC phage isolates infecting Microbacterium radiodurans and Arthrobacter sp. (both phylum Actinomycetota). Host predictions using iPHoP revealed that only 11 of the 80 vOTUs could be assigned to bacterial hosts with good confidence, namely to genera Mycobacterium, Ralstonia, Sphingomonas, and Bradyrhizobium. Our results suggest that high GC is a feature in air viruses from different atmospheric sources and latitudes. While these vOTUs occur irregularly at near-ground sampling heights, a high GC content could favor the survival of airborne viruses higher in the troposphere and thus enable infections of extremophilic hosts within air ecosystems.

References:

1 Simón, D., Cristina, J., & Musto, H. (2021). Nucleotide composition and codon usage across viruses and their respective hosts. Frontiers in Microbiology, 12, 646300.

2 Ellington, A. J., Bryan, N. C., Christner, B. C., & Reisch, C. R. (2021). Draft Genome Sequences of Actinobacterial and Betaproteobacterial Strains Isolated from the Stratosphere. Microbiology Resource Announcements, 10(50), e01009-21.

3 Rahlff, J., Esser, S.P., Plewka, J., Heinrichs, M.E., Soares, A., Scarchilli, C., Grigioni, P., Wex, H., Giebel, H.A. and Probst, A.J., 2023. Marine viruses disperse bidirectionally along the natural water cycle. Nature Communications, 14(1), p.6354.

4 Dillon, K. P., Correa, F., Judon, C., Sancelme, M., Fennell, D. E., Delort, A. M., & Amato, P. (2020). Cyanobacteria and Algae in Clouds and Rain in the Area of puy de Dôme, Central France. Applied and Environmental Microbiology, 87(1), e01850-20.

How to cite: Rahlff, J., Cockerton, L., Amato, P., Pearce, D. A., and Marz, M.: Appearance of viral genomes with high GC base proportion in atmospheric samples from Europe and Antarctica, EGU General Assembly 2024, Vienna, Austria, 14–19 Apr 2024, EGU24-6162, https://doi.org/10.5194/egusphere-egu24-6162, 2024.

Understanding the types of microbes present and their concentrations over time is essential for deciphering the physical, chemical, and biological processes in the atmospheric environment. In this study, Hong Kong, which experiences four distinct seasons, was selected as the study site. High-throughput amplicon sequencing of the 16S rRNA gene was utilized to analyze the microbiomes present, while a light/laser-induced fluorescence (LIF) instrument was employed to characterize the real-time concentrations of fluorescent aerosol particles (FAPs) or bioaerosols. Seasonal variations in the microbiomes were observed, primarily driven by less abundant taxa that were unique to specific locations. Conversely, spatial variations were minimal, suggesting a homogeneity of microbiomes within the scale of a city. The major taxa of the microbiomes reflected the local environments (e.g., aquatic and soil), with neutral assembly processes dominating each season, indicating a minor role of selection in microbial assembly in the air. FAP concentrations were highest in the fall and winter seasons, deviating from measurements in temperate and tropical regions. Bioaerosol concentrations exhibited diurnal patterns, with higher concentrations during the daytime and lower concentrations at nighttime. Certain atmospheric pollutants were associated with bioaerosol concentrations, and positive matrix factorization analysis identified anthropogenic sources as key drivers of bioaerosol concentrations. In summary, the application of molecular techniques and LIF-based instrumentation has provided insights into the microbial composition of the atmospheric environment in a subtropical location, facilitating further investigations into the interactions involving these biological components.

How to cite: Lee, P. K. H. and Miao, Y.: Seasonal Dynamics of the Compositions and Concentrations of Microbiomes in the Atmospheric Environment at a Subtropical Location, EGU General Assembly 2024, Vienna, Austria, 14–19 Apr 2024, EGU24-7371, https://doi.org/10.5194/egusphere-egu24-7371, 2024.

The Arctic region is undergoing rapid environmental changes due to global climate warming. Among the Arctic regions, the surface temperature in the northern Barents Sea, where the Svalbard archipelagos are located, has increased more significantly than in other areas over the last 40 years. This warming results in the loss of sea ice in the ocean and glacier ice in terrestrial areas. These changes in surface conditions may impact the emission of bioaerosols from the Earth's surface, which play a crucial role in ecosystem dynamics and cloud formation. However, there is still limited temporal monitoring in Svalbard and also in entire Arctic. Therefore, in this study, we focus on assessing the temporal changes in bioaerosols during the summer to autumn season in Ny-Ålesund, Svalbard using DNA metabarcoding approaches.

Bioaerosol samples were collected using a vacuum pump with a flow rate of 40 LPM onto HEPA-style filters at the outdoor observatory of the Veksthuset building in Ny-Ålesund. Filters were replaced every 24-72 hours from July to November 2022. Those were then preserved in DNA storage medium (DNA/RNA shield) and transported to the laboratory under frozen conditions. Following particle concentration and DNA extraction, we amplified and sequenced three DNA metabarcoding regions (16S, 18S, and ITS) using the MiSeq platform (Illumina).

Seasonal variations in the observed number of Amplicon Sequence Variants (ASVs) from each barcoding region reveal distinct patterns. These patterns are characterized by elevated ASV counts during the summer (ITS and 18S) and autumn (16S). Microbial communities within the 16S region at the phylum level remain relatively stable throughout the entire season. Conversely, communities within the 18S and ITS regions undergo significant changes in mid-September and after October, coinciding with the terrestrial area being covered by seasonal snowpack. In the presentation, we will provide a more detailed explanation of community changes at the ASV level and discuss the distinctive seasonal patterns observed.

How to cite: Uetake, J. and Tobo, Y.: Difference in seasonal variation between airborne prokaryotic and eukaryotic communities in Ny-Ålesund, Svalbard, EGU General Assembly 2024, Vienna, Austria, 14–19 Apr 2024, EGU24-10332, https://doi.org/10.5194/egusphere-egu24-10332, 2024.

EGU24-12799 | PICO | AS4.6

The transient and species-specific microbiome of radiation fog water 

Ferran Garcia-Pichel, Thi Thuong Thuong Cao, Pierre Herckes, and Derek Straub

We used sampling of quasi-stagnant radiation fogs in Central Pennsylvania during two years to study the dynamics and microbiology of bacterial assemblages in fog droplets. These microbiomes contain concentrations of bacteria orders of magnitude higher than present in concurrent interstitial aerosols, their concentration depending positively, and unlike chemical solutes, on the fog’s liquid water content and temperature, speaking for the role of in situ growth. Fog water microbiomes are recruited from locally available aerosol bacteria, they are compositionally well-differentiated, and their bacteria display differential cellular traits consistent with an actively growing assemblage. Phylogenetic analyses of bacteria enriched in the droplets suggest that C1-volatile metabolizing heterotrophs constitute the trophic basis of these dynamics. However, major loss factors (wet deposition) export much of the net gains, leaving measurable but only subtle legacies in the aerobiome upon fog dissipation. 


How to cite: Garcia-Pichel, F., Cao, T. T. T., Herckes, P., and Straub, D.: The transient and species-specific microbiome of radiation fog water, EGU General Assembly 2024, Vienna, Austria, 14–19 Apr 2024, EGU24-12799, https://doi.org/10.5194/egusphere-egu24-12799, 2024.

EGU24-13840 | PICO | AS4.6 | Highlight

Impacts and Implications of Airborne Microorganisms in a Warming Atmosphere 

Stephan Schuster, Elena Gusareva, Kutmutia Shruti Ketan, Lennard Wittekindt, Yee Hui Lim, Akira Uchida, Elisa Sosa, Kaspar Rudolf Dällenbach, Imad El Haddad, Martin Gysel Beer, Adrian Egli, and Claudia Mohr

Amid escalating concerns regarding climate change and air pollution, the intricate interplay between climate dynamics and air microbiomes remains inadequately understood. Our research team is dedicated to an in-depth exploration of bioaerosol dynamics through metagenomic analysis. This will establish linkages between resultant environmental microbiomes and a spectrum of physico-chemical factors. We will further evaluate potential implications of climate driven bioaerosol dynamics on human health. Consequently, our research initiative entails a comprehensive analysis of bioaerosol dynamics across distinct climate regimes, encompassing alpine, temperate, and tropical environments. Using high-volumetric air sampling technologies,  we have conducted environmental time series that offer high temporal and taxonomic resolution. In an interdisciplinary approach that integrates expertise from aerobiology, medicine, atmospheric physics, and climate modelling, we aim at assessing the impact of raising global temperatures on atmospheric bioaerosols and the global dispersal of airborne microorganisms. Our bioaerosol detection methodologies can be applied to both, historical and contemporary air samples, enabling to examine the bioaerosol dynamics preceding the current and most acute climate crisis. By integrating biological, chemical, and physical measurements collected from pristine alpine and metropolitan areas from temperate and tropical settings, we investigate the potential interconnections between climate-driven alterations in airborne microbial dynamics and their consequential effects on human and ecosystem health.

How to cite: Schuster, S., Gusareva, E., Ketan, K. S., Wittekindt, L., Lim, Y. H., Uchida, A., Sosa, E., Dällenbach, K. R., Haddad, I. E., Beer, M. G., Egli, A., and Mohr, C.: Impacts and Implications of Airborne Microorganisms in a Warming Atmosphere, EGU General Assembly 2024, Vienna, Austria, 14–19 Apr 2024, EGU24-13840, https://doi.org/10.5194/egusphere-egu24-13840, 2024.

The health impacts of air pollution are deeply intertwined with the composition of pollutants, with bioaerosols—microbial particles suspended in the air—playing a critical role. Despite their importance, the behavior of bioaerosols during pollution episodes remainslargely elusive. In this study, we investigated the dynamics of bacterial aerosols over a one-week period. During the sampling period, haze and sandstorm events occurred sequentially, with a transition period in between. Haze air pollution, characterized by high levels of PM2.5, is a typical form of anthropogenic pollution, whereas sandstorm dust events, characterized by high levels of PM10, are typical natural pollutions. We applied 16S rDNA and 16S rRNA sequencing techniques to explore the total bacterial community and the active bacteria, respectively. Our results revealed distinct bacterial aerosol profiles during haze and sandstorm conditions. Notably, the greatest bacterial diversity was found in sandstorm samples, with the least diversity observed during haze periods. The bacterial aerosols during haze showed the most significant differences compared to those during the transition period, particularly when contrasted with sandstorm samples. The active bacterial profiles, as determined by 16S rRNA sequencing, were found to be dissimilar from the total bacterial communities present during sandstorms. The ecological drivers shaping bacterial community structures also exhibited distinct patterns. Our data suggest that selective forces influence the composition of active bacterial communities in sandstorm samples, as well as the total bacterial population during haze events. A common feature during both haze and sandstorm episodes was the extended residence time of bacteria in the atmosphere, implying that prolonged exposure could alter the structure of airborne bacterial communities. Additionally, our results highlight the increased presence of several pathogens or opportunistic pathogens in the active bacterial communities of sandstorm samples and the total bacteria during haze, indicating a increased health risk for humans, animals, and plants.

How to cite: Shen, F. and Ma, J.: Temporal Dynamics of Bacterial Aerosols in Haze and Sandstorm Events: Implications for Atmospheric Processes and Public Health, EGU General Assembly 2024, Vienna, Austria, 14–19 Apr 2024, EGU24-14338, https://doi.org/10.5194/egusphere-egu24-14338, 2024.

EGU24-17555 | PICO | AS4.6

SLIDE – Southern Latitudes Island Dispersal Evaluation  

David Pearce, Luke Cockerton, Lucie Malard, Julia Schmale, and Peter Convey

The risks of invasions of remote ecosystems by new microorganisms is a major threat as they are likely to impact the diversity and function of resident communities and local ecosystems. In the Antarctic, aerial transport is the primary source of new biological inputs. Airborne communities are believed to be influenced by environmental and climatic conditions, which are already changing rapidly on a global scale, but especially in the Polar regions. Yet, the influence of climate change, weather patterns and environmental conditions on these airborne communities are still unclear. One of the key challenges in understanding these processes is the high heterogeneity and variability of airborne samples. Following the Antarctic Expedition (ACE), in which daily samples were taken around the Antarctic continent to provide spatial distribution of airborne microorganisms, a time series was conducted at one of the ACE field sites (South Georgia) over a period of two weeks, at both high and low altitude to establish the daily variability between aerobiological sample sets. Results showed that although there was indeed a high heterogeneity and variability within the sample sets and across sample types, reliable patterns in the overall diversity could still be determined, and hence single daily samples can still provide useful assessment of aerial diversity over spatial and temporal scales in the Antarctic.


How to cite: Pearce, D., Cockerton, L., Malard, L., Schmale, J., and Convey, P.: SLIDE – Southern Latitudes Island Dispersal Evaluation , EGU General Assembly 2024, Vienna, Austria, 14–19 Apr 2024, EGU24-17555, https://doi.org/10.5194/egusphere-egu24-17555, 2024.

EGU24-18119 | ECS | PICO | AS4.6

Long-range transatlantic dust transport: via hitchhiking to South America 

Jens Weber, Cybelli Barbosa, Isabella Hrabe de Angelis, Petya Yordanova, Sebastian Brill, Stefanie Maier, Ulrich Pöschl, Christopher Pöhlker, and Bettina Weber

Primary biological aerosols (bioaerosols) represent the predominant fraction of aerosols within the Amazon rainforest, a global biodiversity hotspot. Bioaerosols encompass a wide range of biological material. These can be single molecules such as proteins, carbohydrates, metabolites, toxins and allergens, or as large as whole dispersal units such as pollen, fungal and cryptogamic spores. They also include whole living or dead microbial organisms such as viruses, bacteria, archaea, or fungi, and fragments or secretions from organism. These bioaerosols can serve as nuclei for ice crystals and cloud droplets and thereby influence the properties of clouds and precipitations patterns with implications for hydrological cycles and the climate. Moreover, the aerial transport of microorganisms contributes to global species spread, with the potential to affect animal, plant, and ecosystem health. Aerosolized soil particles (dust) can act as vehicles, enabling microorganisms to traverse extensive distances, such as the Atlantic Ocean. However, the identity and effects of microorganisms associated with long-range transported dust masses on the local bioaerosol community of the Amazon rainforest is still unknown.

Here, we investigate the effect of dust, originating from the African continent and transported to the Amazon rainforest on the local microbial and fungal bioaerosol community of the Amazon rainforest. We collected total suspended particles at the Amazon Tall Tower Observatory (ATTO) in Brazil before, during and after a dust event, at 42 m and 320 m height. The prokaryotic and fungal communities were analyzed using amplicon sequencing techniques. Our results revealed a distinct local fungal and procaryotic bioaerosol community under dust free conditions. However, dust occurrence did not majorly effect the fungal community structure, which showed an overall very uniform core microbiome, across time and height. In contrast, the prokaryotic community was strongly altered during the dust event, with members of the Bacillota strongly increasing. Also, the prokaryotic core microbiome was smaller compared to the fungal core microbiome and changed between heights. Our findings suggest that the Amazon rainforest air microbiome can be affected by long-range transported dust and the microbial communities transported within while the fungal air microbiome seems overall more stable. Suggesting the transcontinental exchange of dust between Africa and South America as a plausible pathway for the spread of prokaryotes.

How to cite: Weber, J., Barbosa, C., Hrabe de Angelis, I., Yordanova, P., Brill, S., Maier, S., Pöschl, U., Pöhlker, C., and Weber, B.: Long-range transatlantic dust transport: via hitchhiking to South America, EGU General Assembly 2024, Vienna, Austria, 14–19 Apr 2024, EGU24-18119, https://doi.org/10.5194/egusphere-egu24-18119, 2024.

EGU24-18750 | ECS | PICO | AS4.6

Exploring precipitation over the northern Antarctic Peninsula - a microbiological perspective 

Ksenija Vučković, Eva Lopes, Leonor Pizarro, Miguel Semedo, Maria de Fátima Carvalho, Catarina Magalhães, and Irina Gorodetskaya

Keywords: precipitation, aerosols, microorganisms, Antarctica, clouds

Clouds and precipitation play an intrinsic role in the global climate, upholding the Earth's surface energy equilibrium and water cycle. Despite their significance, clouds and aerosols over Antarctica and the Southern Ocean remain poorly understood, primarily due to the extreme environment for observations and insufficient data. The Antarctic Peninsula (AP) has been exhibiting a significant warming trend over the last 60 years (Jones et al, 2019). Coupled with the rising temperatures, an increase in precipitation and surface melt is being observed across the AP, with major surface melts and precipitation events, both snowfall and rainfall, being associated with atmospheric rivers (ARs) (Gorodetskaya et al., 2023; Wille et al., 2021). ARs are long corridors of intense moisture and heat transport from subtropical and mid-latitude regions poleward, typically also carrying liquid-containing clouds to the AP. Moreover, ARs can impact the long-range transport of aerosols, as well as contribute to gas and aerosol exchange between the atmosphere and the ocean. Aerosols, which serve as cloud condensation and ice nuclei, determine cloud microphysical properties and influence cloud radiative forcing and precipitation formation. Given that a substantial percentage of aerosols are of biological origin, it is crucial to effectively identify and describe them.

In this project, we aim to characterize bioaerosols, specifically microorganisms, present in the precipitation and surface snow in the AP. Rainfall and snowfall samples were collected during PROPOLAR campaigns on King George Island, northern AP, in the vicinity of Escudero and King Sejong stations. The precipitation samples were preserved and analysed using culturable and non-culturable methodologies. Bacterial strains were obtained and identified through 16S rRNA gene sequencing, which provided information about the diversity and phylogenetic relationships of the identified microorganisms. The identified organisms were categorized into six distinct genera, including those recognized for their ice nucleation capabilities, such as the Pseudomonas genus (Attard et al, 2012). The main phylum identified was Proteobacteria. We identified four strains among those analyzed as potentially novel species affiliated with the Spirosoma and Paenibacillus genera. These findings highlight the untapped potential of these regions in harbouring unique microbial biodiversity. 

Obtaining a comprehensive study of the microbial community in precipitation in Antarctica will pave the path to understanding the role these microorganisms have in cloud condensation processes and ice nucleation. More international efforts and campaigns are needed to gain information about aerosols, clouds and precipitation over the Southern Ocean.


Acknowledgements: PROPOLAR (Portuguese Polar Program) projects APMAR/TULIP/ APMAR2 and FCT project MAPS (2022.09201.PTDC)

References: 

Attard et al. 2012. Effects of atmospheric conditions on ice nucleation activity of Pseudomonas.  Atmos. Chem. Phys. https://doi.org/10.5194/acp-12-10667-2012

Gorodetskaya et al. (2023): Record-high Antarctic Peninsula temperatures and surface melt in February 2022: a compound event with an intense atmospheric river. npj Clim.Atmos.Sci. https://doi.org/10.1038/s41612-023-00529-6

Jones et al. (2019). Sixty years of widespread warming in the Southern middle and high latitudes(1957–2016). J.Clim.https://doi.org/10.1175/JCLI-D-18-0565.1 

Wille et al. (2021).  Antarctic atmospheric river climatology and precipitation impacts. J.Geophys.Res.https://doi.org/10.1029/2020JD033788


How to cite: Vučković, K., Lopes, E., Pizarro, L., Semedo, M., de Fátima Carvalho, M., Magalhães, C., and Gorodetskaya, I.: Exploring precipitation over the northern Antarctic Peninsula - a microbiological perspective, EGU General Assembly 2024, Vienna, Austria, 14–19 Apr 2024, EGU24-18750, https://doi.org/10.5194/egusphere-egu24-18750, 2024.

EGU24-19988 | ECS | PICO | AS4.6

Seasonal Dynamics of Arctic Marine Ice-Nucleating Particles 

Christian Ditlev Funder Castenschiold, Anne Ellebæk, Kai Finster, and Tina Šantl-Temkiv

There is growing evidence that the oceans constitute an important source of ice-nucleating particles (INPs) in the atmosphere, aerosolized through sea spray. These particles play a crucial role in cloud formation and cloud properties by inducing ice crystal formation. Microorganisms, in particular, can produce ice-nucleating proteins which are efficient catalysts in the formation of ice, triggering heterogenous freezing between -1°C and -15°C. INPs have been measured in sea bulk water and sea surface microlayer, and specifically Arctic waters have been shown to exhibit ice-nucleation activity at high temperatures. In addition, terrestrial environments have long been recognized as substantial reservoirs of INPs. The runoff from these terrestrial environments, facilitated by meltwater and rivers, could have the potential to contribute a substantial influx of INPs to coastal marine environments. Our understanding of the extent of this input, the properties, and concentrations of INPs, and their connection with the microbial community in sea bulk water and sea surface microlayer remains limited. Furthermore, there is a lack of investigation into the temporal and spatial distribution of INPs in sea water. This information, coupled with atmospheric INP measurements, is needed to improve predictions of INP emissions from the ocean to the atmosphere. Therefore, we conducted a sampling campaign at Disko Island, Greenland, and collected sea bulk water, sea surface microlayer, and air samples from May to September 2023. Freshwater samples were collected from a river in continuation of a marine transect spanning eight km offshore to investigate the impact of terrestrial runoff on the coastal marine microbial community and INPs. Our investigation reveals distinct seasonal variations in INP concentrations, ice-nucleation activity, and microbial community at a regularly visited marine site throughout the sampling campaign. Air samples were collected simultaneously at this marine site, enabling the measurement of INP concentrations and the exploration of the microbial community present in the immediate overlaying air masses. Additional air samples were consistently collected from a foreland, located approximately five km from the marine sampling site, using a high-flow-rate impinger with a specific focus on capturing sea spray emissions and facilitating the integration of the data to the marine water samples. Our results further demonstrate a pronounced input of INPs originating from terrestrial runoff into the sea surface microlayer within coastal marine waters. Notably, this was not observed in the bulk water due to the stratification resulting from the introduction of freshwater. Our study unveils seasonal dynamics of INPs and microbial communities and a prominent impact of terrestrial runoff in Arctic marine waters. The study emphasizes the importance of considering the marine environment as a major source of atmospheric INPs and, further, contributes valuable insights to improve predictions of INP emissions from the ocean to the atmosphere.

How to cite: Castenschiold, C. D. F., Ellebæk, A., Finster, K., and Šantl-Temkiv, T.: Seasonal Dynamics of Arctic Marine Ice-Nucleating Particles, EGU General Assembly 2024, Vienna, Austria, 14–19 Apr 2024, EGU24-19988, https://doi.org/10.5194/egusphere-egu24-19988, 2024.

EGU24-20130 | PICO | AS4.6

Microbiome of Saharan dust aerosols 

Kalliopi Violaki, Christos Panagiotopoulos, Pierre Rossi, Ernest Abboud, Maria Kanakidou, and Athanasios Nenes

Airborne biological material, or bioaerosol, plays an important role in the Earth system and therefore have an impact on the atmosphere, the biosphere and the hydrological cycle as well as on public health. Bioaerosols consist of viruses, bacteria, mold, pollen, plant fibers and fragments that range from tens of nanometers to a few hundred micrometers in size. Terrestrial ecosystems are the major sources of the atmospheric bioaerosols with urban environments and areas with agricultural and industrial activity being particularly important. Desert dust contains high concentrations of bioaerosol mainly composed of soil microorganisms and plant detritus. This dust may be further enriched with fungal spores, bacteria, viruses, and pollen that accumulate as dust plumes are transported over terrestrial and aquatic environment through the adhesion of microbe-laden fine aquatic sprays to dust particles. The relative importance of bioaerosol sources in the atmosphere varies with altitude, season, location and meteorological factors.

In this study, Saharan dust aerosols (n=19) were sampled from East Mediterranean (Crete, Greece) using a high-volume TSPs sampler (TISCH). Dust atmospheric particles were collected on precombusted (450 °C for 5 h) 20 × 25 cm quartz filters (Pall, 2500QAT-UP). The sampling resolution was 48 h, at a flow rate of 85 m3 h−1. We established a reliable analytical protocol for extracting DNA from these Saharan dust particles. Together with biological quantification and identification, chemical analysis was performed, including metals, major ions, phospholipids and sugars.

Results show that the number of Eucaryotic DNA copies were 30 times higher than the bacterial copies during the dust events. The bacterial community composition in the collected dust aerosol as the most abundant Phyla were Proteobacteria (37%) followed by Actinobacteria (22%) and Firmicutes (13%). Furthermore, we analyzed five (n=5) intense dust events using magic angle spinning solid-state 31P-NMR. The results show that the typical functional groups in P speciation, were orthophosphate and monophosphate esters which sharing the same chemical shift (H3PO4 and RH2-PO4), phosphate diesters (R1R2 HPO4) and pyrophosphate (H4P2O7). No phosphonates were detected (C-P bond) in dust samples. Monophosphate esters and diesters are mainly found in nucleotides and their derivatives (e.g., DNA, RNA, AMP, ADP and ATP) but also in phospholipids, and as such, they constitute the majority of atmospheric organic-P. These organic-P compounds have C-O-P bonds and are easily hydrolyzed in the marine environment by alkaline phosphatase enzyme, providing an important source of P in the aquatic ecosystems when Saharan dust is deposited.

How to cite: Violaki, K., Panagiotopoulos, C., Rossi, P., Abboud, E., Kanakidou, M., and Nenes, A.: Microbiome of Saharan dust aerosols, EGU General Assembly 2024, Vienna, Austria, 14–19 Apr 2024, EGU24-20130, https://doi.org/10.5194/egusphere-egu24-20130, 2024.

EGU24-509 | ECS | Orals | NH10.5

Global Ionospheric Responses in Both Hemispheres during the 2015 St. Patrick’s Day Storm 

Bhupendra Malvi and Pramod Purohit

On St. Patrick's Day, March 17, 2015, the first historical intense geomagnetic storm (Dst < −200 nT) of the 24th solar cycle occurred. This storm caused complex effects around the globe. Geomagnetic storms are a concern for society, especially the strongest storms and how they affect satellite communications, navigations and power grids. Using Global Positioning System (GPS) data to compute the Total Electron Content (TEC) of the Earth's ionosphere is one of the most common methods used to investigate perturbations in the ionosphere. GPS TEC variations may reveal ionospheric anomalies, which might endanger the continuity and availability of GPS performance metrics. Thus, the ionospheric consequences of geomagnetic storms have been researched intensively for decades but are still not fully understood. This study investigates the ionospheric behaviour during an intense geomagnetic storm that occurred from 14 - 24 March 2015. In particular, we used geomagnetic indices and GPS TEC data from various IGS stations all over the world to give a comprehensive analysis of how the ionospheric total electron content changes in both the northern and southern hemispheres at different latitude and longitude stations.

How to cite: Malvi, B. and Purohit, P.: Global Ionospheric Responses in Both Hemispheres during the 2015 St. Patrick’s Day Storm, EGU General Assembly 2024, Vienna, Austria, 14–19 Apr 2024, EGU24-509, https://doi.org/10.5194/egusphere-egu24-509, 2024.

Disastrous earthquakes are a permanent threat to every second resident of our planet causing a massive loss of lives and property. Understanding the nature of earthquake precursory signatures and related hazard mitigation has immense potential for scientific advancement as well as for societal benefits. To study these multidisciplinary and complicated precursory signatures, several models have been proposed in favor of the Lithosphere- Atmosphere- Ionosphere- Coupling (LAIC) mechanism by earlier workers. The major objective of this study is to investigate the short-term perturbations in land surface temperature (LST), atmospheric air temperature (AT), atmospheric relative humidity (ARH), and in ionospheric vTEC prior to the destructive shallow sheeted Turkey-Syria earthquake (Mw 7.8, Depth 10 Km, Intensity IX) on 6th February 2023 and its major aftershocks (Mw 7.5, 6.8, 6, 6). Earthquakes of such large magnitude causes synchronization changes, not only in the atmospheric parameters but also in the ionospheric TEC. The GPS and GNSS (IGS) derived ionospheric TEC data are now being used extensively to investigate seismo-ionospheric perturbations over and near the epicentral regions of earthquakes over the last two decades. To identify the perturbation in the LST and atmospheric parameters (AT and RH), we have studied the spatio-temporal variation of MODIS (Terra) derived LST data and MERRA 2 (NASA) derived atmospheric temperature and relative humidity at 2 meter height. The Terra-MODIS derived LST differential time series reveals a prominent increase ~ 6-16 ⁰C from 18th to 26th Jan, 2023 around the epicentral region. Moreover, the hourly varying atmospheric parameters (AT, RH) have shown significant and synchronous deviations from 18th Jan to 26th Jan. The highest positive (+ve) deviation in the AT is found to be 10.33 ⁰C and the lowest negative (-ve) anomaly in the RH is found to be 45.67% on 19th Jan. The observed atmospheric anomalies are identified with respect to the constructed bounds using past 5 years hourly data (m ± 2σ). The temporal variation of ionospheric vTEC of the nearest grid point, derived from both GNSS (IGS) and GPS receivers shows a series of prominent –ve anomalies from 25th Jan to 1st Feb about 5-12 days prior to the main shock. After ruling out possible contributions due to the solar terrestrial environment with respect to F10.7 Scale and Ap index, it is found that the evolved TEC anomaly is seismogenic in origin. In order to visualize the TEC anomaly in spatio-temporal domain, we have plotted 2D latitude-longitude time (LLT) maps of different epochs during those anomalous days (Max anomaly~ -15 TECu on 28th Jan at UTC 11th and 12th hour). Considering the nearest plate boundary, spatial extent of TEC conjugates and TEC gradient we have determined the probable epicenter which showed very promising correlation in comparison to actual epicenter. This multi parametric spatio-temporal analysis of the pre-seismic signature will produce some beneficial insight to understand the LAIC mechanism in detail and somehow be able to save so many lives.

How to cite: Dutta, B. and Malik, J. N.: Potential Utilization of Multi-Parametric Earthquake Precursory Signatures in Support of LAIC Mechanism: A case study on Turkey- Syria Earthquake (6th Feb, 2023)., EGU General Assembly 2024, Vienna, Austria, 14–19 Apr 2024, EGU24-1054, https://doi.org/10.5194/egusphere-egu24-1054, 2024.

EGU24-2380 | ECS | Posters on site | NH10.5

Modeling Equatorial Plasma Bubbles with SAMI3/SD-WACCM-X: Large-Scale Wave Structure 

Min-Yang Chou, Jia Yue, Nicholas Pedatella, Sarah McDonald, and Jennifer Tate

Large-scale wave structure (LSWS) in the bottomside F layer is pivotal in developing equatorial plasma bubbles (EPBs), potentially serving as a precursor of EPBs. Gravity waves, hypothesized to contribute through the wind dynamo mechanism, face experimental challenges. This study, utilizing the coupled SAMI3 and SD-WACCM-X models, investigates the role of gravity wave wind dynamo effect and gravity in LSWS development. We found that the gravity waves originating from the lower atmosphere induce vertical E×B drift perturbations in the nighttime ionosphere. Notably, LSWS can manifest independently of gravity, emphasizing the dominance of the gravity wave wind dynamo mechanism. However, LSWS exhibits more pronounced vertical E×B drift perturbations, indicating an additional eastward Pedersen current driven by equatorial winds (i.e., downward wind) via the gradient drift instability. Gravity-driven Pedersen current, therefore, plays a role in amplifying the LSWS and EPB development. Simulations also show the emergence of pre-dawn turbulent bubble-like irregularities in the bottomside ionosphere even without gravity, attributed to concentric gravity waves over the magnetic equator. Our findings underscore the significant influence of gravity waves on the formation of LSWS and ionospheric irregularities.    

How to cite: Chou, M.-Y., Yue, J., Pedatella, N., McDonald, S., and Tate, J.: Modeling Equatorial Plasma Bubbles with SAMI3/SD-WACCM-X: Large-Scale Wave Structure, EGU General Assembly 2024, Vienna, Austria, 14–19 Apr 2024, EGU24-2380, https://doi.org/10.5194/egusphere-egu24-2380, 2024.

The Monitoring Vibrations and Perturbations in the Lithosphere, Atmosphere, and Ionosphere (MVP-LAI) instrumental array was established in Sichuan, China, in 2021. The MVP-LAI station has demonstrated its efficacy in investigating the causal mechanisms of LAI coupling among multiple geophysical parameters in the vertical direction above a specific area on the Earth's surface during natural hazards such as earthquakes, volcanic eruptions, and landslides. Another MVP-LAI station will be established in Yunnan, approximately 200 km away from the first one, this year. Additionally, a high-frequency Doppler sounder array, comprising two transmitters with distinct frequencies and eight receivers, will be installed in areas covering both MVP-LAI stations to monitor vertical changes in ionospheric layers at two specific altitudes. It is noteworthy that observations from seismometers, magnetometers, and ground-based GNSS receivers in this area can be utilized to capture waves and/or perturbations propagating along the horizontal layer at the Earth's surface, at altitudes of approximately 100 km and 350 km, respectively. The two frequencies employed by the high-frequency Doppler sounder array can aid in comprehending how waves and/or perturbations propagate along the horizontal layers at approximately 200 km and 250 km in altitude. When the two MVP-LAI stations, the high-frequency Doppler sounder array, and substations are integrated, vibrations and/or perturbations propagate both vertically and along the five horizontal layers, even in slant directions, can be detected. The collaboration between MVP-LAI stations and horizontal observations forms the Greater Omnidirectional Ascertain Technology (GOAT), which enhances the understanding of the proportional mechanism for the LAI coupling.

How to cite: Chen, C.-H., Sun, Y.-Y., Lin, K., and Zhang, X.: Greater Omnidirectional Ascertain Technology (GOAT) of the Monitoring Vibrations and Perturbations in the Lithosphere, Atmosphere, and Ionosphere (MVP-LAI) Array, EGU General Assembly 2024, Vienna, Austria, 14–19 Apr 2024, EGU24-2698, https://doi.org/10.5194/egusphere-egu24-2698, 2024.

The sudden cutoff of solar radiation caused by the solar eclipse could cause significant changes in the thermosphere and ionosphere, considering the fact that the solar radiation plays a significant role in their dynamical processes. In this study, the thermospheric neutral wind recorded by the Michelson Interferometer for Global High-Resolution Thermospheric Imaging (MIGHTI) on the Ionospheric Connection Explorer (ICON) spacecraft and metero radar were analyzed to examine the variations in thermospheric wind during and after the 21 June 2020 annular solar eclipse over the East China area. The neutral wind observations showed direct evidences that the solar eclipse disturbed the mesosphere and low thermosphere for more than 10 hours. The clear enhancement of the meridional wind during the moon obscuration and sharply decreased meridional wind after local sunset suggested that a large-scale oscillation was caused by the solar eclipse, which persisted from daytime to nighttime.

How to cite: Wang, J. and Sun, Y.-Y.: Thermospheric wind response to the annular solar eclipse on 21 June 2020, EGU General Assembly 2024, Vienna, Austria, 14–19 Apr 2024, EGU24-2968, https://doi.org/10.5194/egusphere-egu24-2968, 2024.

A FORMOSAT-5 satellite was launched on 25 August 2017 CST into a 98.28° inclination sun-synchronous circular orbit at 720 km altitude along the 1030/2230 local time sectors.  Advanced Ionospheric Probe (AIP), a piggyback science payload developed by National Central University for the FORMOSAT-5 satellite, has measured in-situ ionospheric plasma concentrations at a 1,024 Hz sampling rate over a wide range of spatial scales for more than 6 years.  In this poster, global plasma density irregularities in the pre-midnight sector had been seasonally selected from FORMOSAT-5/AIP data during 2018 to 2023.  Yearly variations of these irregularity patterns with solar cycle could be clearly observed.

How to cite: Chao, C.-K.: Equatorial Plasma Density Irregularities Observed by Advanced Ionospheric Probe Onboard FORMOSAT-5 Satellite, EGU General Assembly 2024, Vienna, Austria, 14–19 Apr 2024, EGU24-2985, https://doi.org/10.5194/egusphere-egu24-2985, 2024.

EGU24-2998 | ECS | Orals | NH10.5

Simulation of the atmospheric Acoustic-gravity waves caused by a finite fault 

Ting Li and Yongxin Gao

Based on the stratified lithosphere-atmosphere model, we present a semi-analytic method for calculating acoustic-gravity waves (AGWs) excited by a finite fault in the lithosphere. A finite fault is decomposed into a series of small subfaults, each treated as a point source with distinct rupture times. The fault is assumed to slide uniformly at a constant velocity along a specific direction. Simulation results reveal that both sides of the fault generate two types of AGWs when the fault rupture initiates and ceases. One type is the head AGW, generated by the P and Rayleigh waves propagating along the surface. The other one is the epicenter AGW, produced by direct seismic waves. The propagation of the AGWs is directional and related to the fault mechanism. We investigated a vertical strike-slip fault and a thrust fault, finding that the velocity amplitudes of the AGWs caused by both types of faults along the rupture direction are larger than the opposite direction. The AGWs induced by the thrust fault are stronger than those caused by the strike-slip fault. Furthermore, variations in the rupture velocity result in differences in waveform.

How to cite: Li, T. and Gao, Y.: Simulation of the atmospheric Acoustic-gravity waves caused by a finite fault, EGU General Assembly 2024, Vienna, Austria, 14–19 Apr 2024, EGU24-2998, https://doi.org/10.5194/egusphere-egu24-2998, 2024.

EGU24-3089 | ECS | Orals | NH10.5

Design, Testing, and Preliminary Data Analysis of the Seafloor Absolute Pressure Gauge 

Ching-Ren Lin, Ya-Ju Hsu, Feng-Sheng Lin, and Kun-Hui Chang

Taiwan is situated in the collision zone between the Philippine Sea Plate and the Eurasian Plate, where these two plates are converging at an average rate of 8.2 centimeters per year, leading to significant crustal deformation on the island. Utilizing data from GPS (Global Positioning System) measurements processed and analyzed using Bernese software, the average velocity field of crustal movements can be estimated, providing a more comprehensive understanding of crustal deformation. The combination of GPS and seafloor geodesy observations can aid in unraveling the seismic processes along plate boundaries. Due to the inability of GPS signals to penetrate seawater, acoustic methods are employed to make ocean bottom pressure (OBP) measurements, serving as a valuable and unique tool for monitoring integrated ocean currents and observing sea level changes.

OBP measurements have been applied for various geophysical purposes, including ocean physics and marine geodesy. Seafloor Absolute Pressure Gauges (SAPG) based on quartz oscillation principles have been employed to record phenomena such as tsunamis, ocean tides and non-tidal sea level variations, as well as seafloor vertical deformations. These instruments play a crucial role in marine physics research.

In recent years, the Academia Sinica has also conducted research in the surrounding waters of Taiwan using acoustic positioning methods for seafloor geodetic observations. In conjunction with seafloor geodetic observations, ocean bottom pressure (OBP) measurement is another method employed.

The seafloor absolute pressure gauge (SAPG) developed by the Academia Sinica is composed of a Paroscientific Inc. quartz vibrating pressure sensor, integrated with an OEM data logger from RBR-Global Co. (http://www.rbr-global.com/products/bpr) and components such as the BART Boards with Regular Tuning ROUND and Acoustic Transducer that made by EdgeTech Co. The assembly of SAPG has been completed, and it has been deployed in the waters off the eastern coast of Taiwan for long-term observations. This paper will introduce the instrument assembly of SAPG, pre-deployment testing, and preliminary analysis results of the marine data.

How to cite: Lin, C.-R., Hsu, Y.-J., Lin, F.-S., and Chang, K.-H.: Design, Testing, and Preliminary Data Analysis of the Seafloor Absolute Pressure Gauge, EGU General Assembly 2024, Vienna, Austria, 14–19 Apr 2024, EGU24-3089, https://doi.org/10.5194/egusphere-egu24-3089, 2024.

In fair weather, the vertical atmospheric electric field is oriented downward (positive in the earth surface ordinate system) in the global atmospheric circuit. Some researchers revealed the unique phenomenon whereby once an upward vertical atmospheric electric field is observed in fair weather, an earthquake follows within 2-48 hours regardless of the earthquake magnitude. However, the mechanism has not been explained with a suitable physical model. In this paper, a physical model is presented considering four types of forces acting on charged particles in air. It is demonstrated that the heavier positive ions and lighter negative ions are rapidly separated. Finally, a reversed fair weather electrostatic field is formed by the above charge separation process. The simulation results have instructive significance for future observations and hazard predictions and it still needs further research.

How to cite: Chen, T. and Li, L.: Atmospheric charge separation mechanism due to gas release from the crust before an earthquake, EGU General Assembly 2024, Vienna, Austria, 14–19 Apr 2024, EGU24-3308, https://doi.org/10.5194/egusphere-egu24-3308, 2024.

EGU24-3330 | Orals | NH10.5

Acoustic-gravity waves generated by a point earthquake source 

Yongxin Gao and Ting Li

It is reported that earthquakes can trigger coseismic ionospheric disturbances, leading to the so called Lithosphere-atmosphere-ionosphere (LAI) coupling phenomenon. The acoustic-grave wave (AGW) is an important mechanism to induce such a phenomenon. In this study, we present a semi-analytic method to calculate AGWs excited by an earthquake source in the stratified lithosphere-atmosphere model and conduct numerical simulations to investigate characteristics of the AGWs. The results show that mainly two kinds of AGWs can be generated by the earthquake source. One is the head AGWs wave generated by the Rayleigh wave propagating along the surface, which propagates upwards nearly vertically. Another one is the epicenter AGWs generated by the direct seismic waves from the source. Both the head and epicenter AGWs are sensitive to the earthquake focal mechanism and are influenced by the structures of the atmosphere and solid earth. We also apply our method to a real earthquake event and compare the synthetic signals with the observed data.

How to cite: Gao, Y. and Li, T.: Acoustic-gravity waves generated by a point earthquake source, EGU General Assembly 2024, Vienna, Austria, 14–19 Apr 2024, EGU24-3330, https://doi.org/10.5194/egusphere-egu24-3330, 2024.

EGU24-3553 | Orals | NH10.5

Differences between ionospheric infrasound induced by a strong volcanic eruption and an earthquake. 

Jaroslav Chum, Petra Koucká, Tereza Šindelářová, and Jan Rusz

 Strong earthquakes and volcano eruptions generate atmospheric waves in the infrasound range that can reach ionospheric heights and cause electron density disturbances that can be monitor remotely, e.g., using electromagnetic waves. Using infrasound measurement in the ionosphere by continuous radio Doppler sounding in Europe, the differences between ionospheric disturbances induced by earthquakes and volcano eruption are discussed on the examples of the recent M=7.7 Turkey 6 February 2023 earthquake and Hunga eruption on 15 January 2022. It will be shown that the main difference is that co-seismic (induced by seismic waves) infrasound detected in the ionosphere propagated roughly vertically and is generated locally (below the observation in the ionosphere) by vertical movement of ground surface. On the other hand, the infrasound induced by volcano eruption propagated most probably from the source (volcano) and leaked to the ionosphere from the imperfect stratospheric and thermospheric wave guide. In addition, a distinct travelling ionospheric disturbance was observed.    

How to cite: Chum, J., Koucká, P., Šindelářová, T., and Rusz, J.: Differences between ionospheric infrasound induced by a strong volcanic eruption and an earthquake., EGU General Assembly 2024, Vienna, Austria, 14–19 Apr 2024, EGU24-3553, https://doi.org/10.5194/egusphere-egu24-3553, 2024.

EGU24-3948 | ECS | Orals | NH10.5

Electromagnetic response to undersea earthquakes in marine layered model 

Qianli Cheng and Yongxin Gao

In this study, we adopt a horizontally layered model which consisting of air, seawater and undersea porous rock and develop an analytically-based method to calculate the seismic and EM fields generated by undersea earthquakes. We conduct numerical simulations to investigate the characteristics of the EM response in three case (the receivers located at the seafloor, in the seawater near the sea surface and in the air, respectively). The results show that two kinds of EM signals can be identified in the EM records at these receivers. The first is the early EM wave arriving before the seismic waves and the second is the coseismic EM fields with apparent speed of the seismic waves. The EM signals observed at the seafloor are mostly stronger than those observed in the seawater and air near the sea surface. We applied this method to simulating the EM response to the 2022 Mw 7.3 earthquake that took place in the sea near Fukushima, Japan. At the receiver with 80 km epicentral distance at the seafloor, the predicted coseismic electric and magnetic signals reach the amplitudes of 2 μV/m and 2 nT, respectively. The results suggest a possibility to monitor the EM disturbances associated with marine earthquakes and use them to serve the earthquake early warning or earthquake mitigation.

How to cite: Cheng, Q. and Gao, Y.: Electromagnetic response to undersea earthquakes in marine layered model, EGU General Assembly 2024, Vienna, Austria, 14–19 Apr 2024, EGU24-3948, https://doi.org/10.5194/egusphere-egu24-3948, 2024.

EGU24-4579 | Orals | NH10.5

Ionospheric space weather and seismo-ionospheric precursors observed by China seismo-electromagnetic satellite 

Jann-Yenq Liu, Fu-Yuan Chang, Yun-Cheng Wen, and Xuhui Shen

The China Seismo-Electromagnetic Satellite (CSES), with a sun-synchronous orbit at 507 km altitude, was launched on 2 February 2018 to investigate seismo-ionospheric precursors (SIPs) and ionospheric space weather.  The CSES probes manifest longitudinal features of 4-peak plasma density and three plasma depletions in the equatorial/low-latitudes as well as mid-latitude troughs.  CSES plasma and the total electron content (TEC) of the global ionosphere map (GIM) are used to study PEIAs associated with a destructive M7.0 earthquake and its followed M6.5 and M6.3/M6.9 earthquakes in Lombok, Indonesia, on 5, 17, and 19 August 2018, respectively, as well as to examine ionospheric disturbances induced by an intense storm with the Dst index of -175 nT on 26 August 2018.  Spatial analyses of GIM TEC and CSES plasma quantities discriminate SIPs from global effects and locate the epicenter of possible forthcoming large earthquakes.  CSES ion velocities are useful to derive SIP- and storm-related electric fields in the ionosphere.

How to cite: Liu, J.-Y., Chang, F.-Y., Wen, Y.-C., and Shen, X.: Ionospheric space weather and seismo-ionospheric precursors observed by China seismo-electromagnetic satellite, EGU General Assembly 2024, Vienna, Austria, 14–19 Apr 2024, EGU24-4579, https://doi.org/10.5194/egusphere-egu24-4579, 2024.

EGU24-4806 | Posters on site | NH10.5

Rapid Estimation of 2022 Tonga Erupted Volume from the Remote Seismo-Acoustic Resonance 

Cheng-Horng Lin, Min-Hung Shih, and Ya-Chuan Lai

The powerful acoustic waves generated by the major eruption on January 15, 2022 on Hunga Tonga Hunga Ha’apai (HTHH) of Tonga were unambiguously recorded in Taiwan by several infrasonic stations and Formosa array, which consists of 146 broadband seismic stations with an average spacing of ~5 km in northern Taiwan. Based on the carefully analyses of the broadband frequency-wavenumber method (BBFK) and the Fast Fourier Transform (FFT), it was interesting to see that both data sets consistently showed a resonant frequency of ~0.0117 Hz persisted for more than 25 minutes after the first major eruption. Such a long-duration resonance of the remote seismo-acoustic waves provides a rapid estimation of the erupted magma volume of 0.215 ± 0.015 if the volcanic cavity produced by the erupting magma is considered as a classic Helmholtz resonator. Thus, we may obtain that the first major eruption alone of HTHH rated a 4 on the VEI scale. But the total erupted volume could reach up VEI 5 or even 6 if we consider all of the accumulated magma from the following eruptions.

How to cite: Lin, C.-H., Shih, M.-H., and Lai, Y.-C.: Rapid Estimation of 2022 Tonga Erupted Volume from the Remote Seismo-Acoustic Resonance, EGU General Assembly 2024, Vienna, Austria, 14–19 Apr 2024, EGU24-4806, https://doi.org/10.5194/egusphere-egu24-4806, 2024.

EGU24-4922 | Posters on site | NH10.5

Indicators of the Activity Associated with Concealed Feeding Volcanic Fluids in the Tatun Volcano Group, Northern Taiwan 

Hsin-Chieh Pu, Cheng-Horng Lin, Hsiao-Fen Lee, Ya-Chuan Lai, Min-Hung Shih, Guo-Teng Hong, and Po-Tsun Lee

We analyzed 3,330 earthquake focal mechanisms and the fumarolic gases in the Tatun Volcano Group (TVG) during 2018–2021. Between June/2020 and June/2021, we found a concealed inflation beneath a depth of 2 km. We indicate this inflating mechanism was associated with the feeding volcanic fluids, which induced the past inflating cases in the TVG before 2018. We deliberated about the feeding features regarding this and the past cases and purpose three indicators to monitor such concealed activities, including the inflating indicator associated with the behaviors of earthquake faulting, heating indicator determined by the systematically high HCl/CO2 ratios, and discharging indicator displayed by the lasting high St/CO2 ratios. Using these indicators, we concluded that it was not rare during the last one decade that the concealed activities whose volcanic fluids were discharged occasionally.

How to cite: Pu, H.-C., Lin, C.-H., Lee, H.-F., Lai, Y.-C., Shih, M.-H., Hong, G.-T., and Lee, P.-T.: Indicators of the Activity Associated with Concealed Feeding Volcanic Fluids in the Tatun Volcano Group, Northern Taiwan, EGU General Assembly 2024, Vienna, Austria, 14–19 Apr 2024, EGU24-4922, https://doi.org/10.5194/egusphere-egu24-4922, 2024.

A solar storm can trigger severe geomagnetic and ionospheric disturbances, and activities originating from the Earth’s surface can do so as well. This presentation will introduce the sudden changes in the ionospheric plasma structure and electrodynamics after large lithospheric disturbances, such as earthquakes/tsunamis and volcanic eruptions. The main focus will be on the two significant events of the magnitude 9.0 Tohoku earthquake/tsunami (38.3°N 142.4°E) in the northeastern sea area of Japan on 11 March 2011, and the undersea volcanic eruption in Tonga (20.6°S 175.4°W), Central Pacific, on 15 January 2022. This presentation will also discuss the main characteristics of disturbances in ionospheric structures and electrodynamics. Investigating the two events enhances our comprehension of the sensitivity of the ionosphere response to lithospheric activities.

How to cite: Sun, Y.-Y.: Electrodynamic changes in the ionosphere due to large lithospheric disturbances, EGU General Assembly 2024, Vienna, Austria, 14–19 Apr 2024, EGU24-4979, https://doi.org/10.5194/egusphere-egu24-4979, 2024.

Pre-earthquake anomalous phenomena in different geospheres have been widely reported.  Scientists found that the anomalies appear days to months prior to earthquakes from distinct geophysical parameters.  It is urgent and challengeable to investigate impending-earthquake anomalous signals for earthquake prediction.  The MVP-LAI (Monitoring Vibrations and Perturbations in the Lithosphere, Atmosphere, and Ionosphere) system was established at Leshan, Sichuan, China in 2021.  The system monitors the changes of over 20 various geophysical parameters from subsurface to ionosphere.  It aims to gain insights into the mechanisms of the lithosphere-atmosphere-lithosphere coupling (LAIC) during natural hazards.  On 5 September 2022, a M6.8 earthquake occurred at Luding, which is approximately 175 km from the MVP-LAI system.  The results show that the seven parameters from the MVP-LAI system simultaneously exhibited abnormal signal approximately 3 hours before the Luding earthquake. The parameters include ground tilts, air pressure, radon concentration, atmospheric vertical electric field, geomagnetic field, wind field, and total electron content. The enhancement in radon concentration suggests that the chemical channel could be a promising mechanism for the coupling of geospheres. On the other hand, air pressure, the geomagnetic field, and total electron content exhibit similar anomalous spectral characteristics. These anomalies may be attributed to atmospheric resonance before the earthquake. Furthermore, the reduction of the horizontal wind speed, and the increase of upward vertical wind support the resonance channel. The results demonstrate that the LAIC before earthquakes could be dominated by multiple potential mechanisms. The multi-parameter anomalies identified in this study guarantee approximately 3 hours of warning for people to prepare for the seismic event and mitigate hazards.

How to cite: Mao, Z. and Chen, C.-H.: Multi-parameter anomalies of the lithosphere, atmosphere, and ionosphere approximately three hours prior to the M6.8 Luding earthquake in China, EGU General Assembly 2024, Vienna, Austria, 14–19 Apr 2024, EGU24-7128, https://doi.org/10.5194/egusphere-egu24-7128, 2024.

The ionosphere owns a complex electric current system mainly driven by the ionospheric electric field and thermospheric wind. Changes in current can generate geomagnetic signals that can be observed both on the ground and in space. In this study, we analyzed the ionospheric current in the Asia-Oceania region by utilizing geomagnetic data collected from magnetometers of ground-based observatories and SWARM satellites at ~450 km altitude. The results present the geomagnetic variations at the two distinct altitudes, encompassing longitudinal, latitudinal, and seasonal variations. Furthermore, the Ionosphere-Electrodynamics General Circulation Model (TIE-GCM) was employed to simulate the associated geomagnetic signals. This study is the first to combine dense geomagnetic data from multiple altitudes and simulations to understand the ionospheric current in the Asia-Oceania region. The differences between the observational geomagnetic signals at different altitudes, along with the simulations, reveal a unique current structure that has not been previously discovered. The findings provide a new understanding of the intricate evolution of the current systems, which contributes to our knowledge of the electric dynamics within Earth's ionosphere.

How to cite: Zhang, P. and Sun, Y.-Y.: A unique structure of the ionospheric current over the Asian-Oceania region determined by the combination of the ground-based and space-borne magnetometers, EGU General Assembly 2024, Vienna, Austria, 14–19 Apr 2024, EGU24-8677, https://doi.org/10.5194/egusphere-egu24-8677, 2024.

The Qinling Orogenic Belt (QOB) is one of the most important orogens in Eastern Asia formed by the collision between the North China Block (NCB) and the South China Block (SCB). The evolution history of the QOB is essential to the assembly processes of the major blocks in China and the evolution history of the Proto-Tethys Ocean (Shangdan Ocean). Paleomagnetism can quantitatively restore the paleo-position of blocks, which is key to studying the related tectonic evolution. Hindered by the complex tectonic process, few paleomagnetic results have been reported from the QOB. Here we reported a primary paleomagnetic study from the northern QOB by conducting both rock magnetic and paleomagnetic experiments on the early Devonian Lajimiao pluton (~413Ma) in the North Qinling belt (NQB), to constrain its paleo-position and the evolution of the QOB during the early Paleozoic period.

253 cores from 28 sites were drilled by portable gasoline drills, and oriented by a magnetic compass and also a sun compass if possible. Rock magnetic experiments indicate that the main magnetic mineral in most of the samples is mainly magnetite in a pseudo-single domain or multi-domain state. Both thermal demagnetization and alternating-field demagnetization were applied to obtain the characteristic remanent magnetization. The Fisher-mean direction of the low-temperature/coercivity component is roughly consistent with the present geomagnetic field (PGF), suggesting that it is probably a viscous remanent magnetization caused by the PGF. The high-temperature/coercivity component yielded a Fisher-mean direction Ds/ Is = 355.8°/19.1° in stratigraphic coordinates, corresponding to a paleomagnetic pole of 65.8°N/299.9°E (A95=2.4°). It is the first Devonian paleomagnetic pole among the scarce paleomagnetic results from the QOB. This pole indicates that the NQB may have been located at a low latitude at the early Devonian, probably in proximity to both the North China and South China blocks. However, the difference between the coeval paleomagnetic poles from the three blocks (NQB, NCB, SCB) may hint the assembly process of the several major blocks is not simple and direct. Anyway, the newly obtained paleomagnetic pole from the NQB would be able to refine our understanding of the tectonic evolution of the QOB and the Proto-Tethys Ocean.

How to cite: Xu, H., Liang, Y., Lai, Y., and Li, G.: Primary Devonian paleomagnetic results from the Qinling orogenic belt and its implication for the evolution of the Proto-Tethys Ocean, EGU General Assembly 2024, Vienna, Austria, 14–19 Apr 2024, EGU24-9414, https://doi.org/10.5194/egusphere-egu24-9414, 2024.

EGU24-11811 | ECS | Orals | NH10.5

Comparative analysis of recent seismic and volcanic events in the Tonga-Kermadec zone: Insights into Lithosphere-Atmosphere-Ionosphere Coupling 

Serena D'Arcangelo, Mauro Regi, Angelo De Santis, Loredana Perrone, Gianfranco Cianchini, Maurizio Soldani, Alessandro Piscini, Cristiano Fidani, Dario Sabbagh, Stefania Lepidi, and Domenico Di Mauro

The Tonga-Kermadec zone stands out as one of the most active areas in the world for continuous subduction processes characterizing the area. In the recent few years, it has been affected by two important geophysical events: first a strong earthquake of M7.2 on June 15, 2019, with the epicentre in Kermadec Islands (New Zealand), and then an exceptional eruption of Hunga Tonga-Hunga Ha’apai volcano on January 15, 2022. We focused our attention on the phenomena appearing before, during and soon after each event, employing a multi-parametric and multi-layer approach in order to analyse the geodynamics of the entire area and the involved lithosphere-atmosphere-ionosphere coupling (LAIC). In details, for the lithosphere we conducted a seismic analysis of the earthquake sequence culminating with the mainshock on June 15, 2019, and of those preceding the big eruption, within a circular area with Dobrovolsky strain radius corresponding to that of an equivalent seismic event of magnitude equal to the energy released during the eruption. Moving to the atmosphere, we considered some parameters possibly influenced by seismic and volcanic events, using the CAPRI algorithm to the ECMWF datasets to detect anomalies in their values. Finally, by observing satellite data, we analysed the magnetic field and electron burst precipitations, potentially correlated to the events. All these observations, along with their similarities and differences, provide a better insight of the complex tectonic context.

How to cite: D'Arcangelo, S., Regi, M., De Santis, A., Perrone, L., Cianchini, G., Soldani, M., Piscini, A., Fidani, C., Sabbagh, D., Lepidi, S., and Di Mauro, D.: Comparative analysis of recent seismic and volcanic events in the Tonga-Kermadec zone: Insights into Lithosphere-Atmosphere-Ionosphere Coupling, EGU General Assembly 2024, Vienna, Austria, 14–19 Apr 2024, EGU24-11811, https://doi.org/10.5194/egusphere-egu24-11811, 2024.

EGU24-12565 | Posters on site | NH10.5

TROPOMAG - Influence of geomagnetic storms on the TROPOsphere dynamics: Can the Earth’s MAGnetic field be considered a proxy of climate changes? Some results 

Lucia Santarelli, Valentina Bruno, Igino Coco, Sofia De Gregorio, Paola De Michelis, Fabio Giannattasio, Paolo Madonia, Michael Pezzopane, Marco Pietrella, Massimo Rossi, and Roberta Tozzi

The TROPOMAG project investigates the possible effects of changes of the Earth’s magnetic field on the atmosphere and weather conditions with the aim to better quantify the natural sources of the atmospheric variability. This need raises to assess the observed climate trends more correctly, with a consequent better understanding of manmade effects on climate. Specifically, this work explores possible connections between atmospheric pressure anomalies and the occurrence of geomagnetic storms. To accomplish this task pressure data, recorded over some Italian volcanic areas, are analysed according to different methods and considering geomagnetic indexes. This work describes and discusses corresponding preliminary results.

How to cite: Santarelli, L., Bruno, V., Coco, I., De Gregorio, S., De Michelis, P., Giannattasio, F., Madonia, P., Pezzopane, M., Pietrella, M., Rossi, M., and Tozzi, R.: TROPOMAG - Influence of geomagnetic storms on the TROPOsphere dynamics: Can the Earth’s MAGnetic field be considered a proxy of climate changes? Some results, EGU General Assembly 2024, Vienna, Austria, 14–19 Apr 2024, EGU24-12565, https://doi.org/10.5194/egusphere-egu24-12565, 2024.

EGU24-12791 | Orals | NH10.5

The case of the missing ionosphere: Investigating the ionospheric hole following the 2022 Tonga volcanic eruption 

Claire Gasque, Brian Harding, Thomas Immel, Yen-Jung Wu, and Colin Triplett

Following the eruption of the Hunga Tonga-Hunga Ha'apai (hereafter called ‘Tonga’) volcano just before local sunset on 15 January 2022, satellite data reveals the formation of a large-scale plasma depletion surrounding the region. This depletion persisted for roughly 14 hours, until local sunrise resumed plasma production. By combining in-situ and remote satellite observations, we seek to characterize the depletion's magnitude, spatial scale, and temporal evolution in the hours following the eruption. We will compare this to observations of ionospheric holes following previous impulsive lower atmospheric events, such as the 2011 Tohoku earthquake. Finally, we will investigate the dominant mechanism for locally depleting the plasma following this event, considering field-aligned ion drag, cross B transport due to electric fields arising from dynamo or other effects, and changing recombination rates. We aim ultimately to better understand the coupling between the lower atmosphere and ionosphere/thermosphere system following impulsive events such as this eruption. 

How to cite: Gasque, C., Harding, B., Immel, T., Wu, Y.-J., and Triplett, C.: The case of the missing ionosphere: Investigating the ionospheric hole following the 2022 Tonga volcanic eruption, EGU General Assembly 2024, Vienna, Austria, 14–19 Apr 2024, EGU24-12791, https://doi.org/10.5194/egusphere-egu24-12791, 2024.

EGU24-13179 | Orals | NH10.5

Experimental data and models for radio diagnostics of extreme impacts “from above” and “from below” on ionospheric space weather: VLF, LOFAR and GNSS 

Yuriy Rapoport, Volodymyr Grimalsky, Andrzej Krankowski, Leszek Błaszkiewicz, Paweł Flisek, Kacper Kotulak, Adam Fron, Volodymyr Reshetnyk, Asen Grytsai, Vasil Ivchenko, Alex Liashchuk, and Sergei Petrishchevskii

Radio diagnostics, including scattering of electromagnetic waves (EMW) by spatiotemporal disturbances of the ionospheric plasma in the ELF (Extremely Low Frequencies, Hz), VLF (Very Low Frequencies, kHz), HF (High Frequencies, MHz) and microwaves (GHz) ranges, is one of the most effective methods for detecting and studying extreme modifications of ionospheric “space weather”. Such modifications are caused, in particular, by influences “from above” (from the Solar wind and magnetospheric storms) and “from below” (from tropical cyclones, earthquakes and volcanoes) and other Natural Hazards. Such ionospheric modifications are manifested, in particular, in the excitation of TIDs (Traveling Ionospheric Disturbances) and scintillations on various scales of the HF waves detected by LOFAR (Low Frequency Array) Radio Telescope.

In combination with other ionosphere sounding techniques (as GNSS) LOFAR can give a complementary insight to the ionospheric structures. We present LOFAR scintillation observations compared with GNSS-observed ionospheric irregularities in order to assess the ionospheric plasma structures. Classified ionospheric scintillation data will be presented. These include quasi-periodic, quasi-pulse, flare-like and other disturbances detected on the LOFAR radio telescopic systems in Poland, Great Britain, Germany and other countries. Spectral processing of LOFAR data is currently being carried out to identify various types of ionospheric disturbances, including TIDs, that characterize ionospheric space weather. We are currently developing TID modelling methods aimed at comparison with experimental data. Theoretical and experimental data on ionospheric disturbances associated with the eruption of the Hunga-Tonga-Hunga-Ha'apai volcano in January 2022 are presented and the results of their comparison are discussed. Based on the data-driven approach, effective current sources associated with lightning discharges caused by the eruption of the Hunga-Tonga-Hunga-Ha'apai volcano are identified in the ULF (Ultra-Low Frequency), ELF and VLF ranges. In particular, theoretical results are given on: (i) the excitation of the first and second modes of the Schumann resonator; (ii) the fundamental possibility of simultaneous excitation of coupled global Schumann and local Alfvén resonators. The results of applying the model for the scattering of HF electromagnetic waves (EMWs) on ionospheric disturbances such as increased and decreased plasma densities will be presented. The effects of birefringence, the dependence of EMW frequency on time in moving plasma, diffraction and dispersion of EMWs will be included, based on the advanced method of Complex Geometrical Optics.

An information is provided on the Ukrainian Ground-Based Space Weather Monitoring Network. This network includes GNSS stations, VLF receivers, Magnetotelluric stations, Ionosonde and magnetometer INTERMAGNET. Examples of corresponding measurements are presented.

Yu.R. and L.B. are grateful, for partial funding this research, by National Science Centre, Poland, grant No 2023/49/B/ST10/03465, “Modern Radio-Diagnostics of the Ionosphere using LOFAR and GNSS Data”

How to cite: Rapoport, Y., Grimalsky, V., Krankowski, A., Błaszkiewicz, L., Flisek, P., Kotulak, K., Fron, A., Reshetnyk, V., Grytsai, A., Ivchenko, V., Liashchuk, A., and Petrishchevskii, S.: Experimental data and models for radio diagnostics of extreme impacts “from above” and “from below” on ionospheric space weather: VLF, LOFAR and GNSS, EGU General Assembly 2024, Vienna, Austria, 14–19 Apr 2024, EGU24-13179, https://doi.org/10.5194/egusphere-egu24-13179, 2024.

The M7.8 and M7.5 earthquakes that occurred on 6 February 2023 in Turkey caused co-seismic ionospheric disturbances, and ionospheric total electron content (TEC) disturbances can be detected by Beidou geostationary satellites. The 17 GNSS continuous observation stations from IGS Net around the epicenters receive electromagnetic wave signals emitted by two Beidou geostationary satellites located above the equator at a frequency of 1 Hz. That allows us to obtain the TEC time series at fixed ionospheric piercing points (IPPs). Disturbances triggered by the M7.5 earthquake propagate farther and have a larger amplitude in general traveling at least 1600 km northwest and 800 km south and reaching the furthest area of the study with the maximum amplitude of about 2.5 TECU. For Mw 7.8 earthquake, the disturbances can be observed about 800 km northwest of the epicenter while no significant disturbances detected further away and the maximum amplitude of the disturbances is about 0.25 TECU. The TEC disturbances propagation speeds corresponding to the M7.5 and M7.8 earthquakes are 2.77 km/s and 2.60 km/s as the results of least squares fitting performed on epicentral distances and travelling times of the disturbances with the greatest amplitude. The speeds are closer to Rayleigh waves velocity of about 3 km/s at the surface rather than acoustic waves velocity of about 1 km/s in the ionosphere. The velocity of propagation for the co-seismic ionospheric disturbances, as determined by utilizing the Beidou geostationary satellites during two earthquakes, is consistent with that of the Rayleigh waves determined from the seismometers. Meanwhile, the velocity exhibits directional disparities for M7.5 earthquake.

How to cite: Rao, H. and Chen, C.-H.: Co-seismic ionospheric total electron content disturbances of Turkey earthquake doublet in 2023 detected by Beidou geostationary satellites, EGU General Assembly 2024, Vienna, Austria, 14–19 Apr 2024, EGU24-14108, https://doi.org/10.5194/egusphere-egu24-14108, 2024.

EGU24-14234 | Posters virtual | NH10.5

Simulation and Analysis of Disastrous earthquakes in the plains of SW Taiwan 

Strong Wen, Yulien Yeh, and Kuan-Ting Tu

There are many types of natural disasters in the world, among which earthquakes are sudden and highly uncertain, which may cause direct or indirect disasters, resulting in casualties, property losses, and infrastructure damage. Local seismic hazard analysis has been studied for a long time. This study uses historical earthquake data and virtual earthquake sources to simulate the propagation of seismic waves in urban areas in SW Taiwan. However, due to the limited number of existing free-field seismic stations and insufficient installation density, the accuracy of earthquake damage assessment is directly affected. Past research has pointed out that the use of scenario earthquake simulation can effectively simulate ground motions in local areas. Therefore, the goal of this study is to use numerical methods to construct a 3D seismic wave simulation, using numerical data and virtual seismic observation stations to simulate regional scales. However, due to limitations in computing resources and underground structure information, seismic waves calculated by 3D seismic wave propagation simulations can only cover relatively low-frequency (<1 Hz). However, for structural analysis in urban areas, in addition to inputting this relatively low-frequency signals, it is also necessary to utilize seismic waves covering high frequencies (>1 Hz) to calculate the vibration process and seismic resistance of the structure. Therefore, the goal of this study is to calculate low-frequency and high-frequency seismic waves separately, and to obtain broadband seismic waves containing low-frequency and high-frequency information through a hybrid method. The findings could be applied to future earthquake risk and building damage assessments.

How to cite: Wen, S., Yeh, Y., and Tu, K.-T.: Simulation and Analysis of Disastrous earthquakes in the plains of SW Taiwan, EGU General Assembly 2024, Vienna, Austria, 14–19 Apr 2024, EGU24-14234, https://doi.org/10.5194/egusphere-egu24-14234, 2024.

The magnetic storm that occurred in May 1921 ranks among the most extreme events ever observed by magnetic observatories. Some parts of this storm were also recorded in declination and vertical intensity by the variation station at the Stará Ďala observatory (present-day Hurbanovo in Slovakia). However, the magnetogram on photographic paper for this event not only contained data gaps, it also did not have a marked timeline, and the values of the divisions for the geomagnetic elements were not known. We identified timestamps using global variations observed by other observatories and estimated the values of the divisions based on data from before and after the studied event. Then, the magnetograms were digitized. To interpret the obtained data, we compared them with hourly averages from other observatories in different parts of the globe. Our results seem to confirm the expected assumption that, in the morning hours of 15 May 1921, the equatorward boundary of the auroral oval extended to the European mid-latitude observatories.

How to cite: Koči, E. and Valach, F.: The extreme geomagnetic storm on 13–15 May 1921: a study based on hourly means, including observations at Stará Ďala (Hurbanovo), EGU General Assembly 2024, Vienna, Austria, 14–19 Apr 2024, EGU24-16216, https://doi.org/10.5194/egusphere-egu24-16216, 2024.

Typhoon is a key dynamic factor triggering landslides. In view of the fact that the previous susceptibility evaluation models rarely consider the interaction between typhoon and static factors, carry out research on the optimal dynamic and static factors combination of typhoon-induced landslides susceptibility. Using the interpretability of machine learning, the importance ranking of dynamic and static factors is carried out to identify key impact factors. On this basis, the importance of static factors under the influence of typhoon is compared, and the interaction between typhoon and static factors is analyzed. Finally, the optimal combination of dynamic and static factors is proposed by using k-fold cross-validation method and taking the average descent accuracy as the index. The results show that the importance of the key influencing factors of typhoon-induced landslide from high to low mainly includes: elevation, NDVI, road and other factors; the addition of typhoon and rainstorm factors significantly increased the importance of factors susceptible to typhoon, such as water system and vegetation, with an increase rate of 24.8-151.7 %. The optimal dynamic and static factors combination of typhoon rainstorm landslide includes all key static factors and four dynamic factors, among which the dynamic factors are: maximum sustained wind speed, rainfall, distance from typhoon center and near gale wind circle radius. The results of ROC curve verification show that the selection of the optimal factor combination can increase the accuracy of the evaluation model by 1.5%-3.5%, which can significantly improve the accuracy and rationality of the susceptibility mapping of typhoon-induced landslides.

Keywords: Impact factor, Typhoon, Landslides susceptibility, Interpretability of machine learning.

How to cite: Wang, F., Zhou, L., Liu, Y., and Chen, F.: Optimal factor combinations selection in typhoon-induced landslides susceptibility mapping using machine learning interpretability, EGU General Assembly 2024, Vienna, Austria, 14–19 Apr 2024, EGU24-16885, https://doi.org/10.5194/egusphere-egu24-16885, 2024.

EGU24-17238 | Posters on site | NH10.5

Anomalous Atmospheric Electric Field Just around the Time of Earthquakes: Case and statistical studies 

Yasuhide Hobara, Mako Watanabe, Mio Hongo, Hiroshi Kikuchi, Takuo Tsuda, and Masashi Hayakawa

In this paper, we report on the Atmospheric Electric Field (AEF) anomalies immediately before and after earthquakes (within 12 hours) in Japan. We demonstrate the results of a case study for several earthquakes that occurred close to our AEF observation network (within 100-200 km of the epicenter) under relatively fair local weather conditions. We found the common features for different earthquakes at different field sites e.g. 20~90 min period of clear anomalous signatures in wavelet spectrograms within a few hours around the main shock. Clear arrival time differences between AEF stations indicate propagating nature of observed AEF anomaly and enable us to calculate the propagation velocities and its occurrence timing. The observational results are compared with the dispersion relation of Internal Gravity Waves (IGW). Moreover, statistical results of the occurrence rate of the AEF anomalies support above mentioned results. Above-mentioned results may indicate the Lithosphere-Atmosphere Coupling, and we propose the physical mechanism of the observed electric field anomalies considering IGW originating from the epicenter region propagating over the field site and disturbing the local atmospheric electric field. 

How to cite: Hobara, Y., Watanabe, M., Hongo, M., Kikuchi, H., Tsuda, T., and Hayakawa, M.: Anomalous Atmospheric Electric Field Just around the Time of Earthquakes: Case and statistical studies, EGU General Assembly 2024, Vienna, Austria, 14–19 Apr 2024, EGU24-17238, https://doi.org/10.5194/egusphere-egu24-17238, 2024.

EGU24-229 | ECS | Orals | CL2.5

The future changes in spatio-temporal distribution of urban heat load and factors that affect its variability 

Zdeněk Janků, Petr Dobrovolný, Jan Geletič, and Michal Lehnert

Summer temperature extremes are increasing rapidly under the current global climate change. Urban environments are among those most exposed to temperature extremes due to the urban heat island, and these exacerbated conditions significantly affect human health and activities, making urban heat load one of the most fundamental concerns for people living in cities. Our research quantifies spatio-temporal changes in urban heat load in two Central-European cities (Brno and Ostrava, Czech Republic) in different geographical configurations. We applied the urban climate model MUKLIMO_3, combined with the cuboid method, to simulate recent and future distributions of four summer climate indices. The simulation results clearly indicate continuous climate warming and project a significant increase in the mean annual values of summer climate indices by the end of the 21st century, particularly in the built-up areas with a predominance of impervious surfaces. Both model simulations and in-situ observations confirm that the magnitude of these changes can differ significantly from city to city suggesting the distribution of urban heat load is not only influenced by climate change, but also by local geography and anthropogenic factors. To determine the causes of the differences in urban heat load variability, we applied land use/land cover configuration metrics and correlation analysis using various geographical factors. Our results show that a compact and less fragmented land use/land cover structure can significantly increase the urban heat load. Altitude also has a strong influence on the heat load pattern in complex terrain. Therefore, some cities are and may continue to be extremely vulnerable to adverse summer temperature extremes. We suggest that urban planners should take into account the current impact of land use/land cover structure on temperature conditions when designing effective adaptation measures to mitigate urban heat load.

How to cite: Janků, Z., Dobrovolný, P., Geletič, J., and Lehnert, M.: The future changes in spatio-temporal distribution of urban heat load and factors that affect its variability, EGU General Assembly 2024, Vienna, Austria, 14–19 Apr 2024, EGU24-229, https://doi.org/10.5194/egusphere-egu24-229, 2024.

EGU24-423 | ECS | Orals | CL2.5

Combining crowdsourced weather data and the numerical urban climate model PALM – potentials and limitations 

Lara van der Linden, Patrick Hogan, Björn Maronga, Rowell Hagemann, and Benjamin Bechtel

The increasing intensity and frequency of heat waves combined with the urban heat island can create thermal conditions which are hazardous for human health. Numerical urban climate modelling can deliver the necessary information to plan resilient adaptation measures for healthy living conditions in cities under a future climate. However, as a model is always a simplification of the real world, model evaluation with measurement data is important. Traditional measurement networks and campaigns are very often not suitable in active planning processes. Crowdsourcing the required weather data offers the potential to easily evaluate model results at any given time.

To identify the potentials and limitations of this approach, the microscale urban climate model PALM is applied to simulate a hot day (Tmax > 30 °C) in a German city. The model results are evaluated with quality controlled crowdsourced air temperature data. The evaluation reveals a good model performance with a high coefficient of determination (R2) of 0.86 to 0.88 and a root mean squared error (RMSE) around 2 K. A temporal pattern in model accuracy is detected with an underestimation of night-time air temperatures. Due to the high number of available stations and the resulting representation of intra-urban temperature variations, the crowdsourced air temperature data proved valuable for model evaluation. Limitations for this approach arise from radiation errors leading to a reduced data quality. Furthermore, measurements from a single station are influenced by microscale and localscale conditions and therefore only the information derived from several stations can be used for evaluation.

How to cite: van der Linden, L., Hogan, P., Maronga, B., Hagemann, R., and Bechtel, B.: Combining crowdsourced weather data and the numerical urban climate model PALM – potentials and limitations, EGU General Assembly 2024, Vienna, Austria, 14–19 Apr 2024, EGU24-423, https://doi.org/10.5194/egusphere-egu24-423, 2024.

Air and surface temperature are among the most important variables to study the urban climate and are closely linked with thermal comfort and human health. Despite their importance, for now only surface temperature can be estimated by remote sensing, which means that the spatial variability of urban air temperature data can only be studied with a dense set of weather stations, which are expensive and do not yet have a spatial resolution as good as remote sensing. Near-surface air exchanges heat mainly with the surface which suggests that their temperatures could be estimated by each other, but as air is a fluid and moves their relationship is complex, so this estimation cannot yet be done with enough precision. This study aims to help improve the estimation of air temperature with surface temperature using the concept of footprint/source areas, which are the average surface areas that air has most interacted with before reaching the sensor at a weather station. For that, footprint areas were approximated as circles around the weather station. Then, using Landsat 5 and 8 satellites data (which passes around 10 a.m. in local solar time), average surface temperatures at different radii around 51 weather stations at the Metropolitan Region of São Paulo, Brazil, were computed. Then, the Pearson Correlation Coefficient between air and surface temperature was computed for each radius, each weather station and different periods of the year, where the radius with maximum correlation would be an approximation of the true footprint area. The average surface temperature in this area is also a better value for estimating air temperature than the surface temperature in the original Landsat data (100 and 120 metters). 

How to cite: Lustosa, R. and Rocha, H.: Estimating air temperature based on satellite surface temperature in the Metropolitan Region of São Paulo, EGU General Assembly 2024, Vienna, Austria, 14–19 Apr 2024, EGU24-698, https://doi.org/10.5194/egusphere-egu24-698, 2024.

EGU24-1457 | ECS | Posters on site | CL2.5

Dense network of wet bulb globe temperature observations to assess the effect of diverse micro-environments on heat stress 

Ian Hellebosch, Sara Top, Steven Caluwaerts, Koen De Ridder, Raf Theunissen, and Clemens Mensink

There is an urgent need for governments to know which measures effectively decrease heat stress and how to adapt urban environments to keep our cities livable in a climate with more, and more extreme, heatwave days. To answer this question, an observational campaign took place in the urban fringe of Ghent (Belgium), a maritime mid-latitude city, during the summer of 2023, including a heatwave in June. This campaign employed diverse in-situ weather stations (2 Campbell stations, 2 Hobo devices and a station from the Flemish MOCCA and VLINDER networks) complemented by 16 AT-HTS01 devices, specifically designed to measure heat stress. Combined, the stations are equipped with black globe thermometers, anemometers, humidity sensors, short-wave radiation pyranometers and actively and passively ventilated air temperature sensors. Based on these variables the wet bulb globe temperature (WBGT) is computed and from this, the influence of different suburban micro-environments on heat stress is derived. In particular, the effects of the surface type, neighboring buildings, trees and forest patches on WBGT are investigated. Some air temperature sensors are installed in actively ventilated shields to detect air temperature differences in different forest patches excluding any radiation-induced measurement errors. Additionally, drone infrared measurements were conducted to estimate the surface temperature of the different surface types during the day and the night. A forest patch decreases the maximum air temperature during the heatwave to up to 1.5°C. At night, the unpaved surface decreases the globe temperature to up to 1.5°C compared to paved surfaces. During daytime shadow effects of buildings and trees have the largest impact on decreasing the globe temperature (by 10°C) and consequently strongly lowers the actual WBGT (up to 4°C). Future research will focus on validating meter-scale numerical models with these observations.

How to cite: Hellebosch, I., Top, S., Caluwaerts, S., De Ridder, K., Theunissen, R., and Mensink, C.: Dense network of wet bulb globe temperature observations to assess the effect of diverse micro-environments on heat stress, EGU General Assembly 2024, Vienna, Austria, 14–19 Apr 2024, EGU24-1457, https://doi.org/10.5194/egusphere-egu24-1457, 2024.

EGU24-1643 | ECS | Orals | CL2.5

Quantifying the Effect of Urban Heat Advection using Crowd Weather Stations 

Jonas Kittner, Daniel Fenner, Matthias Demuzere, and Benjamin Bechtel

Detailed measurements are indispensable in order to understand small-scale urban climate effects. With professional weather stations (PWS) mostly being available outside of cities with few sites per city, alternative data sources such as crowd-sourced weather data have proven to be valuable. Often the Urban Heat Island (UHI) is studied under ideal calm conditions when its development is strongest. At the same time, it has been shown that wind leads to advection of urban air, impacting regions downwind of urban areas and within the city.

We aim to provide insights into the effects of Urban Heat Advection (UHA) in the Urban Canopy Layer (UCL). The metropolitan regions of Paris and Berlin were studied, using four years (2019 - 2022) of quality-controlled crowdsourced air-temperature data from thousands of privately-owned Crowd Weather Stations (CWS). Those data were combined with global ERA5-Land data to overcome gaps in rural CWS coverage and globally-available Local Climate Zone (LCZ) information.

It is shown that wind causes increased exposure to urban heat for areas located downwind of the city core, which was derived using a LCZ-weighted centroid detection. 

For all observed wind directions, classified by dynamically moving wind sectors, differences in spatial patterns were visible with the effect being strongest with regional wind speeds of 3 m·s−1. The results highlight the importance of considering the effects of UHA when studying the UHI to avoid underestimating the exposure to urban heat in downwind areas of the city. The results could be used as a starting point for coupling the conditions in the Atmospheric Boundary Layer with the resulting conditions in the UCL, utilizing a large database with crowdsourced CWS data.

How to cite: Kittner, J., Fenner, D., Demuzere, M., and Bechtel, B.: Quantifying the Effect of Urban Heat Advection using Crowd Weather Stations, EGU General Assembly 2024, Vienna, Austria, 14–19 Apr 2024, EGU24-1643, https://doi.org/10.5194/egusphere-egu24-1643, 2024.

EGU24-1788 | Posters on site | CL2.5

A Global Database of quality-controlled Crowd Weather Station Data 

Benjamin Bechtel, Jonas Kittner, Daniel Fenner, and Matthias Demuzere

Privately-owned weather stations, Crowd Weather Stations (CWS), offer high spatial and temporal density in many urban regions across the globe, and therefore have been used in a variety of urban climate studies, mostly focusing on single cities. One challenge in crowdsourcing CWS data lies in the fact that the link between measured atmospheric data and (historic-) metadata is often lost due to the limited metadata available from popular CWS networks. This poses challenges in retrieving and analyzing data, as, e.g., past changes in CWS location remain undetected, introducing incorrect data, thus reducing data integrity.

We developed an end-to-end workflow for consistently collecting and checking CWS (meta-)data in 257 areas worldwide, covering over 500 urban regions since 2019. The workflow automatically adds newly set-up CWS to the database, as well as consistently handling changes in CWS location. Until now, the database includes over 310,000 CWS with 7 Billion hourly observations of air temperature and relative humidity (mean, maximum, minimum). Over 65,000 changes in CWS location have been detected since 2019. This highlights the importance of continuous metadata updates for this dynamic data source, further enabling the use of the measurements for different applications. Within the database, CWS are linked to additional metadata, including a global digital elevation model, a global Local Climate Zones map, and the Global Human Settlement Layer Urban Center Database.

The database was developed using open data and open-source software, combining PostgreSQL, PostGIS, and Timescale, which allows us to manage billions of measurements efficiently. All air-temperature measurements are consistently and continuously quality controlled using the state-of-the-art open R-Package CrowdQC+. The result is a dataset of consistently-processed metadata and measurements with potential for global-scale (intra-)urban climate studies and in-depth city analyses.[MD1] [DF2] 

How to cite: Bechtel, B., Kittner, J., Fenner, D., and Demuzere, M.: A Global Database of quality-controlled Crowd Weather Station Data, EGU General Assembly 2024, Vienna, Austria, 14–19 Apr 2024, EGU24-1788, https://doi.org/10.5194/egusphere-egu24-1788, 2024.

EGU24-1964 | ECS | Posters virtual | CL2.5

Establishment of Circular Open Data Ecosystems: Supporting the Transition to Urban Greening and Sustainability 

Anastasios Georgakopoulos, Aikaterini Karagiannopoulou, Chrysovalantis Tsiakos, and Angelos Amditis

As urban populations burgeon globally, the imperative to foster sustainable cities becomes increasingly pressing. One primary challenge in urban sustainability is the fragmented data silos within different stakeholders. Addressing these barriers, the key term of the Open Data Ecosystem (ODE) has started to gain a wider appreciation, as it emphasises the need to not only provide free and accessible data assets, but rather a circular, sustainable, demand-driven environment. Towards this perspective, the European-funded project Urban ReLeaf capitalised on the Data Landscape Playbook (DLP) methodology, launched by the Open Data Institute (ODI) to dismantle the data silos in six European cities, i.e., Athens (Greece), Dundee (Scotland), Cascais (Portugal), Mannheim (Germany), Riga (Latvia), and Utrecht (The Netherlands).

Four steps of DLP were adopted, called Plays, to examine the objectives of each city, identify the data owners and infrastructure, and assess the ethical context behind data accessibility. For the first play, a three-tier approach was established to (i) evaluate the initial objectives of the cities, (ii) transform them based on the latest perspectives, and (iii) correlate them with the project. Subsequently, the Data Ecosystem Mapping (DEM) was formulated and provided valuable information about the data assets, the data owners and the formal value exchanges between stakeholders that are generating jointly a data source. Continuing, we addressed key aspects related to the data itself. An early outcome of this process was that the majority of pilot cities chose to disseminate their data sources in open-access data repositories and machine-usable data formats. Unfortunately, most of the identified datasets were an outcome of individual data collection campaigns revealing any intention to continue.

Through the fourth step, we investigated the ethical content following FAIR guidelines. Each data source was classified according to ODI’s Data spectrum scheme (i.e., Closed, Shared, Open) and thus identified the tendency of the European cities towards open access policies. The latest was verified through the identification of the open-accessed data dashboards and licences. An exemption from the general adoption of the Creative Common (CC) licenses was Mannheim, which established the tailored dl-de-by-2.0 license of Germany. Finally, a preliminary review was applied towards the trustworthiness of the released data, investigating methodological procedures that safeguarded the inner trust of data, or the outer trust by the requested public’s opinion.

In conclusion, the integration of the ODI-DLP in urban contexts holds the promise of breaking down data silos, fostering circularity, collaboration, and propelling cities towards sustainability. By investigating the existing open data principles, and interoperable technologies that are used and engaging citizens, cities could harness the full potential of their data to inform policies and initiatives that enhance the Quality of Life (QoL) for residents and pave the way for a more sustainable urban future.

Acknowledgement: This research has been funded by the European Union’s Horizon Europe Research and Innovation Programme under Urban ReLeaf project (Grant Agreement No 101086638).

How to cite: Georgakopoulos, A., Karagiannopoulou, A., Tsiakos, C., and Amditis, A.: Establishment of Circular Open Data Ecosystems: Supporting the Transition to Urban Greening and Sustainability, EGU General Assembly 2024, Vienna, Austria, 14–19 Apr 2024, EGU24-1964, https://doi.org/10.5194/egusphere-egu24-1964, 2024.

EGU24-2159 | ECS | Orals | CL2.5

Assessing the quality of citizen-science rainfall data based on station setup 

Arjan Droste, Marchien Boonstra, Marie-Claire Ten Veldhuis, Marit Bogert, Marc Schleiss, and Sandra De Vries

The Delft Measures Rain Citizen-Science programme has been running for several years in the city of Delft, the Netherlands. Within this programme, interested citizens can apply to receive a low-cost Alecto WS5500 weather station, to measure local meteorological parameters in their own garden. Currently there are over 45 of these citizen-science weather stations spread across neighbourhoods in Delft, capturing rainfall variability in different urban microclimates. However, the scientific quality of these specific stations has never been tested, and from previous work we know that rigorous quality assurance is necessary in order to get meaningful (precipitation) data. Thus we have installed 8 Alecto stations in The Green Village outdoors urban climate field lab at the TU Delft. Stations have been explicitly installed in ways that a citizen might do: slightly tilted, next to a wall (simulating the limited open garden space of a Dutch urban residence), on top of a shed as well as free-standing. These different measurement setups, combined with a row of stations installed in the same way right next to one another, allow us to investigate the bias caused by less-than-ideal station installation, as well as systematic errors related to the tipping bucket mechanism and sensor drifts. Initial results show a general overestimation of the Alecto compared to reference stations and radar observations, and a discernible negative bias caused by sheltering effects of plants and, to a lesser extent by walls.

How to cite: Droste, A., Boonstra, M., Ten Veldhuis, M.-C., Bogert, M., Schleiss, M., and De Vries, S.: Assessing the quality of citizen-science rainfall data based on station setup, EGU General Assembly 2024, Vienna, Austria, 14–19 Apr 2024, EGU24-2159, https://doi.org/10.5194/egusphere-egu24-2159, 2024.

EGU24-3171 | Orals | CL2.5

Serious game as a tool for understanding the need for adapting our neighbourhoods to climate change 

Magdalena Kuchcik, Agata Cieszewska, Joanna Adamczyk-Jabłońska, Joanna Dudek-Klimiuk, Renata Giedych, Krzysztof Klimaszewski, Marcin Łączyński, Gabriela Maksymiuk, Dorota Pusłowska-Tyszewska, and Piotr Wałdykowski

The strategic, serious games could be one of the most interesting and effective educational tools in climate change action methods. This is why interdisciplinary project Co-Adapt - Communities for Climate Change Action (NOR/IdeaLab/Co-Adapt/0002/2020-00; https://coadapt.pl/en)​ aims to develop an integration toolkit based on both board and  computer game to support resiliency and citizen engagement in city-communities, empowering them in responding to new climate change challenges with bottom-up involvement.

The game features simulations that allow local community to transform their neighborhoods into more resilient to the climate change. The game is adapted to local environmental and spatial conditions so people can play in a group on their real neighborhoods maps what stimulate higher motivation for participation in climate change transformation. The residents play together and they are forced to co-operate. They will explore various choices available for their neighborhoods (from wide, but limited and detailed range of solutions connected with green and blue infrastructure, renewable resources, climate-friendly changes of colors of facades and roofs etc.) and consequences (costs, savings, climatic benefits). The workshop toolkit integrates best practices collected from communities that are already involved in climate change actions in Norway, Denmark, France or USA and which were visited by project’ leaders.

The pilot board games were played October-November 2023 in five neighbourhoods in Warsaw diversified in relation to exposure to urban heat island, flood risk etc., urban structure and socioeconomic factors. They were carefully chosen after consultations with Warsaw City Council out of the most active local communities and on city-owned land. City ownership is crucial because at the end of the game each of the community will be able to implement some solutions from the game up to the sum of c. 6800 € (30 000 PLN). The residents could eg plant the trees, sow a flower meadow, create bioswale trough or start a small orchard.

Co-Adapt game is completely new idea of ​​implementing science into the behavior of local communities in order to arouse their will to act together, to improve their living environment, to adapt to climate change and to mitigate this change.  


How to cite: Kuchcik, M., Cieszewska, A., Adamczyk-Jabłońska, J., Dudek-Klimiuk, J., Giedych, R., Klimaszewski, K., Łączyński, M., Maksymiuk, G., Pusłowska-Tyszewska, D., and Wałdykowski, P.: Serious game as a tool for understanding the need for adapting our neighbourhoods to climate change, EGU General Assembly 2024, Vienna, Austria, 14–19 Apr 2024, EGU24-3171, https://doi.org/10.5194/egusphere-egu24-3171, 2024.

EGU24-3181 | ECS | Posters on site | CL2.5

The cooling effect of a river as a contribution to climate change adaptation and resilience 

Kaja Czarnecka, Magdalena Kuchcik, and Agata Cieszewska

Due to climate change, adaptation strategies are being implemented all over the world, from the scale of the entire country to individual housing estates. The CoAdapt – Communities for Climate Change Action (NOR/IdeaLab/Co-Adapt/0002/2020-00) project documents the best nature-based solutions supporting adaptation to climate change and creates a database of good practices in neighbourhoods. One of the most effective examples is the use of blue infrastructure such as restoring rivers to the surface or thoughtful development of the immediate surroundings of the river. Therefore, to better understand the cooling effect of rivers, research was carried out in the Vistula River valley in Warsaw – the city where CoAdapt project was started. This study aims to investigate the differences in the thermal regime in the river valley and other parts of the city, and determine which elements of the immediate surroundings of the site impact the thermal environment the most.

The basis for the calculations was the air temperature sampled every 10 minutes by HOBO loggers at 2 m above the ground, collected in the years 2017-2022. The air temperature monitoring in the Vistula Valley was carried out on three stations: in the south and the downtown part on the left bank and the north on the right bank of the river. To present the thermal characteristics of the river and its cooling effect, these data were compared with the stations located in other parts of the city and characterized by different types of spatial development (e.g. Floor Area Ratio, Ratio of Biologically Vital Area, Sky View Factor). Moreover, based on 25 satellite thermal images from 2002-2018, the impact of the Vistula River on the incidence of the Cold Spot effect was analysed.

In this study, it was found that with increasing development density and a decrease in the share of biologically vital areas, the average daily air amplitude decreases. The northern and southern parts of the valley in Warsaw are characterized by similar thermal conditions. However, the middle one, located in the downtown area of the city, stands out significantly – it is warmer, and the Cold Spot effect occurs more often. Surrounded by highly heated artificial surfaces, the impact of the Vistula is more visible than in the case of green areas adjacent to the valley, although the range of impact is smaller due to the rapidly growing intensity of development in the city centre.

Getting acquainted with environmental data such as air and surface temperature and the good practices, then selecting diverse, effective methods based on blue and green infrastructure in neighbourhoods was one of the stages leading to the creation of the serious game – the main result of the CoAdapt project. Moreover, data related to the monitoring of the Vistula Valley were used to select neighbourhoods in Warsaw to conduct the CoAdapt workshops.

How to cite: Czarnecka, K., Kuchcik, M., and Cieszewska, A.: The cooling effect of a river as a contribution to climate change adaptation and resilience, EGU General Assembly 2024, Vienna, Austria, 14–19 Apr 2024, EGU24-3181, https://doi.org/10.5194/egusphere-egu24-3181, 2024.

Over the last decade, numerous urban canyon schemes have been developed, aiming to reproduce the interactions between the urban surface and the atmosphere. They have either used a bulk approach, where the general urban surface characteristics are modified, or a layered approach, in which single or multiple canyon levels are adopted, taking into account the contributions of individual urban facets: such as roofs, walls, and floors. Bulk schemes have often been the preferred approach in numerical weather prediction and climate models for their cost-efficient way of representing key atmosphere-canopy interactions and other important urban characteristics.
TERRA_URB is one of these bulk urban canopy models (UCM), originally developed for the COSMO atmospheric model. It has recently been integrated into the Icosahedral Non-hydrostatic Weather and Climate Model (ICON). In this study, we extended the preliminary implementation in ICON with the capability of representing morphological and material properties of the urban surfaces as spatially varying (instead of constant) fields in order to better represent the variability of energy, moisture, radiation, and momentum fluxes between the canopy and the atmosphere across a city. The spatially varying properties were derived from the Ecoclimap Second Generation (ECOCLIMAP-SG) land cover dataset, which is the latest version of ECOCLIMAP, incorporating local climate zones with a relatively high resolution of 300 meters. To assess the performance of ICON with TERRA_URB, we simulated the hot and dry summer period of mid-July to mid-August 2022 over the cities of Zurich and Basel in three configurations, (i) without TERRA_URB, (ii) with TERRA_URB in the preliminary and (iii) in the enhanced version. The three versions were compared against each other and evaluated against different types of observations, including standard weather stations, temperature sensor networks, and flux tower measurements.
Overall, our results reinforce the importance of incorporating accurate characterization of urban morphological and material properties into UCMs. Going forward, we will further improve these urban parameters by incorporating local datasets not accessible to a global product like ECOCLIMAP-SG. This will include, among others, detailed 3D building information, building material properties, surface reflectance (albedo) properties derived from remote sensing, and anthropogenic heat fluxes estimated from a detailed CO2 emission inventory. Our ultimate goal is to develop a comprehensive ICON-based urban modeling system that can be run with either a bulk UCM or the multilayer UCM BEP-Tree, previously developed in our group for COSMO. This novel modeling system will allow us to study the feedback between vegetation, carbon, energy, and water cycles in the urban environment.

How to cite: Dönmez, K., Emmenegger, L., and Brunner, D.: Urban Climate and CO2 Simulations with the New Atmospheric Model ICON-ART Accounting for Spatially Varying Urban Morphology and Material Properties, EGU General Assembly 2024, Vienna, Austria, 14–19 Apr 2024, EGU24-3375, https://doi.org/10.5194/egusphere-egu24-3375, 2024.

EGU24-3829 | ECS | Posters on site | CL2.5 | Highlight

Fast analysis of urban meteorological observations with the user-friendly MetObs-toolkit 

Thomas Vergauwen, Sara Top, Amber Jacobs, Andrei Covaci, Wout Dewettinck, Kobe Vandelanotte, Ian Hellebosch, and Steven Caluwaerts

Working with and analysing data from non-traditional measurement networks, such as urban climate networks, can be challenging and time consuming. After undertaking an observational campaign, researchers often face the issue of missing data due to technical problems such as power cuts or data communication issues. Additionally, data from low-cost networks or crowdsourced data need quality control to avoid the inclusion of measurement errors and biases, which often leads to additional gaps in the time series. Moreover, data storage formats and temporal measurement frequencies are often not consistent or synchronised when comparing data of different measurement networks. MetObs, an open-source Python toolkit, was developed to overcome these issues and fully exploits such valuable datasets. MetObs aims to provide a framework for the entire flow from raw sensor data to a dedicated analysis, with the possibility to apply it to various types of non-traditional networks without any formatting issues. To obtain a clean dataset, the time resolution is firstly resampled to the desired resolution, followed by identifying erroneous and missing records. Finally, missing records are filled in with the most suitable or preferred gap-filling method. Dedicated software for quality control, such as TITAN and CrowdQC+, already existed prior to the development of MetObs and are therefore implemented in the toolkit instead of being reinvented. The toolkit makes it moreover possible to generate analytics with the possibility to incorporate geographical data and create various graphics for the analysis of the meteorological measurements. MetObs was developed in such a way that people without a coding background can utilise it to get insight into their own meteorological measurements by following examples and using tutorials. At the same time, it allows more experienced data scientists to tweak the functionalities in such a way that the toolkit provides a pipeline for their dedicated use case.

How to cite: Vergauwen, T., Top, S., Jacobs, A., Covaci, A., Dewettinck, W., Vandelanotte, K., Hellebosch, I., and Caluwaerts, S.: Fast analysis of urban meteorological observations with the user-friendly MetObs-toolkit, EGU General Assembly 2024, Vienna, Austria, 14–19 Apr 2024, EGU24-3829, https://doi.org/10.5194/egusphere-egu24-3829, 2024.

The urban expansion-induced heat can exacerbate heat stress for urban dwellers, especially during heat waves. The urban parameterization within the Community Land Model version 5 (CLM5) was modified incorporating the local climate zones (LCZs) framework, named CLM5-LCZs, to simulate the urban climate of cities in eastern China. The results exhibited that daytime and nighttime canopy urban heat island intensity (CUHII) were highest in the Compact Low Rise (LCZ3) and the Compact High Rise (LCZ1) areas respectively, while surface urban heat island intensity (SUHII) peaked in the Large Low Rise (LCZ8) and the Compact High Rise (LCZ1) areas during daytime and nighttime respectively. Urban dwellers were easier exposed to serious heat environment in LCZ3 and LCZ1 areas over the north subtropical climate zone. Contrasts of CUHII and SUHII among different urban classes could exceed 1.7 °C and 5.4°C. The intra-urban heterogeneity may alter the dominant factors controlling SUHII, which were also modulated by local climate and HW intensity. Unlike other controlling factors, the impact of local climate on the contribution from the urban-rural contrast of convection efficiency was larger than urban features. Overall, CLM5-LCZs displayed potential of implementing detailed simulations for inter- and intra-city UHIs at a larger scale, and enhancing the capabilities in modelling urban climate and exploring the causes and controls of UHIs.

How to cite: Zhang, N.: Modeling Urban Climate  in East China with CLM5 coupling Local Climate Zone Schemes, EGU General Assembly 2024, Vienna, Austria, 14–19 Apr 2024, EGU24-4061, https://doi.org/10.5194/egusphere-egu24-4061, 2024.

EGU24-4377 | ECS | Orals | CL2.5

Detection of urban effects on precipitation in the Seoul metropolitan area, South Korea 

Seong-Ho Hong, Han-Gyul Jin, and Jong-Jin Baik

With growing urban population and expanding urban areas, the importance of understanding urban effects on precipitation keeps increasing. This study attempts to detect urban effects on precipitation in the Seoul Metropolitan Area (SMA), South Korea by analyzing hourly rain gauge data during 2005–2020. Precipitation events are categorized according to 850-hPa wind directions, and the precipitation increases from the upwind to downwind regions are examined for different duration and intensity classes of precipitation events. The downwind precipitation increase is largest in summer (39%), especially in August (64%). The August precipitation is analyzed in detail. Precipitation statistically significantly increases in Seoul for weak winds and 25–50 km downwind of the center of Seoul for westerly winds, and the precipitation increases are largest in the afternoon. For the precipitation increases, the increases in frequency and intensity of precipitation events are responsible. Short-duration and heavy precipitation events associated with small-sized precipitation systems initiated within the SMA are mainly responsible for the precipitation increases. The downwind precipitation increase also occurs for southwesterly, southerly, and southeasterly winds, but the increases are associated with large-sized precipitation systems.

How to cite: Hong, S.-H., Jin, H.-G., and Baik, J.-J.: Detection of urban effects on precipitation in the Seoul metropolitan area, South Korea, EGU General Assembly 2024, Vienna, Austria, 14–19 Apr 2024, EGU24-4377, https://doi.org/10.5194/egusphere-egu24-4377, 2024.

EGU24-4394 | Orals | CL2.5

Investigation of diurnal/nocturnal and seasonal effect of blue and green features on thermal exposure in Czech cities 

Michal Lehnert, Veronika Květoňová, Alena Koukalová, Martin Jurek, and Jan Geletič

Increasing intensity, frequency, and duration of hot extremes has been one of the most pronounced aspects of climate change in Central Europe. At the same time cities and towns, where the majority of the population live, are affected by added urban heat load. Such circumstances require effective adaptation of the municipalities to heat extremes. On that account, the influence of blue and green features and various surfaces on thermal exposure, represented by MRT and physiological indices of Universal Thermal Climate Index (UTCI) and Physiological Equivalent Temperature (PET), has been investigated over a period of five years in a set of short-term measurement campaigns in several Czech cities. The results showed that trees in open public areas of Czech cities lead to a substantial decrease of thermal exposure during the daytime whereas it might slightly increase on-site thermal exposure during the night. Maintained turfs in open areas characteristically reduce thermal exposure only slightly, depending on grass height and density and soil properties. Similarly, the cooling or warming effect of blue elements differs with their character. The effect of fountains and misting systems in open areas of thermal exposure is usually hardly detectable; however, ground-based fountains moisturising the pavement seem efficient. Further results from a recently launched measurement winter season campaign are expected soon. 

How to cite: Lehnert, M., Květoňová, V., Koukalová, A., Jurek, M., and Geletič, J.: Investigation of diurnal/nocturnal and seasonal effect of blue and green features on thermal exposure in Czech cities, EGU General Assembly 2024, Vienna, Austria, 14–19 Apr 2024, EGU24-4394, https://doi.org/10.5194/egusphere-egu24-4394, 2024.

EGU24-4737 | ECS | Orals | CL2.5

GreenRoofNet: Integrating High-Resolution Aerial Imagery with Deep Learning for Efficient Green Roof Monitoring 

Md Abdul Halim, Wenxi Liao, Imrul Kayes, Jennifer Drake, Liat Margolis, Debra Wunch, and Sean Thomas

Background: Urban environments are increasingly recognized as both significant contributors to and primary victims of climate change. Buildings in urban settings are responsible for approximately 33% of global greenhouse gas emissions, while cities themselves are often situated on fertile land with high carbon sequestration potential. To mitigate these impacts on climate, adopting nature-based sustainable technologies is essential for developing climate-smart cities. Among these, green roofs have emerged as a critical solution for climate change mitigation.

Significance of Green Roofs: Originally designed for stormwater management, green roofs have demonstrated effectiveness in various environmental aspects. They mitigate urban heat island effects, reduce sound and air pollution, lower building energy consumption, enhance biodiversity, and have the potential for carbon sequestration. Recognizing these benefits, Toronto implemented a by-law in 2009 mandating green roofs on all new large buildings with flat roofs larger than 2,000 m², complemented by incentives for the private sector. Despite the increase in green roof installations, there is a lack of efficient monitoring, leading to concerns about maintenance and compliance.

Challenges in Monitoring: The absence of an efficient green-roof monitoring system is a widespread problem. Traditional monitoring techniques face limitations, including on-site inspections and satellite imagery analysis. High-resolution satellite data are costly, while freely available images (e.g., from Landsat) lack the necessary resolution for small-scale green roof analysis. This gap highlights the need for an efficient, automated, and accurate green roof monitoring system.

Methods: To address this need, we developed an automated, deep-learning-based toolbox (GreenRoofNet) for monitoring green roofs using high-resolution (8 cm) orthoimages collected by the City of Toronto for other purposes. We segmented these images into 299x299 pixel tiles with a 20% overlap to ensure comprehensive coverage, particularly of smaller green roofs. Using 500 labeled images for training and validation, and the remainder for testing, we employed the Inception v4 architecture in TensorFlow. This deep convolutional network model was selected for its ability to extract detailed features crucial for accurate green roof detection. The model training involved a cross-entropy loss function, an Adam optimizer, and a dynamic learning rate, with a 50-epoch limit and early stopping to prevent overfitting. Post-processing of tiles was conducted using maximum confidence scores to amalgamate overlapping detections.

Results and Implications: The model has successfully identified green roofs with approximately 95% accuracy and detected their boundaries with about 90% precision. Preliminary analysis reveals that a segment of Toronto's green roofs is undergoing degradation, whereas a substantial proportion remains in good condition, with a smaller segment being currently undetectable or missing. Further testing is underway, with plans to package the results of this project in a web application featuring an open-source map. This tool will play a pivotal role in assessing the effectiveness of the green roof by-law, aiding in the verification of subsidies, guiding the maintenance of green roofs, and facilitating the estimation of their environmental benefits.

How to cite: Halim, M. A., Liao, W., Kayes, I., Drake, J., Margolis, L., Wunch, D., and Thomas, S.: GreenRoofNet: Integrating High-Resolution Aerial Imagery with Deep Learning for Efficient Green Roof Monitoring, EGU General Assembly 2024, Vienna, Austria, 14–19 Apr 2024, EGU24-4737, https://doi.org/10.5194/egusphere-egu24-4737, 2024.

EGU24-5058 | Posters on site | CL2.5

The development of the Koreans’ climatic index for tourism (KCIT) 

Sookuk Park, Sangman Jo, Yuri Choi, and Jeonghyeon Moon

To develop the Koreans’ climatic index for tourism (KCIT) in the four tourism and recreation types (cultural tourism, beach walking, Oreum/light climbing, and Olle/tracking), this study conducted comprehensive microclimatic data collection and surveys throughout the four seasons of 2022-2023 in Jeju, Republic of Korea. The research involved expert opinions and insights from 26 experts and 1,860 tourists in cultural tourism, 15 and 511 in beach walking, 28 and 603 in Oreum, and 14 and 234 in Olle. The collected microclimatic data included air temperature, relative humidity, wind speed, and shortwave and longwave radiation, concurrently gathered with tourist surveys. The KCIT comprises 7 scales, ranging from very poor to ideal, and is composed of three critical aspects: thermal, aesthetic, and physical. The thermal aspect analyzed human thermal sensation across 9 ASHRAE scales, from very hot to very cold, utilizing physiological equivalent temperature. It revealed that a consistent optimal range was from neutral to slightly cool across the four tourism and recreation types. The possible range of all tourism and recreation was from hot to cold, and the difficult range was very hot and very cold. The aesthetic aspect evaluated cloud cover, establishing an optimal range of clear or less cloudy conditions (30-50%) for all tourism and recreation types, while beach walking displayed a preference for clearer skies. Wind speed, a physical aspect, indicated an optimal range of a gentle breeze, 1.4-3.4 ms-1, with variations observed across tourism and recreation types. The possible range was from 0 to 7.5 ms-1 in cultural tourism and from 0 to 5.5 ms-1 in the others. The difficult range was from 7.5 ms-1 in cultural tourism and 5.6 ms-1 in the others. Precipitation, another physical aspect, revealed optimal, possible, and difficult ranges of 0 mmhr-1, 0.1-5.0 mmhr-1, and more than 5.1 mmhr-1, respectively. The study highlights the versatility of the KCIT scale, offering a user-friendly tool for tourists and tour companies. Additionally, it presents valuable insights for local governments in shaping future tourism plans. This ongoing research is set to continue exploring other tourism and recreation aspects in 2024.

How to cite: Park, S., Jo, S., Choi, Y., and Moon, J.: The development of the Koreans’ climatic index for tourism (KCIT), EGU General Assembly 2024, Vienna, Austria, 14–19 Apr 2024, EGU24-5058, https://doi.org/10.5194/egusphere-egu24-5058, 2024.

EGU24-5096 | ECS | Orals | CL2.5

Which dataset should be used to get building footprint and height worldwide ? 

Jérémy Bernard, Jean Wurtz, Valéry Masson, and Erwan Bocher

The building size and distribution has a big impact on atmospheric properties such as wind speed, air temperature, air pollution, etc. This impact may be quite different depending on the lattitude and the climate where a city is located. Nowadays, climate simulations performed over city territories consider average building properties (building height, distance between buildings, etc.) over one to several hundred meters grid cells. However, it is difficult to find a homogeneous building dataset that would be used over the world to observe the effect of a same building organisation between two regions of the world located at a different lattitude or in a different climate zone.

This work is dedicated to the evaluation of several building datasets (OpenStreetMap, BING, Global Human Settlement, etc.) that are available over several continents. The building footprint and height of each dataset are compared to local reference data for different parts of the world. The objective is to identify which dataset would be preferable to use depending on its quality and availability.

How to cite: Bernard, J., Wurtz, J., Masson, V., and Bocher, E.: Which dataset should be used to get building footprint and height worldwide ?, EGU General Assembly 2024, Vienna, Austria, 14–19 Apr 2024, EGU24-5096, https://doi.org/10.5194/egusphere-egu24-5096, 2024.

EGU24-5167 | ECS | Posters on site | CL2.5

Assessment of the optimal initial and boundary conditions for the LES-based model PALM 

Jelena Radovic, Michal Belda, Jaroslav Resler, Kryštof Eben, Martin Bureš, Jan Geletič, Pavel Krč, Hynek Řezíček, and Vladimír Fuka

Proper assessment of urban atmosphere and climate by physics-based Computational Fluid Dynamic (CFD) models has been a pressing topic in the urban modeling community. Due to the ever-increasing number of city dwellers, continuous urbanization, and consequent modification of the urban atmosphere, this topic is and will remain popular in the future. The most advanced microscale models widely used for urban boundary layer studies, typically based on the Large Eddy Simulation (LES) principle, are currently the ones whose higher accuracy and ability to capture physical processes in the urban atmosphere have been well-validated. However, to fully assess their reliability, the necessity of testing the influence of the initial and boundary conditions (IBC) on the model outputs is a crucial issue that needs to be addressed.
Four different three-day episodes throughout the year 2019 have been modeled using the PALM model system for experiment purposes. Two of the episodes encompass extreme weather events (e.i., a heatwave and a bad air quality period), and the other two episodes are chosen to represent non-extreme and usual weather conditions. In this experiment, an ensemble of 16 different WRF model realizations differing in parameterization setup is created and it serves as a source of IBC for the PALM model simulations. Firstly, a method for optimal WRF ensemble member selection has been developed, based on which subgroup of the ensemble members has been selected for driving the microscale model. The microscale model 8 x 8 km simulation domain is located in the realistic urban area in the city of Prague,  its horizontal resolution is 10m. Altogether, 14 simulations have been performed with identical configurations except for the driving conditions. The PALM model outputs have been evaluated against radio-soundings, and compared to the WRF model driving conditions, both quantitatively and qualitatively. 
This study shows that PALM model outputs are largely influenced by the imposed driving conditions and that the majority of errors originate from the mesoscale model, and propagate into the microscale simulation. The sensitivity of the microscale model on different IBCs is significant, but the PALM model is capable of attenuating the errors coming from the WRF model. Finally, the experiment stresses the importance of high-quality driving data and shows the complexity of the process of acquiring such data.

How to cite: Radovic, J., Belda, M., Resler, J., Eben, K., Bureš, M., Geletič, J., Krč, P., Řezíček, H., and Fuka, V.: Assessment of the optimal initial and boundary conditions for the LES-based model PALM, EGU General Assembly 2024, Vienna, Austria, 14–19 Apr 2024, EGU24-5167, https://doi.org/10.5194/egusphere-egu24-5167, 2024.

This study investigates the interactions between urban heat islands (UHIs) and heat waves in Seoul, South Korea, using 25-year (1997–2021) observations. Under heat waves, South Korea is under strong influence of an anomalous 500-hPa anticyclonic high and the expanded Tibetan high. The urban heat island intensity (UHII) calculated as the difference between the urban-station average and rural-station average of the daily minimum (maximum) 2-m temperature increases by 0.53 °C (0.20 °C) under heat waves, indicating synergistic interactions in both nighttime and daytime. UHII substantially varies within heat waves. UHII tends to increase under stronger heat waves and has statistically significant negative correlation with relative humidity and cloud fraction. Among heat wave days, strong (weak) UHI days with UHII larger (smaller) than its 90th (10th) percentile are selected, and these days well represent positive (negative) interaction cases. The strong UHI days exhibit relatively hot, calm, dry, and clear weather conditions with relatively strong subsidence compared to the weak UHI days. The dominant synoptic patterns on the strong and weak UHI days are the Pacific-Japan (PJ) pattern and the expanded western North Pacific subtropical high (WNPSH), respectively. The strong UHI days are frequent in recent years.

How to cite: Park, K., Jin, H.-G., and Baik, J.-J.: Contrasting interactions between urban heat islands and heat waves in Seoul, South Korea, and their associations with synoptic patterns, EGU General Assembly 2024, Vienna, Austria, 14–19 Apr 2024, EGU24-5568, https://doi.org/10.5194/egusphere-egu24-5568, 2024.

EGU24-6178 | ECS | Orals | CL2.5

Sensitivity of the high-resolution regional climate model AROME to urban sprawl over Paris region 

Léa Corneille, Aude Lemonsu, Tiago Machado, and Vincent Viguié

Cities, as cradles of population and economic activities, constitute a crucial issue in the current environmental challenges. Their organisation is enduring major changes and the issues surrounding spatial planning are of growing interest in a context of climate change, since cities are particularly vulnerable to extreme events.

The evaluation of the climate change impacts requires to refine the climate projections provided by global and regional climate models down to a finer spatial scale more adapted to the city study. Besides their fine resolution, these models may include a dedicated surface model to represent explicitly the urban areas and the physical processes involved.

The CP-RCM (Convection-Permitting Regional Climate Model) AROME is coupled to the TEB urban canopy model with an horizontal resolution of 2.5 km, and uses the ECOCLIMAP land use and land cover database to characterise the surface properties. It is applied over the Paris region for a past period, forced by the ERA5 reanalysis, in order to assess local impacts of climate change.

Nonetheless, the land use map, used by the CP-RCM AROME and based on data from the 1990s without evolution in time, can be a limit to the realism of climate simulations. The expansion incurred by cities until the current period is not represented, nor the future dynamics. 

This study compares different climate simulations run with past, present and future land use maps over Paris region with the aim to quantify and analyse the impact of land use changes on the regional climate, as well as to explore the consequences in terms of population exposure to high heat conditions.

How to cite: Corneille, L., Lemonsu, A., Machado, T., and Viguié, V.: Sensitivity of the high-resolution regional climate model AROME to urban sprawl over Paris region, EGU General Assembly 2024, Vienna, Austria, 14–19 Apr 2024, EGU24-6178, https://doi.org/10.5194/egusphere-egu24-6178, 2024.

EGU24-6183 | ECS | Orals | CL2.5

Explicit representation of cities in the ORCHIDEE land surface model 

Morgane Lalonde, Ludovic Oudin, Agnès Ducharne, Sophie Bastin, and Pedro Arboleda-Obando

Cities alter the interactions between the surface and the atmosphere by modifying energy and water budgets. This is caused by the low albedo of urban environments, its high thermal conductivity, the increased surface roughness, and by greater surface imperviousness. Since the beginning of the 21st century, advances in high-performance computing allowed steady refinement of the numerical grids of climate models at the kilometer scale. At this resolution, representing the urban environment explicitly is necessary, as simplifying it to bare soil no longer suffices for accurate energy and water budget assessments and satisfies e.g. the representation of heat waves or urban runoff. In the ORCHIDEE model of the IPSL, cities are currently represented as bare soil, which fails to account for specific urban processes. To enhance ORCHIDEE's performance and study the impacts of specific urban processes on energy and water fluxes, an urban land cover was added to the existing land cover classes taken into account by the model. For this urban class, we prescribed specific parameters for soil imperviousness (though hydraulic conductivity), surface roughness, albedo, and thermal conductivity. All those parameters are cell-dependent, i.e. they account for the diversity of urban environments and cities as characterized by the WUDAPT database (Ching et al., 2018). By comparing model simulations with and without the urban module, we assess the sensitivity of simulated turbulent fluxes, infiltration, soil moisture, runoff, drainage, temperature, and compare them to available observations over France.

How to cite: Lalonde, M., Oudin, L., Ducharne, A., Bastin, S., and Arboleda-Obando, P.: Explicit representation of cities in the ORCHIDEE land surface model, EGU General Assembly 2024, Vienna, Austria, 14–19 Apr 2024, EGU24-6183, https://doi.org/10.5194/egusphere-egu24-6183, 2024.

Urban Heat Islands (UHIs) represent a climatic consequence of urbanization, leading to elevated temperatures within cities compared to surrounding rural and suburban areas. Addressing this human-induced phenomenon demands effective mitigation strategies. This study quantifies the UHI in the Kansas City Metropolitan Areas (KCMA) in the United States and investigates the potential of albedo modification, particularly through the cool roof implementation, as a means to mitigate UHI effects within the KCMA.

Utilizing the Weather Research and Forecasting (WRF) model, we first designed a suite of high-resolution simulations, examined UHI dynamics during a heatwave event across various scenarios within the KCMA, and determined the effectiveness of mitigation strategies in reducing temperatures within the KCMA. Specifically, we simulated two cool roof scenarios: one representing "newly installed" cool roofs with an albedo of 0.8 and another reflecting "aged" cool roofs with an albedo of 0.5. Our findings reveal that cool roof materials significantly mitigated surface UHI effects during evenings, delaying the onset of UHI effects until later in the day. Moreover, our study showcases the more profound impact of cool roofs on surface skin temperature, influencing the surface energy balance by altering sensible and ground storage heat fluxes and the planetary boundary layer.

Leveraging numerical modeling, we led and launched an Urban Heat Island Mapping Campaign in Kansas City. It is a volunteer-based community citizen science field campaign that builds upon local partnerships among academia, local government agencies, non-profits, and private sectors. This campaign engages Kansas City's local residents in a scientific study to map and understand how heat is distributed in the communities and the factors affecting the uneven distribution of heat. It raises awareness about the adverse impacts of extreme heat and excessive urban heat and presents actionable measures for urban planners and policymakers to address heat-related challenges in metropolitan areas.

How to cite: Sun, F.: Urban Heat and Mitigation Potential in the Kansas City Metropolitan Area: Insights from Integrated Numerical Modeling and Heat Mapping, EGU General Assembly 2024, Vienna, Austria, 14–19 Apr 2024, EGU24-6510, https://doi.org/10.5194/egusphere-egu24-6510, 2024.

EGU24-6559 | Posters virtual | CL2.5

Compound hot extremes at an urban site based on climatic and bioclimatic indices  

Dimitra Founda, Fragiskos Pierros, and George Katavoutas

Over the past decades, extreme weather phenomena like hot extremes and heat waves (HWs) stand out as a major threat for humans and ecosystems. Compound extremes are understood as simultaneous, concurrent or sequential extreme events, taking place at a single or different locations. Compound extreme events may exacerbate the risk and increase associated adverse impacts, compared to individual events.

In the study, we examined the occurrence of compound hot extremes at an urban site of the eastern Mediterranean over a century-long period, using the historical climatic records of the National Observatory of Athens (NOA, 1897-2023). Compound hot extremes are defined as concurrent daytime and nighttime hot extremes, namely cases when both, daily maximum (Tmax) and daily minimum (Tmin) air temperatures are above a predefined threshold value. The threshold values for Tmax and Tmin were set equal to 36.7 oC and 25.9 oC respectively, corresponding to the 90th percentile of the summer Tmax and Tmin distributions at NOA, over the reference period 1981-2010. Likewise, we examined compound heat waves, defined as sequences of at least 3 consecutive days when both Tmax and Tmin exceed the predefined thresholds. Analysis has shown that 60% of the total number of compound hot extremes and compound heat waves in Athens (NOA) was observed from 2000 onwards. Besides, 57% of the daytime HWs over the whole study period constitute also compound HWs, while this percentage increases to 72% after the 2000s, indicating an increase in nighttime HWs, very likely related to the urban heat island effect. 

In addition to the hot extremes based on air temperature, we have also estimated compound daytime and nighttime extremes related to human thermal comfort, using the bioclimatic index UTCI (Universal Thermal Climate Index), accounting also for relative humidity, solar radiation and wind speed conditions. Compound hot extremes based on UTCI were defined as the cases when the daily maximum UTCI value  was above the index threshold indicating ‘at least very strong heat stress’ (UTCI > 38), and simultaneously, the daily minimum UTCI value was above the index threshold indicating ‘at least moderate heat stress’ conditions (UTCI > 26). The analysis detected 45 compound hot extremes based on UTCI from 1960-2023, with 34 of them occurring after the 2000s, suggesting a dramatic increase in the frequency of cases with heat-related thermal discomfort throughout the whole day and night.  The higher frequency of compound hot events was observed during the extreme years 2007, 2021 and 2023.


How to cite: Founda, D., Pierros, F., and Katavoutas, G.: Compound hot extremes at an urban site based on climatic and bioclimatic indices , EGU General Assembly 2024, Vienna, Austria, 14–19 Apr 2024, EGU24-6559, https://doi.org/10.5194/egusphere-egu24-6559, 2024.

EGU24-6988 | ECS | Posters on site | CL2.5

Synergistic effects between urban heat island and heat waves in China 

Zitong Shi

Under the background of climate change and fast urbanization, climate extremes such as heat waves tend to be more frequent, more severe, and longer-lasting. Cities face a greater risk of heat waves due to population growth, industry concentration, and the superposition of their unique climate effects. Quantitative analysis of the combined effects of regional-scale heat waves and local-scale urban heat islands is important for urban adaptation to climate change and for urban disaster prevention and mitigation. On one hand, urban expansion, causing reduced evapotranspiration and weakened wind speed that normally cools the lower atmosphere by turbulent heat loss and cooled air advection, led to magnified heat extremes. On the other hand, synergistic effects between urban heat island and heat waves were found in most cities in China. Given this synergistic interaction between urban heat islands and heat waves, collaborative efforts will be necessary to implement climate adaptation and mitigation strategies aimed at reducing the serious heat-related health risks faced by urban residents.

How to cite: Shi, Z.: Synergistic effects between urban heat island and heat waves in China, EGU General Assembly 2024, Vienna, Austria, 14–19 Apr 2024, EGU24-6988, https://doi.org/10.5194/egusphere-egu24-6988, 2024.

EGU24-7058 | ECS | Orals | CL2.5

Assessing urban heat mitigation strategies in Singapore with a Digital Urban Climate Twin (DUCT) 

Minn Lin Wong, Ander Zozaya, and Kristina Orehounig

Addressing the urban heat island effect requires informed and strategic planning of measures to mitigate urban heating. This is particularly important for highly urbanized and densely populated cities in the tropics, such as Singapore, which experience high levels of thermal discomfort due to urban heat island effect, and is further intensified by global warming. To assess the impact and effectiveness of different heat mitigation measures, we utilize a Digital Urban Climate Twin (DUCT) model of Singapore. The DUCT integrates the Weather and Research Forecasting model and Building Energy Model (WRF/BEM), with an added modification to account for near-surface anthropogenic heat sources such as power plants and traffic emissions. Next to these models the DUCT also integrates various data sources such as weather conditions, landcover, buildings, traffic etc. to describe the thermal behaviour of the city.

In this study, we use the DUCT to conduct a comprehensive testing of the sensitivity of urban temperatures to various heat mitigation measures such as increasing urban greenery, changing urban morphology and improvements in building efficiencies and traffic. Preliminary results indicate that designating forest land use and incorporating green areas are the most effective in reducing local and surrounding temperatures. This is followed by increasing the urban vegetation fraction in the pre-existing urban landscape, increase in electric vehicle usage, and improvements in building energy efficiencies, which show a more limited impact on temperatures. This work aims to highlight the capabilities of the DUCT as a versatile tool for planning agencies and policy makers to test the effectiveness of various policies and guide strategic planning for the management of urban heat.

How to cite: Wong, M. L., Zozaya, A., and Orehounig, K.: Assessing urban heat mitigation strategies in Singapore with a Digital Urban Climate Twin (DUCT), EGU General Assembly 2024, Vienna, Austria, 14–19 Apr 2024, EGU24-7058, https://doi.org/10.5194/egusphere-egu24-7058, 2024.

Increasing human activities and urbanization have posed huge challenges to the urban climate, such as the urban heat island effect, which makes air temperature in urban areas higher than that in suburban areas. Meanwhile, the urban heat island intensity (UHII) suffers impacts from the exacerbation of observed extreme heat events, but how extreme heat events affect UHII in different subdivided urban spaces remains unclear. In this paper, we attempt to address the impact of extreme heat days and nights on urban heat environment from the perspective of local climate zones (LCZs). Firstly, we propose a framework for LCZ classification for higher precision LCZ mapping over the Guanzhong Plain urban agglomeration in China. Secondly, to select extreme heat days and nights based on six extreme temperature indices (TXx, TNx, TX90p, TN90p, SU25 and TR20), the daily maximum, minimum and average seamless 1-km air temperatures are estimated using the random forest method for the period from 2000 to 2020. Finally, combining the LCZ map and gridded temperature product, we analyze variance in air temperature and UHII among different LCZs at daytime and nighttime, as well as the influence of extreme heat conditions on air temperature and UHII in different LCZs.

Our results indicate that the air temperature difference within LCZs is greater under extreme heat conditions compared against that under non-extreme conditions. Meanwhile, extreme heat conditions aggravate the urban heat risks at daytime, which is manifested in the following two aspects: (1) the temperature difference within LCZs on extreme heat days is greater than that on extreme heat nights; and (2) UHII at nighttime is stronger than that at daytime in most LCZs under non-extreme conditions, but under extreme heat conditions, it is the opposite. In addition, although the rank of UHII in different LCZs varies due to differences in time and definition of extreme heat days and nights, LCZ 6a (agricultural greenhouse) stands out for suffering the highest UHII under all conditions (different extreme temperature indices, on days and nights), to which particular attention should be paid. Our results could be contributed to conducting mitigation measures of urban heat risks and providing more explicit guidance to policymakers and urban planners.

How to cite: Wang, B., Gao, M., and Li, Z.: Impacts of extreme heat days and nights on urban heat environment: a perspective of local climate zones, EGU General Assembly 2024, Vienna, Austria, 14–19 Apr 2024, EGU24-7102, https://doi.org/10.5194/egusphere-egu24-7102, 2024.

EGU24-7195 | ECS | Orals | CL2.5 | Highlight

Urban heat trends across global cities 

Marzie Naserikia, Melissa Hart, Negin Nazarian, Panagiotis Sismanidis, Jonas Kittner, and Benjamin Bechtel

Urban heat is characterised by elevated temperatures in cities, resulting not only from global climate change but also from urban development and human activities. Previous research on urban heat has predominantly relied on satellite-derived land surface temperature (LST) data to investigate the changes in near-surface thermal environments. However, the applicability of LST for examining the temporal variation of air temperature is still not well understood. Using crowdsourced air temperature observations and satellite imagery, we explore the temporal variation of air temperature and its relationship with LST in more than 50 populated cities worldwide. Results show that city-average air temperature values are highly correlated with LST. However, the intensity of this correlation differs by season, day/night cycle, and is further influenced by background climate. Using satellite LST data, we expanded our analysis to include over 1500 urban areas and evaluated temperature changes in the past two decades. We observed a general trend of increasing temperatures in cities globally, although the rates of warming vary. The highest rate of temperature change was found in cold climate cities, with a more rapid increase during winter days. These cities are predominantly located in Eastern Europe, extending into parts of Western Asia. These findings provide new insights into the application of satellite-based LST for predicting future air temperature changes and identifying areas most vulnerable to urban overheating.

How to cite: Naserikia, M., Hart, M., Nazarian, N., Sismanidis, P., Kittner, J., and Bechtel, B.: Urban heat trends across global cities, EGU General Assembly 2024, Vienna, Austria, 14–19 Apr 2024, EGU24-7195, https://doi.org/10.5194/egusphere-egu24-7195, 2024.

EGU24-8061 | ECS | Orals | CL2.5

Urban canopy parameters and local climate zones over Europe using OpenStreetMap data 

Jean Wurtz, Jeremy Bernard, Valery Masson, and Bocher Erwan

Climate modelling needs to have accurate informations about topography, type of land and land-use, size and type of wind or radiative obstacles such as trees or buildings. Explicits climate models solves heat and mass equations for each individual surfaces but they cannot be applied at regional scale for long time periods due to computational limitations. Parameterized climate models can overpass this limitations considering that within a given grid cell (being from one to several hundred meters wide), the obstacles and lands follow a given setting (e.g. street canyon for cities, with or without a garden). The heat and mass balances are applied for each of the grid cells using urban canopy parameters summarizing the main relevant parameters describing an area (e.g. mean building height, canyon aspect ratio, building fraction, fraction of road, building type and use, etc.). However, there is currently no datasets over Europe that would accurately describe all these informations.

OpenStreetMap (OSM) is a free, open geographic database updated and maintained by a community of volunteers via open collaboration. It contains most of the informations needed by climate models. It can cover any part of the world and is particularly well fullfilled for the European continent. One of its limitation is the lack of building height information. GeoClimate is a tool that calculates urban canopy and land cover parameters as well as Local Climate Zones (LCZ). GeoClimate uses vector data such as the ones available through the OSM project and uses machine learning algorithm to estimate the height of building missing such information. GeoClimate has recently used the OSM data to calculate the needed informations needed by parameterized climate models such as SURFEX-MesoNH or WRF over Europe. The presentation will describe the way GeoClimate works and will show some of the results of the resulting dataset.

How to cite: Wurtz, J., Bernard, J., Masson, V., and Erwan, B.: Urban canopy parameters and local climate zones over Europe using OpenStreetMap data, EGU General Assembly 2024, Vienna, Austria, 14–19 Apr 2024, EGU24-8061, https://doi.org/10.5194/egusphere-egu24-8061, 2024.

EGU24-8258 | ECS | Posters on site | CL2.5

Assessing different urban heat metrics in varied settlements and their relation to thermal comfort 

Svea Krikau, Iris Otto, Natalie Scheck, and Susanne Benz

Rising temperatures, resulting in prolonged heat waves and increased occurrences of tropical nights, present a risk to both morbidity and mortality rates. Urban populations are particularly vulnerable due to the additional elevation of temperatures within urban areas compared to the rural surroundings, commonly known as the "urban heat island effect". For the identification of heat exposure air temperature (Ta) at a high spatial scale is a preferred metric, however due to the scarcity of official measurement stations land surfaces temperature (LST) measurements are often used as a substitute. In addition, most studies focus only on densely populated urban areas, neglecting smaller settlements in a rural environment.
Here we show the differences in LST and air temperature extremes at nighttime for the state of Hesse, Germany. This involves comparing various temporal aggregates (such as 90th percentile and mean) and diverse urban heat metrics (including absolute temperatures and rural-urban temperature differences). We furthermore focus on small towns (5000 to under 20000 residents), medium-sized cities (20000 to under 100000 residents) and large urban metropolises (over 100000 residents) separately, taking into account the distinct relations to land cover/land use characteristics (indicated by Local Climate Zones) of the individual urban heat metrics. To gain insights into how these different temperature parameters (as well as daytime LST) relate to human-perceived comfort the Thermal Comfort Index 'Physiological Equivalent Temperature' (PET) is included as a metric.

How to cite: Krikau, S., Otto, I., Scheck, N., and Benz, S.: Assessing different urban heat metrics in varied settlements and their relation to thermal comfort, EGU General Assembly 2024, Vienna, Austria, 14–19 Apr 2024, EGU24-8258, https://doi.org/10.5194/egusphere-egu24-8258, 2024.

EGU24-8402 | ECS | Orals | CL2.5

Urban Hydrometeorology: an overview and bibliometric analysis of published research 

Dragan Milošević, Ryan Teuling, Spyros Paparrizos, and Gert-Jan Steeneveld

Urban hydrometeorological (UHM) research is important for managing the challenges that arise from the complex interactions between climate change, meteorological processes and the water cycle in urban environments. It provides valuable insights for sustainable urban development, infrastructure planning, climate change adaptation, public health and improving the overall resilience of cities to weather, water and climate-related challenges. This bibliometric research analyses published literature on the research topic of UHM. In total, 507 studies were assessed in the period 1975-2023 based on the Web of Science database, covering almost half of the century of UHM research. Three subperiods with different publication trends were noticed. The first publication subperiod is the longest (1975-2020), but with the fewest publications (45), while the second subperiod is substantially shorter (2011-2017), but with a significant increase in the number of publications (122). The third subperiod is the shortest, i.e., from 2018 to 2023, and it is characterized by further substantial increase in the number of publications (340); although the shortest, the third subperiod contains 67% of published UHM studies, thus showing the increased interest in this research topic during the recent years. Furthermore, majority of UHM studies were published in the research fields of: 1) Environmental Sciences (175 studies), 2) Water Resources (165 studies); and 3) Meteorology and Atmospheric Sciences (150 studies). Countries/regions leading the way in UHM research and publishing are the USA, China and England, while there is a noticeable lack of UHM studies from Global South. Regarding sustainable development, UHM studies mostly contributed to the research on SDG 13 (Climate Action), SDG 6 (Clean Water and Sanitation) and SDG 11 (Sustainable Cities and Communities). The keyword analysis further revealed the changes in the main research themes during the last decades of the 20th century and the first decades of the 21st century. This study can be beneficial for those interested in acquiring more knowledge about UHM research and its application.

How to cite: Milošević, D., Teuling, R., Paparrizos, S., and Steeneveld, G.-J.: Urban Hydrometeorology: an overview and bibliometric analysis of published research, EGU General Assembly 2024, Vienna, Austria, 14–19 Apr 2024, EGU24-8402, https://doi.org/10.5194/egusphere-egu24-8402, 2024.

EGU24-8483 | Orals | CL2.5

Use of urban climate recommendation maps for heat action plans 

Janalisa Hahne, Lutz Katzschner, and Sebastian Kupski

Cities worldwide are in the phase of either acknowleding the need for heat action plans or are already in the phase of improving their existing plans. Due to bad ventilation conditions heat plays a major role in city dwellers‘ life. Heat actions plans are therefore a strongly advised intrument by many experts. Main tools are urban climatic maps (UCM) and their recommendation plans.

This article is about the methods during the development phase of heat action plans with a focus on urban climatology. We suggest to use urban climate maps and recommendation maps under the framework of VDI Guidelines „urban climate and planning“ to locate areas, institutions and livinghoods facing heat and to develop recommendations to decrease vulnerability.

With the example of a small city in Western Germany the methodology is shown. Based on urban climate map and recommendation map those loactions were identified which are moderately hot or show inconvenient ventilation conditions. Together with demographic statistics (age), vunerable groups were identified: Children under 6 years and people over 65 years. Further, we analysed the location of institutions which become frequently visited by vulnerable people: i.e. kindergartens, schools, care institituions for older people. We added urban green infrastructure (UGI) as places for recreation during heat phases.

WIth the help of geoinformation services (GIS) we were able to combine the different information from UCM, recommendation map, UGI, demographic statistics and the location of the „sensitive institutions“ to find spots most attractive for recreation as well as spots less attractive or even dangerous in terms of health during heat. This technique gives valuable and localised information for developing heat action plans.

How to cite: Hahne, J., Katzschner, L., and Kupski, S.: Use of urban climate recommendation maps for heat action plans, EGU General Assembly 2024, Vienna, Austria, 14–19 Apr 2024, EGU24-8483, https://doi.org/10.5194/egusphere-egu24-8483, 2024.

EGU24-8755 | ECS | Orals | CL2.5

Microclimatic effects of idealized urban planning projects on their surrounding area 

Martin Schneider, Tanja Tötzer, and Marianne Bügelmayer-Blaschek

Over the past years, microclimate simulations and analyses became an important tool for the impact assessment of different planning scenarios of real estate projects on a local site. Based on the results of evaluated scenarios, the need for (additional) climate adaptation measures can be identified and improved design concepts might be realized. While this process led to several positive developments and best practice examples, the impact of a building project on the microclimate of the surrounding areas in spatial proximity to the development area is often still neglected. Especially if formerly green areas are sealed, cold-air production areas are lost, or cold-air corridors blocked. Even positively assessed microclimate studies for the local site itself, can have a negative effect on the microclimate of the surrounding area. While large urban planning projects (e.g., area size > 15 ha) in Austria require environmental impact assessments, policy makers and administrative units lack objective criteria to request spatially extended microclimate analyses for medium sized projects that not only affect the development area but also the neighbouring quarters.

In the prevalent research project, “Development of a criteria catalogue for requiring extended microclimate analyses”, funded by the Climate and Energy Fund and carried out under the program "Austrian Climate Research Programme Implementation", potential microclimatic impact of urban planning projects on their surroundings during autochthonous weather conditions in summer is evaluated through sensitivity experiments with the urban climate model PALM-4U. Based on the concept of Local Climate Zones (LCZ), idealized real estate projects are set up in two locations (inner city and periphery) of the city of Linz (Austria). For each location, the following selected characteristics of static input data are varied: (1) size of building site, (2) building footprint, (3) building height, and (4) degree of soil sealing. By comparing simulation results to the reference scenario of an unsealed, green area, the potential impact in terms of intensity and spatial range is assessed.

Results of the sensitivity experiments are used to compile a compact set of criteria, which allows policy makers and administrative units to request spatially extended microclimate analyses to evaluate effects of medium sized urban planning projects on the district-wide microclimate if impacts are expected.

How to cite: Schneider, M., Tötzer, T., and Bügelmayer-Blaschek, M.: Microclimatic effects of idealized urban planning projects on their surrounding area, EGU General Assembly 2024, Vienna, Austria, 14–19 Apr 2024, EGU24-8755, https://doi.org/10.5194/egusphere-egu24-8755, 2024.

Radiative cooling (RC) materials gained interest over the past decades, as these can help mitigating the urban heat island effect, fighting climate change and reducing the cooling demand for buildings. Their altered photonic properties, albedo and emissivity, enable these materials to cool down below ambient temperature and radiate heat in the atmospheric spectral window (8-13 µm), effectively releasing heat into space. Current RC materials typically consist of thin layers of metal and polymer, manufactured through energy-intensive and costly manufacturing processes. The Horizon 2020 project ‘MIRACLE’ is developing a new innovative radiative cooling material, that for the first time, is based on conventional concrete.

This study quantifies the effect of the Photonic Meta Concrete (PMC) on the climate of the highly urbanized region of Flanders, Belgium (13600 km²). Modelling such a large area allows to explore the impact on the urban heat island across multiple cities with diverse geometrical and geographical properties. More specifically, this study assesses the urban heat island effect of selected cities during a heatwave in August of 2019, comparing scenarios with and without the implementation of PMC in the built environment. The COSMO-CLM regional climate model, utilizing the TERRA-URB urban-canopy land-surface scheme, is employed for this assessment. Integration of the PMC’s photonic properties, i.e. the specific emissivity and albedo, into the urban canopy scheme is achieved by adapting the land surface parameters using the Semi-empirical Urban CanopY parametrization (SURY). Comparisons are made between scenarios incorporating specific albedo of the PMC, specific emissivity of the PMC or both against a baseline scenario without the PMC implementation. These comparisons aim to estimate the mitigation potential offered by this innovative material.

Initial findings suggest that the PMC shows promising potential for lowering city temperatures, with the albedo being identified as the primary factor in combating the urban heat island effect. In Brussels, surface temperatures drop by as much as eight degrees, while temperatures at a height of two meters decrease by up to two degrees

How to cite: Adams, N., Neirynck, J., Borgers, R., and Van Lipzig, N.: Implementation of a newly developed Photonic Meta-Concrete into the COSMO-CLM model to estimate the impact on the urban heat island: a case study of Flanders, Belgium, EGU General Assembly 2024, Vienna, Austria, 14–19 Apr 2024, EGU24-9028, https://doi.org/10.5194/egusphere-egu24-9028, 2024.

EGU24-9290 | ECS | Posters on site | CL2.5

Interaction between Urban Heat Island and Sea-Breeze: a focus on Shanghai 

Hongying Chen, Sara Top, Rafiq Hamdi, and Steven Caluwaerts

In the context of ongoing global warming and the intensification of urbanization processes, urban climate research is particularly important. The urban heat island (UHI) stands out as the most typical characteristic of urban climates. Shanghai is recognized as one the largest cities in China, with over 24 million inhabitants. Located on the east coast, Shanghai’s climate is significantly affected by the UHI and sea breeze, particularly during the summer.

UHI and sea breezes have been extensively explored in various coastal cities on a global scale.  This study aims to run for the first time the ALARO model over the Shanghai region and analyze interplay between sea breezes and UHI during heat waves (HW). The ALARO-SURFEX regional climate model set-up will be used for dynamical downscaling from ERA5 up to kilometric resolution. Urban effects will be taken into account by running the Town Energy Balance (TEB) module. The model runs will be evaluated based on observations in different Local Climate Zones (LCZs). The ECOCLIMAP database used to characterize the land characteristics has been updated based on detailed urban datasets of Shanghai.  Additionally, this study will explore the effects of LCZs on this interaction.

How to cite: Chen, H., Top, S., Hamdi, R., and Caluwaerts, S.: Interaction between Urban Heat Island and Sea-Breeze: a focus on Shanghai, EGU General Assembly 2024, Vienna, Austria, 14–19 Apr 2024, EGU24-9290, https://doi.org/10.5194/egusphere-egu24-9290, 2024.

EGU24-9351 | ECS | Posters on site | CL2.5

Mapping Urban Heat Islands Using Calibrated ENVI-met Model : Application to Sense-City Data 

Nacer Sellila, Julien Waeytens, Martin Hendel, Yan Ulanowski, and Alejandra Castellanos

Urban heat islands (UHI) occur in urban areas with higher temperatures than in surrounding zones, exhibiting an average increase of 2°C. During summer heatwaves, this difference can even reach up to even 12°C. This intense heat phenomenon in urban areas leads to thermal stress, potentially causing health issues such as increased risks of dehydration, heat strokes, and other heat-related health problems. To evaluate the impact of thermal variations on health in urban environments, ENVI-met is used. This work focuses on two main points: sensitivity analysis and parameter calibration.

Numerical sensitivity analysis allows to study the influence of urban area model parameters on quantities of interest (e.g. thermal confort indices). These parameters include notably surface albedo and emissivity. Hence, it gives information of their impact on heat islands. This step prioritizes the influence of each parameter, providing crucial insights for the subsequent stages of the study.

To better understand these urban phenomena and design efficient mitigation solutions, the calibration of the ENVI-met model stands as a promising approach. It aims to establish a digital twin based on experimental data. This calibrated model will enable a detailed mapping of urban temperature and other environmental parameters, thereby enhancing our understanding of the mechanisms behind urban heat islands.

This approach will facilitate an evaluation and comparison between the outcomes of the numerical model and the experimental data collected in Sense-City urban area. Sense-City is a climate chamber that can cover two $400m^{2}$ areas. These urban areas can be studied in natural conditions or in controlled climatic conditions. This comparison will strengthen the credibility and trust in the accuracy of the established digital twin. Thanks to simulations and experimental observations, we will have the opportunity to deepen our knowledge about the formation and the evolution of urban heat islands in this specific environment and to select efficient cooling strategies at the block-scale.

How to cite: Sellila, N., Waeytens, J., Hendel, M., Ulanowski, Y., and Castellanos, A.: Mapping Urban Heat Islands Using Calibrated ENVI-met Model : Application to Sense-City Data, EGU General Assembly 2024, Vienna, Austria, 14–19 Apr 2024, EGU24-9351, https://doi.org/10.5194/egusphere-egu24-9351, 2024.

Heat stress is a major challenge in urban areas, especially in cities which are affected by the urban heat island effect. Adaptation measures are a key strategy to mitigate future heat and health consequences in the context of climate change. To improve both indoor and outdoor microclimatic conditions and thermal comfort, nature-based solutions like roof greenings or wet roofs are implemented as they do not require additional space in dense urban environments. However, cooling effects of evaporation- and transpiration-based adaptation measures are limited by water availability to enable latent heat flux and reduce sensible and wall heat flux during extreme prolonged heat events. Water storage systems like rainfed cisterns can supply water for roof greenings or wet roofs during hot periods, but also store storm water to reduce flooding risks. While individual green roofs or blue roofs only show small local cooling potentials in their direct surrounding of their installation, scaling such measures for a larger proportion of buildings can cause significant cooling effects for the entire air volume of a city. This research aims to simulate heat mitigation effects of blue and green roofs on building wall temperature and thermal outdoor comfort using the physically-based microclimate model ENVI-met. A 16-ha 3D gridded model domain of a dense urban district in the city of Cologne/Germany was parameterized using remote sensing data and field observations. The model is validated based on a quality-controlled, densely-distributed microclimate measurement network with 59 sensors which was setup in the study area. A new model parameterization for wet roofs was developed. Scenario analyses are performed to scale these measures up to an implementation on all 338 buildings in the model domain (100%). Statistically significant average cooling effects of -0.52 K and up to -2.67 K on air temperature and -3.85 K and up to -29.03 K on building roof wall temperature were found for blue roofs in relation to the reference run of the status-quo. For roof greenings, average cooling effects of -0.76 K and up to -3.01 K for air temperature and -12.82 K and up to -39.45 K for wall temperature were determined. Cooling effects of green roofs on outdoor air temperature are strongest during daytime, and for wet roofs strongest in the evenings. Green roofs also have a higher wall cooling potential than blue roofs during daytime. However, roof greenings only show small effects on wall temperatures during nighttime, while blue roofs slightly heat up walls in nighttime. In future research, climate change adaptation and heat mitigation potentials of combining blue and green roofs with other nature-based and technical solutions in the street canyons will be analysed. 

How to cite: Eingrüber, N., Korres, W., and Schneider, K.: Comparison of heat mitigation effects of blue roofs and green roofs on building wall temperature and thermal outdoor comfort based on scenario analyses using 3D microclimate modelling for a dense urban district , EGU General Assembly 2024, Vienna, Austria, 14–19 Apr 2024, EGU24-9967, https://doi.org/10.5194/egusphere-egu24-9967, 2024.

EGU24-10422 | Posters on site | CL2.5 | Highlight

Urban turbulence fluxes for free!  Estimating the surface fluxes for heat, moisture and momentum over cities from crowdsourced observations. 

Gert-Jan Steeneveld, Fidessa Wijnholds, and Wessel van der Meer

The interest in urban meteorology is growing and thus the need to understand and quantify the urban energy balance consisting of the sensible heat flux (QH), the latent heat flux (QE) and the momentum flux (u*) is essential. However, professional meteorological flux observations over cities are scarce and challenging to maintain. Nevertheless, many cities have a dense network of personal weather stations, operated by citizens. This study presents a model to estimate turbulence fluxes over cities that is driven by air temperature, wind speed, and relative humidity from urban weather stations and by information about the urban morphology. The model was tested against flux observations in Amsterdam (the Netherlands) once fed with professional observations from the automatic weather stations of the Amsterdam Atmospheric Monitoring Supersite and once from crowdsourced observations Netatmo personal weather stations. Overall, for both professional and crowdsourced input the estimated QH and u∗ agreed with the observations, whereas the model performed relatively poor for QE. Using crowdsourced input resulted in nearly identical root mean squared errors (RMSE) for QH and QE as using professional input, whereas for u∗ the RMSE was smaller when professional input was used. The model performed better during daytime, under conditions with few clouds and without precipitation. Also, we test the approach for Vienna (Austria) and Tokyo (Japan), and develop the approach further and show that the spatial variability of the temperature across an urban network can be used as proxi for the downwelling solar radiation. Although there is room for model improvement, our results illustrates the potential of using crowdsourced observations to estimate the urban surface fluxes for heat, moisture and momentum.

How to cite: Steeneveld, G.-J., Wijnholds, F., and van der Meer, W.: Urban turbulence fluxes for free!  Estimating the surface fluxes for heat, moisture and momentum over cities from crowdsourced observations., EGU General Assembly 2024, Vienna, Austria, 14–19 Apr 2024, EGU24-10422, https://doi.org/10.5194/egusphere-egu24-10422, 2024.

EGU24-11400 | ECS | Orals | CL2.5

The food-water-climate nexus of green infrastructure: Examining ecosystem services trade-offs of peri-urban agriculture 

Ricard Segura-Barrero, Johannes Langemeyer, Alba Badia, Sergi Ventura, Jaime Vila-Traver, and Gara Villalba

Emission reduction, heat mitigation, and improved access to water and food provision are increasingly critical challenges for urban areas in the context of global climate change adaptation and mitigation. The revival of local agricultural production is often lauded as a potential nature-based solution. However, an expansion of peri-urban agriculture (peri-UA) may entail significant trade-offs in the ecosystem services it provides.

This study explores the impacts on the food-water-climate nexus of different scenarios of peri-urban agricultural expansion in a semi-arid, Mediterranean climate, addressing local food provision, freshwater use, local temperature regulation, global climate change mitigation, and the trade-offs thereof. Examining four theoretical land-use scenarios in the Metropolitan Area of Barcelona, the study integrates estimates of food provision and irrigation water requirements based on georeferenced urban metabolism approach with the local atmosphere and biogenic carbon balance estimates produced through the combination of an atmospheric model with a satellite and meteorological-driven biosphere model.

Our study reveals that a 31.12 % (+17.27 km2) and 115.08 % (+64.25 km2) increase in the current peri-UA in the AMB, achieved by replacing natural non-forested and forest areas, results in an increase in local food production of 24.0 % (+16503 tons year-1) and 85.8 % (+58940 tons year-1), respectively. However, it would also increase the irrigation water requirements by 10.0 % (+3.2 hm3) and 43.5 % (+14.1 hm3), respectively. The analysis of the midday/midafternoon temperatures during a summer hot month reveals that peri-UA especially when it is irrigated can potentially reduce near-surface temperatures up to 0.7 °C with respect to a current scenario, however the air cooling affects principally located in rural regions with lower population density, while temperature reductions in the densest urban areas are minimal. If an expansion of Peri-UA goes at the expense of natural non-forested and forests areas, as in the scenarios we used, it has further the potential to disrupt the regional carbon balance, impacting the net ecosystem productivity of the AMB green infrastructure and overall carbon stocks with reductions in the net ecosystem productivity of up to 18.5 % and reduce total carbon stocks by 3.3 %.

These findings, derived from an innovative and combined modelling approach, reveal significant trade-offs in ecosystem services associated with an expansion of peri-urban agriculture. It is likely that similar trade-offs would be observed with other nature-based solutions strategies. An integrated understanding of these trade-offs, facilitated by nexus approaches that combine different models, appears to be a promising direction for informing land-use decision-making in the context of urban climate adaptation and mitigation. 

How to cite: Segura-Barrero, R., Langemeyer, J., Badia, A., Ventura, S., Vila-Traver, J., and Villalba, G.: The food-water-climate nexus of green infrastructure: Examining ecosystem services trade-offs of peri-urban agriculture, EGU General Assembly 2024, Vienna, Austria, 14–19 Apr 2024, EGU24-11400, https://doi.org/10.5194/egusphere-egu24-11400, 2024.

EGU24-11609 | Orals | CL2.5

A new method for automatic identification and ranking the urban heat island hotspots 

Adina-Eliza Croitoru, Zsolt Magyari-Saska, Csaba Horvath, and Sorin Pop

Urban Heat Islands (UHIs) are increasingly posing critical challenges to urban environments and human well-being. In response, we propose a novel methodology to identify Urban Heat Island Hotspots (UHIHs) to address the urgent need for effective management and mitigation strategies. Our research introduces the innovative concept of direct UHIHs detection and ranking, providing a framework for urban planning stakeholders to prioritise areas for regeneration based on UHIH severity.

A new concept is proposed, and it consists of: hotspot ranking in a given urban area, a new algorithm for hotspot detection, and a new tool for automatic detection and ranking hotspots. This approach greatly improves the effectiveness of interventions to mitigate the adverse impacts of UHIs on urban environments and public health.

This methodology addresses the critical importance of incorporating threshold percentiles and considering the spatial coverage of the study area. It relies on percentile-based thresholds, establishing the minimum acceptable values for individual cells and the mean values of the entire UHIH area. Through extensive experimentation with various threshold pairs, we identified the most suitable thresholds for further application, considering both LST values and non-climatic factors (e.g., urban fabric and imperviousness). The new hotspot identification algorithm calculates minimum acceptable values for individual cells and hotspot means, which plays a pivotal role in pinpointing UHI hotspots effectively. Each hotspot is identified on a step-by-step basis, starting with the identification of the highest temperature cell, which hasn’t been assigned to any other hotspot in previous steps. Further on, the algorithm searches among all surrounding cells and checks if they meet the two threshold conditions or not. In case of a positive result, the identified cell is assigned to the current hotspot and placed in a stack for its neighbours to be further considered. In addition to the detection process, this research introduces the concept of hotspot ranking based on their intensity. This innovative feature enhances the utility of our algorithm by prioritising the severity of UHI hotspots, facilitating data-driven decision-making for urban planning and climate mitigation strategies.

The practical implementation of the proposed algorithm is sustained by the use of the versatile R programming language, providing researchers and practitioners with a flexible and user-friendly tool.

This research addresses the complex challenges urban heat islands induce, offering a comprehensive approach readily adoptable by researchers and urban planners. It underscores the urgency of UHI management and its potential to enhance the well-being of urban populations.

In summary, this new approach and tool could become very useful in the urban planning process as they:

  • Enhance the effectiveness by prioritising the assessment of UHIHs based on their severity in a given location;
  • Provide a valuable tool for data-informed decision-making in urban planning and climate mitigation;
  • Enables urban planners and stakeholders to allocate resources and interventions more strategically, focusing on the critical areas from the UHI perspective;
  • Maximise the impact of the urban planners/stakeholders’ efforts in enhancing urban resilience and sustainability.

How to cite: Croitoru, A.-E., Magyari-Saska, Z., Horvath, C., and Pop, S.: A new method for automatic identification and ranking the urban heat island hotspots, EGU General Assembly 2024, Vienna, Austria, 14–19 Apr 2024, EGU24-11609, https://doi.org/10.5194/egusphere-egu24-11609, 2024.

EGU24-11633 | ECS | Orals | CL2.5

Effect of city and climate change on weather conditions, building thermal comfort and energy consumption: application to Strasbourg region 

Florentin Breton, Alice Micolier, Makram Abdellatif, Maxence Mendez, and Nadège Blond

Weather conditions play a large role in thermal comfort and energy consumption, such as during a cold spell (body hypothermia and building heating) or a heatwave (body overheating and building air conditioning). These weather conditions can be modified by urban factors and climate change, such as higher temperatures in city-center and in future periods. However, weather conditions used for building design and renovation are often taken for convenience from past data near airports. The present study aims to determine weather conditions with urban factors and climate change, as well as thermal comfort and energy needs for several building types in different environments. Measurements and simulations are combined to provide weather conditions and building estimations for different locations (rural, periurban, urban), seasonal cases (winter, summer, heatwave) and periods (recent past, mid-century, end-century). A first application of the approach is presented over the city of Strasbourg (France).

We find that the urban case has higher temperature, reduced windspeed and relative humidity, less energy for winter heating and less summer thermal comfort than the periurban than the rural case. Climate change leads to higher temperature and lower relative humidity, and to less summer thermal comfort especially during a heatwave and for older buildings. The combined effect of city, heatwave and climate change on outdoor air temperature reaches 8 to 11 degrees, and similarly for the indoor air temperature of very old buildings but 5 to 7 degrees for recent (well-insulated) buildings. This approach may support building renovation strategies and analyses of population vulnerability. The perspectives include the application to other regions, a comparison of urban climate models, and an investigation of urban scenarios.

How to cite: Breton, F., Micolier, A., Abdellatif, M., Mendez, M., and Blond, N.: Effect of city and climate change on weather conditions, building thermal comfort and energy consumption: application to Strasbourg region, EGU General Assembly 2024, Vienna, Austria, 14–19 Apr 2024, EGU24-11633, https://doi.org/10.5194/egusphere-egu24-11633, 2024.

EGU24-12850 | Orals | CL2.5

High-resolution air temperature modeling during the summer 2022 heat waves over Dijon 

Alexandre Berger, Julien Crétat, Julien Pergaud, Benjamin Pohl, Mélissa Poupelin, and Yves Richard

1Centre de Recherches de Climatologie/Biogéosciences, Université de Bourgogne, Dijon, France - alexandre.berger@u-bourgogne.fr

2Laboratoire ThéMA, Université de Bourgogne, Dijon, France


Heat waves (HWs) become more frequent, severe and longer under climate change. In cities, their impact is exacerbated by urban heat islands (UHIs). Proposing efficient adaptation plans necessitates upstream studies to further understand air temperature space-time variability within cities during HWs, their drivers, and associated mechanisms and processes.

This study aims at understanding 2 m air temperature (T2m) space-time variability during the four HWs that occurred in Dijon during summer 2022 based on the dense MUSTARDijon network of 92 thermometers. We used a 150 m mesoscale simulations performed with the Meso-NH atmospheric model coupled with the TEB and ISBA surface schemes optimized for urban and rural environments, respectively. First, we evaluate the capability of Meso-NH to simulate the diurnal cycle of T2m for the four HWs over urban and rural environments. We show that Meso-NH more skillfully simulates the T2m diurnal cycle over urban than rural environments, despite a systematic cold bias in early morning and late afternoon. Second, we focus on the drivers of T2m space-time variability by using different predictors including land cover, energy budget, soil and atmospheric humidity and atmospheric dynamics. Buildings and roads contribute to warm the urban environment mostly at night, but these contributions are exaggerated by Meso-NH during all HWs. By contrast, vegetation contributes to cool the urban environment all day long for low vegetation and at night only for high vegetation in both observations and simulations. Also, wind speed seems having a strong impact on UHI intensity.

How to cite: Berger, A., Crétat, J., Pergaud, J., Pohl, B., Poupelin, M., and Richard, Y.: High-resolution air temperature modeling during the summer 2022 heat waves over Dijon, EGU General Assembly 2024, Vienna, Austria, 14–19 Apr 2024, EGU24-12850, https://doi.org/10.5194/egusphere-egu24-12850, 2024.

EGU24-13001 | ECS | Posters on site | CL2.5

Multiscale characterization the Urban Heat Island (UHI) of the city of Milan (Italy) 

Luca Gallia, Federico Agliardi, Sergio Cogliati, Stefano Basiricò, Roberto Garzonio, Cinzia Panigada, Roberto Colombo, and Riccardo Castellanza

Milan is one of the largest, most industrialized and populated cities of Italy. It extends over more than 180 Km2, most of which are built or paved areas. The area is characterized by the perturbation of thermal regime known as Urban Heat Island (UHI), that is related to a variety of natural and anthropogenic factors. UHI is observed on different spatial scales, from macro (citywide) to micro (neighbourhoods), and can be significantly heterogeneous depending on urban structure and builts environment. UHI usually includes three layers: surface-layer heat island (SLHI), canopy-layer Heat Island (CLHI) to the top of built environment, and boundary-layer Heat Island (BLHI). Its robust monitoring and modelling is crucial to support actions aimed at improving urban climate. 

In this perspective, we focused on the reconstruction of the Milan UHI, taking into account its spatial heterogeneity and temporal variability. We started by mapping the UHI at the regional scale of the Milan metropolitan area since April 2013, using Landsat imagery that is able to provide Land Surface Temperature (LST) at 100m resolution. Through Google Earth Engine, we collected 14 Landsat-8 LST images over the period 2015-2023. This allowed obtaining macroscale measures of the heterogeneous nature of the UHI and identifying important hot-spots. One of them is the Bicocca neighborhood, a former industrial district that underwent significant urban changes over the last four decades, and it is still made of a mixture of industrial, residential, vegetated, or mixed spots. For each of these targets, we analyzed the spatial distributions and temporal trends of LST, providing “signatures” of the different components of a complex UHI.

At the urban micro-scale, we focused our attention on Piazza della Scienza (Bicocca university campus) and its surroundings that are undergoing extensive urban regeneration, including depaving and nature-based solutions in the framework of the PNRR project MUSA (Milano Urban Sustainability Action). Here, UHI characterization and monitoring in space and time is required to compare pre- and post- intervention conditions and to setup and calibrate dynamic numerical models that support a quantitative understanding of urban climate evolution and urban design optimization. This kind of monitoring requires a trade-off between the needs of accurate spatially-distributed and temporally-continuous measurements of surface and air temperature and related variables. To do this, we combined different techniques and multiple technologies. Surface temperature was characterized through a radiometrically-calibrated IRT camera (FLIR-T1020/T650) for the spatially-distributed, discontinuous time-lapse characterization of key sectors of ground and buildings. Furthermore, HOBO sensors (T/RH-sensors) provided accurate continuous temperature time series at many key locations spread over the area. Air temperature was monitored through UAV-based thermal sensors along vertical profiles up to 120m high at different locations and different times, to obtain a 3D grid of temperature measurements across the CLHI. This wealth of information, obtained at different spatial scales over time, will allow the reconstruction of the internal structure, heterogeneity and temporal trends of the Milan UHI, as a first step towards the development of dynamic numerical models that will support the definition, implementation and validation of urban renewal and mitigations strategies.

How to cite: Gallia, L., Agliardi, F., Cogliati, S., Basiricò, S., Garzonio, R., Panigada, C., Colombo, R., and Castellanza, R.: Multiscale characterization the Urban Heat Island (UHI) of the city of Milan (Italy), EGU General Assembly 2024, Vienna, Austria, 14–19 Apr 2024, EGU24-13001, https://doi.org/10.5194/egusphere-egu24-13001, 2024.

EGU24-13324 | ECS | Orals | CL2.5

Disagreements among current-generation global urban estimates across scales 

Tirthankar Chakraborty, Zander Venter, Lei Zhao, Matthias Demuzere, Wenfeng Zhan, Jin Gao, and Yun Qian

The rise in high-resolution satellite technology and computational advancements has enabled the development of global urban land cover datasets, crucial for understanding climate risks in our increasingly urbanizing world. Here, we analyze urbanization patterns across spatiotemporal scales from several such widely used current-generation datasets and find substantial discrepancies in percentage of urban land influenced by differing urban definitions and methodologies. Despite these inconsistencies, the datasets show a rapidly urbanizing world, with global urban land nearly tripling between 1985 and 2015. We also discuss the implications of these inconsistencies for several use cases, including for monitoring urban climate impacts, such as localized urban warming and urban flood risks, and for modeling urbanization and its influence on weather and climate from regional to global scales. Our results demonstrate the importance of choosing application-appropriate datasets for examining specific aspects of historical, present, and future urbanization with potential implications for informing sustainable development, resource allocation, and quantifying climate impacts.

How to cite: Chakraborty, T., Venter, Z., Zhao, L., Demuzere, M., Zhan, W., Gao, J., and Qian, Y.: Disagreements among current-generation global urban estimates across scales, EGU General Assembly 2024, Vienna, Austria, 14–19 Apr 2024, EGU24-13324, https://doi.org/10.5194/egusphere-egu24-13324, 2024.

EGU24-13679 | ECS | Orals | CL2.5

“GENIUS: Satellite Monitoring Platform for City Management and Planning” 

Javier Medina, Ana Hernández-Duarte, Freddy Saavedra, Valentina Contreras, Marcelo Leguía, and Carlos Romero

More than 50% of people worldwide live in cities with upward projections. Ensuring health, public safety, and maintaining a high quality of life is a challenge within cities due to the accelerated growth of urbanization, climate change, and the limited resources available for urban management and planning. Strategies for sustainable urban planning are a need that has become relevant worldwide. The concept of a Smart City is presented as an approach that integrates many inputs from different sources to make decisions based on reliable and updated information, considering, for example, environmental monitoring. However, capturing the spatiotemporal variability of processes within the city requires a significant investment in time and resources, especially for medium-sized cities in Latin America, where little information is available. Earth Observation based on open-access information offers essential opportunities to obtain information of interest, contributing to cities' physical and environmental characterization. Satellite sensors allow cities to be characterized in terms of the presence and state of vegetation, surface temperature, changes in the urban footprint, level of luminosity, and atmospheric pollution, among other parameters. This ongoing project is progressing with a web platform containing urban-environmental indicators derived from satellite images to support intelligent planning and management of sustainable development strategies in the city. The platform is currently undergoing pilot development in the city of Quilpué, Valparaíso Region, with the potential for scaling to other territories at the regional and national levels. Preliminary findings with satellite data reveal adverse trends in surface temperature, vegetation health, and air quality in Quilpué City, which are currently undergoing validation with on-site data. Efforts were focused on merging socio-economic and environmental data to pinpoint areas with vulnerable populations. Despite the emphasis on environmental variables, gaps exist in analyzing population exposure to these factors due to outdated demographic information. This underscores the importance of nature-based solutions to exposure variables such as air quality, surface temperature, and proximity of green areas, which could be addressed by governance risk management and public policy planning. This approach offers substantial potential for informed decision-making and risk mitigation strategies.

How to cite: Medina, J., Hernández-Duarte, A., Saavedra, F., Contreras, V., Leguía, M., and Romero, C.: “GENIUS: Satellite Monitoring Platform for City Management and Planning”, EGU General Assembly 2024, Vienna, Austria, 14–19 Apr 2024, EGU24-13679, https://doi.org/10.5194/egusphere-egu24-13679, 2024.

EGU24-14149 | Orals | CL2.5

Contrasting Responses of Heat Mitigation Strategies on Surface and Air Temperature and on Thermal-Stress Indices Deduced from Mesoscale Modelling 

Sylvie Leroyer, Stéphane Bélair, Nasim Alavi, Oumarou Nikiema, Rodrigo Munoz-Alpizar, and Ivana Popadic

With recent advances in subkilometric numerical weather prediction (NWP) for urban areas1, it has become possible to develop numerical platforms to assess landscape modifications and in particular heat mitigation scenarios in urban areas. One of the major barriers that exist for urban planners and health institutes to rely on such data is that they might be reluctant to consider the large amount of data produced by such numerical simulations.  This study aims at analyzing results in a more holistic approach, with the objectives of developing training data for statistical assessment of the impact of heat mitigation strategies in a particular city.

In a recent study2, evaluations of scenarios for the urban landscape modifications were performed in Canada for Montreal and Toronto metropolitan areas with the Global Environmental Multiscale (GEM) atmospheric model with grid spacing of 250 m (with the Town Energy Balance TEB and the Interactions between the Soil, the Biosphere and the Atmosphere ISBA surface schemes) and applied during two overheating periods in 2010 when large impacts on the mortality rate were observed. More than 20 scenarios were assessed with realistic but ambitious scenarios, including increase of vegetation fraction with or without irrigation, and of thermal reflectivities. Various responses on the temperature reduction were found with an overall improvement, and down to -3 oC during the daytime, but negative effects were also found on the thermal stress during daytime when increasing albedo values.

More insights into the results are provided in this study, using various normalized efficiency metrics, as for example those based on previous work3 and extended to the mean radiant temperature and to thermal stress indices computed in these experiments (UTCI and WBGT4).  Dependencies of the measures on the various environmental conditions will be presented and greening strategies will be analyzed in combination with the soil water availability. 

References:

1.Leroyer, S., et al., 2022, https://doi.org/10.3390/atmos13071030

2.Leroyer, S., et al., 2019, https://doi.org/10.5281/zenodo.7075789

3.Krayenhoff, E.S., et al., 2021, https://doi.org/10.1088/1748-9326/abdcf1

4.Leroyer, S., et al., 2018, https://doi.org/10.1016/j.uclim.2018.05.003

How to cite: Leroyer, S., Bélair, S., Alavi, N., Nikiema, O., Munoz-Alpizar, R., and Popadic, I.: Contrasting Responses of Heat Mitigation Strategies on Surface and Air Temperature and on Thermal-Stress Indices Deduced from Mesoscale Modelling, EGU General Assembly 2024, Vienna, Austria, 14–19 Apr 2024, EGU24-14149, https://doi.org/10.5194/egusphere-egu24-14149, 2024.

EGU24-14389 | Posters on site | CL2.5

ILS+Urban: an offline land-surface process model for global urban climate and energy simulations 

Yuya Takane, Tomoko Nitta, Sachiho A. Adachi, Kei Yoshimura, Masuo Nakano, Makoto Nakayoshi, Shiho Onomura, and Ben Crawford

We have developed ILS+Urban: a coupled model of an offline land-surface model (ILS) and an urban canopy and building energy model (SLUCM+BEM) for global urban climate and energy research. The ILS is an offline land-surface model that includes MATSIRO, a land-surface model for the global climate model MIROC5. The SLUCM+BEM is a new parametrisation for urban climate and energy simulations developed by the authors, which can simply simulate anthropogenic heat from buildings (QFB) and electricity consumption (EC) from human activities. We have implemented the SLUCM+BEM in the ILS, which allows us to simulate global urban climate and energy with relatively low computational resources in offline mode. A test simulation of ILS+Urban shows that QFB and EC tend to be quantitatively high throughout the year in the Middle East, for example. In the near future, we will implement a global urban database (e.g. global LCZ, anthropogenic heat emissions and morphology) and new technology parameterisations (e.g. EV, PV and heat pump water heaters) for global urban climate and energy projections and countermeasures for urban heat and energy savings & generation. In addition, the ILS+Urban will be coupled with global climate models (e.g. MIROC and NICAM).

How to cite: Takane, Y., Nitta, T., Adachi, S. A., Yoshimura, K., Nakano, M., Nakayoshi, M., Onomura, S., and Crawford, B.: ILS+Urban: an offline land-surface process model for global urban climate and energy simulations, EGU General Assembly 2024, Vienna, Austria, 14–19 Apr 2024, EGU24-14389, https://doi.org/10.5194/egusphere-egu24-14389, 2024.

Cities such as Austin, Texas have in the last decade noted increase in severity and frequency of weather extremes, causing loss of life and millions in damaged property and  critical infrastructure. Communities with the fewest resources often experience the greatest burden from these events and struggle to “bounce back.” The City of Austin, as well as all other cities around the world, are currently scrambling to understand how to plan for an uncertain future. 

The University of Texas (UT)-City Climate CoLab is a novel initiative that builds on the success of national climate assessments, the state and regional climate centers, and highlights and fills the void of creating a city climate office. The UT-City of Austin CoLab develops Austin and City-specific climate information, data products, tools, and assessments to drive innovation and investment in research, policy, governance, and education. This CoLab is the first City-academia  climate collaboratory in the US through the city council.

City Council, planners, engineers, and other decision-makers are using the past to predict the future, and with climate change, that approach is no longer sufficient. This presentation will bring out the workings of this colab with the City staff and community group on extreme weather and climate projects. The City Colab has been working on different needs/problems to solve:

  • Specific climate data and models needs that are often confusing for community and City project teams and staff, therefore not immediately useful for planning and policy purposes;
  • Academic research can be made accessible to different City departments, agencies, and programs to improve decision-making -- but is not easily usable; 
  • Currently there is no entity that directly supports municipal climate data needs. Climate aligns with multiple departments’ work but needs differ across teams. Need more coordination across departments and to connect data to city department decision making;
  • Currently, academia / City climate research projects are selected per faculty interest and a much more strategic approach is needed.

Types of Projects: (a) City Climate Assessment (coinciding with global climate assessment from IPCC; (b)  Data products:  Provide data based on different department needs; Develop data products and downscale the needed climate model information so that it is useful at city scale i.e. 100 km uniform grid information to gridded neighborhood scale (target 1 km x 1 km data output or even finer); (c) Communication: Collaborate with local news weather teams to share climate information; Connect through the City Public Information Office to share takeaways in official city press releases; (d)  Policy and Governance: Map intra- and inter-agency climate governance networks to understand key relationships, programs, and community organizations for outreach;  Research policy and governance frameworks;  Connect climate modeling data products to social and policy science, including social vulnerability;  Develop a stakeholder database and platform. (e) Outreach: Workshop and outreach for assessing media, community and stakeholder needs; Conduct public participation in scientific research by collecting and sharing data based on community feedback; Advance community science and volunteer monitoring efforts. 

A number of research topics are underway  and an outline of these activities, lessons learnt, and path ahead will be presented. 

How to cite: Niyogi, D.: The University of Texas Austin City Climate CoLab - Localizing Climate Decision using Data and Community Partnerships, EGU General Assembly 2024, Vienna, Austria, 14–19 Apr 2024, EGU24-14394, https://doi.org/10.5194/egusphere-egu24-14394, 2024.

EGU24-15108 | ECS | Posters on site | CL2.5

Modelling Microclimatic Benefits of Urban Green Spaces: Insights from ENVI-met Simulations in Augsburg, Germany 

Jonathan Simon, Joachim Rathmann, Jacqueline Oster, Max Stocker, Lisa-Marie Falkenrodt, Elisabeth André, Bhargavi Mahesh, Yekta Said Can, Michael Dietz, Andreas Philipp, and Christoph Beck

With two thirds of the world's population expected to live in urban areas by 2050, the exacerbation of the urban heat island effect is a critical challenge, affecting thermal comfort, public health, and air quality. Urban green spaces (UGS) emerge as pivotal tools for mitigating these adverse effects. They provide essential ecosystem services, including thermal comfort, shade, pollution control, carbon storage, and water cycling. In addition, UGS provide city-dwellers with opportunities for recreation, social interaction, and aesthetic inspiration.

This study, funded by the German Research Foundation under contract 471909988, uses ENVI-met, a three-dimensional, grid-based microclimate model, to examine the positive microclimatic and biometeorological effects of UGS in different vegetation-dominated urban areas. The latest fractal-based L-tree (Lindenmayer system) representation in ENVI-met V5 provides a more nuanced representation of trees, categorised by tree species, considering variations in leaf area density within the tree crowns and the structurally correct representation of the tree skeleton.

Focusing on UGS in Augsburg, Germany, including an urban park and different urban forest sites such as a mixed forest, a pine forest, a beech-dominated forest and a heath, the study examines the hypothesis that L-trees provide more accurate microclimate models than grid-based 3D-plants of older ENVI-met versions. The investigation considers the influence of spatial resolution, tree species, tree shapes, and tree heights on modelling precision. Additionally, the study investigates whether UGS heat mitigation is more pronounced in summer than in other seasons and how much it is influenced by area size, vegetation density, and study site. The spatial extent of the model areas is approximately 0.4 km² - 1.0 km² with a spatial resolution of 2 m - 5 m. We expect that the microclimatic impact of tree species composition within an UGS may be negligible, but could nevertheless influence subjective thermal comfort, aesthetic inspiration, and health-related parameters. These aspects are the subject of two further parts of the study, which deal with the objective health effects and the subjective perception of different UGS.

Validation of microclimate model results includes field measurements using Kestrel 5400 heat stress trackers and HOBO MX2301A loggers. The study collected participant health and survey data during thermal walks through the UGS study sites, using wearable devices and questionnaires, to further validate various biometeorological effects and subjective perceptions. The research contributes to the advancement of microclimate modelling in urban parks and forests and provides insights crucial for optimizing ecosystem services of UGS to enhance urban resilience and promote sustainable development.

How to cite: Simon, J., Rathmann, J., Oster, J., Stocker, M., Falkenrodt, L.-M., André, E., Mahesh, B., Can, Y. S., Dietz, M., Philipp, A., and Beck, C.: Modelling Microclimatic Benefits of Urban Green Spaces: Insights from ENVI-met Simulations in Augsburg, Germany, EGU General Assembly 2024, Vienna, Austria, 14–19 Apr 2024, EGU24-15108, https://doi.org/10.5194/egusphere-egu24-15108, 2024.

EGU24-15290 | Posters on site | CL2.5 | Highlight

Transforming public spaces towards user-friendly, climate resilient and energy producing spaces - the BARTLETT 

Tanja Tötzer, Marianne Bügelmayer-Blaschek, Martin Jung, Martin Schneider, Romana Berg, Karl Berger, Silja Tillner, Alfred Willinger, Karl Grimm, Irene Zluwa, and Elia Stefan

Urban areas are severely affected by climate change, as the associated increase in temperature and precipitation intensity are further exacerbated by the prevailing morphology of densely built areas and the prevalence of sealed surfaces. Especially heat has been recognised as an increasing risk and therefore, appropriate adaptation measures such as nature-based solutions (NbS) have been studied extensively.

Space is scarce and valuable in cities and the usability of urban spaces has gained a growing attention in the last years – not only in the sense of climate adaptation but also for climate protection, as the energy transition calls for the implementation of renewable energy sources, where public spaces offer great potential for PV-suitable areas. In addition, an increasing number of people living in cities demand more living space and put even more pressure on available public spaces.

These three aspects form the basis of the presented study, where a highly frequented public space, the Volkertplatz in Vienna is chosen to be transformed into a climate-resilient, user-friendly and energy-generating space. To achieve this, the following steps are necessary: (i) analysis of the current and future local climate conditions, (ii) incorporating and understanding the needs of the local users, (iii) design of the BARTLETT (Blue-green energy-generating canopied seating and communication facility) and (iv) implementation of an appropriate process of involvement of the local authorities.

The analyses show that the current design of the space prevents the infiltration of rainwater, intensifies the prevailing heat load in summer and mainly meets the needs of male users. Therefore, the transformed space needs to reduce the identified barriers in order to improve the quality of the Volkertplatz.  A key element is the BARTLETT, a construction that improves the local microclimate, collects rainwater for irrigation of the plants and produces energy through the installed PV collectors. Furthermore, the design enhances the usability of the square by different groups, providing both open and more hidden spaces. To ensure the acceptance of local citizens, their needs have been identified, their behaviour observed, and their opinions incorporated through workshops. As important as the local support, is the timely involvement of relevant political stakeholders, which is ensured by the project partners and collected in a handbook to allow transferability to other public spaces.

How to cite: Tötzer, T., Bügelmayer-Blaschek, M., Jung, M., Schneider, M., Berg, R., Berger, K., Tillner, S., Willinger, A., Grimm, K., Zluwa, I., and Stefan, E.: Transforming public spaces towards user-friendly, climate resilient and energy producing spaces - the BARTLETT, EGU General Assembly 2024, Vienna, Austria, 14–19 Apr 2024, EGU24-15290, https://doi.org/10.5194/egusphere-egu24-15290, 2024.

EGU24-15357 | ECS | Orals | CL2.5

Urban Heat Island under Climate Change over European cities: Evaluation of the EURO-CORDEX ensemble performance in reproducing the UHI 

Eloisa Raluy-López, Victoria Gallardo, Pedro Jiménez-Guerrero, and Juan Pedro Montávez

The urban heat island (UHI) is defined as the temperature difference between a city and its rural surroundings. It is one of the most studied urban phenomena and can have potential adverse effects on human well-being. Furthermore, the UHI may contribute to an increase in the urban energy consumption and ecological footprint, potentially exacerbating the impacts of climate change. The aim of this study is to evaluate the capability of different regional models from the EURO-CORDEX ensemble to accurately reproduce the UHI over several European large cities. Subsequently, the evolution of the UHI under climate change scenarios is studied using the models that demonstrate good performance. 

The employed data were extracted from the EURO-CORDEX EUR-11 project and the ERA5-land dataset. The historical data cover the period 1971-2000. The future model data under the climate change RCP8.5 scenario are divided into near future (2021-2050) and distant future (2071-2100) periods. There are multiple ways to perform the UHI intensity calculation. In this case, the urban temperature of each city is assigned as the temperature series of the most urbanized grid point. The reference rural temperature is defined as the mean temperature series of all the valid rural points inside a 1º box centered in the most urbanized point. A rural point is considered to be valid if its rural fraction falls below 5%, its land fraction is no lower than 50% and if its altitude does not differ more than 100 meters from the urban point altitude.

The results of this study show that several models do not simulate the timing of the UHI correctly, exhibiting its daily maximum during the daytime instead of the nighttime, as seen in other studies. ERA5-land data present similar limitations. However, the RegCM4-6 and HadREM3-GA7-05 models are two examples of regional models able to successfully reproduce the UHI effect and its annual and daily cycles. The differences between the historical and future mean annual cycles of the UHI daily maximum show small to no changes in most of the cities, with these small differences being generally negative. Barcelona and Lisbon present greater negative changes, with a reduction of the UHI intensity of around 0.2 ºC in the near future and a reduction of around 0.4 ºC in the distant future. In contrast, Porto and Toulouse present positive differences with an intensification of the UHI effect of around 0.3-0.4 ºC in the distant future. Furthermore, the greatest changes in each city occur during the summer season. No important changes in the hourly distribution of the UHI daily maximum are found. In conclusion, the UHI effect seems to generally not aggravate the rising temperatures due to climate change in urban areas.


The authors acknowledge the ECCE project (PID2020-115693RB-I00) of the Ministerio de Ciencia e Innovación/Agencia Estatal de Investigación (MCIN/AEI/10.13039/501100011033). ERL thanks her predoctoral contract FPU (FPU21/02464) to the Ministerio de Universidades of Spain.

How to cite: Raluy-López, E., Gallardo, V., Jiménez-Guerrero, P., and Montávez, J. P.: Urban Heat Island under Climate Change over European cities: Evaluation of the EURO-CORDEX ensemble performance in reproducing the UHI, EGU General Assembly 2024, Vienna, Austria, 14–19 Apr 2024, EGU24-15357, https://doi.org/10.5194/egusphere-egu24-15357, 2024.

EGU24-15412 | Orals | CL2.5 | Highlight

A public database of future heat stress in 140 cities to examine the potential for heat reduction via climate-smart urban development  

Quentin Lejeune, Niels Souverijns, Sarantis Georgiou, Niklas Schwind, Sajid Ali, Tiago Capela Lourenço, Khadija Irfan, Dirk Lauwaet, Inês Gomes Marques, Helena Gonzales Lindberg, Inga Menke, Shruti Nath, Peter Pfleiderer, Hugo Pires Costa, Fahad Saeed, Mariam Saleh Khan, Sylvia Schmidt, Emily Theokritoff, Burcu Yesil, and Carl-Friedrich Schleussner

Heatwaves are becoming more frequent because of climate change, and this trend is exacerbated in cities due to the urban heat island effect. With more than half of the world’s population living in cities, it is essential to quantify the future evolution of heat stress and develop smart adaptation strategies to counter its impacts. This requires the capturing of fine-grained variations in heat-related hazards within the urban fabric. However, the coarse resolutions of Earth System Models makes it difficult to model urban areas explicitly. Moreover, high-resolution modelling of future climate conditions in cities is often conducted for select cities only, in very focused studies or by private companies, thus limiting the availability of its results in the public domain. Additionally, there is limited understanding of the potential of climate-smart urban development for reducing heat stress.

In the H2020 PROVIDE project, we use the urban boundary layer climate model UrbClim to generate projections of urban heat stress at a 100-meter resolution, for about 20 indicators in 140 urban centres across the world. UrbClim consists of a land surface scheme with simplified urban physics coupled to a 3-D atmospheric boundary layer module, and can represent the effect of varying land cover conditions on local climate. We consider three emission scenarios: 1) compatible with the 1.5°C goal of the Paris Agreement, 2) representative of the trend from current policies, and 3) an intermediary scenario. The forcing data corresponding to these scenarios is generated by coupling the emulator for Global Mean Temperature FaIR, with the Earth System Model emulator with spatially explicit representation MESMER. This allows us to account for uncertainties in the forcing data arising from both the response of Global Mean Temperature (GMT) to emissions, and the response of large-scale climate conditions above each city included in the study to rising GMT.

The resulting database is integrated into the PROVIDE climate risk dashboard, an open-access and user-friendly online tool that allows visualization of global-to-local future climate impacts depending on mitigation outcomes. The dashboard also contains a module that allows its users to first select a critical heat stress level of their choice, and then get information about the emission scenarios that would enable to avoid exceeding that level in their city of interest. This more impact-centered perspective on the UrbClim results provides information on future heat stress in a way that better reflect how climate impact information is accounted for in local adaptation processes.

Furthermore, we explore the potential for urban greening plans co-developed by urban planners and city-level stakeholders to reduce heat stress by running UrbClim at very high resolution (down to 1 meter) for the cities of Lisbon (Portugal), Bodø (Norway), Islamabad (Pakistan), and Berlin (Germany). These new results will eventually also be made available in the PROVIDE climate risk dashboard. Together with the insights from the urban planners and stakeholders’ needs, they offer more practical and policy-relevant insights for adaptation practitioners at the municipal level on the potential for climate-smart urban development to reduce heat stress.

How to cite: Lejeune, Q., Souverijns, N., Georgiou, S., Schwind, N., Ali, S., Capela Lourenço, T., Irfan, K., Lauwaet, D., Gomes Marques, I., Gonzales Lindberg, H., Menke, I., Nath, S., Pfleiderer, P., Pires Costa, H., Saeed, F., Saleh Khan, M., Schmidt, S., Theokritoff, E., Yesil, B., and Schleussner, C.-F.: A public database of future heat stress in 140 cities to examine the potential for heat reduction via climate-smart urban development , EGU General Assembly 2024, Vienna, Austria, 14–19 Apr 2024, EGU24-15412, https://doi.org/10.5194/egusphere-egu24-15412, 2024.

EGU24-15460 | ECS | Posters on site | CL2.5

Cool pavements for adapting Paris to climate change 

Charbel Abboud, Sophie Parison, Frédéric Filaine, Martin Hendel, Laurent Royon, and Maïlys Chanial

In order to adapt to climate change, cities are studying various urban cooling techniques to improve 
pedestrian thermal comfort of users during heatwaves including urban greening and cool materials [1,2]. On 
technique being considered by the City of Paris is cool pavements [3] . To this aim, an experimental test site 
has been constructed and instrumented to study the thermal and climatic behavior of candidate sidewalk 
structures.
The experimental demonstrator is located in Bonneuil-sur-Marne near Paris, France. This experimental 
device consists of 16 samples of various sidewalk structures [4]. Each sample is approximately 4x4m across 
by 25 cm deep and is composed of several layers following real-world conditions. The samples are 
instrumented with temperature and heat flow sensors at several depths, with the data recorded every 5 
minutes. Additional weather measurements are also conducted onsite to monitor air temperature and 
humidity, global horizontal short- and longwave irradiance as well as wind speed and direction. 
This communication is focused on data collected during the summers of 2021 and 2022, specifically 
temperatures and heat fluxes and the derived surface heat budget of each sample. These data from each 
strcture will be analyzed with respect to their contribution to the degradation of pedestrian thermal comfort 
as well as to the urban heat island effect in order to inform the city services in their selection of suited 
sidewalk materials. 
Additional testing inside a climate chamber will supplement the demonstrator test site with complementary 
measurements performed in the laboratory. 

References:

[1] H. Akbari, M. Pomerantz, and H. Taha, “Cool surfaces and shade trees to reduce energy use and improve 
air quality in urban areas,” Sol. Energy, vol. 70, no. 3, pp. 295–310, Jan. 2001.
[2] M. Chanial, G. Karam, S. Parison, M. Hendel and L. Royon. (2022). Microclimatic analysis of an 
experimental cooling watering device (in French).. CIFQ 2022, Paris (France).
[3] Santamouris, M. (2013). Using cool pavements as a mitigation strategy to fight urban heat island—A 
review of the actual developments. Renewable and Sustainable Energy Reviews, 26, 224-240. 
[4] S. Parison, M. Chanial, F. Filaine and M. Hendel. (2022). Surface heat budget of sixteen pavement 
samples on an experimental test site in the Parisian region. SURF 2022, Milano (Italy).

How to cite: Abboud, C., Parison, S., Filaine, F., Hendel, M., Royon, L., and Chanial, M.: Cool pavements for adapting Paris to climate change, EGU General Assembly 2024, Vienna, Austria, 14–19 Apr 2024, EGU24-15460, https://doi.org/10.5194/egusphere-egu24-15460, 2024.

EGU24-15471 | ECS | Posters on site | CL2.5

Monitoring pedestrian heat stress in Greater Paris 

James Kamara, Frédéric Filaine, Arnaud Grados, Nassim Filaoui, Basile Chaix, Julien Bigorgne, Martin Hendel, and Laurent Royon

Urban heat islands, combined with extreme heat waves, can provoke a public health risk. During the 2003 heat wave in Paris, strong correlations were observed between nighttime outdoor air temperatures and mortality [1]. However, previous studies only focus on outdoor nighttime air temperatures when citizens are sleeping, without linking these observations with the heat stress they may have been exposed to during the day or in their apartment. 

This standpoint is one of the principal aims of  “Heat waves, urban Health islands, Health: a mobile sensing approach” (H3Sensing ANR research project) by adopting citizen science methods in order to measure heat stress exposure over several days as well as physiological parameters. Mobile measurements of microclimatic parameters [2] allow us to characterize and map heat stress exposures [3] in Greater Paris. Stationary measurements in apartments and surveys will complete the data set which will be combined with measured physiological data.

Initial prototyping and testing of the microclimatic measurement kits and sensor characterization are presented and perspectives discussed. Besides, the constraints related to the prototype, such as using low-cost sensors or battery autonomy, will be discussed too.


References:

[1] Karine Laaidi, Abdelkrim Zeghnoun, Bénédicte Dousset, Philippe Bretin, Stéphanie Vandentorren, Emmanuel Giraudet and Pascal Beaudeau.(2011). The Impact of Heat Islands on Mortality in Paris during the August 2003 Heat Wave, Environmental Health Perspectives.

[2] Riccardo Bartoli, Frédéric Filaine, Sophie Parison and Martin Hendel. (2022). Development of a portable device for measuring thermal stress of a pedestrian (in French). CIFQ 2022, Paris(France).

[3]  Ilaria Pigliautile, Anna Laura Pisello.A new wearable monitoring system for investigating pedestrians' environmental conditions: Development of the experimental tool and start-up findings, CIRIAF ‐ Interuniversity Research Center, (Elsevier B.V.), University of Perugia, Perugia, Italy, (2018).


How to cite: Kamara, J., Filaine, F., Grados, A., Filaoui, N., Chaix, B., Bigorgne, J., Hendel, M., and Royon, L.: Monitoring pedestrian heat stress in Greater Paris, EGU General Assembly 2024, Vienna, Austria, 14–19 Apr 2024, EGU24-15471, https://doi.org/10.5194/egusphere-egu24-15471, 2024.

EGU24-15826 | ECS | Orals | CL2.5

Evaluating the implementation of the new urban parameterization for the ICON atmospheric model: results over Italy 

Angelo Campanale, Marianna Adinolfi, Mario Raffa, Jan-Peter Schulz, and Paola Mercogliano

The increasing in the resolution of atmospheric models for numerical weather prediction and climate simulations allows a more accurate description of the physical processes at urban scale. Furthermore, as the world continues to warm, urban areas are expected to face the brunt of the impacts due to large populations and higher temperatures.

In all this scenario, the interest in proper modelling the physical processes in urban areas has gained wide attention from the research community. In particular, the convection-permitting atmospheric models, associated with urban parameterizations, are able to resolve the heterogeneity of cities with applications for heat stress assessment and the development of urban climate adaptation and mitigation strategies. Generally, these schemes parametrize the effects of buildings, streets and other man-made impervious surfaces on energy, water and momentum exchanges between surface and atmosphere, accounting also for the anthropogenic heat flux, as a heat source from the surface to the atmosphere due to human activities.

In this perspective, a bulk urban canopy parameterization, TERRA_URB, has been developed for the multi-layer land surface scheme of the COSMO regional atmospheric model. This parameterization has already demonstrated to be able to properly take into account the overall properties of urban areas and to correctly reproduce the prominent urban meteorological characteristics for different European cities. Thus, in the framework of the transition from the COSMO model to the new Icosahedral Nonhydrostatic (ICON) Weather and Climate regional model, TERRA_URB needs to be implemented in ICON.

In this work, we present the results for TERRA_URB in the ICON-LAM (limited area model), for some cities of the Italian peninsula at 2km resolution. The main outcome of this study is that the porting of the TERRA URB scheme in ICON is satisfactorily completed, and it reasonably reproduces urban effects, like Urban Heat Islands, while improving air temperature forecasts for the investigated urban areas. The results constitute an updating of numerical weather prediction and climate simulations for urban modelling applications, although further investigations aimed at enhancing the calibration of the model parameterization and introduction of more realistic urban canopy parameters are needed.

How to cite: Campanale, A., Adinolfi, M., Raffa, M., Schulz, J.-P., and Mercogliano, P.: Evaluating the implementation of the new urban parameterization for the ICON atmospheric model: results over Italy, EGU General Assembly 2024, Vienna, Austria, 14–19 Apr 2024, EGU24-15826, https://doi.org/10.5194/egusphere-egu24-15826, 2024.

EGU24-15984 | Orals | CL2.5

Comparison of different methods to produce local climate zone maps using the LczExplore tool 

Erwan Bocher, Matthieu Gousseff, Bernard Jérémy, Elisabeth Le Saux Wiederhold, Baptiste Alglave, and Emmanuelle Kerjouan

Urban climate conditions under global or regional change are a major stake for city planners and policy makers.

Members of the different involved communities need a common way to describe urban territory, a way that urban planners and policy makers can easily comprehend and that at the same time can be validated by specialists of the different science relevant fields : climatology, meteorology, building energy, environment and social sciences...

Local Climate Zones (LCZ) have proven their usefulness as an easy to use and scientifically founded concept.

Several methods aim at classifying a territory into LCZ, and a few workflow even allow an automatic classification. These methods produce maps which are often similar, but may show some differences, due to input data or implemented algorithm.

Outside these technical considerations, to assess the impact of urban planning scenarios, one may also want to compare maps before and after the planned urban renovation projects.

Therefore, the need for automation of LCZ map comparison asks for an easy to use tool.

The `lczexplore` package is a free open-source package that allows to easily import, visualize, group and compare LCZ maps, even if they do not use the same spatial units / resolution. These LCZ maps can come from vector layers or raster layers. Five steps are usually performed by the tool:

1. The LCZ classifications (or any other qualitative variables) are imported from a file (geojson or shapefile format)

2. Each LCZ classification can then be visualized

3. Some LCZ levels may be grouped in broader categories

4. A pair of LCZ classifications (or qualitative variable maps) can then be compared:

- a map of agreement/disagreement is produced,

- the general agreement and a pseudo-kappa indicator of agreement are computed,

- the summed surface of each LCZ type is computed for each classification,

- a confusion matrix shows how the levels of one LCZ classification break up into the levels of the other

5. Influence of the level of confidence on the agreement between classifications is performed (sensitivity analysis)

To illustrate the use of LczExplore, we propose a study case where three different maps are compared :

- one created within the WUDAPT project, an approach using remote sensor data and machine-learning algorithm

- a second created using the GeoClimate software and geographical data provided by an institutionnal actor (the French National Geographical Institute)

- a third created using the GeoClimate software and crowdsourced geographical data (from OpenStreetMap).

The use of lczexplore package allows to easily visualize how the different map agree or differ, and gives insight on how methods can be complementary to each other, and how input data or algorithms could be improved in the future.

How to cite: Bocher, E., Gousseff, M., Jérémy, B., Le Saux Wiederhold, E., Alglave, B., and Kerjouan, E.: Comparison of different methods to produce local climate zone maps using the LczExplore tool, EGU General Assembly 2024, Vienna, Austria, 14–19 Apr 2024, EGU24-15984, https://doi.org/10.5194/egusphere-egu24-15984, 2024.

EGU24-16110 | ECS | Orals | CL2.5 | Highlight

Downscaling climate projections to map future outdoor thermal comfort in cities based on a deep learning approach 

Ferdinand Briegel, Simon Schrodi, Markus Sulzer, Thomas Brox, Andreas Christen, and Joaquim G. Pinto

Outdoor thermal comfort is influenced not only by meteorological variables air temperature, radiation and humidity at regional and local scales but also by local parameters such as mean radiant temperature and wind patterns, which vary at meter-scale within cities. All these factors can be affected by ongoing climate change. Hence, modelling future thermal comfort requires a multi-scale approach. Thermal comfort in outdoor settings can be quantified and described by thermal indices such as the Universal Thermal Climate Index (UTCI), which reflects the human response to environmental and physiological forcing. To date, several microscale modelling approaches have been proposed to model the meteorological and geometric variables that contribute to the UTCI, but they are all highly detailed, complex and computationally intensive. As a result, only individual heat waves, short case studies or single points have been modelled to estimate future heat stress conditions in cities.

This study introduces a novel and efficient deep-learning model that instantly and accurately predicts thermal comfort maps across entire cities and for long periods. This model is unique in its adoption of a solitary deep learning architecture, avoiding the use of sub-models that separately model, for example, air temperature or wind speed. We will refer to this model as the Unified Human Thermal Comfort Neural Network (UHTC-NN). Training and evaluation of the UHTC-NN is based on a machine learning model from a previous study, which combines four sub-models modelling air temperature, mean radiant temperature, wind speed, and relative humidity into UTCI. The UHTC-NN has a mean absolute error of 0.5 K compared to its preceding model. The UHTC-NN enables new applications of thermal comfort modelling, including meter-scale urban climate projection to support climate adaptation management in cities.

In a case study, we apply UHTC-NN to downscale 15 EURO-CORDEX climate projections with a 3-hour resolution over 30 years to generate high-resolution (1x1 m) street-level outdoor thermal comfort maps for the city of Freiburg, Germany. We compare the changes in UTCI frequency distribution and uncertainties of three different Representative Concentration Pathways (RCP2.6, 4.5 and 8.5) for the years 2070-2099 with the historical climate (1990-2019). Our study models the entire city center of Freiburg, with a domain size of 2.5x2.5 km, covering various aspects of the city's urban form. We show that the average number of hours per year with strong to extreme heat stress (UTCI >= 32°C) will increase up to three and six times for RCP2.6 and RCP8.5, respectively. The number of night-time hours with UTCI >= 20°C will increase by a factor of two and five, respectively for RCP2.6 and RCP8.5, compared to the 1990-2019 period. In addition, the 80th UTCI percentile shifts by 2°C and 4°C for RCP2.6 and RCP8.5, respectively. The presented high-resolution urban climate simulations allow us to identify intra-urban variability and daytime / nocturnal hot-spots where climate change will have the greatest impacts on outdoor thermal comfort. Such urban climate simulations therefore allow for an effective selection of areas where climate adaptation needs to be prioritized.

How to cite: Briegel, F., Schrodi, S., Sulzer, M., Brox, T., Christen, A., and Pinto, J. G.: Downscaling climate projections to map future outdoor thermal comfort in cities based on a deep learning approach, EGU General Assembly 2024, Vienna, Austria, 14–19 Apr 2024, EGU24-16110, https://doi.org/10.5194/egusphere-egu24-16110, 2024.

EGU24-16326 | ECS | Posters on site | CL2.5

Integrating Quality Control and Data Gathering in Space-Time Analysis for Temperature Assessment in European Cities 

Setareh Amini and Stefan Brönnimann

Urban areas across Europe are facing unprecedented challenges from climate change, further intensified by the emergence of urban heat islands (UHIs). The resulting elevated temperatures within cities have profound implications for public health, energy consumption, and overall urban liveability. Climate adaptation and evidence-based urban planning that are needed to address these pressing issues require a better understanding of urban temperature dynamics. To address this pressing issue, our research aims to bridge a critical gap in our understanding of urban temperature dynamics through a comprehensive space-time analysis focused on 9 European cities. The primary emphasis at this stage is placed on the foundational step: collection, enhancement, and intercomparison of local temperature information. This initiative, which is part of the European COST-Action FAIRNESS (https://www.fairness-ca20108.eu/), is driven by the imperative need for accurate and localized data to inform evidence-based urban planning and climate adaptation strategies, highlighting the urgency and significance of our research.


We collected measurements from nine European cities, namely, Amsterdam, Basel, Bern, Biel, Turku, Rennes, Novi Sad, Birmingham, and Zurich The initial phase of the work involved the collection of raw data from different networks, encompassing varying time periods. The datasets exhibited considerable diversity in formats and temporal resolutions, necessitating meticulous handling. In parallel, metadata relevant to each dataset was collected. The primary step was to standardize all data into a common file format, with the Station Exchange Format (SEF) being the chosen standard. During this formatting process, a version with harmonized time resolution was generated, ensuring coherence across the datasets. Subsequently, a series of automatic quality control procedures were developed to systematically enhance the reliability and precision of the datasets. These procedures were designed to be universally applicable to all stations, promoting consistency in the assessment of temperature data. Additionally, for certain networks, a radiation correction was implemented to further refine the accuracy of the collected information.


Looking ahead, the datasets will be published, offering accessibility to urban planners and other stakeholders. The outcomes of this preliminary phase not only contribute to advancing space-time analysis in temperature assessment but also establish a robust foundation for subsequent research stages. The significance of this work resonates with urban planners, environmental scientists, and policymakers actively involved in crafting localized strategies for climate-resilient urban planning in European cities.

How to cite: Amini, S. and Brönnimann, S.: Integrating Quality Control and Data Gathering in Space-Time Analysis for Temperature Assessment in European Cities, EGU General Assembly 2024, Vienna, Austria, 14–19 Apr 2024, EGU24-16326, https://doi.org/10.5194/egusphere-egu24-16326, 2024.

At the end of the century, during the hot summer days, the thermal environment will be unbearable in most of the outdoor spaces of the cities. The few locations where the thermal environment will remain moderate will constitute heat shelters. The present study analyses the evolution of the quantity and the nature of the outdoor heat shelters, in a 27km2 central portion of the Lyon conurbation, during a hot summer day that is representative of the climate at the end of the century.

A specific methodology has been applied to perform such an analysis. The weather data for the representative hot summer day (RHSD) was selected within a database of weather projections made available by the CORDEX project. The RHSD represents weather conditions that may happen statistically once every 5 years, during the 14th of July, in Lyon, at the end of the century. Then, mean radiant temperature and operative temperature predictions were performed using the SOLWEIG micro-meteorological model. The heat shelters were defined as the outdoor locations where the operative temperature is below 37°C. With this definition, the heat shelters may not provide thermal comfort, but prolongated stays in the heat shelters would be safe for most of the population. The quantity of available heat shelters was measured through the heat shelter area per capita, which represents the total of the area covered by the heat shelters divided by the number of inhabitants in the domain.

During the RHSD, the heat shelters area goes below  per capita between 10:15 and 17:45, and reaches  between 15:00 and 16:00. During this period, the outdoor public domain is not able to provide heat shelters. This result suggests that people will have to adapt their way of life to the disappearance of heat shelters in the core of the afternoons, in order to avoid prolongated stays in the outdoor public environment.

The observation of the heat shelter maps reveals that, between 9:00 and at 19:00, the heat shelters are exclusively located within shaded areas. Continuous tree covers are more efficient than buildings to provide heat shelters: between 13:00 and 14:00, heat shelters are exclusively located in the core of the urban forests. In the streets, the capacity of shaded areas to provide heat shelters highly depends on the presence of surfaces (buildings façade or soil) that reflect the solar radiation toward the shaded areas. This result invites to rethink the way climate adaptation solutions should be designed in cities.

How to cite: David, D. and Salles, M.: Evaluation of the heat shelters availability in the city of Lyon, during a hot summer day at the end of the century., EGU General Assembly 2024, Vienna, Austria, 14–19 Apr 2024, EGU24-16912, https://doi.org/10.5194/egusphere-egu24-16912, 2024.

EGU24-16969 | ECS | Orals | CL2.5 | Highlight

Modelled outdoor temperature effects and heat-related mortality impact of cool roofs and rooftop photovoltaics in London 

Charles H. Simpson, Oscar Brousse, Michael Davies, and Clare Heaviside

Population exposure to high temperatures poses health risks and increases mortality, but comprehensive studies comparing impacts of building and street levels interventions on air temperature at urban scales are still lacking. High-albedo roofs (also called “cool roofs”) can lower the air temperature in urban areas, compared to standard low-albedo roofs. As part of the transition to renewable power generation rooftop regional authorities in the UK have set targets for rooftop solar panel capacity, but some recent studies have argued that solar panels may increase urban temperatures and therefore have unintended consequences. Using advanced urban climate modelling (WRF BEP-BEM), we model the impact of these cool roofs and rooftop photovoltaics on urban air temperature during the record-breaking hot summer of 2018, and estimate the impact these measures may have on heat-related mortality.

We find that cool roofs and rooftop photovoltaics both decrease modelled daily-mean temperature compared to standard low-albedo roofs. Rooftop photovoltaics may reduce heat-related mortality by 96 (12%), or cool roofs by 249 (33%), in scenarios where all roofs have these measures. Monetised using value of statistical life, we estimate benefits for solar roofs and cool roofs of £237M and £616M respectively for London July-August 2018 conditions, and we estimate 20 TWh of electricity, worth £3-6 billion, would be generated in the rooftop PV scenario. Our modelling indicates that, in the conditions of London July-August 2018, rooftop PV or cool roofs may reduce near-surface air temperatures and therefore heat related mortality, with cool roofs having a larger effect.

How to cite: Simpson, C. H., Brousse, O., Davies, M., and Heaviside, C.: Modelled outdoor temperature effects and heat-related mortality impact of cool roofs and rooftop photovoltaics in London, EGU General Assembly 2024, Vienna, Austria, 14–19 Apr 2024, EGU24-16969, https://doi.org/10.5194/egusphere-egu24-16969, 2024.

EGU24-17406 | ECS | Orals | CL2.5

Climate sensitive designs for policy makers: how well can LES models represent urban microclimates? 

Leyla Sungur, Wolfgang Babel, Eva Spaete, and Christoph Thomas

Cities can offer an extraordinarily high or low urban level of climatic stressors depending on their location and topographical setting, infrastructural geometry and anthropogenic activities. To protect human well-being today and in the future, it is crucial to better understand how to mitigate temperature extremes in cities. Since cities are constantly growing and transforming in response to their residents’ needs, planning a foresighted sustainable climate-friendly infrastructure is critical. This need creates a niche for research to assess local climate effects that effect the lower atmosphere ground layer where human activity takes place. Large Eddy Simulation (LES) models can simulate heat transport and mixing processes by directly resolving large-scale turbulence and are often used to simulate urban development activities potentially mitigating the adverse effects of heatwaves in cities. Despite their growing use in forming recommendations, these models are inherently difficult to validate which leads to ‘simply believing them’.

We evaluate the performance of an urban LES model against a reference multi-station observational network focusing how well the space-time dynamics of distinct urban microclimate including densely-built hot spots, peri urban and park-cool islands agree. We selected a 72-hour extreme heatwave period in July 2019 in a mid-sized city in Germany which suffers from a similarly large urban heat island effect as larger cities. We investigated air temperature, air humidity, wind speed and direction as key elements impacting the perceived heat stress or relief by humans. Observations were compared to the PALM-4U LES model with a nested domain dynamically driven by the mesoscale COSMO-D2 output by the German Meteorological Service at spatial resolutions of 20 m and 5 m domain. We employed the stochastic multiresolution decomposition (MRD) technique applied to two-point correlation statistics for characterizing the space-time behavior.

Absolute air temperatures differences amounted to +5 K overestimation of modeled nocturnal air temperatures. A key finding from the MRD analysis is that correlation between stations does not follow separation distance (as expected for homogeneous domains) but rather the distinct urban microclimatic for air temperature and specific humidity in both observations and model at both resolutions. Separating the results into day and night shows distinct differences for air temperature and specific humidities for both model resolutions compared to the observations, but only small differences for near-surface winds. The model performance varies with its resolution and climate element: while winds are better represented in the finer 5 m resolution, specific humidity cannot be simulated properly by the model at night. Air temperature during day is better represented by the 20 m resolution, while the match between observations and the 5 m-prediction is better at night.

We show that the LES model can simulate the statistical space-time behavior of urban microclimates but performs poorly when absolute targets are modeled. Simulated air temperature and specific humidity follow mostly the implemented synoptic advective forcing large scale model which does not recognize local microclimatic effects. For near-surface winds, this model performs better with finer resolution as the larger eddies resolved depend on the geometry of the city.

How to cite: Sungur, L., Babel, W., Spaete, E., and Thomas, C.: Climate sensitive designs for policy makers: how well can LES models represent urban microclimates?, EGU General Assembly 2024, Vienna, Austria, 14–19 Apr 2024, EGU24-17406, https://doi.org/10.5194/egusphere-egu24-17406, 2024.

EGU24-17510 | ECS | Posters virtual | CL2.5

Exploring the impact of Local Climate Zones to the efficacy of cooling materials at the urban scale 

Nikolaos Michail Stavrianos, Ilias Agathangelidis, Constantinos Cartalis, and Christos Giannaros

The Mediterranean region is an exceptionally thermally vulnerable area, projected to suffer from frequent and severe heatwaves in the coming decades. Numerical simulations enable a comparative assessment of different heat adaptation strategies. Additionally, the Local Climate Zone (LCZ) scheme allows a standardized classification of urban neighbourhoods depending on their urban form. In this work, high resolution microscale simulations using ENVI-met are conducted for Athens, Greece, under typical summer conditions (simulated by the Weather Research and Forecasting model) and idealized configurations of high density LCZs 2 and 3. For each LCZ, a total of four simulations are performed, starting from the base situation and three additional scenarios where cooling materials are applied on ground surfaces and/or rooftops. Each scenario is assessed in terms of the reduction in air temperature within the simulation area. Findings indicate that the efficacy of cooling materials varies depending on LCZ characteristics. Understanding these differences is necessary for implementing targeted strategies to mitigate urban overheating for specific urban settings.

How to cite: Stavrianos, N. M., Agathangelidis, I., Cartalis, C., and Giannaros, C.: Exploring the impact of Local Climate Zones to the efficacy of cooling materials at the urban scale, EGU General Assembly 2024, Vienna, Austria, 14–19 Apr 2024, EGU24-17510, https://doi.org/10.5194/egusphere-egu24-17510, 2024.

EGU24-17816 | Posters on site | CL2.5

Quantifying Adaptation Measures for Thermal Stress in German Cities using the Microscale Urban Climate Model PALM-4U: Insights from the UrbanGreenEye Project 

Mohamed Salim, Sebastian Schubert, Sebastian Lehmler, Benjamin Stöckigt, Annett Frick, and Galina Churkina

The UrbanGreenEye project is a collaborative research initiative focusing on monitoring urban areas for climate change adaptation using remotely sensed indicators. The project addresses the critical need for comprehensive and accessible data to support sustainable urban development. In the context of climate change adaptation, the project recognizes the challenges faced by local civil services in obtaining timely and cost-effective information about urban structures. This study presents the crucial role of the microscale building-resolving urban climate mode PALM-4U in quantifying the effectiveness of vital indicators derived from Earth Observation, such as land surface temperature (LST), urban green volume, vegetation vitality, and imperviousness. For instance, the implementation of PALM-4U enables a detailed deficit analysis of urban green volume, allowing for the identification of areas experiencing thermal and hydrological stress. The model PALM-4U is used in validating greening scenarios, providing valuable insights for urban planners and decision-makers in formulating effective adaptation measures. Recognizing the inherent uncertainties in satellite-based calculations of indicators, the model PALM-4U investigates the impact of these uncertainties on the accuracy of PALM-4U simulations. By employing artificial intelligence algorithms, including Convolutional Neural Networks (CNN) and Long Short-Term Memory (LSTM) models, the UrbanGreenEye project aims to enhance the reliability of satellite-derived data for improved urban climate modeling. Through collaboration with nine partner municipalities, this research contributes to bridging the gap between remote sensing capabilities and local authorities' needs. The outcomes of this study will facilitate the creation of a robust model for urban green volume deficiency, identifying hotspots for adaptation measures and supporting evidence-based urban planning strategies. Additionally, urban areas, influenced by the urban heat island effect, experience elevated surface and air temperatures due to factors such as increased solar absorption, lack of vegetation, and human activities. The model PALM-4U is used to explor the relationship between surface and air temperatures. Understanding this correlation is crucial for informing decisions by city planners and policymakers to mitigate the urban heat island effect. The insights gained also aid meteorologists in accurate temperature predictions for urban areas and contribute to scientific understanding of temperature dynamics, providing valuable perspectives on the potential impacts of climate change on future cities. Ultimately, the assessment of remotely sensed indicators using the model PALM-4U within the UrbanGreenEye project is considered a considerable step towards enhancing the resilience of urban areas to climate change.

How to cite: Salim, M., Schubert, S., Lehmler, S., Stöckigt, B., Frick, A., and Churkina, G.: Quantifying Adaptation Measures for Thermal Stress in German Cities using the Microscale Urban Climate Model PALM-4U: Insights from the UrbanGreenEye Project, EGU General Assembly 2024, Vienna, Austria, 14–19 Apr 2024, EGU24-17816, https://doi.org/10.5194/egusphere-egu24-17816, 2024.

EGU24-18972 | Posters on site | CL2.5

Extreme heat hazard in the urban areas of Romania in a changing climate 

Dana Magdalena Micu, Sorin Cheval, Alexandru Dumitrescu, Raluca Smău, and Vlad Amihăesei

Cities emerge as particularly vulnerable environments to climate extremes, exacerbated by the observed climate change These environments are human heat stress hotspots due to the amplified contribution of the urban heat island effect and joint action of extreme weather events  The study aims to detect and quantify the changing signals in the combined heat hazard (CHH), associated with concurrent hot days (HD - maximum temperature above 30˚C) and nights (HN - minimum temperature above 20˚C) in 40 large cities of Romania (>100,000 inhabitants), including the capital city. CHH is highly relevant in the assessment of heat-health risk through its inhibiting influence on the recovery from daytime heat stress and exacerbation of the extreme heat impact through sleep deprivation at night. We use homogenized climate observations (1961-2021) and ensemble EUROCORDEX simulations (RCP4.5, RCP8.5), for the near future (2021-2050) and far-future (2071-2100), to analyse the temporal changes in two CHH metrics: CHHf - frequency (number of co-occurrences of HD and HN), and CHHl - length (the maximum number of consecutive co-occurrences of HD and HN). The results show consistent geographical patterns in the change signals of the CHH metrics, over both present and future climates. The strongest change signals in CHH, as well as the most pronounced projected changes, especially in the far-future under RCP8.5 are found in the cities located in the southern, eastern and western lowlands of the country (i.e., Bucharest, Giurgiu, Iasi, Timisoara).

These cities show strong increases in both frequency and duration of CHH, almost doubling by 2050 and even more by 2100. These results are suggestive of a consistent amplification and northward expansion of the areas prone to CHH (i.e., cities located in the central and northern parts of the country).

The correlations between the temporal variability of CHH and the cooling degree days provide an improved understanding of the relationship between energy consumption and prevailing climatic conditions during the extreme heat episodes in urban areas, under both present and future climate warming. The study provides valuable insights into the urban heat hazard and provides science-based evidence that could be used for assessing the heat-health risk at the city scale and optimisation of decision-making for climate change adaptation. 

This study has been funded by the project Synergies between Urban Heat Island and Heat Wave Risks in Romania: Climate Change Challenges and Adaptation Options (SynUHI) PN-III- P4-PCE-2021-1695 


How to cite: Micu, D. M., Cheval, S., Dumitrescu, A., Smău, R., and Amihăesei, V.: Extreme heat hazard in the urban areas of Romania in a changing climate, EGU General Assembly 2024, Vienna, Austria, 14–19 Apr 2024, EGU24-18972, https://doi.org/10.5194/egusphere-egu24-18972, 2024.

EGU24-19264 | Posters on site | CL2.5

Sub-daily Land Surface Temperature data for urban heat monitoring from spaceenhanced by machine learning 

Christian Mollière, Lukas Kondmann, Julia Gottfriedsen, and Martin Langer

Urban heat islands are becoming a major health factor for cities in the eye of a warming planet. Fueled by impervious surfaces and rising temperatures, extreme heat may lead to 235,000 emergency room visits and 56,000 hospital admissions annually in the US alone in 2023 [1]. Beyond its economic impact, urban heat therefore puts a strain on wellbeing and health across the globe with visible effects on mortality.

Urban planning aims to mitigate extreme heat in cities, a challenge intensified by urban densification and climate change. However, accurately predicting and managing urban heat is complex due to the difficulty in measuring local physical processes, particularly in dynamically changing environments. The scarcity of granular measurements of land surface temperature compounds this issue. While satellite imagery from thermal instruments offers some assistance, traditional data sources often lack the necessary temporal density of observations. Rapid diurnal temperature fluctuations necessitate near-real-time monitoring for effective decision-making and a comprehensive understanding of urban temperature dynamics.

New Space constellations with higher temporal cadence are starting to close this data gap with enormous potential for urban development as well as extreme heat event anticipation. For example, OroraTech’s Forest constellation allows frequent observation of urban areas. With 2 satellites operating in orbit and 9 more planned to launch in 2024, we aim to provide Land Surface Temperature (LST) every 12 hours globally. Once our full constellation is operational in 2027, the update frequency will again improve to sub-hourly.

The native spatial resolution of Forest data at 200m is, however, a challenge for urban applications. We are currently exploring enhancing our imagery with artificial intelligence approaches to 70m to get from city quarter to building block level. These super-resolution techniques are the result of recent advancement in AI and image processing with promising results on our thermal data. Yet, the usability of super-resolved data for urban policy is underexplored. We aim to present preliminary findings of the accuracy of our super-resolution method compared with higher resolution Ecostress data and investigate the applicability of the results for urban planning as well as extreme heat event analysis. With this, we aim to help cities to mitigate and adapt to the new public health challenges as a result of extreme heat.

[1]: Yale Program on Climate Change Communication, 2023 https://yaleclimateconnections.org/2023/07/extreme-heat-will-cost-the-u-s-1-billion-in-health-car e-costs-this-summer-alone/

How to cite: Mollière, C., Kondmann, L., Gottfriedsen, J., and Langer, M.: Sub-daily Land Surface Temperature data for urban heat monitoring from spaceenhanced by machine learning, EGU General Assembly 2024, Vienna, Austria, 14–19 Apr 2024, EGU24-19264, https://doi.org/10.5194/egusphere-egu24-19264, 2024.

EGU24-19271 | Posters on site | CL2.5

Compound impact of extreme summer heat waves and droughts on surface urban heat island in Budapest 

Zsuzsanna Dezső and Rita Pongrácz

The aim of our research is to investigate how heat waves affect the surface urban heat island (SUHI) phenomenon in Budapest, a mid-latitude city with significant year-to-year differences in temperature and precipitation. A unique, 22-year long time series of continuous measurements from the MODIS instrument on NASA's Terra and Aqua satellites was used to study the SUHI pattern, surface temperature and humidity in detail. The two decades of surface temperature data show a significant warming trend. Analysis of the summers shows that the SUHI intensity decreases as the rural area around the city becomes warmer, especially in July and August, as the less moisture available in the rural area is unable to reduce the surface temperature, similar to the urban area. Thus, the SUHI intensity is mainly determined by the rural surface temperature. During summers with frequent and intense heat waves and droughts, the SUHI is very weak because the land surface temperatures are very high in both urban and rural areas resulting in very little difference between the built-up area and the vegetation-covered surrounding. In our research, we analyse this phenomenon in detail for the years 2003, 2007 and 2022, when intense heat waves occurred in the region. Due to climate change, heat waves and droughts are projected to become more frequent, more intense and more persistent in the future, which is likely to result in adverse effects to the quality of life of urban populations. A detailed analysis aiming to understand the complex environmental processes in the urban environment is essential to develop effective adaptation strategies to the upcoming challenges of climate change.

Acknowledgements: Research leading to this study has been supported by the Hungarian National Research, Development and Innovation Fund (under grant K-129162) and the National Multidisciplinary Laboratory for Climate Change (RRF-2.3.1-21-2022-00014).

How to cite: Dezső, Z. and Pongrácz, R.: Compound impact of extreme summer heat waves and droughts on surface urban heat island in Budapest, EGU General Assembly 2024, Vienna, Austria, 14–19 Apr 2024, EGU24-19271, https://doi.org/10.5194/egusphere-egu24-19271, 2024.

EGU24-19427 | ECS | Orals | CL2.5

High spatio-temporal monitoring of weather and outdoor thermal comfort in urban environments: A modular sensor network, first year data and outreach 

Gregor Feigel, Marvin Plein, Matthias Zeeman, Dirk Schindler, Andreas Matzarakis, Swen Metzger, and Andreas Christen

Timely information on the effects of the increasing intensity, frequency and duration of heatwaves on cities and critical infrastructure is needed for warning, emergency management and for developing context-specific climate adaptation strategies. Aside from the challenge of deploying sensor networks within built environments, there are hardly any operational city-wide networks that continuously measure and communicate human thermal comfort indices in public spaces. 

To address this gap, a two-tiered weather and outdoor human thermal comfort monitoring network was developed and deployed in Freiburg in 2022. The monitoring network comprises a total of 42 automatic weather stations primarily mounted on public lamp posts at a height of 3 m, with the Tier-I network consisting of 13 customised stations, which are equipped with an in-house developed data logging unit optimised for this application, that is extend by a spatially dense but less complex Tier-II network consisting of 29 commercial weather stations. Both networks collect data on air temperature, humidity and precipitation, with the Tier-I network providing additional data on wind, radiation, pressure, lightning, solar radiation and black-globe temperature to calculate human-biometeorological thermal indices such as the Physiological Equivalent Temperature (PET). 

Over the course of the first year of deployment (01-Sept-2022 to 31-Aug-2023), the stations have continuously collected high-resolution data (30 and 60 sec) with only little data loss. In a case study, the intra-urban differences in thermal comfort were analysed during the hot month of July 2023, in which five official heat warnings were issued by the German Meteorological Service (DWD). The results show expected intra-urban and urban-rural contrasts and that mid-density sites experience the highest number of summer days, totalling 22, compared to 19-20 in the city centre. The highest amount of moderate heat stress and higher (PET > 29°C) was observed in FRLAND (26,3%) compared to 13-19% at rural sites. Also more tropical nights were observed at inner city sites with 5-6, compared to 3 at outer, primarily suburban sites. Remote and rural sites reported no tropical nights. 

Over the full annual cycle and the entire network, the number of tropical nights ranged between 0 (rural) and 29 (inner city) per year. The highest number of summer days per year was recorded in industrial and suburban areas (up to 101) compared to 84-97 days in the city centre and 62-90 days at rural sites. The average annual air temperatures reveal a distinct long-term heat island with an annual mean temperature up to 14.0°C in the city centre, and 11.6°C - 12.7°C at rural sites of same elevation.

These results highlight the benefit of continued monitoring for real-time assessments, efficient identification of hot-spots for climate adaptation strategies, and model evaluation and to improve our understanding of urban heat islands and human thermal comfort patterns. In addition, an outreach platform and mobile app (uniWeatherTM) have been developed to provide end-users and the public with free access to real-time data and interpretation following FAIR principles.

How to cite: Feigel, G., Plein, M., Zeeman, M., Schindler, D., Matzarakis, A., Metzger, S., and Christen, A.: High spatio-temporal monitoring of weather and outdoor thermal comfort in urban environments: A modular sensor network, first year data and outreach, EGU General Assembly 2024, Vienna, Austria, 14–19 Apr 2024, EGU24-19427, https://doi.org/10.5194/egusphere-egu24-19427, 2024.

The third United Nations Conference on Housing and Sustainable Urban Development (HABITAT-III) in October 2016 adopted the New Urban Agenda (United Nations, 2017), which brings into focus urban resilience, climate and environment sustainability, and disaster risk management.
Following the event at the United Nations Economic and Social Council, efforts are required from WMO to consolidate its input to the revision of the New Urban Agenda (NUA) and support urban related activities in a comprehensive manner. Urban development is now a cornerstone of the United Nations 2030 Sustainable Development Goals. It has its own sustainable development goal (SDG 11): Make cities inclusive, safe, resilient and sustainable.
To support implementation of urban activities the WMO inter-programme Urban Expert Team under the Commission for Atmospheric Sciences and Commission for Basic Systems (2018) supported by a dedicated team of urban focal points in the Secretariat developed the Guidance on Integrated Urban Hydro-Meteorological, Climate and Environmental Services (IUS). The needs for integrated urban services (IUS) include information for short-term preparedness (e.g. hazard response and early warning systems), longer-term planning (e.g. adaptation and mitigation to climate change) and support for day-to-day operations (e.g. water resources). The aim is to build urban systems and services that meet the special needs of cities through a combination of dense observation networks, high-resolution forecasts, multi-hazard early warning systems, disaster management plans and climate services. This approach gives cities the tools they need to reduce emissions, build thriving and resilient communities and implement the UN Sustainable Development Goals.

The ways and approaches, as well as priorities for relization of such systems depend on specific climatic, geographical, economical and environmental conditions specific cities. In this presentation we will classify and concider different approaches, methodologies and tools for selected cities in different climate zones (e.g. northern, tropical), economical conditions (developed and developing worlds) and combinations of risk factors (e.g., multi-hazards, heat stress, floods, air quality). Specific focus will also be done on the mitigation and adaptation strategies and their combinations. 

How to cite: Baklanov, A.: Integrated Hydrometeorology, Climate and Environmental Systems and Services for Sustainable Cities: Approaches for different regions and countries. , EGU General Assembly 2024, Vienna, Austria, 14–19 Apr 2024, EGU24-19983, https://doi.org/10.5194/egusphere-egu24-19983, 2024.

Extreme weather conditions associated with climate change could impact urban living in many ways. These conditions include flooding caused by extreme rainfall events and tidal surges caused by super tropical cyclones. Among these weather extremes, the extreme regional calm wind condition (ERCWC or weak synoptic forcing condition) relevant to air pollution has been less studied. Meanwhile, current urban planning guidelines for air quality consider only prevailing weather conditions without taking extreme weather into account. The current computational fluid dynamics (CFD) study examines urban air pollution dispersion under the influence of urban heat associated with ERCWC. First, our large-eddy simulation (LES) turbulent model results were validated with the results of the ETH Zürich Atmospheric Boundary Layer Water Tunnel experiment. We then examined the simulated airflow patterns and dispersion patterns inside representative urban parametric models. The National Supercomputing Centre Singapore provided all computing resources for our simulations. The adopted parametric models were developed based on urban density analysis to reflect the real urban morphology of Singapore. The models consist of nine building clusters, each containing 24 generic building blocks. The study compared the prevailing wind scenario with calm scenario driven by buoyancy. Inlet boundary conditions for the former and latter scenarios were determined by using the annual-average wind velocity measured at an urban weather station and zero wind velocity, respectively. In the latter scenario, ground and building surfaces were set at 5°C above ambient temperatures, which is within Singapore's measured values. There were a total of four sources of line emission in the computational domain. New insights and implications were found regarding urban air dispersion within the urban canopy layer for the buoyancy-driven scenario (the ERCWC) over the prevailing wind scenario. Wind reversal at certain areas for the buoyancy-driven scenario is an example, which leads to upwind sites to become downwind sites. We recommend upgrading the current guidelines for urban planning to improve urban resilience during extreme weather conditions by implementing mitigation measures, some of which were discussed in this study.

How to cite: Wai, K.-M. and Yuan, C.: On the modification of neighbourhood-scale atmospheric dispersion within urban morphologies by the buoyancy effect - a CFD study, EGU General Assembly 2024, Vienna, Austria, 14–19 Apr 2024, EGU24-21451, https://doi.org/10.5194/egusphere-egu24-21451, 2024.

EGU24-22023 | Posters on site | CL2.5

Mitigating Urban Heat Island Intensity in Urban Environments by optimal control method 

Waleed Mouhali, Nacer Sellila, Mohammed Louaked, and Houari Mechkour

Climate in urban areas differs from that in neighboring rural areas, as a result of urban development. It can create issues. Among these disturbances, Urban Heat Island (UHI) is a huge risk with many negative consequences (health, comfort...). It concerns urbanized area where temperatures are higher than in surrounding areas. To reduce this effect, the implantation (and design) of green spaces in dense cities is a pertinent solution.

In this study, we use optimal control method to find the optimal shape of green space. We consider city as a porous media system. Therefore, a three-dimensional model is established for numerical studies of the effects of urban anthropogenic heat and wind velocity in urban and rural regions. The transport mechanism of fluid in the cities is governed by the Navier–Stokes–Forchheimer porous media system. It is actually based on non-stationary turbulent fluid dynamics coupled with heat equation considering building/soil radiation effects.

We compute two-dimensional direct numerical simulation. We show the results for temperature and velocity fields. This work presents the governing equations, the control optimal algorithm and discusses the results of the predictions of the flow problems constituting the initial validation space of the model.

How to cite: Mouhali, W., Sellila, N., Louaked, M., and Mechkour, H.: Mitigating Urban Heat Island Intensity in Urban Environments by optimal control method, EGU General Assembly 2024, Vienna, Austria, 14–19 Apr 2024, EGU24-22023, https://doi.org/10.5194/egusphere-egu24-22023, 2024.

EGU24-22059 | Orals | CL2.5 | Highlight

New directions for urban climate science 

Gerald Mills and Evyatar Erell

The study of urban climates is at a critical juncture in its development as its subject matter is viewed as increasing relevant to a number of intersecting concerns across a hierarchy of scales. These concerns include global climate change and its drivers and consequences, which are focused on cities where most reside. Addressing these concerns requires an integrated science of cities, which does not yet exist. Our current urban climate knowledge framework developed as a series of specialist endeavours concentrating on aspects of the outdoor and of the indoor environments. As a result, much of the training, methodologies, technical language and data that are associated with these specialist fields are distinct and not easily transferable. In the climate field, there is a clear division between the outdoor and indoor climates and addressing each independently makes it difficult to find solutions to urban challenges, such as achieving zero Carbon cities. Moreover, the lack of a common framework causes confusion when articulating findings. As examples, the urban canopy layer (UCL) in urban climatology commonly refers to the outdoor space below roof level and is bounded by the ground, the walls of adjacent buildings and the interface at roof level; the walls are also part of the indoor canopy, which is bounded by the walls and the roof. Clearly these spaces are strongly connected by exchanges of energy and mass and by the movement of people across the wall interface, yet these receive little attention. In this presentation we will discuss the emergence of indoor and outdoor climate sciences and the potential for integration within an urban climate science.

How to cite: Mills, G. and Erell, E.: New directions for urban climate science, EGU General Assembly 2024, Vienna, Austria, 14–19 Apr 2024, EGU24-22059, https://doi.org/10.5194/egusphere-egu24-22059, 2024.

EGU24-22073 | Posters on site | CL2.5

Urban Climate Observatory (UCO) Berlin, Germany 

Fred Meier, Achim Holtmann, Marco Otto, and Dieter Scherer

The Urban Climate Observatory (UCO) Berlin is an open and long-term infrastructure for integrative research on urban weather, climate, and air quality. Quality-controlled observations are carried out in order to study the interaction between atmospheric processes and urban structures, as well as climate variability and climate change in urban environments. It enables multi-scale, three-dimensional atmospheric studies integrating observational and numerical modelling methods. The UCO Berlin includes the following components:

The Urban Climate Observation Network (UCON) Berlin provides long-term observations of atmospheric variables (air temperature, relative humidity, air pressure, global radiation, wind, precipitation) in the Urban Canopy Layer (UCL) at various locations since the 1990s. Since 2015 freely available data from Netatmo weather stations in Berlin and surrounding have been systematically collected (Crowdsourcing).

The meteorological towers are located in the garden of the Institute of Ecology at Rothenburgstraße (ROTH) in Berlin-Steglitz since 2018 and on the roof of the main building of the TU Berlin at Campus Charlottenburg (TUCC) since 2014. Turbulent fluxes of sensible and latent heat as well as carbon dioxide are derived from eddy covariance (EC) systems, which combines an open-path gas analyzer and a three dimensional sonic anemometer-thermometer (IRGASON, Campbell Scientific). The EC-systems at ROTH are installed at 40 m, 30 m, 20 m, 10 m and 2 m above ground and at TUCC at 10 m above roof (56 m above ground). The down- and upwelling radiation is measured separately for short-wave and long-wave radiation (CNR4, Kipp & Zonen) at the same heights as the EC-systems. The seasonal development of vegetation is observed at both tower locations using phenocams part of the international PhenoCam (phenocam.nau.edu) network. The ROTH tower is an associate site of the European research infrastructure Integrated Carbon Observation System (ICOS) and part of the national ICOS-D network (ID: DE-BeR).

Ground-based remote sensing is used to study the urban boundary layer since 2017. The UCO Berlin operates two Doppler LiDAR systems (Streamline XR, Halo Photonics) and provide profiles of the horizontal wind speed and wind direction as well as information on atmospheric turbulence. Cloud height, cloud cover and aerosol layers are recorded with ceilometers (CHM 15k, Lufft) at sites Grunewald and TUCC, which is part of the E-Profile Network of the European meteorological services EUMETNET. The ceilometer range is 15 km, the vertical resolution is 15 m and the temporal resolution is 15 s. A microwave radiometer (HATPRO-G5, RPG Radiometer Physics GmbH) provides vertical profiles of air temperature and absolute humidity up to an altitude of 10 km. Integrated liquid water path (LWP) and the integrated water vapor (IWV) are derived from measurements of the brightness temperature in 14 channels. An X-band Doppler weather radar with dual polarization (GMWR-25-DP, GAMIC) for precipitation research is in operation since autumn 2022 and has a range of 100 km.

The website of the UCO Berlin provides a data portal for search of meta data and download of open climate data in Berlin and surrounding: https://uco.berlin

How to cite: Meier, F., Holtmann, A., Otto, M., and Scherer, D.: Urban Climate Observatory (UCO) Berlin, Germany, EGU General Assembly 2024, Vienna, Austria, 14–19 Apr 2024, EGU24-22073, https://doi.org/10.5194/egusphere-egu24-22073, 2024.

EGU24-3624 | ECS | Orals | ITS2.8/AS4.10

Discriminators of Antarctic Atmospheric River Environments             

Rebecca Baiman, Andrew C. Winters, Benjamin Pohl, Vincent Favier, Jonathan D. Wille, and Kyle R. Clem

Although rare, atmospheric rivers (ARs) substantially influence the interannual variability of Antarctic surface mass balance. We identify characteristics unique to AR environments by comparing (1) AR, (2) Analog (environments that feature high-low pressure couplets, similar to AR environments, but no AR), and (3) Top AR (high-precipitation AR timesteps) during 1980–2019 around Antarctica. We find significant differences between AR and Analog environments including more intense and poleward-shifted mid-tropospheric geopotential height couplets as well as larger atmospheric moisture anomalies. We find similar significant enhancement in synoptic-scale dynamic drivers of Top ARs compared to AR environments, but no significant difference in local integrated water vapor anomalies. Instead, our results highlight the importance of large-scale dynamic drivers of Top AR timesteps, including connections between high-precipitation ARs and Rossby waves excited by tropical convection. This deeper understanding of Antarctic AR environments provides context for interpreting future changes to the Antarctic surface mass balance.

How to cite: Baiman, R., Winters, A. C., Pohl, B., Favier, V., Wille, J. D., and Clem, K. R.: Discriminators of Antarctic Atmospheric River Environments            , EGU General Assembly 2024, Vienna, Austria, 14–19 Apr 2024, EGU24-3624, https://doi.org/10.5194/egusphere-egu24-3624, 2024.

EGU24-3880 | ECS | Orals | ITS2.8/AS4.10 | Highlight

Future Atmospheric Rivers in Antarctica using CMIP6-IPSL model : intensity and impacts 

Léonard Barthelemy, Francis Codron, Vincent Favier, and Jonathan Wille

Atmospheric Rivers (AR) are extreme hydrological events that have strong impacts on the different components of the Antarctic ice sheet surface mass balance (SMB), through both snow accumulation and surface melt due to heating and rain. Their evolving characteristics are therefore important to understand for an accurate prediction of future SMB changes.

We use here an ensemble of simulations of the mid-21st century climate using the IPSL-CM6 model. The future Antarctic ARs are identified using a detection algorithm adapted to the region, and taking into account in the detection threshold (based on moisture fluxes) the rising background moisture in a warmer climate. While a constant detection threshold leads to a continuous increase of the number of ARs detected, the use of this adaptative threshold leads instead to a relatively stable frequency of occurence, but with a larger penetration over Antarctica (+5% occurence over the continent). In addition, a wave number 3 component appears in the future change in frequency, as well as in AR-related snowfall.

While the number of ARs does not change much, their intensity, as measured by the associated water vapor transport, increases in line with the Clausius-Clapeyron relation. Their different impacts on the SMB also become larger, with both increasing snowfall, and surface melt and rainfall in the coastal regions. The direct effect on the SMB is however dominated by the increase in snow accumulation.

How to cite: Barthelemy, L., Codron, F., Favier, V., and Wille, J.: Future Atmospheric Rivers in Antarctica using CMIP6-IPSL model : intensity and impacts, EGU General Assembly 2024, Vienna, Austria, 14–19 Apr 2024, EGU24-3880, https://doi.org/10.5194/egusphere-egu24-3880, 2024.

EGU24-6344 | Orals | ITS2.8/AS4.10

Characteristics of surface melt potential over Antarctic ice shelves based on regional atmospheric model simulations of summer air temperature extremes from 1979/80 to 2018/19 

Andrew Orr, Pranab Deb, Kyle Clem, Ella Gilbert, David Bromwich, Fredrik Boberg, Steve Colwell, Nicolaj Hansen, Matthew Lazzara, Priscilla Mooney, Ruth Mottram, Masashi Niwano, Tony Phillips, Denis Pishniak, Carleen Reijmer, Willem Jan van de Berg, Stuart Webster, and Xun Zou

We calculate a regional surface “melt potential” index (MPI) over Antarctic ice shelves that describes the frequency (MPI-freq, %) and intensity (MPI-int, K) of daily maximum summer temperatures exceeding a melt threshold of 273.15 K. This is used to determine which ice shelves are vulnerable to melt-induced hydrofracture and is calculated using near-surface temperature output for each summer from 1979/80 to 2018/19 from two high-resolution regional atmospheric model hindcasts (using the MetUM and HIRHAM5). MPI is highest for Antarctic Peninsula ice shelves (MPI-freq 23-35%, MPI-int 1.2-2.1 K), lowest (2-3%, < 0 K) for Ronne-Filchner and Ross ice shelves, and around 10-24% and 0.6-1.7 K for the other West and East Antarctic ice shelves. Hotspots of MPI are apparent over many ice shelves, and they also show a decreasing trend in MPI-freq. The regional circulation patterns associated with high MPI values over West and East Antarctic ice shelves are remarkably consistent for their respective region but tied to different large-scale climate forcings. The West Antarctic circulation resembles the central Pacific El Niño pattern with a stationary Rossby wave and a strong anticyclone over the high-latitude South Pacific. By contrast, the East Antarctic circulation comprises a zonally symmetric negative Southern Annular Mode pattern with a strong regional anticyclone on the plateau and enhanced coastal easterlies/weakened Southern Ocean westerlies. Values of MPI are 3-4 times larger for a lower temperature/melt threshold of 271.15 K used in a sensitivity test, as melting can occur at temperatures lower than 273.15 K depending on snowpack properties.

How to cite: Orr, A., Deb, P., Clem, K., Gilbert, E., Bromwich, D., Boberg, F., Colwell, S., Hansen, N., Lazzara, M., Mooney, P., Mottram, R., Niwano, M., Phillips, T., Pishniak, D., Reijmer, C., van de Berg, W. J., Webster, S., and Zou, X.: Characteristics of surface melt potential over Antarctic ice shelves based on regional atmospheric model simulations of summer air temperature extremes from 1979/80 to 2018/19, EGU General Assembly 2024, Vienna, Austria, 14–19 Apr 2024, EGU24-6344, https://doi.org/10.5194/egusphere-egu24-6344, 2024.

EGU24-6416 | ECS | Posters on site | ITS2.8/AS4.10 | Highlight

Modelling the Impacts of Summer Extreme Precipitation Events on Surface Mass Balance in Southern Greenland 

Nicole Loeb, Alex Crawford, and Julienne Stroeve

The warming Arctic climate drives an increased potential for extreme precipitation events. Here, extreme precipitation is defined as the top 5% of daily accumulations where at least 1 mm occurred. Case studies have shown that these events can have substantial impacts on the regional surface mass balance (SMB) of the Greenland Ice Sheet. Depending on the precipitation phase and timing, mass may be added via the precipitation, or melt may be enhanced from rainfall, driving increased runoff and ice discharge. Southern Greenland is an area undergoing substantial change in terms of both intense precipitation occurrence and SMB, so it is essential to understand their relationship as the climate warms.

Observations of extreme precipitation are limited due to its rare nature and sparse observational networks. Modelling studies can shed light on broader changes by filling in data gaps and providing future projections, allowing for a deeper look into physical linkages and changes. Here, historical and future simulations of the Regional Atmospheric Climate Model (RACMO) and Variable-Resolution Community Earth System Model (VR-CESM) are used. Representation of summer extreme precipitation events in southern Greenland in VR-CESM and RACMO is explored and compared through case studies. Key variables, including precipitation phase, runoff, and overall SMB are evaluated to discern potential impacts in each model. Events in the historical and future (following SSP5-8.5) periods are investigated to determine whether the response to events of similar magnitude and seasonal timing differs in a warmer climate.

Furthermore, an approximation of how these extreme precipitation events influence seasonal SMB is presented by assessing the ratio of the event-related anomaly to the cumulative seasonal SMB anomalies. Comparisons of event-specific contributions with broader seasonal variations shed light on the connection between short-term meteorological events and longer-term climatic shifts in shaping Greenland's SMB.

How to cite: Loeb, N., Crawford, A., and Stroeve, J.: Modelling the Impacts of Summer Extreme Precipitation Events on Surface Mass Balance in Southern Greenland, EGU General Assembly 2024, Vienna, Austria, 14–19 Apr 2024, EGU24-6416, https://doi.org/10.5194/egusphere-egu24-6416, 2024.

EGU24-7689 | ECS | Posters on site | ITS2.8/AS4.10

Quantification of the Greenland ice sheet surface mass balance using high-resolution CARRA data and in-situ observations 

Verena Mülder, Maurice van Tiggelen, and Carleen Tijm-Reijmer

This project contributes to the understanding of the surface mass and energy balance of the Greenland ice sheet, by evaluating the accuracy of the Copernicus Arctic Regional Reanalysis (CARRA) dataset against in-situ observations collected from automatic weather stations (AWS) positioned along the K-transect on the Greenland ice sheet.  Additionally, the results are compared with the Regional Atmospheric Climate Model 2.3p2 (RACMO2.3p2), containing a spatial resolution of 11 km against CARRA’s 2.5 km horizontal resolution. This research thereby emphasizes the improvements and shortcomings of the new CARRA dataset for reproducing the near surface climatology on the Greenland ice sheet.

The validated CARRA dataset is then used as forcing in a surface energy balance model, enabling the determination of the surface mass and energy balance components of the Greenland ice sheet at higher spatial resolution. The modelled surface mass balance is evaluated against in-situ measurements along the K-transect, and to other regions where in situ measurements are available. 

Preliminary results show that the CARRA dataset accurately reproduces radiative fluxes, such as short- and longwave radiation components, as well as turbulent fluxes, including temperature and wind gradients. These accurate representations provide updated, high-resolution gridded fields of the Greenland ice sheet’s climate, and are crucial for precise modelling of the melt and runoff dynamics of the Greenland ice sheet through the surface energy balance model.

This research thereby presents an updated high-resolution depiction of the Greenland ice sheet climate and energy balance, which can be used as a foundation for future projections of the Greenland Ice Sheet in forthcoming studies.

How to cite: Mülder, V., van Tiggelen, M., and Tijm-Reijmer, C.: Quantification of the Greenland ice sheet surface mass balance using high-resolution CARRA data and in-situ observations, EGU General Assembly 2024, Vienna, Austria, 14–19 Apr 2024, EGU24-7689, https://doi.org/10.5194/egusphere-egu24-7689, 2024.

EGU24-10419 | Posters on site | ITS2.8/AS4.10

Unraveling the Forcings behind West Antarctic Summer Melt: CMIP6 Perspectives on Remote Climate Drivers 

Yingfei Fang, James Screen, Song Yang, Xiaoming Hu, and Shuheng Lin

The circulation pattern conducive to summer surface melt over the Ross Ice Shelf in West Antarctica is intricately linked to sea surface temperature anomalies in the tropical central-eastern Pacific associated with El Niño, along with atmospheric heating anomalies over western Australia. Our study utilizes 61 models within the Coupled Model Intercomparison Project (CMIP6) and reveals their ability to effectively simulate these primary drivers that influence the circulation pattern over West Antarctica.

El Niño emerges as a crucial force shaping atmospheric circulation anomalies over the Ross Sea, inducing two distinct wave trains toward West Antarctica—one originating from the central Pacific and the other from the Maritime Continent. Furthermore, irrespective of El Niño, anomalous atmospheric heating over western Australia emerges as another significant forcing, initiating a Rossby wave train that extends from subtropical Australia to the Ross Sea.

This comprehensive assessment advances our understanding of the remote forcings steering climate variability in West Antarctica during the austral summer. Moreover, it instills confidence in the predictability of future climate changes in this region.

How to cite: Fang, Y., Screen, J., Yang, S., Hu, X., and Lin, S.: Unraveling the Forcings behind West Antarctic Summer Melt: CMIP6 Perspectives on Remote Climate Drivers, EGU General Assembly 2024, Vienna, Austria, 14–19 Apr 2024, EGU24-10419, https://doi.org/10.5194/egusphere-egu24-10419, 2024.

EGU24-10663 | ECS | Orals | ITS2.8/AS4.10 | Highlight

Contribution of blowing snow sublimation to the surface mass balance of Antarctica 

Srinidhi Gadde and Willem Jan van de Berg

Blowing snow transport is an essential polar boundary layer process and constitutes the major ablation term in the Antarctic ice sheet's surface mass balance (SMB). Here, we present an update to the blowing snow model in the Regional Atmospheric Climate Model (RACMO), version 2.3p3, to include the effect of blowing snow sublimation and transport in the prognostic equations for temperature and water vapour. Updates rectify the numerical artefacts in the modelled blowing snow flux variation with wind speed. Updates include the replacement of uniformly distributed ice particle radius, which limited the maximum ice particle radius to ≤ 50 μm, with an exponentially increasing ice particle radius distribution to include all the relevant range of radii between 2 to 300 μm without any additional computational overhead. We compare the model results against the observations from site D47 in Adèlie Land, East Antarctica. These updates correct the numerical artefacts observed in the previous model results, and RACMO successfully predicts the power-law variation of the blowing snow transport flux with wind speed. Updates also improve the prediction of the magnitude of the blowing snow fluxes. In addition, at site D47, we obtain an average blowing snow layer depth of 230±116 μm, which falls within the range of values obtained from satellite observations. A qualitative comparison of the simulated blowing snow frequency from RACMO with CALIPSO satellite observations shows that the simulated frequency matches well with the satellite product. Compared to the previous model version for the period 2000–2010, the contribution of integrated blowing snow sublimation is increased by 30%, with a yearly average of 176±4 Gt yr-1. The increase amounts to 1.2% reduction in the integrated SMB of the Antarctic ice sheet. The updates also introduce changes in the climatology of blowing snow in Antarctica. Specifically, we observe significant changes in the sublimation of interior regions of the escarpment zone of Antarctica.

How to cite: Gadde, S. and van de Berg, W. J.: Contribution of blowing snow sublimation to the surface mass balance of Antarctica, EGU General Assembly 2024, Vienna, Austria, 14–19 Apr 2024, EGU24-10663, https://doi.org/10.5194/egusphere-egu24-10663, 2024.

EGU24-11814 | Posters on site | ITS2.8/AS4.10 | Highlight

Large-scale drivers of the exceptionally low winter Antarctic Sea Ice Extent in 2023 

Monica Ionita-Scholz

The year 2023 marked a turning point for the Antarctic region, as the Southern Hemisphere experienced a significant reduction in its sea ice cover, with a record-breaking sea ice minimum in July 2023 of ~2.4 million square kilometers below the long-term mean. This study investigates the drivers behind this exceptional event, by combining observational, satellite and reanalysis data. Throughout the year, the Antarctic Sea ice extent broke record after record, ranking as the lowest sea ice on record from January to September, with the exception of March and April. The exceptionally low sea ice extent from May to August was mainly driven by the prevalence of a zonal wave number 3 pattern, with alternating surface high- and low-pressure systems, which favored the advection of heat and moisture, especially over the Ross Sea (RS), Weddell Sea (WS), and Indian Ocean (IO). From May 2023 to August 2023, record-breaking low sea ice extent and high temperatures were recorded, and the most affected regions were RS, WS, and IO. Over the Weddell Sea, temperature anomalies of up to 10°C have been observed from May to July, whereas over the Ross Sea, temperature anomalies of up to 10°C have been observed, especially in July and August. A regime shift in the Antarctic Sea ice, as well as in the average mean air temperature and subsurface ocean temperature over the Weddell Sea, was detected around 2015. The analysis revealed complex interactions between atmospheric circulation patterns, oceanic processes, and their implications for variability and change in Antarctic Sea ice. Understanding the underlying mechanisms of these extreme events provides crucial insights into the changing dynamics of Antarctic Sea ice and its broader climatic significance.

How to cite: Ionita-Scholz, M.: Large-scale drivers of the exceptionally low winter Antarctic Sea Ice Extent in 2023, EGU General Assembly 2024, Vienna, Austria, 14–19 Apr 2024, EGU24-11814, https://doi.org/10.5194/egusphere-egu24-11814, 2024.

EGU24-12356 | ECS | Orals | ITS2.8/AS4.10

Understanding local and large-scale changes in the Arctic and the effect on Cyclone activity 

Chelsea Parker, Melinda Webster, Priscilla Mooney, Elina Valkonen, and Linette Boisvert

The Arctic is warming four times faster than the rest of the globe, with a concurrent rapid loss of sea ice extent and thickness. Cyclones are synoptic weather events that transport heat and moisture into the Arctic, and have complex impacts on sea ice, marine ecosystems, and socio-economic activities. However, the effect of a changing climate on Arctic cyclone behavior remains poorly understood. This study uses a combination of reanalysis data, cyclone tracking techniques, and high-resolution numerical modeling to explore the effect of recent and future climate change on Arctic cyclone behavior across seasons.

This work first examines the relative importance of changes in local surface conditions and turbulent fluxes and broader changes in pressure patterns, steering flow, and baroclinicity with recent climate change in governing cyclone frequency, intensity, and trajectories. Our analysis suggests that cyclone activity is shifting throughout the autumn with competing effects of turbulent fluxes and large-scale conditions. With recent climate change, sea ice is declining, and surface temperatures and turbulent fluxes are increasing, resulting in slight increases in Autumn cyclone intensity. In early autumn, cyclone frequency and trajectories are strongly governed by the large-scale flow despite increases in surface turbulent fluxes and baroclinicity. By late autumn, land-sea temperature contrast is increasing with sea ice loss, and changes in baroclinicity and large-scale flow work in concert to increase cyclone activity in the Arctic.

This work then uses regional, high resolution, convection-permitting Weather Research and Forecasting (WRF) model simulations to demonstrate the sensitivity of cyclone characteristics to recent and future climate change. Simulations with downscaled CMIP6 global climate projections reveal that future sea ice loss and increasing surface temperatures by the year 2100 drive large increases in the near-surface vertical temperature gradient, sensible and latent heat fluxes into the atmosphere, and deep convection during spring cyclone events. The changes in the future (warmer) climate alter cyclone trajectories and increase and prolong intensity, with significantly increased wind speeds, temperatures, and precipitation. Such changes in cyclone lifecycles and characteristics may exacerbate sea ice loss and Arctic warming through positive feedback mechanisms. The increasing extreme nature of weather events such as Arctic cyclones has important implications for atmosphere-ice-ocean interactions in the new Arctic.

How to cite: Parker, C., Webster, M., Mooney, P., Valkonen, E., and Boisvert, L.: Understanding local and large-scale changes in the Arctic and the effect on Cyclone activity, EGU General Assembly 2024, Vienna, Austria, 14–19 Apr 2024, EGU24-12356, https://doi.org/10.5194/egusphere-egu24-12356, 2024.

EGU24-12942 | Orals | ITS2.8/AS4.10 | Highlight

Abrupt increase in Greenland melt governed by atmospheric wave change 

Rune Grand Graversen, Tuomas Heiskanen, Richard Bintanja, and Heiko Goelzer

Recent Greenland ice-sheet melt constitutes an alarming contribution to global sea-level rise. Observations indicate an approximate balance of the ice sheet until the late 1990s, after which a strong increase in melting occurred. This cannot be attributed linearly to gradually-increasing global warming. Instead the abrupt shift is suggested to be linked to atmospheric circulation changes, although causality is not fully understood. Here we show that changes of atmospheric waves over Greenland have significantly contributed to the shift into a strong melting state. This is evident from applying a newly-developed methodology effectively decomposing atmospheric flow patterns into parts associated with Rossby waves and smaller perturbations. A westerly-flow reduction, consistent with anthropogenic Arctic warming, affected transports by atmospheric waves and led to a decrease in precipitation and an increase in surface warming, contributing to ice-sheet mass loss, in particular over the southwestern regions. Hence the Greenland ice-sheet melt is an example of a climate response non-linearly coupled to global warming.

How to cite: Graversen, R. G., Heiskanen, T., Bintanja, R., and Goelzer, H.: Abrupt increase in Greenland melt governed by atmospheric wave change, EGU General Assembly 2024, Vienna, Austria, 14–19 Apr 2024, EGU24-12942, https://doi.org/10.5194/egusphere-egu24-12942, 2024.

EGU24-13437 | Orals | ITS2.8/AS4.10

Atmospheric river brings warmth and rainfall to the northern Antarctic Peninsula during the mid-austral winter of 2023 

Deniz Bozkurt, Jorge F. Carrasco, Raul R. Cordero, Francisco Fernandoy, Alvaro Gómez, Benjamin Carillo, and Bin Guan

Recent research has extensively analyzed summertime atmospheric river (AR) events in the Antarctic Peninsula (AP) using ground-based and atmospheric observations, yet a significant gap remains in understanding the occurrence and impacts of ARs during the Antarctic winter. This study focuses on an extraordinary warming event in the AP between 1 and 3 July 2023, utilizing data from recent wintertime field campaigns and ERA5 reanalysis. On 2 July, the Frei station in northern AP recorded a remarkable daily maximum near-surface air temperature of 2.7°C, significantly higher than the mean winter value of -3.8°C and surpassing the winter 99th percentile of 1.8°C. On 2-3 July, at least 6 hours of liquid precipitation were recorded, as corroborated by ERA5 data, leading to notable rain-on-snow and melt events. This occurrence challenges conventional expectations, as liquid precipitation during the depths of the southern winter is exceedingly rare in Antarctica. Radiosonde observations indicated a substantial elevation of the freezing level to about 650 meters, a stark contrast to the 20 meters observed before the event. These observations also revealed a moist and nearly saturated atmospheric profile. The event was synoptically characterized by a distinct trough over the Bellingshausen Sea and a pronounced northwest-southeast oriented blocking ridge from the southwestern Atlantic to the Weddell Sea, resulting in a dipole-like pressure pattern around the AP. These conditions were instrumental in the development of an AR with a north-to-south flow. This flow was marked by maximum integrated vapor transport values exceeding 500 kg m-1 s-1, channeling warm, moisture-laden air from continental South America towards the AP. A long-term winter trend analysis reveals a significant strengthening of the dipole pattern, which correlates with increased frequencies of ARs and consequently leads to notable warm temperature anomalies over the northern AP. The study underscores the importance of understanding the complex relationship between local, synoptic conditions, and the dynamics of ARs in influencing winter climate patterns in the AP. This study's ongoing high-resolution simulations and isotope analysis aim to uncover the detailed characteristics and isotopic signatures of this extraordinary warming event, enhancing our understanding of its origins and impacts.

How to cite: Bozkurt, D., Carrasco, J. F., Cordero, R. R., Fernandoy, F., Gómez, A., Carillo, B., and Guan, B.: Atmospheric river brings warmth and rainfall to the northern Antarctic Peninsula during the mid-austral winter of 2023, EGU General Assembly 2024, Vienna, Austria, 14–19 Apr 2024, EGU24-13437, https://doi.org/10.5194/egusphere-egu24-13437, 2024.

EGU24-14236 | ECS | Posters on site | ITS2.8/AS4.10

Visibility and Fog Synoptic and Mesoscale Variability over Marambio Base, Antarctic Peninsula 

Mauricio Jimenez Garcia, John Mejia, Juan Jose Henao, Noemi Troche, Alvaro Rafael Martinez, and Kevin Alexander Chicaeme

Summertime aviation, research, and field campaigns in Marambio Base, Antarctic Peninsula (AP), and surrounding areas, are frequently affected by low visibility and fog.  Additionally, upper-air soundings in the area are launched weekly, limiting the study of the synoptic time scale variability of these hazards. A special field campaign was designed to fill this observational gap, and to examine the drivers of fog events.  A three week-long intensive observation campaign during February 2023 successfully captured the evolution and vertical structure of two multiday fog episodes that were later interrupted by westerly Foehn winds, favoring sudden warming, drying, and clear skies over eastern flank of the AP.  This dataset is also used to evaluate and assess the skill of regional climate simulations using the Global Forecasting Systems data and the Polar-WRF model.  We carried out the later modeling activities to examine the mesoscale characteristics of the interplay between the fog episodes and the Foehn winds.  This study shows the analyses of the special upper-air observations and modeling simulations, with emphasis in the description of the observable and predictable mesoscale ingredients and their relationship with synoptic forcings. We found a cycle that modulates visibility and fog: (i) low visibility ahead of the synoptic trough bringing a deep northerly moistening and warming dominating warm advection fog on the northeastern side of the AP; (ii) an enhanced mid-level inversion is formed by adiabatic warming due to westerly winds on the lee side of the AP limiting mixing; (iii) visibility increases as Foehn winds warm up and dry out the low-level atmosphere west of the AP; (iii) a meso-low (heat-low) developed on the lee side of the AP that later moved eastward with the synoptic trough, bringing cooler southerly air masses that lower visibility and favoring cold advection fog; finally (iv) cooling is maintained ahead of the synoptic ridge sustaining cold advection fog.  Polar-WRF helped us diagnose the mechanistic nature of the fog events, while providing intricate multiscale connections modulating visibility in the region.

How to cite: Jimenez Garcia, M., Mejia, J., Henao, J. J., Troche, N., Martinez, A. R., and Chicaeme, K. A.: Visibility and Fog Synoptic and Mesoscale Variability over Marambio Base, Antarctic Peninsula, EGU General Assembly 2024, Vienna, Austria, 14–19 Apr 2024, EGU24-14236, https://doi.org/10.5194/egusphere-egu24-14236, 2024.

EGU24-15041 | ECS | Posters on site | ITS2.8/AS4.10

Comparison of Atmospheric Large-scale Patterns during two Warming Periods in Greenland in the last 100 years  

Florina Roana Schalamon, Jakob Abermann, Sebastian Scher, Andreas Trügler, and Wolfgang Schöner

The air temperature (AT) increased during the Early 20th Century Warming (ETCW), especially in the Arctic, with a similar trend as during the present warming period. This AT increase is observed while investigating the annual AT anomaly of historic observations provided by the Danish Meteorological Institute (DMI) and of the zonal average of Greenland based on reanalysis data (NOAA 20CRv3). 

We define two distinct warming periods (1922–1932 and 1993–2007) for Greenland with a continuous increase in the AT anomaly. The increase is the largest at the northernmost observations in Upernavik and the smallest at the easternmost observations in Tasiilaq. The zonal average trend (Sen's slope) of AT increase in Greenland is 0.1°C/year in both periods, exceeding the global AT trend. Examining the spatial distribution of the AT trend in the reanalysis data during the warming periods reveals a warming hotspot in the sea in front of the West Coast of Greenland, which is more dominant in the second period. Nonetheless, the positive trend is rather homogeneous over Greenland, indicative of large-scale influences rather than localized phenomena. This motivates our study to analyse and compare the structure of atmospheric large-scale patterns (LSP) during these two warming periods. 

To do this, we use an unsupervised self-organizing maps (SOM) algorithm to highlight prevalent LSPs based on the reanalysis of the geopotential height of 500hPa. SOM is an artificial neural network used for clustering data into distinct groups, so-called nodes, by reducing its dimensionality. In the first approach to compare both periods, the frequency of the nodes is evaluated, meaning comparing how often a specific prevalent LSP defined by SOM occurs in the one and the other warming periods. A preliminary result is that there are significant differences in the occurrence of the nodes. Further exploration of the difference in node frequency and setting them into a meteorological context are the primary objectives of this study. 

Additionally, we aim to establish links between LSP and anomalies of atmospheric variables (such as air temperature) to investigate whether similar LSP are accountable for similar deviations. This will deepen our understanding of the atmospheric dynamics during Greenland's warming periods, which affect the cryosphere.  

How to cite: Schalamon, F. R., Abermann, J., Scher, S., Trügler, A., and Schöner, W.: Comparison of Atmospheric Large-scale Patterns during two Warming Periods in Greenland in the last 100 years , EGU General Assembly 2024, Vienna, Austria, 14–19 Apr 2024, EGU24-15041, https://doi.org/10.5194/egusphere-egu24-15041, 2024.

EGU24-16074 | ECS | Posters on site | ITS2.8/AS4.10

Correcting uncertainty estimations of  20th-century reanalysis with independent historic datasets in the arctic 

Sebastian Scher, Florina Schalamon, Jakob Abermann, and Andreas Trügler

20th-century reanalysis datasets are an invaluable tool for understanding the climate from the beginning of the last century up to the present. They provide a best guess of the atmospheric state, based on a combination of observations and numerical modeling. Contrary to other reanalysis datasets, however, 20th-century reanalysis uses solely surface observations and is thus much less constrained. Consequently, the uncertainty of the analysis is high compared to reanalysis datasets for the satellite era. In the Arctic, where observations are even more sparse than in other parts of the globe, this issue is especially severe. Therefore, a robust estimation of the uncertainty of the reanalysis product is essential. While state of the art 20th-century reanalysis datasets provide some measures of uncertainty, they do not cover the whole uncertainty. We test whether historic independent measurements – that were not assimilated in the reanalysis – can be used to get a more reliable uncertainty estimation of temperature time-series over the last century. For this aim, we use recently digitized in-situ measurements from Alfred Wegener’s last Greenland expedition.  Finally, we assess how the outcome of testing typical hypotheses – such as warming trends or comparison of different periods - is affected when considering the new uncertainty estimations 

How to cite: Scher, S., Schalamon, F., Abermann, J., and Trügler, A.: Correcting uncertainty estimations of  20th-century reanalysis with independent historic datasets in the arctic, EGU General Assembly 2024, Vienna, Austria, 14–19 Apr 2024, EGU24-16074, https://doi.org/10.5194/egusphere-egu24-16074, 2024.

EGU24-16268 | ECS | Orals | ITS2.8/AS4.10

Atmospheric drivers of the rapid decline of Novaya Zemlya's glaciers 

Jan Haacker, Bert Wouters, Xavier Fettweis, Jason Box, and Isolde Glissenaar
The glaciers on the High Russian Arctic archipielago Novaya Zemlya have been losing roughly 10 Gt/yr over the past decade, 5 Gt/yr more than in the one before. While earlier research pointed to ocean discharge as driver of the acceleration, we present new results that show that foehn events, triggered by atmospheric rivers, led to the most severe melt events in the recent times. We use output of the regional atmospheric model MAR, together with geodetic observations from CryoSat-2, and reanalysis data (CARRA, ERA5, MERRA-2) to show that roughly 70 % of the melt occurs during atmospheric rivers episodes. Between 1990 and 2022, 45 of the 54 days with more than 1 Gt melt were accompanied by foehn winds. We conclude that the representation of atmospheric rivers and foehn winds in models is crucial for accurate projections of the future glacier evolution.

How to cite: Haacker, J., Wouters, B., Fettweis, X., Box, J., and Glissenaar, I.: Atmospheric drivers of the rapid decline of Novaya Zemlya's glaciers, EGU General Assembly 2024, Vienna, Austria, 14–19 Apr 2024, EGU24-16268, https://doi.org/10.5194/egusphere-egu24-16268, 2024.

EGU24-18137 | ECS | Orals | ITS2.8/AS4.10 | Highlight

Melt ponds and atmosphere-ice-ocean exchange in the UK Met Office Unified Model during the Arctic Summertime Cyclones field campaign 

Christopher Barrell, Ian Renfrew, John Methven, and Andrew Elvidge

Melt ponds play a key role in the Arctic sea-ice surface energy budget. Their reduced albedo compared to the surrounding ice and snow surfaces increases the absorption of short-wave radiation and enhances ice melt. Further, melt ponds affect atmosphere-ice-ocean surface turbulent exchanges of heat, moisture and momentum, which influence the structure of the overlying boundary layer. 

Simulation of melt ponds and surface exchange over sea ice in coupled numerical weather prediction models depends on parameterization schemes that need further development. However, the relationship between sea ice surface conditions and the overlying boundary layer is difficult to constrain due to the lack of in-situ observations in Arctic regions. 

We carried out the Arctic Summertime Cyclones project field campaign in July-August 2022 to make observations of sea-ice surface exchange and cyclone dynamics. Using the British Antarctic Survey MASIN Twin Otter aircraft we observed a range of sea ice surface types, some with a very high melt pond fraction during warm melt conditions, and the overlying atmospheric boundary layer. 

Using these observations to evaluate forecasts from the UK Met Office Unified Model, we show that a combination of deficiencies in the model sea ice field, melt pond representation and surface exchange parameterizations are linked to errors in the simulated boundary layer structure. In particular, the model consistently exhibits surface temperature and albedo biases over sea ice with melt ponds that act as sources of error in the surface energy budget.

How to cite: Barrell, C., Renfrew, I., Methven, J., and Elvidge, A.: Melt ponds and atmosphere-ice-ocean exchange in the UK Met Office Unified Model during the Arctic Summertime Cyclones field campaign, EGU General Assembly 2024, Vienna, Austria, 14–19 Apr 2024, EGU24-18137, https://doi.org/10.5194/egusphere-egu24-18137, 2024.

EGU24-18598 | ECS | Posters on site | ITS2.8/AS4.10

Projection of near-surface winds in Antarctica using ESMs downscaled by a regional atmospheric model (MAR) 

Cécile Davrinche, Cécile Agosta, Charles Amory, Christoph Kittel, and Anaïs Orsi

Antarctica's climate is unique, partly due to strong westerlies on the ocean and strong easterlies at the ice sheet margins. On the continent, near-surface winds play a major role in shaping the climate of the continent as they influence sea-ice formation, the amount of precipitation reaching the ground or the stability of the boundary layer. They result from both large-scale and surface forcings, whose relative magnitude and future evolution is yet uncertain.

We show an evaluation at present day of a selection of Earth System Models (ESMs) from CMIP6 and their downscalings by the regional atmospheric model MAR. The ESMs have been selected based on their demonstrated ability to represent fairly well the southern hemisphere general atmospheric circulation. They are thus expected to have a good representation of the large-scale forcing of near-surface wind. We present a framework for evaluating against field observations how accurately different CMIP6 products are able to represent near-surface winds over Antarctica. We also present the selection process for the automatic weather stations to use and the metrics for the evaluation.

Then, we investigate the future evolution of near-surface winds on the Antarctic continent as projected by the ESMs and their downscalings. We show maps of their projected changes up to 2100 and investigate whether these changes are significant with regards to the internal variability of the ESMs and their historical biases. This evaluation provides us with a first step towards characterizing the future evolution of near-surface winds in Antarctica. Further work will then be undertaken to provide a more comprehensive analysis of their potential drivers, including the evolution of both large-scale and surface forcings.

How to cite: Davrinche, C., Agosta, C., Amory, C., Kittel, C., and Orsi, A.: Projection of near-surface winds in Antarctica using ESMs downscaled by a regional atmospheric model (MAR), EGU General Assembly 2024, Vienna, Austria, 14–19 Apr 2024, EGU24-18598, https://doi.org/10.5194/egusphere-egu24-18598, 2024.

EGU24-18912 | Posters on site | ITS2.8/AS4.10

Evaluating a state of the art, internationally coordinated pan-Arctic regional climate model ensemble 

Priscilla Mooney, Alok Samantaray, Chiara De Falco, and Ruth Mottram and the PolarRES regional climate modellers

Within the Horizon 2020 project PolarRES, a new ensemble of regional climate simulations has been developed using the latest generation of regional climate models (RCMs) for the Arctic. These state-of-the-art RCMs downscale the ERA5 reanalysis over the period 2001-2020, covering the entire Arctic region at a grid spacings of approximately 12km. Furthermore, all simulations follow the Polar CORDEX protocol for the next generation of regional climate projections of the polar regions. This new ensemble of high-resolution climate simulations offers considerable opportunities to advance our understanding of the present-day climate of the Arctic. However, a first step to realising this potential is to evaluate the performance of the regional climate models, highlighting their strengths and limitations. This is also necessary for understanding and interpreting the future projections that will be generated by these RCMs using a novel storylines approach to downscale CMIP6 models.

The work presented here will focus on the simulations of the present-day climate driven by the ERA5 reanalysis. As part of the evaluation process, a clustering technique is applied to reanalysis data to identify regions with similar annual and seasonal characteristics of surface temperature and precipitation. This approach allows for a better understanding of the regional climates of the Arctic, provides a more physically consistent basis for model evaluation, and eases the investigation of model deficiencies in simulating regional scale forcings. This work will focus on the regionalisation of the Arctic for model evaluation and present preliminary results of the application of this regionalisation to the aforementioned Arctic climate simulations.

How to cite: Mooney, P., Samantaray, A., De Falco, C., and Mottram, R. and the PolarRES regional climate modellers: Evaluating a state of the art, internationally coordinated pan-Arctic regional climate model ensemble, EGU General Assembly 2024, Vienna, Austria, 14–19 Apr 2024, EGU24-18912, https://doi.org/10.5194/egusphere-egu24-18912, 2024.

EGU24-20816 | Orals | ITS2.8/AS4.10

Surface melt over the Antarctic Peninsula: targeted observations capturing recent extreme events 

Irina V. Gorodetskaya, Claudio Durán-Alarcón, Penny Rowe, Xun Zou, Sangjong Park, and Vincent Favier

The recent two years have been marked by many regional climate-state extremes particularly over the southern polar region including record-high surface melt over the Antarctic Peninsula in February 2022 (Gorodetskaya et al., 2023; Zou et al., 2023), the strongest heatwave ever recorded over East Antarctica bringing extreme inland snowfall and coastal surface melt in March 2022 (Wille et al., 2024), and an extremely low Antarctic sea ice area observed in winter 2022 outpaced by the lowest record in winter 2023 (Purich and Doddridge, 2023). Increased magnitude and probability of occurrence of extreme events, along with their high impacts on the Antarctic surface mass balance require detailed understanding of the underlying large-scale, regional and local drivers, using comprehensive and high-resolution observations and modeling. Here we will present analysis of extreme surface melt events and their drivers based on targeted observations conducted during 2022-2023 over the northern Antarctic Peninsula, including two austral summer campaigns and the winter Year of Polar Prediction in the Southern Hemisphere (YOPP-SH) enhanced observational period. Cloud and precipitation profiles using radar and lidar measurements are analyzed together with thermodynamic state of the troposphere from radiosonde observations and surface radiative fluxes with a specific focus on the extreme warm events characterized by surface melt and/or rainfall. In particular, the February 2022 extreme warm event showed very high downwelling longwave flux (up to 350 W/m2) due to the low warm-base liquid-containing clouds. Frequent occurrence of supercooled liquid water with low and warm cloud-bases is characteristic of the site during both summer and winter seasons and plays an important role in surface melt events. Another key factor during warm events is the transition from snowfall to rainfall (both with height in the vertical column, indicated by melt layer height derived from the precipitation radar measurements, and with time over the course of the event). Using radiosonde profiling, we identify layers of maximum moisture and heat transport into the Antarctic Peninsula, which showed an outstanding magnitude during the hot spell in February 2022 associated with an intense atmospheric river and which we further compare to other observed warm events. Significant differences are found for cloud and precipitation properties between ground-based measurements and ERA5 reanalysis, prompting the use of state-of-art high-resolution observations to improve representation of relevant processes in the models particularly during surface melt events.

Funding acknowledgements: Portuguese Polar Program projects APMAR/TULIP/APMAR2; FCT projects MAPS and ATLACE; ANR project ARCA; KOPRI; NSF awards 2127632 and 2229392.

References:

Gorodetskaya et al. (2023): Record-high Antarctic Peninsula temperatures and surface melt in February 2022: a compound event with an intense atmospheric river. npj Clim Atmos Sci, https://doi.org/10.1038/s41612-023-00529-6

Purich and Doddridge (2023): Record low Antarctic sea ice coverage indicates a new sea ice state. Commun Earth Environ, https://doi.org/10.1038/s43247-023-00961-9

Wille et al (2024): The Extraordinary March 2022 East Antarctica “Heat” Wave. Part I: Observations and Meteorological Drivers. J. Climate, https://doi.org/10.1175/JCLI-D-23-0175.1.

Zou et al (2023): Strong warming over the Antarctic Peninsula during combined atmospheric River and foehn events: Contribution of shortwave radiation and turbulence. J. Geophys. Res. Atmos., https://doi. org/10.1029/2022JD038138 


How to cite: Gorodetskaya, I. V., Durán-Alarcón, C., Rowe, P., Zou, X., Park, S., and Favier, V.: Surface melt over the Antarctic Peninsula: targeted observations capturing recent extreme events, EGU General Assembly 2024, Vienna, Austria, 14–19 Apr 2024, EGU24-20816, https://doi.org/10.5194/egusphere-egu24-20816, 2024.

AS5 – Methods and Techniques

This presentation reports the WCRP GEWEX GASS multi-model intercomparison study on diurnal cycle of precipitation, which is aimed to understand the processes that control the diurnal variation of precipitation over different climate regimes. The study focuses on the interaction between convection and its environments, afternoon and nocturnal convection over land, and convection transition. It used a hierarchy of models with different levels of complexity to diagnose and investigate the associated processes and model biases in simulation of the diurnal cycle of precipitation. Confronting models with detailed observations allowed to identify the deficiencies and missing physics in current weather and climate models and gain insights for further improving the parameterization of convection in General Circulation Models (GCMs).

Results from the recently completed long-term single-column model intercomparison and GCM intercomparison studies indicate that most of the participating models share common model biases in simulating the diurnal cycle of precipitation, as already illustrated in previous studies, such as the precipitation peak occurring too early during the day, a lack of nocturnal precipitation and transition from shallow to deep convection. The issues are primarily related to deficiencies in cumulus parameterizations. Sensitivity tests with different cumulus parameterizations suggest that a unified treatment of shallow and deep convection could better capture the transition from shallow to deep convection and help delay the daytime precipitation peak to late afternoon over land. However, this does not improve the simulation of nocturnal precipitation that is often caused by elevated convection associated with the passage of meso-scale convective systems. The key to capture the observed nocturnal peak is to allow elevated convection to be captured by incorporating a mid-level convection parameterization or removing the restriction of the source layer for launching air parcel within the boundary layer. Including convective memory in cumulus parameterizations acts to suppress light-to-moderate rain and promote intense rainfall, however, it weakens the diurnal variability of precipitation and does not show an improvement in the simulation of the diurnal cycle. Results also suggest that simply increasing model resolution cannot fully resolve the biases the diurnal cycle of precipitation in low-resolution models as long as cumulus parameterizations are needed. The hierarchical modeling framework is useful in identifying missing physics in GCMs and testing new developments of model physical parameterizations over different convective regimes.

How to cite: Xie, S., Tao, C., Tang, S., Ma, H.-Y., Bechtold, P., and Neelin, D.: Understanding Systematic Errors in Simulation of the Diurnal Cycle of Precipitation in Weather and Climate Models through a Multi-Model Intercomparison with a Hierarchical Modeling Framework , EGU General Assembly 2024, Vienna, Austria, 14–19 Apr 2024, EGU24-2044, https://doi.org/10.5194/egusphere-egu24-2044, 2024.

EGU24-2085 | ECS | Posters on site | AS5.1

Implementation and Evaluation of the Land Surface Model JSBACH in the ECHAM/MESSy Atmospheric Chemistry Model 

Anna Martin, Veronika Gayler, Benedikt Steil, Klaus Klingmüller, Patrick Jöckel, Holger Tost, Jos Lelieveld, and Andrea Pozzer

We present the integration and evaluation of the land surface model JSBACH (Jena Scheme for Biosphere-Atmosphere Coupling in Hamburg) in EMAC (ECHAM/MESSy Atmospheric Chemistry General Circulation Model). 
JSBACH replaces the former simplistic SURFACE submodel, introducing a five-layer diffusive hydrological transport model for soil water and a five-layer snow scheme accounting for phase changes of water. It encompasses various land cover types, forest age structures, phenology, and introduces a range of new vegetation and soil-related features, including processes like photosynthesis, plant carbon uptake, and feedback mechanisms linked to surface energy and moisture fluxes. Additionally, JSBACH provides a three-layer canopy scheme, incorporating photosynthesis and solar radiation absorption within the canopy layers. The newly coupled model is evaluated based on ERA5 reanalysis datasets, observations of the Global Precipitation Climatology Project (GPCP), and MODIS satellite data. We Evaluate land surface temperature, terrestrial water storage, surface albedo, precipitation, top-of-atmosphere radiation flux, fraction of absorbed photosynthetic active radiation, leaf area index and gross primary productivity, representing a selection of the most important drivers within the Earth System. We show that, despite the many newly included processes and features, the coupled model performance is not significantly degraded and the run time increase using the new submodel is negligible. The coupling of JSBACH extends the capabilities and versatility of EMAC, taking it a step closer to a comprehensive Earth system model. Additionally, we discuss future work, including the investigation of land-atmosphere interactions, with a particular focus on the feedback of water stress on biogenic organic compound emissions and related changes in atmospheric composition. 

How to cite: Martin, A., Gayler, V., Steil, B., Klingmüller, K., Jöckel, P., Tost, H., Lelieveld, J., and Pozzer, A.: Implementation and Evaluation of the Land Surface Model JSBACH in the ECHAM/MESSy Atmospheric Chemistry Model, EGU General Assembly 2024, Vienna, Austria, 14–19 Apr 2024, EGU24-2085, https://doi.org/10.5194/egusphere-egu24-2085, 2024.

This study investigates the inter-model spread of extratropical westerly jets between 52 Coupled Model Intercomparison Project phase 6 (CMIP6) models in boreal winter. The results show that there is a substantial spread in latitude of upper-tropospheric westerly jet between models, characterized by large inter-model standard deviations to the poleward and equatorward of jet axis, although the multi-model ensemble mean (MME) of the models performs well in simulating meridional position of westerly jets. Furthermore, we detect the consistency of inter-model jet position spread between the northern and southern hemispheres, based on the inter-model empirical orthogonal function (EOF) decomposition and correlation of regional-averaged zonal winds. Specifically, the models that simulate the westerly jets poleward/equatorward than MME position in one hemisphere tend to also simulate the jets poleward/equatorward in the other hemisphere. Accordingly, we define a global jet spread index to depict the concurrence of jet shift in the two hemispheres. The results of regression analyses based on this index indicate that the models positioning the jets poleward than MME tend to simulate a wider Hadley Cell, a poleward-shifted Ferrel Cell in the southern hemisphere, and a wider intertropical convergence zone (ITCZ). Finally, the inter-model spread of ITCZ width is mainly determined by the spread of convective precipitations between the models, implying that different convection parameterization schemes may play a crucial role in inducing the inter-model spread of extratropical westerly jets and the concurrence of meridional jet shift in the two hemispheres.

How to cite: Tang, L., Lu, R., and Lin, Z.: Consistent inter-model spread of extratropical westerly jet meridional positions in CMIP6 models between the northern and southern hemispheres in boreal winter, EGU General Assembly 2024, Vienna, Austria, 14–19 Apr 2024, EGU24-2529, https://doi.org/10.5194/egusphere-egu24-2529, 2024.

EGU24-3509 | ECS | Posters on site | AS5.1

Exploring Thermo-Electrohydrodynamic Flows with DifferentialRotation in AtmoFlow 

Yann Gaillard, Peter Szabo, and Christoph Egbers

The AtmoFlow experiment is a small-scale,  laboratory experiment  designed to explore idealized large-scale atmospheric flow fields and planned to become operational onboard the International Space Station by 2026. The experiment is composed of two independently rotating spherical shells, mimicking planetary rotation. The temperature on the shell's boundaries is heated at the equator and cooled at the poles to count for the equatorial and polar temperature difference in the presence of solar radiation. An electrical field is applied to a dielectric fluid confined between the shells that serves as an artificial gravity force, known as dielectrophoretic force, inducing the formation of buoyant flow patterns.

Beyond modelling terrestrial or explanatory atmospheres via solid body rotation, the experiment is also able to mimic atmospheric regimes of large celestial bodies by deferential rotation of each shell. The resulting combination of rotational momentum flux and buoyancy force gives rise to distinctive patterns that are dependent on the magnitude of the forcing parameter, enabling to study different regimes. Prior studies have shown that the electric gravity gives rise to a buoyant force leading to plume-like patterns [1,2] in the radial direction, while the Taylor vortices induced by differential rotation maintains an azimuth flow component. The main objective of this study is to investigate the interaction between these two different transport mechanism.

Complementing numerical investigations are therefore performed to model the experiment using the OpenFOAM ecosystem, an open source finite volume solver.  The emerging convective regimes close to the outer shell regions are evaluated. The observed patterns are the classified into these distinct regimes  and presented in a regime diagram showing the transition from different convective states. 
Beside the pattern analysis, the heat flux through the model is investigated in relation to the forcing strength. This provided  an estimation of the overall heat transported from the inner to the outer shell.  The changes in the thermal transport were also reflected in the kinetic energy, which was monitored for each case and brought in relation to the evaluated heat transfer.

[1] Futterer, B., R. Hollerbach, and C. Egbers, ‘GeoFlow: 3D Numerical Simulation of Supercritical Thermal Convective States’, Journal of Physics: Conference Series, 137/1 (2008), 012026
[2] Futterer, B., A. Krebs, A.-C. Plesa, F. Zaussinger, R. Hollerbach, D. Breuer, and others, ‘Sheet-like and Plume-like Thermal Flow in a Spherical Convection Experiment Performed under Microgravity’, Journal of Fluid Mechanics, 735 (2013), 647–83

How to cite: Gaillard, Y., Szabo, P., and Egbers, C.: Exploring Thermo-Electrohydrodynamic Flows with DifferentialRotation in AtmoFlow, EGU General Assembly 2024, Vienna, Austria, 14–19 Apr 2024, EGU24-3509, https://doi.org/10.5194/egusphere-egu24-3509, 2024.

The oceans are believed to be responsible for taking up over 90% of the heat retained by anthropogenic greenhouse gases in the atmosphere. For this reason it is important for the ocean component in climate models to have an acceptably realistic representation of the processes that transport heat from the surface into the ocean interior. It is known that ocean models tend to have significant levels of spurious numerical diapycnal mixing, arising chiefly from truncation errors in the tracer advection scheme. It is therefore important to quantify the sensitivity of the simulated climate to numerical mixing, and then to evaluate remedies for the numerical mixing.     

A large ensemble of forced and coupled simulations with a 1/4° NEMO ocean is shown to have a global mean surface heat flux ranging from -1.5 to +1.5 W/m2. We demonstrate a strong negative correlation between global ocean surface heat flux and the global mean effective diapycnal diffusivity, a metric of total ocean mixing that includes both explicit and numerical contributions. Several potential mechanisms for this apparently paradoxical result are discussed, including changes in upwelling in the Southern Ocean, mixing of bottom waters in the Pacific and Atlantic, and the Atlantic meridional overturning circulation. Approaches to reducing numerical mixing will be described. 

How to cite: Megann, A.: The sensitivity of ocean heat uptake to numerical mixing in forced and coupled ocean models, EGU General Assembly 2024, Vienna, Austria, 14–19 Apr 2024, EGU24-5172, https://doi.org/10.5194/egusphere-egu24-5172, 2024.

EGU24-5894 | ECS | Posters on site | AS5.1

Exploring mathematical formulations for a next-generation compatible finite element dynamical core 

Daniel Witt, Jemma Shipton, and Thomas Bendall

Compatible finite element methods are attractive for modelling geophysical fluids because they can replicate many of the desirable properties of the Arakawa C-grid, such as good wave dispersion. Compatible finite elements also facilitate alternative grid structures which avoid the clustering of grid points at the poles without the associated downsides these grids have with a finite difference scheme. For this reason compatible finite element methods are used in the Met Office's next-generation dynamical core, GungHo. The mathematical formulation used in GungHo is designed to be similar to that used in the Met Office's previous dynamical core, ENDGame. For instance, GungHo uses an advective form of the momentum equation and the lowest-order finite element spaces  


We present an investigation into formulation options, carried out in Gusto, a geophysical fluid toolkit built upon Firedrake, an automated code generation framework for solving PDEs via finite element methods. Gusto shares the same fundamental compatible finite element formulation as GungHo but provides greater flexibility to investigate other choices


Specifically, we investigate the effects of increasing the finite element order on the model. Due to the flexibility of Gusto, we can consider a generally higher order model as well as separately altering the horizontal and vertical orders. Additionally we investigate the effects brought about by writing the advective term in the momentum equation in its vector invariant form. We evaluate the impacts of these choices by conducting several test cases considering the short-term fluid dynamics and long-term statistical climate properties. 


Understanding how these options impact the dynamical core will inform future research directions and improvements for GungHo.

How to cite: Witt, D., Shipton, J., and Bendall, T.: Exploring mathematical formulations for a next-generation compatible finite element dynamical core, EGU General Assembly 2024, Vienna, Austria, 14–19 Apr 2024, EGU24-5894, https://doi.org/10.5194/egusphere-egu24-5894, 2024.

EGU24-6500 | Posters on site | AS5.1

Biases in stratosphere-troposphere coupling processes in S2S forecast systems 

Amy Butler, Chaim Garfinkel, and Zachary Lawrence

Two-way coupling between the stratosphere and troposphere is recognized as an important source of subseasonal-to-seasonal (S2S) predictability. Extratropical coupling between the stratosphere and the surface may modulate the tropospheric circulation in predictable ways and/or provide forecast windows of opportunity. S2S forecast models may struggle to represent such coupling processes; at longer lead times, drifts in a model’s circulation related to model configurations, biases, and parameterizations have the potential to feedback and affect stratosphere-troposphere coupling. This presentation will highlight results from an international SPARC-SNAP (Stratospheric Network for the Assessment of Predictability) community effort to diagnose and characterize biases in stratosphere-troposphere coupling in S2S models. We find that in the Northern Hemisphere, the S2S forecast systems struggle to reproduce the strength of observed upward coupling from the troposphere to the stratosphere, while downward coupling is mostly well represented. In the Southern Hemisphere, forecast systems generally overestimate downward coupling strength, despite underestimating radiative persistence in the lower stratosphere.

How to cite: Butler, A., Garfinkel, C., and Lawrence, Z.: Biases in stratosphere-troposphere coupling processes in S2S forecast systems, EGU General Assembly 2024, Vienna, Austria, 14–19 Apr 2024, EGU24-6500, https://doi.org/10.5194/egusphere-egu24-6500, 2024.

We introduce a time integrator for a prototype model of highly oscillatory PDEs that exhibits accurate solutions even under the usage of large time step sizes. To achieve large time steps, we apply a phase averaging technique that smooths out the fast waves from the system. To avoid the errors that such smoothing usually entails, we use a higher order (HO) phase averaging algorithm based on the idea of [1]. This algorithm expresses the sensitivity of the solutions on the phases in terms of an HO basis which the equations are projected onto. The resulting HO phase corrections reduce the errors in the solutions even for finite averaging windows. Rather than using monomials as such HO basis as originally suggested in [1], here we introduce an alternative basis in terms of exponentials and we discuss its properties.

Similarly to [1], we test this idea on an ODE describing the dynamics of a swinging spring, a model due to Peter Lynch. Although idealized, this model shows an interesting analogy to geophysical flows as it exhibits a high sensitivity of small scale oscillation on the large scale dynamics. On this example, we illustrate that the HO phase averaging method with an exponential basis allows for highly accurate solutions even when using large averaging windows and hence larger time step sizes than standard methods. These HO phase corrections (the reason for this improvement) can be evaluated independently, hence computed in parallel. In contrast, in standard averaging approaches, e.g. [2], arbitrarily accurate solutions could only be obtained with small averaging windows as well as small time step sizes.  We present these highly promising results and discuss challenges in generalizing them to highly oscillatory PDEs for applications in simulations of weather, ocean, and climate.

References

[1] Bauer, W., Cotter, C. J. and Wingate, B. [2022], Higher order phase averaging for highly oscillatory systems, SIAM Multiscale Modeling \& Simulation (SIAM MMS), 20, 936-956.

[2] Peddle, A. G., Haut, T., Wingate, B. [2019], Parareal convergence for oscillatory PDEs with finite time-scale separation. SIAM Journal on Scientific Computing, 41, A3476-A3497.

How to cite: Bauer, W. and Cotter, C. J.: Accurate solutions of highly oscillatory systems under large time steps using higher-order phase averages, EGU General Assembly 2024, Vienna, Austria, 14–19 Apr 2024, EGU24-6718, https://doi.org/10.5194/egusphere-egu24-6718, 2024.

EGU24-7246 | ECS | Orals | AS5.1

Algorithmic optimisation of key parameters of OpenIFS. Implications on ensemble forecasts 

Lauri Tuppi, Madeleine Ekblom, Daniel Köhler, Pirkka Ollinaho, and Heikki Järvinen

Numerical weather prediction models contain physical parameters describing various small-scale phenomena as a part of parameterization schemes. These parameters are uncertain and can be tuned manually, or more efficiently, using algorithmic methods. Algorithmic tuning is an appealing approach to increase transparency and repeatability of the tuning process. Often, the focus of model tuning is on deterministic forecasts and the effect of model tuning on ensemble forecasts receives little to no attention. This presentation exemplifies how a superficially justifiable choice of activating initial state perturbations in algorithmic tuning of model parameters can have a systematic (and potentially detrimental) effect on the spread-skill relationship of ensemble forecasts.

This presentation continues directly from the poster presented last year in EGU2023 (Tuppi et al. 2023). This time, the objective is to understand how algorithmic optimization of a weather model affects the skill of ensemble forecasts. This presentation focuses on ensemble forecasting-based verification of the tuned model versions using root-mean squared error/spread relationship, continuous ranked probability score, and filter likelihood score. The headline results show that ensemble forecasts run with tuned model parameters experience a significant reduction of spread when initial state perturbations are active during the tuning of the parameters. However, both choices of tuning the model with initial state perturbations activated and deactivated lead to optimal deterministic forecasts. This behavior likely arises from conflicting interests between the method to generate initial state perturbations and the method of determining goodness of the parameter values during tuning.

Tuppi, L., Ekblom, M., Ollinaho, P., and Järvinen, H.: Algorithmic optimisation of key parameters of OpenIFS, EGU General Assembly 2023, Vienna, Austria, 23–28 Apr 2023, EGU23-4817, https://doi.org/10.5194/egusphere-egu23-4817, 2023.

How to cite: Tuppi, L., Ekblom, M., Köhler, D., Ollinaho, P., and Järvinen, H.: Algorithmic optimisation of key parameters of OpenIFS. Implications on ensemble forecasts, EGU General Assembly 2024, Vienna, Austria, 14–19 Apr 2024, EGU24-7246, https://doi.org/10.5194/egusphere-egu24-7246, 2024.

Large-scale ocean modeling relies on the so-called primitive equations, which are a simplified form of the Navier-Stokes equations based on common assumptions. These assumptions include the Boussinesq approximation, the hydrostatic assumption and the incompressibility hypothesis. The hydrostatic assumption is yet no longer valid in the framework of high-resolution regional ocean modeling and is thus to be removed, leading to a significant increase in the computational load of the model. This gives rise to consideration of model coupling, where the hydrostatic assumption is selectively lifted within specific regions of the computational domain. This is the subject of this work.

One of the primary challenges involves accurately representing the various types of waves that propagate in the ocean. Waves are studied by analyzing the dispersion relations after linearizing the equations. A key distinction between hydrostatic and non-hydrostatic modeling lies in the dispersive nature of the wave propragation in the latter. We initially explore an idealized scenario by coupling a transport equation with a Korteweg-de Vries equation. To manage dispersive effects, we employ Perfectly Matched Layers (PML), typically used for replicating absorbing boundary conditions, they can also be regarded as a buffer zone for filtering dispersive effects.

Expanding this approach into a three-dimensional framework involves projecting the vertical ocean structure onto vertical modes associated with the ocean's background vertical stratification. We show that this projection allows us to reduce the problem to the previously studied case.

How to cite: Lozano, P.: Coupling hydrostatic and non-hydrostatic ocean circulation models. Vertical modes perspective., EGU General Assembly 2024, Vienna, Austria, 14–19 Apr 2024, EGU24-8249, https://doi.org/10.5194/egusphere-egu24-8249, 2024.

EGU24-9149 | Posters on site | AS5.1

GC5-LFRic: Developing the next Met Office coupled atmosphere-ocean model with a cubed-sphere atmosphere grid. 

Tim Graham, Maria Carvalho, Dan Copsey, Duncan Ackerley, Paul Earnshaw, Charline Marzin, Marion Mittermaier, Nikesh Narayan, Ben Shipway, and Martin Willett

The Met Office uses its global coupled atmosphere-ocean model for predictions on timescales from days to centuries as part of its seamless prediction framework. The atmospheric component of the coupled system is the Unified Model on a latitude-longitude grid. With ever increasing resolution and significant changes to high performance computing such as new processor types and increased parallelisation, a fundamentally new atmosphere model is needed to meet future requirements.

A major effort is underway to develop a new version of the coupled model using the GungHo dynamical core on a cube-sphere grid with atmospheric physics from the existing unified model. This is coupled to the NEMO ocean model and SI3 sea-ice model on a tripolar grid.

We will show results from the latest prototype models for numerical weather prediction and climate simulations. We will also discuss the ongoing work and challenges to make these systems operational at the Met Office.

How to cite: Graham, T., Carvalho, M., Copsey, D., Ackerley, D., Earnshaw, P., Marzin, C., Mittermaier, M., Narayan, N., Shipway, B., and Willett, M.: GC5-LFRic: Developing the next Met Office coupled atmosphere-ocean model with a cubed-sphere atmosphere grid., EGU General Assembly 2024, Vienna, Austria, 14–19 Apr 2024, EGU24-9149, https://doi.org/10.5194/egusphere-egu24-9149, 2024.

EGU24-9189 | Posters on site | AS5.1

Time parallel integration and phase averaging for the nonlinear shallow water equations on the sphere 

Hiroe Yamazaki, Colin Cotter, and Beth Wingate

We present a phase-averaging framework for the rotating shallow-water equations and a time-integration methodology for it. Phase averaging consists of averaging the nonlinearity over phase shifts in the exponential of the linear wave operator. Phase averaging aims to capture the slow dynamics in a solution that is smoother in time (in transformed variables), so that larger timesteps may be taken. In our numerical implementation, the averaging integral is replaced by a Riemann sum, where each term can be evaluated in parallel. This creates an opportunity for parallelism in the timestepping method.

In this talk, we will show proof-of-concept results and analyse their errors in order to examine the impact of the phase averaging on the rotating shallow-water solution. We will also examine how the averaging allows us to use larger timesteps and where the optimal averaging window is at a chosen timestep size.

How to cite: Yamazaki, H., Cotter, C., and Wingate, B.: Time parallel integration and phase averaging for the nonlinear shallow water equations on the sphere, EGU General Assembly 2024, Vienna, Austria, 14–19 Apr 2024, EGU24-9189, https://doi.org/10.5194/egusphere-egu24-9189, 2024.

EGU24-9316 | ECS | Posters on site | AS5.1

Precipitation bias correction: A novel method combining wavelet analysis and quantile mapping (WA-QM) 

Xia Wu, Zhu Liu, and Qingyun Duan

While CMIP6 has made notable improvements compared to CMIP5, there are still biases present in its simulations of different climate features due to limitations in model physics and uncertainties in input data. To address these biases, effective bias correction methods need to be employed. One commonly used method is quantile mapping, which aligns the probability density function (PDF) of climate simulations with observed data. However, this method has a limitation as it fails to maintain the temporal correspondence between model predictions and observations.

To overcome this limitation, a new approach called Wavelet Analysis-Quantile Mapping (WA-QM) has been proposed. This method involves decomposing GCM simulations into different frequency bands using discrete wavelet transformation. The scaling factors of these bands are adjusted based on their correlations with observed data. Additionally, a quantile mapping procedure is applied to modify the overall PDF of the simulations.

The WA-QM method was tested in monthly precipitation simulation data from five CMIP6 models covering the period 1951-2010 in the Pan Third Pole (PTP) region, which includes the Tibetan Plateau, Central Asia, and Southeast Asia. Results showed that WA-QM combines the advantages of wavelet analysis and quantile mapping. It effectively improves the representation of seasonal and monthly climatology varying through wavelet analysis, while also correcting mean and variance biases using quantile mapping. Consequently, the PDF closely resembles the observed data. The effectiveness of the WA-QM approach extends to correcting precipitation biases across different spatial areas and CMIP6 models.

How to cite: Wu, X., Liu, Z., and Duan, Q.: Precipitation bias correction: A novel method combining wavelet analysis and quantile mapping (WA-QM), EGU General Assembly 2024, Vienna, Austria, 14–19 Apr 2024, EGU24-9316, https://doi.org/10.5194/egusphere-egu24-9316, 2024.

EGU24-10755 | ECS | Orals | AS5.1

Design of a generalized vertical coordinate to properly represent the structure of normal modes in an oceanic model  

Gabriel Derrida, Laurent Debreu, Florian Lemarie, and Jérôme Chanut

In ocean modeling, the choice of a suitable vertical coordinate system is crucial due to the complex vertical dynamics of the ocean, playing a significant role in climate considerations. The objective of this research is to develop a generalized vertical coordinate system applicable across various scales, from global to coastal applications. 

Three primary algorithms for solving generalized vertical coordinate ocean equations are considered: quasi-Eulerian (QE) coordinate, Vertical Lagrangian Remapping (VLR), and the Arbitrary Lagrangian-Eulerian (V-ALE) method. The V-ALE method offers an alternative between QE and VLR, incorporating both Lagrangian and Eulerian components in the movement of the target grid. In this study, the focus is on the V-ALE method, with a particular emphasis on specifying the target grid. 

The proposed approach consists in defining the target grid to solve a propagation problem in an inhomogeneous environment. The stratification state, a key element of this environment, has a significant influence on the mode structure.

From a discrete point of view, the challenge is to identify the optimum grid point positions for correctly representing vertical modes. The aim is to understand the errors introduced by discretization and minimize them to find the optimal point positions. A variational method is also proposed, leading to a non-uniform grid that better represents vertical modes. We illustrate the results obtained with these methods using stratification profiles derived from climatological data.

How to cite: Derrida, G., Debreu, L., Lemarie, F., and Chanut, J.: Design of a generalized vertical coordinate to properly represent the structure of normal modes in an oceanic model , EGU General Assembly 2024, Vienna, Austria, 14–19 Apr 2024, EGU24-10755, https://doi.org/10.5194/egusphere-egu24-10755, 2024.

EGU24-10839 | Posters on site | AS5.1

The Common Community Physics Package: Recent Updates and New Frontiers 

Ligia Bernardet, Dustin Swales, Grant Firl, Mike Kavulich, Samuel Trahan, Soren Rasmussen, Daniel Abdi, Vanderlei Vargas, Jimy Dudhia, Man Zhang, Tracy Hertneky, Weiwei Li, Lulin Xue, and Isidora Jankov

The Common Community Physics Package (CCPP) is a collection of atmospheric physical parameterizations and a framework that couples the physics for use in Earth system models. The CCPP Framework was developed by the U.S. Developmental Testbed Center (DTC) and is now an integral part of the Unified Forecast System (UFS). The UFS is a community-based, coupled, comprehensive Earth modeling system designed to support research and be the source system for NOAA‘s multi-scale operational numerical weather prediction applications.  The CCPP is now operational at NOAA as part of the UFS Hurricane Analysis and Forecast System, and it is planned for upcoming implementations of the Global Forecast System and other models. The CCPP Framework is also being used in developmental mode to connect aerosol parameterizations to the UFS. Additionally, the CCPP is employed in the experimental U.S. Navy Environmental Prediction sysTem Utilizing the Non-hydrostatic corE (NEPTUNE) and is currently being integrated into National Center for Atmospheric Research (NCAR) models such as the Community Earth System Model (CESM) and the Model for Prediction Across Scales (MPAS). 

A primary goal for this effort is to facilitate research and development of physical parameterizations, while simultaneously offering capabilities for use in operational models. The CCPP Framework supports configurations ranging from process studies to operational numerical weather prediction as it enables host models to assemble the parameterizations in flexible suites. Framework capabilities include flexibility with respect to the order in which schemes are called, ability to group parameterizations for calls in different parts of the host model, and ability to call some parameterizations more often than others. Furthermore, the CCPP is distributed with a single-column model (SCM) that can be used to test innovations,  conduct hierarchical studies in which physics and dynamics are decoupled, and isolate processes to more easily identify issues associated with systematic model biases. The CCPP SCM is also being updated to be forced by the UFS output.

The CCPP v6.0.0 public release includes 23 primary parameterizations (and six supported suites), representing a wide range of meteorological and land-surface processes. Experimental versions of the CCPP also contain chemical schemes, making it possible to represent processes in which chemistry and meteorology are tightly coupled. It is anticipated that soon the CCPP will have schemes that utilize machine learning.

The CCPP is developed as open-source code and has received contributions from the wide community in the form of new schemes and innovations within existing schemes. In this presentation, we will provide an update on recent CCPP development, including transition to single-precision and initial work toward its deployment in Graphical Processing Units (GPUs), and discuss the outcomes of the CCPP Visioning Workshop held in August 2023. The latter was a multi-institutional event intended to inform the community about the CCPP and to gather input on a range of subjects. Topics covered include code management, releases, documentation, support, and best practices for interoperability to foster collaborative development. 

How to cite: Bernardet, L., Swales, D., Firl, G., Kavulich, M., Trahan, S., Rasmussen, S., Abdi, D., Vargas, V., Dudhia, J., Zhang, M., Hertneky, T., Li, W., Xue, L., and Jankov, I.: The Common Community Physics Package: Recent Updates and New Frontiers, EGU General Assembly 2024, Vienna, Austria, 14–19 Apr 2024, EGU24-10839, https://doi.org/10.5194/egusphere-egu24-10839, 2024.

EGU24-10860 | ECS | Posters on site | AS5.1

Performance portability across CPUs, GPUs and FPGAs for an unstructured grid shallow water model 

Markus Büttner, Christoph Alt, Tobias Kenter, and Vadym Aizinger

By re-implementing our unstructured grid discontinuous Galerkin solver for the 2D shallow water equations in SYCL we produce a single code which not only runs on various CPUs and GPUs from AMD, Intel, and NVIDIA as well as on Intel Field Programmable Gate Arrays (FPGAs), but also achieves excellent performance on each of those architectures. The separation of concerns concept is realized in SYCL by using a modern C++ standard for model code implementation and handling all hardware-specifics automatically in the SYCL runtime. This makes this programming model very flexible in terms of data structures and algorithmic constructs and reduces the developer exposure to various hardware architectures with their differing performance optimization requirements. Furthermore, we demonstrate that the FPGAs, which consist of generic logic blocks configured for a specific code and data structures, outperform all other architectures for small-size problems if one uses the SYCL implementation provided by Intel oneAPI.

How to cite: Büttner, M., Alt, C., Kenter, T., and Aizinger, V.: Performance portability across CPUs, GPUs and FPGAs for an unstructured grid shallow water model, EGU General Assembly 2024, Vienna, Austria, 14–19 Apr 2024, EGU24-10860, https://doi.org/10.5194/egusphere-egu24-10860, 2024.

EGU24-10960 | Posters on site | AS5.1

Improving Earth System Models via Hierarchical System Development 

Michael Ek and the DTC HSD team

Hierarchical System Development (HSD) is an efficient way to effectively integrate the model development process, with the ability to test small elements (e.g., physics schemes) in an Earth System Model (ESM) first in isolation, then progressively connecting elements with increased coupling between ESM components. System in HSD is end-to-end: it includes data ingest/quality control, data assimilation, modeling, post-processing, and verification. HSD includes individual physics simulators, Single Column Models (SCMs; including “on/off switches” for individual physics elements), small-domain and regional models, all the way to complex fully-coupled global ESMs with atmosphere/chemistry/aerosol, ocean/wave/sea-ice, land-hydrology/snow/land-ice, and biogeochemical cycle/ecosystem components. Datasets used for the different HSD steps are obtained from observational networks and field programs, ESM output, or idealized conditions (e.g., used to “stress-test” ESM elements and components). Advancing from one HSD step to the next requires appropriate verification metrics of ESM performance, many at the process level. This process is concurrent and iterative such that more complex HSD steps can provide information to be used at simpler HSD steps and vice versa.  The HSD approach can also help understand spatial and temporal dependencies in model solutions, where consistency for different models and resolutions across HSD steps is required. The Common Community Physics Package (CCPP) is designed to lower the bar for community involvement in physics testing and development through increased interoperability, improved documentation, and continuous support to developers and users. Together, CCPP and its companion SCM, developed and supported by the Developmental Testbed Center (DTC), provide an enabling software infrastructure to connect HSD steps. The HSD approach and use of CCPP will be illustrated and discussed through testing and evaluation examples. This work also supports the NOAA Earth Prediction Innovation Center (EPIC) program.

How to cite: Ek, M. and the DTC HSD team: Improving Earth System Models via Hierarchical System Development, EGU General Assembly 2024, Vienna, Austria, 14–19 Apr 2024, EGU24-10960, https://doi.org/10.5194/egusphere-egu24-10960, 2024.

EGU24-11421 | Posters on site | AS5.1

Thompson Microphysics Updates in the Unified Forecast System 

Ruiyu Sun, Fanglin Yang, Songyou Hong, Jianwen Bao, Jongil Han, Eric Aligo, Anning Cheng, Greg Thompson, Jili Dong, and Qingfu Liu

The Thompson microphysics scheme was evaluated in the Unified Forecast System (UFS) for medium-range weather application in both atmosphere-only and fully coupled atmosphere-ocean-ice-wave system configurations. Initial tests based on the Global Forecast System (GFS) version 16 configuration showed that the Thompson microphysics scheme became unstable with a typical GFS time step. An inner-loop time-splitting approach and a new semi-Lagrangian sedimentation algorithm for rain and graupel were implemented in the scheme to alleviate this numerical instability problem. To reduce biases of radiative fluxes  at the surface and at the top of the atmosphere, the conversions from cloud ice to snow and from snow to graupel in the scheme were modified along with the falling velocity of cloud ice. A few other parameters related to the cloud ice formation process were also adjusted to help improve the accuracy of radiative fluxes. Convective cloud condensate was included in the calculations of the total cloud cover and radiative transfer. Both atmosphere-only and air-sea coupled experiments were conducted to examine the impacts of these changes on global and regional forecast skills at different temporal and spatial scales. 


How to cite: Sun, R., Yang, F., Hong, S., Bao, J., Han, J., Aligo, E., Cheng, A., Thompson, G., Dong, J., and Liu, Q.: Thompson Microphysics Updates in the Unified Forecast System, EGU General Assembly 2024, Vienna, Austria, 14–19 Apr 2024, EGU24-11421, https://doi.org/10.5194/egusphere-egu24-11421, 2024.

EGU24-11884 | Orals | AS5.1

An efficient and accurate deep learning approach to weather prediction 

Tan Bui-Thanh and Arjit Seth

Machine learning is being increasingly applied as a surrogate modeling technique for weather prediction, providing fast forecasts with similar accuracy to numerical weather prediction models. However, developing accurate state-of-the-art machine learning models requires a significant allocation of high-performance computing resources for processing datasets and training. In this work, we investigate the essential components of a deep learning model architecture for accurate weather prediction and formulate strategies that reduce the number of parameters needed in such a model based on physical assumptions to lower training time. Specifically, we investigate autoencoder architectures with convolutional and attention-based neural network layers for capturing the necessary information provided by weather data for prediction. These architectures are incorporated within the neural ordinary differential equations framework and then trained based on reanalysis data constructed from simulation and observation data to provide forecasts. The results and conclusions based on these experiments are discussed, and recommendations for future work are provided.

How to cite: Bui-Thanh, T. and Seth, A.: An efficient and accurate deep learning approach to weather prediction, EGU General Assembly 2024, Vienna, Austria, 14–19 Apr 2024, EGU24-11884, https://doi.org/10.5194/egusphere-egu24-11884, 2024.

EGU24-12060 | ECS | Posters on site | AS5.1

Idealized test cases in GFDL's FV3 demonstrating the new Duo-Grid. 

Joseph Mouallem, Lucas Harris, and Xi Chen

The Duo-Grid is a novel algorithm that addresses grid imprinting in generic gnomonic cubed-sphere grids. The algorithm aims to overcome grid discontinuities at the edges and corners by remapping data in a cube’s face halo region from its kinked coordinates to its natural location along extended great circle lines. We recently implemented the Duo-Grid in the Geophysical Fluid Dynamics Laboratory's (GFDL) Finite-Volume Cubed-Sphere Dynamical Core (FV3). We apply the Duo-Grid in idealized tests of 2D shallow water solver and the 3D hydrostatic and non-hydrostatic solvers. Our findings reveal that error norms are greatly reduced and grid imprinting is practically eliminated when employing the Duo-Grid. Most notably we find that a Rossby-Haurwitz wave is maintained significantly longer in the Rossby-Haurwitz tests, from about 80 to beyond 100 days. These results strongly suggest an improvement in FV3's accuracy and robustness.

How to cite: Mouallem, J., Harris, L., and Chen, X.: Idealized test cases in GFDL's FV3 demonstrating the new Duo-Grid., EGU General Assembly 2024, Vienna, Austria, 14–19 Apr 2024, EGU24-12060, https://doi.org/10.5194/egusphere-egu24-12060, 2024.

EGU24-12501 | ECS | Orals | AS5.1

A unifying moist shallow water framework and test cases for moist shallow water models 

Nell Hartney and Thomas Bendall

The rotating shallow water equations are widely used in the development of weather and climate models. They are a much simpler equation set than the full 3D atmospheric equations and so are computationally cheap, but they still retain many pertinent features of atmospheric dynamics. The usual shallow water equations model a ‘dry’ atmosphere and so neglect moist processes and moisture effects. Including moisture in the shallow water system not only extends the modelling potential of the equations, but also introduces numerical complexities that are of interest in the development of time-stepping schemes. These include features such as new timescales related to moist physics processes, discontinuities introduced by the notion of boundaries between ‘precipitating’ and ‘non-precipitating’ regions, and how the addition of moisture affects the ideas of balance and conservation in the equations. In this way the moist shallow water equations provide a simplified equation set for exploring physics-dynamics coupling and how this coupling is handled by different time steppers.

This talk will discuss our implementation of a flexible, unifying moist shallow water model that encompasses three different approaches to moist shallow water modelling. Our implementation is in the dynamical core toolkit Gusto, which follows a compatible finite element approach like that of the next-generation UK Met Office model. We will demonstrate some simple moist shallow water test cases using each of the three approaches with our unifying formulation in Gusto, and describe progress towards running tests with more complex dynamics to investigate questions about time-stepping with physics. 

How to cite: Hartney, N. and Bendall, T.: A unifying moist shallow water framework and test cases for moist shallow water models, EGU General Assembly 2024, Vienna, Austria, 14–19 Apr 2024, EGU24-12501, https://doi.org/10.5194/egusphere-egu24-12501, 2024.

EGU24-13684 | Orals | AS5.1

Development of the signal-to-noise paradox in subseasonal forecasting models: After how long? Where? Why? 

Chen Schwartz, Chaim I. Garfinkel, Jeff Knight, Masakazu Taguchi, Judah Cohen, Wen Chen, Amy H. Butler, Daniela I.V. Domeisen, and Zachary Lawrence

Subseasonal forecast models are shown to suffer from the same  inconsistency found in climate models between the low strength of predictable signals and the relatively high level of agreement they exhibit with observed variability of the atmospheric circulation. That is, subseasonal forecast models show higher correlation with observed variability than with their own simulations, i.e., the signal-to-noise paradox. Also similar to climate models, this paradox is particularly evident in the North Atlantic sector.  The paradox is not evident in week 1 or week 2 forecasts, and hence is limited to subseasonal timescales. The paradox appears to be related to overly fast decay of Northern Annular  Mode regimes. Three possible causes of this overly fast decay and for the paradox in the Northern Hemisphere are identified:  a too-fast decay of polar stratospheric signals, overly weak downward coupling from the stratosphere to the surface (in some models),  and overly weak transient synoptic eddy feedbacks. While the paradox is clearly evident in the North Atlantic, things are qualitatively different in the Southern Hemisphere:  Southern Annular  Mode regimes persist realistically, the stratospheric signal is well maintained, and eddy feedback is, if anything, too strong and zonal.  

How to cite: Schwartz, C., Garfinkel, C. I., Knight, J., Taguchi, M., Cohen, J., Chen, W., Butler, A. H., Domeisen, D. I. V., and Lawrence, Z.: Development of the signal-to-noise paradox in subseasonal forecasting models: After how long? Where? Why?, EGU General Assembly 2024, Vienna, Austria, 14–19 Apr 2024, EGU24-13684, https://doi.org/10.5194/egusphere-egu24-13684, 2024.

EGU24-16005 | ECS | Posters on site | AS5.1

Block-structured grids for finite element models of coastal ocean 

Jonathan Schmalfuß, Sara Faghih-Naini, Daniel Zint, and Vadym Aizinger

For numerical models of the ocean, the choice of the underlying grid is a crucial technical decision affecting the accuracy, stability, computational performance, and, ultimately, modeling skill. This is a particularly important issue for high-resolution simulations of coastal and regional oceans, where a precise representation of irregular land boundaries and geometric features such as islands, channels, rivers, etc. is a key requirement. For these types of applications, unstructured triangular meshes are often the preferred type of horizontal mesh due to their adaptability and ease of construction. However, optimizing the computational performance of unstructured mesh codes on many modern hardware architectures is quite challenging compared to doing the same for stencil-based numerical schemes used in structured grid models. As a viable alternative to unstructured meshes, we propose block structured grids (BSGs) consisting of a topologically unstructured mesh of blocks, each of which is partitioned using a structured grid. Our methodology allows to automatically generate BSGs for realistic ocean domains with a prescribed number of blocks of given resolution already load-balanced for execution on a parallel computer of given configuration. To allow generating BSGs for ocean domain geometries and topographies of varying complexity our approach supports three different types of BSGs:

1. standard BSGs -- very computationally efficient but only practical for rather simple geometries

2. masked BSGs -- an extension of the standard BSGs that permits masking of elements to allow meshing of small geometric features using large blocks

3. hybrid BSGs -- an entirely new method combining structured with unstructured blocks to offer the optimal compromise between geometric accuracy and computational efficiency

We present grid generation techniques, validation of simulation results, and computational performance evaluations for the proposed methods.

How to cite: Schmalfuß, J., Faghih-Naini, S., Zint, D., and Aizinger, V.: Block-structured grids for finite element models of coastal ocean, EGU General Assembly 2024, Vienna, Austria, 14–19 Apr 2024, EGU24-16005, https://doi.org/10.5194/egusphere-egu24-16005, 2024.

We have developed a new advection scheme for Eulerian models by combining the Piecewise Parabolic Method “PPM” (Colella, 1984) and the Walcek scheme (Walcek, 2000). The concept is to keep the excellent accuracy of the PPM scheme in the areas of smooth gradient, and to use the flux modifications of Walcek to improve over the PPM scheme in the vicinity of extrema. This combination forms a new advection scheme that we call PPM+W (“Piecewise Parabolic Method + Walcek”). We have studied the properties of this new scheme in the idealized framework of ToyCTM v1.0.1, an academic model including advection and stiff chemistry mimicking tropospheric photochemistry, including inert species and reactive species such as nitrogen oxide, ozones and radicals. This study shows that PPM+W reduces advection error by 10-30% compared to both the Walcek scheme and the PPM scheme. The efficiency of PPM+W is also good: the computation time for PPM+W is not higher than in the classical PPM scheme. Following these results, PPM+W has been implemented in the CHIMERE chemistry-transport model (CHIMERE v2023r1), and could also be useful for other models including atmospheric and oceanic models.

Apart from the design of this new advection scheme, we present a novel method to evaluate advection schemes in contexts where mixing is weak / negligible, and show that this novel method gives results consistent with more classical methods, without requiring the knowledge of the exact solution.

References:
 Colella, P. and Woodward, P. R.: The piecewise parabolic method (PPM) for gas-dynamical simulations, J. Comput. Phys., 54, 174-201, https://doi.org/10.1016/0021-9991(84)90143-8, 1984
 
 Mailler, S., Pennel, R., Menut, L., and Cholakian, A.: An improved  version of the piecewise parabolic method advection scheme: description  and performance assessment in a bidimensional test case with stiff  chemistry in toyCTM v1.0.1, Geosci. Model Dev., 16, 7509–7526,  https://doi.org/10.5194/gmd-16-7509-2023, 2023

Walcek, C., Minor flux adjustment near mixing ratio extremes for simplified yet highly accurate monotonic calculation of tracer advection, J. Geophys. Res., 105, 9335–9348, https://doi.org/10.1029/1999JD901142, 2000

How to cite: Mailler, S., Pennel, R., Menut, L., and Cholakian, A.: PPM+W, an improved version of the Piecewise Parabolic Method advection scheme: Description, evaluation and implementation in the CHIMERE model., EGU General Assembly 2024, Vienna, Austria, 14–19 Apr 2024, EGU24-16312, https://doi.org/10.5194/egusphere-egu24-16312, 2024.

EGU24-17236 | Posters on site | AS5.1

Low-effort stabilization for compressible Euler-Equations for volcanic plume simulation 

Joern Behrens and Michel Bänsch

A stabilization method for a discontinuous Galerkin discretization of the compressible Euler equations is presented, based on the idea of balancing the equations discretely. This method is very cost efficient with regards to computational effort while still effective in stabilizing the discrete numerical scheme. We apply the new numerical scheme to standard test cases as well as to a simplified volcanic plume model within an adaptive mesh refinement simulation framework. Comparisons with different adaptive mesh refinement environments (i.e. amatos and deal.II) are perfomed and demonstrate the applicability in particular in triangular adaptive meshes. Tests show that this method generates reliable and computationally efficient results.

How to cite: Behrens, J. and Bänsch, M.: Low-effort stabilization for compressible Euler-Equations for volcanic plume simulation, EGU General Assembly 2024, Vienna, Austria, 14–19 Apr 2024, EGU24-17236, https://doi.org/10.5194/egusphere-egu24-17236, 2024.

EGU24-17639 | Posters on site | AS5.1

Development of systematic errors in the East Asian summer monsoon 

Jose M. Rodriguez

Mean-state errors in the simulation of the Asian summer monsoon are common to many CMIP6 climate models, with some biases persisting over several generations of models.  In this work, we use the Met Office Unified Model (MetUM) as an example to understand the physical processes involved in the emerged circulation patterns.  We focus on the west Pacific subtropical high (WPSH), an important feature of the East Asian summer monsoon, that modulates the distribution of summer rainfall in the region and influences the tropical cyclone activity in the Western North Pacific.    MetUM exhibits robust systematic biases in its representation of the WPSH, including a weakening of the anticyclone and a location too far east, which leads to an underestimation of the southwesterly monsoon flow over East Asia and contributes to seasonal precipitation errors in the area.

We present results from a combination of various techniques and sensitivity experiments, used to understand the sources of the circulation errors.    We benefit from MetUM’s seamless approach of employing the same dynamical core and physical parameterisations in configurations used for various forecast systems, from NWP to climate projections.  Previous studies have shown that many systematic errors in the climate model develop within the first few days of simulation and persist to climate timescales.   Using an ensemble of NWP hindcasts, we examine the error development after initialisation. This allows to reduce the impact of circulation-physics feedbacks and separate the roles played by local physical processes and remote teleconnections.  We apply the nudging methodology, where velocities and temperatures are relaxed towards analysis in chosen regions, to examine the remote effect that biases developing in one region produce in other regions.  The information from these experiments highlights a key role for physical deficiencies over the Maritime Continent in the development of the WPSH biases in MetUM.  The use of an idealised model (semi-geotriptic balance), which allows to study the effect of individual physics tendencies, shows that diabatic heating errors associated with convection are the main source of MetUM WPSH circulation bias.  Further analysis with moisture tendencies reveals that in the model’s parameterised convection, a large drying of the lower boundary layer occurs, balanced only by surface fluxes.  In places with low exchange coefficient (low surface wind), surface fluxes are not able to sustain convection over a long period and the bias is established. 

We examine the persistence of the circulation bias in various models, by evaluating   a perturbed parameter ensemble (PPE) of MetUM climate simulations, which samples climate uncertainties arising from differences in parameter values in physics schemes.   We compare the circulation biases in the ensemble members with model simulations with a new convection parameterisation scheme, CoMorph, and with a convection-permitting simulation. We also show preliminary results of circulation bias development in a machine-learning model for weather forecast.

How to cite: Rodriguez, J. M.: Development of systematic errors in the East Asian summer monsoon, EGU General Assembly 2024, Vienna, Austria, 14–19 Apr 2024, EGU24-17639, https://doi.org/10.5194/egusphere-egu24-17639, 2024.

EGU24-1089 | ECS | Posters on site | CL4.5

Evaluation of Mesoscale Eddy-Ice Interaction in the Southern Ocean using High-Resolution Models 

Stephy Libera, Hugues Goosse, and Dian Putrasahan

Antarctic sea ice plays an important role in the global climate through its influence on local and global oceanic and atmospheric circulations, planetary radiative balance, and the crucial support it provides for Southern Ocean ecosystem. Understanding the physical processes influencing Antarctic sea ice, and the drivers of its change are therefore of broad interest. The sea ice–covered the Southern Ocean, has relatively weak stratification in the upper ocean, where a relatively thin halocline separates the cold winter mixed layer from significantly warmer ocean interior. When warmer waters from the ocean interior enter the mixed layer, it can melt sea ice at its base. Features in the upper ocean, like mesoscale eddies can impact the thermohaline structure and stratification in this region and can impact the heat delivered to the surface. However, the mesoscale dynamics in the polar regions, especially under sea ice cover, is little known due to the limited observations and the inability of many numerical models to resolve mesoscale processes in the high latitudes.   

This study aims to understand better the interaction between ocean mesoscale eddies and sea ice using high-resolution European Eddy RIch Earth System Models (EERIE) models. We investigate the effect of mesoscale eddies locally, and the integrated effect of eddy-sea ice interaction in the circumpolar Southern Ocean. Previous studies have identified eddy ice interactions to vary within regions of varying sea ice concentrations, such as in the high concentration pack ice and low-concentration marginal ice zones. The variations in the eddy-sea ice interaction in the Southern Ocean, within the open ocean, pack ice, and marginal ice zones are further investigated in this study.  

How to cite: Libera, S., Goosse, H., and Putrasahan, D.: Evaluation of Mesoscale Eddy-Ice Interaction in the Southern Ocean using High-Resolution Models, EGU General Assembly 2024, Vienna, Austria, 14–19 Apr 2024, EGU24-1089, https://doi.org/10.5194/egusphere-egu24-1089, 2024.

EGU24-1430 | Orals | CL4.5

Evaluation of the K-scale model hierarchy across MetOffice models. 

Claudio Sanchez, Huw Lewis, Richard Jones, James Warner, and Dasha Shchepanovska

Models resolving km-scale processes, such as deep convection, improve the representation of precipitation associated to several processes at sub-synoptic scales, e.g. diurnal cycle, mesoscale convective systems or tropical cyclones. These models generally improve extremes and add value to hazard forecasting, in particular over the tropics. However, these models have been unaffordable to run on a pseudo-global scale until recently and thus their impact in large scale processes is not well known.

Aiming to develop the next generation of Met Office weather and climate prediction systems, the UK K-scale project has been established to evaluate the technical challenges, the scientific improvements and the predictability benefits of km-scale models. The first step of the program is the development of a K-scale “model hierarchy”, a family of simulations across several resolutions and two scientific configurations under the same MetOffice Unified Modelling framework (MetUM). Such hierarchy comprises a generic global model at 12km resolution, realizations at different resolutions of the Cyclic Tropical Channel (CTC), which is a global model in the zonal with north and south boundaries at 26N and 44S respectively, and limited area models (LAMS) over several locations at 2.2km. The two scientific configurations are (i) a global-like aimed at global resolutions above 10km, which includes a parametrization of shallow and mid-level convection, and (ii) a regional-like aimed to km- and sub-km-scale LAM which does not parametrize convection at any level.

Our results from simulations of the 40-day DYAMOND summer and winter periods show than differences between global-like and regional-like configurations at the same resolution can be as large as differences between models at 12km and 4.4km resolution with the same configuration. When all convective processes are not parametrized in the whole tropics at km-scale resolution, the PDF of precipitation shift towards higher intensities, the diurnal cycle improves in several regions, and the wet and dry biases around the E-W boundaries of LAMs are reduced.

The African tropical easterly jet is represented differently across the simulations; with a stronger jet in global-like configurations with convective parametrization. A significant change in mean-state upper wind over the Indian Ocean has potential implications on both subsidence over East Africa, and wind shear over West Africa. These are both tied to widespread rainfall patterns over Africa.

Regional-like configurations at km-scale resolution capture the kinetic energy spectra slope -5/3, poorly represented by the global-like model at 12km. The uncertainty growth across the kscale hierarchy is explored with the use of a twin experiment methodology, and in particular the role of equatorial waves in the error growth across resolutions and science configurations.

How to cite: Sanchez, C., Lewis, H., Jones, R., Warner, J., and Shchepanovska, D.: Evaluation of the K-scale model hierarchy across MetOffice models., EGU General Assembly 2024, Vienna, Austria, 14–19 Apr 2024, EGU24-1430, https://doi.org/10.5194/egusphere-egu24-1430, 2024.

EGU24-2040 | ECS | Posters on site | CL4.5

The representation of tropical cyclones in high resolution coupled climate simulations 

Paolo Ghinassi and Paolo Davini

Tropical cyclones (TCs) are one of the most impactful weather phenomena on Earth. Their formation and development depends on small-scale processes like air-sea interaction and convection. These processes pose challenges for climate models since they are often misrepresented and act as sources of uncertainty. Additionally, TCs interact with both tropical and extratropical large-scale circulation, contributing to the upscale error propagation. The accurate representation of such physical processes in climate models therefore is crucial for the correct simulation not only of TCs but of the entire climate system. Until a few years ago, these small scale processes could not be resolved explicitly in traditional state-of-the-art coupled climate simulations due to a too coarse horizontal resolution. Nowadays that we are able to run climate simulations at a very high resolution (less than 10 km) and explicitly resolve such processes we expect to have a much more realistic representation of the intensity, frequency, and structure of TCs in climate models.

For this study, we consider data from the nextGEMS and Climate Digital Twin (part of the Destination Earth initiative) experiments (with an horizontal resolution up to 2.5 km), assessing model performance comparing them with both ERA5 reanalysis and with observational data sets such as IBTrACS to detect model biases. An algorithm for the detection and tracking of TCs based on the TempestExtremes library is used to detect and track TCs at first on a coarser resolution grid on a single time step (e.g., every 6 hours). Then, a series of variables at the original model resolution are saved in the vicinity of the TC centres, to allow examining their finer structure with an unprecedented level of detail. This diagnostic is part of the Application for Quality assessment and Uncertainty quAntification (AQUA) model evaluation framework developed within the Destination Earth project. Our analysis considers the TCs intensity (e.g. cyclones classification, wind pressure relationship), TCs structure (e.g. examining wind gusts and rain bands) and TCs temporal and spatial distribution (computing and analysing TCs trajectories). Preliminary results enlight the ability of these very high-resolution climate simulations to represent TCs features in a much more realistic way, especially close to the smallest resolved scales. Moreover, an increased horizontal resolution is beneficial to reduce model biases, enabling climate models to simulate TCs with a magnitude comparable to the observations.

How to cite: Ghinassi, P. and Davini, P.: The representation of tropical cyclones in high resolution coupled climate simulations, EGU General Assembly 2024, Vienna, Austria, 14–19 Apr 2024, EGU24-2040, https://doi.org/10.5194/egusphere-egu24-2040, 2024.

EGU24-2359 | ECS | Posters on site | CL4.5

Simulating the Earth system with interactive aerosols at the kilometer scale 

Philipp Weiss and Philip Stier

Aerosols originate from natural processes and human activities. They scatter and absorb radiation but also act as condensation nuclei in clouds. How these interactions influence the climate is still uncertain. New climate simulations at the kilometer-scale allow us to examine long-standing questions related to these interactions such as the complex effects on convective clouds. To perform kilometer-scale simulations with interactive aerosols, we developed the reduced-complexity aerosol module HAM-lite and coupled it to the climate model ICON-Sapphire. HAM-lite is based on and fully traceable to the complex aerosol module HAM. Aerosols are represented as an ensemble of log-normal modes with prescribed sizes and compositions.

We present first global simulations with ICON-Sapphire and HAM-lite at resolutions of about five kilometers and over periods of a few months. The sea surface temperature and sea ice are prescribed with boundary conditions of AMIP, and the initial conditions of the atmosphere and land are derived from the operational analysis of ECMWF. The aerosols are represented by two pure modes, one of dust and one of sea salt, and two internally mixed modes, both of organic carbon, black carbon, and sulfate. The first mixed mode represents aerosols from biomass burning emissions and the second mixed mode represents aerosols from anthropogenic and volcanic emissions.

The simulations capture key elements of the global aerosol cycle, of which some are missing entirely in coarse-scale simulations. For example, cold pool fronts drive intense dust storms over the Sahara and tropical cyclones interact with sea salt aerosols in the Pacific. We observe the transport of dust aerosols across the ocean, the wash out of sea salt aerosols by rain bands, and the updraft of biomass burning aerosols over land. We evaluate the observations with a combination of remote-sensing and in-situ data. We also compare the results to coarse-scale climate simulations. To understand processes like updraft by convection or deposition by rain, we examine the distribution of aerosols throughout the vertical column.

How to cite: Weiss, P. and Stier, P.: Simulating the Earth system with interactive aerosols at the kilometer scale, EGU General Assembly 2024, Vienna, Austria, 14–19 Apr 2024, EGU24-2359, https://doi.org/10.5194/egusphere-egu24-2359, 2024.

We propose a protocol for observational intensive intercomparison experiments of global storm-resolving models, targeting for evaluation by the EarthCARE satellite, the new satellite scheduled to be launched in May 2024. Previously, a month-long or 40-day simulation of an intercomparison of global storm-resolving models was conducted under the DYAMOND (the DYnamics of the Atmospheric general circulation Modeled On Non-hydrostatic Domains) project. Global storm-resolving models can simulate meso-scale systems in the global domain, and it has been shown that the month-long simulations under the DYAMOND project reproduce the evolution of meso-scale convective systems comparable to nature in many aspects. As a next step of the feasibility of the global storm-resolving models, two directions of the intercomparison experiments are considered. One is to extend the simulation time to cover a longer period, such as a one-year experiment with a seasonal march (Takasuka et al. 2024, in preparation). The other is to evaluate with intensive observations. Here, we propose a possible protocol for the short-term (a few weeks to a month) intercomparison experiment to evaluate GSRM results with observation by the EarthCARE satellite and the coordinated grand observation campaign called ORCESTRA.

The EarthCARE satellite will enable the world's first observations of Doppler velocities from space using radar. This groundbreaking capability allows for the observational understanding of global snow and raindrop falling velocities. In numerical climate and weather forecasting models, falling velocities of snow and raindrops have traditionally relied on empirical formulas based on fragmented observations, lacking comprehensive validation through global observations. These falling velocities have frequently been used as tuning parameters for numerical models. The falling velocity of upper-level clouds directly impacts radiation balance through variations in cloud amount. In contrast, the raindrop velocity influences the formation of cold pools and the organization of convective clouds. After obtaining Doppler velocity observations from the EarthCARE satellite, reliance on these falling velocities as tuning parameters becomes obsolete, introducing observational constraints. Conversely, altering these falling velocities from traditional prescribed values in numerical models leads to deviations in model climatology and equilibrium states from observations, necessitating refinement of other processes, which require the resolution of new compensatory errors. This presentation analyzes the characteristics of Doppler velocities using the global non-hydrostatic model NICAM and discusses the impact of snow and raindrops falling velocities. Specifically, utilizing the EarthCARE-like simulated data based on a global 220m mesh NICAM simulation, we aim to comprehend the global view of falling velocity characteristics and gain insights to analyze the EarthCARE satellite observational data.

How to cite: Satoh, M., Roh, W., and Matsugishi, S.: Proposal for an Intensive Short-term Intercomparison Experiment of Global Storm Resolution Models for Evaluation by EarthCARE Satellite Observations, EGU General Assembly 2024, Vienna, Austria, 14–19 Apr 2024, EGU24-3359, https://doi.org/10.5194/egusphere-egu24-3359, 2024.

EGU24-5731 | ECS | Orals | CL4.5

Identifying cloud objects in the km-scale earth system model ICON 

Vanessa Rieger, Paul Splechtna, and Aiko Voigt

Clouds crucially impact Earth’s climate. The distribution of clouds, horizontally and vertically, influences the radiative transfer through the atmosphere. Hence, to correctly compute the radiative transfer, it is important to understand the horizontal and vertical distribution of clouds.  Km-scale earth system models enable to resolve convection explicitly and offer the potential to represent cloud patterns more realistically. We investigate simulations of the earth system model ICON with a horizontal resolution of 5 km performed within the project nextGEMS. We identify cloud objects using connected component labelling. The method is applied to the vertically integrated cloud field as well as to the global three-dimensional cloud field. We analyse the distribution of cloud objects, their water and ice content as well as their fractal dimension on a global and regional scale. The choice of the threshold for identifying cloud objects strongly influences the analysis of the objects.

How to cite: Rieger, V., Splechtna, P., and Voigt, A.: Identifying cloud objects in the km-scale earth system model ICON, EGU General Assembly 2024, Vienna, Austria, 14–19 Apr 2024, EGU24-5731, https://doi.org/10.5194/egusphere-egu24-5731, 2024.

EGU24-6596 | ECS | Orals | CL4.5

Improved northern hemispheric atmospheric blocking properties in two storm-resolving climate models 

Edgar Dolores Tesillos and Olivia Martius

Atmospheric blocking and its associated extreme phenomena, such as hot and cold spells represent a risk to society. Current climate models struggle to simulate the atmospheric blocking properties, making it difficult to understand the underlying physical processes and raising uncertainty about their evolution under warming. Today, several climate models attempt to better resolve small-scale processes and have demonstrated their ability to convincingly simulate them; however, few studies have evaluated the impact of these tunings on large-scale flow.

Here, we investigate the representation of Atmospheric blocking characteristics in the two new generations of storm-resolving Earth-system models (nextGEMS), consisting of the Icosahedral Nonhydrostatic Weather and Climate Model (ICON) and the ECMWF Integrated Forecasting System (hereafter only IFS). These models are run at high horizontal resolution, ICON at 5 km (convective parameterization off) and IFS at 4.4 km and 28 km (convective parameterization on). Both models are fully coupled models with eddy-resolving ocean models. The five years of simulations are compared with the reanalysis ERA5 and one CMIP6 model (MPI-ESM1-2-LR). Atmospheric blockings are identified and tracked using a Lagrangian approach based on the geopotential height anomaly at 500 hPa. Properties such as intensity, size, and zonal speed are evaluated.

The nextGEMS showed an increased skill in reproducing atmospheric blocking at the system scale. Firstly, the Atmospheric blocking intensity, spatial extension, and zonal speed are closer to the ERA5 than the CMIP6 model. However, the block intensity and size in the IFS model are simulated better than in the ICON model, and its improvement increases at the finest resolution, 4.4 km. This improvement at higher resolution coincides with more precipitation upstream to the block center than at lower resolution during the onset phase. The latter is consistent with recent studies, indicating that increased moist processes contribute to stronger and bigger blocks. Thus, we provide insights into how the large-scale flow can benefit from the storm-resolving climate models by increasing their skill to simulate atmospheric blocking characteristics and the diabatic processes at higher resolution in a fully coupled system. A more comprehensive evaluation of the large-scale flow in the nextGEMS models will be performed with longer runs.

How to cite: Dolores Tesillos, E. and Martius, O.: Improved northern hemispheric atmospheric blocking properties in two storm-resolving climate models, EGU General Assembly 2024, Vienna, Austria, 14–19 Apr 2024, EGU24-6596, https://doi.org/10.5194/egusphere-egu24-6596, 2024.

EGU24-7170 | Orals | CL4.5

Projections of future climate changes from the cloud-permitting greenhouse warming simulations 

Sun-Seon Lee, Ja-Yeon Moon, Axel Timmermann, Jan Streffing, Tido Semmler, and Thomas Jung

Assessing the future risk of natural disasters, securing sustainable energy and water resources, and developing strategies for adapting to climate change remain challenging due to the large uncertainties in regional-scale climate projections. Recent efforts to address this issue include km-scale coupled climate model simulations that resolve mesoscale processes in the atmosphere and ocean, as well as their interactions with the large-scale environment and small-scale topographic features. Our presentation shows the first results from a series of global 9 km-scale greenhouse warming simulations using the AWI Climate Model Version 3 which is based on the OpenIFS atmosphere model at TCO1279 resolution and 137 vertical levels and the FESOM2 ocean model at 4-15 km resolution. By comparing a set of consecutive 10-year time-slice simulations forced by the CMIP6 SSP585 scenario with a transient simulation at a lower-resolution (31 km in the OpenIFS), we identify key differences in weather and climate-related phenomena, including tropical cyclones, ENSO, and regional climate change features that can be attributed to km-scale dynamics in clouds and atmospheric circulation patterns. The findings from our cloud-permitting climate simulations provide valuable insights into the role of small-scale processes in the sensitivity of the regional and global climate.

How to cite: Lee, S.-S., Moon, J.-Y., Timmermann, A., Streffing, J., Semmler, T., and Jung, T.: Projections of future climate changes from the cloud-permitting greenhouse warming simulations, EGU General Assembly 2024, Vienna, Austria, 14–19 Apr 2024, EGU24-7170, https://doi.org/10.5194/egusphere-egu24-7170, 2024.

EGU24-8254 | ECS | Orals | CL4.5

Demonstrating the potential of km-scale multi-annual coupled global simulations in nextGEMS: a (urban) surface perspective 

Xabier Pedruzo-Bagazgoitia, Tobias Becker, Sebastian Milinski, Thomas Rackow, Irina Sandu, Souhail Boussetta, Emanuel Dutra, Ioan Hadade, Joao Martins, Joe McNorton, Birgit Sützl, and Nils Wedi

The nextGEMS project is dedicated to develop global coupled earth-system models for multidecadal climate projections at a kilometre-scale resolution. By harnessing the strengths of high spatial resolution, the project seeks to improve the representation of physical processes and provide climate information at spatial scales that align with real-world measurements. Preparing for 30-year production runs, nextGEMS has achieved significant milestones, including the successful completion of five-year global coupled runs with a 5 km spatial resolution by two different Earth-System models: ICON, and ECMWF’s Integrated Forecasting System (IFS) coupled to the sea ice-ocean model FESOM. In this work we focus on the km-scale IFS-FESOM configuration, along with a comparable set of coarser IFS simulations coupled to either FESOM or NEMO ocean models.

We first provide a brief overview of the most relevant scientific modifications on IFS and FESOM through the development cycles needed to perform multi-annual simulations: a reduction of the global water and energy imbalance by orders of magnitude, as well as the modification in cloud physics parameters to provide a stable climate, improved coupling of ocean surface currents and fluxes, and the addition of improved high-resolution land use and land cover maps.

We further investigate the impact that the new refined surface maps have on the representation of climate at the surface and near-surface. We first explore the spatio-temporal surface-atmosphere coupling in these km-scale simulations. We then focus on more local phenomena: In particular, we pioneer the study of urban climate via coupled global multiannual simulations and explore surface-atmosphere interactions over urbanized areas, by combining refined land use/land cover maps with the active urban scheme in IFS. We find a more realistic spatial distribution of surface temperature in both urban and rural areas, especially noticeable at spatial resolutions of 9km and finer. By showing that the diurnal cycle of urban heat island intensity exhibits improved accuracy in numerous large European urban areas, our global simulations can provide local granularity at the scale of individual cities The enhancements in representing urban climate features are quantified through reduced bias, root-mean square error, and increased correlation with successively increasing model resolution.

How to cite: Pedruzo-Bagazgoitia, X., Becker, T., Milinski, S., Rackow, T., Sandu, I., Boussetta, S., Dutra, E., Hadade, I., Martins, J., McNorton, J., Sützl, B., and Wedi, N.: Demonstrating the potential of km-scale multi-annual coupled global simulations in nextGEMS: a (urban) surface perspective, EGU General Assembly 2024, Vienna, Austria, 14–19 Apr 2024, EGU24-8254, https://doi.org/10.5194/egusphere-egu24-8254, 2024.

EGU24-8565 | Orals | CL4.5

Ocean Eddy-rich Climate Simulation with IFS-FESOM 

Rohit Ghosh, Suvarchal K Cheedela, Nikolay Koldunov, Amal John, Jan Streffing, Vasco Müller, Sebastian Beyer, Thomas Rackow, Dmitry Sidorenko, Sergey Danilov, and Thomas Jung

Efforts to enhance climate model simulations by achieving higher resolutions to explicitly capture sub-grid scale processes constitute a central objective in contemporary climate modeling. In this pursuit, our focus is on resolving a pivotal element of the climate system—the ocean meso-scale eddies. At the Alfred-Wegener-Institute, we are working towards this objective by employing the ocean-sea ice model FESOM at approximately 5km horizontal resolution (NG5), coupled with the atmospheric model IFS at a 9km horizontal resolution (tco1279).

This presentation showcases preliminary results from the control simulations of IFS-FESOM under 1950 radiative conditions. Furthermore, we provide an initial glimpse into results from a historical simulation starting in 1950 with the same model configuration. Our analysis illuminates how ocean eddy-rich regions are portrayed in our simulations relative to observations. We delineate the changes and improvements in key climate components, encompassing North Atlantic/Southern Ocean temperatures, NAO, atmospheric blocking, midlatitude storm tracks, ENSO, Monsoon, ITCZ, Hadley/Walker Cells, MJO, meridional overturning, gyre circulations, as well as Arctic/Antarctic Sea ice dynamics under such high resolution.

Moreover, we endeavor to demonstrate how regional high-frequency weather and climate processes can be accurately represented in such simulations, including capturing the nature of regional extremes. In essence, our goal is to illustrate how advancing model resolution to resolve ocean eddies contributes to a more comprehensive representation of the climate system.


How to cite: Ghosh, R., Cheedela, S. K., Koldunov, N., John, A., Streffing, J., Müller, V., Beyer, S., Rackow, T., Sidorenko, D., Danilov, S., and Jung, T.: Ocean Eddy-rich Climate Simulation with IFS-FESOM, EGU General Assembly 2024, Vienna, Austria, 14–19 Apr 2024, EGU24-8565, https://doi.org/10.5194/egusphere-egu24-8565, 2024.

EGU24-8603 | Orals | CL4.5

Cloud-feedbacks in global km-scale earth system model simulations 

Ja-Yeon Moon, Sun-Seon Lee, Axel Timmermann, Jan Streffing, Tido Semmler, and Thomas Jung

Clouds are an important regulator of earth’s radiation balance. Therefore, future changes in clouds and corresponding feedbacks are likely to influence global climate sensitivity. How clouds respond to greenhouse warming on global and regional scales is still not well understood. Here we present first results from a km-scale, cloud-permitting greenhouse warming simulation conducted with the coupled OpenIFS-FESOM2 model (AWI-CM3) with ~9 km atmosphere resolution, 137 vertical levels and  4-15 km variable ocean resolution. Our analysis is based on a  set of 10-year time-slice simulations, which branched off from a lower-resolution (31 km) SSP585 transient scenario run with relatively high climate sensitivity. We will quantify the effect of atmosphere resolution and cloud granularity on cloud radiative feedbacks. We will further present results from the calculation of radiative kernels to determine the role of high cloud feedbacks in polar amplification. 

How to cite: Moon, J.-Y., Lee, S.-S., Timmermann, A., Streffing, J., Semmler, T., and Jung, T.: Cloud-feedbacks in global km-scale earth system model simulations, EGU General Assembly 2024, Vienna, Austria, 14–19 Apr 2024, EGU24-8603, https://doi.org/10.5194/egusphere-egu24-8603, 2024.

EGU24-9221 | ECS | Orals | CL4.5

Autocorrelation – A Simple Diagnostic for Tropical Precipitation in Global Kilometer-Scale Climate Models 

Dorian Spät, Aiko Voigt, Michela Biasutti, and David Schuhbauer

Tropical precipitation is the result of a complex interplay of processes across a wide range of atmospheric scales and is highly variable from place to place. A particularly interesting geographical pattern is obtained for the lag 1 autocorrelation of daily precipitation. Generally, this metric displays a relatively uniform distribution of positive values throughout the tropics. However, certain land regions, such as the Sahel, stand out due to exceptionally low autocorrelation values. These low values correspond to a dominance of high frequency precipitation events in the power spectrum.

In accordance with previous work, we show that CMIP6 climate models struggle to create a similar autocorrelation pattern. Global kilometer-scale models circumvent many of the shortcomings of the conventional coarse models, by resolving deep convection. We find that the two global kilometer-scale models developed as part of the nextGEMS project produce an autocorrelation pattern that is quite similar to the observations. These models also provide an opportunity to study the processes associated with the autocorrelation pattern.

We compare simulations with deep convection parameterization turned on and off to investigate how the parameterization scheme affects the autocorrelation pattern and the underlying power spectrum. Additionally, we perform a precipitation variance analysis based on filtering of convectively coupled equatorial waves to study the genesis of the autocorrelation pattern.

How to cite: Spät, D., Voigt, A., Biasutti, M., and Schuhbauer, D.: Autocorrelation – A Simple Diagnostic for Tropical Precipitation in Global Kilometer-Scale Climate Models, EGU General Assembly 2024, Vienna, Austria, 14–19 Apr 2024, EGU24-9221, https://doi.org/10.5194/egusphere-egu24-9221, 2024.

EGU24-10275 | ECS | Posters on site | CL4.5

Precipitation impacting upper-ocean currents: an analysis using a km-scale Earth System model 

Hans Segura, Angel Peinado, Swantje Bastin, Marius Winkler, Rodomyra Schevchenko, Ian Dragaud, and Divya Patruri

In this study, we assess the impact of precipitation on the ocean current acceleration using an Earth System model resolving deep convection and ocean eddies using a horizontal grid spacing of 5 km. Punctual studies using observations show that precipitation events with intensities higher than 24 mm d^-1 could impact the upper-ocean dynamics. Basically, the increase in buoyance flux equals half buoyancy resulting in the absorption of shortwave radiation (200 W m-2) under clear sky conditions. Due to the spatial sparse of observational sites, there is still the question of whether this number holds only in specific locations. With a grid spacing of 5 km, the simulation shows that precipitation events in the tropical Atlantic with a mean intensity greater than 20 mm d-1 impact tremendously in the stratification due to salinity in the upper ocean with two consequences. First, the mixed layer depth shallows, even in cases with strong wind forcing. Second, the momentum trapped in this shallow layer accelerates the surface currents. This is also accompanied by an increase in the turbulent kinetic energy in the mixed layer depth. These results point to the fact that precipitation, in particular in the deep tropics, could impact the upper ocean dynamic.

How to cite: Segura, H., Peinado, A., Bastin, S., Winkler, M., Schevchenko, R., Dragaud, I., and Patruri, D.: Precipitation impacting upper-ocean currents: an analysis using a km-scale Earth System model, EGU General Assembly 2024, Vienna, Austria, 14–19 Apr 2024, EGU24-10275, https://doi.org/10.5194/egusphere-egu24-10275, 2024.

EGU24-10935 | ECS | Orals | CL4.5

AQUA: a novel quality assessment tool for km-scale simulations in the Destination Earth Climate Digital Twin - the core framework 

Matteo Nurisso, Jost von Hardenberg, Silvia Caprioli, Supriyo Ghosh, Nikolay Koldunov, Bruno P. Kinoshita, Natalia Nazarova, Paolo Ghinassi, and Paolo Davini

Destination Earth (DestinE) is a major initiative by the European Commission aiming to create a highly accurate global digital twin of Earth. The Climate Adaptation Digital Twin in DestinE is an ambitious project of several different climate simulations at the km-scale producing a large amount of heavy dataset, difficult to access and analyse with standard data processing  pipelines. Each project and each model produces data that may differ in format (NetCDF, GRIB, Zarr), structure and metadata, leading to the necessity of tweaks and complex pipelines in order to prepare data for analysis.

We thus introduce AQUA, an Application for Quality assessment and Uncertainty quAntification. AQUA is composed of a core engine facilitating data access, combined with a series of modular and independent diagnostics to be run continuously to monitor and evaluate climate simulations. In this contribution we present the core engine and its features. 

Though many available suites already exist to analyse data from global climate models, AQUA has been specifically developed to deal with large km-scale datasets, with the goal of unifying and simplifying climate data access for all users. AQUA responds to the need for users to have the focus on the development of their data analysis, while datasets are found, retrieved and homogenised by an external tool to which they can connect their pipeline. 

Developed in Python, leveraging the power of Dask and Xarray libraries, AQUA prioritises efficiency through lazy data access. Noteworthy is the utilisation of cdo for one-time weight computation, enhancing performances in regridding and averaging operations. A key strength lies in its ability to handle high-resolution, high-frequency data, loading into memory only when necessary. AQUA not only unifies and simplifies climate data access for users but also addresses the crucial need for responsive feedback to climate model developers.

How to cite: Nurisso, M., von Hardenberg, J., Caprioli, S., Ghosh, S., Koldunov, N., P. Kinoshita, B., Nazarova, N., Ghinassi, P., and Davini, P.: AQUA: a novel quality assessment tool for km-scale simulations in the Destination Earth Climate Digital Twin - the core framework, EGU General Assembly 2024, Vienna, Austria, 14–19 Apr 2024, EGU24-10935, https://doi.org/10.5194/egusphere-egu24-10935, 2024.

EGU24-11230 | ECS | Orals | CL4.5

AQUA: a novel quality assessment tool for km-scale simulations in the Destination Earth Climate Digital Twin - the diagnostics suite 

Silvia Caprioli, Jost von Hardenberg, Paolo Ghinassi, Supriyo Ghosh, Lukas Kluft, Nikolay Koldunov, François Massonnet, Natalia Nazarova, Matteo Nurisso, Pablo Ortega, Susan Sayed, Tanvi Sharma, and Paolo Davini

Destination Earth (DestinE) is a major initiative by the European Commission aiming to create a highly accurate global digital twin of Earth. This model, supported by advanced high-performance computing and artificial intelligence, will monitor and simulate interactions between natural phenomena and human activities with unprecedented accuracy. Developed within the Climate Adaptation Digital Twin of the Destination Earth project, AQUA (Application for Quality assessment and Uncertainty quAntification) is a specialized model evaluation framework for running climate data diagnostics.

While existing diagnostic suites for global climate model data are already available, AQUA stands out by specifically addressing extensive kilometer-scale datasets, to simplify climate data access for all possible users. AQUA features two diagnostic families:

  • "state-of-the-art” diagnostics, which compare low-resolution data with observations to assess general model performance and to identify biases and drifts (performance indices, radiation budget, atmospheric global mean time series and biases, teleconnection indices, ocean circulation evaluation, tropical cyclones detection, tracking and zoom-in)
  • “frontier” diagnostics, which exploit new high-resolution (i.e., km-scale hourly) climate data to provide insight at climatological scales of physical/dynamical processes that could not be investigated before (sea surface height variability, tropical rainfall) 

Beyond offering a flexible and efficient framework for processing and analyzing large volumes of climate data, AQUA’s modular design offers the possibility of seamless integration of new diagnostic tools, with plans for further expansion in the future phases of the project.
In this contribution, we will introduce the current suite of AQUA diagnostics and outline its planned future developments.

How to cite: Caprioli, S., von Hardenberg, J., Ghinassi, P., Ghosh, S., Kluft, L., Koldunov, N., Massonnet, F., Nazarova, N., Nurisso, M., Ortega, P., Sayed, S., Sharma, T., and Davini, P.: AQUA: a novel quality assessment tool for km-scale simulations in the Destination Earth Climate Digital Twin - the diagnostics suite, EGU General Assembly 2024, Vienna, Austria, 14–19 Apr 2024, EGU24-11230, https://doi.org/10.5194/egusphere-egu24-11230, 2024.

EGU24-11656 | ECS | Posters on site | CL4.5

Climate storylines using the spectral nudged simulations with IFS-FESOM 

Amal John, Sebastian Beyer, Marylou Athanase, Antonio Sánchez Benítez, Helge Goessling, and Thomas Jung

We are presenting our efforts to incorporate spectral nudging capabilities into the development and assessment of model-driven storyline scenarios using a km-scale coupled climate model. Working within the framework of the EU’s Destination Earth project, we are working towards this objective by employing the ocean sea-ice model FESOM coupled with the atmospheric model IFS.

We showcase our preliminary results from the nudged runs of IFS-FESOM for the present day which will eventually lead the way into the storyline scenarios where the same winds would be imposed in different climates. We also show a glimpse of how the nudged simulations for the present-day climate serve to assess model quality against observations based on relatively short simulations, incorporating field campaign data like MOSAiC. In the future, these capabilities could be used to produce “storylines” that help to address the question of how recent extreme events would unfold in preindustrial, +1.5K, +2K, +3K and +4K climates.

Ultimately, our novel storyline scenarios have the potential to illustrate the impact of climate change on extreme events in a way that is more tangible and relatable and nicely complements the probabilistic approach. Since they are based on recent extreme events and explore probable variations in diverse plausible climates, these storylines establish a more profound connection to users' experiences. When these scenarios are presented to users it can foster discussions on future activities and necessary adaptation measures.

How to cite: John, A., Beyer, S., Athanase, M., Sánchez Benítez, A., Goessling, H., and Jung, T.: Climate storylines using the spectral nudged simulations with IFS-FESOM, EGU General Assembly 2024, Vienna, Austria, 14–19 Apr 2024, EGU24-11656, https://doi.org/10.5194/egusphere-egu24-11656, 2024.

The amplitude of precipitation extremes across Europe is expected to increase through the 21st century under most climate change scenarios. Current CMIP-style global climate models broadly project increased flooding and drought extremes; however, they often rely on parametrization schemes or downscaling methods for inferring about potential future extreme events. These methods often introduce errors leading to high levels of uncertainty for policymakers and infrastructure planning. The need for accurate extreme event projections became further evident after the July 2021 floods and summer 2022 record-breaking heatwaves and droughts across Western Europe.

The ongoing H2020 Next Generation Earth Modelling Systems (nextGEMS) project aims to address these issues with the development of storm-resolving, fully-coupled, Earth-system models. Using the latest Cycle 3 runs from the Integrated Forecast System from ECMWF and ICON from MPI-M, we examine the dynamical representation of extreme precipitation events across Europe and compare it against a suite of observations (station and satellite based), reanalysis datasets, and CESM2 simulations. Focusing on tail-end extremes, the results focus on the realism of high precipitation extremes, value of upscaling to CMIP6 resolution, representation of precipitation drivers, and dry extremes (dry day percentages and consecutive dry days). Overall, both ICON and IFS perform reasonably well in representing high precipitation extremes although issues related to the ICON non-parameterized, deep convection causes overly frequent precipitation events.

How to cite: Wille, J. and Fischer, E.: Representation of extreme precipitation events in storm-resolving global climate models within the nextGEMS project, EGU General Assembly 2024, Vienna, Austria, 14–19 Apr 2024, EGU24-11797, https://doi.org/10.5194/egusphere-egu24-11797, 2024.

EGU24-12427 | ECS | Posters on site | CL4.5

Km-scale climate simulations with IFS-FESOM 

Sebastian Beyer, Dmitry Sidorenko, Rohit Ghosh, Amal John, Thomas Rackow, Jan Streffing, Suvarchal Kumar Cheedela, Bimochan Niraula, Nikolay Koldunov, and Thomas Jung

Within the EU’s Destination Earth (DestinE) initiative we are developing a digital climate twin with km-scale resolution. This enables us to resolve physical processes that, so far, have only been represented by approximations. This core model setup (called digital twin engine)  is able to run multidecadal simulations for historic periods as well as different future scenarios in unprecedented resolution which will be used by decision makers.

In phase one of DestinE, our goal is to run a control simulation (under 1950 pre industrial conditions), a historic simulation from 1990 to 2020 and finally, projection simulations from 2020 to 2040. The control run will be performed with a global atmospheric resolution of 9km, while the projection simulations use 4km. The ocean component uses the unstructured NG5 mesh, which means an approximate resolution of 5km.

In this work we present the latest iteration of the IFS-FESOM model, the Integrated Forecasting System coupled to the Finite volumE Sea Ice-Ocean Model FESOM2. We explain its components and recent improvements, including  the integration of ECMWF’s IO-server and post processing toolkit multio into the FESOM2 component and the introduction of a novel runoff mapper. Preliminary results from our kilometre-scale simulations are shown and compared to preindustrial conditions, with the primary objective to quantify effects of a ~1K warming world.

How to cite: Beyer, S., Sidorenko, D., Ghosh, R., John, A., Rackow, T., Streffing, J., Cheedela, S. K., Niraula, B., Koldunov, N., and Jung, T.: Km-scale climate simulations with IFS-FESOM, EGU General Assembly 2024, Vienna, Austria, 14–19 Apr 2024, EGU24-12427, https://doi.org/10.5194/egusphere-egu24-12427, 2024.

Global nonhydrostatic models that cover the globe with a kilometer (km)-scale mesh have been developed by various organizations worldwide and are expected to be next-generation models that can explicitly calculate deep convective clouds. However, it is known that convective upward motions are not sufficiently represented at the km-scale resolution, and the mesh size of O(100m) is required to obtain convergence of upward motions. To understand the limitation of global km-scale models, we investigate the representation of cloud, precipitation, and circulation with the resolution in the global simulations between km-scale to sub-km-scales.

We conduct the global atmospheric simulations by the Nonhydrostatic Icosahedral Atmospheric Model (NICAM) for the mesh size of 3.5 km, 1.7 km, 870 m, 440 m, and 220 m using the Supercomputer "Fugaku."  The 3.5 km experiment started on August 1, 2016, the same day as DYAMOND-summer, and the next higher resolution was run using the lower resolution simulation results as initial conditions. We analyzed data on August 5, 2016. We conducted the global 220m simulation for 8 hours.

The resolution dependence of cloud, precipitation, and convection was investigated. Lower clouds decrease with increasing resolution. High cloud increased or decreased with respect to resolution depending on the turbulence scheme. The precipitation distribution and zonal mean humidity do not change significantly, but the precipitation intensity changes with resolution. For the grid spacing of less than km, it eliminates overconcentration of precipitation, and the rain area widens as the resolution becomes finer. The coarse-grained rainfall distribution is smoother in the sub-km scale model than in the km scale model. A finer scale convection core is reproduced in the sub-km scale model. Vertical wind speed at grid point scales increases with increasing resolution. However, when horizontally averaged over a few-degree grid, the vertical wind speed decreases, and the circulation becomes weaker with higher resolution. We found that the km-scale model may be creating large strong convection. Uncertainties resulting from the turbulence scheme also appear to be large in the km/sub-km models.

How to cite: Matsugishi, S., Ohno, T., and Satoh, M.: Differences in the cloud, precipitation, and convection representation between the global sub-km mesh simulation and km simulations, EGU General Assembly 2024, Vienna, Austria, 14–19 Apr 2024, EGU24-14676, https://doi.org/10.5194/egusphere-egu24-14676, 2024.

EGU24-15657 | ECS | Orals | CL4.5

Towards a global km-scale flood forecasting system 

Jasper Denissen, Gabriele Arduini, Ervin Zsoter, Cinzia Mazzetti, Christel Prudhomme, Shaun Harrigan, Gianpaolo Balsamo, Iria Ayan-Miguez, Peter Dueben, Irina Sandu, and Benoit Vanniere

River discharge has direct influence on the water-food-energy-environment nexus and can have devastating impacts during extreme events with rapid onsets such as floods. Floods often occur after extreme precipitation events, which are challenging to forecast accurately, both in time and space. Unresolved small-scale processes and features, including convection and orography, have a detrimental effect on precipitation and consequently hydrological forecast skill. This calls for a spatial resolution increase in Numerical Weather Prediction (NWP) models, including their land component.

The Destination Earth programme of the European Commission addresses this with globally coupled forecasts at spatial resolutions down to the km-scale with lead times of 5 days: the Digital Twin on Weather-Induced Extremes (EDT). These meteorological forecasts are used to force ECMWF’s Land Surface Modelling System (ECLand), the land component of the Integrated Forecasting System (IFS), to generate runoff. Subsequently, the river-routing scheme CaMa-Flood, effectively 1-way coupled to the IFS, is used to route runoff in rivers and to produce hydrological simulations. Essentially, CaMa-Flood will be part of the continuous component of the EDT, which in phase 2 of Destination Earth will provide daily high-resolution forecasts to monitor extreme events, such as floods, in real time. As river discharge acts as a natural integrator of the water cycle, CaMa-Flood can be used as a diagnostic tool to assess the hydrological response to increases in spatial resolution of the forcing and the river-routing network.

In this study, two data products are derived: i) long-term hydrological simulations forced by atmospheric analysis data (e.g. ERA5 or ECMWF operational analysis) and ii) hydrological forecasts (daily forecasts in June - July 2021 and January - February 2022 as well as selected flood cases). To assess their quality, these data are validated with point-observed river-discharge time series. Analysis shows that the long-term hydrological simulations benefit from spatial resolution increases in the meteorological forcing and to a lesser extent from spatial resolution increases in the river-routing network. This is evidenced by higher Kling-Gupta Efficiency (KGE), higher correlations and lower biases across 876 river stations in Europe. Further, hydrological forecasts also benefit from higher spatial resolution meteorological forcing, evidenced both by higher correlations of the continuous summer/winter forecasts against river discharge observations from 798 river stations across Europe and by more pronounced flood peak magnitude for selected flood cases. These results highlight the added value of high resolution for hydrological forecast accuracy.

How to cite: Denissen, J., Arduini, G., Zsoter, E., Mazzetti, C., Prudhomme, C., Harrigan, S., Balsamo, G., Ayan-Miguez, I., Dueben, P., Sandu, I., and Vanniere, B.: Towards a global km-scale flood forecasting system, EGU General Assembly 2024, Vienna, Austria, 14–19 Apr 2024, EGU24-15657, https://doi.org/10.5194/egusphere-egu24-15657, 2024.

Cloud microphysics are a prime example of processes that remain unresolved in atmospheric modelling with storm-resolving resolution. In this study, we explore how uncertainties in the representation of microphysical processes affect the tropical energy budget in a global storm-resolving model (SRM). We use the global SRM ICON with a one-moment or a two-moment microphysics schemes and do several sensitivity runs, where we vary one parameter of the applied microphysics scheme in its range of uncertainty. We find that the two microphysics schemes have distinct signatures, e.g., in how condensate is distributed among the different hydrometeor categories or in the intensity distribution of precipitation, but their tropical mean cloud fraction and total condensate profiles are rather robust. Precipitation efficiency sets the amount of condensate in the atmosphere and thereby links microphysical processes to the radiative properties of the atmosphere. Uncertainties in the representation of microphysical processes cause substantial spread in the top-of-the-atmosphere (TOA) energy balance. In agreement with the robustness of the cloud fraction, changes in the radiative balance at TOA are dominated by changes in the radiative properties of cloudy points. A shift towards higher cloud-ice concentrations in simulations with the two-moment microphysics scheme leads to more reflected shortwave radiation that is not fully compensated by less outgoing longwave radiation and results in a slight cooling of the atmospheric column. Overall, microphysical sensitivities at storm-resolving resolution are substantial and resemble part of the inter-model spread of a multi-model ensemble.

How to cite: Naumann, A. K., Esch, M., and Stevens, B.: How the representation of microphysical processes affects the tropical energy budget in a global storm-resolving model, EGU General Assembly 2024, Vienna, Austria, 14–19 Apr 2024, EGU24-16801, https://doi.org/10.5194/egusphere-egu24-16801, 2024.

EGU24-17906 | ECS | Orals | CL4.5

Multifractal analysis for evaluating the representation of clouds in global km-scale models 

Lilli Freischem, Philipp Weiss, Hannah Christensen, and Philip Stier

Clouds are one of the largest sources of uncertainty in climate predictions. Emerging next-generation km-scale climate models need to simulate clouds and precipitation accurately to reliably predict future climates. To isolate issues in their representation of clouds, and thereby facilitate their improvement, km-scale models need to be thoroughly evaluated via comparisons with observations.

Traditionally, climate models are evaluated using spatio-temporally averaged observations. However, aggregated evaluation loses crucial information about underlying physical processes, such as convective updrafts, and the resulting cloud macrophysical structures. We postulate that a novel spatio-temporal evaluation strategy using satellite observations provides direct constraints on physical processes.

Here, we introduce multifractal analysis as a method for evaluating km-scale simulations. We apply it to top-of-atmosphere outgoing longwave radiation (OLR) fields to investigate structural differences between observed and simulated clouds in the tropics. For this purpose, we compute structure functions from OLR fields to which we fit scaling exponents. We then parameterise the scaling exponents to compute scaling parameters. The parameters compactly characterise OLR variability and can be compared across simulations and observations. We use this method to evaluate the ICON-Sapphire and IFS-FESOM simulations run for cycle 3 of the nextGEMS project via comparison with data from the geostationary satellite GOES-16.

We find that clouds in both models exhibit multifractal scaling from 50 to 1000km. However, the scaling parameters are significantly different between ICON and IFS, and neither match observations. In the ICON model, multifractal scaling exponents are lower than in observations whereas in IFS, they are larger. The observed differences indicate how the modelling approaches in ICON and IFS impact the organisation of clouds. More specifically, the deep convection scheme in ICON is switched off completely whereas it is still active in IFS, which could explain the difference in scaling behaviour we observed.

Our results show that spatio-temporal analysis is a promising new way to constrain global km-scale models. It can provide key insights into model performance and shed light on issues in the representation of clouds.

How to cite: Freischem, L., Weiss, P., Christensen, H., and Stier, P.: Multifractal analysis for evaluating the representation of clouds in global km-scale models, EGU General Assembly 2024, Vienna, Austria, 14–19 Apr 2024, EGU24-17906, https://doi.org/10.5194/egusphere-egu24-17906, 2024.

In recent years, great efforts have been made to reduce the horizontal grid spacing of atmospheric models to a few kilometers to build so-called Global Storm-Resolving Models (GSRMs). However, the vertical grid spacings used in these models are generally of the same order of magnitude as those used in classical climate models with horizontal grid spacings of a few hundred kilometers. From previous sensitivity experiments with a variety of model types, from direct numerical simulations to these classical climate models, it is known that especially the simulation of clouds can strongly depend on the vertical model resolution. To test the importance of the vertical grid spacing in GSRMs we have performed simulations with the ICON atmospheric model at 5 km horizontal grid spacing and with between 55 and 540 vertical layers, corresponding to maximum tropospheric vertical grid spacings between 800 and 50 m.  

Here we present results of these simulations. They results show that for most of the variables considered, halving the vertical grid spacing by half has a less pronounced impact than halving the horizontal grid spacing, but the effect is not negligible. For example, for each halving of the vertical grid spacing, coupled with necessary reductions in the time step length, cloud liquid water increases globally by approximately 7%, while it decreases by roughly 16% when halving the horizontal grid spacing. Both the grid spacing and the time step contribute to these effects. Comparison of selected climate variables with observations shows that model biases are only in some cases reduced by higher vertical resolution, because of the dominance of model biases with other origins.

How to cite: Schmidt, H.: Exploring the impact of the vertical grid spacing for the climate simulated in a global storm-resolving model, EGU General Assembly 2024, Vienna, Austria, 14–19 Apr 2024, EGU24-18060, https://doi.org/10.5194/egusphere-egu24-18060, 2024.

EGU24-18483 | Posters on site | CL4.5

Eulerian and Lagrangian Perspectives on Mesoscale Air-Sea Interactions 

Dian Putrasahan and Jin-Song von Storch
Mesoscale ocean eddies can be likened to weather events of the sea, influencing a multitude of coupled air-sea processes that help in regulating heat and carbon uptake and consequently the climate. With the advancements in high-performance computing, we can now employ multi-decadal kilometre-scale coupled global climate models (GCMs) that effectively captures the intricacies of mesoscale ocean-atmosphere interactions and shed light on their implications at larger scales. While low resolution CMIP-type GCMs show a dominance of atmospheric-forced coupled variability, e.g. faster winds over ocean surface can enhance turbulent heat flux and thus cool sea surface temperatures (SSTs), satellite observations and eddy-resolving coupled models show a prevalence of mesoscale ocean-forced coupled variability over eddy-rich regions like SST front areas. Two ocean mesoscale dynamical processes can promote such ocean-forced coupled variability, namely through thermal feedback and current feedback. Consider the thermal feedback as an example; the destabilisation of the atmosphere above warm mesoscale anomalies amplifies the downward transfer of momentum from higher-altitude winds to the surface, known as the vertical or downward mixing mechanism. This, in turn, leads to enhanced surface winds and increased turbulent heat flux over warm SST anomalies. We employ a coupled 5km-ocean 10km-atmosphere ICON model to assess the global distribution of mesoscale air-sea coupling associated with these feedbacks and their implications on wind work and eddy-induced Ekman upwelling. Additionally, we show examples of such mesoscale coupling from a Lagrangian perspective through composites of tracked eddies, their impact on ocean upwelling/downwelling and their imprint on the overlying atmosphere beyond the surface like precipitation.

How to cite: Putrasahan, D. and von Storch, J.-S.: Eulerian and Lagrangian Perspectives on Mesoscale Air-Sea Interactions, EGU General Assembly 2024, Vienna, Austria, 14–19 Apr 2024, EGU24-18483, https://doi.org/10.5194/egusphere-egu24-18483, 2024.

EGU24-18761 | Posters on site | CL4.5

Modelling of the Hunga Tonga eruption for testing the GPU port of ICON 

Luis Kornblueh and the Port ICON to Lumi

Porting weather and climate models such as ICON to GPU-based computer production systems requires serious testing of the code adapted to the
additional hardware and its software stack. The high resolution of storm resolving models poses problems for porting ICON and very short simulations facilitate this task.

The 2022 eruption of the Hunga Tonga–Hunga Haʻapai submarine volcano had a very strong water vapour signal, which is modelled by adjusting the model initial conditions to include a cylindrical water vapour plume: a very simple setup to implement, but one that reflects the strong signal in the model results. This plume is visible in the model for years. For the test case we focus on the first time steps. These support the detection of technical errors in the porting of the model code in very short simulations at the final model resolution of 5 km.

We present the scientific use case, the model configuration and some results from test simulations on Lumi.

How to cite: Kornblueh, L. and the Port ICON to Lumi: Modelling of the Hunga Tonga eruption for testing the GPU port of ICON, EGU General Assembly 2024, Vienna, Austria, 14–19 Apr 2024, EGU24-18761, https://doi.org/10.5194/egusphere-egu24-18761, 2024.

EGU24-18964 | ECS | Posters on site | CL4.5

On the detection and tracking of mesoscale ocean eddies: Parameter sensitivity 

Stella Bērziņa, Nicolas Gruber, and Matthias Münnich

The characteristics of coherent mesoscale eddies are an important point of evaluation for high-resolution ocean and coupled climate models. Mesoscale eddies are rotating features in the ocean on horizontal scales from 10 to 100 km that transport physical, chemical and biological properties of the ocean water. There are many possible ways to identify and track eddies (sea surface height anomalies, sea surface temperature anomalies, vorticity, etc.) and even within one method parameters can be adjusted to lead to different eddy identification results, for example, the allowed shape error of eddies.  

Here we explore systematically the sensitivity of the identification and tracking results to choices made with regard to data, allowed eddy size and shape error and the use of different high-pass filters. Additionally, eddy identification and tracking are done on a regular latitude-longitude grid rather than the native model grid, therefore, the impact of the chosen grid size is assessed.

To this end, we use “py-eddy-tracker” (Mason et al. 2014) a commonly used open-source geometry-based approach. The algorithm uses sea level anomaly data and several adjustable parameters to identify eddies. It then joins the identified eddies to form tracks by using the ellipsoid method described in Chelton et al. 2011, where the two closest lying eddies in subsequent time steps are connected if they occur within a restricted search region.

We apply this identification and tracking algorithm to high frequency output from different high-resolution coupled climate models run as part of the EERIE project and compare the results of eddy characteristics to observations. This study will help to make more informed and study-specific choices when setting threshold values in eddy identification algorithms for model assessment or creating eddy observational data set from satellite altimetry data.

How to cite: Bērziņa, S., Gruber, N., and Münnich, M.: On the detection and tracking of mesoscale ocean eddies: Parameter sensitivity, EGU General Assembly 2024, Vienna, Austria, 14–19 Apr 2024, EGU24-18964, https://doi.org/10.5194/egusphere-egu24-18964, 2024.

EGU24-19072 | ECS | Orals | CL4.5

Surface irradiance variability over land in storm-resolving models. 

Menno Veerman and Chiel van Heerwaarden

With increasing horizontal resolution in global models, we may expect an increasingly more realistic representation of cloud development over land as both large-scale circulations and local surface heterogeneities, such as orography and land use type, are better resolved. As clouds are a dominant contributor to inter- and intra-diurnal variations in both solar and thermal surface irradiance, the spatiotemporal irradiance variability should then be better represented than in conventional climate models. Here, we use the 5-year coupled atmosphere-ocean global simulations performed in Cycle 3 of the nextGEMS project to evaluate the surface irradiance variability over land. These 5-year simulations were performed at different resolution, from 4.4 to 28 km, and with two different global models, the Integrated Forecasting System (IFS) and the Icosahedral Nonhydrostatic model (ICON), allowing us to separate the impacts of horizontal resolution and of implementation choices concerning model physics. We select a couple of representative locations with varying climate and land surface characteristics where high-quality irradiance observations from the Baseline Surface Radiation Network (BSRN) are available. While first results show some benefits of increased horizontal resolution, higher resolutions simulations do not consistently produce more accurate surface irradiances than simulations at lower resolution. Furthermore, differences between the IFS and ICON models are often larger than differences between the IFS simulations at varying resolutions. These results suggest that if realistic surface irradiance predictions are concerned, e.g. for solar energy applications, the road to model improvement by increasing horizontal resolution is not straightforward. 

How to cite: Veerman, M. and van Heerwaarden, C.: Surface irradiance variability over land in storm-resolving models., EGU General Assembly 2024, Vienna, Austria, 14–19 Apr 2024, EGU24-19072, https://doi.org/10.5194/egusphere-egu24-19072, 2024.

EGU24-19735 | ECS | Posters on site | CL4.5

Network of extremes in ocean eddy-resolving climate models 

Emma Ferri, Nicolas Gruber, Matthias Münnich, and Dian Putrasahan

Marine extreme events, such as marine heatwaves, have a disproportional impact on marine organisms and ecosystems, shaping many of their characteristics. Even though such extremes have become the focus of much research in the last few years, our understanding of the processes that give rise to extreme conditions is still relatively poor. Mesoscale processes have been shown to structure and shape extremes, but also not much is known about their role. Here we use graph theory to detect the correlation between extreme marine events and distant occurrences of atmospheric extremes in the context of mesoscale variability. The data stem from a set of mesoscale resolution model simulation results obtained from the European Eddy RIch Earth System Models (EERIE) project. Common statistical tests such as the Pearson correlation coefficient and the Granger causality will be used to build the graph object. This will permit us to build a network of different oceanographic and atmospheric variables in an attempt to detect teleconnections, such as, for example, the impact of El Niño, on the onset, persistence, and demise of extremes. Our initial networks correlate various variables, such as precipitation and sea surface temperature (SST), eddy kinetic energy and SST, and global SST variations.

How to cite: Ferri, E., Gruber, N., Münnich, M., and Putrasahan, D.: Network of extremes in ocean eddy-resolving climate models, EGU General Assembly 2024, Vienna, Austria, 14–19 Apr 2024, EGU24-19735, https://doi.org/10.5194/egusphere-egu24-19735, 2024.

EGU24-21956 | ECS | Posters on site | CL4.5

Storm Tracks and Jet Streams in ICON: Unravelling Climate Change Responses through Aquaplanet Horizontal Grid Spacing Sensitivity Experiments 

Angel Peinado Bravo, Tiffany Shaw, Daniel Klocke, and Bjorn Stevens

General Circulation Models (GCMs) are widely used to understand our climate and to simulate and predict the effects of global warming, revealing the dynamical convergence of storm tracks and jet streams at horizontal grid spacing of 50 km (e.g., Lu et al. 2015). Nevertheless, they have shown persistent biases in the large-scale features of the general circulation and basic climate statistics, which are attributed mainly to the parameterization, specifically, convection parameterization. To address this, Global storm-resolving models (GSRMs) provide an alternative approach to parameterization by explicitly resolving convection and its interaction with other processes,  through the refinement of the horizontal grid, thus, offering new insights into the climate system. In a prior study, we showed the physical convergence of the tropical and general circulation structure at horizontal grid spacing of 2.5 km using aquaplanets. However, questions linger: Does the response under climate change of the storm tracks and jet streams converge at similar horizontal grid spacing, and what mechanism controls this convergence?


We will present the effect of increasing horizontal grid spacing on the convergence of the storm tracks and jet stream location and intensity using the global storm-resolving model ICON. Control runs and idealised climate change experiments (increasing sea-surface temperature by 4 Kelvin) were conducted at horizontal grid spacing from 160 km to 2.5 km using an aqua-planet configuration. We adopt an aqua-planet configuration to focus on atmospheric phenomena, specifically convection and cloud feedback, meanwhile reducing the effect of complex interaction with land, topography, sea ice, and seasons. We will discuss the convergence rate of the eddy driven jet, subtropical jet, storm track, and large-scale circulation and their response to climate warming, characterised by the location, width, and intensity. 

How to cite: Peinado Bravo, A., Shaw, T., Klocke, D., and Stevens, B.: Storm Tracks and Jet Streams in ICON: Unravelling Climate Change Responses through Aquaplanet Horizontal Grid Spacing Sensitivity Experiments, EGU General Assembly 2024, Vienna, Austria, 14–19 Apr 2024, EGU24-21956, https://doi.org/10.5194/egusphere-egu24-21956, 2024.

EGU24-150 | ECS | Posters virtual | AS5.5

Machine Learning Forecasting of Extreme Winds: A Study on the Mediterranean West Coast in the Valencian Community 

Gustavo Hazel Guerrero-Navarro, Javier Martínez-Amaya, and Veronica Nieves

The occurrence of extreme wind events poses a significant threat to human populations, putting lives at risk and causing substantial damage to vital infrastructures. Coastal regions, in particular, face heightened vulnerability due to the unpredictable nature of the land-sea interface, presenting a formidable   challenge for accurate modeling. Thus, there is an urgent need for robust and efficient predictive techniques to anticipate and manage the impact of these severe wind phenomena. In response to this imperative, our study explores the application of an innovative machine learning forecasting methodology tailored for extreme winds, specifically focusing on the Mediterranean west coast in the Valencian community. Our approach involves analysis of historical meteorological station data from the Spanish meteorological agency. This data, combined with an extensive set of reanalysis data spanning from 1961 to 2019, is utilized for the identification and classification of extreme wind events. Employing a train-test procedure, we implemented a Random Forest binary classification model, enabling successful forecasting of extreme wind episodes up to 48h in advance. Notably, the precision of our model exhibited a remarkable range between 73% and 92%, varying with the lead-time across the considered regions. This methodology not only enhances forecasting capabilities but also provides insights into the intricate dependencies of meteorological variables, thereby advancing our understanding of complex atmospheric processes. This pioneering study, driven by artificial intelligence, contributes to the ongoing exploration of the complex dynamics of winds in coastal regions. The insights gained from our research extend beyond the Mediterranean west coast and have the potential for broader applicability  in other coastal areas. The results underscore the pivotal role of adaptive strategies in mitigating the impact of extreme weather events, emphasizing the importance of proactive measures in the face of escalating climate-related challenges.

How to cite: Guerrero-Navarro, G. H., Martínez-Amaya, J., and Nieves, V.: Machine Learning Forecasting of Extreme Winds: A Study on the Mediterranean West Coast in the Valencian Community, EGU General Assembly 2024, Vienna, Austria, 14–19 Apr 2024, EGU24-150, https://doi.org/10.5194/egusphere-egu24-150, 2024.

Volatile organic compounds (VOCs) play a crucial role in atmospheric chemistry, influencing global climate and posing potential health risks to humans. Accurate spatiotemporal estimation of VOCs is vital for establishing advanced early warning systems and controlling air pollution. However, research on high-resolution spatiotemporal prediction of VOCs concentrations using machine learning is still limited. This study conducted an extensive VOCs observational campaign in Shanghai, improving upon the LightGBM model with the integration of spatiotemporal information, satellite data, meteorological data, emission inventories, and geographical data for VOCs estimation. We achieved a high-precision distribution map of VOCs concentrations in Shanghai (1 km, 1 hour resolution), demonstrating the model’s excellent hourly VOCs estimation performance (R^2 = 0.92). Further analysis with SHapley Additive exPlanations (SHAP) regression revealed the significant contributions of each input feature to VOCs estimation. Compared to many traditional machine learning models, this approach offers lower computational demands in terms of speed and memory. Moreover, the model maintained good hourly spatiotemporal VOCs prediction performance during the COVID-19 lockdown. This research analyzed the spatiotemporal variations of VOCs concentrations in Shanghai, providing a scientific basis for future control of VOCs levels in the city and offering algorithmic support for comprehensive VOCs prediction in other regions.

How to cite: Lu, B. and Li, X.: High-resolution mapping of  VOCs using the fast space-time Light Gradient Boosting Machine (LightGBM), EGU General Assembly 2024, Vienna, Austria, 14–19 Apr 2024, EGU24-331, https://doi.org/10.5194/egusphere-egu24-331, 2024.

EGU24-1754 | Orals | AS5.5

Multitask Learning for Tornado Identification Using Doppler Radar Data 

Jinyang Xie, Kanghui Zhou, Lei Han, Liang Guan, Maoyu Wang, Yongguang Zheng, Hongjin Chen, and Jiaqi Mao

Tornadoes, as highly destructive small-scale weather events, demand accurate detection and identification for effective weather decision-making. While weather radar serves as a primary tool for tornado identification, traditional radar-based tornado identification algorithms, such as Tornado detect algorithm (TDA) and Tornado Vortex Signature algorithm (TVS), are susceptible to radar noise, with limited tornado feature extraction capability leading to high rates of false alarms and low probability of detection. In response to these challenges, this study introduces an innovative multi-task learning network based on spatial-temporal information (TS-MINet) to improve tornado identification. Leveraging continuous three-frame radar Level-II data as inputs, including reflectivity, radial velocity, and spectral width, TS-MINet adopts a multi-task learning structure, simultaneously performing tornado detection and number estimation tasks to comprehensively extract tornado-related information. TS-MINet integrates channel recalibration blocks, spatial construction module, and temporal construction module, constructing a robust tornado identification model that overcomes the limitations of traditional algorithms with single-frame radar data. The introduction of channel recalibration blocks refines local representations, capturing micro-scale features crucial for accurate tornado identification. Inspired by the transformer architecture, the spatial construction module enriches global spatial dependencies by assimilating information from different spatial regions. Simultaneously, the temporal construction module captures the time-relatedness of consecutive radar frames, providing a nuanced understanding of tornado evolution. Given the limited number of tornado samples, data augmentation techniques like random rotation and cropping are implemented during model training to enhance robustness. Compared with the traditional TDA method with a Critical Success Index (CSI) of 0.15, the proposed method successfully improves the CSI to 0.54, which highlights the potentially advantages of deep learning methods in identification tasks. Even compared with the classical deep learning model UNet, which has a Probability of Detection (POD) of 0.62 and a False Alarm Rate (FAR) of 0.50, the proposed method achieves 0.75 and 0.32, respectively, and possesses more superior accuracy and robustness. The innovative TS-MINet model provides new insights and solutions for tornado detection, providing strong support for accurate prediction and timely response to future weather events. 

How to cite: Xie, J., Zhou, K., Han, L., Guan, L., Wang, M., Zheng, Y., Chen, H., and Mao, J.: Multitask Learning for Tornado Identification Using Doppler Radar Data, EGU General Assembly 2024, Vienna, Austria, 14–19 Apr 2024, EGU24-1754, https://doi.org/10.5194/egusphere-egu24-1754, 2024.

EGU24-1868 | ECS | Posters on site | AS5.5 | Highlight

Utilizing convolutional neural networks for ground-based cloud observations 

Markus Rosenberger, Manfred Dorninger, and Martin Weissmann

Clouds of any kind play a substantial role in a wide variety of atmospheric processes, e.g. radiation, and moisture transport. Moreover, knowledge of currently occurring cloud types allows the observer to draw conclusions about the short-term evolution of the state of the atmosphere and hence also the weather. However, the number of operational cloud observations is rather decreasing than increasing due to high monetary and personnel expenses. 

To counteract this trend, we train a multi-input residual neural network architecture from scratch with ground based RGB images, where each instance consists of 4 images. Human cloud observations from nearby SYNOP station Vienna Hohe Warte are used as ground truth. To the best of our knowledge we are the first to classify clouds with this methodology into 30 different classes, which are consistent with the state-of-the-art scheme for operational cloud observations. Of these 30 classes up to three can be observed simultaneously in the same instance, making this a multi-input multi-label classification problem. Additional difficulty stems from highly imbalanced ground truth class distributions, with the most abundant cloud class being observed several hundred times more frequently than the least abundant class, leading to strong biases in the model output. To reduce these biases, class-specific resampling methods are used, which increase the total number of available instances from less than 12,000 to more than 20,000. This resampling is fundamental to get sufficient results.

We conducted a large number of experiments covering a variety of model architectures, as well as different loss and class weighting functions. Preliminary results will be shown, which indicate very high precision and sufficiently high recall in most classes of the validation data, especially in those where aggressive resampling strategies have been used. The performance is even better, when classes with visual similarities are combined during validation. Thus, a substantial portion of false predictions can be explained by the model's confusion of similar-looking classes. Results also show that biases due to class imbalances are heavily reduced but are still present. Overall our classifier also shows exceptionally good reliability.

With such a machine learning method and a common camera system, clouds can be observed independently and operationally where no human observations are available. This also allows a permanent monitoring of the current state of the weather as well as its short-time evolution. Apart from this, further applications of such an automated cloud classifier may be model verification, or cloud monitoring with high temporal resolution in the proximity of solar power plants. There, upcoming clouds can substantially change the possible energy output, which leads to the necessity of taking precautions. 

How to cite: Rosenberger, M., Dorninger, M., and Weissmann, M.: Utilizing convolutional neural networks for ground-based cloud observations, EGU General Assembly 2024, Vienna, Austria, 14–19 Apr 2024, EGU24-1868, https://doi.org/10.5194/egusphere-egu24-1868, 2024.

EGU24-2320 | Posters on site | AS5.5 | Highlight

AI/ML Augmented Hyper Local Weather Forecast 

Hung-Lung Allen Huang

Our very recent artificial intelligence – machine learning (AI/ML) augmented wind energy production forecast has successfully demonstrated a consistent >30% wind speed and power generation forecast improvement over the NOAA operational High-Resolution Rapid Refresh (HRRR) standalone capability.

So far, we have used a suite of AI/ML algorithms, including 1) artificial neural networks, 2) ridge regression, 3) lasso regression, 4) support vector machines, 5) gradient boosting, 6) elastic networks, 7) nearest neighboring clustering, and 8) random forest (RF) models for wind energy forecasting applications. These AI/ML augmented forecasts significantly improve the management of the power grid distribution, energy trading strategy, and plant operations with training and testing corresponding to 253 sites in Texas and validated on a year of independent testing data. It has shown that each AI/ML model offers significant forecast improvement (+20% mean squared error) skill over the current official HRRR forecasts. Furthermore, an AI/ML model ensemble of different machine learning models is deployed and demonstrated to significantly improve wind speed accuracy during all seasons, times of day, sites tested, and forecast horizon times.

This fully matured AI/ML augmented framework has shown to be comprehensive and robust, demonstrating that AI/ML is a natural complement to the existing NWP infrastructure and can be expanded to enhance local forecasts.


How to cite: Huang, H.-L. A.: AI/ML Augmented Hyper Local Weather Forecast, EGU General Assembly 2024, Vienna, Austria, 14–19 Apr 2024, EGU24-2320, https://doi.org/10.5194/egusphere-egu24-2320, 2024.

EGU24-2401 | Orals | AS5.5 | Highlight

From Stiff Equations to Deep Learning: Overcoming Challenges in Simulating Complex Atmospheric Aerosol Chemistry 

Manish Shrivastava, Himanshu Sharma, and Balwinder Singh

Fine particles in the atmosphere known as Secondary Organic Aerosols (SOA) have a considerable impact on the Earth's energy budget, as they interact with clouds and radiation. The formation of SOA is a complex process that involves various chemical reactions in the gas phase, aqueous aerosols, and clouds. This process is computationally expensive for three-dimensional chemical transport models, as it requires solving a stiff set of differential equations. Deep neural networks (DNNs) can be used to represent the nonlinear changes in the physical and chemical processes of aerosols. However, their use is limited due to several challenges such as generalizability, preservation of mass balance, simulating sparse model outputs, and maintaining physical constraints. 

To address these challenges, we have developed a physics-informed DNN approach that can simulate the complex physical and chemical formation processes of isoprene epoxydiol SOA (IEPOX-SOA) over the Amazon rainforest. The DNN is trained over a short period of 7 hours of simulated IEPOX-SOA over the entire atmospheric column using the Weather Research and Forecasting Model coupled with Chemistry (WRF-Chem). The trained DNN is then embedded within WRF-Chem to replace the default solver of IEPOX-SOA formation, which is computationally expensive. The approach shows promise, as the trained DNN generalizes well and agrees with the default model simulation of the IEPOX-SOA mass concentrations and its size distribution over several days of simulations in both dry and wet seasons. Additionally, the computational expense of WRF-Chem is reduced by a factor of 2. The approach has the potential to be applied to other computationally expensive chemistry solvers in climate models, which could greatly speed up the models while maintaining complexity.

How to cite: Shrivastava, M., Sharma, H., and Singh, B.: From Stiff Equations to Deep Learning: Overcoming Challenges in Simulating Complex Atmospheric Aerosol Chemistry, EGU General Assembly 2024, Vienna, Austria, 14–19 Apr 2024, EGU24-2401, https://doi.org/10.5194/egusphere-egu24-2401, 2024.

EGU24-2478 | ECS | Orals | AS5.5 | Highlight

Multi-scale hybrid modeling of terrestrial evaporation 

Akash Koppa, Oscar Baez-Villanueva, Olivier Bonte, and Diego G. Miralles

Hybrid  modeling – combining physics with machine learning – in recent years has pushed the frontiers of Earth science, providing an opportunity to accurately characterize traditionally elusive variables. Terrestrial evaporation (E) is one such climatic variable which couples the global water and energy cycles. Accurately estimating E is important for determining crop water requirements at the local scale, while diagnosing the vegetation state at the global scale. Despite its importance, an accurate prediction of E has proven elusive, leading to the implementation of a plethora of mechanistic and data-driven models in the last few decades. The difficulty in modeling E can be traced to the complex response of transpiration (Et; i.e., evaporation from vegetation) to various environmental stressors, which are assumed to interact linearly in global models due to our limited knowledge based on local studies. 

Here, we train deep learning algorithms using eddy covariance and sap flow data together with satellite observations as inputs, aiming to retrieve a universal formulation of transpiration stress (St), i.e., the reduction of Et from its theoretical maximum. Then, we embed the new St formulation within the process-based Global Land Evaporation Amsterdam Model (GLEAM). In the resulting hybrid model, the St formulation is bidirectionally coupled to the host model at the daily timescale. Comparisons against in situ data and satellite-based proxies of E demonstrate the ability of this hybrid framework to produce better estimates of St and E globally across multiple spatial scales (ranging from 1km to 0.10 degrees) (Koppa et al. 2022). The proposed framework may be extended to improve not only the modeling of E in Earth System Models but also enhance the understanding of processes which modulate this crucial climatic variable. Future work in this direction involves the development of an end-to-end hybrid model, capable of simultaneously learning and inferring St and E through differentiable programming. Our results highlight the potential of combining mechanistic modeling with machine learning, especially deep learning, for improving our understanding of complex Earth system processes which are difficult to measure directly at the scale of interest.

References

Koppa, A., Rains, D., Hulsman, P. et al. A deep learning-based hybrid model of global terrestrial evaporation. Nat Commun 13, 1912 (2022). https://doi.org/10.1038/s41467-022-29543-7

How to cite: Koppa, A., Baez-Villanueva, O., Bonte, O., and G. Miralles, D.: Multi-scale hybrid modeling of terrestrial evaporation, EGU General Assembly 2024, Vienna, Austria, 14–19 Apr 2024, EGU24-2478, https://doi.org/10.5194/egusphere-egu24-2478, 2024.

EGU24-2504 | Posters on site | AS5.5

Estimation of daily NO2 with explainable machine learning model in China, 2007-2020 

Yanchuan Shao, Wei Zhao, Riyang Liu, Jianxun Yang, Miaomiao Liu, Wen Fang, Litiao Hu, Matthew Adams, Jun Bi, and Zongwei Ma

Surface nitrogen dioxide (NO2) is an effective indicator of anthropogenic combustion and is associated with regional burden of disease. Though satellite-borne column NO2 is widely used to acquire surface concentration through the integration of sophisticated models, long-term and full-coverage estimation is hindered by the incomplete retrieval of satellite data. Moreover, the mechanical relationship between surface and tropospheric NO2 is often ignored in the context of machine learning (ML) approach. Here we develop a gap-filling method to obtain full-coverage column NO2 by fusing satellite data from different sources. The surface NO2 is then estimated during 2007-2020 in China using the XGBoost model, with daily out-of-sample cross-validation (CV) R2 of 0.75 and root-mean-square error (RMSE) of 9.11 µg/m3. The back-extrapolation performance is verified through by-year CV (daily R2 = 0.60 and RMSE = 11.46 µg/m3) and external estimations in Taiwan before 2013 (daily R2 = 0.69 and RMSE = 8.59 µg/m3). We explore the variable impacts in three hotspots of eastern China through SHAP (Shapley additive explanation) values. We find the driving contributions of column NO2 to the variation of ground pollution during 2007-2020 (average SHAP = 5.09 µg/m3 compared with the baseline concentration of 33.39 µg/m3). The estimated effect is also compared with ordinary least squares (OLS) model to provide a straightforward understanding. The related health burden is further calculated by using the annual NO2. We demonstrate the employment of explainable ML model is beneficial for comprehend the coupled relationship in surface NO2 change.

How to cite: Shao, Y., Zhao, W., Liu, R., Yang, J., Liu, M., Fang, W., Hu, L., Adams, M., Bi, J., and Ma, Z.: Estimation of daily NO2 with explainable machine learning model in China, 2007-2020, EGU General Assembly 2024, Vienna, Austria, 14–19 Apr 2024, EGU24-2504, https://doi.org/10.5194/egusphere-egu24-2504, 2024.

EGU24-2763 | ECS | Posters virtual | AS5.5

Study on the 3DVar emission inversion method combined with machine learning in CMAQ 

Congwu Huang, Tijian Wang, and Tao Niu

The air quality model is increasingly important in air pollution forecasting and controlling. Emissions significantly impact the accuracy of air quality models. This research studied the 3DVar (three-dimensional variational) emission inversion method based on machine learning in CMAQ (The Community Multiscale Air Quality modeling system). The ExRT(extremely randomized trees method) machine learning conversion matrixes were established to convert the pollutant concentration innovations to the corresponding emission intensity innovations, extended 3DVar to emission inversion. The O3 and NO2 concentration, NOx and VOCs emissions are modeled using machine learning, taking account of the nonlinearity of the O3-NOx-VOCs processes. This method significantly improved the simulation ability of O3. Taking the air pollution process in the BTH region from January 15 to 30, 2019 as an example, ExRT-3DVar (3DEx) and Nudging (Nud) emission assimilation experiments were caried out. Compared with the simulation without assimilation (NODA), the Nudging method has better assimilation effects on PM10 and NO2, with the regional errors reduced by 14%, 2%, and the temporal errors reduced by 31%, 34%; ExRT-3DVar has better effects on the assimilation of PM2.5, O3, SO2, the regional errors were reduced by 40%, 29%, 13%, and the temporal errors were reduced by 49%, 10%, 33%. This simplicity, efficiently and extensibility framework of ExRT-3DVar method has been proved to be a good way to adjust emissions in CMAQ and still remains much to be done in the future.

How to cite: Huang, C., Wang, T., and Niu, T.: Study on the 3DVar emission inversion method combined with machine learning in CMAQ, EGU General Assembly 2024, Vienna, Austria, 14–19 Apr 2024, EGU24-2763, https://doi.org/10.5194/egusphere-egu24-2763, 2024.

EGU24-2857 | ECS | Orals | AS5.5 | Highlight

Coupling the Data-driven Weather Forecasting Model with 4D Variational Assimilation 

Yi Xiao, Lei Bai, Wei Xue, Kang Chen, Tao Han, and Wanli Ouyang

In recent years, the development of artificial intelligence has led to rapid advances in data-driven weather forecasting models, some of which rival or even surpass traditional methods like Integrated Forecasting System (IFS) in terms of forecasting accuracy. However, existing data-driven weather forecasting models still rely on the analysis fields generated by the traditional assimilation and forecasting system, which hampers the significance of data-driven weather forecasting models regarding both computational cost and forecasting accuracy.

Four-dimensional variational assimilation (4DVar) is one of the most popular data assimilation algorithms and has been adopted in numerical weather prediction centers worldwide. This research aims at extending the ability of data-driven weather forecasting models by coupling them with the 4DVar algorithm, i.e., alternatively running the AI forecast and 4DVar to realize a long-term self-contained forecasting system.

In the 4DVar algorithm, the forecasting model is embedded into the objective function so that the flow dependencies are taken into account. Realizing the 4DVar algorithm in which the flow dependencies are expressed by the AI weather forecasting model is still a new area to be explored. Previous research has demonstrated the feasibility of using AI forecasting models in 4DVar as flow dependencies with the aid of auto-differentiation in simple dynamic systems, but scaling to the more complicated global weather forecasting faces additional challenges. For example, a differentiable background error covariance matrix needs to be constructed so that auto-differentiation can be implemented. Furthermore, the rapid error accumulation of AI forecasting models reduces the accuracy of flow dependencies in 4DVar and hinders the assimilation accuracy.

In this research, we address these challenges by leveraging the following techniques. First, we take advantage of the “torch-harmonics” package developed by Nvidia to implement the differentiable spherical convolution for representing horizontal correlations in the background error matrix. Second, we reformulate the 4DVar objective function to take into account the cumulative error of AI weather forecasting model so that the objective function can better represent the error statistics. Third, the temporal aggregation strategy with different time-length AI forecasting models is employed to efficiently build flow dependencies so as to reduce the iterative error of AI forecasting model and improve assimilation accuracy.

We conduct this research on the global AI weather forecasting model, FengWu, and couple it with 4DVar to implement the AI weather forecasting system prototype, FengWu-4DVar. Our experiments were conducted with the FengWu forecasting model at 1.4° resolution and the ERA5 simulation observations. With an observation proportion of 15% and the assimilation window of 6 hours, FengWu-4DVar is capable of generating reasonable analysis fields and achieving stable and efficiently cyclic assimilation and forecasting for at least one year, and the root mean square error on the potential height of the analysis field at 500hPa is less than 25m2/s2 on average. Moreover, assimilating observations in a 6-hour window can be realized in less than 30 seconds on one GPU of NVIDIA A100.

How to cite: Xiao, Y., Bai, L., Xue, W., Chen, K., Han, T., and Ouyang, W.: Coupling the Data-driven Weather Forecasting Model with 4D Variational Assimilation, EGU General Assembly 2024, Vienna, Austria, 14–19 Apr 2024, EGU24-2857, https://doi.org/10.5194/egusphere-egu24-2857, 2024.

EGU24-3905 | Posters on site | AS5.5

Performing Quality Control on Meteorological Data Using Machine Learning Techniques 

Teresa Spohn, John O’Donoghue, Kevin Horan, Tim Charnecki, Conor Lally, and Merlin Haslam

Quality control (QC) on data has historically been a tedious and time-consuming task. With the currently available computer processing power and machine learning algorithms, it is possible to make QC far faster and more efficient, providing high-quality data in near real time to end users. Many organisations are already using such systems with great success, although the rapid expansion of machine learning continues to open new avenues for improvement. The aim of this project is to create a QC system for Met Eireann, the Irish Meteorological Office, which incorporates the latest machine learning techniques, combined with expert human supervision, to produce the highest possible quality meteorological data.

Presented here are the ideas and concepts we intend to implement to create the QC system, showing the results of the initial trials on air temperature data. The project is still in the earliest stages of development and will benefit from input and feedback from others with experience working on similar projects.

How to cite: Spohn, T., O’Donoghue, J., Horan, K., Charnecki, T., Lally, C., and Haslam, M.: Performing Quality Control on Meteorological Data Using Machine Learning Techniques, EGU General Assembly 2024, Vienna, Austria, 14–19 Apr 2024, EGU24-3905, https://doi.org/10.5194/egusphere-egu24-3905, 2024.

EGU24-4501 | ECS | Posters on site | AS5.5

Unified Model of Forecasting Ozone 

Zhenze Liu, Ke Li, Oliver Wild, Ruth Doherty, Fiona O'Connor, and Steven Turnock

The chemical transport models face challenges in simulating the concentrations of surface ozone accurately in all conditions when meteorology and chemical environment are changing. The capability of capturing the principle physical and chemical processes is clearly limited. We propose a unified framework based on deep learning to provide a more accurate prediction of surface ozone. The model is tailored to individual observation sites in China, forming a specific graph that would reflect the interaction between spatial and temporal connection in physics and chemistry. This mitigates the uncertainty associated with model resolution and emissions. We show that the model achieves the State-of-the-Art (SOTA) performance in simulating MDA8 ozone among current process-based and other deep learning models. The model structure is also flexible to be applied to other places where observations are available such as Europe and North America. This work underscores great benefits that can be gained through implementing more measurement sites to enhance the density of the model graph.

How to cite: Liu, Z., Li, K., Wild, O., Doherty, R., O'Connor, F., and Turnock, S.: Unified Model of Forecasting Ozone, EGU General Assembly 2024, Vienna, Austria, 14–19 Apr 2024, EGU24-4501, https://doi.org/10.5194/egusphere-egu24-4501, 2024.

Surface ozone (O3) poses great threats to both human health and crop production worldwide. However, a multi-decadal assessment of O3 impacts in China is lacking due to insufficient long-term continuous O3 observations. In this study, we used a machine learning (ML) algorithm to correct the biases of O3 concentrations simulated by the chemical transport model from 1981–2019 by integrating multi-source datasets. The ML-enabled bias-corrected O3 concentrations improve the estimates of O3 impacts on human health and crop yields. The warm-season increasing trend of O3 in Beijing-Tianjin-Hebei and its surroundings (BTHs), Yangtze River Delta (YRD), Sichuan Basin (SCB) and Pearl River Delta (PRD) regions are 0.32, 0.63, 0.84, and 0.81 μg m–3 yr–1 from 1981 to 2019, respectively. In more recent years, O3 concentrations experience more fluctuations in the four major regions. Our results show that only BTHs have a perceptible increasing trend of 0.81 μg m–3 yr–1 during 2013–2019. The estimated annual all-cause premature deaths induced by O3 increase from ~55,900 in 1981 to ~162,000 in 2019 with an increasing trend of ~2,980 deaths yr–1. The annual premature deaths related to respiratory and cardiovascular disease are ~34,200 and ~40,300 in 1998, and ~26,500 and ~79,000 in 2019, having a rate of change of –546 and +1,770 deaths yr–1 during 1998–2019, respectively. Using AOT40-China exposure-yield response relationships, the estimated relative yield losses (RYLs) for wheat, rice, soybean and maize are 17.6%, 13.8%, 11.3% and 7.3% in 1981, and increases to 24.2%, 17.5%, 16.3% and 9.8% in 2019, with an increasing rate of +0.03% yr–1, +0.04% yr–1, +0.27% yr–1 and +0.13% yr–1, respectively. Currently, estimating ozone-induced crop production losses still faces great uncertainties in magnitudes and/or spatial patterns when using different approaches, particularly in large-scale studies involving diverse ecological and climatic conditions. The averaged national annual mean RYLs for wheat are estimated to range from 4.3 to 24.6%, considering most available exposure metrics, including concentration-based and flux-based metrics. Our study, for the first time, used ML to provide a robust O3 dataset over the past four decades in China, enabling a long-term evaluation of O3-induced health impacts and crop losses. These findings are expected to fill the gap in the long-term O3 trend and impact assessment in China.

Figure 1. Density scatter plots and linear regressions between O3 measurements and predictions of LightGBM and GEOS-Chem model at (a1, a2) daily level and (a3, a4) hourly level, respectively. The annual averaged MDA8 O3 concentrations of LightGBM bias-corrected predictions and corresponding anomalies from 1981 to 2019: (b1) BTHs, (b2) YRD, (b3) SCB, and (b4) PRD.  (c1) The mortality (thousand) for different health endpoints; (c2) The province-based mortality (thousand) attributed to different health endpoints; (c3) The annual province-based population (million). (d) Bar plot of the RYLs for crops using different metrics from 1981-2019: (left panel) LightGBM, and (right panel) GEOS-Chem. 

Figure 2. Spatial distribution of averaged annual RYLs (%) for wheat: (a) AOT40, (b) FBB, (c) DO3SE_LRTAP, and (d) DO3SE_Feng. The spatial correlation coefficients (r) of estimated RYLs using different metrics (Table).

How to cite: Mao, J. and Tai, A.: Multidecadal ozone trends in China and implications for human health and crop yields: A hybrid approach combining chemical transport model and machine learning, EGU General Assembly 2024, Vienna, Austria, 14–19 Apr 2024, EGU24-4625, https://doi.org/10.5194/egusphere-egu24-4625, 2024.

EGU24-4951 | ECS | Posters on site | AS5.5

Improving prediction of marine low clouds with cloud droplet number concentration and a deep learning method 

Yang Cao, Yannian Zhu, Minghuai Wang, Daniel Rosenfeld, and Chen Zhou

Marine low clouds have a pronounced cooling effect on the climate system because of their large cloud fraction (CF) and high albedo. However, predicting marine low clouds with satellite data remains challenging due to the non-linear response of marine low clouds to cloud-controlling factors (CCFs) and the ignorance of cloud droplet number concentration (Nd). Here, we developed a unified convolutional neural network (CNN) incorporating meteorology and Nd as CCFs to predict critical properties of marine low clouds, such as CF, albedo, and cloud radiative effects (CRE). Our CNN model excels in capturing the variability of these cloud properties, achieving over 70% variance explanation for daily 1x1 degree areas, surpassing previous studies. It also effectively replicates geographical patterns of CF, albedo, and CRE, including climatology and long-term trends from 2003 to 2022. This research underscores the significant potential of deep learning in deep exploitation of the information content of the data and, thus, advancing our understanding of aerosol-cloud interactions, a pioneering effort in the field.

How to cite: Cao, Y., Zhu, Y., Wang, M., Rosenfeld, D., and Zhou, C.: Improving prediction of marine low clouds with cloud droplet number concentration and a deep learning method, EGU General Assembly 2024, Vienna, Austria, 14–19 Apr 2024, EGU24-4951, https://doi.org/10.5194/egusphere-egu24-4951, 2024.

EGU24-5491 | ECS | Posters virtual | AS5.5

  PM2.5 concentration forecast using Hybrid models over Urban cities in India 

Vyshnavi k k, Shubha Verma, and Vibhu Vaibhav

Air pollution poses a substantial risk to both public health and the environment. Accurate forecasting of air quality is crucial in mitigating its detrimental impacts. The existing forecast method of air quality in India is computationally intensive and is not economical; hence, we utilize Advanced Machine and Deep Learning Models to forecast air quality. The objective of this research is to develop a novel hybrid model integrating Long Short-Term Memory (LSTM), Extreme Gradient Boosting (XGBoost), and Multi-Layer Perceptron (MLP) models to forecast concentrations over Kanpur. The study involved comprehensive data collection (Secondary air quality and meteorological data from the Central Pollution Control Board), analysis, and experimentation with multiple models. Root mean square error (RMSE) and coefficient of determination (R2 score) are used for model validation. MLP-XGBoost-LSTM hybrid model works well with a decreased RMSE (12.6 μg/m3 ) and increased R2 score (0.96) compared to individual models (XGBoost- 37 μg/m3, MLP-39 μg/m3, and LSTM-41 μg/m3).  The significance of the research lies in its potential to provide highly accurate forecasts, even with limited computational resources. These findings have significant implications for environmental policy, public health in heavily polluted regions, and the broader utilization of machine learning in environmental science.

How to cite: k k, V., Verma, S., and Vaibhav, V.:   PM2.5 concentration forecast using Hybrid models over Urban cities in India, EGU General Assembly 2024, Vienna, Austria, 14–19 Apr 2024, EGU24-5491, https://doi.org/10.5194/egusphere-egu24-5491, 2024.

EGU24-5695 | Posters on site | AS5.5

Innovative surface reflectance retrieval from UV satellites 

Pascal Hedelt, Klaus-Peter Heue, Ronny Lutz, Fabian Romahn, and Diego Loyola

The knowledge of the surface reflectance is essential for the retrieval of atmospheric trace-gases from satellites. It is required in the conversion of the observed trace gas slant column to the total vertical column by means of a so-called air-mass factor. Although there exists climatological databases based on UV satellite data (e.g. OMI, GOME-2), these have a low spatial resolution and are not appropriate for current and future UV satellite missions like Sentinel-5p/TROPOMI or MTG-S/UVN (Sentinel-4) due their significantly higher spatial and spectral resolution. Current climatologies which are used in operational retrievals provide the Lambertian Equivalent Reflection (LER, e.g. OMI, GOME-2, TROPOMI, see [1,2,3]) and Directional-LER (DLER, e.g. GOME-2, TROPOMI see [3,4]) for selected wavelength in the UV-VIS range and are based on the so-called minimum LER approach, i.e. determine the minimum surface reflectance in the measurement timeframe.

We present here a new technique called GE_LER (Geometry-dependent Effective Lambertian Equivalent Reflectivity) based on Machine Learning, which retrieves the DLER from UV satellites in a wavelength range as opposed to the single wavelength approaches of existing climatologies. In this way, dedicated surface reflectivities for specific trace gas retrieval wavelength ranges can be determined. We train a Neural Network with simulated UV spectra, which have been calculated with (V)LIDORT (see [5]). This radiative transfer model is also used for the generation of Air Mass Factors in the operational TROPOMI trace gas retrieval. In this way we reduce the influence of using different radiative transfer models with respect to trace gas retrievals.

First results of our GE_LER retrieval for several trace-gases based on TROPOMI data will be shown.


References

[1] Kleipool (2010), OMI/Aura Surface Reflectance Climatology L3 Global Gridded 0.5 degree x 0.5 degree V3, Greenbelt, MD, USA, Goddard Earth Sciences Data and Information Services Center (GES DISC),, 10.5067/Aura/OMI/DATA3006

[2] Tilstra et al. (2017), Surface reflectivity climatologies from UV to NIR determined from Earth observations by GOME-2 and SCIAMACHY, J. Geophys. Res. Atmos. 122, 4084-4111, doi:10.1002/2016JD025940

[3] Tilstra et al. (2021), Directionally dependent Lambertian-equivalent reflectivity (DLER) of the Earth's surface measured by the GOME-2 satellite instruments, Atmos. Meas. Tech. 14, 4219-4238, doi:10.5194/amt-14-4219-2021

[4] Tilstra et al. (2023), A directional surface reflectance climatology determined from TROPOMI observations, Atmos. Meas. Tech. Discuss. [preprint], doi:10.5194/amt-2023-222, in review

[4] Spurr et al. (2008), LIDORT and VLIDORT: Linearized pseudo-spherical scalar and vector discrete ordinate radiative transfer models for use in remote sensing retrieval problems. Light Scattering Reviews, Volume 3, ed. A. Kokhanovsky, Springer

How to cite: Hedelt, P., Heue, K.-P., Lutz, R., Romahn, F., and Loyola, D.: Innovative surface reflectance retrieval from UV satellites, EGU General Assembly 2024, Vienna, Austria, 14–19 Apr 2024, EGU24-5695, https://doi.org/10.5194/egusphere-egu24-5695, 2024.

EGU24-6633 | ECS | Posters on site | AS5.5

Hyper-Resolution Wind Forecasting in Austral Chile combining WRF forecasting and Deep Learning techniques. 

Jorge Arevalo, Andrés Ávila, Walter Gomez, Pablo Andrade, Diana Pozo, Deniz Bozkurt, Ruben Lagos, Francisco Alvial, and Ana María Cordova

Near-surface wind conditions, specifically at 10 meters above ground, play a crucial role in areas with complex topography like the Austral Chilean Territory, characterized by small islands, channels, and fiords. The impact of topography and land cover on wind patterns is particularly significant. In the other hand, wind impacts local transport and, consequently, the economy and social activities. Accurate forecasting of these winds is essential for optimal planning and heightened maritime safety.

While dynamic models, such as the WRF model, have proven valuable for stakeholders, their operational use is limited by the high computational cost, restricting spatial resolutions to a few kilometers. For example, the Chilean Navy Weather Service employs the WRF model with a resolution of up to 3 km in specific areas, and the Chilean Weather Office uses a 4 km resolution across the entire continental territory.

This study addresses this limitation by developing an emulator for dynamic downscaling of surface wind, aiming for hyper resolutions (~300 m) over Austral Chile. Utilizing cluster analysis of ERA 5 10m-wind fields, eight wind patterns were identified. Multi-day simulations were conducted with telescopic domains reaching 100 m resolution, incorporating NASA's ASTER DEM into WRF and updating the coastline in the default 500 m land-use dataset. The consistency analysis of these results will be presented.

To achieve hyper-resolution forecasting, various deep learning models, including Convolutional Neural Networks (CNN) and Generative Adversarial Networks (GAN), were trained to downscale the 3 km domain to the 100 m one. The presentation will focus on the evaluation and comparison of these models, showcasing the first key results of this research. This study is part of a larger research project that aims to produce a very high-resolution wind forecasting system, based on the downscaling of WRF simulations by using Deep learning techniques (SiVAR-Austral, funded by ANID ID22I10206). Results will be valuable to stakeholders by enhancing both planning capabilities and maritime safety in the Austral Chilean Territory.

How to cite: Arevalo, J., Ávila, A., Gomez, W., Andrade, P., Pozo, D., Bozkurt, D., Lagos, R., Alvial, F., and Cordova, A. M.: Hyper-Resolution Wind Forecasting in Austral Chile combining WRF forecasting and Deep Learning techniques., EGU General Assembly 2024, Vienna, Austria, 14–19 Apr 2024, EGU24-6633, https://doi.org/10.5194/egusphere-egu24-6633, 2024.

Climate models are vital for understanding and projecting global climate. However, these models frequently suffer from biases that limit their accuracy in historical simulations and the trustworthiness of future projections. Addressing these challenges requires overcoming internal variability, hindering direct alignment between model simulations and observations and thwarting conventional supervised learning methods. Here, we employ an unsupervised Cycle-consistent Generative Adversarial Network (CycleGAN), to correct daily Sea Surface Temperature (SST) simulations from Community Earth System Model 2 (CESM2). Our results reveal that CycleGAN not only corrects climatological biases but also improves the simulation of major dynamic modes including El Niño-Southern Oscillation (ENSO) and Indian Ocean Dipole mode, as well as SST extremes. Notably, it substantially mitigates climatological SST bias, decreasing the Root Mean Square Error (RMSE) by 58%. Furthermore, it markedly refines the representation of the annual cycle in the tropical Pacific, reducing the RMSE by 31% and boosting the pattern correlation coefficient (PCC) by 34%. Intriguingly, CycleGAN effectively addresses the well-known excessive westward bias in ENSO SST anomalies, a common issue in climate models. Additionally, it augments the simulation of SST extremes, raising the PCC from 0.56 to 0.88 and lowering the RMSE from 0.5 to 0.32. This enhancement is attributed to better representations of interannual variability and variabilities at intraseasonal and weather scales. This study offers a novel approach to correct global SST simulations, and underscores its effectiveness across different time scales and primary dynamical modes.

How to cite: Wang, Y.: Correcting Climate Model Sea Surface Temperature Simulations with Generative Adversarial Networks: Climatology, Interannual Variability, and Extremes, EGU General Assembly 2024, Vienna, Austria, 14–19 Apr 2024, EGU24-6936, https://doi.org/10.5194/egusphere-egu24-6936, 2024.

Tropical cyclones are intense weather phenomena that originate over tropical oceans, posing significant threats to human life and property safety. This paper introduces methods for extracting and forecasting tropical cyclone information based on deep learning and satellite infrared images. It includes tropical cyclone wind radii estimation (global), tropical cyclone center location (Northwest Pacific), and tropical cyclone intensity forecast (Northwest Pacific). Utilizing infrared images and ERA5 reanalysis data, datasets for tropical cyclone wind radii estimation from 2004 to 2016, tropical cyclone center location from 2015 to 2018, and 24-hour tropical cyclone intensity forecasts from 1979 to 2021 have been constructed.

Firstly, the DL-TCR model with an asymmetric branch is designed to infer the asymmetric tropical cyclone wind radii (R34, R50 and R64) of global tropical cyclones. A modified MAE-weighted loss function is introduced to enhance the model's underestimation of large-sized tropical cyclone wind radii. The results indicate that the DL-TCR model achieves MAEs for R34 wind radii of 18.8, 19.5, 18.6, and 18.8 n mi in the NE, SE, SW, and NW quadrants, respectively. For R50 wind radii, the MAEs are 11.3, 11.3, 11.1, and 10.8 n mi, and for R64 wind radii, the MAEs are 8.9, 9.9, 9.2, and 8.7 n mi. These values represent an improvement of 12.1-35.5% compared to existing methods.

Then, employing transfer learning by transferring pre-trained models based on the ImageNet natural image dataset significantly improved the precision of tropical cyclone center location models. The results demonstrate that the transfer-learning-based model enhances the location accuracy by 14.1% compared to models without transfer learning. The location error for the tropical cyclone centers in the test data is 29.3 km, and for H2-H5 category, the tropical cyclone center location error is less than 20 km.

Finally, a deep learning model, named the TCIF-fusion model, was developed with two distinct branches engineered to learn multi-factor information and forecast the intensity of TCs over a 24-hour period. Ultimately, heatmaps were generated to capture the model's insights, which were then utilized to augment the original input data, leading to an improved dataset that significantly enhanced the accuracy of the TC intensity forecasting. Utilizing the refined input, the heatmaps (referred to as model knowledge, MK) were employed to direct the modeling process of the TCIF-fusion model. Consequently, the model guided by MK achieved a 24-hour forecast error of 3.56 m/s for Northwest Pacific TCs during the period from 2020 to 2021. The MK-based TCIF-fusion model has improved the forecasting performance by 12.1-35.5% compared to existing methods.

In summary, deep learning exhibits significant potential in the extraction and forecasting of tropical cyclone information, positioning it as a crucial tool for future tropical cyclone monitoring and forecasting.

How to cite: Wang, C. and Li, X.: Tropical Cyclone Information Extraction and Forecast Based on Satellite Infrared Images and Deep Learning Technology, EGU General Assembly 2024, Vienna, Austria, 14–19 Apr 2024, EGU24-7056, https://doi.org/10.5194/egusphere-egu24-7056, 2024.

EGU24-7133 | ECS | Posters on site | AS5.5

The capability of deep learning model to predict atmospheric compositions across spatial and temporal domains 

Weichao Han, Tai-Long He, Zhe Jiang, Min Wang, Dylan Jones, Kazuyuki Miyazaki, and Yanan Shen

Machine learning (ML) techniques have been extensively applied in the field of atmospheric science. It provides an efficient way of integrating data and predicting atmospheric compositions. However, whether ML predictions can be extrapolated to different domains with significant spatial and temporal discrepancies is still unclear. Here we explore the answer to this question by presenting a comparative analysis of surface carbon monoxide (CO) and ozone (O3) predictions by integrating deep learning (DL) and chemical transport model (CTM) methods. The DL model trained with surface CO observations in China in 2015-2018 exhibited good spatial and temporal extrapolation capabilities, i.e., good surface daily CO predictions in China in 2019-2020 and over 10% independent observation stations in China in 2015-2020. The spatial and temporal extrapolation capabilities of DL model are further evaluated by predicting hourly surface O3 concentrations in China, the United States (US) and Europe in 2015-2022 with a DL model trained with surface O3 observations in China and the US in 2015-2018. Compared to baseline O3 simulations using GEOS-Chem (GC) model, our analysis exhibits mean biases of 2.6 and 4.8 µg/m3 with correlation coefficients of 0.94 and 0.93 (DL); and mean biases of 3.7 and 5.4 µg/m3 with correlation coefficients of 0.95 and 0.92 (GC) in Europe in 2015-2018 and 2019-2022, respectively. This analysis indicates the potential of DL to make reliable atmospheric composition predictions over spatial and temporal domains where a wealth of local observations for training is not available.

How to cite: Han, W., He, T.-L., Jiang, Z., Wang, M., Jones, D., Miyazaki, K., and Shen, Y.: The capability of deep learning model to predict atmospheric compositions across spatial and temporal domains, EGU General Assembly 2024, Vienna, Austria, 14–19 Apr 2024, EGU24-7133, https://doi.org/10.5194/egusphere-egu24-7133, 2024.

Precipitation forecasting with Typhoons (especially nowcasting), a short-term (up to two hours) high-resolution forecasting, is arguably one of the most demanding tasks. Traditional forecasting methods contain 1) Ensemble numerical weather prediction (NWP) systems and 2) advect precipitation fields with radar-based wind estimates via optical flow techniques. The former simulates coupled physical equations of the atmosphere to generate multiple precipitation forecasts. In the latter methods, motion fields are estimated by optical flow, smoothness penalties are used to approximate an advection forecast, and stochastic perturbations are added to the motion field and intensity model. However, these methods either do not meet the requirement on time or rely on the advection equation. These drawbacks limit the performance of precipitation forecasting. Satellite imagery benefits from machine learning technologies, e.g., deep learning, which can be regarded as video frames and is expected to be a promising approach to solving precipitation nowcasting tasks.

Convolutional neural networks (CNN), recurrent neural networks (RNN), and their combination are used to generate future frames with the previous context frames. In general, CNN is employed to capture spatial dependencies, while RNN aims to capture temporal dependencies. However, CNN suffers from inductive bias (i.e., translation invariance and locality), which cannot capture location-variant information (i.e., natural motion and transformation) and fails to extract long-range dependencies. As for RNN, the process of long back-propagation is time-consuming because of its recurrent structure. Therefore, the above drawbacks lack these methods’ operational utility and can not provide skillful precipitation forecasting.

This work proposes a fire-new artificial intelligence model to achieve skillful precipitation forecasting with Typhoons. The satellite Imagery containing precipitation is made into a series of sequences, each containing multiple frames over time. We re-design the traditional CNN-RNN-based architecture that can solve the problem of information loss/forgetting and provide skillful precipitation forecasting. Furthermore, we introduce the generative adversarial strategy and propose a novel random-patch loss function. It ensures that the model can generate high-fidelity precipitation forecasting. In summary, our proposed model simplifies the complex TC precipitation forecasting into a video prediction problem, greatly avoiding many uncertainties in the physical process and facilitating a fully data-driven artificial intelligence paradigm using deep learning and satellite image sequencing for discovering insights for weather forecasting-related sciences.

How to cite: Yang, N. and Li, X.: Typhoon precipitation forecasting based on Satellite Imagery Sequencing and Generative Adversarial Networks, EGU General Assembly 2024, Vienna, Austria, 14–19 Apr 2024, EGU24-7244, https://doi.org/10.5194/egusphere-egu24-7244, 2024.

Black carbon (BC) plays an important role in air quality, public health, and climate, while its long-term variations in emissions and health effect were insufficiently understood for China. Here, we present the spatiotemporal evolution of BC emissions and the associated premature mortality in China during 2000-2020 based on an integrated framework combining satellite observations, a machine learning technique, a “top-down” inversion approach, and an exposure-response model. We found that the “bottom-up” approach likely underestimated BC emissions, particularly in less developed western and remote areas. Pollution controls were estimated to reduce the annual BC emissions by 26% during 2010-2020, reversing the 8% growth during 2000-2010. BC emissions in the main coal-producing provinces declined by 2010 but rebounded afterwards. By contrast, provinces with higher economic and urbanization levels experienced emission growth (0.05-0.10 Mg/km2/yr) by 2010 and declined greatly (0.07-0.23 Mg/km2/yr) during 2010-2020. The national annual BC-associated premature mortality ranged between 733,910 (95% confidence interval: 676,790-800,250) and 937,980 cases (864,510-1,023,400) for different years. The changing BC emissions contributed 78,590 cases (72,520-85,600) growth within 2000-2005 and 133,360 (123,150-145,180) reduction within 2010-2015. Strategies differentiated by region are needed for further reducing BC emissions and its health and climate impacts.

How to cite: Zhao, W. and Zhao, Y.: Long-term Variability in Black Carbon Emissions Constrained by Gap-filled Absorption Aerosol Optical Depth and Associated Premature Mortality in China, EGU General Assembly 2024, Vienna, Austria, 14–19 Apr 2024, EGU24-7393, https://doi.org/10.5194/egusphere-egu24-7393, 2024.

Due to the rapid development of industrialization and substantial economy, China has become one of the global hotspots of nitrogen (N) and sulfur (S) deposition following Europe and the USA. Here, we developed a dataset with full coverage of N and S deposition from 2005 to 2020, with multiple statistical models that combine ground-level observations, chemistry transport simulations, satellite-derived vertical columns, and meteorological and geographic variables. Based on the newly developed random forest method, the multi-year averages of dry deposition of oxidized nitrogen (OXN), reduced nitrogen (RDN) and S in China were estimated at 10.4, 14.4 and 16.7 kg N/S ha−1 yr−1, and the analogous numbers for total deposition were respectively 15.2, 20.2 and 25.9 kg N/S ha−1 yr−1 when wet deposition estimated previously with a a generalized additive model (GAM) was included. The dry to wet deposition ratio (Rdry/wet) of N stabilized in earlier years and then gradually increased especially for RDN, while that of S declined for over ten years and then slightly increased. The RDN to OXN deposition ratio (RRDN/OXN) was estimated to be larger than 1 for the whole research period and clearly larger than that of the USA and Europe, with a continuous decline from 2005 to 2011 and a more prominent rebound afterwards. Compared with the USA and Europe, a more prominent lagging response of OXN and S deposition to precursor emission abatement was found in China. The OXN dry deposition presented a descending gradient from east to west, while the S dry deposition a descending gradient from north to south. After 2012, the OXN and S deposition in eastern China declined faster than the west, attributable to stricter emission controls. Positive correlation was found between regional deposition and emissions, while smaller deposition to emission ratios (D/E) existed in developed eastern China with more intensive human activities.

How to cite: Zhou, K. and Zhao, Y.: Estimating nitrogen and sulfur deposition across China during 2005-2020 based on multiple statistical models, EGU General Assembly 2024, Vienna, Austria, 14–19 Apr 2024, EGU24-7514, https://doi.org/10.5194/egusphere-egu24-7514, 2024.

EGU24-7936 | ECS | Posters on site | AS5.5

Inferring Surface NO2 over Western Europe: A Machine Learning Approach with Uncertainty Quantification 

Wenfu Sun, Frederik Tack, Lieven Clarisse, Rochelle Schneider, Trissevgeni Stavrakou, and Michel Van Roozendael

Nitrogen oxides (NOx = NO + NO2) are of great concern due to their impact on human health and the environment. Machine learning (ML) techniques are increasingly employed for surface NO2 estimation following fast-paced developments in artificial intelligence, computational power, and big data management. However, the uncertainties inherent in these retrievals are critical but are rarely studied in the rapid expansion of ML applications in atmospheric research.

In this study, we have developed a novel ML framework enhanced with uncertainty quantification techniques, named Boosting Ensemble Conformal Quantile Estimator (BEnCQE), to estimate surface NO2 and assess the corresponding uncertainty arising from data. Quantifying such data-induced uncertainty is essential for ML applications as the ML models are data-driven. We apply the BEnCQE model with multi-source data to infer surface NO2 concentrations over Western Europe at the daily scale and 1 km spatial resolution, from May 2018 to December 2021. The space-based cross-validation with in-situ station measurements shows that our model achieves accurate point estimates (r = 0.8, R2 = 0.64, root mean square error = 8.08 ug/m3) and reliable prediction intervals (coverage probability, PI-66%: 66.4%, PI-90%: 90.4%). The model result is also in good agreement with the Copernicus Atmosphere Monitoring Service (CAMS) model output. Furthermore, the quantile estimation strategy used in our model enables us to understand the variations in the predictors’ importance for different NO2 level estimates. Additionally, integrating uncertainty information can uncover potential exceedances of the World Health Organization (WHO) 2021 NO2 limits in some locations, an exceedance risk that point estimates alone may fail to fully capture. Meanwhile, uncertainty quantification, by providing information on the uncertainty of each estimate, allows us to assess the robustness of the model outside of existing in-situ station measurements. The variations in uncertainty suggest that the model's robustness is related to conflicts between seasonal and spatial NO2 patterns influenced by multi-source data. It also reveals challenges in urban and mountainous areas where NO2 is highly variable and heterogeneously distributed.

How to cite: Sun, W., Tack, F., Clarisse, L., Schneider, R., Stavrakou, T., and Van Roozendael, M.: Inferring Surface NO2 over Western Europe: A Machine Learning Approach with Uncertainty Quantification, EGU General Assembly 2024, Vienna, Austria, 14–19 Apr 2024, EGU24-7936, https://doi.org/10.5194/egusphere-egu24-7936, 2024.

EGU24-9208 | Orals | AS5.5

Combined machine learning model of aeolian dust and surface soil moisture 

Klaus Klingmüller, Jodok Arns, Anna Martin, Andrea Pozzer, and Jos Lelieveld

Atmospheric mineral dust has significant impacts on climate, public health, infrastructure and ecosystems. To predict atmospheric dust concentrations and quantify dust sources, we have previously presented a hybrid aeolian dust model using machine learning components and physical equations. In this model, trained with dust aerosol optical depth retrievals from the Infrared Atmospheric Sounding Interferometer on board the MetOp-A satellite and using atmospheric and surface data from the European Centre for Medium-Range Weather Forecasts fifth generation atmospheric reanalysis (ERA5), surface soil moisture is one of the most important predictors of mineral dust emission flux. Here we present the combination of the aeolian dust model with a deep learning model of surface soil moisture. The latter has been trained with satellite retrievals from the European Space Agency's Climate Change Initiative and provides results that are more consistent with these observations than ERA5. The combination of the two models is a step towards a comprehensive hybrid modelling system that complements and improves traditional process-based aeolian dust models.

How to cite: Klingmüller, K., Arns, J., Martin, A., Pozzer, A., and Lelieveld, J.: Combined machine learning model of aeolian dust and surface soil moisture, EGU General Assembly 2024, Vienna, Austria, 14–19 Apr 2024, EGU24-9208, https://doi.org/10.5194/egusphere-egu24-9208, 2024.

North Africa is the world’s largest source region of mineral dust. Mineral dust aerosol itself plays an important role in the climate system, as it is, for example, directly and indirectly influencing radiative transfer and providing nutrients for marine and terrestrial ecosystems. In addition, airborne mineral dust has adverse effects on air quality and public health.

Satellite observations can provide large spatial coverage of dust plumes, which facilitates the study of dust sources, transport pathways, and sinks. Such large spatial coverage can be combined with a high temporal resolution by instruments onboard geostationary satellite. An example of such an instrument is the Spinning Enhanced Visible and InfraRed Imager (SEVIRI) onboard the geostationary Meteosat Second Generation satellites (MSG). The full spatial extent of dust plumes in SEVIRI observations is frequently obscured by clouds. To overcome this limitation, we propose the use of machine-learning-based image in-painting techniques.

Machine-learning-based image in-painting techniques can restore damaged images of structures like buildings, cars, landscapes, insects or human faces by learning the typical patterns of these structures. Image in-painting algorithms have in recent years been successfully adapted to reconstruct missing geophysical data. In this study, we use an off-the-shelf implementation of an image in-painting algorithm and developed a method for applying it to satellite-observed dust plumes. The algorithm is trained on reanalysis fields of the dust aerosol optical thickness combined with temporally corresponding cloud masks obtained from MSG-SEVIRI. In a next step we use this trained algorithm to restore the full spatial extent of dust plumes on grey-scaled images of North African dust plumes during 2021 and 2022, derived from the SEVIRI Dust RGB product. We test the reconstructed dust plumes against independent data, derived from dust forecasts provided by the WMO Barcelona Dust Regional Center. Our reconstructions spatially and temporally agree well with output from the forecast model ensemble. The proposed method is adaptable to other satellite products in the future, including products from the Meteosat Third Generation Flexible Combined Imager (MTG-FCI).

Reference

Kanngießer and Fiedler, 2024, “Seeing” beneath the clouds - machine-learning-based reconstruction of North African dust plumes, AGU Advances, In Press.

How to cite: Kanngießer, F. and Fiedler, S.: Reconstructing the spatial patterns of dust plumes in geostationary satellite images over North Africa using in-painting techniques, EGU General Assembly 2024, Vienna, Austria, 14–19 Apr 2024, EGU24-9450, https://doi.org/10.5194/egusphere-egu24-9450, 2024.

EGU24-9820 | ECS | Posters on site | AS5.5

Advancing Atmospheric Retrieval: A Rapid Physics-Informed Data-Driven Approach using FORUM Simulated Measurements 

Cristina Sgattoni, Matthias Chung, and Luca Sgheri

FORUM (Far-infrared Outgoing Radiation Understanding and Monitoring) represents the ninth Earth Explorer mission chosen by the European Space Agency (ESA) in 2019. This satellite mission focuses on delivering interferometric measurements within the Far-InfraRed (FIR) spectrum, constituting approximately 50% of the Earth's longwave flux emitted into space. Enhanced accuracy in measuring the Top Of the Atmosphere (TOA) spectrum in the FIR is crucial for minimizing uncertainties in climate models. However, current instruments fall short, necessitating the incorporation of innovative computational techniques. The mission aims to refine understanding across various atmospheric variables, including tropospheric water vapor, ice cloud properties, and notably, surface emissivity in the FIR.
During the mission's early development, an End-to-End Simulator (E2ES) was devised to showcase proof-of-concept and assess the impact of instrument characteristics and scene conditions on the accuracy of reconstructed atmospheric properties. This simulator comprises a sequence of modules simulating the entire measurement acquisition process, accounting for all major sources of discrepancies in operational conditions leading to the retrieval of geophysical quantities.
From a mathematical perspective, two challenges arise: the radiative transfer equation, known as the direct problem, and its inversion, referred to as the retrieval problem. Both problems can be addressed through a full physics method, particularly applying the Optimal Estimation (OE) approach—a specialized Tikhonov regularization scheme based on Bayesian formulation. However, the computational demands of a full physics method hinder Near Real-Time (NRT) data analysis. Faster models become imperative for next-generation satellites measuring hundreds of spectra per minute and climatology models simulating years of global-scale radiative transfer.
To expedite solutions for both problems, a hybrid approach is employed, combining an a priori regularized data-driven method utilizing the Moore-Penrose pseudoinverse and a neural network approach.


How to cite: Sgattoni, C., Chung, M., and Sgheri, L.: Advancing Atmospheric Retrieval: A Rapid Physics-Informed Data-Driven Approach using FORUM Simulated Measurements, EGU General Assembly 2024, Vienna, Austria, 14–19 Apr 2024, EGU24-9820, https://doi.org/10.5194/egusphere-egu24-9820, 2024.

EGU24-10670 | ECS | Posters on site | AS5.5

Tracking changes in the emission strengths of source-specific aerosols by coupling a receptor model with machine learning 

Qili Dai, Tianjiao Dai, Xiaohui Bi, Jianhui Wu, Yufen Zhang, and Yinchang Feng

Reducing aerosol mass loading requires targeted control of emissions from anthropogenic sources. Accurately tracking the changes in emission strengths of specific aerosol sources is vital for assessing the effectiveness of regulatory policies. However, this task is challenging due to meteorological influences and the presence of multiple co-existing emissions. Using multi-year data on ambient black carbon (BC) and PM2.5 from Tianjin, China, as a case study, we employed a data-driven approach that integrates a dispersion-normalized factor analysis receptor model with a machine learning technique for meteorological normalization. This approach enabled us to differentiate between the emission sources of BC and PM2.5 and their meteorological impacts. The source-specific aerosol exhibited abrupt changes in response to human-made interventions, such as those during COVID-19 and holiday periods, after accounting for weather-related variables. Notably, significant reductions were observed in emissions from coal combustion, vehicles, dust, and biomass burning over years, affirming the effectiveness of policies such as clean winter heating initiatives and the support for the Clean Air Actions. This coupled approach holds significant promise for advancing air quality accountability studies.

How to cite: Dai, Q., Dai, T., Bi, X., Wu, J., Zhang, Y., and Feng, Y.: Tracking changes in the emission strengths of source-specific aerosols by coupling a receptor model with machine learning, EGU General Assembly 2024, Vienna, Austria, 14–19 Apr 2024, EGU24-10670, https://doi.org/10.5194/egusphere-egu24-10670, 2024.

EGU24-11071 | ECS | Orals | AS5.5

Using Machine Learning for Post-Simulation Diagnostics of Microphysical Process Rates with the ICON Model 

Miriam Simm, Corinna Hoose, and Uğur Çayoğlu

Clouds play an important role in the hydrological cycle and significantly affect the Earth's radiative budget. Cloud microphysics describes the formation and interaction of individual cloud and precipitation particles. Its representation in numerical weather prediction and climate models remains challenging. Due to their sub-scale nature, microphysical processes need to be represented by parametrization schemes, which often rely on simplifying assumptions. Furthermore, the large number and variety of cloud particles and numerous nonlinear interactions thereof render cloud microphysics extremely complex. Many of its aspects are poorly understood, and a comprehensive theoretical description does not yet exist.

Detailed information about microphysical process rates is essential in order to establish a profound understanding of the microphysical pathways, feedback loops and aerosol-cloud interactions. In the ICON model, cloud microphysics is often parametrized with the two-moment scheme, developed by Seifert and Beheng (2006),  with six hydrometeor categories. However, due to the high number of processes, including the microphysical process rates in the model output results in approximately 20-50 additional three-dimensional output variables. If this output is generated in every time step of the model, this quickly requires immense storage capacities.

Machine learning (ML) opens the possibility of generating on-demand offline diagnostics based on standard output variables as an alternative approach. Based on the two-moment bulk microphysics scheme, we trained a neural network to emulate the calculation of the process rates in the ICON model for warm-rain formation, reproducing earlier results of Seifert and Rasp (2020). As input, we use cloud and atmospheric state variables. We conducted simulations with the ICON model in a global configuration with 13 km grid spacing in order to generate training and validation datasets. In the initial stage of model development, this resolution seems sufficient, however, we plan on using a smaller grid spacing in a limited-area configuration to improve the accuracy of our results. We performed analyses using Mutual Information to unveil the dependencies between model variables and process rates and chose the predictors of the model accordingly. We compare different sets of predictors and activation functions in order to improve the model's predictiveness. Furthermore, we discuss the possibility of constructing a similar model for processes in mixed-phase and ice clouds.

How to cite: Simm, M., Hoose, C., and Çayoğlu, U.: Using Machine Learning for Post-Simulation Diagnostics of Microphysical Process Rates with the ICON Model, EGU General Assembly 2024, Vienna, Austria, 14–19 Apr 2024, EGU24-11071, https://doi.org/10.5194/egusphere-egu24-11071, 2024.

EGU24-11381 | Orals | AS5.5 | Highlight

GraphCast: Learning skillful medium-range global weather forecasting 

Alvaro Sanchez-Gonzalez and the GraphCast team from Google DeepMind

Global medium-range weather forecasting is critical to decision-making across many social and economic domains. Traditional numerical weather prediction uses increased compute resources to improve forecast accuracy but does not directly use historical weather data to improve the underlying model. In this talk we will be presenting GraphCast, a machine learning–based method trained directly from reanalysis data. It predicts hundreds of weather variables for the next 10 days at 0.25° resolution globally in under 1 minute. We compare GraphCast to the most accurate operational deterministic system (HRES) and show how its forecasts produce state of the art metrics, and support better severe event prediction, including tropical cyclone tracking, atmospheric rivers, and extreme temperatures. We also show how the approach can be extended to probabilistic forecasting to materialize similar improvements against ENS, a top operational ensemble forecast. These models are key advances in accurate and efficient weather forecasting and help realize the promise of machine learning for modeling complex dynamical systems.

How to cite: Sanchez-Gonzalez, A. and the GraphCast team from Google DeepMind: GraphCast: Learning skillful medium-range global weather forecasting, EGU General Assembly 2024, Vienna, Austria, 14–19 Apr 2024, EGU24-11381, https://doi.org/10.5194/egusphere-egu24-11381, 2024.

EGU24-11707 | Orals | AS5.5

Machine learning weather prediction model development for global ensemble forecasts at NCEP 

Jun Wang, Sadegh Tabas, Fanglin Yang, Jason Levit, Ivanka Stajner, Raffaele Montuoro, Vijay Tallapragada, and Brian Gross

Data driven machine learning-based weather prediction (MLWP) models have been under rapid development in recent years. These models leverage autoregressive neural network architectures and are trained using reanalysis data generated by operational centers, demonstrating proficient forecasting abilities. One remarkable advantage of these MLWP models is that, once trained, they take significantly less amount of computational resources to produce forecasts compared to traditional numerical weather prediction (NWP) models while maintaining or surpassing the NWP performance. 

NCEP has started machine learning development collaborating with the research community for several years.  This presentation will provide an overview of the development of MLWP models for the global ensemble forecast system at NCEP Environment Modeling Center (EMC). The model adopts state-of-the-art MLWP models such as GraphCast and leverages the methodologies from FuXi global ensemble system. The development includes developing cascade MLWP models, training the model with GEFSv12 reanalysis data and producing forecasts with the operational GEFSv12 initial states. The model will be validated using two years of GEFSv12 operational forecast data. The ultimate objective is to deliver 15-day forecasts with skill levels comparable to the operational GEFSv12.

How to cite: Wang, J., Tabas, S., Yang, F., Levit, J., Stajner, I., Montuoro, R., Tallapragada, V., and Gross, B.: Machine learning weather prediction model development for global ensemble forecasts at NCEP, EGU General Assembly 2024, Vienna, Austria, 14–19 Apr 2024, EGU24-11707, https://doi.org/10.5194/egusphere-egu24-11707, 2024.

EGU24-12205 | Orals | AS5.5

Uncertainty Quantification for Deep Learning 

Peter Jan van Leeuwen, J. Christine Chiu, and C. Kevin Yang

Many processes in the geosciences are highly complex and computationally challenging or  not well known. In those cases, Machine Learning, especially Deep Learning, is becoming increasingly popular to either replace expensive numerical models or parts of those models, or to describe relations between variables where the underlying equations are unknown. Despite many successful applications, the uptake of Deep Learning in science has been slow because proper uncertainty estimates are lacking, while these are crucial for comparison studies, forecasting, and risk management.

Deep Learning can be considered as a method that provides a nonlinear map between an input vector “x” and an output vector “z”. The nonlinear map contains a large weight vector “w,” determined via optimization using training, validation, and testing dataset. To quantify the uncertainty in the output “z”, we need to take into account uncertainty in 1) the input “x”, 2) the weight vector “w”, and 3) the nonlinear map from input to output. Furthermore, the uncertainty in the weight vector depends on uncertainties in the training and testing dataset. Present-day Deep Learning methods such as Bagging, MC Drop-out, and Deep Ensembles ignore most of these uncertainty sources, or apply them incorrectly, resulting in an incorrect uncertainty estimate.

In this presentation, we will, for the first time, take all uncertainty sources into account and provide an efficient methodology to generate output uncertainty estimates. Interestingly, by taking uncertainty in input training data into account, we show that the uncertainty quantification becomes more robust to outliers as it is a systematic and well-defined way to implicitly increase the training dataset. We then demonstrate an application for predicting cloud process rates from a deep neural net and provide a physical interpretation of the resulting uncertainty estimates.

How to cite: van Leeuwen, P. J., Chiu, J. C., and Yang, C. K.: Uncertainty Quantification for Deep Learning, EGU General Assembly 2024, Vienna, Austria, 14–19 Apr 2024, EGU24-12205, https://doi.org/10.5194/egusphere-egu24-12205, 2024.

EGU24-13317 | Posters virtual | AS5.5

Potential-vorticity regimes over the Eastern Mediterranean and their relation to local boundary layer profiles 

Sigalit Berkovic, Ronit Schloss, and Shira Raveh-Rubin

The occurrence and passage of synoptic-scale systems modulate the local boundary-layer (BL) profile. In the Eastern Mediterranean (EM), a detailed clustering of the winter profiles over Beit-Dagan, at the Israeli central coastal plain, showed direct links to winter highs, lows and Red Sea troughs and further enabled the identification of the active RST, a longstanding challenge to objectively identify.

Since high resolution radiosondes profile data at Beit Dagan is available for the recent 20 years, and sometimes suffers lack of data, its application as synoptic tool is limited. Objective synoptic classification during longer periods is needed.

Our research  investigates the synoptic regimes according to upper tropospheric PV during the winter months (DJF 2011-2021). We utilize the self-organizing map (SOM) clustering method and the ERA5 reanalysis data to achieve this aim. Various domains, SOM parameters, quantization and topographical errors, standard deviations of each SOM class, and gradual size of maps were tuned and inspected respectively to select the final map. The synoptic regimes are later related to the boundary layer profile variability. The relation between the PV classes and the variability of the BL profile is found according to the frequencies of the PV classes under each BL profile class.

The ageostrophic balance next to the surface effect the BL profile. To include this important factor, extended synoptic classification, according to multi variable clustering of PV and 1000 hPa geopotential height (gph) was devised. SOM training and projection on the BL profile classes were accordingly preformed.

SOM clustering of 320K isentropic surface potential vorticity (PV) data presented 4X4 classes. Two PV classes relate to high PV (> 2 PVU) over the EM: the first presents wide northerly trough and the second a thinner trough with a north-easterly axis towards Israel due to anticyclonic shear. Most of the other classes present low PV values (< 2 PVU) over the EM relating to southerly wide ridge or anticyclonic wave breaking propagating to the east of the EM. Strong or weak PV activity over the EM is related to some of the BL profile classes (few classes with relatively high frequency (> 20%)). Under mild PV activity which is related to mild surface pressure gradients, no strong relation is found.

Multi-variable SOM clustering of gph and PV presented 4X5 classes which follow the variability of surface winter lows, highs and active Red Sea troughs. The active Red Sea trough relates to the north easterly relatively narrow PV stream. The main PV classes of the 4X4 single variable SOM classification resemble those of the combined (PV + gph) classification. The multi-variable clustering somewhat improves the indication of the BL profile classes. Better indication between BL profile pattern and strong winter highs is obtained.

This work suggests a new approach to inspect the co variability of synoptic regimes over the EM with various meteorological variables (beyond the BL profile) including examination of trends and persistence of each synoptic regime.

How to cite: Berkovic, S., Schloss, R., and Raveh-Rubin, S.: Potential-vorticity regimes over the Eastern Mediterranean and their relation to local boundary layer profiles, EGU General Assembly 2024, Vienna, Austria, 14–19 Apr 2024, EGU24-13317, https://doi.org/10.5194/egusphere-egu24-13317, 2024.

EGU24-13882 | ECS | Orals | AS5.5

Physics-Informed Diffusion Model and Sampling for Global Weather Forecasting 

Sanghoon Choi and David Topping

Recent advancements in weather forecasting have shown that generative probabilistic models, particularly diffusion models, exhibit significant promise in spatiotemporal forecasting. These models demonstrate enhanced accuracy, surpassing both machine learning-based deterministic models and traditional Numerical Weather Prediction (NWP) models, especially in short-range forecasting. However, a key challenge in utilising diffusion models for long lead time predictions is the increased variance in samples, which complicates the identification of the most accurate predictions. Specifically, ensemble means from samples at longer lead times often lack the necessary granularity to provide detailed and accurate predictions. This study addresses these challenges by introducing a novel approach: a physics-informed diffusion model coupled with physics-based sampling strategies. We incorporate physical information into the diffusion model as guiding constraints, and apply additional knowledge-based control to reduce the diversity in predictions, aiming for more consistent and reliable forecasts. The effectiveness of various types of physical information and the methods used to integrate this physics into the diffusion model are evaluated on WeatherBench2. Furthermore, we propose a unique physics-based sampling technique that utilises conservation laws. This methodology is designed to enable the selection of predictions that are most consistent with physical principles, potentially enhancing the model's capability in accurately forecasting extreme weather events. By integrating physical laws and principles into both the diffusion model and the sampling process, this approach aims to improve the overall accuracy and reliability of long-range weather predictions. The combination of physics-informed modelling and physics-based sampling offers a new strategy in generative model for weather forecasting.

How to cite: Choi, S. and Topping, D.: Physics-Informed Diffusion Model and Sampling for Global Weather Forecasting, EGU General Assembly 2024, Vienna, Austria, 14–19 Apr 2024, EGU24-13882, https://doi.org/10.5194/egusphere-egu24-13882, 2024.

EGU24-13925 | Orals | AS5.5 | Highlight

Zero-shot learning of aerosol optical properties with graph neural networks 

Kara Lamb and Pierre Gentine

Black carbon (BC), a strongly absorbing aerosol sourced from combustion, is an important short-lived climate forcer. BC’s complex morphology contributes to uncertainty in its direct climate radiative effects, as current methods to accurately calculate the optical properties of these aerosols are too computationally expensive to be used online in models or for observational retrievals. Here we demonstrate that a Graph Neural Network (GNN) trained to predict the optical properties of numerically-generated BC fractal aggregates can accurately generalize to arbitrarily shaped particles, including much larger (10x) aggregates than in the training dataset. This zero-shot learning approach could be used to estimate single particle optical properties of realistically-shaped aerosol and cloud particles for inclusion in radiative transfer codes for atmospheric models and remote sensing inversions. In addition, GNN’s can be used to gain physical intuition on the relationship between small-scale interactions (here of the spheres’ positions and interactions) and large-scale properties (here of the radiative properties of aerosols).

How to cite: Lamb, K. and Gentine, P.: Zero-shot learning of aerosol optical properties with graph neural networks, EGU General Assembly 2024, Vienna, Austria, 14–19 Apr 2024, EGU24-13925, https://doi.org/10.5194/egusphere-egu24-13925, 2024.

The atmosphere is governed by laws of atmospheric physics and chemistry. For decades even centuries, these laws are represented by differential equations, usually solved numerically for the scale defined by model grid cells. However, this representation paradigm reaches its limits when the underlying physics or chemistry is too complex or even unknown, especially when considering the multiscale nature of the atmosphere. In our data era these laws are stored in immense datasets of various observations and numerical simulations, while artificial intelligence techniques can retrieve them from data albeit often with limited physical interpretations. Hybrid modeling [1] can thus balance the physical modeling and the data-driven modeling for a more comprehensive representation of the atmosphere. By representation learning, the multiscale features of the atmosphere can be learnt and encoded in the weights of connected neurons in the deep networks of multiple layers, as is fundamentally different from the traditional atmospheric representation using formulae and equations. Here we elaborate this new deep learning-based representation paradigm with two demonstrating cases. In the first case [2], we reveal a multiscale representation of the convective atmosphere by reconstructing the radar echoes from the Weather Research and Forecasting (WRF) model simulations and the Himawari-8 satellite products using U-Net deep networks. We then diagnose the physical interpretations of the learnt representation with a sensitivity analysis method. We find stratified features with small-scale patterns such as echo intensities sensitive to the WRF-simulated dynamic and thermodynamic variables and with larger-scale information about shapes and locations mainly captured from satellite images. Such explainable representation of the convective atmosphere would inspire innovative data assimilation methods and hybrid models that could overcome the conventional limits of nowcasting. In the second case [3], we employ deep convolutional neural networks (CNN) to represent the errors associated with fine particulate matter (PM2.5) forecasts of a chemistry-transport model (CTM), the Nested Air Quality Prediction Modeling System (NAQPMS), within 240-hour lead times across 180 monitoring sites in the Yangtze River Delta (YRD) region of China. The learnt multiscale error representation reduces the PM2.5 forecasts’ root mean square error (RMSE) by 16.3-34.2% on test cases in 2017-2018. We then probe the physical interpretation of the multiscale error representation using the deep learning important features (DeepLIFT) interpretability method. We quantify the significant contribution from sulfur dioxide (SO2, 31.3%) and ozone (29.4%), which are comparable to PM2.5 (31.1%) and about three times higher than nitrogen dioxide (8.2%). Such interpretations would suggest that improvements are needed in formulating the SO2-sensitive pollution in the ammonia-poor YRD region. We consider our representation studies as a step towards more comprehensive atmospheric hybrid models that take advantage of the mighty artificial intelligence technologies but are at the same time physically explainable.

[1] Liao, Q., Zhu, M., Wu, L. et al. 2020. https://doi.org/10.1007/s40726-020-00159-z

[2] Zhu, M., Liao, Q., Wu, L. et al. 2023. https://doi.org/10.3390/rs15143466

[3] Zhu, M., Liao, Q., Wu, L. et al. 2024. In submission.

How to cite: Zhu, M., Wu, L., Su, H., and Wang, Z.: Representing the atmosphere using deep learning techniques: applications in radar echo data reconstruction and PM2.5 forecast error reduction, EGU General Assembly 2024, Vienna, Austria, 14–19 Apr 2024, EGU24-13977, https://doi.org/10.5194/egusphere-egu24-13977, 2024.

EGU24-14260 | Posters on site | AS5.5

Understanding cloud structures with machine learning- An algorithm to represent sub-grid scale variability in stratocumulus clouds  

Nithin Allwayin, Michael Larsen, Alexander Shaw, Kamal Kant Chandrakar, Susanne Glienke, and Raymond Shaw

Changes to low-level cloud properties and their associated feedback in a warming climate are a significant source of uncertainty in global climate models (GCMs). “Local’’ processes at the droplet scales, such as drizzle growth by collision-coalescence, are not well represented in GCMs and constitute a significant uncertainty in model predictions. Parameterization schemes often derived from empirical fits to spatially averaged cloud size distributions have been used to represent clouds and hence do not fully account for the subgrid-scale variabilities. We hypothesize that inhomogeneities in cloud microphysical properties may be captured by a small number of distinct droplet size distributions called “characteristic distributions” and developed an algorithm capable of retrieving them.

To do this, we developed an algorithm by combining hypothesis testing with a machine-learning clustering algorithm. The test does not presume any specific distribution shape, is parameter-free, and avoids biases from binning. Importantly, for the clustering algorithm, the number of clusters is not an input parameter but is independently determined in an unsupervised fashion. As implemented, it works on an abstract space from the hypothesis test results, and hence spatial correlation is not fundamental for members classified to a characteristic distribution. To validate the algorithm's robustness, we test it on a synthetic dataset that mimics cloud drop distributions. The algorithm successfully identifies the predefined distributions at plausible noise levels.

When implemented on cm-scale cloud samples taken using Holographic Detector for Clouds (HOLODEC) deployed during Aerosol and Cloud Experiments in the Eastern North Atlantic (ACE-ENA), the algorithm reveals that local characteristic distribution types are ubiquitous in stratocumulus clouds. These distribution types are generally narrow with distinct modes and do not resemble the averaged size distribution shape. Each characteristic distribution represents identical-looking local cloud volumes which tend to occur in spatial blocks of varying extent, usually of order 1s to 10s of km. These observations have implications for understanding small-scale cloud properties and can guide the development of novel parameterizations of sub-grid-scale variability for coarse-resolution models. Subsequently, we show the first results from an investigation of characteristic distributions for LESs. The algorithm is general and helps in finding similarities in data representable as CDFs and is expected to have broader applicability in earth sciences.

How to cite: Allwayin, N., Larsen, M., Shaw, A., Chandrakar, K. K., Glienke, S., and Shaw, R.: Understanding cloud structures with machine learning- An algorithm to represent sub-grid scale variability in stratocumulus clouds , EGU General Assembly 2024, Vienna, Austria, 14–19 Apr 2024, EGU24-14260, https://doi.org/10.5194/egusphere-egu24-14260, 2024.

EGU24-15297 | ECS | Posters on site | AS5.5

Identification and description of fire emission plumes from Sentinel-5p observations    

Daniel Kinalczyk, Matthias Forkel, and Jos de Laat

Understanding the dynamics and characteristics of emission plumes from wildfires is of paramount importance for environmental monitoring and policy decisions. These plumes, composed of various greenhouse gases and pollutants, can have far-reaching consequences on global climate, air quality and health. In this study, a data-driven approach to detect and characterise emission plumes from wildfires utilising TROPOMI (Tropospheric Monitoring Instrument) of the Sentinel-5p satellite observations of nitrogen oxides (NOx), carbon monoxide (CO) and aerosols. The analysis leverages VIIRS active fire data to identify locations of fire occurrence, laying the foundation for plume detection. The primary hypothesis states that a plume image consists of three components: a plume body or core, a transitional zone from plume to clear sky, and the clear sky itself. To realise this hypothesis, a data-driven unsupervised algorithm to identify and map plumes is developed, which is based on kernel functions to pre-process the Sentinel-5p images. These kernels effectively highlight plume-related features, allowing for more precise delineation. Subsequently, Gaussian Mixture Models (GMM) are utilised to classify the images into three components of the plume according to the main hypothesis. In instances where multiple plume candidates exist, a Gaussian distance weighting function to identify the likeliest plume is employed. Furthermore, the mapping of the plume-clean air transition zones is further evaluated by employing Monte Carlo simulations to validate and refine the transition zone assessments. To verify the detections, plumes of methane (CH4), carbon monoxide (CO), formaldehyde (HCHO), nitrogen dioxide (NO2) and aerosols for several plumes over the Amazon and Alberta are extracted and the plume properties are related to different landcover types. The findings of this study provide valuable insights into the development of an advanced methodology for plume detection, which has broad implications for the understanding and monitoring of fire emissions and atmospheric research.

How to cite: Kinalczyk, D., Forkel, M., and de Laat, J.: Identification and description of fire emission plumes from Sentinel-5p observations   , EGU General Assembly 2024, Vienna, Austria, 14–19 Apr 2024, EGU24-15297, https://doi.org/10.5194/egusphere-egu24-15297, 2024.

EGU24-15874 | Orals | AS5.5 | Highlight

Deep learning and Process Understanding for Data-Driven Earth System Science 

Markus Reichstein, Zavud Baghirov, Martin Jung, and Basil Kraft

For a better understanding of the Earth system we need a stronger integration of observations and (mechanistic) models. Classical model-data integration approaches start with a model structure and try to estimate states or parameters via data assimilation and inverse modelling, respectively. Sometimes, several model structures are employed and evaluated, e.g. in Bayesian model averaging, but still parametric model structures are assumed. Recently, Reichstein et al. (2019) proposed a fusion of machine learning and mechanistic modelling approaches into so-called hybrid modelling. Ideally, this combines scientific consistency with the versatility of data driven approaches and is expected to allow for better predictions and better understanding of the system, e.g. by inferring unobserved variables. In this talk we will introduce this concept and illustrate its promise with examples on biosphere-atmosphere exchange, and carbon and water cycles from the ecosystem to the global scale.

Reichstein, M., G. Camps-Valls, B. Stevens, M. Jung, J. Denzler, N. Carvalhais, and Prabhat. "Deep Learning and Process Understanding for Data-Driven Earth System Science." Nature 566, no. 7743 (2019): 195-204. https://doi.org/10.1038/s41586-019-0912-1.

How to cite: Reichstein, M., Baghirov, Z., Jung, M., and Kraft, B.: Deep learning and Process Understanding for Data-Driven Earth System Science, EGU General Assembly 2024, Vienna, Austria, 14–19 Apr 2024, EGU24-15874, https://doi.org/10.5194/egusphere-egu24-15874, 2024.

EGU24-17782 | ECS | Posters on site | AS5.5

Variability among Machine Learning Explanations for Precipitation Forecasting in Köppen Climate Zones 

Ali Ulvi Galip Senocak, Sinan Kalkan, M. Tugrul Yilmaz, Ismail Yucel, and Muhammad Amjad

A plethora of studies have used machine learning for quantitative precipitation forecasting. However, only a fraction of those studies have focused on the explainability of the utilized machine learning models. Consequently, to the best of the authors' knowledge, the variability in explainability concerning predictor clusters (i.e., grouped predictor categories based on shared attributes such as climate categories) has not received attention in the literature.

This study aims to address this gap by analyzing variability in explanations at the model level regarding different Köppen Climate Zones (i.e., arid, temperate, and continental climates). To this end, Türkiye is selected as the study area, which has a complex topography and omnigenous in climate types. The utilized dataset covers 687 stations spanning 10 different climate zones (clustered into B, C, and D Köppen climate zones) and more than one million rows covering four years as temporal coverage. While the ground truth is defined as the daily observed precipitation amount, the predictors consist of daily total precipitation forecasts of numerical weather prediction models (ECMWF, GFS, ALARO, and WRF) with a 24-hour lead time, geographical parameters (elevation, roughness, slope, aspect, distance to the sea, latitude and longitude), and seasonality (day of the year, and month). The study uses a multi-layer perceptron (Root Mean Squared Error = 3.6 mm/day),  as the machine learning method with two hidden layers (with Gaussian Error Linear Unit non-linearity). It utilizes Huber-Loss (delta = 1.5) as the loss function to mitigate the adverse effects of the long-tailed dataset. A Linear Interpretable Mogel Agnostic (LIME) approach is utilized to explain the predictions by MLP. Topographical, coordinate-based, and seasonality predictors are grouped except for the distance to the sea.

The importance assessments of predictors are compared with drop-out loss, which quantifies the decline in model performance that occurs when a predictor is removed, showing the relevance of the predictors to the predictions of models. Analysis results indicate that the ECMWF forecasts are the most important predictor for the model for all three climate types, with a drop-out loss value of 0.531 for arid (B) climate zones, 1.617 for temperate (C) climate zones, and 0.901 for continental (D) climate zones. Seasonality is more utilized for generating the predictions for continental climate zones (0.05 vs 0.02 for both arid and temperate zones). Another noteworthy result is that the distance to the sea predictor negatively affects the model over arid zones (-0.03) while positively contributing to both continental (0.013) and temperate zones (0.102). Moreover, the drop-out loss for distance to the sea (0.102) exceeds the WRF forecast's (0.076) over temperate climate zones. This might be related to the average distance to the sea (0.99 degrees over temperate, 1.66 over arid, and 1.72 over continental zones). Similarly, topographical parameters have a positive effect over arid (0.003) and continental zones (0.014) while having a negative effect over temperate (-0.012) zones. These results indicate that both multi-model machine learning designs can be beneficial for complex datasets, and the influence of parameters can vary over different input clusters.

How to cite: Senocak, A. U. G., Kalkan, S., Yilmaz, M. T., Yucel, I., and Amjad, M.: Variability among Machine Learning Explanations for Precipitation Forecasting in Köppen Climate Zones, EGU General Assembly 2024, Vienna, Austria, 14–19 Apr 2024, EGU24-17782, https://doi.org/10.5194/egusphere-egu24-17782, 2024.

EGU24-18552 | ECS | Posters on site | AS5.5

A novel automated framework to design optimal networks of atmospheric greenhouse gas stations 

David Matajira-Rueda, Robert Maiwald, Charbel Abdallah, Sanam Vardag, Andre Butz, and Thomas Lauvaux

This research proposes an optimal design framework for a mesoscale atmospheric greenhouse gas network dedicated to inverse flux monitoring at urban, regional, or national scales.

The framework’s design is based on data processing of atmospheric concentrations using multiple machine learning techniques such as image processing and pattern recognition, among others, all of them powered by optimization algorithms, giving the solution process explorative and exploitative features over the problem search space. 

Besides, the data processing uses graph representation as it considers a discrete search space, which in turn allows for speeding up the information access in each stage, especially during the inverse analysis procedure.

All of the above is framed with a learning system whose purpose is automatizing the processing when combining diverse data sources by mixing the supervised and unsupervised learning types in pre- and post-processing, respectively. 

On the one hand, the problem is related to the design of a monitoring network of greenhouse gases, in which it is required to decide the locations of a specific number of towers according to their measurement influence region, hence minimizing the number of towers while guaranteeing the appropriate parameter estimation.

On the other hand, the solution strategy conducts a data analysis, where observed and fitted data are treated as spatial-temporal images. During the batch processing, these images are filtered, contrasted, binarized, classified, and clustered, among other operations to maximize the data analysis.

Performance tests were based on reference datasets from the Weather Research and Forecasting model (here hourly simulated concentrations at 3 kilometers resolution over eastern France) as well as other synthetically and randomly generated concentration fields, which allowed for comparison of the proposed algorithm processing.

According to the parametric and non-parametric tests used to evaluate the scheme, our framework is competitively capable of designing optimal monitoring networks by using data processing and high-performance computing.

How to cite: Matajira-Rueda, D., Maiwald, R., Abdallah, C., Vardag, S., Butz, A., and Lauvaux, T.: A novel automated framework to design optimal networks of atmospheric greenhouse gas stations, EGU General Assembly 2024, Vienna, Austria, 14–19 Apr 2024, EGU24-18552, https://doi.org/10.5194/egusphere-egu24-18552, 2024.

EGU24-20404 | ECS | Posters on site | AS5.5 | Highlight

Automatic cloud detection in GHGSat satellite imagery 

Jake Wilson, Joshua Sampson, Marianne Girard, Kareem Hammami, Dylan Jervis, Jason McKeever, Antoine Ramier, and Zoya Qudsi

GHGSat operates a constellation of satellites that detect and quantify methane and carbon dioxide emissions from industrial facilities across the globe. With twelve satellites in orbit, each making around fifty observations per day, automatic data processing is required.  

A key step in the automation process is the detection of clouds. Identifying pixels that contain clouds or cloud shadow can improve the retrieval quality of cloudy observations and make it easier to detect greenhouse gas emissions.  

In this presentation, we discuss the ML/AI techniques used to detect and segment clouds in GHGSat imagery. We highlight some of the challenges encountered during the creation of training datasets and model training. A first guess at cloud masks is obtained with an unsupervised clustering approach to group pixels of similar intensity. Then, using a dataset of 1000 human-annotated observations, we compare the performance of U-NET and Mask2Former models trained for cloud segmentation. We discuss how the monitoring of training loss can help to identify problematic examples. Finally, we investigate the creation of cloud shadow masks using geometrical projections of the cloud masks, where cloud height is estimated through an intensity-based optimisation. 

How to cite: Wilson, J., Sampson, J., Girard, M., Hammami, K., Jervis, D., McKeever, J., Ramier, A., and Qudsi, Z.: Automatic cloud detection in GHGSat satellite imagery, EGU General Assembly 2024, Vienna, Austria, 14–19 Apr 2024, EGU24-20404, https://doi.org/10.5194/egusphere-egu24-20404, 2024.

EGU24-20726 | ECS | Orals | AS5.5

Machine Learning Based Closure Optimization for the Unified Convection Parametrization  

Janaina Nascimento, Alessandro Banducci, Haiqin Li, and Georg Grell

The EMC Unified Convection (UC) parameterization combines the Simplified Arakawa Schubert (SAS) and Grell-Freitas (GF) convective parameterizations in order to improve performance on regional and global scales. The UC parameterization uses the average of an ensemble of closures to determine the strength and location of convection. Deficiencies in optimizing the selection of these closures, used in deep convection parameterizations in General Circulation Models (GCMs), at different scales and in changing environmental conditions have critical impacts on climate simulations. Some closures may produce more accurate output in particular environmental conditions but currently the GF parametrization takes a uniform average over all closures. This work uses Machine learning (ML) methods combined with satellite and global model datasets in order to weight the closure average based on location and meteorological conditions. First dimensionality reduction techniques are applied in order to define a set of conditions where certain groups of closures tend to perform better. From these groups a weight vector is generated from the relative error each closure demonstrates compared with observations. A decision tree is then responsible for deciding which weight vectors are best in particular environmental situations. One advantage of this approach is that it is explainable; a human expert familiar with the behaviors of the closures (the conditions where they perform best/worst, etc.) can determine why the decision tree chose the particular weight vector.

How to cite: Nascimento, J., Banducci, A., Li, H., and Grell, G.: Machine Learning Based Closure Optimization for the Unified Convection Parametrization , EGU General Assembly 2024, Vienna, Austria, 14–19 Apr 2024, EGU24-20726, https://doi.org/10.5194/egusphere-egu24-20726, 2024.

EGU24-21203 | ECS | Posters on site | AS5.5

Application of Three Machine Learning Models for a Severe Ozone Episode in Mexico City  

Mateen Ahmad, Bernhard Rappenglück, Olabosipo O. Osibanjo, and Armando Retama

Mexico City due to its specific topography and strong ozone precursors emissions often faces high surface ozone concentrations which negatively impact the dwellers and the environment of Mexico City. This necessitates developing models with the capacity to rank meteorological and air quality variables contributing to the build-up of ozone during an ozone episode in Mexico City. Such ranking is crucial for regulatory procedures aiming at reducing ozone detrimental effects during an ozone episode. In this study, three machine learning models (Random Forest, Gradient Boosting Tree, feedforward neural network) are used to learn a prediction function that reveals the functional dependence of ozone on its predictors and can predict hourly ozone concentrations using hourly data of eight predictors (nitric oxide, nitrogen dioxide, shortwave ultraviolet-A radiation, wind direction, wind speed, relative humidity, ambient surface temperature, planetary boundary layer height). The best model, feedforward neural network with 92% accuracy, in conjunction with Shapely Additive exPlanations approach, is utilized to simulate high ozone concentrations and rank the predictors according to their importance in the build-up of ozone during a severe ozone smog episode that occurred in the period 6 - 18 March 2016. The research focuses on Mexico City, but it is equally applicable to any other city in the world.

How to cite: Ahmad, M., Rappenglück, B., O. Osibanjo, O., and Retama, A.: Application of Three Machine Learning Models for a Severe Ozone Episode in Mexico City , EGU General Assembly 2024, Vienna, Austria, 14–19 Apr 2024, EGU24-21203, https://doi.org/10.5194/egusphere-egu24-21203, 2024.

EGU24-2632 | Posters on site | AS5.7

Development of a UAV-borne cavity-enhanced albedometer for in-situ measurements of the vertical profiles of aerosol optical properties 

Weixiong Zhao, Jiacheng Zhou, Bo Fang, Shuo Wang, Weijun Zhang, and Weidong Chen

Vertical profiles of aerosol light scattering (bscat), absorption (babs), as well as the single scattering albedo (SSA, ω), play an important role in the effects of aerosols on climate, air quality, and local photochemistry. However, direct measurement of the vertical profiles of these optical parameters remains challenging. Although some aircraft observations have been carried out, there is still large uncertainty.

In this presentation, we will report the development of an unmanned-aerial-vehicle (UAV)-borne cavity-enhanced aerosol single scattering albedometer (CEA-albedometer) operating at λ = 532 nm for simultaneous in-situ measurements of the vertical distributions of bext, bscat, babs, and ω. The achieved detection precisions in laboratory were 0.38, 0.21, and 0.43 Mm-1 for bext, bscat, and babs, respectively, for a 1 s data acquisition time.

The UAV used here was a petrol-powered hexacopter with a flight height of up to 1.5 km and a speed of up to 20 m/s. The maximum take-off weight of the UAV was ~ 150 kg, and about 30 kg of equipment can be carried. The full load flight endurance time was about 80 minutes depending on the temperature and wind. It was controlled by a GPS module with a precision of 0.1 m in the horizontal direction and 0.05 m in the vertical direction.

The concept of using UAVs for atmospheric research began in the 1990s. Nowadays, it has developed rapidly, and various instruments have demonstrated impressive performance. The UAV flight platform reported here demonstrated good performance and will become a valuable and powerful tool for atmospheric boundary layer research.

How to cite: Zhao, W., Zhou, J., Fang, B., Wang, S., Zhang, W., and Chen, W.: Development of a UAV-borne cavity-enhanced albedometer for in-situ measurements of the vertical profiles of aerosol optical properties, EGU General Assembly 2024, Vienna, Austria, 14–19 Apr 2024, EGU24-2632, https://doi.org/10.5194/egusphere-egu24-2632, 2024.

EGU24-3706 | ECS | Orals | AS5.7

Study of NO2 and HCHO vertical profile measurement based on Fast Synchronous MAX-DOAS 

Jiangman Xu, Ang Li, Zhaokun Hu, and Hairong Zhang

This paper investigates a multi-elevation Fast Synchronous observation MAX-DOAS system(FS MAX-DOAS) that can quickly obtain trace gas profiles. Compared to the traditional sequential scanning of elevation angles by motors, the system employs a grating spectrometer with a two-dimensional array CCD, we also designed telescopes of small field(<10), a high-speed shutter switching module, and a multi-mode multi-core fiber which is divided into twelve beams to achieve multitrack spectroscopy. It greatly improves the time resolution of spectra collection(a elevation cycle within two minutes). The influence of spectral resolution on FS MAX-DOAS detection of trace gases was analyzed, and the optimal resolution range (0.277-0.569nm) was determined to select the grating used in the spectrometer. The selection of actual binning rows takes into account the SNR of each row of pixels to improve the quality of spectral data, and two-step acquisition is used to overcome the influence of difference in light intensity for low elevation angles. The stability of the system was analyzed using Allan variance. The outfield comparison experiment with differential optical absorption spectroscopy was conducted, and the comparison test was conducted with the ground-based MAX-DOAS system for NO2 and HCHO in the actual atmosphere. The Pearson correlation coefficient of NO2 reached 0.9, HCHO had a good correlation(Pearson’s R was mostly between 0.65-0.78). In the experiment, it was found that the RMS of FS MAX-DOAS spectral inversion can be stably lower than that of MAX-DOAS system for a long time, and the gas profile obtained by the former can show more details due to the improved time resolution. Compared to the near surface concentration of NO2 using active Long Path DOAS instrument, the Pearson’s R of FS MAX-DOAS data is higher. New system can quickly and simultaneously obtain vertical distribution profiles of NO2 and HCHO with high accuracy, which provides a possibility for mobile MAX-DOAS to achieve gas profile inversion.

How to cite: Xu, J., Li, A., Hu, Z., and Zhang, H.: Study of NO2 and HCHO vertical profile measurement based on Fast Synchronous MAX-DOAS, EGU General Assembly 2024, Vienna, Austria, 14–19 Apr 2024, EGU24-3706, https://doi.org/10.5194/egusphere-egu24-3706, 2024.

EGU24-4954 | ECS | Posters on site | AS5.7

A new method for measuring ambient 1,3-butadiene through active DOAS 

Chuanqi Gu, Zhou Bin, and Shanshan Wang

As one of highly reactive dialkenes, 1,3-butadiene (BD) plays a significant role in the atmospheric radical cycle. We have introduced a novel method for the online measurement of ambient BD using the Differential Optical Absorption Spectroscopy (DOAS) technique. During lab testing, the correlation coefficient (R2) between measured BD concentrations and standard concentrations consistently exceeded 0.9999. The accuracy and precision were within ± 5% and 1%, respectively. Interference testing demonstrated that DOAS can effectively distinguish between substances and accurately fit BD concentrations. Following field measurement, the detection limit for BD reached 90 pptv, the R2 between DOAS and the online VOCs system results reaches 0.85, with a slope of 0.86. With its minute-level temporal resolution and cost-effectiveness, DOAS is suitable for long-term BD measurements and has been further validated as an effective method to provide valuable data support for in-depth investigations into the atmospheric oxidation processes of BD.

This work was supported by Sino-German Mobility Program (M-0509) and National Natural Science Foundation of China (grant number 42075097, 22176037, 42375089, 22376030).

How to cite: Gu, C., Bin, Z., and Wang, S.: A new method for measuring ambient 1,3-butadiene through active DOAS, EGU General Assembly 2024, Vienna, Austria, 14–19 Apr 2024, EGU24-4954, https://doi.org/10.5194/egusphere-egu24-4954, 2024.

EGU24-5711 | ECS | Orals | AS5.7

Towards Carbon Dioxide imaging using Fabry-Pérot interferometer correlation spectroscopy 

Moritz Sindram, Jonas Kuhn, Ralph Kleinschek, Christopher Fuchs, Marvin Knapp, Benedikt Löw, Alexander Nies, Tobias Schmitt, and André Butz

Carbon dioxide (CO2) emissions are the major driver of anthropogenic climate change. While strong point sources contribute significantly to overall emissions, their source strength is not always well quantified by bottom-up estimates or in situ measurements. Passive remote sensing of CO2 emissions could provide a simple tool to substantially refine source strength estimates. However, current approaches from ground-based to space-borne platforms only suit exceptionally strong emitters.

We propose a ground-based CO2 imaging technique based on Fabry-Perot interferometer (FPI) correlation spectroscopy. The free spectral range (FSR) of an FPI is matched to the spectral separation of individual rovibrational absorption lines of the CO2 1.57 µm absorption band. This allows to compare the radiance of sky-scattered sunlight between “online” and “offline” wavelengths, i.e., the FPI transmission spectrum correlating and anti-correlating with the CO2 absorption lines, respectively. The advantage of a high FPI light throughput enables imaging measurements of the CO2 column density with a resolving power of 18,000.

Instrument simulations based on available optics suggest an integration time of approximately 10 seconds to record a CO2 plume image with 300 by 300 pixels of a medium-sized power plant (7 Mt CO2/yr). This is about two orders of magnitude faster compared to grating-based imaging spectrometers. For recording the emission plume of a passively degassing volcano at the same spatial resolution integration times are on the order of ten minutes. Additionally, we present ongoing work on developing a prototype instrument to validate the feasibility of this CO2 imaging technique.

How to cite: Sindram, M., Kuhn, J., Kleinschek, R., Fuchs, C., Knapp, M., Löw, B., Nies, A., Schmitt, T., and Butz, A.: Towards Carbon Dioxide imaging using Fabry-Pérot interferometer correlation spectroscopy, EGU General Assembly 2024, Vienna, Austria, 14–19 Apr 2024, EGU24-5711, https://doi.org/10.5194/egusphere-egu24-5711, 2024.

Abstract: Water vapor is one of the crucial greenhouse gases in the atmosphere, and the accurate determination of its concentration and vertical profiles is essential for investigating regional water cycling, and climate-environmental changes. This study investigated a method for retrieving atmospheric water vapor vertical column densities (VCDs) and profiles using the Multi-Axis Differential Optical Absorption Spectroscopy (MAX-DOAS) technique. The approach involves a two-step inversion: first, aerosol extinction profiles are inverted, followed by the inversion of water vapor profile information. A parameterized look-up table method is employed during profile inversion, minimizing reliance on prior information. The study focused on the Huaibei region, using MAX-DOAS to retrieve O4 absorption aerosol profiles. By minimizing the cost function and employing the look-up table method, water vapor profiles are inverted, including parameters such as H2O VCD, water vapor weighting factors in the boundary layer (ω), and boundary layer height (h). Results indicated that, during the observation period in the Huaibei region, water vapor was  primarily concentrated below 1 km, gradually decreasing with altitude. The comparison of the H2O VCDs retrieved using the look-up table method with the European Centre for Medium-Range Weather Forecasts (ECMWF) ERA5 model and geometric approximation demonstrated a strong agreement in diurnal trends (correlation coefficients: 0.93 and 0.98, respectively). In order to understand the sources of water vapor in different vertical layers in the Huaibei region, a 24-hour backward trajectory clustering analysis was conducted using the HYSPLIT model based on the observed wind fields during the monitoring period. The results indicated that at 500 meters altitude, water vapor primarily originated from the southeast direction, while at 1 km and 2 km altitude, the dominant source of water vapor was from the southwest direction. The study demonstrates the successful inversion of tropospheric water vapor vertical column densities and profiles, providing reliable technical support for obtaining regional water vapor information.

How to cite: Li, S., Zhou, C., and Mou, F.:  Investigation of vertical column densities and profiles of water vapor using look-up table method with MAX-DOAS, EGU General Assembly 2024, Vienna, Austria, 14–19 Apr 2024, EGU24-5932, https://doi.org/10.5194/egusphere-egu24-5932, 2024.

EGU24-6039 | Posters on site | AS5.7

Detecting lightning NOx from ship-borne MAX DOAS measurements 

Steffen Ziegler, Lucas Reischmann, Stefan Kinne, Bianca Lauster, Sebastian Donner, Steffen Beirle, and Thomas Wagner

Transit cruises of German research vessels across the great oceans provide a unique platform for Multi AXis Differential Optical Absorption Spectroscopy (MAX-DOAS) measurements of atmospheric trace gases such as nitrogen dioxide (NO2), formaldehyde (HCHO) and sulphur dioxide (SO2) in pristine locations. Here, we present results of the Extra Atmospheric References for Satellites (EARS) campaign which took place from 16th May to 4th June 2023. During that period the research vessel Meteor was in transit from Walvis Bay (Namibia) to Las Palmas (Canary Islands) from 23 °S to 28 °N crossing the equator at around 10 °W.

While crossing the Inner Tropical Convergence Zone (ITCZ), the vessel was sailing through a large convective system consisting of multiple cells and spreading over a few hundred kilometres. The combination of a remote location without nearby anthropogenic sources of NO2 and increased lightning activity allowed for the ground-based detection of lightning NOx. An NO2 peak differential slant column density of 1e16 molec/cm2 could be attributed to the lightning activity in the morning of the 26th May. The corresponding light path length was estimated from the simultaneously measured O4 absorption. As lightning NOx is usually investigated using satellite remote sensing or in-situ on air planes, these ground-based measurements provide a new complementary view on the atmospheric NOx chemistry during a thunderstorm.

How to cite: Ziegler, S., Reischmann, L., Kinne, S., Lauster, B., Donner, S., Beirle, S., and Wagner, T.: Detecting lightning NOx from ship-borne MAX DOAS measurements, EGU General Assembly 2024, Vienna, Austria, 14–19 Apr 2024, EGU24-6039, https://doi.org/10.5194/egusphere-egu24-6039, 2024.

EGU24-6822 | ECS | Orals | AS5.7

OH Radical Detection Using Broadband Cavity Enhanced Absorption Spectroscopy (BBCEAS) in an Open-Path Configuration 

Callum Flowerday, Ryan Thalman, Matthew Asplund, and Jaron Hansen

Hydroxyl radical (OH) is a pivotal oxidant in the atmosphere, exerting significant influence on atmospheric chemistry and participating in diverse environmental processes. However, accurately measuring OH in the atmosphere is challenging due to its short half-life and low ambient concentrations. Various methods, such as laser-induced fluorescence coupled with fluorescence assay by gas expansion (LIF-FAGE), differential optical absorption spectroscopy (DOAS), and ion-chemical ionization mass spectrometry (CIMS), have been employed for OH quantification, each with its associated complexities and limitations.

This study introduces a novel measurement approach utilizing broadband cavity-enhanced absorption spectroscopy (BBCEAS) for detecting OH under ambient atmospheric conditions. The BBCEAS instrument, known for its portability and resilience to interferants owing to its spectroscopic nature, emerges as a practical solution for field measurements. The instrument's characterization involved detecting OH in an open flame, and subsequent enhancements were implemented to render it field-ready, enabling it to compete with established methods like LIF-FAGE, CIMS, and DOAS.

The application of BBCEAS in OH detection represents a valuable tool for atmospheric researchers, offering a balance between portability and sensitivity. This study highlights the potential of BBCEAS as a reliable method for field measurements of OH concentrations, contributing to a more comprehensive understanding of atmospheric processes and chemical reactions.

How to cite: Flowerday, C., Thalman, R., Asplund, M., and Hansen, J.: OH Radical Detection Using Broadband Cavity Enhanced Absorption Spectroscopy (BBCEAS) in an Open-Path Configuration, EGU General Assembly 2024, Vienna, Austria, 14–19 Apr 2024, EGU24-6822, https://doi.org/10.5194/egusphere-egu24-6822, 2024.

EGU24-6920 | ECS | Orals | AS5.7

Clear-sky temperature and water vapor retrievals utilizing collocated microwave and infrared hyperspectrometers 

Lei Liu, Natalia Bliankinshtein, Yi Huang, John Gyakum, Philip Gabriel, Shiqi Xu, and Mengistu Wolde

Accurately monitoring atmospheric temperature and water vapor profiles with high spatial and temporal resolutions is crucial for weather forecasting and climate research. Hyperspectral radiance measurements offer a promising opportunity to retrieve these profiles due to the distinct absorption features of various atmospheric compositions.

Three clear-sky field campaigns were conducted in Ottawa to collect collocated hyperspectral measurements from two sophisticated instruments: the High Spectral Resolution Airborne Microwave Sounder (HiSRAMS) and the Atmospheric Emitted Radiance Interferometer (AERI). HiSRAMS operates within the microwave oxygen band (49.6-58.3 GHz) and microwave water vapor band (175.9-184.6 GHz), while AERI operates in the infrared spectral range (520-1800 cm-1). Both instruments possess high spectral resolution, enabling the detection of subtle changes in temperature and water vapor profiles. Radiosonde measurements were simultaneously taken during each field campaign to serve as the truth for this study.

Initially, we performed a simultaneous assessment of the radiometric accuracy of HiSRAMS and AERI through radiative closure tests. A persistent warm radiance bias was detected in AERI observations in the window band. Correcting this bias improved radiative closure within the same band. HiSRAMS observations, when directed towards the nadir, displayed a smaller brightness temperature bias compared to zenith observations. We diagnosed and compared the radiometric accuracy of both instruments based on the relationship between radiometric bias and optical depth. HiSRAMS exhibited similar radiometric accuracy to AERI in nadir-pointing measurements but demonstrated comparatively poorer accuracy in zenith-pointing measurements, necessitating further characterization.

Subsequently, clear-sky temperature and water vapor concentration profiles were successfully retrieved from collocated HiSRAMS flight measurements and AERI ground measurements. These retrieved profiles were validated against radiosonde measurements, demonstrating good agreement. When both instruments were positioned on the ground for zenith-pointing measurements, infrared hyperspectral measurements provided higher information content and better vertical resolution for temperature and water vapor retrievals compared to microwave hyperspectral measurements. Combining airborne nadir-pointing microwave measurements and ground-based zenith-pointing infrared measurements, termed the “sandwich” sounding approach, exhibited increased information content and reduced retrieval uncertainty for temperature and water vapor concentrations across all retrieval levels.

How to cite: Liu, L., Bliankinshtein, N., Huang, Y., Gyakum, J., Gabriel, P., Xu, S., and Wolde, M.: Clear-sky temperature and water vapor retrievals utilizing collocated microwave and infrared hyperspectrometers, EGU General Assembly 2024, Vienna, Austria, 14–19 Apr 2024, EGU24-6920, https://doi.org/10.5194/egusphere-egu24-6920, 2024.

EGU24-6949 | Posters virtual | AS5.7

Stacking Machine Learning Models Empowered High Time-height Resolved Ozone Profiling from Ground to the Stratopause Based on MAX-DOAS Observation 

Sanbao Zhang, Shanshan Wang, Jian Zhu, Ruibin Xue, Zhiwen Jiang, Chuanqi Gu, Yuhao Yan, and Bin Zhou

Ozone (O3) profiles are crucial for comprehending the intricate interplay among O3 sources, sinks, and transport. However, conventional O3 monitoring approaches often suffer from limitations such as low spatiotemporal resolution, high cost, and cumbersome procedures. Here, we propose a novel approach that combines Multi Axis Differential Optical Absorption Spectroscopy (MAX-DOAS) and machine learning (ML) technology. This approach allows the retrieval of O3 profiles with exceptionally high temporal resolution at the minute level and vertical resolution reaching the hundred meters scale. The ML models are trained using parameters obtained from radiative transfer modeling, MAX-DOAS observations, and reanalysis dataset. To enhance the accuracy of retrieving O3, we employ a stacking approach in constructing ML models. The retrieved MAX-DOAS O3 profiles are compared to data from in-situ instrument, lidar, and satellite observation, demonstrating a high level of consistency. The total error of this approach is estimated to be within 25%. On balance, this study is the first ground-based passive remote sensing of high time-height resolved O3 distribution from ground to the stratopause (0-60 km). It opens up new avenues for enhancing our comprehension of O3 dynamics in atmospheric environments. Moreover, the cost-effective and portable MAX-DOAS combined with this versatile profiling approach enables the potential for stereoscopic observations of various trace gases across multiple platforms.

This work has been supported by Sino-German Mobility Program (M-0509), National Natural Science Foundation of China (grant number 42075097, 22176037, 42375089, 22376030).

How to cite: Zhang, S., Wang, S., Zhu, J., Xue, R., Jiang, Z., Gu, C., Yan, Y., and Zhou, B.: Stacking Machine Learning Models Empowered High Time-height Resolved Ozone Profiling from Ground to the Stratopause Based on MAX-DOAS Observation, EGU General Assembly 2024, Vienna, Austria, 14–19 Apr 2024, EGU24-6949, https://doi.org/10.5194/egusphere-egu24-6949, 2024.

EGU24-7004 | Posters on site | AS5.7

A laser‐based open‐path analyzer with low-temperature corrections for eddy covariance CH4 flux measurements 

Yin Wang, Kai Wang, Jingting Zhang, Teng Lu, Yanze Zhou, and Ting-Jung Lin

This work presents an open-path methane (CH4) analyzer (Model HT8600, HealthyPhoton Co., Ltd.) suitable for eddy covariance (EC) flux measurements based on the tunable diode laser absorption spectroscopy (TDLAS) technology. As discussed in the previous literature, EC flux measurements based on open-path analyzers are subject to temperature-correlated corrections, including the density and spectroscopic effects. The HT8600 utilizes an interband cascade laser (ICL) to probe the mid-infrared transition of CH4 at ~3221.1 nm. The chosen absorption peak has the advantage that the density and spectroscopic effects compensate for each other, resulting in low temperature-related corrections in EC flux measurements [1].


The HT8600 has a weight of ~15 kg and dimensions of 84 cm (length) and 20 cm (diameter). Multiple laser beam reflections enable an optical path length of 17 m. The total power consumption is 30 W, which lithium batteries can supply for continuous measurements. Laboratory experiments showed that the HT8600 has a noise level of 1.36 ppbv at a 10-Hz data rate. A long-term field experiment is ongoing to compare the performance of the HT8600 against another commercial open-path CH4 analyzer. We used the fluxes measured by the commercial analyzer with complete temperature corrections as the reference. Preliminary results showed that raw fluxes measured by the HT8600 achieved high consistency with the one from the commercial analyzer, which proved our initiative that the chosen absorption line is subject to low-temperature biases.


As the inter-comparison is ongoing, we are collecting more field results for formal analysis of the performance of HT8600 under a wide dynamic range of temperatures. Detailed analysis of the correction factors will be presented at the conference. Meanwhile, as there is a nearby absorption line of water (H2O) at 3222.7 nm, the work extends the analyzer’s capability of measuring H2O and CH4 simultaneously, enhancing its versatility for field CH4 flux monitoring.

Reference

  • Pan, D., Gelfand, I., Tao, L., Abraha, M., Sun, K., Guo, X., Chen, J., Robertson, G. P., andZondlo, M. A. (2022). A new open-path eddy covariance method for nitrous oxide and other trace gases that minimizes temperature corrections. Global Change Biology, 28, 1446– 1457. Doi: https://doi.org/10.1111/gcb.15986.

How to cite: Wang, Y., Wang, K., Zhang, J., Lu, T., Zhou, Y., and Lin, T.-J.: A laser‐based open‐path analyzer with low-temperature corrections for eddy covariance CH4 flux measurements, EGU General Assembly 2024, Vienna, Austria, 14–19 Apr 2024, EGU24-7004, https://doi.org/10.5194/egusphere-egu24-7004, 2024.

Absorption in the deep-UV region often excites strong electronic bands. In cases where vibronic structure is evident, these strong absorptions could be exploited for sensitive and selective quantification of trace gases, as is done in long-path DOAS systems to monitor ammonia emissions. Accurate and appropriate resolution absorption cross sections are essential for this purpose, but literature cross sections of adequate quality are not always available. In this study, we report new cross section for major inorganic species (NO and SO2), as well as important biogenic and anthropogenic volatile organic compounds (BVOC and AVOC). 
A spectrometer using a xenon arc flashlamp was used to measure absorption spectra in the wavelength range of 197 to 225 nm. Absorption cross section measurements using a flow cell were validated against SO2 absorption cross-sections, for which there is excellent agreement in the literature. We report a new absorption cross section of nitric oxide (NO) using the flow cell. Despite being a key nitrogen oxide species in the atmosphere, there are few NO absorption cross-sections between 190 and 230 nm and little agreement among the spectra. VOCs measurements were made in a static cell and validated against the isoprene absorption cross-section. New absorption cross sections are reported for important AVOCS (benzene, toluene, ethylbenzene, xylene) and key BVOCS (α-pinene, β-pinene, limonene, 3-carene, and myrcene). The measured absorption cross-sections are compared and discussed.
We discuss the potential and challenges of using deep-UV measurements and the sensitivities that would be needed to be useful for trace gas detection in a range of contexts.

How to cite: Wang, M., C. Connolly, S., and S. Venables, D.: Measurement of deep-ultraviolet cross-sections of strongly absorbing atmospheric species and their potential for trace gas detection, EGU General Assembly 2024, Vienna, Austria, 14–19 Apr 2024, EGU24-7919, https://doi.org/10.5194/egusphere-egu24-7919, 2024.

EGU24-8237 | ECS | Orals | AS5.7

Assessment of variability in urban HONO using MAX-DOAS measurements in Central London 

Eleanor Gershenson-Smith, Eloise A. Marais, Robert G. Ryan, and Gongda Lu

In polluted cities with large sources of NOx, rapid photolysis of nitrous acid (HONO) may be a major daytime source of the main atmospheric oxidant, OH. Current understanding of urban HONO is problematic. Its abundance is generally underestimated by models, and urban and rural networks. Campaigns with in situ instruments routinely identify a mystery midday HONO source. These measurements do not directly measure HONO and offer no insight into its vertical distribution. We use remotely sensed daytime differential slant column density (dSCD) measurements of HONO from a Multi-Axis Differential Optical Absorption Spectroscopy (MAX-DOAS) instrument which was installed on a 60 m rooftop during summer 2022 on the Bloomsbury University College London (UCL) campus. Modelled (GEOS-Chem) and surface network measurements of air quality and meteorology are used to characterise conditions conducive to HONO detection. To be detected, dSCDs must exceed the detection limit, which we define as 2 times the root mean square of the fit of residuals divided by the maximum absorption cross section of HONO. We find that MAX-DOAS HONO dSCDs at elevation angles measuring the lowest layers of the atmosphere are only ever above the instrument detection limit in winter mornings (8:30 am–12:00 pm local time), suggesting substantial nighttime accumulation of HONO. This early morning HONO decreases rapidly (within 3-4 hours) to below detection after sunrise. Consistent characteristics of these mornings include cloud-free, cold (< 0°C) and calm conditions (wind speeds < 2.5 m s-1), a shallow boundary layer (< 100 m), substantial surface ozone depletion (< 10 µg m-3), and relatively large contribution of NO to total NOx (NO/NOx mass ratio ³ 0.3). Work is underway to further characterise urban HONO using 190 m measurements of NOx from the Central London BT Tower observatory and assess the reaction kinetics balancing HONO loss and formation. New knowledge of HONO gained from MAX-DOAS measurements will then be used to evaluate best understanding of urban HONO as simulated with the GEOS-Chem model.

How to cite: Gershenson-Smith, E., Marais, E. A., Ryan, R. G., and Lu, G.: Assessment of variability in urban HONO using MAX-DOAS measurements in Central London, EGU General Assembly 2024, Vienna, Austria, 14–19 Apr 2024, EGU24-8237, https://doi.org/10.5194/egusphere-egu24-8237, 2024.

EGU24-8526 | ECS | Orals | AS5.7

Ultra-broadband mid-infrared supercontinuum-based spectroscopy for greenhouse gas monitoring at wastewater treatment plants 

Roderik Krebbers, Kees van Kempen, Yueyu Lin, Amir Khodabakhsh, and Simona Cristescu

Ultra-broadband spectroscopy in the mid-infrared (MIR) wavelength range, where most molecular species have strong, distinct absorption features, has a great potential for gas sensing applications. Novel MIR supercontinuum (SC) sources excel in their ability to provide broadband light together with a high spatial coherence. Using this unique combination of properties, we have recently demonstrated the potential of MIR SC sources in combination with a tailor-made Fourier Transform Spectrometer (FTS) and a multipass absorption cell for multispecies trace gas detection [1]. Moreover, a novel application is to utilize the spatial coherence of the source to monitor outdoor (greenhouse) gas concentrations through free space. In open-path absorption spectroscopy, the light beam is guided over an (outdoor) path, instead of sampling the gas in a cell. The concentrations of the gases of interest are integrated over this path, which is useful for detecting greenhouse gases in an area or around an emission source. Wastewater treatment plants are a known source of greenhouse gas emissions of CO2, CH4, and N2O. However, little is known about the fluctuation in the emission rates of these gases over time and their relation to internal and external factors.

We have developed a new, transportable instrument for open-path absorption spectroscopy, which comprises of a unique, novel SC source with an ultra-broad spectrum from 2 – 11.5 µm with ~3 W output power and a custom-built Fourier transform spectrometer [2]. The beam of the SC source is sent over an open path to a cubic retroreflector, where it is reflected back to the FTS. Using the spatial coherence of the beam, extensive, outdoor optical paths can be achieved, while the broad spectrum enables simultaneous detection of many different gas species.

We present the results of field measurements at a wastewater treatment plant where we monitored the concentration of greenhouse gases (CH4, N2O, and CO2) and other trace gases (e.g., NH3 and CO) simultaneously in the atmosphere surrounding the aerobic tank of the plant (Figure 1).  We will shed light on the perspective of this novel instrumentation for greenhouse gas monitoring around emitting sources, as it is providing reliable data for modelling studies on the dynamics of the emissions of wastewater treatment plants and other sources.

Figure 1: Satellite image of the aerobic tank of the wastewater treatment plant with the beam path over the tank (in red). Left insert: Retrieved concentrations of methane using the open-path instrument (in black) and using a validation instrument (in red, measured at point marked “x” in the photo). Right insert: Close-up of the open-path instrument.


[1] M. A. Abbas, K. E. Jahromi, M. Nematollahi, R. Krebbers, N. Liu, G. Woyessa, O. Bang, L. Huot, F. J. M. Harren, and A. Khodabakhsh, "Fourier transform spectrometer based on high-repetition-rate mid-infrared supercontinuum sources for trace gas detection," Opt. Express 29, 22315-22330 (2021).

[2] R. Krebbers, K. van Kempen, F. J. M. Harren, S. Vasilyev, I. Peterse, S. Lücker, A. Khodabakhsh, and S. M. Cristescu, “Ultra-broadband spectroscopy using a 2–11.5 µm IDFG-based supercontinuum source”, Optica Open. Preprint. DOI:10.1364/opticaopen.24967692.v1.

How to cite: Krebbers, R., van Kempen, K., Lin, Y., Khodabakhsh, A., and Cristescu, S.: Ultra-broadband mid-infrared supercontinuum-based spectroscopy for greenhouse gas monitoring at wastewater treatment plants, EGU General Assembly 2024, Vienna, Austria, 14–19 Apr 2024, EGU24-8526, https://doi.org/10.5194/egusphere-egu24-8526, 2024.

EGU24-9155 | ECS | Orals | AS5.7

Observations and retrieval of volcanic SO2 emissions from the Sakurajima volcano, Japan, using temperature-stabilised Car-DOAS 

Simon Bittner, Alexandros P. Poulidis, Andreas Richter, Masato Iguchi, and Mihalis Vrekoussis

Volcanic eruptions in recent years, including the long-lasting eruption of Cumbre Vieja, La Palma (September-December 2021) and the fissure eruption at Reykjanes Peninsula, Iceland (December 2023, currently ongoing), have put a spotlight on the severe impacts volcanic gas emissions can have on human activities and the environment. Observations of such volcanic degassing were the target of the Volcanic Emissions Observation and Modeling (VOLCOM) field campaign, carried out on Sakurajima volcano, Japan, during November 2023, chosen due to the volcano’s long-lasting activity (currently ongoing since 1955) and surrounding population (>1 million residents in the surrounding 20 km).

VOLCOM provided an excellent opportunity to employ and test a well-known remote sensing methodology (Car-DOAS). To reduce the noise level in Car-DOAS measurements, we incorporated a temperature stabilization device. The temperature stabilized-Avantes spectrometer was mounted on a vehicle equipped with a UV bandpass filter. The planning of the measurements was supported by a dedicated high-resolution meteorological forecasting approach using the Weather Research and Forecasting (WRF) and FALL3D models. With the presented setup, SO2 emission rates from the vent were monitored, and strong signals (SCD >1018 molecules cm-2) were observed.

High concentrations of SO2 in the plume, however, can make proper retrieval of the signal challenging as the strong absorption of SO2 pushes the DOAS method to its limits. It was seen that shifting the fit window depending on the SO2 signals ensures that the weak absorber assumption remains valid, which is used to create a composite product featuring multiple fit windows. Based on the composite product, the passive emissions during that period were estimated using a mass-balance approach with the forecasted wind field over the volcano. Proper retrieval of the SO2 signal will help us establish a new dataset for the volcano and allow us to gain insight into the chemistry and environmental impacts of volcanic gas emissions.

How to cite: Bittner, S., Poulidis, A. P., Richter, A., Iguchi, M., and Vrekoussis, M.: Observations and retrieval of volcanic SO2 emissions from the Sakurajima volcano, Japan, using temperature-stabilised Car-DOAS, EGU General Assembly 2024, Vienna, Austria, 14–19 Apr 2024, EGU24-9155, https://doi.org/10.5194/egusphere-egu24-9155, 2024.

EGU24-9344 | ECS | Orals | AS5.7

Spatially resolved MAX-DOAS measurements of Formaldehyde at Torrejon de Ardoz (41 N). 

Marcos Blanco, Olga Puentedura, Monica Navarro-Comas, Laura Gomez-Martin, Javier Iglesias, Cristina Prados-Roman, and Margarita Yela

The presence of formaldehyde (HCHO) in the atmosphere is an indicative of the existence of oxidation processes of volatile organic compounds (VOCs), and plays a big role in a number of tropospheric chemical processes, most importantly in the formation of tropospheric ozone. It can also be used as a proxy for local air quality and air pollution studies. In the framework of the FRM4DOAS project, a series of MAX-DOAS measurements has been carried out in an unpolluted environment situated at the north of the city of Torrejón de Ardoz (Madrid, Spain, 41° N), to determine the distribution of NO2 and HCHO in both urban and green areas, with special emphasis on the detection of the spatial heterogeneity of both species. The instrumentation’s operation site was situated in TOTEM, an observation station inside the premises of INTA, and on the top of a tower which height ensures that there are no immediate obstacles in the observations’ lines of sight.
This work is focused on HCHO measurements. The series of measurements spans from 2019 to 2022, with some gaps in between due to instrumental problems, and 4 different azimuth angles that enable the study of airmasses around nearby urban areas, highways and airport landing strips, and also around nearby fields and mountains. Some measurements have also been filtered out with a HCHO detection limit criterion to ensure that the studied spectra properly detect this trace gas.
The instrument involved in these measurements was a MAX-DOAS spectrometer observing in the UV region (320-415 nm), with a resolution of FHWM 0.55 nm, and equipped with a calibrated inclinometer to precisely adjust to the selected elevation angles. The instrument was configured to measure in the following elevation angles: 0°, 1°, 2°, 3°, 5°, 10°, 30°, 60° and zenith, and in 4 different azimuth angles (50°, 100°, 180° and 220° N, clockwise).
The spectral analysis for the HCHO retrieval was made by a software developed at INTA. O4 retrieval was also performed, at a different spectral range than that used for HCHO but still in the UV region, to obtain information of the optical paths that the light followed before being measured by our instrument.
A clear seasonality can be observed throughout the years, with a maximum peak around July- August, and a minimum in the months of February-March. This seasonal behaviour can be observed in all azimuthal directions, but it’s more prevalent in the 100° N azimuth direction, pointing to the city of Alcalá a few kilometers away.

How to cite: Blanco, M., Puentedura, O., Navarro-Comas, M., Gomez-Martin, L., Iglesias, J., Prados-Roman, C., and Yela, M.: Spatially resolved MAX-DOAS measurements of Formaldehyde at Torrejon de Ardoz (41 N)., EGU General Assembly 2024, Vienna, Austria, 14–19 Apr 2024, EGU24-9344, https://doi.org/10.5194/egusphere-egu24-9344, 2024.

EGU24-9752 | ECS | Posters on site | AS5.7

Updated version of the MAX-DOAS cloud classification algorithm and its validation 

Lucas Reischmann, Steffen Ziegler, Steffen Beirle, Vinod Kumar, Ankie Piters, Sebastian Donner, and Thomas Wagner

Characterizing the light path through the atmosphere is a fundamental challenge in Differential Optical Absorption Spectroscopy (DOAS). Clouds strongly influence the light paths and thus the interpretation and further use of the measurements. In this context, it is important to receive information about the cloud cover in the field of view of the Multi-AXis-DOAS (MAX-DOAS) instrument. A method for extracting this information from the measured spectra themselves was introduced by Wagner et al. (2014, 2016). They developed an algorithm to determine and classify sky conditions based on the combination of CI (Colour Index) and O4 absorption obtained from MAX-DOAS spectra.

In this study, the improvements of an updated version of this algorithm are presented and validated by comparison with a series of observations with camera measurements of sky conditions at several stations. In order to process the large number of observations, a tool was implemented to enable rapid categorization of the camera images.

How to cite: Reischmann, L., Ziegler, S., Beirle, S., Kumar, V., Piters, A., Donner, S., and Wagner, T.: Updated version of the MAX-DOAS cloud classification algorithm and its validation, EGU General Assembly 2024, Vienna, Austria, 14–19 Apr 2024, EGU24-9752, https://doi.org/10.5194/egusphere-egu24-9752, 2024.

EGU24-9843 | ECS | Posters on site | AS5.7

Intercomparison of MAX-DOAS, FTIR and direct-sun DOAS HCHO retrievals in Xianghe (China) 

Gaia Pinardi, Michel Van Roozendael, Martina M. Friedrich, Bavo Langerock, Corinne Vigouroux, Isabelle De Smedt, François Hendrick, Ting Wang, Pucai Wang, and Minqiang Zhou

MAX-DOAS, direct-sun DOAS and FTIR measurements are increasingly used as fiducial reference for the validation of HCHO satellite observations. Understanding their strengths and limitations, and assessing their consistency is therefore crucial to produce robust and consolidated validation results. So far, only a few studies have explored the complementarity between MAX-DOAS and FTIR HCHO measurements.

In the present study, we take benefit of MAX-DOAS and FTIR instruments being simultaneously operated at the Xianghe station (39.75° N, 116.96° E, approximately 55 km southeast of Beijing) to compare HCHO vertical columns retrieved from both instruments during one full year in a site under the influence of strong VOC emissions from biogenic and anthropogenic origins. In addition to its standard MAX-DOAS geometry, the IAP/BIRA instrument also provides regular direct-sun measurements suitable for comparison with FTIR solar absorption data. HCHO total columns from FTIR and direct-sun DOAS measurements are found to be in excellent agreement demonstrating the high level of consistency of spectroscopic parameters in the UV and infrared spectral ranges.

We also investigate results obtained using different MAX-DOAS algorithms (namely bePRO, MMF and MAPA), assessing the agreement reached with respect to reference FTIR and direct-sun data. Various retrieval assumptions (e.g., a-priori profiles, covariance matrices, …) that can be tuned in the FRM4DOAS centralized-facility are tested. The study takes into account both MAXDOAS and FTIR sensitivities and a-priori profile information, and also links the obtained results to reference model data.

How to cite: Pinardi, G., Van Roozendael, M., Friedrich, M. M., Langerock, B., Vigouroux, C., De Smedt, I., Hendrick, F., Wang, T., Wang, P., and Zhou, M.: Intercomparison of MAX-DOAS, FTIR and direct-sun DOAS HCHO retrievals in Xianghe (China), EGU General Assembly 2024, Vienna, Austria, 14–19 Apr 2024, EGU24-9843, https://doi.org/10.5194/egusphere-egu24-9843, 2024.

EGU24-11512 | Orals | AS5.7

Observations of atomic oxygen in the MLT from a stratospheric balloon with the OSAS-B terahertz heterodyne spectrometer 

Martin Wienold, Alexey Semenov, Peder Hansen, and Heinz-Wilhelm Hübers

The Oxygen Spectrometer for Atmospheric Science on a Balloon (OSAS-B) is a heterodyne receiver for the thermally excited ground state transition of neutral atomic oxygen at 4.75 THz [1]. It has been shown that this transition is favorable for the determination of atomic oxygen in the mesosphere and lower thermosphere (MLT) region of Earth [2]. Due to water absorption, it cannot be observed from ground. Atomic oxygen is the dominant species in the MLT, and thus plays an important role for the chemistry and energy balance in the MLT region as well as for the deceleration of low-earth orbit satellites. OSAS-B uses a combined helium/nitrogen cryostat for the detector of the instrument, a superconducting hot-electron bolometer mixer, as well as for cooling the quantum-cascade laser, which serves as the local oscillator for heterodyne detection. A turning mirror allows for measurements at different vertical inclinations and for radiometric calibration against two blackbody sources. The first flight took place as a one-day flight in September 2022 from Esrange, Sweden in the framework of the EU-funded Hemera 2020 program. During the course of the flight, several hundred spectra for different elevation angles and azimuth directions were recorded. Preliminary results show a reasonable agreement with predictions from the current MSIS model (NRL MSIS 2.0/2.1). Besides, we are able to observe the spectral signatures of shear winds in the MLT as they are predicted by the horizontal-wind model (HWM 2014).

[1] Wienold, M. et al. 48th IRMMW-THz, Montreal, Canada (2023), doi: 10.1109/IRMMW-THz57677.2023.10299165
[2] Richter, H. et al. Commun Earth Environ 2,19 (2021), doi: 10.1038/s43247-020-00084-5

How to cite: Wienold, M., Semenov, A., Hansen, P., and Hübers, H.-W.: Observations of atomic oxygen in the MLT from a stratospheric balloon with the OSAS-B terahertz heterodyne spectrometer, EGU General Assembly 2024, Vienna, Austria, 14–19 Apr 2024, EGU24-11512, https://doi.org/10.5194/egusphere-egu24-11512, 2024.

EGU24-11539 | Posters on site | AS5.7

Digitization and use of historical spectra from 1950/51 for the retrieval of various trace gases from the Jungfraujoch site (46.55N, 7.98E, 3580m) 

Jamal Makkor, Mathias Palm, Matthias Buschmann, Emannuel Mahieu, Martyn Chipperfield, and Justus Notholt

The Sphinx Observatory at Jungfraujoch (46.55N, 7.98E, 3580m) has been pivotal in atmospheric research, particularly atmospheric sounding, since its inception. This study revisits the observatory's pioneering work in the 1950s when a Pfund-type, dispersive spectrometer was utilized to capture infrared solar spectra, initially recorded on paper rolls. While the initial focus was on solar spectrum analysis, these historical spectra now offer a unique window into the atmospheric composition of the 1950s. The solar absorption spectroscopy at Jungfraujoch allows the retrieval of the atmospheric composition.

Our research is twofold. First, we developed a specialized software for digitizing and calibrating these historical spectra, and making the spectra available for the scientific community. Second, using these digitized spectra, we determined the atmospheric concentrations of carbon monoxide (CO) and dichlorodifluoromethane (CFC12) from that era, comparing our findings with current model projections.

The results show an intriguing disparity. For CO, the observed concentrations in 1950/51 were lower than those predicted by models. As expected, CFC12 levels were significantly lower than current levels, averaging at 0.75E15 molecules per square centimeter. This predates James Lovelock's first detection of CFCs in the 1970s and suggests a minor but detectable presence of CFC12 in the 1950s atmosphere. Ongoing efforts focus on extending this analysis to other trace gases, aiming to enrich our understanding of the atmospheric composition in 1950/51.

How to cite: Makkor, J., Palm, M., Buschmann, M., Mahieu, E., Chipperfield, M., and Notholt, J.: Digitization and use of historical spectra from 1950/51 for the retrieval of various trace gases from the Jungfraujoch site (46.55N, 7.98E, 3580m), EGU General Assembly 2024, Vienna, Austria, 14–19 Apr 2024, EGU24-11539, https://doi.org/10.5194/egusphere-egu24-11539, 2024.

EGU24-11697 | ECS | Posters on site | AS5.7

Multispecies mid-IR laser absorption spectroscopy for drone-based measurements of ship emissions 

Timo Kaldewey, Philipp Scheidegger, Herbert Looser, Richard Maulini, Stéphane Blaser, Antoine Muller, Lukas Emmenegger, and Béla Tuzson

The accentuated global market substantially increased worldwide shipping and thus the related greenhouse gas (GHG) emissions. Without effective global measures, emissions from maritime transport will soon undermine any attempts to mitigate climate change. Therefore, the International Maritime Organization committed to new targets for GHG emission reduction. Similarly, the EU commission aims to regulate the emissions from all large ships starting from 2024 [1]. This includes now also CH4 and N2O emissions besides CO2 and SO2. For any market-based measure, however, a robust monitoring, reporting and verification (MRV) system is a prerequisite. Furthermore, air surveillance techniques that are able to assess smoke plumes, are effective approaches to verify compliance and to identify potential violations.

Within the framework of the Eurostars 3 project, ZEPHir, we support this effort by creating key enabling technologies for efficient monitoring of ship emissions. Leveraging on our recent advances in compact optical cells [2], laser driving schemes [3], and data-acquisition solutions [4], we target a multi-compound laser absorption spectrometer that can be carried aboard unmanned aerial vehicles (UAVs), such as drones, providing fast, in-situ, and high precision GHG measurements of vessel's exhaust plumes. For this purpose, two custom-made DFB quantum cascade lasers (QCLs) operated in a time-multiplexed regime (intermittent continuous wave operation) are coupled into a segmented circular multipass cell (SC-MPC) with an optical path length of 57 m. As each laser is selected to cover at least two different target species, we are able to assess all the regulated GHG compounds. As shown previously [5], the fastest analytical response is achieved in open-path configuration. However, open-path and thus at atmospheric pressure limits the analytical selectivity. Therefore, we identified a closed-path design at a pressure of 0.3 atm as the best compromise between selectivity and responsivity. Preliminary results indicate a noise equivalent absorbance in the range of 3 to 13 x10-9 cm-1 for all above GHGs within one second of averaging, well suited for measuring typical concentrations found ship plumes.

The final aim of this ongoing work is to provide a portable spectrometer to be systematically deployed in maritime ports and harbors for providing quick, flexible and reliable estimates of ship emissions.


References

  • https://emsa.europa.eu/reducing-emissions/mrv-changes.html
  • M. Graf, L. Emmenegger, and B. Tuzson, "Compact, circular, and optically stable multipass cell for mobile laser absorption spectroscopy", Opt. Lett. 43, 2434-2437 (2018)
  • M. Fischer, B. Tuzson, A. Hugi, R. Brönnimann, A. Kunz, S. Blaser, M. Rochat, O. Landry, A. Müller, and L. Emmenegger, "Intermittent operation of QC-lasers for mid-IR spectroscopy with low heat dissipation: tuning characteristics and driving electronics", Opt. Express 22, 7014-7027 (2014)
  • C. Liu, B. Tuzson, P. Scheidegger, H. Looser, B. Bereiter, M. Graf, M. Hundt, O. Aseev, D. Maas and L. Emmenegger, "Laser driving and data processing concept for mobile trace gas sensing: Design and implementation", Rev. Sci. Instrum. 1 June 2018; 89 (6): 065107
  • Tuzson, B. and Graf, M. and Ravelid, J. and Scheidegger, P. and Kupferschmid, A. and Looser, H. and Morales, R. P. and Emmenegger, L., "A compact QCL spectrometer for mobile, high-precision methane sensing aboard drones", Atmos. Meas. Tech., 13, 4715–4726

How to cite: Kaldewey, T., Scheidegger, P., Looser, H., Maulini, R., Blaser, S., Muller, A., Emmenegger, L., and Tuzson, B.: Multispecies mid-IR laser absorption spectroscopy for drone-based measurements of ship emissions, EGU General Assembly 2024, Vienna, Austria, 14–19 Apr 2024, EGU24-11697, https://doi.org/10.5194/egusphere-egu24-11697, 2024.

EGU24-11921 | ECS | Orals | AS5.7

MAX-DOAS measurements of air pollution on the northern tip of Taiwan 

André Seyler, Kezia Lange, Andreas Richter, Tim Bösch, Lisa Behrens, Charles C.K. Chou, Wei-Nai Chen, Shinjie Ho, Kai-Shuan Hsu, Chunchiang Kuo, M. Roja Raman, John P. Burrows, and Hartmut Bösch

Wind and weather in Taiwan are strongly influenced by the monsoons. Taiwan is on the lee side of the Asian winter monsoon, originating on the Asian continent. It receives continental air masses transported by the monsoon, thus air pollutants originating in the eastern and northern parts of China. While polluted air reaches Taiwan during winter monsoon, clean air masses from the remote western North Pacific are predominant in summer, making Taiwan an ideal location to investigate variations in atmospheric composition due to the monsoons. In addition to that, the monsoons themselves are also subject to regional climate changes in the future.

Since June 2023, a Multi-AXis-DOAS (MAX-DOAS) instrument has been installed at the Cape Fuguei Research Station (CAFE) at the northernmost point of Taiwan, measuring vertical and horizontal distributions of trace gases, including NO2, SO2, HCHO, and aerosols. The measurements aim to investigate local air pollution and study the impact of pollution export from mainland China on tropospheric composition and local air quality. The MAX-DOAS and the other measurements at the site will also be very valuable in the validation of the data products from the GEMS satellite.

The measurements are part of the project “Investigation of Pollution Transport to Taiwan” (IPToT), which has been established as a cooperation between the Insitute of Environmental Physics (IUP) of the University of Bremen (Germany) and the Research Center for Environmental Changes of the Academia Sinica (Taiwan), funded by the DFG (Deutsche Forschungsgemeinschaft).

Here, we present first MAX-DOAS observations and retrieved profiles of NO2, SO2, HCHO, and aerosols at this new station and compare them to collocated in-situ and (aerosol) LIDAR measurements. The data are evaluated for diurnal and weekly pollution signals and the dependency on the prevailing wind direction. A first comparison to satellite measurements is also shown.

How to cite: Seyler, A., Lange, K., Richter, A., Bösch, T., Behrens, L., Chou, C. C. K., Chen, W.-N., Ho, S., Hsu, K.-S., Kuo, C., Raman, M. R., Burrows, J. P., and Bösch, H.: MAX-DOAS measurements of air pollution on the northern tip of Taiwan, EGU General Assembly 2024, Vienna, Austria, 14–19 Apr 2024, EGU24-11921, https://doi.org/10.5194/egusphere-egu24-11921, 2024.

EGU24-11955 | ECS | Posters on site | AS5.7

UV-Vis remote sensing of atmospheric pollutants from a wind turbine platform in the North Sea: the SEMPAS project 

Gytha Mettepenningen, Caroline Fayt, Frederik Tack, Cato Van Doorne, Pieter Bogaert, Lars Jacobs, Sophie Berkenbosch, Aurélien Aubry, Filip Desmet, Charles Robert, Martine De Mazière, and Michel Van Roozendael

Ship emissions comprise up to 15% of global transport pollution. To regulate this pollution, Nitrogen Emission Control Area (NECA) and Sulphur Emission Control Area (SECA) zones have been introduced in the North Sea, which define a threshold for shipping emissions of respectively NOx and SOx. The current method of control of these regulations in the Belgian North Sea uses an aircraft equipped with sniffers to fly through the plume. As this is an intensive method, only a limited number of ships can be evaluated. The Ship Emission Monitoring by Passive Absorption Spectroscopy (SEMPAS) project develops a UV-Visible Differential Optical Absorption Spectroscopy (DOAS) instrument to permanently monitor ships from a Belgian offshore windfarm and to complement the aircraft-based measurements.

The instrument is an imaging DOAS system, with a field of view of 0.5x3 degrees corresponding to 3x15 pixels. The imaging functionality is obtained by means of an optical fiber bundle where fibers are organised in a matrix structure. Every fiber provides a separate measurement and corresponds to a pixel in the image that is created. The light is then fed into a grating spectrometer that measures slant columns of both SO2 and NO2 in the UV at a spectral resolution of 0.4 nm, based on the DOAS fitting principle. Next to the DOAS system, a second channel uses a Bruker EM27 FTIR instrument to measure CO2 and SO2 in emission mode. The aim is to quantify emission factors based on measured ratios of SO2 to CO2, NO2 to CO2 and SO2 to NO2.

The instrument is accompanied by a simple visible camera. An image recognition AI-based algorithm on the live feed of this camera ensures active tracking of passing ships, to increase sensitivity. From the measured image, the plume concentrations can be derived, as well as the background concentrations measured next to the plume.

In addition, the instrument can be set to MAX-DOAS mode, by binning the signals from the fibers to a point measurement with high sensitivity. This mode will be used when no ships are in the area. As the network of MAX-DOAS instruments in a marine environment is limited, this instrument can help in studying the marine atmosphere in more detail.

The instrument’s development is currently being finalised and it will be installed and start operations in spring 2024. The proposed poster presents an instrumental description, including calibration and initial results from test measurements.

How to cite: Mettepenningen, G., Fayt, C., Tack, F., Van Doorne, C., Bogaert, P., Jacobs, L., Berkenbosch, S., Aubry, A., Desmet, F., Robert, C., De Mazière, M., and Van Roozendael, M.: UV-Vis remote sensing of atmospheric pollutants from a wind turbine platform in the North Sea: the SEMPAS project, EGU General Assembly 2024, Vienna, Austria, 14–19 Apr 2024, EGU24-11955, https://doi.org/10.5194/egusphere-egu24-11955, 2024.

EGU24-12107 | ECS | Orals | AS5.7

Experimental results on the H2-H2 and H2 -He collisional-induced absorption coefficients at typical Jupiter’s upper tropospheric conditions.  

Francesca Vitali, Stefania Stefani, Giuseppe Piccioni, Davide Grassi, and Marcel Snels

Jupiter’s atmosphere is primarily composed of molecular hydrogen and helium with a mixing ratio almost identical to our Sun.

Since the atmosphere of this gaseous giant represents a high-density environment, spanning many orders of magnitude along its radius, the H2-H2 and H2-He Collision Induced Absorption (CIA) bands represent its main source of opacity in the infrared part of the spectrum, particularly between 1 and 5 μm, a spectral range widely used by remote sensing instruments.

Thus, it is of primary importance to have experimental data on the CIA absorption and to compare them with the theoretical models present in the literature, to have the most accurate estimation of Jupiter’s atmospheric opacity, at least for the CIA.

Consequently, measurements of the hydrogen CIA fundamental band have been performed at three different temperatures and pressure conditions typical of the Jovian upper-tropospheric profile [1], using an H2-He mixture with 13.8 % helium, a typical value of Jupiter’s atmosphere.

For this scope, we used an experimental setup called PASSxS, which allows us to record absorption spectra in the spectral range from 1 to 6 μm.

It comprises two stainless steel concentric vessels, as shown in Figure 1. The inner one contains the gas or mixture of gases under investigation, while the external one can be evacuated to ensure thermal insulation of the sample chamber from the external environment.

The inner vessel contains a Multi-Pass cell, characterized by an optical path of about 3.2 m, coupled with an FT-IR spectrometer. The spectral resolution achievable with the present FT-IR spans from 0.06 to 10 cm-1. For a more detailed description of the experimental setup refer to [2].

Figure 2 shows the experimental absorption coefficients (blue curve) acquired at 402 K and 19.2 bar, compared with Abel’s theoretical model [3] (red curve). The band shows a maximum absorption around 4200 cm-1 where the absorption coefficients reach a value of  5.8 10-4 cm-1.

Some discrepancies between the data and the model are evident and have to be further investigated. This work presents the first experimental study of the CIA fundamental band of H2-He at this high temperature.

Since our experimental setup can reach temperatures up to 550 K, one of the main objectives will be to perform measurements at still higher temperatures, to further investigate a not-yet explored temperature range (work in progress at the time of this abstract).

Figure 2 also shows the so-called interference dips [4] around 4150 cm-1, which represent a lack of absorption at specific wavelengths. The spectral resolution of our setup allowed, for the first time, to resolve four interference dips.

A further investigation of these features might be important for future modeling.

Acknowledgments: This work has been developed under the ASI-INAF agreement n. 2023-6-HH.0.

References:

[1] A. Seiff (1997), Science Vol 276, pp.102-104.

[2] M. Snels et al. (2021), AMT 14, 7187–7197.

[3] M. Abel et al. (2012), The Journal of Chemical Physics, 136.

[4] J. Van Kranendonk (1968), Canadian Journal of Physics Vol. 46, N. 10.


How to cite: Vitali, F., Stefani, S., Piccioni, G., Grassi, D., and Snels, M.: Experimental results on the H2-H2 and H2 -He collisional-induced absorption coefficients at typical Jupiter’s upper tropospheric conditions. , EGU General Assembly 2024, Vienna, Austria, 14–19 Apr 2024, EGU24-12107, https://doi.org/10.5194/egusphere-egu24-12107, 2024.

EGU24-12176 | Posters on site | AS5.7

Laboratory investigation of the optical absorption properties of brown carbon in the CESAM simulation chamber using a photoacoustic spectrophone at 405 nm 

Weidong Chen, Zhijin Shang, Layal Fayad, Claudia Di Biagio, Mathieu Cazaunau, Edouard Pangui, Antonin Bergé, Bénédicte Picquet-Varrault, Jean‒Francois Doussin, Fabrice Cazier, Dorothée Devaele, Nicolas Houzel, Eric Fertin, Hongpeng Wu, Lei Dong, and Claire Thaury

Light absorption by atmospheric aerosol particles, such as black and brown carbon (BC and BrC), has important effects on the Earth’s radiative balance and climate. Accurate knowledge of the optical absorption properties of such carbonaceous aerosols is highly needed in order to provide the necessary parameterizations for climate models and for remote sensing in order to constrain their global and regional radiative effect. Nowadays, large-scale model calculations are still too poorly constrained to make sufficiently accurate assessments of the climate effects of absorbing aerosols [1].

In this context, filter-free measurement technique based on photoacoustic spectrophone (PAS) has been developed in order to provide in situ measurements of light absorption by aerosols in their natural suspended state to avoid the measurement artefacts associated with traditional, filter-based absorption photometers.

In the framework of the ANR B2C project, a custom-made PAS operating at 405 nm has been deployed for filter-free measurement of absorption coefficient of brown carbon, produced from oxidation of naphthalene by OH radicals in the CESAM atmospheric simulation chamber [2,3]. Performances of the deployed PAS has been evaluated and characterized with the help of the reference instruments deployed in the measurement campaign, such as aethalometer (AE33), scanning mobility particle sizer (SMPS), NOx Monitor (APNA-370) and TEOM monitor (based on tapered element oscillating microbalances technology).

Experimental details and the preliminary results will be discussed and presented.

Acknowledgments

This work is partially supported by the French national research agency (ANR) under the B2C (ANR-19-CE01-0024), Labex CaPPA (ANR-10-LABX-005) and PIA-ADEME SEAM contracts, the CPER ECRIN program, and the EU H2020-ATMOS project. The CNRS-INSU is gratefully acknowledged for supporting the CESAM chamber as a national facility as well as the AERIS data center for distributing and curing the data produced by the CESAM chamber.

References

[1] C. Cappa, R. Kotamarthi, A. Sedlacek, C. Flynn, E. Lewis, A. McComiskey, N. Riemer, "Absorbing Aerosols Workshop Report", U.S. Department of Energy, Climate and Environmental Sciences Division, January 20-21, 2016.

[2] J. Wang, J. F. Doussin, S. Perrier, E. Perraudin, Y. Katrib, E. Pangui, and B. Picquet-Varrault, "Design of a new multi-phase experimental simulation chamber for atmospheric photosmog, aerosol and cloud chemistry research", Atmos. Meas. Tech. 4 (2011) 2465–2494

[3] H. Yi, M. Cazaunau, A. Gratien, V. Michoud, E. Pangui, J.-F. Doussin, W. Chen, "Intercomparison of IBBCEAS, NitroMAC and FTIR for HONO, NO2 and CH2O measurements during the reaction of NO2 with H2O vapour in the simulation chamber CESAM", Atmos. Meas. Tech. 14 (2021) 5701–5715

How to cite: Chen, W., Shang, Z., Fayad, L., Di Biagio, C., Cazaunau, M., Pangui, E., Bergé, A., Picquet-Varrault, B., Doussin, J., Cazier, F., Devaele, D., Houzel, N., Fertin, E., Wu, H., Dong, L., and Thaury, C.: Laboratory investigation of the optical absorption properties of brown carbon in the CESAM simulation chamber using a photoacoustic spectrophone at 405 nm, EGU General Assembly 2024, Vienna, Austria, 14–19 Apr 2024, EGU24-12176, https://doi.org/10.5194/egusphere-egu24-12176, 2024.

EGU24-12365 | ECS | Orals | AS5.7

Deriving Nitrogen Oxide emissions from inland waterway vessels using MAX-DOAS and in-situ measurements: First results from Koblenz, Germany 

Simona Ripperger-Lukosiunaite, Steffen Ziegler, Philipp Eger, Sebastian Donner, Peter Hoor, and Thomas Wagner

Nitrogen oxides (NOx, i.e., NO and NO2) are a major contributor to urban air pollution. They have negative impacts on human health and play an important role in tropospheric chemistry. NO2 causes respiratory and cardiovascular problems and is a precursor of secondary particulate matter and tropospheric ozone, which are also associated with adverse effects on human health. Long-lasting diesel engines of inland waterway vessels operate at high temperatures and are strong NOx emitters. These emissions are concentrated in the vicinity of waterways and have the potential to be a significant source of local air pollution, affecting the air quality and health of people living near waterways. To assess the impact of inland ships on air quality, it is important to have a better understanding of their emission levels by obtaining real-world emission data.

Remote sensing techniques, such as Multi-AXis Differential Optical Absorption Spectroscopy (MAX-DOAS), offer several advantages in determining inland ship emissions. They can be directed to the emission plume from a distance (e.g., from the shore of the river) and provide integrative measurements, yielding the integrated trace gas concentration across the plume, which allows quantitative emission estimates. By using plume scans, the second across plume dimension can be captured, and when combined with wind information, total trace gas emissions can be calculated. The combination of MAX-DOAS and in-situ measurements could lead to more accurate estimates of ship emissions by providing important additional information on the composition of the plume and its chemical evolution. Here we present the first results retrieved from MAX-DOAS and in-situ observations conducted along the Rhine River in Koblenz, Germany.

How to cite: Ripperger-Lukosiunaite, S., Ziegler, S., Eger, P., Donner, S., Hoor, P., and Wagner, T.: Deriving Nitrogen Oxide emissions from inland waterway vessels using MAX-DOAS and in-situ measurements: First results from Koblenz, Germany, EGU General Assembly 2024, Vienna, Austria, 14–19 Apr 2024, EGU24-12365, https://doi.org/10.5194/egusphere-egu24-12365, 2024.

EGU24-13769 | Posters on site | AS5.7

Detection of iodine oxide by Broadband Cavity-Enhanced Absorption Spectroscopy (BBCEAS) based on an ICAD (iterative cavity-enhanced DOAS) algorithm 

Min Qin, Jianye Xie, Baobin Han, Wu Fang, Helu Zhang, Dou Shao, Enbo Ren, Xiadan Zhao, Zhitang Liao, Jun Duan, and Pinhua Xie

Correspondence: Min Qin (mqin@aiofm.ac.cn)

Abstract: Iodine oxide (IO) radicals, as a significant active halogen species in the iodine cycle, play a crucial role in the ozone depletion process. They affect atmospheric chemistry by altering the distribution of NO/NO2 and OH/HO2 radicals. In coastal regions, IO radical play an important role in the formation of ultrafine aerosol particles. The nucleation of these particles affects cloud properties, thereby impacting the climate.

Therefore, for the monitoring and understanding of its tropospheric chemical processes, it is important to explore and develop new techniques for the sensitive measurement of IO. Here, the quantitative method for detection atmospheric IO radicals using Broadband Cavity-Enhanced Absorption Spectroscopy (BBCEAS) technique was introduced. Considering the spectral absorption characteristics of IO radicals in the 435 - 465 nm wavelength region, as well as the actual atmospheric levels in the marine boundary layer, the parameters which affected the BBCEAS system performance were investigated. An iterative algorithm (ICAD) which actually models the light path reduction from the derived absorbers in the optical resonator applied to BBCEAS technique was established. Constant IO concentration used to evaluate the IO sampling loss was generated from the photolysis of molecular iodine (I2) and then reacting with ozone (O3). Nitrogen was bubbled through a solution of I2 and potassium iodide (KI) to take out I2 and then diluted before the reaction between iodine (I) and O3 occurring. The loss of IO within a 10-meter sampling tube was estimated to be approximately 2%, which can be neglected. The system's performance was assessed using Allan variance. For an acquisition time of 60 s, 2σ detection limits for IO and NO2 were about 1.9 pptv and 20 pptv, respectively. The dependency between IO radicals generated from the photolysis of iodine emitted by seaweed and seaweed activity was investigated in the laboratory. The peak of IO radicals reached a maximum value of 50 pptv with O3 at ppmv level, and subsequently the IO radicals showed a declining trend with the reduction of seaweed activity.

Acknowledgements: This work was supported by the National Key Research and Development Program of China (Grant No. 2022YFC3700300) and the HFIPS Director’s Fund (Grant No. YZJJQY202205). 

How to cite: Qin, M., Xie, J., Han, B., Fang, W., Zhang, H., Shao, D., Ren, E., Zhao, X., Liao, Z., Duan, J., and Xie, P.: Detection of iodine oxide by Broadband Cavity-Enhanced Absorption Spectroscopy (BBCEAS) based on an ICAD (iterative cavity-enhanced DOAS) algorithm, EGU General Assembly 2024, Vienna, Austria, 14–19 Apr 2024, EGU24-13769, https://doi.org/10.5194/egusphere-egu24-13769, 2024.

EGU24-14103 | ECS | Orals | AS5.7

Detection of iodine over the continental United States: Implications for ozone and mercury oxidation 

Christopher Lee, Tyler Elgiar, Liji David, Kai Wilmot, Margarita Reza, Noah Hirshorn, Ian McCubbin, Seth Lyman, Gannet Hallar, Lynne Gratz, and Rainer Volkamer

Most of our knowledge about the global distribution of atmospheric iodine is based on measurements of iodine monoxide (IO) radicals in the marine boundary layer and at high latitudes. Recent evidence of IO in the free troposphere is limited to few available aircraft measurements over oceans. We report the first ground-based Multi-AXis Differential Optical Absorption Spectroscopy (MAX-DOAS) observations of tropospheric IO radicals over the central continental United States. IO vertical columns measured at Storm Peak Laboratory, CO (40.455°N, 106.744°W, 3220 m.a.s.l.) are similar to those over oceans and vary significantly. A priori sensitivity studies indicate that IO mixing ratios increase with altitude. Back trajectory modeling indicates that IO is consistently observed in air masses quickly transported from over the Pacific Ocean. We compare the IO columns and their variability with predictions by a global model and use the observations to constrain a chemical box model to assess the atmospheric implications for ozone and mercury oxidation. Iodine-induced mercury oxidation is currently missing in atmospheric models, understudied, and helps to partially explain the elevated concentrations of oxidized mercury measured at SPL.

How to cite: Lee, C., Elgiar, T., David, L., Wilmot, K., Reza, M., Hirshorn, N., McCubbin, I., Lyman, S., Hallar, G., Gratz, L., and Volkamer, R.: Detection of iodine over the continental United States: Implications for ozone and mercury oxidation, EGU General Assembly 2024, Vienna, Austria, 14–19 Apr 2024, EGU24-14103, https://doi.org/10.5194/egusphere-egu24-14103, 2024.

EGU24-14175 | Posters on site | AS5.7

Preliminary GEMS L2 validation results using ground-based measurements during the ASIA-AQ/SIJAQ campaign 

Hyunkee Hong, Hanlim Lee, Ukkyo Jeong, Joowan Kim, Serin Kim, and Donghee Kim

To validate L2 data of the Geostationary Environment Monitoring Spectrometer (GEMS) and to understand the causes of particulate matter generation in winter season, the National Institute of Environmental Research (NIER) in Korea and the National Aeronautics and Space Administration (NASA) in the U.S. will carry out a field campaign over four Asian countries (South Korea, the Philippines, Malaysia, and Thailand) in February through March 2024. In this campaign, NIER will install 12 ground-based remote sensing instruments such as Pandora, Max-DOAS, and AQ-Profiler in and around the Seoul metropolitan area and  retrieve nitrogen dioxide (NO2), formaldehyde, ozone vertical column density, NO2 vertical profile as well as aerosol properties (aerosol optical depth, single scattering albedo, size distribution, etc.). Especially, to investigate pixel inhomogeneity, we installed four instruments around an industrial complex within one GEMS pixel. During this campaign, NASA will observe NO2 and HCHO vertical column density using air-borne remote sensing instruments (e.g., GCAS: GeoCAPE airborne Simulator). Through this campaign, we plan to validate the performance of GEMS L2 data using ground-based and airborne measurements.

How to cite: Hong, H., Lee, H., Jeong, U., Kim, J., Kim, S., and Kim, D.: Preliminary GEMS L2 validation results using ground-based measurements during the ASIA-AQ/SIJAQ campaign, EGU General Assembly 2024, Vienna, Austria, 14–19 Apr 2024, EGU24-14175, https://doi.org/10.5194/egusphere-egu24-14175, 2024.

EGU24-15609 | ECS | Posters on site | AS5.7

Gas measurement method based on Angle dependence of F-P cavity transmittance 

Yinsheng Lv, Pinhua Xie, Jin Xu, Jun Duan, and Xin Tian

Correspondence: Pinhua Xie(phxie@aiofm.ac.cn)

This study introduces a gas measurement method employing Fabry–Pérot (F-P) interferometer correlation spectroscopy. The methodology capitalizes on the angle-dependent characteristics of the F-P interferometer transmission spectrum, aligning interference peaks with gas absorption cross-section features. The experimental setup features a dual-beam synchronous incidence F-P cavity, and a forward model is developed to scrutinize the impact of system parameters on measurement outcomes. A comprehensive investigation into factors affecting the effective transmittance of the F-P cavity is conducted. The analysis reveals that controlling the beam divergence angle significantly influences the spectral resolution of gas measurements, particularly when utilizing the angle-dependent nature of the F-P cavity with oblique beam incidence. Ultimately, this study conducts concentration measurement experiments for gases such as SO2 and CH4, demonstrating the method's efficacy in quantitatively assessing gas concentrations. Given that this approach relies on hardware-based spectral selection to achieve differential measurements, it emerges as a highly selective method for gas measurement. It exhibits robust resistance to cross-interference, holding promise for applications in imaging and facilitating rapid measurements.

Funding. Project supported by the National Natural Science Foundation of China (Grant No. U19A2044), the National Natural Science Foundation of China (Grant No. 41975037), and the Key Technologies Research and Development Program of Anhui Province (Grant No. 202004i07020013).

Acknowledgment. My sincere gratitude goes to Mr. Yingjie Ye for his invaluable assistance in conducting the experiments.


How to cite: Lv, Y., Xie, P., Xu, J., Duan, J., and Tian, X.: Gas measurement method based on Angle dependence of F-P cavity transmittance, EGU General Assembly 2024, Vienna, Austria, 14–19 Apr 2024, EGU24-15609, https://doi.org/10.5194/egusphere-egu24-15609, 2024.

EGU24-15754 | ECS | Orals | AS5.7 | Highlight

Urban application of the AOTF-based NO2 camera  

Cedric Busschots, Pierre Gramme, Noel Catherine Baker, Emmanuel Dekemper, Stefano Casadio, Anna Maria Iannarelli, Annalisa Di Bernardino, and Jurgen Vanhamel

To date, efforts to map ground-level NO2 distribution have primarily utilized visible-light scanning grating spectrometers, such as MAX-DOAS and Pandora. Although these instruments boast high retrieval accuracy, their spatiotemporal resolution remains relatively low, limiting the detection of dynamic features and strong spatial gradients.

In recent years, a novel passive remote sensing instrument called the NO2 camera was developed at the Royal Belgian Institute for Space Aeronomy (BIRA-IASB). This instrument aims to measure 2D distributions of NO2 slant column densities (SCDs) with enhanced spatiotemporal resolution over both extensive areas and in point-source plumes. Central to this instrument is the acousto-optical tunable filter (AOTF), providing both sufficient spectral resolution (~0.7nm) for resolving NO2 absorption cross-section structures and tunability across a broad spectral range.

The measurement approach involves sequential acquisitions of monochromatic images of a scene. A hypercube is constructed by tuning the AOTF to specific wavelengths within the 440-450nm range. This hypercube is a 3D array with two spatial dimensions and one spectral axis.

Conventional methods, such as DOAS, process the acquired light spectrum for each pixel's field of view to retrieve NO2 SCD. The hypercube resulting from a measurement with this AOTF-based NO2 camera is a 512x512 array of NO2 SCD values, taken at approximately 50 different wavelengths collected in around 1 minute, achieving a spatial sampling of less than 1 m, from distance of 1 km. Due to this high spatial resolution of the NO2 camera, the pixels that will be processed can be selected very carefully.

Under the QA4EO IDEAS+ framework, the NO2 camera has been selected for further development. At EGU, we will present the results from the associated measurement campaign, performed in spring 2024 on the rooftop of the Sapienza University in Rome.

This work is partially supported by the QA4EO contract QA4EO/SER/SUB/33.

How to cite: Busschots, C., Gramme, P., Baker, N. C., Dekemper, E., Casadio, S., Iannarelli, A. M., Di Bernardino, A., and Vanhamel, J.: Urban application of the AOTF-based NO2 camera , EGU General Assembly 2024, Vienna, Austria, 14–19 Apr 2024, EGU24-15754, https://doi.org/10.5194/egusphere-egu24-15754, 2024.

EGU24-16415 | Orals | AS5.7

Trace gas detection on a photonic chip with sub-ppb detection levels and isotope discrimination  

Jana Jágerská, Ragnar Seton, Roman Zakoldaev, Jehona Salaj, and Marek Vlk

Spectroscopic techniques, such as laser absorption spectroscopy (LAS), are the gold standard for trace gas detection in environmental research and atmospheric monitoring. Nevertheless, the large size and cost of the LAS instruments limit the scale and contexts in which they can be employed. A promising solution to this challenge is the development of LAS sensors based on photonic integrated circuits. However, the detection limits of the on-chip sensors remain to date in the upper ppm range, i.e. several orders of magnitude higher than that of large instruments based on bulk optics. 

Here we will present an on-chip LAS sensor based on an integrated nanophotonic waveguide capable of detecting CO2 with a record-low sensitivity of 20 ppb. This result was achieved through a careful waveguide design, aiming at (i) operation in the mid-infrared spectral range, (ii) strong evanescent field interaction between the guided light and the gas sample, and (iii) minimizing spurious etalons that are a major source of spectral noise in on-chip devices. Moreover, with this sensor we demonstrate the first δ13C isotope ratio measurement realized with an on-chip device. The achieved precision of the order of 1‰ is comparable with high-end commercial instruments.  

This work is more than an incremental step in on-chip gas sensor development; it is a leap forward for in-situ gas monitoring. Our sensors offer a scalable, efficient solution for autonomous monitoring of remote areas and sensor networks of the future. Additionally, with their minute active sensing volume (microlitre), the on-chip devices open new possibilities for applications where small sample volumes are required such as ice-core samples analysis and microbiological essays

How to cite: Jágerská, J., Seton, R., Zakoldaev, R., Salaj, J., and Vlk, M.: Trace gas detection on a photonic chip with sub-ppb detection levels and isotope discrimination , EGU General Assembly 2024, Vienna, Austria, 14–19 Apr 2024, EGU24-16415, https://doi.org/10.5194/egusphere-egu24-16415, 2024.

EGU24-18145 | Posters on site | AS5.7

Laser based observations of key inorganics (LOKI) on-board the UK research aircraft 

Stuart Young, Pete Edwards, Loren Temple, Jake Vallow, Sam Rogers, Eve Grant, and Andrew Rollins

The UK research aircraft is being equipped with flux capable measurements of NO, NO2, SO2 and O3 in the Laser based Observation of Key Inorganics (LOKI) instrument rack. All instruments within the rack are being made in-house.

This presentation will discuss the aspects of the new instrumentation as well as the sample inlets used that allow high time resolution (10 Hz), high precision measurements to be made over the working envelope of the aircraft.

The need for this improvement in the gas sensing capabilities on board is driven by a number of factors: the increasing desire to use flux measurements to calculate emission rates and identify sources, smaller changes in concentration being of interest (SO2 depletion in clouds) as well as reductions in absolute ambient concentrations of some of these species below the detection limits of currently deployed instrumentation.

Laser Induced Fluorescence is used for NO (Rollins et al., 2020), NO2 (converted to NO), SO2 (Rollins et al., 2016), with O3 being monitored using Broadband Cavity Enhanced Absorption Spectroscopy (BBCEAS) (Hannun et al., 2020).

How to cite: Young, S., Edwards, P., Temple, L., Vallow, J., Rogers, S., Grant, E., and Rollins, A.: Laser based observations of key inorganics (LOKI) on-board the UK research aircraft, EGU General Assembly 2024, Vienna, Austria, 14–19 Apr 2024, EGU24-18145, https://doi.org/10.5194/egusphere-egu24-18145, 2024.

EGU24-19774 | ECS | Posters on site | AS5.7

The Irish Atmospheric Simulation Chamber: a national facility for atmospheric sciences 

Satheesh Chandran, Mixtli Campos-Pineda, Amir Ben Brik, John Wenger, and Albert A. Ruth

The Irish Atmospheric Simulation Chamber (IASC) was established in the Centre for Research into Atmospheric Chemistry at University College Cork (UCC), Ireland to enable the study of fundamental atmospheric processes and to quantify parameters needed in air quality and climate models. This national research infrastructure consists of a custom-built chamber (~27 m3) made of Teflon FEP foil, supported in an aluminium frame, and surrounded by a temperature-controlled enclosure containing 140 UV lamps for experiments on light-driven reactions. Standard parameters such as temperature, pressure (absolute and differential), relative humidity, and CO2 mixing ratios are continuously monitored. The facility is also equipped with a range of commercial instruments for continuous, online measurements of atmospheric constituents including NOX (chemiluminescence detector), O3 (photometer) and particulate matter (scanning mobility particle sizer, SMPS). A time-of-flight chemical ionization mass spectrometer (ToF-CIMS), typically operated using I or C6H6+ as the reagent ion, is used for detecting trace gases and particle phase species, especially organic compounds.

At the core of the facility, however, is a selection of ultra-sensitive optical detector systems, which are based on cavity-enhanced absorption methodologies developed in UCC. The methodologies comprise cavity ring-down spectroscopy (CRDS) and incoherent broadband cavity-enhanced absorption spectroscopy (IBBCEAS) in conjunction with dispersive and high resolution Fourier Transform detection schemes. Target species that can be detected are NO2, NO3 radicals, HONO, glyoxal (CHOCHO), methylglyoxal (CH3COCHO), H2O, and CO2.

With this suite of instrumentation, the IASC can derive much needed information and parameters to constrain predictive atmospheric models and improve forecasts. It enables detailed investigations of a wide range of atmospheric processes including chemical reactions of radicals, volatile organic compound oxidation, secondary pollutant formation, as well as secondary organic aerosol formation and ageing in day and night cycles.

The IASC is an internationally recognized facility with involvement in European research and training networks such as EUROCHAMP-2020 and ATMO-ACCESS. The versatile and highly instrumented nature make the IASC an ideal test bed for the development, testing and benchmarking of new atmospheric monitoring technologies and sensors under controlled (not field) conditions. The current capabilities of IASC will be presented at the EGU conference and typical characterization experiments will be outlined to demonstrate some of its performance.

This work was supported by Science Foundation Ireland (grants 21/FFP-A/8973 & 15/RI/3209).

How to cite: Chandran, S., Campos-Pineda, M., Ben Brik, A., Wenger, J., and Ruth, A. A.: The Irish Atmospheric Simulation Chamber: a national facility for atmospheric sciences, EGU General Assembly 2024, Vienna, Austria, 14–19 Apr 2024, EGU24-19774, https://doi.org/10.5194/egusphere-egu24-19774, 2024.

EGU24-20373 | ECS | Orals | AS5.7

DOAS related techniques and application in photochemical measurement in Changjiang-Huaihe region 

Xin Tian, Pinhua Xie, Min Qin, Renzhi Hu, Jin Xu, Jiangyi Zheng, Feng Hu, and Jun Duan

Correspondence: Pinhua Xie(phxie@aiofm.ac.cn)

The understanding of the causes of photochemical pollution in Changjiang-Huaihe (Jianghuai) region, China, is limited due to the lack of investigation on the spatial-temporal distribution of secondary pollutants and its precursors, meteorological data and atmospheric oxidation. Aiming at this need, an integrated three-dimensional detection system for the key atmospheric components has been established by combining the in-situ and ground based telemetry. To meet the needs of the three-dimensional distribution detection of key atmospheric trace components (precursors - intermediates - secondary pollutants), a trace gas profile inversion algorithm of 50 m vertical resolution based on Monte Carlo method, named McPrA (Monte carlo Profile retrieval algorithm by AIOFM), and a machine learning algorithm based on MAX-DOAS observation were established, respectively. And the Open-path BroadBand Cavity Enhanced Absorption Spectroscopy (OP-BBCEAS) based on ball platform was established to carry out comparative verification and prior optimization for MAX-DOAS inversion algorithm. Long-term spatial-temporal distribution observations of key atmospheric trace components were carried out over the Jianghuai region, China. Aerosol profiles mainly showed the Gaussian shape with the high value concentrated in the range of 0.5-1.5 km. And the key gases profiles showed the exponential shape and concentrated within 1 km of the surface. The potential sources of trace gases at different heights of Hefei City were studied. It was found that aerosol transport from northern Anhui and northern Jiangsu was significant, and its transport layer was concentrated at the altitude of 500 m. For the polluted gases (NO2, SO2 and HCHO), the junction of eastern Anhui and Jiangsu was the main source area for the altitude below 500 m, especially the transport of NO2 was the most significant. With the increase of the altitude, the influence of northern Anhui on Hefei City was gradually enhanced. The result of an integrated analysis of the meteorological factors affecting ozone pollution in Hefei was shown that the highest ozone concentration was mainly under the control of peripheral subsidence of typhoon. Additionally, a typical site for Jianghuai region, named Science Island in Hefei, was set up as a super observatory for photochemical pollution. The characteristics of the ozone control regime in the Jianghuai region were analyzed, and the quantitative response relationship between ozone generation and precursors were revealed.

This work was supported by the National Natural Science Foundation of China (Nos. U19A2044, 42105132, 42030609) and the National Key Research and Development Program of China (No. 2022YFC3700303). 

How to cite: Tian, X., Xie, P., Qin, M., Hu, R., Xu, J., Zheng, J., Hu, F., and Duan, J.: DOAS related techniques and application in photochemical measurement in Changjiang-Huaihe region, EGU General Assembly 2024, Vienna, Austria, 14–19 Apr 2024, EGU24-20373, https://doi.org/10.5194/egusphere-egu24-20373, 2024.

EGU24-20426 | Orals | AS5.7

Vertical Profiling of Greenhouse Gas Mixing Ratios Above a Coastal Marsh and In a High Desert Using a Laser Heterodyne Radiometer. 

J. Houston Miller, Monica M. Flores, Anthony L. Gomez, and David S. Bomse

George Washington University and Mesa Photonics are developing a Laser Heterodyne Radiometer (LHR) that simultaneously measures CO2, CH4, H2O, and O2 mixing ratios throughout the troposphere and lower stratosphere.  One of the prototype instruments is housed in an observatory installed at the Global Change Environmental wetland (GCREW) at the Smithsonian Environmental Research Center (SERC) near Edgewater, Maryland while a nearly identical instrument is located at Mesa Photonics in Santa Fe, NM providing contrast between two very different ecosystems.  The sea level marsh at GCREW is adjacent to a mature secondary upland forest and is also influenced by emissions from the dense population centers within the northeast US megalopolis. The area surrounding the city of Santa Fe, at ~2 km above sea level, is characterized as Juniper scrubland and is sandwiched between Alpine Conifer ecosystems at higher elevations.  The data record from these instruments is anticipated to not only be complementary to other surface concertation and flux measurements but is also expected to be useful in determining transport and land-air surface exchange rates at larger scales. In this presentation, we will review the instrument design and present measurements from both sites spanning these two environments collected throughout the 2023 calendar year. Two spectral areas will be emphasized:           ~1650 nm for quantification of methane and carbon dioxide mixing ratios and ~1278 nm for refined vertical profiling of temperature using fitting of several molecular oxygen transitions.

How to cite: Miller, J. H., Flores, M. M., Gomez, A. L., and Bomse, D. S.: Vertical Profiling of Greenhouse Gas Mixing Ratios Above a Coastal Marsh and In a High Desert Using a Laser Heterodyne Radiometer., EGU General Assembly 2024, Vienna, Austria, 14–19 Apr 2024, EGU24-20426, https://doi.org/10.5194/egusphere-egu24-20426, 2024.

EGU24-21306 | ECS | Orals | AS5.7

Laser-driven stabilized cavity-enhanced absorption spectroscopy for HO2 detection near 1506 nm  

Minh Nhut Ngo, Tong Nguyen-Ba, Mélanie Ghysels-Dubois, Christa Fittschen, Coralie Schoemaecker, and Weidong Chen

Cavity-Enhanced Absorption Spectroscopy (CEAS) [1-3], stands out as a cavity-based approach for sensitive measurement of sample absorption, without the need of complex optical setup and fast electronic devices for the used optical cavity compared to Cavity Ring-Down Spectroscopy (CDRS). CEAS offers continuous data acquisition within rapid scanning of laser frequency. The absorption spectrum is derived from the measured intensity outputs from the cavity with and without sample inside. While in tunable diode laser spectroscopy with wavelength modulation, the baseline is constructed of a high background signal, resulted from direct modulation of the laser power, superimposed with a small gas absorption signal. Achieving precise absorption assessments demands thus overcoming challenges in baseline structure, due to the laser intensity variation during laser frequency scan. Therefore, stabilization of laser intensity to maintain the baseline constant could improve the instrument's stability as well as measurement accuracy and precision.

This work introduces the development and application of a laser Intensity-Stabilized Cavity-Enhanced Spectroscopy (IS-CEAS) operating near 1506 nm. The key innovation lies in employing an acousto-optic modulator (AOM) as an external power actuator for laser intensity stabilization. This strategy resulted in a remarkable 5-fold reduction in the laser intensity noise at lower frequency ranges where the integrated signal is detected. The fluctuations of cavity output intensity during laser scans were effectively eliminated, offering a baseline-free measurement of the absorption. This advancement notably bolstered system stability, enabling nearly 10 times longer integration than the conventional CEAS approach. The developed IS-CEAS system was employed to quantify the concentration of HO2 radicals produced in laboratory, yielding a bandwidth-normalized (1σ) limit of detection for HO2 at 1.6×10⁸ molecule.cm-3.Hz-1/2. This value is comparable to the detection limits achieved by CRDS systems operating at the same wavelength.

The experimental detail and the preliminary results will be presented and discussed.

Acknowledgments The authors thank the financial support from the French ANR Foundation : ICAR-HO2 project (ANR-20-CE04-0003). This work has been partly supported by the EU H2020-ATMOS project, the ANR LABEX CaPPA (ANR-10-LABX-005) project and the regional CPER ECRIN program.


References

[1] M. Mazurenka, A. J. Orr-Ewing, R. Peverall, G. A. D. Ritchie. Annu. Reports Prog. Chem. - Sect. C 2005, 101, 100–142.

[2] W. Chen, A. A. Kosterev, F. K. Tittel, X. Gao, W. Zhao. Appl. Phys. B 2008, 90, 311–315.

[3] M. Ngo, T. Nguyen-Ba, D. Dewaele, F. Cazier, W. Zhao, L. Nähle, W. Chen. Sensors & Actuators: A. Physical 2023, 362, 114654

How to cite: Ngo, M. N., Nguyen-Ba, T., Ghysels-Dubois, M., Fittschen, C., Schoemaecker, C., and Chen, W.: Laser-driven stabilized cavity-enhanced absorption spectroscopy for HO2 detection near 1506 nm , EGU General Assembly 2024, Vienna, Austria, 14–19 Apr 2024, EGU24-21306, https://doi.org/10.5194/egusphere-egu24-21306, 2024.

EGU24-40 | Posters on site | AS5.10

Analysis of Aerosol Pollution over North-Western Nigeria 

Rabia Sa’id S. and Shettima Hussain

This paper analyzes the optical properties and air mass trajectory of aerosol pollution over North-West (NW) Nigeria. The paper studied the Aerosol Optical Depth (AOD), Angstrom Exponent (AE), Single Scattering Albedo (SSA) and air mass trajectory analysis of aerosols pollution over NW Nigeria from 2018 to 2022. For this purpose, the use of satellite products from Ozone Monitoring Instrument (OMI), the Moderate Resolution Imaging Spectroradiometer (MODIS), and back trajectories of air movements calculated using the Hybrid Single Particle Lagrangian Integrated Trajectory Model (HYSPLIT) were employed. AOD values were found to reach peak values (~1 at 500 nm) across the years in the study except in 2020, which, showed a steep decline in AOD values during the period. It is surmised that the decline might have been due to the lock down due to Covid19 when vehicular movement that generate particulate matter and black carbon, construction that generate dust plumes were minimal. Analysis of the optical characteristics of the aerosols studied, supported the observation that the pollution consists of mainly Saharan dust and anthropogenic aerosols with a well-defined seasonal cycle. This assumption was confirmed by HYSPLIT backward trajectories and MODIS images.

Keywords: MODIS, Aerosol Optical Depth, Single Scattering Albedo, Angstrom Exponent, Ozone Monitoring Instrument, HYSPLIT.

How to cite: Sa’id S., R. and Hussain, S.: Analysis of Aerosol Pollution over North-Western Nigeria, EGU General Assembly 2024, Vienna, Austria, 14–19 Apr 2024, EGU24-40, https://doi.org/10.5194/egusphere-egu24-40, 2024.

EGU24-88 | ECS | Posters on site | AS5.10

The potential of using a combination of in-situ, campaign and flight data to analyse Ozone across data sparse regions in Africa 

Raeesa Moolla, Adegun A. Oluwole, Clinton W. Nyathi, and Rebecca Garland and the IGAC-led TOAR Africa over Ozone Working Group

Air pollution and climate change threaten Africa’s development because of their negative impacts on human health, well-being and productivity. Air pollution and climate change reduce agricultural productivity, for example, with implications for food and nutritional security. Two of the biggest issues for African countries are the lack of data on the emissions causing air pollution and climate change, and inadequate policy and implementation capacity. Countries need this data to plan policies that can reduce air pollution and deliver national development priorities and climate goals. Ozone as an anthropogenic greenhouse gas affects the climate beyond increased warming due to its impact on evaporation rates, cloud formation,precipitation levels and atmospheric circulation..  Combustion of fossil fuels is one of the principal processes that release the gaseous precursor pollutants that react to form O3, which is a major factor in Africa, as most populations on the continent are dependent on fossil and  other fuels for heating and cooking,also, emissions from vehicle exhausts and electric generators with unknown ozone concentrations (Ihedike et al, 2023)  . Furthermore, along with the presence of the precursor gases, many meteorological conditions promote the formation of O3 (Guar et al, 2014). The formation, transport, chemical destruction, deposition and atmospheric lifetime of O3 will determine its concentration in any given area.

Aircrafts  and satellites provide a global-scale view on tropospheric ozone and its precursors, with different types of sensors being sensitive to different parts of the atmosphere. They help in improving forecasting of weather conditions and more recently in improving   predictions of air quality. Data from these aircraft and satellite  sensors are complementary to more detailed and more precise data sets . A wide variety of trends and variations in tropospheric ozone were reported by aircraft sensors in the Tropospheric Assessment Report (TOAR Phase I) in the 1990s (Gaudel 2018).The distribution of the tropospheric ozone over the western Pacific Ocean has also been observed during aircraft experiments, but in Africa there has been little information on these data findings and as well their potential limitations. However, this project intends to address these knowledge gaps. Data from these aircraft sensors are complementary to more detailed and more precise in-situ data that are spatially and temporally limited in which this study intends to address. Prelimanary results from the Working Group will be presented, as well as challenges and limitations of data aquisition and data represntation, in data scarce regions.

How to cite: Moolla, R., Oluwole, A. A., Nyathi, C. W., and Garland, R. and the IGAC-led TOAR Africa over Ozone Working Group: The potential of using a combination of in-situ, campaign and flight data to analyse Ozone across data sparse regions in Africa, EGU General Assembly 2024, Vienna, Austria, 14–19 Apr 2024, EGU24-88, https://doi.org/10.5194/egusphere-egu24-88, 2024.

EGU24-107 | ECS | Orals | AS5.10

Validation of Multiple Satellite Aerosol Optical Depth (AOD) Retrievals Using Ground-Based AERONET AOD Data over West Africa 

Muawiya Sani, Rabia Salihu Said, Tijjani Bello Idrith, and Sunusi Usman Yerima

Aerosol Optical Depth (AOD) is an essential parameter for understanding atmospheric aerosol distribution and its impact on climate and air quality. Satellite-based AOD retrievals play a crucial role in large-scale studies, but their accuracy necessitates validation against ground-based measurements. This study focuses on validating AOD data products from multiple satellite sensors (MODIS TERRA, MODIS AQUA, MISR, OMI and MERRA-2) using high-quality ground-based Aerosol Robotic Network (AERONET) AOD data within the West African region. The study aims to assess the performance of different satellite sensors in capturing the spatiotemporal variability of aerosol loading over West Africa for the period 2000–2022. Six AERONET stations (Banizoumbou, Cinzana, Ilorin, Dakar, Capoverde, and Koforidua) are considered within three sub-regions of West Africa (Sahel, Savannah, and Guinea Coast). Rigorous validation techniques, including intercomparison analysis and statistical metrics, are employed to evaluate the agreement between satellite-derived AOD and AERONET measurements. Preliminary results indicate that satellite retrievals generally capture the broad-scale patterns of aerosol distribution in West Africa. However, this study reveals significant discrepancies in some regions, emphasizing the need for improved satellite algorithms, especially in areas with complex aerosol properties. Furthermore, the analysis identifies the best-performing satellite sensors at each AERONET station when employing either daily or monthly data. Daily analysis revealed MODIS AQUA had the best agreement at Banizoumbou, Cinzana Capoverde and Koforidua, while MISR and MODIS TERRA performed best at Dakar and Ilorin, respectively. On the other hand, the monthly analysis revealed MODIS TERRA performs best at Banizoumbou, Dakar, and Capoverde stations, while MERRA performs best at Cinzana and Ilorin stations. MISR shows relatively lower performance compared to MODIS TERRA and MERRA at Banizoumbou and Koforidua stations. But surprisingly, MODIS AQUA wasn’t the best performer at any of the stations based on monthly analysis. These findings highlight the importance of enhancing satellite algorithms to improve the accuracy of aerosol retrievals and the importance of taking caution when selecting a type of satellite data product and the temporal resolution to use for climate studies, air quality monitoring, and environmental management in regions with intricate aerosol characteristics.

Keywords: Aerosol Optical Depth (AOD), MODIS TERRA, MODIS AQUA, MISR, OMI, MERRA-2, Aerosol Robotic Network (AERONET), West Africa.

How to cite: Sani, M., Salihu Said, R., Bello Idrith, T., and Usman Yerima, S.: Validation of Multiple Satellite Aerosol Optical Depth (AOD) Retrievals Using Ground-Based AERONET AOD Data over West Africa, EGU General Assembly 2024, Vienna, Austria, 14–19 Apr 2024, EGU24-107, https://doi.org/10.5194/egusphere-egu24-107, 2024.

Wildfires, primarily over the Indo-Gangetic Plain, southern hilly region of Nepal, cause exceptionally high levels of pollution in the Central Himalayan region during the pre-monsoon season. Although wildfire smoke is one of the main sources of pollution, little research has been done on it. During the pre-monsoon season of 2021, we studied a hazardous level of air pollution in Kathmandu Valley, Nepal, using multiple datasets, including in-situ measurements, reanalysis data, and backward trajectory analysis. A total of 13 days exceeded the extreme pollution level of 134.29 μg/m3 (Mean + 2 * S.D.), with the highest daily concentration reaching 305 μg/m3. We found that smoke transported from nearby and transboundary wildfires was the main cause of the hazardous pollution in the valley. Furthermore, we discovered that the number of wildfires in the source region during that year was the highest on record. A strong correlation existed between daily active fire counts and valley pollution levels. The larger correlation among nearby locations indicates a greater responsibility for the increasing pollution, and it also reflects the rapid movement of pollutants into the valley. Due to the bowl-shaped structure of the valley, pollution accumulated and showed a considerable influence from nearby wildfires when it lagged by two days, reaching a maximum of 0.89 (p<0.05). Because of the calm wind conditions in the valley, a diurnal pollution pattern from the previous days persisted, although it was insufficient to entirely flush pollutants from the valley. Additionally, we noticed that synoptic and mesoscale dynamics in the area regulate the transport of pollutants to the valley. Since wildfire pollution affects people and economic activity in this region, conclusions drawn from research like ours may serve as a starting point for the implementation of legislation aimed at reducing the effects of wildfires and the air pollution they cause.

How to cite: Kuikel, S. and Pokharel, B.: The role of wildfires in surrounding regions in exacerbating air pollution in the central Himalayas of Nepal, EGU General Assembly 2024, Vienna, Austria, 14–19 Apr 2024, EGU24-122, https://doi.org/10.5194/egusphere-egu24-122, 2024.

EGU24-138 | ECS | Orals | AS5.10

City-wide measurement of outdoor PM2.5 and black carbon to support evidence-based environmental policy in Dhaka, Bangladesh 

Riaz Hossain Khan, Anisur Rahman Bayazid, Martha Lee, Md. Kamrul Hasan, Tasnim Abdary Anonna, Lauren Rosenthal, Zahidul Quayyum, Benjamin Barratt, and Jill Baumgartner

Existing literature reported high concentrations of ambient particulates, specifically during the dry months, severely affecting street and construction site workers, elderly, and school-aged children in Dhaka city, Bangladesh. The available air quality data from only three continuous air monitoring stations is inadequate for any evidence-based study regarding public health outcomes. Significant knowledge gaps exist due to air monitoring networks being limited to low-cost optical sensors, key suburban areas, slum areas, and industrial areas remaining uncovered and little information about sources contributing to air pollution. Therefore, this ongoing air monitoring study aimed to conduct a city-wide measurement campaign of fine particulate matter (PM2.5) and black carbon (BC), investigate source contributors to air pollution using source apportionment analysis, and produce spatiotemporal land use regression (LUR) models to estimate PM2.5 and BC concentrations across the city. The study team has recently conducted two seasonal (two months each) air monitoring campaigns from systematically designed eight fixed sites and sixty-one rotating sites considering the major land use classes across the city domain. Sites covered different land use types such as commercial, residential, industrial, suburban, major roads, green space, and brick kilns. The significant challenges during the air monitoring campaign included high road traffic from religious congress, political protests, and waterlogging from sudden intense rainfall. Weather conditions such as high heat and heavy rain affected the functioning and performance of equipment. Besides, exposure of the field team to dengue outbreaks, particularly during the wet season, had to be dealt with. Preliminary results showed that the unadjusted concentration of PM2.5 from the Zefan sensors was substantially higher (often exceeded the WHO 24-hour standard) in the dry season compared to the wet season across the different monitoring sites. Concentrations were also higher during nighttime compared to daytime in both seasons, and this difference was much more pronounced in the dry season. The fixed site in a significant industrial area, Shyampur, showed the highest concentrations compared to the other sites during both seasons, with a dry season average of approximately 290 ug/m3 and a wet season average of about 175 ug/m3. The real-time PM2.5 data will be further validated with filter-based gravimetric measurements for quality assurance. Filters are currently being analyzed for mass, black carbon, and chemical composition in a geochemistry laboratory. Incorporating source apportionment analysis and land use-based regression models of the datasets will support source identification. This will help to improve air pollution mitigation policies and implementation plans for reducing pollution while targeting its sources. The ultimate findings of this research will be conducive to assessing public health outcomes by incorporating socio-economic, demographic, and health data with the air quality data from this study, which is much needed in formulating an improved public health policy.

How to cite: Khan, R. H., Bayazid, A. R., Lee, M., Hasan, Md. K., Anonna, T. A., Rosenthal, L., Quayyum, Z., Barratt, B., and Baumgartner, J.: City-wide measurement of outdoor PM2.5 and black carbon to support evidence-based environmental policy in Dhaka, Bangladesh, EGU General Assembly 2024, Vienna, Austria, 14–19 Apr 2024, EGU24-138, https://doi.org/10.5194/egusphere-egu24-138, 2024.

EGU24-166 | ECS | Posters virtual | AS5.10

Emission Inventory and Critical Assimilative Carrying Capacity of Petroleum Refinery in India 

Udita Gupta, Sruthi Jayaraj, and Shiva Nagendra S. M.

Petroleum refineries generate hydrocarbons, SO2, SO3, VOCs, NOx, CO, and PM10/2.5 as air pollutants through fuel combustion for operating process units/stacks, evaporation from tank farms, fugitive emissions, etc., which have been found to be responsible for causing episodic health effects in the population residing nearby the refinery. The stack emissions are one of the lesser studied and a major contributor to air pollution from a petroleum refinery. This paper calculates its emission inventory using the USEPA Methodology based on fuel consumption and simulates ground-level concentration using the dispersion model. Further, the study calculates critical assimilative carrying capacity (ACC) and remaining carrying capacity (RCC) by conducting iterative simulations on CALPUFF View, a Lagrangian approach based Gaussian Puff Dispersion Model. The total emissions of SO2, NO2, PM10, and CO are found to be 2331.57, 1665.34, 213.565, and 800.841 tons/year respectively, the majority of which are contributed by primary and captive process units. The 24-hour average maximum predicted concentration values for SO2 and NO2 are 26.8 μg/m3 and 27.9 μg/m3 respectively which occurred in the winter season. The lower ground levelconcentrations are attributed to the use of fuel oil with sulphur content (0.75% by mass), Sulphur Recovery Unit (SRU) which recovers sulphur element from acid gases and low NOx burners. By iterative simulations, it is found that for SO2 and NO2, 65% of the carrying capacity remains at current emissions and the current RCC of NO2 and SO2 stands at 4327.6 tons/year and 3091.06 tons/year respectively. The minimum RCC is observed for winters, corresponding to the minimum ventilation coefficient of 1517.15 m2/s, and similarly, the maximum RCC is observed for the summer season at maximum ventilation coefficient of 3413.49 m2/s. The peak values of ACC and RCC can be used for planning possible expansion of the refinery and seasonal variation of the ACC and RCC can be used to bring down the plant capacity in winter and post-monsoon seasons.

How to cite: Gupta, U., Jayaraj, S., and Nagendra S. M., S.: Emission Inventory and Critical Assimilative Carrying Capacity of Petroleum Refinery in India, EGU General Assembly 2024, Vienna, Austria, 14–19 Apr 2024, EGU24-166, https://doi.org/10.5194/egusphere-egu24-166, 2024.

Urban-scale atmospheric dispersion models play a crucial role in air quality (AQ) management, enabling the evaluation of pollutant concentration distribution in unsampled regions and determining necessary emission reductions for compliance with local regulations. However, a significant challenge in implementing air quality models is that their performance assessment requires observations from numerous AQ monitoring stations, a resource often lacking in low and middle-income countries. This constraint is particularly evident in the case of the DAUMOD-GRS model, developed for estimating nitrogen dioxide (NO2) and ozone (O3) concentrations in the Metropolitan Area of Buenos Aires (MABA), where AQ monitoring is scarce. In an effort to overcome this limitation and comprehensively understand model outcomes, even in non-monitored areas, we have devised two innovative methods employing big data techniques. The first method focuses on analysing both input and output (I/O) conditions that are associated with elevated air pollutant concentrations, without relying on observational data. For instance, applying a clustering analysis to an ensemble of I/O data related to summer maximum O3 concentrations in the MABA showed four distinct solution patterns varying with emissions. This analysis revealed different ozone dynamics in the suburban areas. A similar approach used to investigate conditions leading to elevated hourly NO2 concentrations suggested that the model's memory effect could contribute significantly to overestimations in low emission zones of the MABA under conditions of low wind speed. The second method was used to analyse the first long time series of hourly NO2 concentrations measured in the city, which have become recently available. This has allowed a comprehensive assessment of the performance of DAUMOD-GRS. While the model shows an overall acceptable performance at the three monitoring sites, a complementary methodology was introduced to discern whether errors are randomly distributed or concentrated in specific regions within the space of the input data conditions. Employing a k-means algorithm on three daily-calculated performance metrics (FB, NMSE and R), we ranked days according to their levels of model performance. This approach revealed a systematic underestimation of NO2 concentration at the coastal monitoring site when winds come from the river, suggesting a significant impact of the southernmost power plant. Furthermore, it highlighted that the removal of the memory effect leads to an improved estimate of the daily maximum NO2 concentrations. Subsequent re-evaluation of the first method after this modification identified a large number of NO2 events concentrated in a few hours during warm months. A detailed analysis of these cases revealed a change in the reporting of low wind speed values from 2010 onwards. These examples show that analysing both I/O data of high pollutant concentrations and disaggregating model errors by short time periods can help identify possible model improvements and increase confidence in model results in a context of limited air quality monitoring.

How to cite: Pineda Rojas, A. and Kropff, E.: Big data techniques to improve the performance of an air quality model in a mega-city with limited air pollution monitoring, EGU General Assembly 2024, Vienna, Austria, 14–19 Apr 2024, EGU24-186, https://doi.org/10.5194/egusphere-egu24-186, 2024.

EGU24-233 | ECS | Orals | AS5.10

Unravelling the chemical speciation and sources of PM2.5-bound polycyclic aromatic hydrocarbons (PAHs) in Nairobi, Kenya 

Elizabeth Mutua, Michael J. Gitari, August Andersson, Samuel M. Gaita, and Leonard Kirago

Air pollution is a major environmental human health risk in African cities, largely due to the rapidly growing urban population, unregulated traffic and industrial emissions, and inadequate regulations and pollution control policies. Currently, about a million premature deaths are linked to air pollution in Africa, and the related health burden is projected to increase. However, data on PM2.5 chemical characterization and source contribution, needed to address the air pollution challenges and inform policies, is currently limited and/ or inadequate for most African cities. In this view, year-round PM2.5 quartz filter samples were collected in Nairobi city and analyzed for mass concentration and PAHs (known for their carcinogenic and mutagenic properties). The average PM2.5 concentration was determined at 27 ± 6 µgm-3, exceeding the World Health Organization 24-h health guideline. The PAHs concentration ranged between 5 - 20 ng m-3 and were dominated by the heavy molecular weight PAHs (>4 rings). Molecular diagnostic ratios further revealed that the PAHs predominantly originate from combustion sources, such as traffic emissions. Overall, this study signal to a severe health concern, and provide information that can be exploited for policy formulation and air pollution mitigation strategies in Nairobi, as well as other African cities.

How to cite: Mutua, E., Gitari, M. J., Andersson, A., Gaita, S. M., and Kirago, L.: Unravelling the chemical speciation and sources of PM2.5-bound polycyclic aromatic hydrocarbons (PAHs) in Nairobi, Kenya, EGU General Assembly 2024, Vienna, Austria, 14–19 Apr 2024, EGU24-233, https://doi.org/10.5194/egusphere-egu24-233, 2024.

Fine particulate matter, PM2.5 - bound toxic metals upon uptake by the human body, plants and animals by various mechanisms pose health risks.  Additionally, they also play a role in altering the biogeochemical cycles of various species following dry/wet deposition onto soils, sediments and water bodies. Assessing the bioavailability of these metals using the total concentrations makes simplifying assumptions about the chemical states that these species are present in and the findings of risk assessments using such models/estimates are likely to have high uncertainties. Literature suggests that the sequential extraction procedure (SEP) is a versatile analytical method to examine the chemical fractionation of metals in particulate matter. Tessier’s SEP approach was used in this study to determine the extent of reactivity of metals in four fractions using specific solvents. Weekly composite of 24 hr integrated ambient PM2.5 samples (n=52+12 field blanks) collected onto Teflon filters, every other during 2019 were used.  These samples were collected at a regionally representative location in Bhopal, central India, as part of the COALESCE ambient aerosol measurement campaign.  Filter samples were utilized to quantify the metal fractions (K, V, Ti, Mn, Fe, Pb, Zn, and Cu) using Inductively Coupled Plasma Optical Emission Spectroscopy (ICP-OES). The internal check of the recovery of metals was determined by comparing the sum of metal fractions concentration with total metal concentration determined using a ED-XRF (Energy Dispersive X-Ray Fluorescence Spectrometer) on the same filters, prior to their leaching. The total sum of fractional concentrations were in good agreement with the bulk metal concentration (slope = 0.24-57.53, r2 = 0.92 -0.99) and the internal recovery ranged from 85%-110% for different analytes. Annual mean concentration of metal fractions of K, Ti, Pb and Zn were higher in the two bioavailable fractions including soluble, exchangeable fraction (F1) and carbonate, oxide and reducible fraction (F2) (43- 67 % of total concentration). Relatively higher proportions of Fe, Mn, and V were less bioavailable and were present in oxidizable fraction (F3) (40- 73 % of total concentration) indicating its high association with organic matter and inorganic sulfides. Cu was strongly bound to its silicate fraction and had its highest proportion present in the residual fraction (F4) (91 % of total concentration). As expected, application of the United States Environmental Protection Agency (USEPA) health risk assessment equations to the measured fractions revealed that the route of exposure for bioavailable metals was highest via the inhalation pathway, followed by dermal contact and ingestion. Total potential non-carcinogenic health risk indicator, the Hazard Quotients were below but close to the safe level of 1 for all bioavailable metal fractions. The cancer risk from bioavailable metal fractions were also within the USEPA acceptable limits for the three pathways. Overall, this work provides a database for bioavailable ambient PM2.5 heavy metals and evaluates potential health risks.  In the future, this work will be extended to assess the impacts of these metals on perturbing the biochemical cycles of these species in this regional environment.

How to cite: Haswani, D. and Raman, R. S.: Chemical fractionation and potential health risks assessment of particulate matter bound heavy metals in Bhopal, Central India , EGU General Assembly 2024, Vienna, Austria, 14–19 Apr 2024, EGU24-239, https://doi.org/10.5194/egusphere-egu24-239, 2024.

The ambient air quality of Dar es Salaam city has been monitored using 14 low cost PurpleAir PA-II sensors deployed May 2021 to measure particulate matter (PM2.5 and PM10).  Daily average of PM2.5 and PM10  concentration recorded at sites across Dares Salaam city between May 2021 and  February 2022, has been analyzed. Higher PM2.5 and PM10 concentration values were observed at Pugu Dampo (77.26 μg/m3 and 90.89 μg/m3 μg/m3, respectively) and DMDP Magomeni (77.25 μg/m3 and 94μg/m3 respectively) as compared to other stations. While Pugu Dampo is an open municipal waste dumpsite, DMDP Magomeni station is located near traffic congestion dominated junction part of the city. Comparing the observed daily mean values of PM2.5 and PM10 across the stations for the study period, the higher value was from Pugu Dampo (37.94 μg/m3) and Vingunguti Primary school (47.49 μg/m3) respectively. Vingunguti Primary schools, is located in industrial area part of the Ilala District and also is near the major traffic roads and not far from the international airport.  Overall, it has been observed that most observed daily mean and maximum values of PM2.5 and PM10 from sensor stations near busy traffic roads, at the municipal waste dumpsite and in industrial areas exceeds the recommended WHO values. Also, the analyzed data, reveals that the pollution from particulate matter varies greatly across the municipal stations and with time of the day.

How to cite: manyele, A. and Mkiramweni, M.: Trends of Particulate Matter PM2.5 and PM10 Concentrations in Dar Es Salaam City Between 2021 and 2022 as measured by Low cost Sensors., EGU General Assembly 2024, Vienna, Austria, 14–19 Apr 2024, EGU24-295, https://doi.org/10.5194/egusphere-egu24-295, 2024.

EGU24-296 | ECS | Posters on site | AS5.10

Leveraging satellite and reanalysis air quality data for bottom-up approach in tackling air pollution in nigeria 

Samuel Ogunjo, Babatunde Rabiu, and Ibiyinka Fuwape

The failure of air pollution mitigation strategies at national levels can be attributed to the disconnect between policy makers and creators of this pollutants. This is not unconnected to lack of data at the smallest level of the society. Sparse air quality data in developing countries have hindered policy implementations for it’s reduction. There is the need to compensate for the sparse data using other sources. In this study, the performance of satellite (WashU) and reanalysis (CAMS) data was evaluated against two low cost sensors – Purple Air and Clarity devices, across several locations in Nigeria. Both models were found to perform fairly well during the wet season but poorly during the dry season. We developed correction factors to improve both satellite and reanalysis data over Nigeria. We further leverage on the corrected data to develop a bottom-up approach to tackle air pollution from the grassroots using a credit reward system. This will make every citizen part of the clean-up process while accelerating holistic and fair transitioning to a clean economy.

How to cite: Ogunjo, S., Rabiu, B., and Fuwape, I.: Leveraging satellite and reanalysis air quality data for bottom-up approach in tackling air pollution in nigeria, EGU General Assembly 2024, Vienna, Austria, 14–19 Apr 2024, EGU24-296, https://doi.org/10.5194/egusphere-egu24-296, 2024.

EGU24-400 | ECS | Orals | AS5.10

Chemical Characterization of Brown Carbon Aerosol Sampled in the Indo-Gangetic Plain Area. 

Pooja Chaudhary, Christopher P West, Raj Singh, Vinayak Sinha, Baerbel Sinha, and Alexander Laskin

The light-absorbing fraction of organic aerosols, commonly known as brown carbon (BrC), is a significant contributor to climate change. Biomass burning (BB) emissions of BrC are ubiquitous over Indo-Gangetic Plain (IGP). BB is very common in India because of biofuel usage for heating and cooking, agricultural residue burning, and uncontrolled garbage burning. Despite their abundance, the molecular-level understanding of BrC composition in IGP area is limited. Here, we investigate chemical composition of BrC collected at a suburban site in the northwest IGP. The aerosol samples were collected at the Atmospheric Chemistry Facility (30.667° N−76.729° E, 310 m above sea level) of the IISER Mohali, India. Compositional information was obtained by employing ambient ionization with high-resolution mass spectrometry. Specifically, Direct Analysis in Real-Time High-Resolution Mass Spectroscopy (DART-HRMS) was used to analyze samples of organic aerosols collected on the filter spots of 7-wavelength aethalometer. The samples were collected in two different seasons – post-monsoon, and winter. Post-monsoon season is dominated by largescale paddy residue burning whereas winter season is dominated by biofuel (wood and dungcakes) burning for heating and cooking purposes. Comparative analysis of optical records from the aethalometer and molecular information from DART-HRMS was used to assess the relationship between the chemical composition and optical properties of BrC.

How to cite: Chaudhary, P., West, C. P., Singh, R., Sinha, V., Sinha, B., and Laskin, A.: Chemical Characterization of Brown Carbon Aerosol Sampled in the Indo-Gangetic Plain Area., EGU General Assembly 2024, Vienna, Austria, 14–19 Apr 2024, EGU24-400, https://doi.org/10.5194/egusphere-egu24-400, 2024.

EGU24-453 | ECS | Posters on site | AS5.10

Open Air Quality Community Data in Pakistan 

Abid Omar and Colleen Marciel F. Rosales

Cities in Pakistan consistently report extreme levels of air pollution, with our low-cost sensor data ranking Lahore as the most polluted major city in the world with annual average PM2.5 levels at 105 µg/m3, and hourly peak eposides reaching 900 µg/m3. At the same time, these cities remain a ‘data gap’ in terms of availability of air quality data with sporadic monitoring by government or by other institutions. Moreover, there is little scientific research interest for Pakistani cities, especially in comparison with other regional LMIC cities that have relatively lower air pollution levels and affected populations.

This paper is the first comprehensive survey of available data for Pakistan, by publishing seven years of low-cost sensor data collected by a low-cost sensor community network for the 4 largest cities in Pakistan, namely Karachi, Lahore, Islamabad, and Peshawar. Statistical comparisons with available reference-standard data and remote sensing data is also done.  

Challenges in data collection are also covered when working in LMIC city areas affected by access issues, intermittent electricity supply and data outages, as well as the learnings from seven years of community work, and use of sensors for community awareness and advocacy in Pakistan. The impact from this community monitoring network has been instrumental in kick-starting awareness in one of the most air-polluted regions of the world.

How to cite: Omar, A. and Marciel F. Rosales, C.: Open Air Quality Community Data in Pakistan, EGU General Assembly 2024, Vienna, Austria, 14–19 Apr 2024, EGU24-453, https://doi.org/10.5194/egusphere-egu24-453, 2024.

EGU24-469 | ECS | Orals | AS5.10

Insights into long-term variations of Black carbon over various metropolitans in Pakistan 

Saadia Hina, Hamna Nisar, Salman Tariq, Muhammad Ibrahim, and Ammara Habib

Black carbon (BC), despite their small contribution in atmospheric aerosol loads, have growing attention for air quality, human health, and climate change implications. This study aims to investigate the long- term spatio-temporal trends of BC over various metropolitan cities in Pakistan through MERRA-2 reanalysis datasets ranging from 2001 to 2022. In addition, statistically significant spatial clusters (hotspots) of BC in Pakistan have been assessed through a geospatial statistical tool (Getis-Ord 𝐺𝑖) and finally, the hybrid Single-Particle Lagrangian Integrated Trajectory (HYSPLIT) model has been applied to identify the path and direction of BC. The increased trend of BC has been observed in winters due to low PBH (planetary boundary layer) and increased anthropogenic activities during this season. The decreased trends of BC were observed in summers due to precipitation and the washout process. Among the metropolitans of Pakistan, the highest values of BC concentration were recorded in Karachi while lowest values have been observed in Islamabad. The findings showed that most of the hotspot regions are in the southern region along with some central areas. The results demonstrate that BC concentration in Pakistan rises annually because of increased biomass burning, vehicle emissions, and transboundary air pollution. It is anticipated that our study will furnish valuable insights for assessing the hotspots of BC along with their local and remote sources across Pakistan.

How to cite: Hina, S., Nisar, H., Tariq, S., Ibrahim, M., and Habib, A.: Insights into long-term variations of Black carbon over various metropolitans in Pakistan, EGU General Assembly 2024, Vienna, Austria, 14–19 Apr 2024, EGU24-469, https://doi.org/10.5194/egusphere-egu24-469, 2024.

EGU24-481 | ECS | Posters on site | AS5.10

Analysis and Policy Response to Mitigate Methane Emissions from Rice Farming for an Environmental- Sustainability 

Dr Gabriel Friday Ibeh, Dr Lawrence M Ibeh, Dr Vincent N Ojeh, and Dr Daniel Okoh

This research present methane distributions and mitigation innovative strategies for environmental sustainability. Satellite methane data from 2015 to 2022 at three locations across Nigeria will be used in this study. Artificial neural network application will be adopted for data modelling and analysis. Methane is a significant greenhouse gas (GHG) and its atmospheric concentration has virtually increased globally due to its anthropogenic sources such as rice farming. Rice farming is one of the engines of economic growth and economy development in Nigeria, at the same time responsible for significant portion of global methane emission which poses risk as a health burden to the environment. The study will investigate the distributions of methane emission within the locations and years of study. Reduction in rice farming will reduce methane and will have negative impact in economy development.  But, if managed properly for environmental sustainability through relevant innovations and technologies, productive rice will be achieved. To mitigate these emissions, there are several policy responses and innovations that can be implemented. The innovative strategies such as microbial process, Happy Seeder Machine approach, changing of rice production practices, integrated agronomic management strategies and other policy approaches can  mitigate and regulate methane emissions from rice farming at the same time have a proper produce. Details application on how these innovative strategies will be used to mitigate and regulate methane emmissins for environmental sustainability will be discussed in this study.

How to cite: Ibeh, D. G. F., Ibeh, D. L. M., Ojeh, D. V. N., and Okoh, D. D.: Analysis and Policy Response to Mitigate Methane Emissions from Rice Farming for an Environmental- Sustainability, EGU General Assembly 2024, Vienna, Austria, 14–19 Apr 2024, EGU24-481, https://doi.org/10.5194/egusphere-egu24-481, 2024.

EGU24-561 | Orals | AS5.10

Transboundary Air Quality Challenges in South Asia: A Comprehensive Analysis of Climatological Circulation Patterns and Implications for Bangladesh and Beyond 

Diya Mahmood, Firoz Khan, Deen Ahmed, Shahanaj Rahman, Abdul Motalib, Mohammad Moniruzzaman, Aftab Ali Shaikh, Nurul Huda, and Jing Xiang

This article delves into the climatological circulation patterns in South Asia, specifically honing in on the Indo-Gangetic Plain (IGP) region, and examines their repercussions on air quality and public health in Bangladesh. The investigation scrutinizes the seasonal dynamics of air masses, aerosol plumes, wind components, boundary layer conditions, ground-level air particles, and gases. Employing reanalysis data from ERA5 and visualizing it with the Grid Analysis and Display System (GrADS) between 2015 and 2021, the study corroborates its findings using ground-level observation data from various sites in Bangladesh. Uncovering that Bangladesh faces deteriorating air quality in winter due to transboundary influences from the IGP and the far western regions, the study notes elevated aerosol and gas levels at the northern Rangpur site compared to Dhaka, signifying transboundary air pollution impact. Conversely, clean air from the Bay of Bengal sweeps over Bangladesh during the South Asian monsoon, benefiting the entire western IGP region. The research identifies local processes contributing to winter aerosol levels in Bangladesh, with transboundary pollution, notably from coal and post-monsoon crop burning in India, exacerbating air pollution. Utilizing statistical generalized additive modeling (GAM), the study discerns relationships between air pollutants and meteorological variables. It reveals the influence of CO and SO2 emissions on winter PM 2.5 levels, while wind speed and the planetary boundary layer (PBL) show a negative correlation with PM 2.5 concentrations during the monsoon and post-monsoon seasons. The findings underscore the significant impact of biomass burning and the PBL on Bangladesh's air quality. Considering Bangladesh and the Maldives as particularly susceptible to poor air quality consequences, the study emphasizes the urgency of targeted interventions and adaptive strategies in these regions. Notably, it pinpoints hotspots in the North Indian, Pakistani, and Afghan regions, introducing a geopolitical dimension to the study. This underscores the transboundary nature of the issue, stressing the need for cross-border collaboration in finding solutions. Additionally, the study connects seasonal circulation patterns and air pollution sources to implications for air quality and public health in Bangladesh, proposing mitigation strategies. It suggests leveraging the Malé Declaration (MALE) as a catalyst for collaborative efforts in mitigating transboundary air pollution across South Asia. In summary, the research not only contributes insights into Bangladesh's air quality but extends its implications regionally, laying the groundwork for a comprehensive and collaborative approach to address shared air quality and public health challenges in South Asia.

How to cite: Mahmood, D., Khan, F., Ahmed, D., Rahman, S., Motalib, A., Moniruzzaman, M., Ali Shaikh, A., Huda, N., and Xiang, J.: Transboundary Air Quality Challenges in South Asia: A Comprehensive Analysis of Climatological Circulation Patterns and Implications for Bangladesh and Beyond, EGU General Assembly 2024, Vienna, Austria, 14–19 Apr 2024, EGU24-561, https://doi.org/10.5194/egusphere-egu24-561, 2024.

EGU24-573 | Posters virtual | AS5.10

Airvolution: Translating Emerging Techniques in Air Quality Monitoring to Philippine Society 

Jill Manapat and John Richard Hizon

Air quality monitoring (AQM) research is still in its nascent stages in the Philippines. One of the few academic research programs in the country focusing on the development of AQM technologies is the Center for Air Research in Urban Environments (CARE). Based at the University of the Philippines Diliman, CARE is an interdisciplinary group funded by the Department of Science and Technology (DOST) that aims to expand the current coverage of AQM stations by complementing a network of affordable AQM nodes. Its technologies include a multi-stakeholder IoT Platform with data processing and modeling capabilities, stationary indoor and outdoor (I/O) sensor nodes that detect a wide array of I/O particulates and gases, an AI-powered eTraffic system, locally designed equivalent black carbon (eBC) and volatile organic compound (VOC) sensors, and mobile and wearable sensors, among others. However, CARE acknowledges the gap between developing AQM technologies in the lab and actual adoption and utilization by its target users. Research and innovation can only achieve its intended impact if they are successfully transferred to society.

This study will explore various translational methodologies implemented by CARE to increase the chances of AQM technology adoption beyond its three-year DOST grant. Strategies in multi-stakeholder engagement (both local and global), participatory design and co-creation, capacity-building, community-building, and other relevant approaches will be examined through case studies and success stories. Lessons learned and implications for future innovations will also be discussed to provide insights for other research groups that are also working towards effective and efficient AQM technology transfer.

How to cite: Manapat, J. and Hizon, J. R.: Airvolution: Translating Emerging Techniques in Air Quality Monitoring to Philippine Society, EGU General Assembly 2024, Vienna, Austria, 14–19 Apr 2024, EGU24-573, https://doi.org/10.5194/egusphere-egu24-573, 2024.

Source apportionment by means of factorization is the traditional means of assigning of sources to factors in air pollution studies. Both PCA and DN-PMF have assumptions, strengths, and limitations. In common these two models have the assigning of sources to factors which can be subjective and dependent on limited information. PCA and DN-PMF is performed on data from three cities which were sampled at the same time, 16 April 2017 to 18 April 2018. The PCA will determine how many factors are assigned and the DN-PMF will determine the assigning of sources to factors. The geographical origin of the air particulates was modelled by means of HYsplit. The DN-PMF was able to give seasonal information to support the source apportionment. Results of the PCA included 6 factors for Thoyohandou and Pretoria and 7 factors for Cape Town. Where PCA produced strong statistical support to the number of factors chosen, correlations between HYsplit and DN-PMF and seasonal output corroborated the assigning of sources to factors. Utilising two models for factorization during source apportionment limits the error due to subjectivity where one method of PM2.5 sampling was used.

How to cite: Howlett-Downing, C.: Source apportionment for PM2.5 and trace element bound PM2.5 using PMF and PCA at three sites in South Africa, EGU General Assembly 2024, Vienna, Austria, 14–19 Apr 2024, EGU24-645, https://doi.org/10.5194/egusphere-egu24-645, 2024.

Air pollution accounts for 2.2 million premature deaths in the Western Pacific Region. In the Philippines, mortality rates related to poor air quality reached 45.3 deaths for every 100,000 people in 2018. Apart from the cost to lives, pollution has cost the country US$ 1B in 2015, which accounts for 0.3% to 0.4% of the country’s gross domestic product.

Despite the cost to life and associated economic burden, the current system for sampling air pollution data - both indoor and outdoor in urban areas - has not provided dense spatiotemporal distribution information to identify air pollution hotspots.

While the sensor installations of the government and private sector in some parts of the country provide data on the current status of air pollution, one air quality sensor system per city - the average in the Philippines - provides very little information on how pollution is distributed and may not be able to identify hotspots that increase the exposure of the general public.

To close the gap in the strategic installation of air quality sensor systems and the availability of actionable data on air quality status, the University of the Philippines’ College of Engineering proposed the UP Center on Air Quality Research in Urban Environments (UP CARE) research program for government funding. This program provides a venue for engineers, scientists, health professionals and other domain experts to solve this collective challenge on air pollution.

 Our talk will focus on UP CARE’s efforts to study how pollutants, both gaseous and particulate matter, are dispersed in urban environments. One key component in this program is the development of an IoT infrastructure and its online platform that connects various locally-developed wireless sensor nodes to measure air pollutants generated by vehicles traversing the streets of central business districts and determine how much of these pollutants enter homes, schools, and offices. In addition, the online platform would include mobile sensing modalities in our trains, buses, and cars plus personal measurements through wearables to complete the cycle of exposure to air pollution parameters one encounters daily. The goal is to integrate these measurements into a resilient and scalable IoT platform that will enable the development of applications that the general public could use to mitigate their personal exposure to air pollution and allow the local agencies to devise a more reliable approach/plans to decrease the risk of their constituents and stakeholders. The ever-expanding database of measurements will provide datapoints for researchers to improve dispersion and forecasting models and improve our understanding of the long-term effects of air pollution to one’s health.

How to cite: Hizon, J. R.: Air quality data for all: The case for air quality research in the Philippines, EGU General Assembly 2024, Vienna, Austria, 14–19 Apr 2024, EGU24-664, https://doi.org/10.5194/egusphere-egu24-664, 2024.

EGU24-813 | Posters virtual | AS5.10

Low cost, rapid method for ambient particulate matter speciation in specific environments 

George K Varghese, Anson Regi, Prem Mohan, and Jijo Ponnachan

Chemical speciation of ambient particulate matter (PM) is important for understanding the health effects of this most ubiquitous air pollutant. Many studies in India have reported significant contribution of road dust to ambient PM, in some cases as high as 70%. This study presents a quick and affordable method for knowing the approximate chemical composition of the atmospheric PM from the chemical analysis of sediment deposits from ground surface. Sediment from street surface was collected and segregated into different size fractions using sieves. Chemical characterization was done separately for each size fraction, and from the results the composition of dust particles of size less than 10µm was obtained. Ambient PM was monitored using MiniLAS, which is a real time PM monitoring instrument that measures PM in 24 different size channels. Using size as criteria, the fraction of road dust in ambient PM was determined. Now, combining the results of ambient PM monitoring and chemical characterization of street dust, the chemical composition of atmospheric PM was calculated. To confirm the results, PM collected in a high-volume air sampler deployed at the place was analyzed for chemical composition. The results matched with the calculated composition indicating the possibility of adopting this method for environments polluted with resuspended dust, which is very often the case in developing countries.

How to cite: Varghese, G. K., Regi, A., Mohan, P., and Ponnachan, J.: Low cost, rapid method for ambient particulate matter speciation in specific environments, EGU General Assembly 2024, Vienna, Austria, 14–19 Apr 2024, EGU24-813, https://doi.org/10.5194/egusphere-egu24-813, 2024.

The PM2.5 concentrations in Northern India are one of the highest in the world, posing significant risks to human health and affecting climate and air quality. This study aims to assess the influence of different sources of emissions and meteorological conditions on the levels of PM2.5 at a regional background location in Northern India. The study employed a combination of the Random Forest model with Shapley Additive exPlanations (RF-SHAP) and Partial Dependence Plot (RF-PDP), together with Positive Matrix Factorization (PMF), to assess the effects of various factors on PM­2.5 pollution. The RF model accurately captured the variation of PM2.5 (R2 = 0.95) during the sampling period. The results show that emissions sources and meteorology accounted for approximately 79% (99.8 μg/m3 ± 68.9) and 21% (26.5 ± 18.3 μg/m3) of the variability in PM2.5 levels, respectively. Secondary aerosols (SA) had the most significant influence among all sources, accounting for around 45.7% and having a SHAP value of approximately 23.6 μg/m3. Biomass burning had the second highest impact, contributing around 23.1% and having a SHAP value of approximately 19.3 μg/m3. The RF-PDP approach was utilized to assess the sensitivity of the combined influence of secondary aerosols and biomass burning on PM2.5 concentrations. The results suggest that controlling concentrations of secondary aerosols below 25 μg/m3 and biomass burning below 15 μg/m3can reduce the overall PM2.5 concentration by over 2.5 times. It is to be noted that even after the strategic control measures, PM2.5 concentrations are predicted to be over 100 μg/m3. Given the critical role of secondary aerosols in PM2.5 pollution and the complexity of their generation mechanisms, the temporal variations of SA concentrations and their drivers were also analyzed via RF-SHAP during the study period. The model results highlight that secondary aerosol formation is mostly driven by meteorological conditions (64% ~ 13.6 ± 18.5 μg/m3) than primary emissions (36% ~ 7.7 ± 10.4  μg/m3), making it difficult to implement control strategies due to dependence on meteorological conditions. However, the sensitivity analysis using RF-PDP suggests that under favourable meteorological conditions, strategic control of primary emissions like biomass burning and coal combustion can reduce the secondary aerosol concentration and consequently reduce particulate pollution. In conclusion, the findings aid in uncovering approaches to effectively mitigate particulate pollution by managing emissions during favourable meteorological situations. Thus, the integration of machine learning algorithms with expert decisions and existing methodology can assist in effectively addressing ambient air pollution and find extensive use in the field of air pollution.

How to cite: Manwani, P., Lekinwala, N., Bhushan, M., Venkataraman, C., and Phuleria, H.: Unravelling the Nexus of emission sources and meteorology on Regional PM­2.5: A Comprehensive Analysis Using Source Apportionment Model and Machine Learning for Effective Pollution Mitigation Strategies, EGU General Assembly 2024, Vienna, Austria, 14–19 Apr 2024, EGU24-829, https://doi.org/10.5194/egusphere-egu24-829, 2024.

Particulate matter (PM2.5 and PM10), black carbon (BC), and ultrafine particle (UFP) exposures among toll station workers on a highway in India were measured in both summer and winter seasons. Results showed that toll workers inside the toll collection booths (Tinside) were exposed to higher concentrations of air pollutants than those working outside the booths (Toutside), except for UFP. The concentrations of PM2.5 were higher during winter than summer: 152.3 > 86.1 µg m-3 (Tinside) and 136.6 > 79.2 µg m-3 (Toutside), while PM10 concentrations were 205.8 > 169.5 µg m-3 (Tinside) and 185.3 > 156.4 µg m-3 (Toutside), and BC concentrations were 38.8 > 34.5 µg m-3 (Tinside) and 22.2 > 18.5 µg m-3 (Toutside). In contrast, UFP concentrations were higher at Toutside (31312 > 22000 pt cm-3) than Tinside (21610 > 18000 pt cm-3). The diurnal variation of pollutants showed higher concentrations in the evening hours due to increased traffic, low wind speed and less atmospheric dispersion. Further, a significant correlation was found between pollutants and meteorological parameters (temperature, relative humidity, wind speed, solar radiation and boundary layer height) and traffic volume. Using Multiple-path particle dosimetry model (MPPD), mass deposition in the lungs were determined. Mass deposition found to be higher inside the toll booths workers. The study also revealed that PM particles consisted of soot, mineral and fly ash, which are proxies of fresh exhaust emissions, re-suspended road dust, and industrial emissions, respectively. The presence of Si, Al, Ca and Pb, as confirmed by EDX analyses, indicated the sources of pollutants to be re-suspended road dust, brake/tire wear, and construction dust. The results underscore the importance of implementing policies to control air pollutant levels, especially in workplaces near busy roads.

How to cite: Nazneen, N. and Patra, A. K.: Seasonal Variations in Particle Exposure: A Study at an Indian Highway Toll Station Investigating Coarse, Fine, Ultrafine, and Black Carbon Particles, EGU General Assembly 2024, Vienna, Austria, 14–19 Apr 2024, EGU24-921, https://doi.org/10.5194/egusphere-egu24-921, 2024.

EGU24-933 | ECS | Orals | AS5.10

Active Commuters’ Exposure to PM2.5, Black Carbon, Noise, and Heat During the Northeast Monsoon in Selected Urban Cities in Malaysia 

Josfirin Uding Rangga, Eliani Ezani, Sharifah Norkhadijah Syed Ismail, Mohd Johari Mohd Yusof, and Shamsul Bahari Shamsudin

Today, more than 70% of the Malaysian population lives in urban areas, and this proportion continues to increase. Changes in land use and land cover, as well as additional anthropogenic factors, have altered the energy balance and led to spatio-temporal variations in urban climate. Active commuters who travel near roadways with high traffic density face a range of exposures, such as traffic-related air pollution (TRAP), traffic noise (TN), and urban heat (UHI). As urbanisation and population acceleration increase, understanding the environmental stressors faced by active commuters becomes crucial. Our aim is to measure the weekly spatial and temporal variation of TRAP, TN, and UH in selected cities in Malaysia and assess the health risks of exposures. The assessment was conducted along the selected routes in Kuala Lumpur (KUL) city centre and Cyberjaya (CYB) in Malaysia. The sampling campaign was conducted in October and November 2023. This comprehensive assessment measured TRAP (i.e., PM2.5, black carbon (BC)), TN, and UH simultaneously. The TSI SidePak (AM510), microAeth (MA200), TSI Edge 5 Personal Noise Dosimeter, and QUESTemp 36 models were used to measure PM2.5, BC, TN, and UH, respectively. The preliminary findings indicate a significant difference between peak hours (morning, noon, and evening) for all parameters (p < 0.001), except for BC concentrations (p = 0.37) during weekdays. All parameters were significant (p < 0.001) during weekends in KUL (Route 1). For CYB (Route 2), there was a significant difference in PM2.5, BC, TN, and UH levels (p < 0.001) between peak hours on both weekdays and weekends. PM2.5 (73.31 µg/m3), BC (6.19 µg/m3), and TN (80.10 dB(A)) were significantly higher on weekdays in Route 1 compared to Route 2, while the heat index was also higher (27.90 °C) in Route 1. Similar findings showed higher levels of PM2.5 (85.14 µg/m3), BC (5.95 µg/m3), and TN (77.89 dB (A)) on weekends in Route 1. Our study will help to address the knowledge gap on the impact of urban heat, air pollution, and noise pollution on climate adaptation among active commuters in urban cities. The findings of this study will contribute to the development of targeted interventions and strategies to enhance the resilience of these active commuters to the adverse effects of urban stressors. Our examination will also add to the wider discussion on sustainable urban mobility, highlighting the importance of specific actions to improve the environmental conditions for those who use active modes of transport. This will eventually encourage healthier and more sustainable travel options.

How to cite: Uding Rangga, J., Ezani, E., Norkhadijah Syed Ismail, S., Mohd Yusof, M. J., and Bahari Shamsudin, S.: Active Commuters’ Exposure to PM2.5, Black Carbon, Noise, and Heat During the Northeast Monsoon in Selected Urban Cities in Malaysia, EGU General Assembly 2024, Vienna, Austria, 14–19 Apr 2024, EGU24-933, https://doi.org/10.5194/egusphere-egu24-933, 2024.

EGU24-954 | Orals | AS5.10

Quantifying the oxidative potential of aerosols in low-income urban areas in South Africa 

Pieter G. van Zyl, Constance K. Segakweng, Catherine Liousse, Sylvian Gnamien, Eric Gardrat, Johan P. Beukes, Kerneels Jaars, Camille Dumat, Benjamin Guinot, Miroslav Josipovic, Brigitte Language, Roelof P. Burger, Stuart J. Piketh, and Tiantian Xiong

Health impacts associated with exposure to atmospheric aerosols are of global concern and are not completely understood. In addition, health studies are, especially, complicated in developing countries such as South Africa. Oxidative potential (OP), defined as a measure of the capacity of aerosols to oxidise target molecules, has been proposed as a viable alternative relevant biological metric to better quantify toxicological responses related to atmospheric aerosol exposure in health studies. The dithiothreitol (DTT) assay is the most commonly used method to determine OP of aerosols, which was used in this study to quantify the OP of outdoor and indoor atmospheric particulates collected at three low-income settlements in South Africa. This technique is easy-to-operate, low-cost, effective and reproducible. The DTT methodology had to be modified according to previous applications, which required choosing a suitable extraction procedure and -setup. The redox activity of size-resolved sampled aerosols was evaluated and related to their chemical composition with correlation analysis. The seasonal variations of DTT redox activity were established by normalizing in terms of aerosol mass and sampled volume for indoor and outdoor particulate samples. Higher redox activity was determined for the smallest aerosols (aerodynamic diameter <1 μm) compared to the larger particulates (aerodynamic diameter between 1 and 10 μm) in both environments. DTT redox activity correlated strongly with elemental- and organic carbon, as well as trace elements and water-soluble inorganic species. These correlations revealed toxic effects of sources of atmospheric aerosols in these settlements, which included domestic- and open biomass burning, vehicles and industrial activities. The DTT method was successfully applied in this study and could be used in other data scarce regions that are difficult to access.

How to cite: van Zyl, P. G., Segakweng, C. K., Liousse, C., Gnamien, S., Gardrat, E., Beukes, J. P., Jaars, K., Dumat, C., Guinot, B., Josipovic, M., Language, B., Burger, R. P., Piketh, S. J., and Xiong, T.: Quantifying the oxidative potential of aerosols in low-income urban areas in South Africa, EGU General Assembly 2024, Vienna, Austria, 14–19 Apr 2024, EGU24-954, https://doi.org/10.5194/egusphere-egu24-954, 2024.

EGU24-967 | ECS | Posters on site | AS5.10

Spatial variability in global atmospheric CO during Covid-19 lockdown: Implication of air quality policies 

Mansi Pathak, Vikas Kumar Patel, and Jayanarayanan Kuttippurath

The COVID-19 lockdown (LD) presented a unique opportunity for examining shifts in regional and global air quality. The alterations in atmospheric carbon monoxide (CO) during LD necessitate thorough analysis, given that CO is a significant air pollutant impacting human health, ecosystems, and climate. Our examination reveals a 5-10% decrease in the CO column during LD (April-May 2020) compared to the pre-lockdown (PreLD, March 2020) periods in regions with elevated anthropogenic activity, such as East China (EC), Indo-Gangetic Plain (IGP), North America, parts of Europe, and Russia. However, this reduction was absent in regions prone to frequent and intense wildfires and agricultural waste burning (AWB). There is substantial heterogeneity in CO column distributions, ranging from regional to city scales, during the LD period. To identify the sources of CO emissions during LD, we analyzed the ratios of nitrogen dioxide (NO2), sulfur dioxide (SO2) to CO for major cities worldwide. This analysis facilitated the identification of contributions from various sources, including vehicles, industries, and biomass burning during LD. Comparisons between CO levels during LD and PreLD periods indicate a significant reduction in global tropospheric CO but no noteworthy change in the stratosphere. Notably, CO emissions decreased during LD in hotspot regions but rebounded after the lifting of LD restrictions. This study underscores the importance of policy decisions and their implementation on both global and regional scales to enhance air quality, safeguarding public health and the environment.

How to cite: Pathak, M., Patel, V. K., and Kuttippurath, J.: Spatial variability in global atmospheric CO during Covid-19 lockdown: Implication of air quality policies, EGU General Assembly 2024, Vienna, Austria, 14–19 Apr 2024, EGU24-967, https://doi.org/10.5194/egusphere-egu24-967, 2024.

EGU24-1020 | ECS | Posters on site | AS5.10

Ensemble Modeling of Atmospheric Pollutants: A Case Study with WRF-Chem and LOTOS-EUROS in Aburrá Valley, Colombia 

Lisseth Milena Cruz-Ruiz, Fernando Fernández-Restrepo, Andrés Yarce-Botero, Valeria Solórzano-Araque, and Olga Lucia Quintero

An evaluation of an ensemble of atmospheric Chemical Transport Models (CTMs) was carried out using WRF-Chemand LOTOS-EUROS over the Aburrá Valley, Colombia, an interesting region for huge density of population and mountainous topography. The models were configured in the same spatiotemporal domain and the pollutants of interest were nitrogen dioxide (NO2) and ozone (O3) due to their significant impact on sensitive ecosystems. The ensemble concentrations were assessed by comparing them to the data collected by local air quality monitoring stations against the simulated surface concentration. Additionally, vertical profiles were compared between each model and the ensemble. The Weather Research and Forecasting (WRF) is utilised as the Numerical Weather Model (NWM) driver in the two CTMs with identical initial and boundary conditions, to let the chemical operators from each model to be the contributors to the differences incorporated with an ensemble. The statistical comparison to assess the ensemble includes various metrics expressed in Taylor diagrams. These metrics comprise the mean factorial bias (MFB), root mean square (RMSE) error, and correlation factor (Corr) to evaluate the models and its ensemble against the measurements. The ensemble perspective of the Chemical Transport Model (CTM) diminishes the drawbacks of each CTM and enables us to comprehend the impact of key dynamics over rough topography that has a direct influence on the vertical transport of pollutants. The findings reveal which model aligns better with surface observations in the Aburra Valley and enable a qualitative identification of the principal dynamics in pollutant transport across this region utilizing two CTMs and their ensemble.

How to cite: Cruz-Ruiz, L. M., Fernández-Restrepo, F., Yarce-Botero, A., Solórzano-Araque, V., and Quintero, O. L.: Ensemble Modeling of Atmospheric Pollutants: A Case Study with WRF-Chem and LOTOS-EUROS in Aburrá Valley, Colombia, EGU General Assembly 2024, Vienna, Austria, 14–19 Apr 2024, EGU24-1020, https://doi.org/10.5194/egusphere-egu24-1020, 2024.

EGU24-1057 | ECS | Orals | AS5.10

Exposure to pollutants Risk model in the Aburrá Valley (Expor2) 

Valeria Solórzano-Araque, Sebastián Carmona-Estrada, Pablo A Osorio, Santiago Isaza-Cadavid, Lisseth Cruz-Ruiz, Olga Lucía Quintero, Nicolás Pinel, and Santiago Lopez-Restrepo

The study presents a framework for a human exposure model to pollution based on Chemical Transport Models (CTMs) for the urban area of Medellín in Colombia, including the metropolitan area in which is situated in the the city. The exposure model utilises pollutant concentration simulations obtained from the LOTOS-EUROS CTM drived by the WRF Numerical Weather Model (NWM) simulations conducted in January 2019 within the Aburrá Valley. The simulations provide spatial and temporal resolutions of 1 km x 1 km and 1 hour, correspondingly. This study applies the data from the 2017 Origin Destination Survey, which surveyed 16,340 households and 36,364 individuals living in urban and rural areas of the 10 municipalities of the Aburrá Valley. This data on demographic variables and weekday travel patterns helped to analyse human behaviour and intra-urban migration in order to develop a precise measure of daily pollution exposure for different geographic zones. The total mean exposure is calculated from the linear combination of  the exposure time and the mean concentration in every zone.

The study examined the morphological composition of fine particulate matter PM2.5 and PM10, resulting in the identification of six distinct groups, including mineral, organic/biogenic, tire wear, metallic, paint with high titanium content, and salts. Cytogenotoxicity tests assess the survival rates of cells in eye, skin and lung tissues. The resulting data is extrapolated to determine an irrigation factor specific to the urban area. It is worth highlighting that the central and southern regions of the Aburrá Valley, designated by high population density and multiple sources of pollution, exhibit heightened pollution exposure. On the other hand, the assessment of high-risk regions in the central zone is influenced by the lack of information in other parts of the urban area.

How to cite: Solórzano-Araque, V., Carmona-Estrada, S., Osorio, P. A., Isaza-Cadavid, S., Cruz-Ruiz, L., Quintero, O. L., Pinel, N., and Lopez-Restrepo, S.: Exposure to pollutants Risk model in the Aburrá Valley (Expor2), EGU General Assembly 2024, Vienna, Austria, 14–19 Apr 2024, EGU24-1057, https://doi.org/10.5194/egusphere-egu24-1057, 2024.

EGU24-1094 | ECS | Orals | AS5.10

Identifying Dominant Emission Sectors for Air Quality in Argentina using Partial Least Squares Path Modeling (PLS-PM) on WRF-Chem Simulations. 

Lucas Berná, Ana Isabel López-Noreña, Rafael Pedro Fernandez, and S. Enrique Puliafito

A Partial Least Squares Path Modeling (PLS-PM) methodology was employed to identify the dominant emission sectors responsible for the concentrations of major air pollutants. This approach leverages factor analysis and principal component analysis to differentiate pollutant concentration levels into clusters and establish causal relationships with specific emission sectors. As categorical variables (measurable data) for this model, seven WRF-Chem simulations were conducted over a single domain encompassing Argentina for April 2019. These simulations utilized the GEAA-AEI emission inventory, following a sectorized approach. Five simulations incorporated emissions from individual sectors (Energy, Transport, Livestock, Residential, Industrial), one simulation included emissions from all sectors, and a control simulation was conducted with anthropogenic emissions deactivated. The PLS-PM analysis facilitated the creation of a color map figure that distinguishes areas impacted by each sector. This distinction is particularly evident for transport and livestock emissions at low-pollution levels, while hotspots related to energy sector emissions are discernible in high-pollution areas. This modeling approach holds promise for extracting additional information about areas with high pollution levels from future WRF-Chem simulations or observational data, thereby enabling the identification of contributing sources.

How to cite: Berná, L., López-Noreña, A. I., Fernandez, R. P., and Puliafito, S. E.: Identifying Dominant Emission Sectors for Air Quality in Argentina using Partial Least Squares Path Modeling (PLS-PM) on WRF-Chem Simulations., EGU General Assembly 2024, Vienna, Austria, 14–19 Apr 2024, EGU24-1094, https://doi.org/10.5194/egusphere-egu24-1094, 2024.

EGU24-1131 | ECS | Posters on site | AS5.10

Air Quality Assessment: Analyzing PM Distribution and Calibrating Low-Cost Sensors for Precise Measurements in Indoor and Outdoor Environments 

Rubal Rubal, Anirudha Ambekar, Sarath K. Guttikunda, and Thaseem Thajudeen

Air pollution is one of the leading causes of premature death across the world. To gain valuable insights into ambient fine particulate matter (PM) concentrations, a combination of regulatory monitoring networks, satellite retrievals of air-quality-related substances, and air quality models are typically employed. Studies reveal persistent exceedance of World Health Organization and national standards, particularly in developing nations. It is crucial to recognize that numerous regions in Asia and Africa still need proper monitoring systems to understand the emission sources and concentrations. A major obstacle to better spatiotemporal monitoring is the high cost involved in setting up the monitors.

This research investigates the distribution and proportion of PM1, PM2.5, and PM10 in an educational campus using low-cost sensors (PMS5003, PMS 7003, Winsen ZH 06, SPS 30, Honeywell). A comparative analysis was conducted to evaluate the performance of these sensors against the TSI DRX DustTrak 8533 and calibrated with a beta attenuation monitor (BAM). Additionally, to enhance the accuracy and reliability of LCS measurements, the calibration through various regression and machine-learning (ML) techniques was explored under diverse environmental conditions. In the absence of calibration, the PM2.5 correlation (R2) between LCS and DustTrak is 0.62 to 0.73, indicating a moderate to strong relationship. However, compared to BAM, LCS correlation decreases (0.20 to 0.26), suggesting a weaker association. Utilizing ML with meteorological variables improves R2 values to 0.82 to 0.96 for DustTrak and 0.40 to 0.56 for BAM, with lower mean absolute and root mean square errors. The time-series results demonstrated typical seasonal patterns of winter highs and summer/monsoon lows. We also explored the PM concentrations in the kitchen and common dining facility using a combination of validated low-cost PM sensors (LCS) and DustTrak 8433. It is found that the prolonged cooking durations involved in high-heat cooking methods like stir-frying and deep-frying resulted in a rise in PM2.5, causing a higher exposure to PM. Overall, the findings of the study have provided valuable insights into the dynamics of PM2.5 emissions, the impact of cooking activities, effect of chimney and the importance of ventilation to reduce exposure to PM and implementing mitigation strategies to improve indoor air quality and protect human health.

How to cite: Rubal, R., Ambekar, A., Guttikunda, S. K., and Thajudeen, T.: Air Quality Assessment: Analyzing PM Distribution and Calibrating Low-Cost Sensors for Precise Measurements in Indoor and Outdoor Environments, EGU General Assembly 2024, Vienna, Austria, 14–19 Apr 2024, EGU24-1131, https://doi.org/10.5194/egusphere-egu24-1131, 2024.

EGU24-1151 | ECS | Orals | AS5.10

Enhancing Air Quality Monitoring in India through Dense IoT Deployments (AirIoT): A Multi-faceted Approach 

Ayush Dwivedi, Ayu Parmar, and Sachin Chaudhari

Air pollution, primarily driven by particulate matter (PM), significantly threatens public health. India, with three cities ranking among the world's top ten most polluted and with PM concentrations exceeding WHO guidelines by almost 11 times, urgent measures are needed to address this escalating crisis. AirIoT, a densely deployed IoT-based air quality monitoring network in Hyderabad, India, is an evidence-based approach to bringing awareness and increasing public participation by alleviating data scarcity.

PM concentration has high spatial variability and is often characterized by data scarcity since traditional monitoring setups fall short due to their bulkiness and cost limitations. To tackle this, our research advocates for an innovative approach—deploying a dense network of IoT-enabled PM monitoring devices equipped with low-cost sensors. The work revolves around two core elements: measurement and modelling. 49 IoT-based PM monitoring devices were developed, calibrated, and deployed across Hyderabad, India, covering urban, semi-urban, and green areas. Calibration, essential for seasonal variations, utilized a precise reference sensor. A web-based spatial data dashboard and an Android app were also developed for dynamic geo-visualization of the data from the IoT network, offering citizens and governments actionable insights for efficient pollution control measures. Spatial interpolation models were also designed to extrapolate measurements at micro and macro levels. Demonstrating the effectiveness of dense deployment, a case study was conducted during the Diwali festival, highlighting the importance of localized information in scenarios with air pollution hotspots.

The health impacts of air pollution were also studied, correlating measurements with respiratory, cardiovascular, and psycho-physiological effects. A pilot study utilizing data from AirIoT, health wearables and a questionnaire investigated the long-term health implications for security personnel exposed to air pollution. Computer vision-based methods were developed to scale air pollution monitoring using features like visibility, traffic type and density, eliminating the need for frequent sensor usage. Trained on a large dataset using deep learning, these methods predict air quality in real-time, offering a viable alternative for large-scale implementations.

Ensuring citizen engagement and capacity building, we conducted pilot studies in schools, engaging students in understanding and combating air pollution. Public display systems showcasing real-time pollution levels generated excitement and awareness, leading to residents advocating for reforms. Engineering students from various colleges were trained through hackathons and internship programs to develop low-cost air pollution monitoring devices for local measurements at their institutions and localities. Our work extends beyond air quality monitoring, interlinking with broader smart city applications through the Smart City Research Center at IIITH. Utilizing interoperability standards, such as oM2M, we integrate air quality data with other verticles like weather, water, energy, and crowd monitoring, establishing an interoperable environment with scalable prototypes for other smart cities. Finally, embracing the importance of data sharing and management, our live data feeds into the Indian Urban Data Exchange (IUDX), a data exchange platform aligning with the Smart Cities Mission in India. With a blend of IoT technology and social participation, this collaborative initiative ensures a comprehensive and data-driven approach to address the complex challenges of air pollution in India.

How to cite: Dwivedi, A., Parmar, A., and Chaudhari, S.: Enhancing Air Quality Monitoring in India through Dense IoT Deployments (AirIoT): A Multi-faceted Approach, EGU General Assembly 2024, Vienna, Austria, 14–19 Apr 2024, EGU24-1151, https://doi.org/10.5194/egusphere-egu24-1151, 2024.

EGU24-1167 | ECS | Orals | AS5.10

Unveiling the hidden: air pollution monitoring and health outcomes in LatAm 

Sebastian Diez, Josefina Urquiza, Tailine Correa, and Colleen Rosales

Air pollution has a wide range of harmful effects on public health, ranging from respiratory and cardiovascular problems to metabolic and neurological disorders. As such, characterizing air pollutants is of utmost importance, particularly in regions where environmental injustice is a widespread problem. This study focuses on Latin America, a region where many countries face increased vulnerability due to factors such as limited access to healthcare and inadequate availability of air quality information and medical records. Using an integrative methodology, we combined data from the latest reported data (2022-2023) from reference monitors and air sensors reported in OpenAQ metrics from the Global Burden of Disease study (i.e., years of life lost due to premature mortality or YLLs; years lived with disability or YLDs; and disability‐adjusted life years or DALYs) to analyze correlations and trends. Our initial analysis reveals that countries without air quality monitoring (41% of countries in the region) exhibit an average mortality rate approximately 20% higher than countries with monitoring in place and approximately 35% higher than countries with completely open data. This disparity in monitoring is not just a matter of data availability but reflects deeper socio-economic challenges. Specifically, we found that the burden of disease is significantly higher in countries with lower development, highlighting a major socio-economic dimension in understanding and addressing the health impacts of air pollution. Countries with a low Social Development Index (SDI) showed more than a 5-fold increase in Disability-Adjusted Life Years (DALY) rates for ischemic heart disease and stroke compared to high SDI countries. Furthermore, countries in the lowest economic bracket had a nearly 7-fold higher DALY rate for stroke when compared to very higher-income countries. These findings underscore the deep interconnection between a country's socioeconomic level and the health risks associated with air pollution. However, it is essential to note that these findings do not imply causality, but rather offer a snapshot of the current situation. Additionally, factors such as public health policies, economic development, and socio-environmental conditions must be considered to fully understand these differences. To develop strategies that positively impact the general health of the region, it is essential to take other relevant factors into consideration. This study could serve as a basis for more in-depth research and for the formulation of more informed and effective policies in the region. However, it is essential to note that these findings do not imply causality but rather offer a snapshot of the current situation. Additionally, factors such as public health policies, economic development, and socio-environmental conditions must be considered to fully understand these differences. To develop strategies that positively impact the general health of the region, it is essential to take other relevant factors into consideration. This study could serve as a basis for more in-depth research and for the formulation of more informed and effective policies in the region.

How to cite: Diez, S., Urquiza, J., Correa, T., and Rosales, C.: Unveiling the hidden: air pollution monitoring and health outcomes in LatAm, EGU General Assembly 2024, Vienna, Austria, 14–19 Apr 2024, EGU24-1167, https://doi.org/10.5194/egusphere-egu24-1167, 2024.

EGU24-1178 | Orals | AS5.10

Inequity in personal exposure to PM2.5 and BC in transport microenvironments: a study case in Barranquilla metropolitan region, Colombia 

Dayana Agudelo Castañeda, Sandra Maldonado, Maria Jose Nieto, Julio Davila, Julian Arellana, and Daniel Oviedo

Examining the distribution of both the generation and exposure to traffic-related air pollution across diverse population groups stands as a pivotal environmental justice issue. From a social equity perspective, numerous inquiries arise when scrutinizing commuting patterns within metropolitan areas. Everyday urban mobility entails repeated and sometimes prolonged exposure to traffic-related air pollutants. PM2.5 and Black Carbon have been identified as one of the major pollutants and established as a health hazard.  As part of an interdisciplinary collaboration of experts on urban policy, air quality and transport studies the aim of this research is to assess inequity in patterns of personal exposure to PM2.5 and BC among users of different modes of transportation, including informal public transport. The case of study was Soledad, Colombia. Utilizing household surveys, we crafted user profiles for various modes of transportation, drawing insights from comprehensive data gathered through these surveys. Based on the analysis of mobility patterns, a cross-sectional study was designed to evaluate personal exposure to PM2.5 and BC during trips within the city. Pollutants were measured in real time, during peak, off-peak and weekend hours along typical routes defined by motorized three-wheelers drivers, which were taken as predefined routes for the other modes (car, bus). The average daily inhalation dose within the microenvironment was calculated differentiated by gender and age, according to the daily exposure factor. The findings unveiled significant disparities in PM2.5 and BC exposure, notably affecting adult women and individuals with disabilities, particularly those who frequently use motorized three-wheelers. Despite their lower exposure factor, these groups exhibited a higher dose of pollutants. This inequality underscores the crucial need to incorporate considerations of both accessibility and air quality in the formulation of sustainable urban transport policies.

Key words: inequity; PM2.5; eBC; low-cost sensors; urban mobility; personal exposure, transport modes, environmental justice.

How to cite: Agudelo Castañeda, D., Maldonado, S., Nieto, M. J., Davila, J., Arellana, J., and Oviedo, D.: Inequity in personal exposure to PM2.5 and BC in transport microenvironments: a study case in Barranquilla metropolitan region, Colombia, EGU General Assembly 2024, Vienna, Austria, 14–19 Apr 2024, EGU24-1178, https://doi.org/10.5194/egusphere-egu24-1178, 2024.

EGU24-1194 | ECS | Orals | AS5.10

Unveiling the Crucial Role of Emissions Inventories from Solid Waste Burning in Air Quality Management across Diverse LMICs; A Case of Nairobi City 

William Apondo, George Mwaniki, John Kennedy, Ivy Murgor, and Purity Munyambu

Air pollution poses a significant environmental risk in low- and middle-income countries (LMICs), characterized by diverse pollution sources and complex atmospheric processes. Specifically, the city of Nairobi grapples with air quality challenges, generating approximately 2800 tons of solid waste daily, with 75% undergoing collection and the remaining 700 tons (3.9KG/person/year) being openly burnt. Our study underscores the crucial role of bottom-up emissions inventories, particularly those associated with solid waste burning, in quantifying emissions and guiding evidence-based air quality management strategies within the context of data-scarce LMICs. Leveraging the Solid Waste Emission Estimation Tool (SWEET), our estimations encompass Methane (CH4), Black Carbon (BC), Particulate Matter (PM), oxides of Nitrogen (NOX), and other pollutants from municipal solid waste sources. Our baseline scenario, established for the year 2022, is compared with successive five-year alternative scenarios. Preliminary findings indicate alarming emissions, with around 5.2 million metric tons of PM10, 3,400 metric tons of SOx, and 300 million metric tons of Black Carbon annually from open burning under the business-as-usual scenario. Notably, implementing emission reduction strategies, such as the closure of official dumping site, exhibits promising outcomes. Projected reductions include up to 15% in Methane emissions by 2031 (Scenario1) and a substantial 75% reduction by 2033 (Scenario2). Furthermore, SOx, CO2, and PM emissions are anticipated to decrease by over 90% under these scenarios. Strategically reducing waste burning activities, coupled with measures like cutting the garbage truck fleet by 50%, could yield drastic emission reductions. Our findings emphasize the potential for impactful emissions reduction benefits in addressing open waste burning, an often overlooked source contributing significantly to air pollution in rapidly developing cities like Nairobi. The discussion highlights the importance of a bottom-up approach in developing emissions inventories to comprehend the impact of waste burning on overall city emissions reduction goals and incorporating Gender dynamics.

How to cite: Apondo, W., Mwaniki, G., Kennedy, J., Murgor, I., and Munyambu, P.: Unveiling the Crucial Role of Emissions Inventories from Solid Waste Burning in Air Quality Management across Diverse LMICs; A Case of Nairobi City, EGU General Assembly 2024, Vienna, Austria, 14–19 Apr 2024, EGU24-1194, https://doi.org/10.5194/egusphere-egu24-1194, 2024.

EGU24-1213 | Posters virtual | AS5.10

Particulate air pollution in the heart of the European Union: lessons learned from SAFICA 2017-2018 and SAAERO 2022-2023 projects in Central and Southeast Europe 

Katja Dzepina, Vaios Moschos, Anna Tobler, Deepika Bhattu, Kaspar Daellenbach, Michael Bauer, Peeyush Khare, Jasna Huremović, Almir Bijedić, Gordana Pehnec, Anne Kasper-Giebl, Sanja Frka Milosavljević, Jean-Luc Jaffrezo, Gaelle Uzu, Dragana Đorđević, Asta Gregorič, Leah Williams, Sarath Guttikunda, Griša Močnik, and Andre Prevot and the SAFICA 2017-2018 and SAAERO 2022-2023 team and collaborators

Particularly during the cold weather season, countries of the Southeast Europe are experiencing some of the poorest air quality in the world due to the extensive use of solid fuels and old vehicle fleets. The city of Sarajevo is the capital of Bosnia and Herzegovina (BiH) situated within a basin surrounded by mountains. In the winter months (domestic heating season), topography and meteorology cause the pollutants to be trapped within the city basin. Countries of the Southeast Europe lack state-of-the-art atmospheric sciences research and access to sophisticated instrumentation and methodology, despite high levels of ambient pollution and position within the European Union (EU) borders, making it imperative to understand the emission sources, processing and the adverse health effects of atmospheric aerosol pollution.

               This presentation will highlight the field measurements in Central and Southeast Europe during the Sarajevo Canton Winter Field Campaign 2017-2018 (SAFICA) and Sarajevo Aerosol Experiment 2022-2023 (SAAERO) projects, centered at the Sarajevo Bjelave supersite. Both projects were envisioned to produce crucial, not previously available information about aerosol emission sources and atmospheric transformations through a combination of online field and offline laboratory measurements. Online measurements during a) SAFICA and b) SAAERO included, a) black carbon, particle number and size distribution, and b) carbonaceous species, elemental composition and bulk chemical composition. SAAERO online measurements also included stationary and mobile measurements of gas- and particle-phase species on board the mobile laboratory in Sarajevo and Zenica, BiH, as well as in Ljubljana, Slovenia and Zagreb, Croatia. Finally, extended SAAERO project included measurements of black carbon at three additional urban centers: Ljubljana, Zagreb, and Belgrade, Serbia, enabling the first comparison of urban air quality in Central and Southeast Europe between two EU and two non-EU capitals.

During both projects, laboratory aerosol analyses determined aerosol bulk chemical composition, selected elements (Huremović et al., 2020; Žero et al., 2022) and molecular species (Pehnec et al., 2020). Aerosol chemical composition determined by aerosol mass spectrometry was further analyzed by Positive Matrix Factorization to separate organic aerosol into subtypes characteristic of specific sources and atmospheric processes. Aerosol oxidative potential was also determined to evaluate aerosol ability to generate reactive oxygen species. Sarajevo and Belgrade have high ambient loadings of aerosol and black carbon, indicative of strong and diverse combustion sources and a major public health hazard. Finally, aerosol surface concentrations will be discussed in the context of European air quality.

We thank Jasminka Džepina, Magee Scientific/Aerosol, TSI and Aerodyne for support. We acknowledge the contribution of the COST Action CA16109 COLOSSAL and SEE Change Net. KDž and ASHP acknowledge the grant by the Swiss NSF (Scientific Exchanges IZSEZ0_189495), KDž, GM and ASHP European Commission SAAERO grant (EU H2020 MSCA-IF 2020 #101028909), GM Slovenian ARIS grant (P1-0385), SF Croatian HRZZ grant (BiREADI IP-2018-01-3105), and AG, MR, MI, BA and IBJ Slovenian ARIS grant (L1-4386).

Pehnec, G., et al., Sci. Tot. Environ., 734, 139414, 2020.

Huremović, J., et al., Air Qual. Atmos. Health, 13, 965–976, 2020.

Žero, S., Žužul, S., et al., Environ. Sci. Technol., 56, 7052−7062, 2022.

How to cite: Dzepina, K., Moschos, V., Tobler, A., Bhattu, D., Daellenbach, K., Bauer, M., Khare, P., Huremović, J., Bijedić, A., Pehnec, G., Kasper-Giebl, A., Frka Milosavljević, S., Jaffrezo, J.-L., Uzu, G., Đorđević, D., Gregorič, A., Williams, L., Guttikunda, S., Močnik, G., and Prevot, A. and the SAFICA 2017-2018 and SAAERO 2022-2023 team and collaborators: Particulate air pollution in the heart of the European Union: lessons learned from SAFICA 2017-2018 and SAAERO 2022-2023 projects in Central and Southeast Europe, EGU General Assembly 2024, Vienna, Austria, 14–19 Apr 2024, EGU24-1213, https://doi.org/10.5194/egusphere-egu24-1213, 2024.

EGU24-1214 | ECS | Orals | AS5.10

Forecasting PM2.5 concentrations using machine learning approaches: added value of low-cost monitoring and regional modeling 

K. Santiago Hernández, Duvan Nieves, Jhayron S. Pérez-Carrasquilla, Paola Montoya, Manuel D. Zuluaga, and Mauricio Ramírez

Machine Learning (ML) techniques have acquired great importance for forecasting air pollution events, due to their relatively low computational cost and skillful results within horizons of up to 3 days. In this study, we forecast PM2.5 concentrations measured by low-cost sensors in the Aburrá Valley, a densely populated and complex terrain region in the Colombian Andes. ML models such as Artificial Neural Networks, Random Forest, Gradient Boosting, and Support Vector Regression, were trained for each forecast horizon (up to 72 hours) using data from satellites and global atmospheric models, which are available in other cities with little in-situ information. The information includes 2-meter temperature, boundary layer height, latent heat flux, winds at different levels and precipitation from the Global Forecasting System (GFS); total aerosol optical thickness (AOD), dust AOD, black carbon AOD and sea salt AOD data from the CAMS Global Atmospheric Composition Forecast; and an index calculated from predicted back-trajectories and the fire radiative power derived from MODIS satellite-monitored hotspots, which allows accounting for long-range transport of biomass burning aerosols. As an added value, we investigated the effect of including data from real-time PM2.5 concentrations from low cost sensors, as well as operational forecast information from the Early Warning System of Medellín and the Aburrá Valley (SIATA) with the WRF regional model. The predictions were evaluated across multiple performance metrics and during an air quality special period in which air pollution increases in the region. Our results show that ML-based forecasts perform better than those obtained directly from CAMS. By including real-time measured information, forecast performance significantly improves during the first 24 hours after initialization. In addition, meteorological data obtained from the WRF model are useful for extending the usefulness of the forecasts to longer horizons (2 to 3 days). Since this approach is based on satellite data and global atmospheric models, it can be easily replicated in other cities with scarce in-situ information. Finally, this work highlights the usefulness of these tools for air quality management and serves as a reference framework for the implementation of forecasting tools in other cities with scarce air quality data.

How to cite: Hernández, K. S., Nieves, D., Pérez-Carrasquilla, J. S., Montoya, P., Zuluaga, M. D., and Ramírez, M.: Forecasting PM2.5 concentrations using machine learning approaches: added value of low-cost monitoring and regional modeling, EGU General Assembly 2024, Vienna, Austria, 14–19 Apr 2024, EGU24-1214, https://doi.org/10.5194/egusphere-egu24-1214, 2024.

EGU24-1236 | ECS | Orals | AS5.10

An integrated approach for generating rich city-wide air pollution data in growing Sub-Saharan African cities: Implementing transferable protocol in Kigali, Rwanda 

James Nimo, Jean R. Kubwimana, Chantal Umutoni, Pacifique Karekezi, Paterne Gahungu, Majid Ezzati, Allison Hughes, and Raphael E. Arku

Cities in sub-Saharan Africa (SSA) are undergoing significant economic and urban expansion. The rapid urban growth is shaping land use, housing, transportation, and energy for household and commercial use. Consequently, air pollution from diverse local and regional sources and with complex space-time patterns has emerged as a major environmental health concern for cities in SSA. Yet, limited city-scale data are a barrier to climate and health impact assessment as well as policy formulation and evaluation to reduce air pollution.  

We are implementing and testing the transferability of Pathways to Equitable Health Cities measurement protocol for Accra in Kigali, Rwanda. The protocol is designed to generate rich environmental pollution data in SSA cities. Both Accra and Kigali are representative of the rapid urbanization and economic transformation that are happening across SSA. We have assembled and integrated multiple low-cost, low-power, lightweight sensors that have been validated in prior studies to measure integrated and real-time fine particulate matter (PM2.5), black carbon (BC), and oxides of nitrogen (NO2 and NO) concentrations at city-scale. Initiated in November 2022, our year-long measurement campaign utilizes a network and combination of ‘fixed’ (n=10) and ‘rotating’ (n =120) monitoring sites. The sites represent variety of land uses and emission sources, including background, road traffic, commercial, industrial and residential areas, and neighbourhood socioeconomic classes. The fixed sites are monitored continuously for one year to capture temporal (annual and seasonal) patterns, whereas the rotating sites are monitored for one week (in groups of four per week) to capture spatial variations in the pollutant concentrations. In addition to the air pollutants, we are also collecting data on environmental noise and weather variables (i.e. temperature, relative humidity and wind speed/direction) to aid in the analyses. The Kigali initiative is being implemented in partnership with AIMS-Rwanda and the Rwanda Environment Management Authority (REMA) to promote capacity building within the government.  

Planned analyses involve the use state-of-the-art models, including spatial statistics, deep/machine learning approaches, to capture highly resolved temporal and spatial variations as well as socioeconomic inequalities in pollution levels across Kigali city and to identify sources and their relative contributions. The data form the basis of future climate change and air pollution forecasting and health impact assessment as well as policy evaluation and emission reduction scenarios in the city.

How to cite: Nimo, J., R. Kubwimana, J., Umutoni, C., Karekezi, P., Gahungu, P., Ezzati, M., Hughes, A., and E. Arku, R.: An integrated approach for generating rich city-wide air pollution data in growing Sub-Saharan African cities: Implementing transferable protocol in Kigali, Rwanda, EGU General Assembly 2024, Vienna, Austria, 14–19 Apr 2024, EGU24-1236, https://doi.org/10.5194/egusphere-egu24-1236, 2024.

Air pollution presents a formidable global challenge, exerting profound impacts on climate, human well-being and the world economy. Notably, atmospheric NO2, predominantly of anthropogenic origin, arises from diverse sources, including vehicular and industrial emissions. This study investigates the changes in global atmospheric NO2 through analysis of satellite and ground-based data, focusing on the period from 2002 to 2019. Elevated NO2 levels (> 8 × 10¹⁵ molec./cm2) are identified in regions such as the USA, Europe, India, China, the Middle East (MDE), South Africa (SA), Central Africa (CA) and selected regions in Brazil. Seasonal variability is evident, with peak concentrations in winter and troughs in summer, largely influenced by meteorological conditions and biomass burning. While NOx emissions from road transport dominate the USA and Europe, various industrial activities drive elevated NO2 levels in East China (EC), the Indo-Gangetic Plain (IGP) and SA. Noteworthy is the substantial decline (approximately -0.1 × 10¹⁵ molec./cm2/year) in NO2 observed in the USA and Europe during the study period. In contrast, significant positive trends (approximately 0.06–0.1 × 10¹⁵ molec./cm22/year) are noted in the MDE, EC, SA, CA and IGP. An additional analysis of NO₂ pollution in 3000 global cities reveals a declining trend in most cities in the USA and Western Europe (WE) at -0.1 × 10¹⁵ molec./cm2/year. Conversely, cities in India, China, Africa, Southeast Asia, MDE, and South America exhibit positive trends in NO2, ranging from 0.04 to 0.1 × 10¹⁵ molec./cm2/year. The decreasing NO2 trends in developed nations of North America and Europe are attributed to the enforcement of stringent vehicular norms, resulting in a significant reduction in road transport emissions. This study offers a comprehensive overview of recent NO2 pollution trends across nations and cities, highlighting the contrasting trajectories between developed and developing regions. It also suggests potential strategies for developing nations to mitigate air pollution.

How to cite: Kuttippurath, S. A.: Monitoring long-term changes in NO2 pollution from global to city scale: A journey guided by environmental laws and policies, EGU General Assembly 2024, Vienna, Austria, 14–19 Apr 2024, EGU24-1282, https://doi.org/10.5194/egusphere-egu24-1282, 2024.

EGU24-3111 | Orals | AS5.10

Dust Characterization and Evaluation of Indoor Environmental Quality (IEQ): Case Study of AFTU Buses in Senegal  

Bertrand Tchanche, Sotirios Papathanasiou, and Anil Namdeo

Africa is experiencing a high urbanization rate, ~4% with megacities emerging like Cairo in Egypt, Lagos in Nigeria, Kinshasa in Democratic Republic of Congo. In parallel, a deterioration in air quality is being witnessed. Road traffic contributes significantly to atmospheric pollution through unregulated traffic, poor roads’ design, poor fuel quality and surge in vehicle imports. Arica is the continent with lowest roads densities and with most unpaved roads. Congestion is now frequent in cities with adverse consequences on the economy, health, and society. High daily temperature observed in tropical climates, and favourable wind speed favour dust resuspension and Sahara dust dispersion. Literature review shows a less focus on in-cabin dispersion and impacts. The present work regards a study of the indoor environmental quality (IEQ) of the public transport buses provided by the AFTU company in the city of Thiès, in Senegal. A Particle Plus 8301-AQM2 Series handled optical particle counter (OPC) was used as it offers a good characterisation of the fine particles. the outdoor air, the vehicle itself and the occupants were identified main pollutants sources. Fine particles concentrations, carbon dioxide (CO2), temperature and relative humidity were recorded on several routes at different periods of the day and for several days during the rainy season. Recorded data show high concentration of PM2.5 which increases over time (from 25 up to 300 µg/m3) depending on outdoor conditions and the areas crossed by the vehicle. Variations of PM concentration in different channels: 0.5, 1, 2.5, 5 and 10 were also analysed. Recorded values showed very small mass fraction of 0.5 and large proportion of 5-10 µm diameter particles. CO2 concentration (300-900 ppm) varies with the number of passengers during the trip. The temperature was above 30 °C and the relative humidity, in the range 40-70%. The speed analysis shows high frequency variations and was found low, ~2.5 m/s. A conclusion that emerged is that keeping doors and windows open help in eliminating excess CO2 but ends in high level of particulate matter concentration in the cabin.

How to cite: Tchanche, B., Papathanasiou, S., and Namdeo, A.: Dust Characterization and Evaluation of Indoor Environmental Quality (IEQ): Case Study of AFTU Buses in Senegal , EGU General Assembly 2024, Vienna, Austria, 14–19 Apr 2024, EGU24-3111, https://doi.org/10.5194/egusphere-egu24-3111, 2024.

EGU24-7074 | Posters on site | AS5.10

Ground-Based Speciated Particulate Matter Monitoring as Part of the Multi-Angle Imager for Aerosols (MAIA) Investigation: A Focus on Low- and Middle-Income Countries  

Sina Hasheminassab, David J. Diner, Araya Asfaw, Jeffrey Blair, Sagnik Dey, Rebecca Garland, Pratima Gupta, L. Drew Hill, Fahad Imam, Christina Isaxon, Juanette John, Kristy Langerman, Yang Liu, Christian L’Orange, Tesfaye Mamo, Randall V. Martin, Lotta Mayana, Mogesh Naidoo, Christopher Oxford, and Jeremy Sarnat

Exposure to airborne particulate matter (PM) is the leading environmental risk factor globally. People living in low- and middle-income countries (LMICs) are at higher risk due to elevated levels of PM. Although the connection between total mass concentrations of PM and various health outcomes is well-documented, the relative toxicity of specific PM types—mixtures of particles with different sizes, shapes, and chemical compositions—remains poorly understood. To address this gap, the National Aeronautics and Space Administration (NASA) and the Italian Space Agency (Agenzia Spaziale Italiana, ASI) are jointly implementing the Multi-Angle Imager for Aerosols (MAIA) investigation to explore the association between PM types and adverse health outcomes. The MAIA satellite instrument—a multi-angle imaging spectropolarimeter—will collect targeted measurements of column-integrated aerosol optical and microphysical properties, which will be integrated with measurements from a network of ground-based PM monitors and outputs of the WRF-Chem atmospheric model to generate daily maps of near-surface total PM10, total PM2.5, and speciated (sulfate, nitrate, organic carbon, elemental carbon, and dust) PM2.5 mass concentrations at 1 km spatial resolution. The main focus of the MAIA investigation is a selected set of Primary Target Areas (PTAs) covering highly populated metropolitan regions distributed across the US, Europe, the Middle East, Africa, and Asia. Each PTA encompasses a region that is approximately 360 by 480 km. Three of the MAIA PTAs are in LMICs, including Ethiopia (Addis Ababa and vicinity), South Africa (Johannesburg and vicinity), and India (New Delhi and vicinity), where the MAIA project has deployed and is currently operating various types of surface-based PM pollution monitors. Fabrication of the MAIA satellite instrument was completed in October 2022, and its launch into sun-synchronous Earth orbit is anticipated to occur in 2025. This presentation will cover the ground-based PM monitoring component of the MAIA mission and present preliminary results collected thus far in the low- and middle-income PTAs (LMI-PTAs) and compare the observed total and speciated PM levels to those observed in other countries.

Where available, the MAIA project collects data from existing ground-based PM monitoring networks managed by government agencies, research groups, and other sources. In several PTAs, the MAIA project is capitalizing on the existing SPARTAN Surface Particulate Matter Network for PM2.5 speciation and has expanded this network with additional filter samplers; deployed Colorado State University filter samplers to complement PM2.5 speciation networks; and installed AethLabs microAeth MA350 monitors for black carbon measurements. In Ethiopia, where only a few PM2.5 monitors have historically been operating, a set of cost-effective PurpleAir sensors has been deployed to enhance the spatial coverage of ground-based PM2.5 measurements. The preliminary surface monitoring results indicate highly elevated PM concentrations in LMI-PTAs, which regularly exceed the WHO air quality guidelines. Notably, black carbon is found to be exceptionally high in these regions, reaching levels up to twelve times greater than those measured in developed countries.

How to cite: Hasheminassab, S., Diner, D. J., Asfaw, A., Blair, J., Dey, S., Garland, R., Gupta, P., Hill, L. D., Imam, F., Isaxon, C., John, J., Langerman, K., Liu, Y., L’Orange, C., Mamo, T., Martin, R. V., Mayana, L., Naidoo, M., Oxford, C., and Sarnat, J.: Ground-Based Speciated Particulate Matter Monitoring as Part of the Multi-Angle Imager for Aerosols (MAIA) Investigation: A Focus on Low- and Middle-Income Countries , EGU General Assembly 2024, Vienna, Austria, 14–19 Apr 2024, EGU24-7074, https://doi.org/10.5194/egusphere-egu24-7074, 2024.

EGU24-7641 | Orals | AS5.10

Cost-effective emission reductions to improve air quality in South Asia  

Pallav Purohit, Markus Amann, Gregor Kiesewetter, Wolfgang Schöpp, Fabian Wagner, Zbigniew Klimont, Chris Heyes, Adriana Gomez-Sanabria, Parul Srivastava, and Jens Borken-Kleefeld

South Asia is a global hotspot of air pollution, harboring 37 of the world's 40 most polluted cities. Sixty percent of its residents inhabit areas characterized by high pollution levels, where concentrations of fine particulate matter (PM2.5) - accountable for chronic respiratory diseases and over two million premature deaths annually in the region - surpass the least stringent air quality standard set by the World Health Organization (WHO). Addressing this problem with fragmented approaches is unlikely to yield significant results, as air pollution extends beyond geographical boundaries. Even if fully executed, existing policy measures will only offer partial relief in diminishing PM2.5 concentrations in South Asia.

This study aims to identify and map air pollution hotspots in South Asia in terms of concentration and exposure, understand the various sources of pollution in hotspot areas, and help categorize policy actions and interventions based on a systematic analysis of costs and benefits using the GAINS modeling framework. A large variety of emission sources contribute to PM2.5 pollution in ambient air therefore, effective air quality management needs to balance measures across these sources. Our results reveal that the current environmental policies will decouple emissions from economic growth, however, will not be sufficient to deliver large reductions in ambient PM2.5 in the South Asia region. There is scope for further measures beyond current policies that could approach the WHO Interim Targets (35 µg/m3) for PM2.5. Finally, cost-optimal strategies for air quality management can achieve significant cost savings compared to conventional approaches; however, they require cooperation within states, regions and countries in South Asia.

Monitoring of the chemical composition of PM2.5 reveals that a significant share of total fine particulate matter in ambient air in South Asia is composed of secondary particles, i.e., particles that are formed in the atmosphere through chemical reactions from gaseous precursor emissions (i.e., SO2, NOx, NH3 and VOC). This is relevant for air quality management, as measures that only address sources of primary particles often will not affect these secondary particles and thus have only a limited impact on total PM2.5 concentrations in the atmosphere. Cost- effective air quality management must also include measures for the precursor emissions of secondary particles. Some legislation exists for SO2 and NOx emissions, but its effectiveness can be enhanced by also including ammonia emissions (mainly from agricultural sources) in the portfolio as in many situations they are critically determining the generation of secondary particles.

This study examines four scenarios aimed at mitigating air pollution, varying in terms of policy implementation and international collaboration. The most economically efficient scenario, characterized by full coordination among states/provinces, regions, and countries within South Asia, would lead to a reduction in the average PM2.5 exposure in the region to 30 μg/m³ by 2030. Implementation of this cost-effective scenario is projected to annually prevent 750,000 premature deaths by 2030. The developed scenarios are integrated into the World Bank's support for crafting regional air quality management plans at both state/province and regional (i.e., Indo-Gangetic Plain) levels in South Asia.

How to cite: Purohit, P., Amann, M., Kiesewetter, G., Schöpp, W., Wagner, F., Klimont, Z., Heyes, C., Gomez-Sanabria, A., Srivastava, P., and Borken-Kleefeld, J.: Cost-effective emission reductions to improve air quality in South Asia , EGU General Assembly 2024, Vienna, Austria, 14–19 Apr 2024, EGU24-7641, https://doi.org/10.5194/egusphere-egu24-7641, 2024.

EGU24-8285 | ECS | Posters virtual | AS5.10

Estimating The Health Benefits from Air Quality Improvements in Ahmedabad, India Under the National Clean Air Programme 

Ritika Kapoor, Vijay Limaye, and Abhiyant Tiwari

Outdoor air pollution contributed to an estimated 980,000 deaths in 2019 and imposes an enormous public health burden in India. For many Indian cities, average annual exposures are above the current National Ambient Air Quality Standard (annual average of 40 µg/m3). To provide a roadmap for addressing unhealthy air pollution levels, the Government of India launched the National Clean Air Programme (NCAP) in 2019. The NCAP effort aims to reduce fine particulate matter PM2.5 levels 20–30% by 2024 relative to 2017 levels in 132 cities that are in nonattainment for the annual NAAQS. Ahmedabad,  a city of about 8.5 million people in Gujarat state, in 2017 launched continuous air quality monitoring and has been taking steps to reduce PM2.5 levels through NCAP actions.  We investigated publicly available air quality data for Ahmedabad to evaluate how city air quality has changed during NCAP implementation and deploy an air quality and health impact assessment model to estimate the health effects of city air pollution.

Specifically, we configured the Benefits Mapping and Analysis Program-Community Edition (BenMAP-CE) with local air pollution, population, and baseline health data to estimate citywide air quality effects on human health from PM2.5 exposures between 2018 and 2022 using air quality exposure-response functions derived from international epidemiological cohort studies. Overall, we find that the average air quality improved slightly in Ahmedabad during the evaluation period, from 63.4 to 56.2 µg/m3 in 2022, based on available air monitoring data. That decrease represents a 7.2% reduction in annual PM2.5 levels, while attainment of the 30% NCAP goal by 2022 would have resulted in an annual PM2.5 level of 44.4 µg/m3 in 2022. Our health effect analysis in BenMAP-CE are estimates changes in annual all-cause mortality by analyzing population-weighted PM2.5 exposures. We estimate that observed reductions in PM2.5 levels from 2018-2022 are associated with 1631 (95% CI, 1234 - 2010) fewer deaths citywide. However, if the 30% NCAP target had been achieved by 2022, the city would have seen 3931 (95% CI, 2984 - 4834) fewer deaths from PM2.5 exposures. Our integrated air quality and health assessment provides a blueprint for other Indian cities to evaluate how air quality changes affecting human health and shows how a focus on the health impacts of cleaner air can support future NCAP implementation efforts nationwide.


How to cite: Kapoor, R., Limaye, V., and Tiwari, A.: Estimating The Health Benefits from Air Quality Improvements in Ahmedabad, India Under the National Clean Air Programme, EGU General Assembly 2024, Vienna, Austria, 14–19 Apr 2024, EGU24-8285, https://doi.org/10.5194/egusphere-egu24-8285, 2024.

The Greater Kuala Lumpur (GKL) is the most urbanised region in Malaysia that experiences persistently high levels of PM2.5. Transboundary haze caused by biomass burnings in Sumatra, Indonesia, exacerbates the PM2.5 concentration levels in GKL, negatively impacting the public's health and the socioeconomic environment. We aim to investigate the specific influence of fires induced by biomass burnings in Sumatra provinces, namely Jambi, Riau, and South Sumatra, on PM2.5 concentration levels in GKL during the transboundary haze of September 2019. Our research addresses four key objectives: i)analysing PM2.5 pollution level during 2019 in GKL at Bangi (BG), Batu Muda (BM), Cheras (CS), Klang (KG), Kuala Selangor (KS), Putrajaya (PA), Petaling Jaya (PJ), and Shah Alam (SA); ii)estimating PM2.5 emissions from biomass burnings in Sumatra in 2019; iii)determining smoke pathways during biomass burning events in September 2019; and iv)estimating the contribution of Riau, Jambi and South Sumatra provinces towards PM2.5 concentration load in GKL during September 2019. Our analysis revealed that in September 2019, 80% to 100% of days in GKL exceeded the Malaysian Air Quality Standard (MAQS) and the World Health Organization (WHO) daily guideline for PM2.5 levels. We utilised the Global Fire Assimilation System (GFASv1.2) biomass emission inventory to estimate the total PM2.5 mass emitted from biomass burning events within our domain, latitude 5oS to 10oN and longitude 95oE to 110oE. Our estimation showed that 1.78 teragrams (Tg) of PM2.5 mass was emitted from biomass burnings within the study region in 2019, with 55% (0.90Tg) of these emissions occurring in September. Spearman's analysis demonstrated a strong positive correlation (ρ = 0.747, p < 0.001) between PM2.5 mass emissions from Sumatran biomass burnings and elevated PM2.5 concentration levels in GKL in September 2019. Emissions from Jambi, Riau and South Sumatra provinces accounted for approximately 94% of the total PM2.5 mass emitted during September 2019. Using the Numerical Atmospheric-Dispersion Modelling Environment (NAME) backward run, we observed that the southwestern air pathway influenced the transport of smoke-induced by biomass burning from Jambi, Riau, and South Sumatra towards GKL throughout September 2019. By integrating the NAME backward run with GFASv1.2, we simulated the PM2.5 concentrations in GKL that originated from biomass burnings in these three provinces. The NAME-GFAS model exhibited a slight underestimation (mean bias: -3 µgm-3 to -12 µgm-3) compared to biomass-induced  PM2.5 concentration levels in GKL at the eight locations in GKL in 2019. Notably, the model and observations demonstrated good agreement at these locations for September (correlation coefficient: 0.62– 0.70). Our model predicts that fires from Riau and Jambi provinces collectively account for 97% of  PM2.5 concentration levels in GKL during transboundary haze. Of these, fires from Riau dominated PM2.5 concentration levels in KG (56%), KS(51%) and BG (56%). While Jambi contributed mostly to BM(57%),PJ(51%),CS(55%) and PA (44%). SA has equal contributions from Riau and Jambi. South Sumatra consistently contributed between 1-3% at the respective stations. These findings stress the urgency of considering the effect of geographical morphology in addressing elevated PM2.5 levels during transboundary haze events in GKL.

How to cite: Murulitharan, J., Archibald, A., and Giorio, C.: Uncovering the effect of fires in Jambi, Riau, and South Sumatra on PM2.5 concentration levels in Greater Kuala Lumpur during September 2019 transboundary haze pollution, EGU General Assembly 2024, Vienna, Austria, 14–19 Apr 2024, EGU24-8954, https://doi.org/10.5194/egusphere-egu24-8954, 2024.

EGU24-10283 | ECS | Orals | AS5.10

High-resolution spatiotemporal measurement and city-scale modelling of air and noise pollution in Accra Ghana: sensors, deep learning, and street-view imagery 

Ricky Nathvani, Sierra Clark, Absosede Sarah Alli, Vishwanath Doreswamy-Gowda, Jiayuan Wang, Michael Brauer, James Nimo, Josephine Bedford Moses, Solomon Baah, Alison Hughes, Samuel Agyei-Mensah, James Bennett, Raphael E Arku, and Majid Ezzati

Air and noise pollution are significant emerging environmental health hazards in African cities, with potentially complex spatial and temporal patterns. Limited local data are a major barrier to the formulation and evaluation of policies to reduce air and noise pollution.

We designed and carried out an innovative 3-year measurement campaign to characterise air and noise pollution and their sources at high-resolution within the Greater Accra Metropolitan Area (GAMA), Ghana. Our design used a combination of fixed (3 year-long, n=10) and rotating (week-long over 1 year, n =136) sites, selected to represent a range of land uses and source influences. We collected data on PM2.5, black carbon (BC), nitrogen oxides (NOx), weather variables, noise pollution, along with street level time-lapse images with cameras. To do this, we strategically deployed low-cost, low-power, lightweight monitoring devices in an integrated station that was robust, socially unobtrusive, and able to function in the West African coastal climate. We used spatiotemporal land use regression models to predict PM2.5, NO2, BC and noise pollution across the city in high spatial resolution, and state-of-the-art methods in deep learning to predict pollution levels in high temporal resolution by training classification algorithms on 2 million time-lapse images captured at street level with corresponding pollution measurements. 

Most measurement sites recorded air pollution and noise levels above the WHO health-based guidelines. Spatiotemporal LUR models achieved good out of sample R2’s of 0.51-0.54 (noise), 0.58 – 0.83 (PM2.5), 0.78 - 0.80 (NO2) and 0.79 – 0.88 (BC). From the deep learning image-based analysis, the classification (prediction) accuracy of noise levels in space and time was higher (40-70%) than PM2.5 (30-55%), due to the localised nature of noise source emissions, and the fine-grained nature of our classes, which distinguish between small changes than previous studies.  

Our approach to monitoring and modelling air and noise pollution can be scaled up in other SSA cities to fill critical data gaps, and is already being successfully piloted in Kigali, Rwanda. The exposure surfaces developed with the LUR models are now supporting ongoing epidemiological studies assessing the impact of exposure to air and noise on birth outcomes and child health and development in Accra. Street view imagery are an increasingly available resource in cities around the world (from CCTV; Google Street View), and results from our deep learning image-based analysis show that the time lapsed images are a uniquely informative source of data for predicting high resolution temporal change in exposure, simultaneously with the presence or absence of potential determinants, though integrating with high spatial resolution remains a challenge.

How to cite: Nathvani, R., Clark, S., Alli, A. S., Doreswamy-Gowda, V., Wang, J., Brauer, M., Nimo, J., Moses, J. B., Baah, S., Hughes, A., Agyei-Mensah, S., Bennett, J., Arku, R. E., and Ezzati, M.: High-resolution spatiotemporal measurement and city-scale modelling of air and noise pollution in Accra Ghana: sensors, deep learning, and street-view imagery, EGU General Assembly 2024, Vienna, Austria, 14–19 Apr 2024, EGU24-10283, https://doi.org/10.5194/egusphere-egu24-10283, 2024.

EGU24-14179 | ECS | Orals | AS5.10

The State of Global Air Initiative: Increasing Access to Data on Air Quality and its Health Impacts  

Abinaya Sekar, Ada Wright, Victor Nthusi, and Pallavi Pant

Air pollution is the leading environmental risk factor for human health, with millions of deaths annually and significant societal and economic costs. While access to the latest, reliable, and free air quality and health data is vital for informed decision-making, data on air pollution remains limited, especially in low- and middle-income countries (LMICs). The State of Global Air Initiative (SoGA), a collaboration between the Health Effects Institute and the Institute for Health Metrics and Evaluation, addresses this need by presenting comparable data on levels and trends of air quality and the associated health impacts for more than 200 countries and territories and more than 7000 cities around the world.

The data are drawn from the Global Burden of Disease (GBD) Study and include data on exposure to air pollutants - fine particulate matter (PM2.5), ozone (O3) and nitrogen dioxide (NO2) and the associated burden of disease – deaths, death rate and disability adjusted life years (DALYs) as well percentage of deaths attributed to specific causes of disease and death. To enhance accessibility and reach, the information is presented in a variety of ways including reports, factsheets, an interactive data app, story maps, and videos, often in multiple languages. All the reports and data resources are accessible via https://www.stateofglobalair.org/.

These estimates are produced using a variety of data - air quality estimates are produced from a combination of data from over 10,000 ground-based monitors, satellite observations, and outputs from GEOS-Chem, a chemical transport model. The disease burden estimates are produced using country-specific death and morbidity rates, other health data including disease incidence, population demographics, and exposure-response curves derived from epidemiological studies. However, since the estimates rely on available data on air quality and health, in some cases, estimates are uncertain, particularly in parts of Asia and Africa where data gaps remain. A new dataset featuring estimates for the year 2021 is set to be released shortly. Despite the caveats, such information can be used for public engagement and for making evidence-based decisions to improve air quality and public health.

In 2022 alone, the SoGA initiative reached audiences in more than 50 countries, and for many countries, they are the only available estimates for air pollution levels and associated health impacts. The data have been used for public engagement, media reporting and to inform policy decisions, especially in LMICs. These data are also relevant for scientific research.

Overall, the SoGA initiative serves to close the gap between scientific research and public understanding on air pollution and its health impacts. In this presentation, we will showcase data from the SoGA platform, review lessons learnt and highlight opportunities for future research and engagement.

How to cite: Sekar, A., Wright, A., Nthusi, V., and Pant, P.: The State of Global Air Initiative: Increasing Access to Data on Air Quality and its Health Impacts , EGU General Assembly 2024, Vienna, Austria, 14–19 Apr 2024, EGU24-14179, https://doi.org/10.5194/egusphere-egu24-14179, 2024.

EGU24-14441 | ECS | Orals | AS5.10

Bridging Data Gaps for Air Quality Monitoring: Daily PM2.5 Estimates for 10 km Grid Cells in India 

Ayako Kawano, Makoto Kelp, Minghao Qiu, Eeshan Chaturvedi, Sunil Dahiya, and Marshall Burke

India has experienced elevated levels of Particulate Matter (PM) 2.5 concentrations. Despite increased efforts by the Indian government,  the current monitoring network remains limited, impeding a comprehensive understanding of PM2.5 variations throughout the country. Limited PM2.5 data has led previous health studies to rely on publicly-available monthly PM2.5 estimates. However, these estimates have large uncertainties over the under-monitored regions, including India because PM2.5 observations have been calibrated into their model. The coarse temporal resolution of existing datasets makes it challenging to assess short-term effects of exposure to PM2.5. To bridge these gaps, it is imperative to develop daily PM2.5 datasets with robust spatial and temporal certainty.

This study develops open-source daily PM2.5 datasets at a 10 km resolution for India spanning almost two decades (2005 - 2023). Leveraging two-stage machine learning model with 10-fold spatial cross-validation (CV), we generate PM2.5 estimates for regions without ground measurements. In contrast to random k-fold CV, widely used in previous studies, spatial CV is implemented in this study to control for spatial auto-correction, which could lead to overfitting to the training data and underestimation of spatial prediction errors. The first stage fills missing observations for daily MODIS AOD, Sentinel-5P mission's TROPOPOMI NO2, and TROPOMI CO. The second stage predicts daily ground-measured PM2.5 concentrations. Two models are constructed for the second stage: the AOD model and the Full model, the latter incorporating TROPOMI features in addition to AOD.

The Full model exhibits a spatial out-of-sample performance with an R2 of 0.68, effectively predicting local and temporal PM2.5 variations rather than just average differences between locations, months, or years (within R2 = 0.49). The AOD model performs similarly, with an R2 of 0.64 and within R2 of 0.45. At the monthly level, our model outperforms the existing monthly PM2.5 dataset, with an R2 of 0.74 and within R2 of 0.52. 

Utilizing our PM2.5 predictions, we identified that 31% of 10 km grid cells across the country demonstrated a more than 5% reduction in PM2.5 concentrations in 2018-2022 compared to 2005–2010, and any decrease in PM2.5 was observed in 75% of the locations. Additionally, population-weighted annual average PM2.5 concentrations indicate a decline since 2018, except for a notable increase in 2021. Despite an overall declining trend since 2018, approximately 60% of the population remains exposed to PM2.5 concentrations above the national annual guideline (40 µg/m3), with 10% facing extreme levels of 80 µg/m3 annually.

Our method is useful for resource-constrained countries to understand nationwide air quality trends and identify areas with elevated pollution. To address this, we established the optimal number of air quality monitors using multiple machine learning models with randomly-sampled incremental training data. Our findings show a polynomial increase in within R2 for test data, ranging from 0.24 at 25 monitors to 0.54 at 300 monitors in the training data.

Our predictions offer valuable insights into air quality trends in India from 2005 to 2023. Importantly, our estimates contribute to understanding the number of ground monitors needed to explain variations in PM2.5 concentrations across the country, offering insights for other countries.

How to cite: Kawano, A., Kelp, M., Qiu, M., Chaturvedi, E., Dahiya, S., and Burke, M.: Bridging Data Gaps for Air Quality Monitoring: Daily PM2.5 Estimates for 10 km Grid Cells in India, EGU General Assembly 2024, Vienna, Austria, 14–19 Apr 2024, EGU24-14441, https://doi.org/10.5194/egusphere-egu24-14441, 2024.

In India, agricultural burning, also known as  crop residue burning, is a significant source of air pollution, but quantifying PM2.5 emissions from these open burns has been a persistent challenge for researchers. Global fire databases actively relies on MODIS (Moderate Resolution Imaging Spectroradiometer)  for information on burn area, although MODIS has decades of fire activity data, the coarse spatial resolution (500 m–1 km) along with smog and hazy conditions in Punjab leads to inaccurate detection of fires and burn areas. In our previous work, we developed and implemented a deep learning-based segmentation model combined with Sentinel 2 imagery for accurate fire estimates from open burns and here we discuss our progress on region-specific domain adaptation of the model over Punjab.   
Initially, the model was trained on Sentinel-2 data from Portugal, utilizing the ICNF (Portuguese Institute for Nature Conservation and Forests) as reference data during 2016 - 2017, and subsequently tested on Punjab through a transfer learning approach.  Now, minimizing false detections by the pre-trained model requires region-specific adaptation; however, inadequate monitoring and lack of reference data in Punjab poses major challenges in the fine-tuning process. Therefore, we utilize ground level geolocated image data collected during our field observation campaign in Punjab along with Sentinel-2 and Google Earth data as an input to the pre-trained model. For the year 2020, over 1400 sites were identified as potential burn area polygons and integrated into vector data, with careful exclusion of aquatic bodies and urban areas to prevent false detections. The refined model processes this annotated data along with Sentinel-2 spectral bands B03 (green), B8A (Near Infrared), and B11 (Short Wave Infrared). Another significant challenge in conventional fire detection methods is identifying smaller burn areas. To address this, the model was deliberately trained with several smaller burned areas (up to 0.0256 hectares) in the  sample  to enhance the detection of smaller burns that often escape traditional methods. For validation, we intend to utilize  the onsite geolocated images taken during the campaign from different time periods. Model’s performance is evaluated using the Dice and IOU score method. Currently, the pre-trained model has an accuracy of 0.62 in Dice and 0.59 in IOU, with aspirations to elevate this accuracy to between 0.85 and 0.90.

As we await the outcomes of our ongoing analysis, we are enthusiastic to see how deep learning combined with high-resolution multispectral imagery of Sentinel - 2  can be used to fill missing gaps in burn area assessments. Our fire estimates and spatial burn area pattern for multiple years on Punjab,  will help us quantify the emission contribution from burning at local and regional level and help us understand how the emissions from the field are impacting the air quality in the nearby areas.  This enhanced methodology  aims to set the stage for creating a high-resolution fire emission inventory specifically for crop residue burning. The findings from this research will contribute significantly to understanding the impact of agricultural burning on air quality and may inform future studies and policy decisions.  

How to cite: Anand, A., Imasu, R., Muramatsu, K., and Patra, P.: Domain adaptation of deep learning  segmentation model for agricultural burn area detection using Hi-Resolution Sentinel-2 observations: A case study in Punjab, India, EGU General Assembly 2024, Vienna, Austria, 14–19 Apr 2024, EGU24-16351, https://doi.org/10.5194/egusphere-egu24-16351, 2024.

EGU24-17403 | ECS | Posters on site | AS5.10

Review of Big Data Sources for High Spatial and Temporal Resolution On-Road Transport Emission Inventories 

Asha S Viswanathan, Sarath Guttikunda, and Rahul Goel

Low- and middle-income countries (LMICs) often have the highest levels of air pollution. At the same time, there is a serious lack of routinely collected data (e.g., traffic counts) to develop emission inventories and guide evidence-based policy interventions. The spatial resolution of emission inventories by international research groups (e.g., EDGAR) is often too coarse to represent within-city variation. There is an urgent need to identify cost-effective data sources and develop methods that can be readily applied across LMICs to generate emission inventories at high spatiotemporal resolution. We will present a review of potential big data sources, highlight their strengths and limitations, and propose methodological framework for data fusion to develop transport emissions inventory for an LMIC setting (New Delhi, India).

While many transport inventories have been published for this setting in the past, they have limited reproducibility and often depend on data sources that are static in nature (e.g., vehicle registrations) and are annual estimates. The spatial resolution of these inventories is improved using assumed proxies (e.g., type of road), and temporal resolution using traffic count data or surveys. In some cases, the available data is supplemented by data- and time-intensive traffic simulation studies. We propose that these limitations can be overcome by big data sources combined with ground truth using context-specific low-cost observational surveys.

Through our preliminary review, we identified the following typologies of big data sources: a) satellite or aerial imagery, b) street imagery (e.g., google street view), c) ground-based instrumentation (e.g., CCTV), and d) crowd-sourced GPS data trajectories. The satellite/aerial data, with varying image resolutions (as high as 0.1 m) and their update frequency (as frequent as 1 day), are promising in their potential for vehicle detection to estimate a spatial spread of traffic and to detect longitudinal changes. Street imagery can supplement overhead satellite imagery through accurate detection of smaller vehicles (e.g., motorcycles). GPS data can be used for routing of vehicles, and CCTV recordings (at limited number of locations) can provide diurnal variation and accurately identify types of vehicles.

Use of such data has methodological challenges and requires multidisciplinary skills. Big data is analysed using machine learning methods and computer vision techniques, supported by high-performance computing resources. There is also a need to develop data fusion techniques to harmonise and integrate data across different sources (spatially detected vehicles, GPS routing, and time varying vehicle counts). Additional details of vehicle age, fuel type and emission factors are estimated from public datasets and literature. While challenging, this is usually a one-time procedure for a setting, after which revisions do not require the same amount of time or effort. Using New Delhi, India as a case study, the talk will discuss the application of these data sources and methods.

How to cite: Viswanathan, A. S., Guttikunda, S., and Goel, R.: Review of Big Data Sources for High Spatial and Temporal Resolution On-Road Transport Emission Inventories, EGU General Assembly 2024, Vienna, Austria, 14–19 Apr 2024, EGU24-17403, https://doi.org/10.5194/egusphere-egu24-17403, 2024.

EGU24-18168 | Orals | AS5.10

PM2.5 exposure characterisation around opencast coal mines: leveraging health risk and toxicity assessment 

Kamlika Gupta, Victor Chang, Mohan Yellishetty, and Harish Phuleria

Introduction and background

Opencast coal mining accounts for more than 85% of coal production in India. Heavy transportation and mining activities have been identified as a significant contributor to the emission of fugitive dust and fine particulate matter (PM2.5) leading to a decline in air quality and negative health impacts within densely populated coal mining regions. PM2.5-bound species which are not routinely monitored such as elemental carbon (surrogate for diesel particulate matter, a Class I carcinogen), toxic metals and PAHs (poly aromatic hydrocarbons) may pose significant risk to the inhabitants around these areas raising serious health and regulatory concerns.  

Methodology

PM2.5 samples were collected from roadsides and residential sites near an active coal mining area in Eastern Maharashtra, India at 2, 5 and 10 kms from the mine site comprising of a typical coal haul roadside, an urban roadside, and residential locations. Collected PM samples were analysed for elemental and organic carbon (EC & OC) through thermo-gravimetric analysis, water-soluble metals through ICP-MS and PAHs through GC-MS. Carcinogenic and non-carcinogenic risk was estimated for these species and PM toxicity was measured through acellular assays (Dithiothreitol and Ascorbic Acid).  

Results and conclusions

Five-folds higher PM2.5 exposure levels (~500 ± 190 µg/m3) were observed near coal-haul road than at the residential sites. PM2.5 concentration at 2 and 5 km residential sites was comparable (100-120 µg/m3), but 2-3 times lower at the 10 km site and the residential background location. Average DPM concentration (measured as EC) across the sites was 11.3 ± 12.2 µg/m3, with 3 times higher levels at the coal haul road due to the dominance of diesel-powered trucks. Cr (20 ± 2.3 µg/m3), Ni (5.6 ± 0.3 µg/m3), Cd (7.2 ± 1.5 µg/m3), As (2.8 ± 1.6 µg/m3), and Pb (3.7 ± 0.9 µg/m3) emerged as important carcinogenic metals across the sites likely attributable to coal combustion and vehicular exhaust. Average levels of Benzo(a)pyrene, a priority pollutant, was observed to be 15 ± 2.3 ng/m3 at the community sites. Toxicity of PM—measured as OPvolAA and OPvolDTT—was higher at the roadside (2.3 ± 0.6 nmol min-1 m-3 and ~1.9 ± 0.8 nmol min-1 m-3 respectively) compared to residential sites (~0.76 ± 0.01 nmol min-1 m-3 and 0.94 ± 0.2 nmol min-1 m-3 respectively) against the background 0.6 ± 0.2 nmol min-1 m-3 (OPAA) and 0.9 ± 0.12 nmol min-1 m-3 (OPDTT). The inhalation risk for PM2.5 was observed to be 4 x 10⁻⁴ indicating a significant risk to the population. The study highlights the high exposure to PM2.5 and potential health risks in communities around opencast coal mines. It further underscores the need for considering PM composition and toxicity in environmental regulations to safeguard public health from the adverse impacts of industrial activities in data scarce low- and middle-income countries.  

How to cite: Gupta, K., Chang, V., Yellishetty, M., and Phuleria, H.: PM2.5 exposure characterisation around opencast coal mines: leveraging health risk and toxicity assessment, EGU General Assembly 2024, Vienna, Austria, 14–19 Apr 2024, EGU24-18168, https://doi.org/10.5194/egusphere-egu24-18168, 2024.

EGU24-19373 | Posters on site | AS5.10

Observing air pollution from satellite: EUMETSAT contribution to air quality monitoring at the global scale 

Federico Fierli, Dominika Czyzewska, Sara Basart, Rebecca Garland, Cathy Clerbaux, Vincent Gabaglio, and Anu-Maija Sundstrom

EUMETSAT’s (European Organisation for the Exploitation of Meteorological Satellites) contribution to global air quality monitoring is multifaceted, encompassing technological advancements, long-term commitments, and a collaborative approach to address environmental challenges.

The organization has been actively involved in satellite observations since 1990 through programs like Meteosat and Metop, and since 2015, it has been contributing to the Copernicus EU program. This effort is particularly significant for supporting air quality monitoring in developing countries, where reliable in-situ observatories are limited, and there is high vulnerability to pollutants and climate change impacts. The data provision is set to continue for the next two decades thanks to next-generation missions such as Meteosat Third Generation (MTG). These missions, along with instruments like Sentinel-4 and Sentinel-5 under the Copernicus EU program, are dedicated to air quality monitoring in specific regions, including North Africa and globally.

Here, we will showcase how the atmospheric composition data obtained from EUMETSAT's satellites can be utilized for air quality analysis at the continental and local scale. Recent scientific applications based on datasets from Infrared Atmospheric Sounding Interferometer (IASI) and Sentinel instruments will be reviewed. In addition, examples on how EUMETSAT's satellite data is used to monitor phenomena that have direct implications for health and security, such as desert dust storms and wildfire emissions. A critical part of the discussion will focus on the advantages and drawbacks of satellite data due to observational configurations. This may involve addressing challenges and limitations while highlighting the strengths of satellite observations for air quality monitoring. Finally, it will be shown the importance of data access and training for effective utilization of satellite data. Additional value can be derived from satellite information through techniques like data assimilation and the application of artificial intelligence and machine learning (AI-ML methods).

How to cite: Fierli, F., Czyzewska, D., Basart, S., Garland, R., Clerbaux, C., Gabaglio, V., and Sundstrom, A.-M.: Observing air pollution from satellite: EUMETSAT contribution to air quality monitoring at the global scale, EGU General Assembly 2024, Vienna, Austria, 14–19 Apr 2024, EGU24-19373, https://doi.org/10.5194/egusphere-egu24-19373, 2024.

Air quality degradation in Tier 2 non-attainment Indian cities is a rising concern as the air pollution level is alarmingly increasing, similar to metropolitan cities. Efficient urban air quality management measures in Tier 2 non-attainment cities require a comprehensive emission inventory to support the air pollution abatement strategies. The present study developed a detailed emission inventory of the primary criteria pollutants (PM10, PM2.5, SO2, NOx, CO) and NMVOCs accounting for all the urban anthropogenic sources. The bottom-up emission estimate technique was applied to the Vijayawada metropolitan region, one of India's most polluted tier 2 cities. The emission load of PM10, PM2.5, SO2, NOx, CO, and NMVOCs over Vijayawada were estimated to be 5.65 Gg, 2.13 Gg, 1.38 Gg, 8.91 Gg, 17.17 Gg, and 2.33 Gg respectively in 2021. Road and construction dust accounted for 74% of PM10 and 45% of PM2.5, whereas active motorized vehicular activities significantly contributed to CO (78%) and NOx emissions (69%), and the industrial sector accounted for 96% of the overall SO2 emission load across Vijayawada.

Further, various strategies were tested to project the emission load of PM10, PM2.5, SO2, and NOx under the Business as Usual (BAU) and Alternative (ALT) scenarios for 2025 and 2030, respectively, to evaluate the increased and reduced emission potential. Under the BAU scenarios, the key factors for future projections of sectoral activity data are the population and economic growth of Vijayawada. The BAU scenarios indicated an overall emission increase of 12% and 36% in PM10, 4% and 22% in PM2.5, and 5% and 11% in SO2, whereas the overall NOx emissions are estimated to be reduced by 13% and 14% in 2025 and 2030 respectively. Introducing the BSVI emission standards and phasing out older vehicles were the key scenarios for reducing NOx emissions under BAU scenarios. The strategies tested under the ALT scenarios considered the multi-sectoral control actions declared or proposed by national and state governments owing to the potential to reduce air pollution in the study area. Advanced control techniques, coupled with shifting towards cleaner fuels, may show the potential to reduce the overall PM10 emissions by 13% and 15%, PM2.5 by 16% and 23%, SO2 by 24% and 48%, and NOx emission by 20% and 32% in 2025 and 2030 respectively, under ALT scenarios. The study findings provide a comprehensive emission database encompassing pollutants, sources, and area-specific quantitative information for Tier 2 non-attainment cities. The research outcome will also be used as the guiding tool by the scientific community, air quality researchers, and policymakers for designing practical and feasible air pollution abatement strategies and management plans to provide clean air for present and future generations at the city level.

Keywords: Emission Inventory, Scenarios development, Urban anthropogenic sources, Mitigation measures, Non-attainment cities

How to cite: Sharma, M. and Jain, S.: Bottom-up approach to estimate the present and future air emissions under different policy scenarios in Tier-2 non-attainment city in India, EGU General Assembly 2024, Vienna, Austria, 14–19 Apr 2024, EGU24-20598, https://doi.org/10.5194/egusphere-egu24-20598, 2024.

EGU24-7931 | Orals | ESSI4.4 | Highlight

Advancing Open Data Portals: Learnings from the EPOS Open-Source Solution 

Valerio Vinciarelli, Rossana Paciello, Daniele Bailo, Claudio Goffi, Daniel Warren, Janusz Lavrnja-Czapski, Christopher Card, Philip Atkinson, Wayne Shelley, Jean-Baptiste Roquencourt, Yann Retout, Helen Glaves, Kety Giuliacci, Jan Michalek, Jakob Molander, Harald Nedrebø, Otto Lange, Carmela Freda, Kauzar Saleh-Contell, and Manuela Sbarra

The European Plate Observing System (EPOS), established as a European Research Infrastructure Consortium (ERIC) in 2018, stands as a significant milestone in pan-European research infrastructures, focusing on solid Earth science. The EPOS Data Portal, officially launched in April 2023, is the place where FAIR principles and practices are implemented thanks to the adoption of a co-development approach and  harmonization of actions across communities of scientists, developers, data providers, and users. The EPOS Data Portal currently provides access to data and products from 10 different disciplines: Seismology, Near-Fault Observatories, GNSS Data and Products, Volcano Observations, Satellite Data, Geomagnetic Observations, Anthropogenic Hazards, Geological Information and Modeling, Multi-Scale Laboratories, and Tsunami.

The EPOS Data Portal is based on a user-friendly user interface which provides intuitive visualization methods and interaction modes that significantly simplifies and facilitates the discovery and the access to the geoscientific community assets. Through the portal, users can: i) Perform data searches by combining a set of criteria; ii) Navigate and visualize the retrieved search results in different ways; iii) Fine-tune results using facets and advanced filters; iv) Download selected results or store them in a favorites list.

The underlying system of the Data Portal has been crafted using a blend of open-source technologies, including Java, RabbitMQ, Python, and others. We implemented a modular architecture based on the microservices paradigm, facilitating seamless integration of new data and services through dedicated software interfaces. The source code, collaboratively developed by scientists and IT experts, is now available under a GPL license (https://epos-eu.github.io/epos-open-source/) along with a comprehensive developer’s guide.


In this contribution, we demonstrate the potential impact of our open-source solution in advancing visualizations, interfaces, and best practices within the context of multidisciplinary research. Furthermore, we present how other research infrastructures, projects and initiatives can benefit from the shared knowledge and expertise, accelerating the development of robust and advanced Earth science data portals.

How to cite: Vinciarelli, V., Paciello, R., Bailo, D., Goffi, C., Warren, D., Lavrnja-Czapski, J., Card, C., Atkinson, P., Shelley, W., Roquencourt, J.-B., Retout, Y., Glaves, H., Giuliacci, K., Michalek, J., Molander, J., Nedrebø, H., Lange, O., Freda, C., Saleh-Contell, K., and Sbarra, M.: Advancing Open Data Portals: Learnings from the EPOS Open-Source Solution, EGU General Assembly 2024, Vienna, Austria, 14–19 Apr 2024, EGU24-7931, https://doi.org/10.5194/egusphere-egu24-7931, 2024.

EGU24-11327 | ECS | Orals | ESSI4.4

EOmaps: An open-source python package for geographic data visualization and analysis. 

Raphael Quast and Wolfgang Wagner

EOmaps is a free and open-source python package specifically tailored for geographic data visualization and analysis.

The main goals of the package are twofold:

  • Speed up and simplify the daily struggle of geographic data visualization
  • Directly use the figures as fully customisable interactive data-analysis widgets

EOmaps is built on top of matplotlib and cartopy and integrates well with the scientific python infrastructure (numpy, pandas, xarray, geopandas, datashader, etc.). It provides a flexible and well-documented API to create publication-ready figures and it can be used to visualize (potentially large) structured (e.g. raster) or unstructured (e.g. unordered lists) datasets provided in arbitrary projections. 

In addition, EOmaps comes with many useful features to help with scientific geo-data analysis:

  • Maps can have multiple layers to interactively compare and (transparently) overlay datasets, web-maps etc.
  • Once a dataset is plotted, you can assign arbitrary callback functions to interactively run your analysis-workflow on selected datapoints (e.g. load data from a database, plot underlying timeseries, histograms etc.)

Figures created with EOmaps can be exported as images (png, jpeg, ...), vector-graphics (svg) or embedded in Jupyter Notebooks, web-pages (html) or in GUI frameworks such as Qt or tkinter.

In this presentation we will highlight the capabilities of EOmaps and show how it can be used in a variety of different situations to aid your scientific data analysis workflow.

EOmaps source-code: https://github.com/raphaelquast/EOmaps  
EOmaps documentation: https://eomaps.readthedocs.io/

How to cite: Quast, R. and Wagner, W.: EOmaps: An open-source python package for geographic data visualization and analysis., EGU General Assembly 2024, Vienna, Austria, 14–19 Apr 2024, EGU24-11327, https://doi.org/10.5194/egusphere-egu24-11327, 2024.

EGU24-11805 | Posters on site | ESSI4.4

Next-Gen Zarr Web Map Visualization 

Aimee Barciauskas, Max Jones, Kata Martin, Sean Harkins, and Vincent Sarago

Visualization of Earth science data is crucial for its exploration and understanding. Web browsers, as a universal platform, face the challenge of rendering complex geospatial data swiftly. This led to the creation of pre-generated static map tiles, allowing quick visualization but limiting user control over data representation and imposing storage and update burdens on providers.

While pregenerated map tiles make it possible to visualize data quickly, there are drawbacks. The most significant is the data provider chooses how the data will appear. The user has no power to adjust the visualization, such as modifying the color scale, color map or perform “band math” where multiple variables are combined to produce a new variable. Other drawbacks impact the data provider, such as storage costs and maintaining a pipeline to constantly update or reprocess the tile storage with new and updated data. Next generation approaches give that power to the user, while still giving providers control over the costs.

More recent years have seen the success of the dynamic tiling approach which allows for on-demand map tile creation. This approach has traditionally relied on Cloud-Optimized GeoTIFFs (COGs). When Zarr gained popularity for large-scale n-dimensional data analysis, users started to call for browser-based visualization, but no tools existed to visualize Zarr in the browser.

Now there are 2 options: a dynamic tile server and a dynamic client approach. rio_tiler’s XarrayReader supports tile rendering from anything that is xarray-readable. This means a tile server can render tiles from Zarr stores as well as netCDF4/HDF5 and other formats. However, a tile server still requires running a server while the second option, a “dynamic client”, reads Zarr directly in the browser client and uses WebGL to render map tiles.

The authors have contributed to libraries and testing of both approaches and authored a “Zarr Visualization Report”. This report includes the tradeoffs, requirements for preprocessing the data and performance testing results for when those preprocessing steps were taken or not. We hope that readers will be able to reuse lessons learned and recommendations to deliver their Zarr data to users in web browsers and contribute to the wider adoption of this format for large scale environmental data understanding.

Looking ahead, the focus is on making NASA datasets more accessible through these innovative approaches. The use of Kerchunk reference files, or virtual Zarr datasets, will play a key role in indexing various archival file formats used by NASA, such as HDF5 and NetCDF4. With the capability of titiler-xarray to handle any xarray-readable data, a wide range of NASA datasets can be visualized without the need for duplicating data. Additionally, the creation of data pyramids will further enhance visualization speed at lower resolutions.

How to cite: Barciauskas, A., Jones, M., Martin, K., Harkins, S., and Sarago, V.: Next-Gen Zarr Web Map Visualization, EGU General Assembly 2024, Vienna, Austria, 14–19 Apr 2024, EGU24-11805, https://doi.org/10.5194/egusphere-egu24-11805, 2024.

EGU24-14629 | ECS | Orals | ESSI4.4

Co-designing an interactive tool to communicate the uncertainty of urban air quality models: uncertAIR 

Cristina Carnerero, Jan Mateu Armengol, Alvaro Criado, Antonia Frangeskou, Diana Urquiza, Dragana Bojovic, and Albert Soret

According to the World Health Organization, air pollution is the main environmental threat to public health. Urban environments are particularly critical due to their high-density population centers with often poor air quality. To characterize the exposure of citizens, the use of numerical models corrected with observational data has become a fundamental tool. Despite recent efforts, bias-corrected air quality models at the street scale exhibit significant uncertainty, partly due to the limited number of traffic and air quality observations.

Model uncertainty can critically increase far from measurement points and in regions with characteristics different from those used for calibration. In such locations, modeled data should be interpreted with caution. When the street-scale air quality models are intended to inform policy makers, estimating uncertainty is highly valuable to support decision-making protocols. A simpler air quality model with an estimation of the spatial uncertainty distribution may be preferred over a very sophisticated model that does not give any notion of uncertainty.

Within this context, we aimed at co-designing and co-developing an interactive tool to report the uncertainty of urban air quality simulations, disseminating the results tailored to the users’ needs.

The methodology consists of a geostatistical post-processing of the raw simulations of NO2 concentrations of the CALIOPE-urban air quality model in the city of Barcelona. The methodology is replicable to other cities and pollutants. The uncertainty estimation is based on the error variance of the Universal Kriging technique, which can be subsequently used to produce hourly maps of the probability of exceeding a certain threshold. Additionally, relevant social-ecological-technological variables were identified to explore the interconnections among different types of data, as well as broadening the social impact of this project. For instance, locations associated with vulnerable citizens (e.g., schools and nursing homes), or other variables potentially linked with air quality (e.g., public parks and green spaces). 

A user-centric approach was adopted, involving policymakers from local administrations, urban planners from private companies, environmental social agents and scientific personnel from research institutions and universities. To get a deep understanding of how uncertainty maps can add value to users’ objectives, we conducted a series of individual interviews and a co-design workshop based on design thinking, which allowed for the co-design of the interactive platform. The prototype of the interactive platform was presented in a second workshop, where the users tested the prototype and provided input to further developing the final tool.

The final product is the uncertAIR platform, an open-source interactive tool that integrates modeled NO2 concentrations, their uncertainty and probability of exceedances of legal thresholds, together with  social-ecological-technological variables at different scales of time and spatial resolution. Data can be visualized and downloaded with a temporal resolution of annual or daily averages, and a spatial resolution of 20 m or aggregated at census areas. This integrated dataset serves as the foundational step to integrate uncertainty information on future air quality policy making in Barcelona, such as health impact assessments, official communications, campaign planning, and location optimization of new monitoring stations.

How to cite: Carnerero, C., Mateu Armengol, J., Criado, A., Frangeskou, A., Urquiza, D., Bojovic, D., and Soret, A.: Co-designing an interactive tool to communicate the uncertainty of urban air quality models: uncertAIR, EGU General Assembly 2024, Vienna, Austria, 14–19 Apr 2024, EGU24-14629, https://doi.org/10.5194/egusphere-egu24-14629, 2024.

EGU24-16316 | Posters on site | ESSI4.4

MicroWave Expertise center : a work environment for microwave data exploration 

Marie-Laure Frery, Mathilde Siméon, Roger Fjortoft, Sébastien Charlois, Mélanie Prugniaux, and Matthias Raynal

The MicroWave Expertise center has first been developed to provide a  work environment to support the calibration/validations activities and address the high resolution of Surface Water Ocean Topography (SWOT) mission, launched on December 16th, 2022.  Onboard, the new instrument ‘KaRIn’, is a revolution for both oceanography and hydrology communities and gives access to small scale measurements over ocean, worldwide river heights and flows, and lake heights.

With optimized storage and computation methods, the MicroWave Expertise Center is designed to ease the exploration and studies of 16TB/day products. The tools developed for SWOT are generic and can now be applied to any altimetric mission.

Experts are provided simple and scriptable explore numerous data providers such as copernicus dias, ecmwf, hydroweb.next.

Some tutorials are already available along with visualisation tools. And the list will be growing up in close future from users requirements.

The expertise center is operational and ensure SWOT calval activities. Prospects address SWOT ocean and hydrology studies but could be enlarged to  hydrological research, multi-sensor comparison

How to cite: Frery, M.-L., Siméon, M., Fjortoft, R., Charlois, S., Prugniaux, M., and Raynal, M.: MicroWave Expertise center : a work environment for microwave data exploration, EGU General Assembly 2024, Vienna, Austria, 14–19 Apr 2024, EGU24-16316, https://doi.org/10.5194/egusphere-egu24-16316, 2024.

EGU24-16475 | Orals | ESSI4.4

NASA's FIRMS: Enabling the Use of Earth System Science Data for Wildfire Management 

Otmar Olsina, Jennifer Hewson, Diane Davies, Asen Radov, Brad Quayle, Louis Giglio, and Joanne Hall

NASA’s Fire Information for Resource Management System (FIRMS) enables users to find and analyze a range of earth system science data and information relevant to the complex and evolving field of wildfire management, impacts, and mitigation. FIRMS facilitates the use of earth system science data to inform science-based decision making through a standardized, readily interpretable interface that supports operational users, researchers, and non-scientific stakeholders. This community-driven interface enables user-friendly exploration of data that are increasingly findable, accessible, interoperable, and reproducible (FAIR), and the interface is regularly refined to support the diversity, equity, and inclusion of potential end-users. FIRMS offers fire-based maps through Web Map Service (WMS) and Web Feature Service (WFS), and makes available multiple APIs to support area, country, fire footprint features for stakeholders needing to ingest data into software such as QGIS, ArcGIS, etc. FIRMS developers are also creating a Fire Data Academy to build capacity around the use of Jupyter notebooks, Google Colab, and Python to perform data ingest, manipulation, and visualization. As the impacts of wildfires expand, affecting increasing swaths of population and biodiversity through immediate infrastructure and habitat destruction, and causing longer-term air quality impacts, a transdisciplinary approach to research and response is required. FIRMS supports a transdisciplinary approach through the range of data and information available, ensuring that all users, including those in historically underrepresented communities, can access wildfire data.

How to cite: Olsina, O., Hewson, J., Davies, D., Radov, A., Quayle, B., Giglio, L., and Hall, J.: NASA's FIRMS: Enabling the Use of Earth System Science Data for Wildfire Management, EGU General Assembly 2024, Vienna, Austria, 14–19 Apr 2024, EGU24-16475, https://doi.org/10.5194/egusphere-egu24-16475, 2024.

EGU24-17568 | Posters on site | ESSI4.4

Community based services providing Open Science in water management worldwide 

Frida Gyllensvärd and Berit Arheimer

Water is the basis for life and ultimately the reason why our society could develop the way it did, and thus, water security is an indirect core component in all 17 UN sustainable development goals. However, scientific water data and information are rarely accessible in an easy and understandable way for managers and policy makers. Moreover, hydrological sciences are fragmented with less tradition of sharing results, data and tools between scientists than in many other disciplines. Numerous efforts from development projects have launched prototypes and demonstrators of web-based applications to overcome these issues, but without long-term maintenance most of them disappear at project end. Here we will present experience from developing, maintaining and using three non-commercial operational services to facilitate actions in water security and promote scientific engagement with stakeholders.


https://hypeweb.smhi.se/ provides readily available modelled hydrological data for continent or global scale at sub-catchment resolution of on average 1000 km2 (Arheimer et al., 2020), along with open source code with documentation and data compilation/visualization/training tools. The visitor can explore data for the past, present or future, download the numerical model, or order data subscriptions. The service also provides tutorials, model documentation and training material for model setup. The website is linked to an annual open (free) training course in HYPE modelling for various societal needs.


https://climateinformation.org/ is co-designed with sectorial users in low- and middle-income countries, on behalf of the World Meteorological Organisation (WMO) and the Green Climate Fund (GCF). It offers guidance for non-climate experts and access to two different tools to explore climate-change impact on water resources: 1) instant summary reports of climate change for any site on the globe, 2) easy access to many pre-calculated climate indicators. The main purpose of this new service is to provide scientific data to argue for climate mitigation and adaptation investments in vulnerable countries (Photiadou et al., 2021). Pre-calculated water variables are based on an extensive production chain using global model ensembles from global modelling communities, e.g. CMIP, Cordex, WWH and a rigorous quality assurance protocol.


https://dwg.smhi.se/dwg/ is co-designed with the community of the International Association of Hydrological Sciences (IAHS). It is a brand-new platform to search and find (based on key-words) where on Earth there are: scientific results available from research projects (case-studies), monitoring programs (data repositories), publications (in HSJ, PIAHS) and researchers (personal profiles). The aim is to stimulate and facilitate engagement, interactions and dialogues among scientists and between scientists and stakeholders. The Digital Water Globe offers co-creation and re-examines the role of scientific outreach; it is a scientific community effort completely dependent on content from the users to explore networking and science communication in action.


The presentation will focus on obtained feedback, opportunities and challenges in running operational services with aim to share scientific data and tools with a wide range of users.


Reference:

Arheimer et al., 2020: Global catchment modelling using World-Wide HYPE (WWH), open data and stepwise parameter estimation, HESS 24, 535–559, https://doi.org/10.5194/hess-24-535-2020   

Photiadou et al. 2021. Designing a climate service for planning climate actions in vulnerable countries. Atmosphere 12:121. https://doi.org/10.3390/atmos12010121 

How to cite: Gyllensvärd, F. and Arheimer, B.: Community based services providing Open Science in water management worldwide, EGU General Assembly 2024, Vienna, Austria, 14–19 Apr 2024, EGU24-17568, https://doi.org/10.5194/egusphere-egu24-17568, 2024.

EGU24-18613 | Orals | ESSI4.4

How to benefit from multi-sensor synergy using open Ocean Virtual Laboratory tools 

Lucile Gaultier, Fabrice Collard, Craig Donlon, Ziad El Khoury Hanna, Sylvain Herlédan, and Guillaume Le Seach

In the past decade, the emergence of new satellites and sensors has facilitated the observation of a diverse range of oceanic physical variables across various scales. For instance, the Sentinel 1-2-3-6 program encompasses sensors like SAR, Ocean Color, Temperature brightness, or altimeter, each with an individual long revisit time but a rapid revisit from a constellation perspective. Additionally, geostationary sensors such as SEVIRI contribute by providing Infra Red SST every hour, significantly enhancing coverage in cloudy areas. These variables contain crucial information about the ocean's state.

Despite the wealth of data, discovering, collocating, and analyzing a heterogeneous dataset can be challenging and act as a barrier for potential users wishing to leverage Earth Observation (EO) data. Accessing low-level data and preparing them for analysis requires a diverse set of skills. Addressing this challenge, the Ocean Virtual Laboratory Next Generation (OVL-NG) project has developed two tools, which will be introduced.

Firstly, online data visualization websites, such as https://ovl.oceandatalab.com, have been made publicly accessible. These platforms empower users to explore various satellite, in-situ, and model data with just a few clicks. Users can navigate through time and space, easily compare hundreds of products (some in Near Real-Time), and utilize drawing and annotation features. The OVL web portal also facilitates sharing interesting cases with fellow scientists and communicating about captivating oceanic structures.

Secondly, a complementary tool named SEAScope offers additional features for analyzing pre-processed data and user-generated data. SEAScope is a free and open-source standalone application compatible with Windows, Linux, and macOS. It allows users to collocate data in time and space, rendering them on a 3D globe. Users can adjust rendering settings on the fly, extract data over a specific area or transect, and interface with external applications like Jupyter notebooks. This functionality enables users to extract data on a shared grid, analyze them, and import the results back into SEAScope for visualization alongside the input data.

                                         The OVL-NG tools will be showcased at the OceanDataLab booth


How to cite: Gaultier, L., Collard, F., Donlon, C., El Khoury Hanna, Z., Herlédan, S., and Le Seach, G.: How to benefit from multi-sensor synergy using open Ocean Virtual Laboratory tools, EGU General Assembly 2024, Vienna, Austria, 14–19 Apr 2024, EGU24-18613, https://doi.org/10.5194/egusphere-egu24-18613, 2024.

EGU24-19105 | ECS | Posters on site | ESSI4.4

3D Digital Twins of the Ocean: towards an intuitive and realistic visualization of wave parameters 

Gerard Llorach-Tó, Enoc Martínez, Joaquín Del-Río, Gonzalo Simarro, Martino Pani, Andrea Bucchi, Ya Huang, and Emilio García-Ladona

Understanding and picturing the state of the sea surface according to wave parameters can be difficult for non-expert users. 3D digital twins of the ocean, i.e., realistic virtual copies of the sea state with live updates, can provide user-friendly visualizations. An animated visual representation offers users a more tangible reference to the actual sea state in the field than conventional swell and wind forecasts. Our work presents an interactive web-based open-source visualization of wave data in a 3D realistic environment. The wave data used is provided by a forecast model, CMEMS [1], and the in-situ observation platform OBSEA [2]. Both of these data products provide an open access API that can be accessed via the browser, following the FAIR principles. The challenge of this work is to translate the wave parameters of the data products into a real-time computer graphics simulation representing the real sea state. Different data products provide different parameters, for example, CMEMS forecast model computes wave significant height, wave period, and direction for ‘sea surface wave’, ‘wind wave’, ‘swell 1’, and ‘swell 2’, whereas OBSEA measures wave properties with an acoustic doppler wave array such as ‘Hm0’, ‘H1/10’, ‘H1/3’, and ‘directional spread’. We will discuss algorithms based on empirical observations to generate the virtual sea state from a selection of wave parameters. Subsequently both quantitative and qualitative metrics based on observations will be used to compare between the 3D digital twin and the real sea state. Preliminary results of the digital twin can be found at https://icatmar.github.io/CasablancaBuoy/ and https://cgi-dto.github.io/OBSEA/. 


[1] Korres, G., Oikonomou, C., Denaxa, D., & Sotiropoulou, M. (2023). Mediterranean Sea Waves Analysis and Forecast (Copernicus Marine Service MED-Waves, MEDWAΜ4 system) (Version 1) [Data set]. Copernicus Marine Service (CMS). DOI: 10.25423/CMCC/MEDSEA_ANALYSISFORECAST_WAV_006_017_MEDWAM4

[2] Del Rio, J. [et al.]. Obsea: a decadal balance for a cabled observatory deployment. "IEEE access", 13 Febrer 2020, vol. 8, p. 33163-33177.

How to cite: Llorach-Tó, G., Martínez, E., Del-Río, J., Simarro, G., Pani, M., Bucchi, A., Huang, Y., and García-Ladona, E.: 3D Digital Twins of the Ocean: towards an intuitive and realistic visualization of wave parameters, EGU General Assembly 2024, Vienna, Austria, 14–19 Apr 2024, EGU24-19105, https://doi.org/10.5194/egusphere-egu24-19105, 2024.

EGU24-21547 | ECS | Orals | ESSI4.4

Lexcube for Jupyter: Interactive Earth System Data Cube Visualization in Jupyter Notebooks 

Maximilian Söchting, Miguel D. Mahecha, David Montero Loaiza, and Gerik Scheuermann

Data streams representing the Earth system both through modeling and remote sensing approaches, encompass a diverse range and massive amount of information. Unveiling insights at global and local scales becomes increasingly challenging for the wider public and the broader scientific audience as the temporal and spatial resolutions of data sets continually improve. An effective solution to this involves the development of fully interactive visualizations capable of rendering terabytes of data in real-time, spanning time, space, variables, and model variants. Lexcube.org, the Leipzig Explorer of Earth Data Cubes, was the first tool that allowed to explore and interact with large Earth system data sets in the form of an interactive data cube visualization in the web browser, but was limited to a few preset data sets.

Here we present Lexcube for Jupyter, a Jupyter notebook extension building on top of the existing Lexcube.org software components, that allows to visualize any spatiotemporal or otherwise three-dimensional data as an interactive 3D data cube. The data cube visualization treats all three dimensions equally and, e.g., in the case of a spatiotemporal data cube, allows to inspect temporal patterns in a novel way. Interaction with the data cube is designed to be intuitive, also allowing touch gestures on touch-capable devices. Building on top of the powerful open-source libraries Xarray and Numpy, Lexcube for Juypter integrates effortlessly into the existing ecosystem of open-source data cube software components as it is able to visualize any gridded data set from those libraries, including remotely stored and chunked data sets. Furthermore, Lexcube for Jupyter allows to export the currently visible data cube as a new Xarray or Numpy object, allowing scientists to use Lexcube in their workflow for data selection and curation. In addition, new disciplines such as the atmospheric sciences may profit from Lexcube for Juypter as they can now visualize their own three-dimensional data that is not necessarily spatiotemporal, e.g., three-dimensional atmospheric humidity data cubes (latitude×longitude×pressure level) as seen on lexcube.org. Lexcube for Jupyter is open-source and available on GitHub and PyPi since January 2024.

How to cite: Söchting, M., Mahecha, M. D., Montero Loaiza, D., and Scheuermann, G.: Lexcube for Jupyter: Interactive Earth System Data Cube Visualization in Jupyter Notebooks, EGU General Assembly 2024, Vienna, Austria, 14–19 Apr 2024, EGU24-21547, https://doi.org/10.5194/egusphere-egu24-21547, 2024.

EGU24-22039 | Orals | ESSI4.4

The East Africa Hazards Watch - Meeting the growing need of risk Information due to increasing climate extremes 

Erick Otenyo, Abubakr Salih Babiker, Marta Baraibar, and Viola Otieno

The East Africa Hazards Watch is an online web platform that supports tracking extreme events such as drought, cyclones, pests (desert locust), heavy rainfall, floods or crop failures, which are increasing in frequency and intensity due to climate change in East Africa.

About 90% of the disasters in East Africa are due to weather, climate hazards, leaving the region to be one of the most vulnerable to extreme events. Considering the high dependency of the economic systems in the region on natural resources, the impacts of weather and climate extremes have far-reaching socioeconomic consequences. To protect the population against these hazards and to support the resilience of the local communities, there is a dire need for efficient early warning systems and actionable information for decision making. The East Africa Hazards Watch was developed to fill this gap.

The system aggregates risk information from different specialized systems and presents them in one platform. The main goal of the new system is to collect, store, and analyze risk data from different sources and present it in a color-coded system indicating a different level of alert and urgency.  This public regional multi-hazards watch system aims at providing decision ready information, to support transnational coordination and early action across borders. 

Forecasting and Monitoring Components

  • Weather Forecast data - Presents weather forecasts of total rainfall, heavy precipitation and temperatures in weekly, monthly and seasonal timescales, generated at ICPAC.
  • Drought Monitoring - The East Africa Drought Watch is a near-real time system that uses Earth Observation and Weather information to monitor drought conditions in the East Africa region. It contains drought-relevant information such as maps of indicators derived from different data sources (e.g., precipitation measurements, satellite measurements, modeled soil moisture content)
  • Agriculture and Rangelands Monitoring - Every 10 days, the system generates automatic warnings about low or delayed vegetation performance at province level plus weather and Earth Observation vegetation indicators
  • Food Security Monitoring - ICPAC produces a monthly bulletin on the state of food security in the region using Integrated Phase Classification (IPC). This information is presented in a color-coded system that reflects the state of acuteness in each impacted area in the region
  • Climate Change - Presents temperature variation during the past years for the region, showing the warmest years in the record and how the trend is doing in the past years. Also includes climate change projections until 2100
  • Time Series Analysis - The system allows users to click at any point on the map and get time series analysis charts that show the trend for the past time periods for the different enabled layers.
  • Impact and Vulnerability analysis - For some layers like heavy rainfall forecasts and Drought indicators, the application provides information about the population that might be affected by the hazard for any selected location. 

The system also allows to overlay hazard layers with other socio-economic and infrastructure data. This enables identification of infrastructure like schools and health facilities that are at risk of being affected by an impending hazard.


How to cite: Otenyo, E., Babiker, A. S., Baraibar, M., and Otieno, V.: The East Africa Hazards Watch - Meeting the growing need of risk Information due to increasing climate extremes, EGU General Assembly 2024, Vienna, Austria, 14–19 Apr 2024, EGU24-22039, https://doi.org/10.5194/egusphere-egu24-22039, 2024.

EGU24-22080 | ECS | Orals | ESSI4.4

Showcasing Advances in Climate Prediction and Early Warning Systems in the Greater Horn of Africa 

Titike Bahaga, Zewdu Segele, Hussen Endris, Anthony Mwanthi, Masilin Gudoshava, and Eunice Koech

The Greater Horn of Africa (GHA) region is most vulnerable to climate-related risks. The effects of climate change have become increasingly evident in the region through a rise in the frequency and intensity of extreme weather and climate events, notably recurrent and severe droughts, floods, landslides, and tropical cyclones. These extreme climatic events have had far-reaching consequences on the key socio-economic sectors. The extended drought experienced in 2020/2022 led to the loss of millions of livestock and plunged millions of individuals into poverty, prompting forced displacement and insecurity. In contrast, the strong El Niño and positive Indian Ocean Dipole (IOD) events in 2023/2024 brought substantial rainfall to Somalia, Ethiopia, and Kenya in October and November 2023, resulting in flooding that has caused the loss of over 100 lives and displaced more than 700,000 people. Thus, providing reliable and timely climate information is essential for climate services and is increasingly crucial in supporting decision-making processes across a range of climate-sensitive sectors and reducing extreme climate impact. 

The IGAD Climate Prediction and Applications Centre (ICPAC), as a World Meteorological Organization (WMO) Regional Climate Centre (RCC), currently performs the mandatory and recommended RCC functions covering the domains of climate monitoring, climate forecasting, capacity development, and generation of regional and sub-regional tailored products relevant to the various socio-economic sectors. ICPAC has developed improved and tailored climate products and innovative decision support tools to enhance early warning services. It is also one of the first RCCs to adopt the objective forecasting technique and produce a traceable, reproducible, and verifiable forecast based on WMO’s recommendation. Innovative approaches to user engagement through co-production, communication channels, user-friendly interfaces, and dissemination of climate information have also been developed. 

In this session, we would like to showcase the innovative early warning methods, products, services, and platforms developed by ICPAC for response planning and anticipatory actions to enhance community resilience in the GHA region. This includes improved objective forecasting methods for monthly and seasonal forecast products, innovative approaches to user engagement through co-production, communication channels, and sector-tailored products (onset, cessation, dry and wet spells, probability of exceedance). 

How to cite: Bahaga, T., Segele, Z., Endris, H., Mwanthi, A., Gudoshava, M., and Koech, E.: Showcasing Advances in Climate Prediction and Early Warning Systems in the Greater Horn of Africa, EGU General Assembly 2024, Vienna, Austria, 14–19 Apr 2024, EGU24-22080, https://doi.org/10.5194/egusphere-egu24-22080, 2024.

EGU24-1857 | Orals | ESSI2.9

A Replicable Multi-Cloud Automation Architecture for Earth Observation 

Armagan Karatosun, Claudio Pisa, Tolga Kaprol, Vasileios Baousis, and Mohanad Albughdadi

The EO4EU project aims at making the access and use of Earth Observation (EO) data easier for environmental, government and business forecasts and operations.

To reach this goal, the EO4EU Platform will soon be made officially available, leveraging existing EO data sources such as DestinE, GEOSS, INSPIRE, Copernicus and Galileo, and offering advanced tools and services, based also on machine learning techniques, to help users find, access and handle the data they are interested in. The EO4EU Platform relies on a combination of a multi-cloud computing infrastructure coupled with pre-exascale high-performance computing facilities to manage demanding processing workloads.

The EO4EU multi-cloud infrastructure is composed by IaaS resources hosted on the WEkEO and CINECA Ada clouds, leveraged by a set of Kubernetes clusters dedicated to different workloads (e.g. cluster management tools, observability, or specific applications such as an inference server). To automate the deployment and management of these clusters, with advantages in terms of minimisation of dedicated effort and human errors, we have devised an Infrastructure-as-Code (IaC) architecture based on the Terraform, Rancher and Ansible technologies.

We believe that the proposed IaC architecture, based on open-source components and extensively documented and tested on the field, can be successfully replicated by other EO initiatives leveraging cloud infrastructures.

How to cite: Karatosun, A., Pisa, C., Kaprol, T., Baousis, V., and Albughdadi, M.: A Replicable Multi-Cloud Automation Architecture for Earth Observation, EGU General Assembly 2024, Vienna, Austria, 14–19 Apr 2024, EGU24-1857, https://doi.org/10.5194/egusphere-egu24-1857, 2024.

EGU24-6216 | Posters on site | ESSI2.9

Pangeo environment in Galaxy Earth System supported by Fair-Ease 

Thierry Carval, Marie Jossé, and Jérôme Detoc

The Earth System is a complex and dynamic system that encompasses the interactions between the atmosphere, oceans, land, and biosphere. Understanding and analyzing data from the Earth System Model (ESM) is essential, for example to predict and mitigate the impacts of climate change.

Today, collaborative efforts among scientists across diverse fields are increasingly urgent. The FAIR-EASE project aims to build an interdomain digital architecture for integrated and collaborative use of environmental data. Galaxy is a main component of this architecture which will be used by several domains of study chose by FAIR-EASE.

Galaxy, an open-source web platform, provides users with an easy and FAIR tool to access and handle multidisciplinary environmental data. By design, Galaxy manages data analyses by sharing and publishing all involved items like inputs, results, workflows, and visualisations, ensuring reproducibility by capturing the necessary information to repeat and understand data analyses.

From this point on, a Pangeo environment is a tool more than relevant to be used alongside earth-system related data and processing tools in order to create cross domain analyses. The good news is that a Pangeo environment is accessible on Galaxy. It can be exploited as a jupyterlab and allows the user to manage their NetCDF data in a Pangeo environment with the use of notebooks. Multiple tutorials are available on the Galaxy Training Network to learn how to use Pangeo.

The Galaxy Training Network significantly contributes to enhancing the accessibility and reusability of tools and workflows. The Galaxy Training platform hosts an extensive collection of tutorials. These tutorials serve as valuable resources for individuals seeking to learn how to navigate Galaxy, employ specific functionalities like Interactive Tools or how to execute workflows for specific analyses.

In synthetisis, Pangeo in Galaxy provide Pangeo users with an up-to-date data analysis platform ensuring reproducibility and mixing trainings and tools.

On the Earth System side, a first step was the creation of a Galaxy declination for Earth System studies (earth-system.usegalaxy.eu) with dedicated data, models, processing, visualisations and tutorials. It will make Earth System modeling more accessible to researchers in different fields.

In this Galaxy subdomain we choose to have the Pangeo tools. Our hope is to be able to implement cross domain workflows including climate and earth system sciences.

During this session our aim is to present how you can use the Pangeo environment from the Galaxy Earth System.

How to cite: Carval, T., Jossé, M., and Detoc, J.: Pangeo environment in Galaxy Earth System supported by Fair-Ease, EGU General Assembly 2024, Vienna, Austria, 14–19 Apr 2024, EGU24-6216, https://doi.org/10.5194/egusphere-egu24-6216, 2024.

EGU24-7765 | Orals | ESSI2.9

Unleashing the power of Dask with a high-throughput Trust Region Reflectance solver for raster datacubes 

Bernhard Raml, Raphael Quast, Martin Schobben, Christoph Reimer, and Wolfgang Wagner

In remote sensing applications, the ability to efficiently fit models to vast amounts of observational data is vital for deriving high-quality data products, as well as accelerating research and development. Addressing this challenge, we developed a high-performance non-linear Trust Region Reflectance solver specialised for datacubes, by integrating Python's interoperability with C++ and Dask's distributed computing capabilities. Our solution achieves high throughput both locally and potentially on any Dask-compatible backend, such as EODC's Dask Gateway. The Dask framework takes care of chunking the datacube, and streaming each chunk efficiently to available workers where our specialised solver is applied. Introducing Dask for distributed computing enables our algorithm to run on different compatible backends. This approach not only broadens operational flexibility, but also allows us to focus on enhancing the algorithm's efficiency, free from concerns about concurrency. This enabled us to implement a highly efficient solver in C++, which is optimised to run on a single core, but still utilise all available resources effectively. For the heavy lifting, such as performing singular value decompositions and matrix operations we rely on Eigen, a powerful open-source C++ library specialized on linear algebra. To describe the spatial reference and other auxiliary data associated with our datacube, we employ the Xarray framework. Importantly, Xarray integrates seamlessly with Dask. Finally, to ensure robustness and extensibility of our framework, we applied state-of-the-art software engineering practices, including Continuous Integration and Test-Driven Development. In our work we demonstrate the significant performance gains achievable by effectively utilising available open-source frameworks, and adhering to best engineering practices. This is exemplified by our practical workflow demonstration to fit a soil moisture estimation model. 

How to cite: Raml, B., Quast, R., Schobben, M., Reimer, C., and Wagner, W.: Unleashing the power of Dask with a high-throughput Trust Region Reflectance solver for raster datacubes, EGU General Assembly 2024, Vienna, Austria, 14–19 Apr 2024, EGU24-7765, https://doi.org/10.5194/egusphere-egu24-7765, 2024.

The Earth System Grid Federation (ESGF) data nodes are usually the first address for accessing climate model datasets from WCRP-CMIP activities. It is currently hosting different datasets in several projects, e.g., CMIP6, CORDEX, Input4MIPs or Obs4MIPs. Datasets are usually hosted on different data nodes all over the world while data access is managed by any of the ESGF web portals through a web-based GUI or the ESGF Search RESTful API. The ESGF data nodes provide different access methods, e.g., https, OPeNDAP or Globus. 

Beyond ESGF, there has been the Pangeo / ESGF Cloud Data Working Group that coordinates efforts related to storing and cataloging CMIP data in the cloud, e.g., in the Google cloud and in the Amazon Web Services Simple Storage Service (S3) where a large part of the WCRP-CMIP6 ensemble of global climate simulations is now available in analysis-ready cloud-optimized (ARCO) zarr format. The availibility in the cloud has significantly lowered the barrier for users with limited resources and no access to an HPC environment to work with CMIP6 datasets and at the same time increases the chance for reproducibility and reusability of scientific results. 

Following the Pangeo strategy, we have adapted parts of the Pangeo Forge software stack for publishing our regional climate model datasets from the EURO-CORDEX initiative on AWS S3 cloud storage. The main tools involved are Xarray, Dask, Zarr, Intake and the ETL tools of pangeo-forge-recipes. Thanks to similar meta data conventions in comparison to the global CMIP6 datasets, the workflows require only minor adaptations. In this talk, we will show the strategy and workflow implemented and orchestrated in GitHub Actions workflows as well as a demonstration of how to access EURO-CORDEX datasets in the cloud.

How to cite: Buntemeyer, L.: Beyond ESGF – Bringing regional climate model datasets to the cloud on AWS S3 using the Pangeo Forge ETL framework, EGU General Assembly 2024, Vienna, Austria, 14–19 Apr 2024, EGU24-8058, https://doi.org/10.5194/egusphere-egu24-8058, 2024.

EGU24-8343 | ECS | Posters on site | ESSI2.9 | Highlight

Implementation of a reproducible pipeline for producing seasonal Arctic sea ice forecasts 

Vanessa Stöckl, Björn Grüning, Anne Fouilloux, Jean Iaquinta, and Alejandro Coca-Castro

This work highlights the integration of IceNet (https://doi.org/10.1038/s41467-021-25257-4), a cutting-edge sea ice forecasting system leveraging numerous Python packages from the Pangeo ecosystem, into the Galaxy platform—an open-source tool designed for FAIR (Findable, Accessible, Interoperable, and Reusable) data analysis. Aligned with the Pangeo ecosystem's broader objectives, and carried out in the frame of the EuroScienceGateway project (https://eurosciencegateway.eu), this initiative embraces a collaborative approach to tackle significant geoscience data challenges. The primary aim is to democratise access to IceNet's capabilities by converting a Jupyter Notebook, published in the Environmental Data Science book (www.edsbook.org), into Galaxy Tools and crafting a reusable workflow executable through a Graphical User Interface or standardised APIs. IceNet is meant to predict Arctic sea ice concentration up to six months in advance, and it outperforms previous systems. This integration establishes a fully reproducible workflow, enabling scientists with diverse computational expertise to automate sea ice predictions. The IceNet workflow is hosted on the European Galaxy Server (https://climate.usegalaxy.eu), along with the related tools, ensuring accessibility for a wide community of researchers. With the urgency of accurate predictions amid global warming's impact on Arctic sea ice, this work addresses challenges faced by scientists, particularly those with limited programming experience. The transparent, accessible, and reproducible pipeline for Arctic sea ice forecasting aligns with Open and Science principles. The integrated IceNet into Galaxy enhances accessibility to advanced climate science tools, allowing for automated predictions that contribute to early and precise identification of potential damages from sea ice loss. This initiative mirrors the overarching goals of the Pangeo community, advancing transparent, accessible, and reproducible research. The Galaxy-based pipeline presented serves as a testament to collaborative efforts within the Pangeo community, breaking down barriers related to computational literacy and empowering a diverse range of scientists to contribute to climate science research. The integration of IceNet into Galaxy not only provides a valuable tool for seasonal sea ice predictions but also exemplifies the potential for broad interdisciplinary collaboration within the Pangeo ecosystem.

How to cite: Stöckl, V., Grüning, B., Fouilloux, A., Iaquinta, J., and Coca-Castro, A.: Implementation of a reproducible pipeline for producing seasonal Arctic sea ice forecasts, EGU General Assembly 2024, Vienna, Austria, 14–19 Apr 2024, EGU24-8343, https://doi.org/10.5194/egusphere-egu24-8343, 2024.

EGU24-9156 | ECS | Orals | ESSI2.9

DataLabs: development of a cloud collaborative platform for open interdisciplinary geo-environmental sciences  

Michael Tso, Michael Hollaway, Faiza Samreen, Iain Walmsley, Matthew Fry, John Watkins, and Gordon Blair

In environmental science, scientists and practitioners are increasingly facing the need to create data-driven solutions to the environment's grand challenges, often needing to use data from disparate sources and advanced analytical methods, as well as drawing expertise from collaborative and cross-disciplinary teams [1]. Virtual labs allow scientists to collaboratively explore large or heterogeneous datasets, develop and share methods, and communicate their results to stakeholders and decision-makers. 

DataLabs [2] has been developed as a cloud-based collaborative platform to tackle these challenges and promote open, collaborative, interdisciplinary geo-environmental sciences. It allows users to share notebooks (e.g. JupyterLab, R Studio, and most recently VS Code), datasets and computational environments and promote transparency and end-to-end reasoning of model uncertainty. It supports FAIR access to data and digital assets by providing shared data stores and discovery functionality of datasets and assets hosted on the platform’s asset catalogue. Its tailorable design allows it to be adaptable to different challenges and applications. It is also an excellent platform for large collaborative teams to work on outputs together [3] as well as communicating results to stakeholders by allowing easy prototyping and publishing of web applications (e.g. Shiny, Panel, Voila). It is currently deployed on JASMIN [4] and is part of the UK NERC Environmental data service [5]. 

There are a growing number of use cases and requirements for DataLabs and it is going to play a central part in several planned digital research infrastructure (DRI) initiatives. Future development needs of the platform to further its vision include e.g. more intuitive onboarding experience, easier access to key datasets at source, better connectivity to other cloud platforms, and better use of workflow tools. DataLabs shares many of the features (e.g. heavy use of PANGEO core packages) and design principles of PANGEO. We would be interested in exploring commonalities and differences, sharing best practices, and growing the community of practice in this increasingly important area. 

[1]  Blair, G.S., Henrys, P., Leeson, A., Watkins, J., Eastoe, E., Jarvis, S., Young, P.J., 2019. Data Science of the Natural Environment: A Research Roadmap. Front. Environ. Sci. 7. https://doi.org/10.3389/fenvs.2019.00121  

[2] Hollaway, M.J., Dean, G., Blair, G.S., Brown, M., Henrys, P.A., Watkins, J., 2020. Tackling the Challenges of 21st-Century Open Science and Beyond: A Data Science Lab Approach. Patterns 1, 100103. https://doi.org/10.1016/j.patter.2020.100103 

[3] https://eds.ukri.org/news/impacts/datalabs-streamlines-workflow-assessing-state-nature-uk  

[4] https://jasmin.ac.uk/  

[5] https://eds.ukri.org/news/impacts/datalabs-digital-collaborative-platform-tackling-environmental-science-challenges  

How to cite: Tso, M., Hollaway, M., Samreen, F., Walmsley, I., Fry, M., Watkins, J., and Blair, G.: DataLabs: development of a cloud collaborative platform for open interdisciplinary geo-environmental sciences , EGU General Assembly 2024, Vienna, Austria, 14–19 Apr 2024, EGU24-9156, https://doi.org/10.5194/egusphere-egu24-9156, 2024.

EGU24-9781 | Posters on site | ESSI2.9

Optimizing NetCDF performance for cloud computing : exploring a new chunking strategy 

Flavien Gouillon, Cédric Pénard, Xavier Delaunay, and Florian Wery

Owing to the increasing number of satellites and advancements in sensor resolutions, the volume of scientific data is experiencing rapid growth. NetCDF (Network Common Data Form) stands as the community standard for storing such data, necessitating the development of efficient solutions for file storage and manipulation in this format.

Object storage, emerging with cloud infrastructures, offers potential solutions for data storage and parallel access challenges. However, NetCDF may not fully harness this technology without appropriate adjustments and fine-tuning. To optimize computing and storage resource utilization, evaluating NetCDF performance on cloud infrastructures is essential. Additionally, exploring how cloud-developed software solutions contribute to enhanced overall performance for scientific data is crucial.

Offering multiple file versions with data split into chunks tailored for each use case incurs significant storage costs. Thus, we investigate methods to read portions of compressed chunks, creating virtual sub-chunks that can be read independently. A novel approach involves indexing data within NetCDF chunks compressed with deflate, enabling extraction of smaller data portions without reading the entire chunk.

This feature is very valuable in use cases such as pixel drilling or extracting small amounts of data from large files with sizable chunks. It also saves reading time, particularly in scenarios of poor network connection, such as those encountered onboard research vessels.

We conduct performance assessments of various libraries in various use cases to provide recommendations for the most suitable and efficient library for reading NetCDF data in different situations.

Our tests involved accessing remote NetCDF datasets (two files from the SWOT mission) available on the network via a lighttpd server and an s3 server. Additionally, simulations of degraded Internet connections, featuring high latency, packet loss, and limited bandwidth, are also performed.

We evaluate the performance of four Python libraries (netcdf4 lib, Xarray, h5py, and our chunk indexing library) for reading dataset portions through fsspec or fs_s3. A comparison of reading performance using netCDF, zarr, and nczarr data formats is also conducted on an s3 server.

Preliminary findings indicate that the h5py library is the most efficient, while Xarray exhibits poor performance in reading NetCDF files. Furthermore, the NetCDF format demonstrates reasonably good performance on an s3 server, albeit lower than zarr or nczarr formats. However, the considerable efforts required to convert petabytes of archived NetCDF files and adapt numerous software libraries for a performance improvement within the same order of magnitude can raise questions about the practicality of such endeavors and benefits is thus extremely related to the use cases.

How to cite: Gouillon, F., Pénard, C., Delaunay, X., and Wery, F.: Optimizing NetCDF performance for cloud computing : exploring a new chunking strategy, EGU General Assembly 2024, Vienna, Austria, 14–19 Apr 2024, EGU24-9781, https://doi.org/10.5194/egusphere-egu24-9781, 2024.

EGU24-9795 | ECS | Orals | ESSI2.9

Unifying HPC and Cloud Systems; A Containerized Approach for the Integrated Forecast System (IFS) 

Cathal O'Brien, Armagan Karatosun, Adrian Hill, Paul Cresswell, Michael Sleigh, and Ioan Hadade

The IFS (Integrated Forecast System) is a global numerical weather prediction system maintained by the European Centre for Medium-Range Weather Forecasts (ECMWF). Traditionally, ECMWF’s high-performance computing facility (HPCF) is responsible for operationally supporting the IFS cycles. However, with the emergence of new cloud technologies, initiatives such as Destination Earth (DestinE), and growth of OpenIFS users within Europe and around the globe, the need to run IFS outside of ECMWF's computing facilities becomes more evident. Concerning such use cases, IFSTestsuite allows for the complete IFS system and its dependencies (e.g. ecCodes) to be built and tested outside of ECMWF's HPCF and designed to be self-contained, eliminating the need for external tools like MARS or ecCodes. Despite the need for users to perform multiple steps and the dependency of the software availability and versions on the host operating system, this indicates that there might be a potential for more generic and broader approach. 

Containerization might provide the much-needed portability and disposable environments to trigger new cycles with the desired compiler versions, or even with different compilers. In addition, pre-built container images can be executed on any platform, provided there is a compatible container runtime installed on the target system that adheres to Open Container Initiative (OCI) standards like Singularity or Docker. Another benefit of using container images is container image layers which can significantly reduce the image build time. Lastly, despite their differences, both Singularity and Docker adhere to the OCI standards, and converting one container image to another is straightforward. However, despite the clear advantages, there are several crucial design choices to keep in mind. Notably, the available hardware and software stacks varies greatly across different HPC systems. When performance is important, this heterogeneous landscape limits the portability of containers. The libraries and drivers inside the container must be specially selected with regard to the hardware and software stack of a specific host system to maximize performance on that system. If this is done correctly, the performance of containerized HPC applications can match native applications. We demonstrate this process with the use of a hybrid containerization strategy where compatible MPI stacks and drivers are built inside the containers. The binding of host libraries into containers is also used on systems where proprietary software cannot be rebuilt inside the container.  

In this study we present a containerized solution which balances portability and efficient performance, with examples of containerizing the IFS on a variety of systems including cloud systems with generic x86-64 architecture, such as European Weather Cloud (EWC) and Microsoft Azure, on EuroHPC systems such as Leonardo and LUMI and provided container image recipes for OpenIFS. 

How to cite: O'Brien, C., Karatosun, A., Hill, A., Cresswell, P., Sleigh, M., and Hadade, I.: Unifying HPC and Cloud Systems; A Containerized Approach for the Integrated Forecast System (IFS), EGU General Assembly 2024, Vienna, Austria, 14–19 Apr 2024, EGU24-9795, https://doi.org/10.5194/egusphere-egu24-9795, 2024.

EGU24-10741 | Posters on site | ESSI2.9

Harnessing the Pangeo ecosystem for delivering the cloud-based Global Fish Tracking System 

Daniel Wiesmann, Tina Odaka, Anne Fouilloux, Emmanuelle Autret, Mathieu Woillez, and Benjamin Ragan-Kelley

We present our approach of leveraging the Pangeo software stack for developing the Global Fish Tracking System (GFTS). The GFTS project tackles the challenge of accurately modelling fish movement in the ocean based on biologging data with a primary focus on Sea Bass. Modelling fish movements is essential to better understand migration strategies and site fidelity, which are critical aspects for fish stock management policy and marine life conservation efforts.

Estimating fish movements is a highly compute intensive process. It involves matching pressure and temperature data from in-situ biologging sensors with high resolution ocean temperature simulations over long time periods. The Pangeo software stack provides an ideal environment for this kind of modelling. While the primary target platform of the GFTS project is the new Destination Earth Service Platform (DESP), relying on the Pangeo ecosystem ensures that the GFTS project is a robust and portable solution that can be re-deployed on different infrastructure. 

One of the distinctive features of the GFTS project is its advanced data management approach, synergizing with the capabilities of Pangeo. Diverse datasets, including climate change adaptation digital twin data, sea temperature observations, bathymetry, and biologging in-situ data from tagged fish, are seamlessly integrated within the Pangeo environment. A dedicated software called pangeo-fish has been developed to streamline this complex modelling process. The technical framework of the GFTS project includes Pangeo core packages such as Xarray and Dask, which facilitate scalable computations.

Pangeo's added value in data management becomes apparent in its capability to optimise data access and enhance performance. The concept of "data visitation" is central to this approach. By strategically deploying Dask clusters close to the data sources, the GFTS project aims to significantly improve performance of fish track modelling when compared to traditional approaches. This optimised data access ensures that end-users can efficiently interact with large datasets, leading to more streamlined and efficient analyses.

The cloud-based delivery of the GFTS project aligns with the overarching goal of Pangeo. In addition, the GFTS includes the development of a custom interactive Decision Support Tool (DST). The DST empowers non-technical users with an intuitive interface for better understanding the results of the GFTS project, leading to more informed decision-making. The integration with Pangeo and providing intuitive access to the GFTS data is not merely a technicality; it is a commitment to FAIR (Findable, Accessible, Interoperable and Reusable), TRUST (Transparency, Responsibility, User focus, Sustainability and Technology) and open science principles. 

In short, the GFTS project, within the Pangeo ecosystem, exemplifies how advanced data management, coupled with the optimization of data access through "data visitation," can significantly enhance the performance and usability of geoscience tools. This collaborative and innovative approach not only benefits the immediate goals of the GFTS project but contributes to the evolving landscape of community-driven geoscience initiatives.

How to cite: Wiesmann, D., Odaka, T., Fouilloux, A., Autret, E., Woillez, M., and Ragan-Kelley, B.: Harnessing the Pangeo ecosystem for delivering the cloud-based Global Fish Tracking System, EGU General Assembly 2024, Vienna, Austria, 14–19 Apr 2024, EGU24-10741, https://doi.org/10.5194/egusphere-egu24-10741, 2024.

EGU24-12410 | Orals | ESSI2.9

Towards Enhancing WaaS and Data Provenance over Reana 

Iraklis Klampanos, Antonis Ganios, and Antonis Troumpoukis

Interoperability and reproducibility are critical aspects of scientific computation. The data analysis platform Reana [1], developed by CERN, enhances the interoperability and reproducibility of scientific analyses by allowing researchers to describe, execute, and share their analyses. This is achieved via the execution of standardised scientific workflows, such as CWL, within reusable containers. Moreover, it allows execution to span different types of resources, such as Cloud and HPC. 

In this session we will present ongoing work to enhance Reana’s Workflows-as-a-Service (WaaS) functionality and also support Workflow registration and discoverability. Building upon the design goals and principles of the DARE platform [2], this work aims to enhance Reana by enabling users to register and discover available workflows within the system. In addition, we will present the integration of Data Provenance based on the W3C PROV-O standard [3] allowing the tracking and recording of data lineage in a systematic and dependable way across resource types. 

In summary, key aspects of this ongoing work include:

  • Workflows-as-a-Service (WaaS): Extending Reana's service-oriented mode of operation, allowing users to register, discover, access, execute, and manage workflows by name or ID, via APIs, therefore enhancing the platform's accessibility and usability.
  • Data Provenance based on W3C PROV-O: Implementing support for recording and visualising data lineage information in compliance with the W3C PROV-O standard. This ensures transparency and traceability of data processing steps, aiding in reproducibility and understanding of scientific analyses.

This work aims to broaden Reana's functionality, aligning with best practices for reproducible and transparent scientific research. We aim to make use of the enhanced Reana-based system on the European AI-on-demand platform [4], currently under development, to address the requirements of AI innovators and researchers when studying and executing large-scale AI-infused workflows.

References: 

[1] Simko et al., (2019). Reana: A system for reusable research data analyses. EPJ Web Conf., 214:06034, https://doi.org/10.1051/epjconf/201921406034

[2] Klampanos et al., (2020). DARE Platform: a Developer-Friendly and Self-Optimising Workflows-as-a-Service Framework for e-Science on the Cloud. Journal of Open Source Software, 5(54), 2664, https://doi.org/10.21105/joss.02664

[3] PROV-O: The PROV Ontology: https://www.w3.org/TR/prov-o/ (viewed 9 Jan 2024)

[4] The European AI-on-Demand platform: https://aiod.eu (viewed 9 Jan 2024)

This work has been has received funding from the European Union’s Horizon Europe research and innovation programme under Grant Agreement No 101070000.

How to cite: Klampanos, I., Ganios, A., and Troumpoukis, A.: Towards Enhancing WaaS and Data Provenance over Reana, EGU General Assembly 2024, Vienna, Austria, 14–19 Apr 2024, EGU24-12410, https://doi.org/10.5194/egusphere-egu24-12410, 2024.

EGU24-12669 | ECS | Orals | ESSI2.9

DeployAI to Deliver Interoperability of Cloud and HPC Resources for Earth Observation in the Context of the European AI-on-Demand Platform 

Antonis Troumpoukis, Iraklis Klampanos, and Vangelis Karkaletsis

The European AI-on-Demand Platform (AIoD, http://aiod.eu) is a vital resource for leveraging and boosting the European AI research landscape towards economic growth and societal advancement across Europe. Following and emphasising European values, such as openness, transparency, and trustworthiness for developing and using AI technologies, the AIoD platform aims to become the main one-stop shop for exchanging and building AI resources and applications within the European AI innovation ecosystem, whilst also adhering to European values. The primary goal of the DIGITAL-EUROPE CSA initiative DeployAI (DIGITAL-2022-CLOUD-AI-B-03, 01/2024-12/2027) is to build, deploy, and launch a fully operational AIoD platform, promoting trustworthy, ethical, and transparent European AI solutions for the industry, with a focus on SMEs and the public sector.

Building on Open-source and trusted software, DeployAI will provide a number of technological assets such as a comprehensive and Trustworthy AI resource catalogue and marketplace offering responsible AI resources and tools, workflow composition and execution systems for prototyping and user-friendly creation of novel services, responsible foundational models and services to foster dependable innovation, etc. In addition, and building upon the results of the ICT-49 AI4Copernicus project [1], which provided a bridge between the AIoD platform and the Copernicus ecosystem and the DIAS platforms, DeployAI will integrate impactful Earth Observation AI services into the AIoD platform. These will include (but not limited to) satellite imagery preprocessing, land usage classification, crop type identification, super-resolution, and weather forecasting.

Furthermore, DeployAI will allow the rapid prototyping of AI applications and their deployment to a variety of Cloud/Edge/HPC infrastructures. The project will focus on establishing a cohesive interaction framework that integrates with European Data Spaces and Gaia-X initiatives, HPC systems with an emphasis on the EuroHPC context, and the European Open Science Cloud. Interfaces to European initiatives and industrial AI-capable cloud platforms will be further implemented to enable interoperability. This capability enables the execution of Earth Observation applications not only within the context of a DIAS/DAS but also within several other compute systems. This level of interoperability enhances the adaptability and accessibility of AI applications, fostering a collaborative environment where geoscientific workflows can be seamlessly executed across diverse computational infrastructures and made available to a wide audience of innovators.

[1] A. Troumpoukis et al., "Bridging the European Earth-Observation and AI Communities for Data-Intensive Innovation", 2023 IEEE Ninth International Conference on Big Data Computing Service and Applications (BigDataService), Athens, Greece, 2023, pp. 9-16, doi:10.1109/BigDataService58306.2023.00008.

This work has been has received funding from the European Union’s Digital Europe Programme (DIGITAL) under grant agreement No 101146490.

How to cite: Troumpoukis, A., Klampanos, I., and Karkaletsis, V.: DeployAI to Deliver Interoperability of Cloud and HPC Resources for Earth Observation in the Context of the European AI-on-Demand Platform, EGU General Assembly 2024, Vienna, Austria, 14–19 Apr 2024, EGU24-12669, https://doi.org/10.5194/egusphere-egu24-12669, 2024.

EGU24-15366 | ECS | Posters on site | ESSI2.9

Enabling seamless integration of Copernicus and in-situ data 

Iason Sotiropoulos, Athos Papanikolaou, Odysseas Sekkas, Anastasios Polydoros, Vassileios Tsetsos, Claudio Pisa, and Stamatia Rizou

BUILDSPACE aims to combine terrestrial data from buildings collected by IoT devices with aerial imaging from drones equipped with thermal cameras and location annotated data from satellite services (i.e., EGNSS and Copernicus) to deliver innovative services at building scale, enabling the generation of high fidelity multi-modal digital twins and at city scale providing decision support services for energy demand prediction, urban heat and urban flood analysis. A pivotal element and the foundational support of the BUILDSPACE ecosystem is the Core Platform and it plays a crucial role in facilitating seamless data exchange, secure and scalable data storage, and streamlined access to data from three Copernicus services, namely the Land, Atmosphere, and Climate Change.The platform's underlying technology is robust, incorporating two key components: OIDC for user authentication and group authorization over the data, and a REST API to handle various file operations. OIDC stands for OpenID Connect, a standard protocol that enables secure user authentication and allows for effective management of user groups and their access permissions. On the other hand, the platform employs a REST API for seamless handling of file-related tasks, including uploading, downloading, and sharing. This combination ensures efficient and secure data exchange within the system. Additionally, the use of an S3 compatible file system ensures secure and scalable file storage, while a separate metadata storage system enhances data organization and accessibility. Currently deployed on a Kubernetes cluster, this platform offers numerous advantages, including enhanced scalability, efficient resource management, and simplified deployment processes. The implementation of the Core Platform has led to a current focus on integrating APIs from Copernicus services into the Core Platform's API. This ongoing effort aims to enhance the platform's capabilities by seamlessly incorporating external data, enriching the overall functionality and utility of the project.

How to cite: Sotiropoulos, I., Papanikolaou, A., Sekkas, O., Polydoros, A., Tsetsos, V., Pisa, C., and Rizou, S.: Enabling seamless integration of Copernicus and in-situ data, EGU General Assembly 2024, Vienna, Austria, 14–19 Apr 2024, EGU24-15366, https://doi.org/10.5194/egusphere-egu24-15366, 2024.

EGU24-15416 | ECS | Orals | ESSI2.9

XDGGS: Xarray Extension for Discrete Global Grid Systems (DGGS) 

Alexander Kmoch, Benoît Bovy, Justus Magin, Ryan Abernathey, Peter Strobl, Alejandro Coca-Castro, Anne Fouilloux, Daniel Loos, and Tina Odaka

Traditional geospatial representations of the globe on a 2-dimensional plane often introduce distortions in area, distance, and angles. Discrete Global Grid Systems (DGGS) mitigate these distortions and introduce a hierarchical structure of global grids. Defined by ISO standards, DGGSs serve as spatial reference systems facilitating data cube construction, enabling integration and aggregation of multi-resolution data sources. Various tessellation schemes such as hexagons and triangles cater to different needs - equal area, optimal neighborhoods, congruent parent-child relationships, ease of use, or vector field representation in modeling flows.

The fusion of Discrete Global Grid Systems (DGGS) and Datacubes represents a promising synergy for integrated handling of planetary-scale data.

The recent Pangeo community initiative at the ESA BiDS'23 conference has led to significant advancements in supporting Discrete Global Grid Systems (DGGS) within the widely used Xarray package. This collaboration resulted in the development of the Xarray extension XDGGS (https://github.com/xarray-contrib/xdggs). The aim of xdggs is to provide a unified, high-level, and user-friendly API that simplifies working with various DGGS types and their respective backend libraries, seamlessly integrating with Xarray and the Pangeo scientific computing ecosystem. Executable notebooks demonstrating the use of the xdggs package are also developed to showcase its capabilities.

This development represents a significant step forward, though continuous efforts are necessary to broaden the accessibility of DGGS for scientific and operational applications, especially in handling gridded data such as global climate and ocean modeling, satellite imagery, raster data, and maps.

Keywords: Discrete Global Grid Systems, Xarray Extension, Geospatial Data Integration, Earth Observation, Data Cube, Scientific Collaboration

How to cite: Kmoch, A., Bovy, B., Magin, J., Abernathey, R., Strobl, P., Coca-Castro, A., Fouilloux, A., Loos, D., and Odaka, T.: XDGGS: Xarray Extension for Discrete Global Grid Systems (DGGS), EGU General Assembly 2024, Vienna, Austria, 14–19 Apr 2024, EGU24-15416, https://doi.org/10.5194/egusphere-egu24-15416, 2024.

EGU24-15872 | Posters on site | ESSI2.9

Deploying Pangeo on HPC: our experience with the Remote Sensing Deployment Analysis environmenT on SURF infrastructure 

Francesco Nattino, Meiert W. Grootes, Pranav Chandramouli, Ou Ku, Fakhereh Alidoost, and Yifat Dzigan

The Pangeo software stack includes powerful tools that have the potential to revolutionize the way in which research on big (geo)data is conducted. A few of the aspects that make them very attractive to researchers are the ease of use of the Jupyter web-based interface, the level of integration of the tools with the Dask distributed computing library, and the possibility to seamlessly move from local deployments to large-scale infrastructures. 

The Pangeo community and project Pythia are playing a key role in providing training resources and examples that showcase what is possible with these tools. These are essential to guide interested researchers with clear end goals but also to provide inspiration for new applications. 

However, configuring and setting up a Pangeo-like deployment is not always straightforward. Scientists whose primary focus is domain-specific often do not have the time to spend solving issues that are mostly ICT in nature. In this contribution, we share our experience in providing support to researchers in running use cases backed by deployments based on Jupyter and Dask at the SURF supercomputing center in the Netherlands, in what we call the Remote Sensing Deployment Analysis environmenT (RS-DAT) project. 

Despite the popularity of cloud-based deployments, which are justified by the enormous data availability at various public cloud providers, we discuss the role that HPC infrastructure still plays for researchers, due to the ease of access via merit-based allocation grants and the requirements of integration with pre-existing workflows. We present the solution that we have identified to seamlessly access datasets from the SURF dCache massive storage system, we stress how installation and deployment scripts can facilitate adoption and re-use, and we finally highlight how technical research-support staff such as Research Software Engineers can be key in bridging researchers and HPC centers. 

How to cite: Nattino, F., Grootes, M. W., Chandramouli, P., Ku, O., Alidoost, F., and Dzigan, Y.: Deploying Pangeo on HPC: our experience with the Remote Sensing Deployment Analysis environmenT on SURF infrastructure, EGU General Assembly 2024, Vienna, Austria, 14–19 Apr 2024, EGU24-15872, https://doi.org/10.5194/egusphere-egu24-15872, 2024.

EGU24-17111 | Posters on site | ESSI2.9

Cloudifying Earth System Model Output 

Fabian Wachsmann

We introduce eerie.cloud (eerie.cloud.dkrz.de), a data server for efficient access to prominent climate data sets stored on disk at the German Climate Computing Center (DKRZ). We show how we “cloudify” data from two projects, EERIE and ERA5, and how one can benefit from it. 

The European Eddy-rich Earth System Model (EERIE) project aims to develop state-of-the-art high-resolution Earth System Models (ESM) that are able to resolve ocean mesoscale processes. These models are then used to perform simulations over centennial scales and make their output available for the global community. At present, the total volume of the EERIE data set exceeds 0.5PB  and is rapidly growing, posing challenges for data management.
ERA5 is the fifth generation ECMWF global atmospheric reanalysis. It is widely used as forcing data for climate model simulations, for model evaluation or for the analysis of climate trends. DKRZ maintains a 1.6 PB subset of ERA5 data at its native resolution.

We use Xpublish to set up the data server. Xpublish is a python package and a plugin for Pangeo's central analysis package Xarray. Its main feature is to provide ESM output by mapping any input data to virtual zarr data sets. Users can retrieve these data sets as if they were cloud-native and cloud-optimized.

eerie.cloud features

  • Parallel access to data subsets on chunk-level
  • Interfaces to make the data more FAIR
    • User friendly content overviews with displays of xarray-like dataset representations
    • Simple browsing and loading data with an intake catalog
  • On-the-fly server-side computation 
    • Register simple xarray routines for generating customized variables
    • Compression for speeding up downloads
  • Generation of interactive geographical plots, including animations

Eerie.cloud is a solution to make EERIE data more usable by a wider community.

How to cite: Wachsmann, F.: Cloudifying Earth System Model Output, EGU General Assembly 2024, Vienna, Austria, 14–19 Apr 2024, EGU24-17111, https://doi.org/10.5194/egusphere-egu24-17111, 2024.

EGU24-17150 | ECS | Posters on site | ESSI2.9

Data access patterns of km-scale resolution models 

Janos Zimmermann, Florian Ziemen, and Tobias Kölling

Climate models produce vast amounts of output data. In the nextGEMS project, we have run the ICON model at 5 km resolution for 5 years, producing about 750 TB of output data from one simulation. To ease analysis, the data is stored at multiple temporal and spatial resolutions. The dataset is now analyzed by more than a hundred scientists on the DKRZ levante system. As disk space is limited, it is crucial to obtain information, which parts of this dataset are accessed frequently and need to be kept on disk, and which parts can be moved to the tape archive and only be fetched on request.

By storing the output as zarr files with many small files for the individual data chunks, and logging file access times, we obtained a detailed view of more than half a year of access to the nextGEMS dataset, even going to regional level for a given variable and time step. The evaluation of those access patterns offers the possibility to optimize various aspects such as caching, chunking, and archiving. Furthermore, it provides valuable information for designing future output configurations.

In this poster, we present the observed access patterns and discuss their implications for our chunking and archiving strategy. Leveraging an interactive visualization tool, we explore and compare access patterns, distinguishing frequently accessed subsets, sparsely accessed variables, and preferred resolutions. We furthermore provide information on how we analyzed the data access to enable other users to follow our approach.

How to cite: Zimmermann, J., Ziemen, F., and Kölling, T.: Data access patterns of km-scale resolution models, EGU General Assembly 2024, Vienna, Austria, 14–19 Apr 2024, EGU24-17150, https://doi.org/10.5194/egusphere-egu24-17150, 2024.

EGU24-18256 | Orals | ESSI2.9

Data access for km-scale resolution models 

Florian Ziemen, Tobias Kölling, and Lukas Kluft

With the transition to global, km-scale simulations, model outputs have grown in size, and efficient ways of accessing data have become more important than ever. This implies that the data storage has to be optimized for efficient read access to small sub-sets of the data, and multiple resolutions of the same data need to be provided for efficient analysis on coarse as well as fine-grained scales.

In this high-level overview presentation, we present an approach based on datasets. Each dataset represents a coherent subset of a model output (e.g. all model variables stored at daily resolution). Aiming for a minimum number of datasets makes us enforce consistency in the model output and thus eases analysis. Each dataset is served to the user as one zarr store, independent of the actual file layout on disks or other storage media. Multiple datasets are grouped in catalogs for findability.

By serving the data via https, we can implement a middle layer between the user and the storage systems, allowing to combine different storage backends behind a unifying frontend. At the same time, this approach allows us to largely build the system on existing technologies such as web servers and caches, and efficiently serve data to users outside the compute center where the data is stored.
The approach we present is currently under development in the BMBF project WarmWorld with contributions by the H2020 project nextGEMS, and we expect it to be useful for many other projects as well.

How to cite: Ziemen, F., Kölling, T., and Kluft, L.: Data access for km-scale resolution models, EGU General Assembly 2024, Vienna, Austria, 14–19 Apr 2024, EGU24-18256, https://doi.org/10.5194/egusphere-egu24-18256, 2024.

EGU24-18585 | ECS | Posters on site | ESSI2.9

STAC catalogs for time-varying in-situ data 

Justus Magin

The ability to search a collection of datasets is an important factor for the usefulness of the data. By organizing the metadata into catalogs, we can enable dataset discovery, look up file locations and avoid access to the data files before the actual computation. Spatio-Temporal Asset Catalogs (STAC) is a increasingly popular language-agnostic specification and vibrant ecosystem of tools for geospatial data catalogs, and is tailored for raster data like satellite imagery. It allows for a search using a variety of patterns, including the spatial and temporal extent.

In-situ data is heterogenous and would benefit from being cataloged, as well as the ecosystem of tools. However, due to the strict separation between the spatial and temporal dimensions in STAC the time-varying nature of in-situ data is not optimally captured. While for approximately stationary sensors like tide gauges, moorings, weather stations, and high-frequency radars this is not an issue (see https://doi.org/10.5194/egusphere-egu23-8096), it becomes troublesome for moving sensors, especially if the sensor moves at a high speed, covers big distances, or if the dataset contains a long time series.

To resolve this, we extend the STAC specification by replacing the geojson data with the JSON-encoded ODC moving feature standard.

How to cite: Magin, J.: STAC catalogs for time-varying in-situ data, EGU General Assembly 2024, Vienna, Austria, 14–19 Apr 2024, EGU24-18585, https://doi.org/10.5194/egusphere-egu24-18585, 2024.

EGU24-20779 | Orals | ESSI2.9

Project Pythia: Building an Inclusive Geoscience Community with Cookbooks 

John Clyne, Brian Rose, Orhan Eroglu, James Munroe, Ryan May, Drew Camron, Julia Kent, Amelia Snyder, Kevin Tyle, Maxwell Grover, and Robert Ford

Project Pythia is the educational arm of the Pangeo community, and provides a growing collection of community driven and developed training resources that help geoscientists navigate the Pangeo ecosystem, and the myriad complex technologies essential for today’s Big Data science challenges. Project Pythia began in 2020 with the support of a U.S. NSF EarthCube award. Much of the initial effort focused on Pythia Foundations: a collection of Jupyter Notebooks that covered essential topics such as Python language basics; managing projects with GitHub; authoring and using “binderized” Jupyter Notebooks; and many of Pangeo’s core packages such as Xarray, Pandas, and Matplotlib. Building upon Foundations, the Pythia community turned its attention toward creating Pythia Cookbooks: exemplar collections of recipes for transforming raw ingredients (publicly available, cloud-hosted data) into scientifically useful results. Built from Jupyter Notebooks, Cookbooks are explicitly tied to reproducible computational environments and supported by a rich infrastructure enabling collaborative authoring and automated health-checking – essential tools in the struggle against the widespread notebook obsolescence problem.


Open-access, cloud-based Cookbooks are a democratizing force for growing the capacity of current and future geoscientists to practice open science within the rapidly evolving open science ecosystem. In this talk we outline our vision of a sustainable, inclusive open geoscience community enabled by Cookbooks. With further support from the NSF, the Pythia community will accelerate the development and broad buy-in of these resources, demonstrating highly scalable versions of common analysis workflows on high-value datasets across the geosciences. Infrastructure will be deployed for performant data-proximate Cookbook authoring, testing, and use, on both commercial and public cloud platforms. Content and community will expand through annual workshops, outreach, and classroom use, with recruitment targeting under-served communities. Priorities will be guided by an independent steering board; sustainability will be achieved by nurturing a vibrant, inclusive community backed by automation that lowers barriers to participation.

How to cite: Clyne, J., Rose, B., Eroglu, O., Munroe, J., May, R., Camron, D., Kent, J., Snyder, A., Tyle, K., Grover, M., and Ford, R.: Project Pythia: Building an Inclusive Geoscience Community with Cookbooks, EGU General Assembly 2024, Vienna, Austria, 14–19 Apr 2024, EGU24-20779, https://doi.org/10.5194/egusphere-egu24-20779, 2024.

EGU24-20909 | ECS | Orals | ESSI2.9

UXarray: Extensions to Xarray to support unstructured grids 

Orhan Eroglu, Hongyu Chen, Philip Chmielowiec, John Clyne, Corrine DeCiampa, Cecile Hannay, Robert Jacob, Rajeev Jain, Richard Loft, Brian Medeiros, Lantao Sun, Paul Ullrich, and Colin Zarzycki

The arrival of kilometer-scale climate and global weather models presents substantial challenges for the analysis and visualization of the resulting data, not only because of their tremendous size but also because of the employment of unstructured grids upon which the governing equations of state are solved. Few Open Source analysis and visualization software tools exist that are capable of operating directly on unstructured grid data. Those that do exist are not comprehensive in the capabilities they offer, do not scale adequately, or both. Recognizing this gap in much-needed capability, Project Raijin - funded by an NSF EarthCube award - and the DOE SEATS project, launched a collaborative effort to develop an open source Python package called UXarray. 

UXarray extends the widely used Xarray package, providing support for operating directly (without regridding) on unstructured grid model outputs found in the Earth System Sciences, such as CAM-SE, MPAS, SCRIP, UGRID, and in the future, ICON. Much like Xarray, UXarray provides fundamental analysis and visualization operators, upon which more specialized, domain-specific capabilities can be layered. This talk will present an overview of the current capabilities of UXarray, provide a roadmap for near term future development, and will describe how the Pangeo community can contribute to this on-going effort.

How to cite: Eroglu, O., Chen, H., Chmielowiec, P., Clyne, J., DeCiampa, C., Hannay, C., Jacob, R., Jain, R., Loft, R., Medeiros, B., Sun, L., Ullrich, P., and Zarzycki, C.: UXarray: Extensions to Xarray to support unstructured grids, EGU General Assembly 2024, Vienna, Austria, 14–19 Apr 2024, EGU24-20909, https://doi.org/10.5194/egusphere-egu24-20909, 2024.

EGU24-7295 | ECS | Posters on site | HS1.2.1

Developing gravimetric water level meter 

YooSik Jeong, Ho Jeong Jo, Soo Jeong Park, and Oh Yoon Kong

According to Korean Statistical Information Service(KOSIS)’s data, the area of the Republic of Korea is 100,444 km2 and the area of Seoul, the capital city of Korea, is 605 km2, which is only 0.6 % of the area of Korea. However, the population of the Korea is 51.75 million, and that of Seoul is 9.39 million, accounting for a large 18 % of Korea. A large number of these densely populated cities are located in river basins. In most of time, water resources stored upstream are used as various purposes(drinking, industrial, and agricultural use) and drained downstream. During summer monsoon, however, rain that falls in the basin is discharged downstream as quickly as possible to prevent flooding. But heavy, concentrated rain caused by recent climate change often leads to capacity to exceed designed capacity. Moreover, inundation occurred due to neglect of neglect of drain pipe and street inlet and is becoming a serious social problem.

This study was conducted to observe the ‘flood level’ in the city, which is basic data for flood management. We already have the ability to accurately and conveniently measure the water level and transmit the data when flooding occurs at multiple point in the city. To monitor water levels in underpasses and areas where poor drainage is expected, rods on the centerline of roadway or border of the sidewalk are used. The prototype has been completed, and additional work is underway to miniaturize the built-in equipment(board, communication, and battery) and to extend battery duration. To maintain accuracy of measurement in the process of the miniaturization, it is important to secure enough distance between weight and outer case to minimize the surface tension effect. So it is necessary to understand the relationship between the weight-outer case distance and water level observation measurements. This relationship was confirmed through various weights and outer cases. As a result, the accuracy was found to be sufficient when a weight-outer case distance is about 9 mm or longer.

Acknowledgement : This research was support by a (2022-MOIS63-002) of Cooperative Research Method and Safety Management Technology in National Disaster funded by Ministry of Interior and Safety(MOIS, Korea).

How to cite: Jeong, Y., Jo, H. J., Park, S. J., and Kong, O. Y.: Developing gravimetric water level meter, EGU General Assembly 2024, Vienna, Austria, 14–19 Apr 2024, EGU24-7295, https://doi.org/10.5194/egusphere-egu24-7295, 2024.

EGU24-7444 | Posters on site | HS1.2.1

Development of Portable Weather Observation System 

Mi Eun Park and Yong Hee Lee

In the event of a large-scale forest fire, the Korea Meteorological Administration (KMA)’s weather observation vehicles are deployed to obtain weather information necessary for extinguishing the fire. However, due to the limited number of vehicles and the environment to enter the field, it is difficult to observe the point where the information is actually needed. Therefore, there is an urgent need to develop a weather observation system that is easy to transport and install in the field.

We developed a 'portable weather observation system' that can be easily utilized by anyone, even if the KMA does not support weather observation vehicles and their operators at the disaster site.

 - [Transport] Weight and size that can be easily carried by one adult in a suitcase (or backpack).
 - [Installation] Attached to a steel plate, such as the top of a vehicle without any additional components. If this is not possible, a tripod can be utilized for installation.
 - [Operation] Real-time storage, display, and transmission of observation data
 - [Information] Location of the observation site (latitude, longitude and altitude) and weather variables (temperature, humidity, atmospheric pressure, and wind direction*∙wind speed) of the observation site.
  * Corrected regardless of the system's installation orientation

The prototype consists of a weather observation sensor, two GPS antennas, a tripod, a data processing/storage/display unit, and a power supply unit, and the total weight of the components including the suitcase (10 kg) is 20 kg. The weather observation sensor used is the Vaisala WXT-536, which can observe weather variables. Two GPS antennas were used to determine the location of the sites and correct the wind direction observed by the sensor. The system can be directly utilized by the Korea Forest Service (KFS) and the National Fire Agency (NFA) for initial extinguishment of wildfires.

By applying weather observation data transmitted in real-time from the field to numerical forecasting models, the KMA can provide more accurate weather forecasts back to the field. In the future, we plan to improve the prototype by utilizing an inexpensive sensor and lightweight and long-lasting batteries to reduce the cost and weight as well as increase the operating time.

How to cite: Park, M. E. and Lee, Y. H.: Development of Portable Weather Observation System, EGU General Assembly 2024, Vienna, Austria, 14–19 Apr 2024, EGU24-7444, https://doi.org/10.5194/egusphere-egu24-7444, 2024.

EGU24-11069 | ECS | Posters on site | HS1.2.1

Lake SkyWater - a portable optical buoy for easily measuring water-leaving radiance in lakes based on the skylight-blocked approach (SBA) 

Arthur Coqué, Tiphaine Peroux, Guillaume Morin, and Thierry Tormos

Spaceborne optical sensors are a useful tool for monitoring water quality in oceans, lakes and rivers on a large scale, at high frequency and at relatively low costs. Based on water colour algorithms, many key biogeochemical parameters are operationally estimated from satellite data (e.g. chlorophyll-a concentration). Calibrating and validating these algorithms requires a huge collection of high-quality in situ radiometric data, such as the water-leaving radiance Lw (or the remote sensing reflectance Rrs), necessitating high-level expertise and expensive material.

One of the most robust methods to measure Lw is the skylight-blocked approach (SBA), which allows Lw to be measured directly at the air-water interface. Compared with the conventionnal “above-water” method, the measurement is not contaminated by light reflected from the surface (including both sky- and sun-glint), thanks to the use of a cone-shaped screen attached to the downward-facing radiance sensor (which measures Lw) that fully blocks all downward radiance at the air-water interface.

Our open-source system “Lake SkyWater” was designed around the idea of making in situ radiometry measurements in lakes user-friendly and affordable, while retaining the accuracy and robustness required for scientific and operational purposes. We have created a semi-autonomous buoy that implements the SBA method. Lake SkyWater is low-cost (<1 k€, excluding the cost of the two radiometers), lightweight, and easy to transport and deploy. Our new device addresses one of the main ongoing issues with the SBA protocol: the issue with the radiance sensor measuring water being in the direct sun shadow of the deployment platform.

Our device consists of two commercially available radiometers that use the MODBUS RTU protocol (e.g., TriOS RAMSES G2) controlled by open-source TinkerForge modules and mounted to a rotating platform attached on top of an inner-tube (the buoy). Everything has been optimised for maximal portability (allowing it to be taken on a commercial flight): 1) the buoy is inflatable and 2) the structure is made of lightweight anodised aluminium profiles and PETG 3D-printed parts, and can be disassembled and transported in a suitcase/bag (the longest part measures 745x40x20 mm). The buoy’s position, its absolute orientation as well as its tilt are recorded (thanks to the embedded GNSS receiver and the 9-DOF IMU), and the solar azimuth angle is derived from the buoy’s positioning data. This enables the system to calculate the motor adjustments needed to keep the radiance sensor on the sunny side of the instrument. Our device hosts its own WiFi network and can be controlled wirelessly over a mobile phone, tablet or PC. Additionally, the radiometric buoy can be transformed into a fully autonomous monitoring system by plugging in a Raspberry Pi to act as a data logger.

Lake SkyWater was designed in the context of my PhD thesis dedicated to the calibration and validation of water colour algorithms for Petit-Saut Reservoir in French Guyana.

How to cite: Coqué, A., Peroux, T., Morin, G., and Tormos, T.: Lake SkyWater - a portable optical buoy for easily measuring water-leaving radiance in lakes based on the skylight-blocked approach (SBA), EGU General Assembly 2024, Vienna, Austria, 14–19 Apr 2024, EGU24-11069, https://doi.org/10.5194/egusphere-egu24-11069, 2024.

EGU24-11187 | ECS | Posters on site | HS1.2.1 | Highlight

DISCO: a low-cost Device-Instrumented Secchi disk for water Clarity Observations 

Gaia Donini and Sebastiano Piccolroaz

Water clarity regulates light penetration in aquatic environments, influencing both physical and biological dynamics. Its influence extends to heat transfer within the water column, shaping the thermal structure of lakes. Photosynthetically Active Radiation (PAR) in the euphotic zone is the source of energy for light-dependent organisms, which are crucial for ecological balance. The ability to accurately assess water clarity is therefore important in several aquatic science contexts, ranging from data analysis and process interpretation to modelling. Common metrics used to quantify water quality include the vertical attenuation coefficient Kd,PAR, a measure of light penetration, and the Secchi depth (ZSD), a measure of water visibility. The enduring simplicity and cost effectiveness of the Secchi disk has made it a global standard for measuring water clarity for almost two centuries. In contrast, Kd,PAR is typically determined using expensive instruments designed to measure light in the PAR range. This discrepancy highlights the need for innovative yet cost-effective methods that integrate both types of measurements. In this contribution, we present DISCO, a low-cost instrument that combines the standard and globally used Secchi disk with light attenuation measurement supported by light sensors. DISCO retains the traditional shape of a Secchi disk but is equipped with light-dependent resistors (LDRs), which are used as light sensors both looking up and down. In addition to the LDRs, the disk is also equipped with low-cost temperature and pressure sensors, all connected to an ArduinoUNO board. After calibrating the sensors against commercial instruments, DISCO was tested in two mountain lakes together with high-resolution PAR, temperature and pressure sensors used as a benchmark. The results show that the proposed low-cost instrument is able to reproduce the shape of the light profiles with proper quantification of the light attenuation coefficients. Its affordable cost and ease of construction and use is expected to increase the ability to make measurements in locations where expensive instruments are not available, thereby extending the coverage of water clarity monitoring sites. This in turn has potential implications for wider in-situ calibration of remote sensing products. The prototype of DISCO will be shown at the poster session.

How to cite: Donini, G. and Piccolroaz, S.: DISCO: a low-cost Device-Instrumented Secchi disk for water Clarity Observations, EGU General Assembly 2024, Vienna, Austria, 14–19 Apr 2024, EGU24-11187, https://doi.org/10.5194/egusphere-egu24-11187, 2024.

EGU24-15584 | Posters on site | HS1.2.1

Leveraging inland radar altimetry over rivers with low cost GNSS reflectometry 

Roelof Rietbroek, Zeleke K. Challa, Michael Kizza, Modathir Zaroug, Tom Kanyike, and Calvince Wara

The monitoring of surface water levels in lakes and rivers is essential for adequate water resource management and timely responding to extreme events. Monitoring an entity as large as the Nile river comes with significant challenges. The cross-boundary nature of the Nile, complicates its management due to different jurisdictions and interests, furthermore there are logistical challenges related to accessibility and site safety.

Radar altimetry has the potential to offer remotely sensed water heights, but still requires expert knowledge and site-specific trial and error. Generating in-situ records of water level heights is therefore invaluable activity both for monitoring and validation purposes.

Low-cost Global Navigations Satellite Systems (GNSS) interferometric reflectometry promises a low-cost solution for monitoring water heights, and devices can be locally constructed using off the shelf components which are now widely available. Furthermore, the development of internet of things (IoT) networks in Africa is moving forward and creates opportunities for remotely controlled measurement stations.

Here, we present our activities on designing and deploying low-cost GNSS-R receivers on the shores of Lake Victoria. We show several designs based on raspberry Pi’s and a low-power version based on the Actinius Icarus platform (zephyr based). We further explore possibilities to apply on-board processing of GNSS signal to noise ratio series, which will pave the way for using low bandwidth networks.

How to cite: Rietbroek, R., K. Challa, Z., Kizza, M., Zaroug, M., Kanyike, T., and Wara, C.: Leveraging inland radar altimetry over rivers with low cost GNSS reflectometry, EGU General Assembly 2024, Vienna, Austria, 14–19 Apr 2024, EGU24-15584, https://doi.org/10.5194/egusphere-egu24-15584, 2024.

EGU24-16629 | Posters on site | HS1.2.1

SETIER Project: An open source flowmeter for monitoring flow rates output of waste water treatment 

Arnold Imig, Hélène Guyard, Stephanie Prost-boucle, Valerie Quatela, Sylvain Moreau, Julien Sudre, and Rémi Clément

Different types of sensors are used continuously or intermittently in urban water management systems. They are primarily useful for monitoring and controlling medium to large treatment plants, allowing the recording of physical parameters such as inflow and/or outflow rates or the temperature of the facilities (Murphy et al., 2015). Additionally, continuously measured parameters include those specifically used to monitor physico-chemical processes throughout the treatment: electrical conductivity, pH, turbidity, redox potential, or dissolved oxygen in the basins, as well as insufflated air flow rates. For smaller-scale stations (< 2,000 EH), water quality monitoring is often more limited, frequently confined to batch counting or using malfunction sensors (for instance, effluent overflow).Furthermore, taking the example of reed bed filters (RBF), which are primarily advantageous for operators due to their operational simplicity, the use of sensors could be seen as complicating this system primarily intended for rural areas (Rao et al., 2013). The costs of purchasing and maintaining measurement chains may appear excessively high depending on the parameters used, an opinion shared by municipalities and operators whose financial resources are increasingly constrained (Prost-Boucle et al., 2022). The issue of sensor costs is particularly significant for smaller stations, significantly impacting operational budgets. It is also worth noting the difficulty in repairing and maintaining these solutions, often regarded as black boxes for users, requiring complete upgrades at regular intervals. As part of the Setier project, we have developed a series of Open-hardware tools for the management and monitoring of wastewater treatment plants. The objective of our presentation will be to showcase an open-source ultrasonic flowmeter. This flowmeter allows monitoring variations in Venturi channels, encompassing heights from 0 to 1 meter. It offers a 1mm resolution, and all design elements are shared online. The uniqueness of our system lies in its requirement for no component soldering like “Lego”. The flowmeter is programmable via the Arduino IDE. As for data collection, it is done using a smartphone through a web server embedded in the Arduino MKR1010 Wifi board. Our presentation will highlight the first measurement results from a 6-month wastewater treatment plant.


Murphy, K., Heery, B., Sullivan, T., Zhang, D., Paludetti, L., Lau, K.T., Diamond, D., Costa, E., O׳Connor, N., Regan, F., 2015. A low-cost autonomous optical sensor for water quality monitoring. Talanta 132, 520–527. https://doi.org/10.1016/J.TALANTA.2014.09.045

Prost-Boucle, S., Kamgan Nzeufo, H., Bardo, T., Moreau, S., Guyard, H., Duwig, C., Kim, B., Dubois, V., Gillot, S., Clement, R., 2022. Capteurs bon marché et centrales d’acquisition DIY pour les eaux usées : le projet Setier: Low-cost sensors and datalogger open hardware for wastewaters: Setier project. TSM 35–44. https://doi.org/10.36904/tsm/202201035

Rao, A.S., Marshall, S., Gubbi, J., Palaniswami, M., Sinnott, R., Pettigrovet, V., 2013. Design of low-cost autonomous water quality monitoring system. Presented at the 2013 International Conference on Advances in Computing, Communications and Informatics (ICACCI), pp. 14–19. https://doi.org/10.1109/ICACCI.2013.6637139

How to cite: Imig, A., Guyard, H., Prost-boucle, S., Quatela, V., Moreau, S., Sudre, J., and Clément, R.: SETIER Project: An open source flowmeter for monitoring flow rates output of waste water treatment, EGU General Assembly 2024, Vienna, Austria, 14–19 Apr 2024, EGU24-16629, https://doi.org/10.5194/egusphere-egu24-16629, 2024.

EGU24-18913 | ECS | Posters on site | HS1.2.1

A low-cost multi-sensor platform for monitoring real-time hydrological and biogeochemical dynamics across land-stream interfaces 

Lluís Gómez Gener, Antoine Wiedmer, and Lluís Camarero Galindo

The recognition of global change impacts on catchments and the waters they drain emphasizes the need to better understand and predict both hydrological and biogeochemical dynamics at the terrestrial-aquatic interface. To achieve this great endeavor, a key priority is to substantially increase the number of multi-annual time series, covering a broad range of river types and filling existing geographical gaps (e.g., low-income regions in/and remote areas). However, commercial multi-sensor solutions are not affordable to everyone. The multi-sensor platform consists of a STM32 micro-controller board combined with a data logger module, and a set of sensors to measure hydro-chemical properties both at different depths in soils (adjacent to the streams) as well as within streams: temperature, water level, moisture, electrical conductivity, turbidity, dissolved O2 and CO2. The monitoring system is also equipped with a wireless communication capability using LoRa network technologies. To make our project as accessible as possible, we have designed, built, and programmed the multi-sensor adopting the Open Source Hardware and Software philosophy. Through the complete processes of pre-calibration and in situ measurement, the preliminary results illustrate that the proposed multi-sensor system can provide long-term, high-frequency hydrological and biogeochemical data across land-stream interfaces while keeping the balance of costs and accuracy.

How to cite: Gómez Gener, L., Wiedmer, A., and Camarero Galindo, L.: A low-cost multi-sensor platform for monitoring real-time hydrological and biogeochemical dynamics across land-stream interfaces, EGU General Assembly 2024, Vienna, Austria, 14–19 Apr 2024, EGU24-18913, https://doi.org/10.5194/egusphere-egu24-18913, 2024.

EGU24-19085 | ECS | Posters on site | HS1.2.1

Rainfall Intensity Estimation Based on Raindrops Sound: Leveraging the Convolutional Neural Network for Analyzing Spectrogram 

Seunghyun Hwang, Jinwook Lee, Jongyun Byun, Kihong Park, and Changhyun Jun

In this study, we propose a novel approach for precipitation measurement based on rainfall acoustics, utilizing an effective rainfall acoustic collection device with low-cost IoT sensors housed in waterproof enclosure. Here, rainfall acoustics refer to the sound generated when raindrops fall and collide with surfaces such as the ground or canopy. Even at the same rainfall intensity, depending on the medium with which raindrops collide, acoustics with different frequency characteristics may occur. In this research, an acoustic collection device, combining a Raspberry Pi and a condenser microphone, was inserted into a waterproof enclosure and deployed in a rainfall environment to collect rainfall acoustics. This approach not only controls the medium of rainfall acoustics but also effectively blocks ambient noise and water, ensuring consistent characteristics of rainfall acoustics regardless of the installation environment. The collected rainfall acoustics were segmented into 10-second intervals, and spectrograms in the frequency domain were extracted by applying Short-Time Fourier Transform for each segment. Finally, using the extracted spectrogram as input data, a rainfall intensity estimation model based on a convolutional neural network was developed and other precision rainfall observation instruments (e.g., PARSIVEL, Pluvio², etc.) were considered collectively for the validation of the developed rainfall intensity estimation model. Acoustic-based rainfall observation enables the establishment of a dense observation network using low-cost devices. Leveraging the high temporal resolution of acoustic data, extremely short observation periods for rainfall can be achieved. This methodology presents an opportunity for cost-effective and high-spatiotemporal-resolution rainfall observation, overcoming the limitations of traditional methods.

Keywords: Acoustic Sensing, Rainfall Acoustics, Precipitation, Convolutional Neural Network

Acknowledgement

This work was supported by the National Research Foundation of Korea(NRF) grant funded by the Korea government(MSIT) (No. RS-2023-00250239) and in part by the Korea Meteorological Administration Research and Development Program under Grant RS-2023-00243008.

This work was supported by the National Research Foundation of Korea(NRF) grant funded by the Korea government(MSIT) (No.NRF-2022R1A4A3032838).

How to cite: Hwang, S., Lee, J., Byun, J., Park, K., and Jun, C.: Rainfall Intensity Estimation Based on Raindrops Sound: Leveraging the Convolutional Neural Network for Analyzing Spectrogram, EGU General Assembly 2024, Vienna, Austria, 14–19 Apr 2024, EGU24-19085, https://doi.org/10.5194/egusphere-egu24-19085, 2024.

EGU24-19610 | ECS | Posters on site | HS1.2.1

Open-hardware-based data logger platform for independently operating outdoor instrumentation 

Jannis Weimar and Markus Köhli

Open hardware-based microcontrollers, especially the Arduino platform, have become a comparably easy-to-use tool for rapid prototyping, stand-alone systems and implementing creative solutions. Such devices in combination with dedicated frontend electronics, external sensors and modems can offer low cost alternatives for student projects and independently operating small scale instrumentation. The capabilities of sensor-to-sensor communication can be extended to data taking and signal analysis at decent rates. Low-cost approaches to environmental monitoring will be critical for developing the evidence base needed to better understand the climate system, specifically in our case for understanding the water cycle. Off-the-shelf-components-based, internet-connected devices are easy to monitor and maintain, low risk and capable of extensive deployment to address the challenge of geographical variability and can address user- and site-specific demands. We present our project of a data logger platform "nCollector" based on an Arduino DUE, including data storage on SD cards, serial data transmission via USB, RS485, SDI-12, telemetry via GSM (4G), Nb-IoT and LoRa including its power supply and a minimal user interface. For outdoor instrumentation we specifically designed a solution with a low power demand of 0.2 W in order to realize 24/7 operation under harsh conditions with medium sized PV panels and batteries. With our presentation we want to provide a model case for other researchers to take inspiration from, share our experience with building and deploying over 100 systems all over Europe and help engaging the community to enhance their own instrumentation and data taking. 

How to cite: Weimar, J. and Köhli, M.: Open-hardware-based data logger platform for independently operating outdoor instrumentation, EGU General Assembly 2024, Vienna, Austria, 14–19 Apr 2024, EGU24-19610, https://doi.org/10.5194/egusphere-egu24-19610, 2024.

Precipitable water vapor (PWV), an essential climate variable enlisted by the Global Climate Observing System (GCOS), can be efficiently mapped using popular Earth Observation techniques like Global Navigation Satellite System (GNSS) and Interferometric Synthetic Aperture Radar (InSAR). When used in a combination, these techniques complement each other in terms of temporal and spatial resolution for producing high-resolution PWV. Tropospheric water vapor (measured as wet delay) can be perceived in two components: non-turbulent (ZWD_NT) as well as turbulent information (ZWD_T). Wet delays from InSAR acquisitions are able to capture only the turbulent information, hence need to be enhanced. The non-turbulent component further can be spatially classified into shortwave and longwave components. In this study, GNSS observations from a dense network of twelve GNSS CORS for 2021, from the newly established CORS network by Survey of India with a homogeneous spread over Uttarakhand (UK) state, is used to establish the ZWD_NT model. We develop an exponential elevation-dependent model for shortwave components, incorporating seasonal variations and a location-dependent model for long wave components. Model assessment shows the performance of the developed model when a satisfactory mean RMSE of 8.32 mm is obtained through internal checks, which shows the efficacy of the developed model in capturing elevation dependency and seasonal variations. Further, a geodetic framework is conceptualized wherein the values derived from developed ZWD_NT model are appended to non-differential ZWD_T estimated after Small BAseline Subset InSAR (SBAS-InSAR) processing at measurements points density of about 50 million points from 30 ascending pass Sentinel 1A acquisitions, to arrive at full atmospheric information (ZWD_total). A previously developed weighted mean temperature (Tm) model for the highly undulating himalayan foothills region in the UK, is incorporated in the conversion of ZWD_total to PWV, for better accuracy and further assessment. A high resolution combination of PWV derived from complementary GNSS and InSAR techniques can be efficiently utilized in improving the numerical weather prediction (NWP) skill as well as monitoring extreme weather event since the spatial variations in local tropospheric conditions of a hilly terrain are quite frequent. When validated against PWV from ERA5 reanalysis data, a mean RMSE of 9.5 mm is obtained, except for the monsoon period, when RMSE falls in the range of 10-20mm. This may be due to the fact that InSAR partial non differential PWV captures the spatially correlated artifacts especially in the temporal vicinity of a rainy event. The results show that the proposed approach can effectively enhance the InSAR derived non-differential PWV and provide useful information at a high spatial resolution in a varied topography in lesser Himalayan.These high-resolution PWV maps hold great promise for enhancing meteorological understanding and quantitative analysis, specially during heavy rainfall in a complex terrain like UK. With the upcoming NISAR mission for the Indian subcontinent, spatio-temporal analysis of tropospheric parameters can be further enhanced for weather forecasting.

How to cite: saxena, S., ojha, C., and dwivedi, R.: Establishing Zenith Wet Delay model (ZWD) and developing a framework for generating high resolution PWV for extreme weather monitoring using MT-InSAR and GNSS for Indian Himalayan region , EGU General Assembly 2024, Vienna, Austria, 14–19 Apr 2024, EGU24-1091, https://doi.org/10.5194/egusphere-egu24-1091, 2024.

Integrated Water Vapor (IWV) stands as a pivotal parameter in contemporary environmental research, offering crucial insights into atmospheric dynamics. Due to the inherent challenges in direct measurement, IWV necessitates estimation through various methods. Current approaches, including Global Navigation Satellite System (GNSS), radiosondes, radiometers, and satellite remote sensing, have inherent limitations, resulting in a scarcity of high spatial resolution data. While GNSS technology, radiosondes, and radiometers provide precision, they are confined to specific locations, imposing spatial coverage constraints. On the other hand, satellite remote sensing offers expansive, high spatial resolution IWV data, yet its accuracy is hindered under cloudy conditions and limited by satellite ground tracks.

This study addresses these challenges by introducing a regional IWV prediction model based on Machine Learning. Leveraging IWV data from diverse GNSS stations within a specified region, the study establishes a regional IWV prediction model utilizing an adaptive least squares support vector machine (ALSSVM). This predictive model enables accurate IWV estimation at any designated location within the region, incorporating inputs such as latitude, longitude, height, and temperature. Significantly, the model attains remarkable predictive accuracy, with an overall average root mean square error (RMSE) of 2 millimeters.

The model's performance exhibits variability across different seasons and terrains, illustrating its adaptability to diverse environmental conditions. The study further evaluates the reliability of the conventional ERA5 IWV calculation method in the specified region by comparing it against the predicted results from the proposed IWV prediction model. In conclusion, the developed model is applied to conduct a climate analysis, demonstrating its practical utility in environmental research for the transnational Upper Rhine Graben region.

Keywords:

Global Navigation Satellite System (GNSS), Integrated Water Vapor (IWV), least squares support vector machine (LSSVM), Climate Analysis

How to cite: Wang, L. and Kutterer, H.: Advancing Integrated Water Vapor Estimation: Introducing an Enhanced Regional Prediction Model Utilizing Improved Least Squares Support Vector Machine for the Upper Rhine Graben Region, EGU General Assembly 2024, Vienna, Austria, 14–19 Apr 2024, EGU24-2068, https://doi.org/10.5194/egusphere-egu24-2068, 2024.

EGU24-2522 | ECS | Posters virtual | G5.1

First results about height correction of tropospheric delay mapping function in GNSS applications 

Miaomiao Wang, Ping Li, Ruyu Lu, Shuheng Wang, and Fangyu Zhang

One of the dominant error sources for Global Navigation Satellite System (GNSS) measurements is the correction for delay of an electromagnetic wave as it traverses the neutral atmosphere, which is usually shorted as tropospheric delay. Generally, tropospheric delay must be calculated or estimated since refractivity along ray path is not easily or economically measured. Empirically, the line of sight delay for either hydrostatic or wet component is modeled as product of zenith delay and a mapping function. The accuracy of estimated geodetic parameters for GNSS could be limited due to the indeterminacy of mapping function, when observations are typically made to low elevation angles. Nowadays, there are many different empirical tropospheric delay mapping functions are generated and used in GNSS applications, the sensitivity of mapping functions to height above the geoid of point of observations are mostly corrected with method and formulas proposed in Niell (1996), in which the height corrections are only concerned in hydrostatic delay mapping function. In Niell (1996), the adopted form of height correction for hydrostatic delay mapping function is linearly dependent on height, and the linear coefficient is empirically chosen for fitting precision purpose. In this work, similar to many current works about modelling mapping factors to operational mapping functions, with the help of ERA-Interim reanalysis data set from the European Centre for Medium-range Weather Forecasts (ECMWF), the sensitivity of both hydrostatic and wet delay mapping factors to height are calculated and preliminary analyzed. As an important part of the work, the needed data set sources, i.e., the tropospheric delays at some ground-based stations along some previously set ray paths with different elevation angles, azimuth angles, heights and time epochs, are generated with a self-generated tropospheric delay ray-tracing package named GTRATS (Gnss Tropospheric delay RAy Tracing Software). The first results show that for a specific not low elevation angle, the variations of both hydrostatic and wet mapping factors to the height are not too obvious; the hydrostatic mapping factors change linearly to height with different performances, while wet mapping factors are not with linearly change, especially for low elevation angles; height corrections with method in Niell (1996) for hydrostatic mapping factors actually perform well in some cases, while maybe correct too much or too less in some stations at some time epochs, thus maybe new correction strategy can be accounted; the height correction should also be concerned for wet delay mapping functions, while there is no obvious, regular and reliable relation or appearance can be observed according to our first results, and more efforts should be made for the examination and investigation of this problem.

How to cite: Wang, M., Li, P., Lu, R., Wang, S., and Zhang, F.: First results about height correction of tropospheric delay mapping function in GNSS applications, EGU General Assembly 2024, Vienna, Austria, 14–19 Apr 2024, EGU24-2522, https://doi.org/10.5194/egusphere-egu24-2522, 2024.

EGU24-5628 | ECS | Orals | G5.1

Worldwide Small-Scale Land Surface Roughness Retrieval at L-band Using Space-born GNSS-R Observations  

Mina Rahmani, Jamal Asgari, and Jens Wickert

    Soil moisture (SM) is a crucial factor influencing the exchange of energy between the soil and the atmosphere, playing a key role in hydrological processes. GNSS Reflectometry (GNSS-R) has recently become an innovative method for remotely monitoring various geophysical and hydrological parameters, including soil moisture. GNSS-R operates by utilizing signals from Global Navigation Satellite Systems (GNSS) that are reflected off the Earth's surface. In addition to the quantity of soil moisture content, the features of vegetation, such as vegetation water content, and the soil surface roughness influence GNSS-R observations. Consequently, accurately parameterizing these effects is essential for achieving precise and high-quality estimates of soil moisture. Nevertheless, separating the influences of surface roughness and vegetation on reflected signals is often challenging.

     In this context, we employed a methodology aimed at assessing and mapping the sensitivity of GNSS-R observations to soil roughness effects. This analysis is based on observations collected by NASA's GNSS-R mission, CYGNSS, on a global scale in 2021. Initially, we endeavored to explore the responsiveness of CYGNSS observations to soil effects across a regular 0.2-degree global grid. The results revealed that CYGNSS observations exhibit sensitivity to soil effects over around 90% of the Earth's land surface covered by CYGNSS, spanning latitudes from 37° in the Northern Hemisphere to 37° in the Southern Hemisphere for all longitude values. Nevertheless, they show low sensitivity in the remaining 10% of land areas, primarily attributed to the impact of dense vegetation covers, particularly in the Amazon and Congo forests. In the second step, over regions where CYGNSS observations are sensitive to soil effects, we attempted to compute a map of the roughness parameter (Hr). To achieve this goal, we suggested integrating the effects of both vegetation and roughness into a single parameter, referred to as VR in this study. Initially, VR values were retrieved on a global scale from CYGNSS by inverting the L-MEB model. The L-MEB (Land Microwave Emission Model with Briggs approach) is a radiative transfer model used to simulate microwave emissions from land surfaces for remote sensing applications. Then, the effects of vegetation and soil roughness included in the VR parameter were decoupled by assuming a linear relationship between VR and Leaf Area Index (LAI) (~0.5 in this research) for the purpose of mapping the roughness parameter, Hr.

    In this study, the obtained Hr values range from 3.2 to 4.6. The spatial distribution of Hr values is observed to be influenced by predominant vegetation types, where forests demonstrate higher roughness values (Hr = 4-4.6), whereas deserts, shrubs, crops, and bare soils exhibit lower values (Hr = 3.2-3.4). We also inferred vegetation optical depth (VOD) using CYGNSS observations in conjunction with estimated Hr values as an ancillary dataset. The evaluation of the obtained VOD in comparison with Vegetation Water Content (VWC) and LAI produced correlation coefficients of 0.57 and 0.71, confirming the effectiveness of the recently introduced Hr dataset in our research and highlighting its promising potential for future applications in GNSS-R.

How to cite: Rahmani, M., Asgari, J., and Wickert, J.: Worldwide Small-Scale Land Surface Roughness Retrieval at L-band Using Space-born GNSS-R Observations , EGU General Assembly 2024, Vienna, Austria, 14–19 Apr 2024, EGU24-5628, https://doi.org/10.5194/egusphere-egu24-5628, 2024.

EGU24-5929 | ECS | Posters virtual | G5.1

Probing the Dynamics of Extreme Weather Events in the Azores, Portugal 

Dhiman R. Mondal, Pedro Elosegui, Lucy Brock, Scott Paine, Pedro Mateus, and Virgilio Mendes

The rapidly changing climate is escalating the frequency and intensity of extreme weather events in the Azores, Portugal. It is crucial to comprehend the dynamics of these events to mitigate them. Atmospheric water vapor data from the Global Navigation Satellite System (GNSS) and reanalysis products from an atmospheric general circulation model can be utilized to investigate the dynamics of weather fronts in the Azores Islands. A primary goal of our study is to conduct a comprehensive comparison between GNSS and MERRA2-based atmospheric reanalysis data and derive small-scale atmospheric structures with high-temporal resolution. Using statistical analysis, we will unveil the similarities and discrepancies between the two approaches in capturing atmospheric water vapor patterns. Emphasizing an exploratory methodology, we will showcase our findings using a restricted dataset that centers on specific instances of extreme precipitation witnessed in the Azores Islands.

How to cite: Mondal, D. R., Elosegui, P., Brock, L., Paine, S., Mateus, P., and Mendes, V.: Probing the Dynamics of Extreme Weather Events in the Azores, Portugal, EGU General Assembly 2024, Vienna, Austria, 14–19 Apr 2024, EGU24-5929, https://doi.org/10.5194/egusphere-egu24-5929, 2024.

EGU24-6211 | Posters on site | G5.1

Novel Real-time Observation of High-resolution Water Vapor Behavior for Detection of Precursors of Cumulonimbus Clouds and Investigation of Their Evolution: - Preliminary Results - 

Ryuichi Ichikawa, Yusaku Ohta, Kentaro Araki, Takuya Tajiri, Mikiko Fujita, Hideki Ujihara, Takayoshi Yamada, Takaaki Jike, Hiroshi Imai, Masahiro Minowa, and Yuya Takashima

We have initiated a new research project to analyze the behaviors of precipitable water vapor with high spatial and temporal resolutions using a dense global navigation satellite system (GNSS) network and next-generation microwave radiometers. Recently, line-shaped rainbands with extreme and hazardous characteristics have been occurring frequently in Japan, leading to disasters such as severe flooding and landslides. However, there is insufficient knowledge regarding the generation mechanism of cumulonimbus clouds within these rainbands. Our project has four research subobjectives: (1) to develop a novel microwave radiometer for use in millimeter-wave spectroscopy, enabling high-resolution and high-precision monitoring of water vapor behavior, and conduct field measurements using this radiometer for proof of concept; (2) to conduct high-resolution water vapor measurements using a dense network of low-cost GNSS receivers; (3) to conduct GNSS water vapor tomography for estimating precise temporal and spatial variations; and (4) to numerically predict weather precisely using dense-measurement water vapor datasets and fine GNSS tomography results. Our project is aimed at not only the advancement of mesoscale meteorology but also application to space geodetic techniques such as very long baseline interferometry (VLBI) and GNSS. Regarding the first subobjective, significant progress has been achieved in the development of a next-generation microwave radiometer utilizing millimeter-wave spectroscopy since 2018. To date, we have successfully engineered a new front-end module equipped with an orthomode transducer (OMT) and a wideband feed. The prototype of the complete receiver system has a wide bandwidth feed spanning from 16 to 58 GHz, facilitating the measurement of two frequency bands: 16-28 GHz (H2O) and 50-58 GHz (O2). We plan to integrate this system into a 40-meter-class dish telescope to assess its performance in detecting water vapor variability this summer. For the observation of GNSS precipitable water vapor, we first installed a low-cost GNSS receiver and a commercial-based microwave radiometer at Kagoshima University in early November 2023 as a preliminary observation to understand the variability of water vapor in the southern Kyushu area. In addition to the precipitable water vapor information obtained from this observation, we plan to investigate the variability of water vapor in this area based on the information obtained from the GNSS Earth observation network (GEONET) system of the Geospatial Information Authority of Japan (GSI) and a commercial-based GNSS observation network. Our presentation will include preliminary results and an outlook on future developments. This work received support through JSPS KAKENHI Grant Numbers JP21H04524 and 23H00221.

How to cite: Ichikawa, R., Ohta, Y., Araki, K., Tajiri, T., Fujita, M., Ujihara, H., Yamada, T., Jike, T., Imai, H., Minowa, M., and Takashima, Y.: Novel Real-time Observation of High-resolution Water Vapor Behavior for Detection of Precursors of Cumulonimbus Clouds and Investigation of Their Evolution: - Preliminary Results -, EGU General Assembly 2024, Vienna, Austria, 14–19 Apr 2024, EGU24-6211, https://doi.org/10.5194/egusphere-egu24-6211, 2024.

EGU24-8726 | Posters on site | G5.1

Near real-time water vapour monitoring with shipborne GNSS for numerical weather prediction 

Pierre Bosser and Pierre Tulet

MAP-IO (Marion Dufresne Atmospheric Program Indian Ocean) is a research project that aims to collect long-term atmospheric, biological and marine observations to document the under-instrumented areas of the Indian and Southern Oceans. To achieve this, the French Research Vessel (R/V) Marion-Dufresne, based in Réunion Island in the Indian Ocean, has been equipped with around twenty autonomous instruments to take measurements along its route.

Among the instruments deployed on this R/V, a GNSS antenna has been in operation since autumn 2020, providing unique and continuous measurements of atmospheric water vapour in this part of the world. The data were initially transmitted daily to shore for ultra-rapid (day +1) and rapid (day +3) routine analysis. The quality of the retrieved tropospheric delays and integrated water vapour contents was highlighted in a previous study. With more reliable transmission facilities, raw GNSS data are now transmitted hourly and can be analysed with a latency of less than 30 minutes.

In this study, we provide an initial assessment of the near real-time (h+20min) processing performed as part of this project. This evaluation is based on GNSS raw data collected in August 2023 during a rotation of the R/V Marion-Dufresne in the French Austral Islands (Crozet, Kerguelen, Saint-Paul and Amsterdam Islands). Processing is performed every hour over a 24-hour window, using the raw hourly data transmitted by the R/V and the cumulative real-time ephemerides and clocks provided by JPL / GDGPS. Only the last hour of each analysis is then considered. Over this period, the estimated tropospheric delays are in good agreement with the rapid routine solution, with differences of less than 1 cm RMS. The comparison with the analysis and the 6h forecast of the Météo-France's global numerical weather prediction model Arpège highlight the benefits of these shipborne GNSS measurements for numerical weather prediction.

The medium-term objective of this work is to establish an operational procedure for the assimilation of these near real-time GNSS tropopheric solutions into numerical weather prediction models.

How to cite: Bosser, P. and Tulet, P.: Near real-time water vapour monitoring with shipborne GNSS for numerical weather prediction, EGU General Assembly 2024, Vienna, Austria, 14–19 Apr 2024, EGU24-8726, https://doi.org/10.5194/egusphere-egu24-8726, 2024.

EGU24-8792 | Posters on site | G5.1

Validation of GNSS-based Integrated Water Vapor for the Swabian MOSES 2023 field campaign 

Florian Zus, Annika Oertel, Rohith Muraleedharan Thundathil, Galina Dick, Peter Knippertz, and Jens Wickert

The Swabian MOSES (Modular Observation Solutions for Earth Systems) field campaign was conducted between June and September 2023 in the southeastern Black Forest, the Neckar Valley and the Swabian Alb in southwestern Germany. It focused on hydro-meteorological extreme events, including the initiation and intensification of convective events which are accompanied by heavy rain and can lead to local flooding. As a part of the observing system the GFZ installed eight additional GNSS stations in the region of interest and operated them in near real time during the measurement campaign. The precise point positioning technique was utilized to provide Integrated Water Vapor (IWV) estimates with a temporal resolution of 15 min. In this contribution we provide a first comparison of these IWV estimates with those derived from atmospheric (re-) analysis datasets. We utilize the atmospheric reanalysis ERA5 (horizontal resolution 31 km) and the operational analysis ICON-D2 (horizontal resolution 2 km) provided by the German Weather Service. Ground-based GNSS data are not assimilated into ERA5 and ICON-D2. In general, we find good agreement between GNSS and (re-)analysis estimates: the root mean square error is 1-2 kg/m2. Our goal is to better understand the remaining station specific systematic and random deviations. For example, for all stations, the random deviations are smaller for the high compared to the low resolution model data. We attribute this to smaller representative errors and smaller forward model (interpolation) errors. However, for the systematic deviations the result is not too obvious. Comparisons with measurements from instruments which are collocated with the GNSS stations are envisaged to better understand the issue.  

How to cite: Zus, F., Oertel, A., Muraleedharan Thundathil, R., Dick, G., Knippertz, P., and Wickert, J.: Validation of GNSS-based Integrated Water Vapor for the Swabian MOSES 2023 field campaign, EGU General Assembly 2024, Vienna, Austria, 14–19 Apr 2024, EGU24-8792, https://doi.org/10.5194/egusphere-egu24-8792, 2024.

EGU24-10250 | ECS | Orals | G5.1

Assimilating UAV-based GNSS ZTDs for Numerical Weather Predictions 

Zhenyi Zhang, Mengjie Liu, Valeria Huber, Gregor Möller, Jan Henneberger, Philipp Kryenbühl, Lukas Hammerschmidt, Grzegorz Kłopotek, and Benedikt Soja

In recent decades, various studies have demonstrated that assimilating tropospheric parameters from ground-based GNSS receivers benefits numerical weather predictions (NWPs). However, the achieved performance is limited by the spatial resolution of GNSS, especially in the vertical direction. With the rapidly developing and growing market of unmanned aerial vehicles (UAVs) and the facilitates of integrating low-cost GNSS hardware into various autonomous systems over the last years, there is a potential to address this problem by utilizing UAVs to collect airborne GNSS data and generate zenith total delays (ZTDs). The airborne GNSS ZTDs can act as a potential complementary source to radiosonde data for obtaining vertical profiles of the troposphere, making it promising to investigate the impact of assimilating GNSS ZTDs of high spatio-temporal resolution in NWPs.

In this study, we explored the use of GNSS data collected by a vertically ascending UAV, with ZTDs processed using the software CamaliotGNSS. Based on the airborne GNSS ZTDs, we conducted not only data assimilation but also weather predictions using the Weather Research and Forecasting Model (WRF). With the onboard meteorology observations as references, we found that assimilating airborne GNSS ZTDs positively impacted humidity and temperature forecasts, with their forecasting root-mean-square errors decreasing by about 19% and 29%, respectively. Moreover, by selecting and comparing different subsets of data, we found that better forecasts can be obtained with airborne GNSS ZTDs of higher spatio-temporal resolution. The positive results invite further exploration of applications of airborne platforms such as UAVs in the field of GNSS meteorology. 

How to cite: Zhang, Z., Liu, M., Huber, V., Möller, G., Henneberger, J., Kryenbühl, P., Hammerschmidt, L., Kłopotek, G., and Soja, B.: Assimilating UAV-based GNSS ZTDs for Numerical Weather Predictions, EGU General Assembly 2024, Vienna, Austria, 14–19 Apr 2024, EGU24-10250, https://doi.org/10.5194/egusphere-egu24-10250, 2024.

EGU24-10463 | ECS | Orals | G5.1

Tropospheric slant delays interpolating multiple mapping functions 

Angel Navarro Trastoy, Ghodsiyeh Motlagh Zadeh, Maksym Vasiuta, Patrick Dumitraschkewitz, Torsten Mayer-Gürr, and Heikki Jarvinen

Representing the tropospheric slant delays in geodesy can get complicated due to the inhomogeneity and fast variations of the weather. Mapping functions are the most common used tool for this task, but due to the lack of information when calculating the parameters of the mapping functions, relevant errors could appear. The errors in the zenithal direction come from the limitations of the mapping functions, and in the azimuthal direction come from the asymmetries in the sight-field of the receiver. New representations, as the full skyviews representation made by University of Helsinki, have proven to lead to better results in the computation of GNSS products using orbit processing softwares, but these are expensive, both computationally and in size. In this study, we apply the mapping functions approach using the Least Travel Time ray-tracer with larger amounts of mapping functions per receiver, and a 1-hour update of all the parameters. We believe that a more precise use of the slant delays would lead to a better computaiton of GNSS products, along with a important data assimilation to the weather forecast from the residuals obtained in the Least Squares Adjustment used in the processing. The results show that the error induced when using mapping functions converges quickly to a minimum when we increase the amount of mapping functions used per receiver. The most efficient number of mapping functions is 10, being equidistant (one mapping functions every 36 degrees in azimuth).

How to cite: Navarro Trastoy, A., Motlagh Zadeh, G., Vasiuta, M., Dumitraschkewitz, P., Mayer-Gürr, T., and Jarvinen, H.: Tropospheric slant delays interpolating multiple mapping functions, EGU General Assembly 2024, Vienna, Austria, 14–19 Apr 2024, EGU24-10463, https://doi.org/10.5194/egusphere-egu24-10463, 2024.

EGU24-10874 | ECS | Orals | G5.1

A machine learning model for the vertical correction of tropospheric zenith delays 

Peng Yuan, Kyriakos Balidakis, Jungang Wang, and Zhiguo Deng

Tropospheric delay is one of the most important error sources for space geodetic techniques, such as the Global Navigation Satellite Systems (GNSS). A priori tropospheric Zenith Hydrostatic and Wet Delays (ZHD and ZWD) should be obtained properly in advance to the GNSS data processing. Numerical Weather Model (NWM) is capable to provide accurate tropospheric zenith delays at any specific location with sophisticated calculation. As a more convenient alternative, the tropospheric zenith delays can be first modeled with NWM as a 2-D grid on the Earth surface and then corrected to the height of the specific location. In this case, accurate vertical correction algorithm is crucial. However, though empirical analytical models have been developed for the vertical correction of tropospheric zenith delays, their accuracies are limited due to the large spatiotemporal variability of the delays. In this work, we propose a Machine Learning (ML) model based on neural network for the vertical corrections of both ZHD and ZWD. The training data is obtained from the state-of-the-art NWM, the fifth-generation global reanalysis of European Centre for Medium-Range Weather Forecasts (ERA5). The proposed ML model is capable to reconstruct the tropospheric delays at any height from the Earth surface to up to 14 km. The precision of the ML model is superior to the analytical models with global average RMS values less than 2 and 3 mm for ZHD and ZWD, respectively. Therefore, it provides a convenient alternative to the sophisticated vertical integration of NWM for ordinary users with slight precision loss.

How to cite: Yuan, P., Balidakis, K., Wang, J., and Deng, Z.: A machine learning model for the vertical correction of tropospheric zenith delays, EGU General Assembly 2024, Vienna, Austria, 14–19 Apr 2024, EGU24-10874, https://doi.org/10.5194/egusphere-egu24-10874, 2024.

EGU24-13449 | Posters on site | G5.1

The tropospheric delay of the GPS signal and its correlation with the solar cycle 

Umberto Tammaro, Vincenzo Carbone, Vincenzo Capparelli, Fabio Lepreti, and Claudio Martino

The INGV operates a network of about 60 permanent GNSS stations to monitor the Neapolitan volcanic area (southern Italy), which includes three active volcanoes: Somma Vesuvio, Campi Flegrei and the island of Ischia. In this study we consider only the GPS constellation, whose signals are transmitted in the microwave band. Therefore, they suffer a delay while propagating in the troposphere. Bearing in mind that the refractive index in the atmosphere is a function of the water vapour content, pressure and temperature, tropospheric delay can be assimilated into short-term weather forecast models and used in long-term climate studies. We analyse a data set ranged about 14 years (2006-2019) of continuous GPS data, to evaluate the tropospheric delay to be used as a probe tool to quantify precipitable water and track its spatial-temporal evolution. We limit the analysis to the area of Somma Vesuvio, a strato-vulcano that covers an area of 165 km2 and is about 1200 meters high, to study also the effect of the steep topography on the spatial distribution of the precipitable water content. The data are analysed in terms of empirical functions (IMF), organised in ascending order with a parameter ranging from 0 to 15, plus the trend. The trend found is not a linear growth, but grows to a maximum that is in the middle of the time range of about 11 years and then decreases. It is very interesting that the correlation with the solar cycle is high. Therefore, the next developments will be to analyze other data sets to verify the generality of this result.

How to cite: Tammaro, U., Carbone, V., Capparelli, V., Lepreti, F., and Martino, C.: The tropospheric delay of the GPS signal and its correlation with the solar cycle, EGU General Assembly 2024, Vienna, Austria, 14–19 Apr 2024, EGU24-13449, https://doi.org/10.5194/egusphere-egu24-13449, 2024.

EGU24-14710 | ECS | Posters on site | G5.1

Improved Least Travel Time ray-tracing operator for GNSS tropospheric delays 

Maksym Vasiuta, Angel Navarro Trastoy, Lauri Tuppi, Sanam Motlaghzadeh, and Heikki Järvinen

Modelling of the microwave signal delay in the neutral atmosphere (i.e., the tropospheric delay) is a crucial part of GNSS observations processing. The design of observation-modelling algorithms is based on signal ray tracing. Considering advancements in modern Numerical Weather Prediction (NWP) models and high standards of GNSS product quality, it is necessary to revise the existing ray-tracing algorithms. We developed an improved least-travel time (LTT) ray-tracer with robust physics assumptions, based on the original LTT algorithm. Both new and original LTT implementations, along with the state-of-the-art VieVS Ray-tracer (RADIATE), are supplied with numerical weather data by the Open Integrated Forecasting System model (OpenIFS) of the European Centre for Medium-Range Weather Forecasts (ECMWF). These three ray tracers are justly compared in the setup of modelling the skyview delays for 256 GNSS stations during one month (December 2016). The skill of these delay products is assessed as the quality of GNSS precise orbit determination (POD) products of the GPS constellation made by the orbit solver GROOPS (Gravity Recovery Object Oriented Programming System) software toolkit of the Graz University of Technology. The GNSS POD metrics which have been analysed are orbit midnight discontinuities (MD) and precise point positioning (PPP) error. In the context of these metrics, the usage of the new LTT algorithm leads to better orbit products, compared to the original LTT and the RADIATE ray tracers.

How to cite: Vasiuta, M., Navarro Trastoy, A., Tuppi, L., Motlaghzadeh, S., and Järvinen, H.: Improved Least Travel Time ray-tracing operator for GNSS tropospheric delays, EGU General Assembly 2024, Vienna, Austria, 14–19 Apr 2024, EGU24-14710, https://doi.org/10.5194/egusphere-egu24-14710, 2024.

EGU24-14947 | ECS | Posters on site | G5.1

Extended Kalman filtering applied to high-rate GNSS-R sea level measurements 

Aurélien Pira, Alvaro Santamaría-Gómez, and Guy Woppelmann

Coastal water monitoring is of increasing importance for applications such as sea level monitoring and urban planning. Currently, traditional tide gauge by radar measurement remains the most widely used method, but it involves placing a sensor close to the water surface, which can lead to its destruction, particularly in hostile maritime environments.

Sea level measurement by GNSS-R offers a promising alternative to traditional tide gauge methods by enabling continuous and global sea level measurements (e.g., Larson et al., 2013). It has the significant advantage of limiting the constraints linked to the installation of sensors physically close to the water surface, as a GNSS antenna can be placed away from the coast or on a high structure. Furthermore, this technique takes advantage of the high availability of existing GNSS installations around the globe, which would make it possible to considerably extend the scope of tide gauge measurements on a global scale.

Most of the methods used in GNSS-R are based on the analysis of the signal/noise ratio (SNR). They generally use a spectral analysis based on a Lomb-Scargle periodogram and are effective for monitoring mean sea level at the centimeter level (e.g., Larson et al., 2013; Santamaría-Gómez and Watson, 2017; Peng et al., 2021). However, they require a relatively long portion of the SNR series to obtain a precise estimate of the oscillation frequency of the SNR signal. This has the effect of limiting the sampling rate of the measurement series and limits spectral methods to the observation of slow variations in sea level such as the tide. Other approaches use Kalman filtering and show that it is possible to achieve an accuracy of less than 5cm in near real time (e.g., Strandberg, Hobiger and Haas, 2019; Liu et al., 2023). Furthermore, these methods show that it is possible to considerably increase the data sampling rate and thus monitor rapid variations in sea level. This extends the scope of GNSS-R techniques to all applications requiring real-time sea level measurement.

We present a novel approach for measuring sea level by analyzing SNR signals with Kalman filtering. This approach relies on the estimation of the oscillation frequency and amplitude of SNR signals using an extended Kalman filter. It has the advantage of providing sea level height estimates at a sampling rate as high as the SNR measurements. The major constraint linked to the method lies essentially in the estimation of the initial phase of the SNR signals, which particularly affects the fit of the SNR signals from setting satellites.

GNSS-R measurements were carried out with a sampling frequency of 1 second and compared to those of a tide gauge colocated on the Aix Island ILDX site (France). By combining data from different existing GNSS systems (GPS, GLONASS, Galileo, BDS) and considering all available carriers, we estimate that it is possible to obtain an RMS error of less than 5cm on sites with high tidal ranges (± 6m).

How to cite: Pira, A., Santamaría-Gómez, A., and Woppelmann, G.: Extended Kalman filtering applied to high-rate GNSS-R sea level measurements, EGU General Assembly 2024, Vienna, Austria, 14–19 Apr 2024, EGU24-14947, https://doi.org/10.5194/egusphere-egu24-14947, 2024.

EGU24-15000 | ECS | Orals | G5.1

Estimating GRACE-FO orbit perturbations with numerical weather prediction models 

Sanam Motlaghzadeh, Maksym Vasiuta, Marja Bister, Angel Navarro Trastoy, Lauri Tuppi, Torsten Mayer-gürr, and Heikki Järvinen

Satellites in Earth orbit are exposed to Earth radiation, consisting of reflected solar and emitted thermal radiation, thereby exerting a radiation pressure force that causes acceleration and affects the orbits. Gravity Recovery and Climate Experiment Follow-On (GRACE-FO) mission aiming to retrieve the Earth gravity potential is critically dependent on accounting for all non-gravitational forces, including the Earth radiation. Although weather-of-the-day; e.g., clouds and their properties, has a major role in Earth radiation pressure, only climatology has been used so far to represent this force. Using climatological data doesn’t account for orbit perturbations owing to weather-related transient changes in the Earth radiation pressure. We show here that the top-of-atmosphere radiation fluxes computed with a numerical weather prediction model explain most of the measured variations in the radial acceleration of the GRACE-FO satellite. Our physics-based modelling corrects a hitherto unexplained lack of power spectral density in the measured accelerations. For example, we can accurately model the accelerations associated with a tropical storm in Indian Ocean in December 2020, which would not be possible when using climatological data. Our results demonstrate that using a global numerical weather prediction model significantly improves the simulation of non-gravitational effects in the satellites’ orbit. This advancement will allow more precise gravity retrieval and its applications in Earth sciences. 

How to cite: Motlaghzadeh, S., Vasiuta, M., Bister, M., Navarro Trastoy, A., Tuppi, L., Mayer-gürr, T., and Järvinen, H.: Estimating GRACE-FO orbit perturbations with numerical weather prediction models, EGU General Assembly 2024, Vienna, Austria, 14–19 Apr 2024, EGU24-15000, https://doi.org/10.5194/egusphere-egu24-15000, 2024.

EGU24-15082 | ECS | Posters on site | G5.1

Impact analysis of processing strategies for long-term GPS zenith tropospheric delay (ZTD) 

Jingna Bai, Yidong Lou, Weixing Zhang, Yaozong Zhou, Zhenyi Zhang, Chuang Shi, and Jingnan Liu

Homogenized atmospheric water vapour data is an important prerequisite for climate analysis. Compared with other techniques, GPS has inherent homogeneity advantage, but it still requires reprocessing and homogenization to eliminate impacts of applied strategy and observation environmental changes where a selection of proper processing strategies is critical. Here, we reprocess GPS observations at 44 IGS stations during 1995 to 2014. We focus on the influence of the mapping function, the elevation cut-off angle and homogenization on long-term reprocessing results, in particular for Zenith Tropospheric Delays (ZTD) products. Moreover, for the first time, we include the mapping function (VMF3) and exploit homogenized radiosonde data as a reference for ZTD trend evaluations. Our analysis shows that both site position and ZTD solutions achieved the best accuracy when using VMF3 and 3° elevation cut-off angle. Regarding the long-term ZTD trends, we find that homogenization can reduce the trend inconsistency among different elevation cut-off angles. ZTD trend results show that the impact of mapping functions is very small. On the other hand, the discrepancy can reach 0.60 mm/year by using different elevation cut-off angles. We suggest the low elevation cut-off angles (3° or 7°) for the best estimates of ZTD reprocessing time series when compared to homogenized radiosonde data or ERA5 reference time series.

How to cite: Bai, J., Lou, Y., Zhang, W., Zhou, Y., Zhang, Z., Shi, C., and Liu, J.: Impact analysis of processing strategies for long-term GPS zenith tropospheric delay (ZTD), EGU General Assembly 2024, Vienna, Austria, 14–19 Apr 2024, EGU24-15082, https://doi.org/10.5194/egusphere-egu24-15082, 2024.

EGU24-15444 | Orals | G5.1

PRETTY – First experience from a 3U CubeSat In-Orbit Demonstrator for GNSS-Reflectometry under grazing angle geometry 

Andreas Dielacher, Michael Moser-Moritsch, Walter Hoermanseder, Maximilian Semmling, Weiqiang Li, Florian Zus, Mario Moreno, Jens Wickert, Estel Cardellach, Hossein Nahavandchi, and Camille Pirat

The PRETTY CubeSat In-Orbit Demonstrator (IOD) Mission has been finally launched on 9th October 2023 into a Sun-Synchrounous Orbit (SSO) in 560km height. The Launch and Early Orbit Phase (LEOP) was successful, meaning that communication with the CubeSat was possible, solar panels and VHF antennas are deployed. The commissioning phase is started. The 3U CubeSat hosts two scientific payloads, a radiation dosimeter and a novel GNSS-Reflectometry payload. The GNSS-reflectometer will be measuring earth surface under grazing elevation angles at the L5 frequency, in order to obtain altimetric altitude under various surface conditions (e.g., ocean waters or sea ice). The measurements will be done by correlating the direct and reflected signal (the so called interferometric approach), exploiting the full bandwidth of the GNSS signal.

An Algorithm Theoretical Baseline Document (ATBD) has been created within the scientific consortium and first simulation results have been conducted (and the results are analyzed within the consortium). For this presentation we will focus on the status of the satellite and present the first results obtained from space.

How to cite: Dielacher, A., Moser-Moritsch, M., Hoermanseder, W., Semmling, M., Li, W., Zus, F., Moreno, M., Wickert, J., Cardellach, E., Nahavandchi, H., and Pirat, C.: PRETTY – First experience from a 3U CubeSat In-Orbit Demonstrator for GNSS-Reflectometry under grazing angle geometry, EGU General Assembly 2024, Vienna, Austria, 14–19 Apr 2024, EGU24-15444, https://doi.org/10.5194/egusphere-egu24-15444, 2024.

EGU24-16080 | ECS | Orals | G5.1

Performance assessment of GNSS radio occultation measurements from five missions over China  

Zhixiang Mo, Yidong Lou, Weixing Zhang, Yaozong Zhou, Peida Wu, and Zhenyi Zhang

Global Navigation Satellite System (GNSS) radio occultation (RO) is one of the most crucial observations in atmospheric and climate science. GNSS RO globally produces accurate and long-term stable vertical profiles for essential climate variables such as refractivity and temperature at high vertical resolution in all weather conditions. Currently, various RO satellite constellation programs have been developed by nations and companies, and the growing quantity of RO observations can contribute not only globally but also has the potential to benefit specific regions, such as China. To investigate the potential of RO observation in China, the performance of five operational RO measurements from COSMIC-2, MetOp-B/C, FY-3D/E, Spire and PlanetiQ on data coverage capabilities and quality are assessed by comparing with ERA5 and radiosonde over China. The results of data coverage showed that all RO missions can acquire extensive coverage over China with effective low-altitude penetration capability, whereas MetOp-B/C exhibits some gaps in local time coverage. The results of data quality confirmed that commercial Spire and PlanetiQ are comparable to those of national-led COSMIC-2, MetOp-B/C and FY3D/E, even though Spire exhibited a lower signal-to-noise ratio (SNR). The mean bending angle and refractivity relative differences of all RO measurements are within ±2.9% and ±1.5/0.9% (with respect to ERA5/radiosonde) in the altitude range of 5 to 35 km, respectively, and the corresponding relative standard deviations (SD) are less than 6% and 1.8/2.2%, respectively. Mean temperature and specific humidity differences of all RO measurements are within ±0.8/1.0 K and ± 0.7/1.0 g/kg, respectively, from the near surface to 15 km, with SD of less than 2.1/2.0 K and 1.8/1.7 g/kg. These results can help users further understand the strengths and weaknesses of these RO observations and indicate the significant application potential of numerous high-quality RO profiles from various RO measurements, which is anticipated to enhance numerical weather predictions for China.

How to cite: Mo, Z., Lou, Y., Zhang, W., Zhou, Y., Wu, P., and Zhang, Z.: Performance assessment of GNSS radio occultation measurements from five missions over China , EGU General Assembly 2024, Vienna, Austria, 14–19 Apr 2024, EGU24-16080, https://doi.org/10.5194/egusphere-egu24-16080, 2024.

EGU24-17013 | Posters on site | G5.1

Tropospheric Parameters Derived From Co-located Instrumentation at the Onsala Space Observatory 

Rüdiger Haas and Gunnar Elgered

Observations performed with ground-based space geodetic and remote sensing techniques are sensitive to the amount of water vapour in the neutral atmosphere. Corresponding parameters that describe the signal delay in the troposphere can be derived for example from the analysis of data collected from geodetic Very Long Baseline Interferometry (VLBI), Global Navigation Satellite System (GNSS), as well as microwave radiometers. The latter instruments are often referred to as water vapour radiometers (WVR).

The Onsala Space Observatory (OSO) operates a number of such instruments for VLBI, GNSS and WVR measurements, all co-located within about 600 m. Among these are the Onsala twin telescopes (OTT), two modern 13.2~m diameter radio telescopes performing observations in the VLBI Global Observing System (VGOS) of the International VLBI Service for Geodesy and Astrometry (IVS). The OTT are the first operational VGOS twin telescopes worldwide and are contributing with observations to the IVS since 2019. OSO also operates eight permanently installed GNSS stations, of which two are official stations in the International GNSS Service (IGS) network. Furthermore, OSO operates ground-based microwave radiometers, which are used for atmospheric research and perform continuous observations of the water vapour content in the neutral atmosphere. Data analysis of all three techniques, VLBI, GNSS and WVR, allows to derive information on the temporal and spatial variations of water vapour in the neutral atmosphere. Using co-located instrumentation within a few hundred metres distance thus offers a perfect opportunity for comparisons and assessments of the results.

We focus on data recorded at OSO during 2022 and compare the parameters describing the signal delay in the neutral atmosphere, i.e. the so-called equivalent zenith total delays and the linear horizontal delay gradients. The temporal resolution of the derived parameters is 15 min or less. Out of more than 40 VGOS experiments in 2022, each of a duration of 24 h, we have WVR data covering at least half of the session in all except one.  We have examples where the equivalent zenith wet delay only varies by 2--3 cm over an experiment during rather stable atmospheres.  When the atmosphere is more variable the zenith wet delay can vary by more than 10 cm over 24 h.

How to cite: Haas, R. and Elgered, G.: Tropospheric Parameters Derived From Co-located Instrumentation at the Onsala Space Observatory, EGU General Assembly 2024, Vienna, Austria, 14–19 Apr 2024, EGU24-17013, https://doi.org/10.5194/egusphere-egu24-17013, 2024.

EGU24-18019 | ECS | Posters on site | G5.1

Ionospheric Impact on GNSS Reflectometry: A correction approach for the PRETTY satellite data 

Mario Moreno, Maximilian Semmling, Georges Stienne, Mainul Hoque, and Jens Wickert

The ionosphere, spanning 60 to 2000 km above the Earth’s surface, plays a crucial role in Global Navigation Satellite System (GNSS) signal propagation, as signals traverse this layer on their path from the GNSS satellite to the receiver. In GNSS Reflectometry (GNSS-R), coherent observations are prominent in regions with smooth reflecting surfaces and grazing elevation angles (5° - 30°). However, within this elevation range, higher ionospheric effects (e.g., delay biases) are expected due to the longer path signals travel through the atmosphere.

Dual-frequency receivers can mitigate first-order ionospheric effects by using an ionosphere-free linear combination of code or carrier measurements. Single-frequency receivers, on the other hand, rely on a model to compensate for ionospheric refraction. In this study, the Neustrelitz Electron Density Model (NEDM2020) has been employed to estimate the slant total electron content (slant TEC) along the direct, incident, and reflected ray paths. The reflection events have been simulated using the orbit data from the Spire Global CubeSat constellation.

In preparation for the single-frequency GNSS-R ESA “PRETTY” mission data, this study conducts a comprehensive characterization of relative ionospheric delay, Doppler shift, and variations in the heights at which the maximum electron density is found along the ray paths. The investigation spans different elevation angle ranges, latitude-dependent regions, diurnal changes, and solar activity conditions. The results span a wide range of slant TEC values from 10 TECU between the reflection point and receiving satellite at moderate elevations (15°) to 300 TECU between transmitter and receiver (direct path) at very low elevations (5°). These results correspond to periods of low solar activity (March 2021). The ongoing study focuses on identifying and correcting the ionosphere impact in satellite data of the CyGNSS and PRETTY missions based on the developed simulation scheme.

How to cite: Moreno, M., Semmling, M., Stienne, G., Hoque, M., and Wickert, J.: Ionospheric Impact on GNSS Reflectometry: A correction approach for the PRETTY satellite data, EGU General Assembly 2024, Vienna, Austria, 14–19 Apr 2024, EGU24-18019, https://doi.org/10.5194/egusphere-egu24-18019, 2024.

EGU24-19978 | Posters on site | G5.1

Near real-time GNSS meteorology: a preliminary feasibility demonstration based on the variometric approach  

Alessandra Maria De Pace, Rachele Fratini, Augusto Mazzoni, and Mattia Crespi

The variometric approach has been demonstrated effective in GNSS seismology and GNSS ionospheric seismology to estimate ground shaking (VADASE) and earthquake/tsunami induced ionospheric disturbances (VARION) in real time for years. In this study the same variometric approach has been utilized to appraise the potential for real-time tracking of tropospheric delay (VARTROPO): this investigation holds significance for timely enhancements in weather forecasting, by incorporating this data into numerical weather models.
In contrast to the prevailing method of tracking tropospheric delay, which relies on employing a mapping function and estimating a singular zenith tropospheric delay (ZTD) for all satellites within a specific time interval, the proposed approach is based on the estimation of single-epoch variation of the slant tropospheric delay (VSTD) for individual satellite. The low-pass filtering process and the integration of this variation over time, starting from a known initial value of the STD, allows to estimate the STD in near (due to low-pass filtering) real time for each satellite. It is noteworthy that the proposed approach allows to highlight the azimuthal anisotropy of the troposphere, valuable during periods of intense weather fronts.
The preliminary research focuses on evaluating how the estimates derived from the proposed approach, in near real-time scenario, match with both the official ZTD estimates provided by CDDIS and those obtained through Precise Point Positioning (PPP) technique. In this respect, it has to be underlined that the assessment hereafter illustrated has been developed: (i) using 1-second rate GNSS data; (ii) in both terms of ZTDs and STDs, using a standard 1/sin(elevation) mapping function for conversion; (iii) with fixed position of the GNSS permanent station (only the receiver clock variation has been estimated in the variometric approach); (iv) without multipath mapping and removal. The first presented comparison is between VARTROPO and PPP (MATE station; satellite G03; 1st October 2023) (Figure 1).

Fig. 1

VARTROPO derived VSTD and VZTD exhibits higher noise level; therefore, to mitigate the highfrequency noise, a simple low-pass filter (moving median) with different moving windows (from 5 seconds to 2 minutes) has been applied. Then, the different low-pass filtered VZTDs have been integrated over time, starting from the ZTD at the initial epoch as derived from PPP, and compared to the ZTDs estimated by PPP (Figure 2).

 Fig2

The differences between the reconstructed VARTROPO ZTDs trends and the PPP ZTDs have been represented (Figure 3).

  Fig.3

The second comparison is between VARTROPO and CDDIS, to substantiate the aforementioned findings (Figures 4, 5).

     Fig4

 Fig5

In conclusion, it has been understood that simple moving medians are able to effectively low-pass filter the VARTROPO ZTDs: with 2-minute moving window the agreement with PPP ZTDs and CDDIS ZTDs are at within 1-2 millimeters, what preliminarily demonstrate that near real-time track of the tropospheric delay is feasible. Next research steps will involve: (i) enhancing the VSTDs estimates (e.g. with multipath mitigation); (ii) investigating the possibility to estimate troposphere azimuthal anisotropy in presence of weather fronts.

How to cite: De Pace, A. M., Fratini, R., Mazzoni, A., and Crespi, M.: Near real-time GNSS meteorology: a preliminary feasibility demonstration based on the variometric approach , EGU General Assembly 2024, Vienna, Austria, 14–19 Apr 2024, EGU24-19978, https://doi.org/10.5194/egusphere-egu24-19978, 2024.

EGU24-20132 | Orals | G5.1

On the contribution of InSAR Meteorology to a Digital Twin Of The Atmosphere 

Giovanni Nico, Pedro Mateus, and Joao Catalao

In this work, we discuss the potential and perspective use of InSAR meteorology within the Destination Earth (DestineE) initiative. The joined use of high-resolution Numerical Weather Models (NWM),such as the Weather Research and Forecasting (WRF) model, and the next large availability and redundancy of C- and L-band interferometric SAR missions (besides the current Sentinel-1 A&B and SAOCOM missions and the next Sentinel-1 C&D, N.G., ROSE-L, ALOS-4, NISAR), provides an example of the digital model of Earth that could support the complex task of anticipating extreme weather events.

There are two main approaches of applied mathematics to digitalization: Physics-Based and Data Driven. Physics-based models (PBMs) can give useful information on the processes to be described without the need for huge datasets, a first idea of what variables shall be monitored and provide a means for generalization.

Data-driven approaches imply the use of methods from Machine Learning or even Deep Learning to "learn from data collected by sensors". Artificial Intelligence (AI) tools need very high amounts and can be used to find hidden patterns in the data. Such a pattern can be refined whenever new data are collected. NWMs are an example of a physics-based Digital Twin.

We focus on using WRF and InSAR meteorology to continuously update the Digital Twins of the atmosphere. The data lake consists of Sentinel-1 data (high-resolution PWV maps), the output variables of the ERA5 model. The digital twin engine consists of the 3D-Var assimilation of Sentinel-1 PWV maps, which provide a numerical tool to generate replicas of the NWM (e.g., WRF, AROME, COSMO). We want to demonstrate that it is possible to get: 1) Hints to change/modify the assumptions of NWMs; 2) Hints to reduce the extension of approximations; 3) Extend the limits of applications of WRF to better predict extreme weather events.

How to cite: Nico, G., Mateus, P., and Catalao, J.: On the contribution of InSAR Meteorology to a Digital Twin Of The Atmosphere, EGU General Assembly 2024, Vienna, Austria, 14–19 Apr 2024, EGU24-20132, https://doi.org/10.5194/egusphere-egu24-20132, 2024.

EGU24-21040 | Posters on site | G5.1

New Developments in Near Real-Time GNSS Zenith Total Delay Estimates at the University of Luxembourg 

Addisu Hunegnaw, Norma Teferle, and Jonathan Jones

Recently, the University of Luxembourg (UL), in collaboration with the United Kingdom Met Office, has started providing accurate near real-time (NRT) Zenith Total Delays (ZTDs) from networks of GNSS ground stations. This initiative is in alignment with the operational meteorological products from various analysis centers available at the EUMETNET EIG GNSS Water Vapour Programme (E-GVAP) and the team in Luxembourg envisages to re-start its contributions in the near future. Active in Europe, E-GVAP coordinates NRT GNSS-based atmospheric content monitoring to support Numerical Weather Prediction (NWP) modelling with products that are crucial for mesoscale models throughout Europe, for example, for the Met Office. GNSS technology is essential for accurately measuring atmospheric parameters such as ZTD and Integrated Water Vapor (IWV) at high frequencies, regardless of weather conditions. In addition, GNSS data are low-cost when compared to conventional meteorological systems. Ensuring the NRT availability of these data for NWP assimilation systems requires numerous methods in GNSS data handling and processing, quality assurance, and distribution.  The study details the collaborative work between the UK Met Office and the University of Luxembourg in providing accurate and rapidly available meteorological data through GNSS technology. This collaboration has led to the development and update of various systems for the processing of GNSS observations to produce advanced NRT ZTD products at UL and the Met Office. These products are generated at 1-hour intervals on both global and regional scales, and at sub-hourly intervals regionally. This study primarily aims to provide a thorough review and accuracy assessment of NRT ZTD products from the UL, comparing their precision with benchmark data from both post-processed and NRT ZTD estimates from various EGVAP analysis centres. The NRT GNSS processing systems at UL use the Bernese GNSS Software (BSW) versions 5.2 and 5.4 with a double-differencing (DD) approach, and similarly, the post-processed benchmark ZTD estimates employs the DD positioning strategy using the same software packages.

How to cite: Hunegnaw, A., Teferle, N., and Jones, J.: New Developments in Near Real-Time GNSS Zenith Total Delay Estimates at the University of Luxembourg, EGU General Assembly 2024, Vienna, Austria, 14–19 Apr 2024, EGU24-21040, https://doi.org/10.5194/egusphere-egu24-21040, 2024.

EGU24-22538 | Posters on site | G5.1

Climate trends derived from long-term ground-based GNSS-derived Zenith Total Delay (ZTD) 

Marcelo C. Santos, Kyriakos Balidakis, Anna Kloss, Rosa Pacione, and Jordan Rees

We present findings from an ongoing investigation into the evaluation of long-term trends in ground-based GNSS-derived Zenith Total Delay (ZTD) for potential integration into climate models, either for assimilation or validation purposes. Our analysis focuses on ZTD time series obtained from six REPRO3 IGS Analysis Centers (ACs) – COD, ESA, GFZ, GRG, JPL, and TUG – spanning 20 years or more. Thirty stations from the IGS global network were selected for this study. The ZTD time series underwent a homogenization process, utilizing ERA-5 derived ZTDs as a reference, followed by daily value averaging to minimize potential discrepancies arising from diverse estimation strategies employed by individual ACs. Similar averaging procedures were applied to ERA-5 ZTDs and the IGS tropo-product if already reprocessed in REPRO3. Two combinations, employing weighted mean and a robust least median of squares, were generated from the six homogenized ACs, serving as quality control measures for each AC. Analysis of trends in each of the nine ZTD time series was conducted in both time and frequency domains, revealing geographical variations in results. For instance, at station ALBH in Canada, the inter-AC scatter was 0.47 mm/decade for trends, 0.11 mm for annual amplitudes, and 0.29 degrees for annual phases.

How to cite: C. Santos, M., Balidakis, K., Kloss, A., Pacione, R., and Rees, J.: Climate trends derived from long-term ground-based GNSS-derived Zenith Total Delay (ZTD), EGU General Assembly 2024, Vienna, Austria, 14–19 Apr 2024, EGU24-22538, https://doi.org/10.5194/egusphere-egu24-22538, 2024.

EGU24-2034 | ECS | Posters on site | ITS1.12/AS5.15

Probabilistic Wind Speed Downscaling for Future Wind Power Assessment 

Nina Effenberger, Marvin Pförtner, Philipp Hennig, and Nicole Ludwig

Wind power and other renewable energy sources are essential for the energy supply. However, due to their dependence on both climate and highly local, variable weather conditions, they are less reliable and challenging to forecast.

Recent projections of climate models indicate that the mean annual energy density will change in the future [Pryor et al., 2020]. To avoid costly planning mistakes and improve return on investment, predictions of wind conditions with adequate spatial and temporal resolution are thus indispensable, to facilitate efficient planning of renewables. Recent research regarding the temporal resolution of wind speed data shows that inter-daily wind speed variability can be accounted for by instantaneous data of six-hourly resolution [Effenberger et al., 2024]. However, as wind is a very local phenomenon, the spatial resolution of climate and weather data is paramount in wind power forecasting.

Simulated climate data generally lacks the spatial resolution needed for highly localized wind power forecasts and needs to be downscaled. The downscaled data is subject to mainly two types of predictive uncertainty that are often ignored, yet non-negligible for decision-making. Firstly, climate projections depend on unknown physical processes, like the evolution of atmospheric CO2 concentration, and are thus inherently uncertain. We account for this uncertainty by ensembling across different climate models and scenarios. The second source of uncertainty, which is the main focus of this work, is that the coarse resolution of the simulated data introduces additional uncertainty, since interpolating wind speeds spatially is non-trivial. By downscaling different wind speed projections using a probabilistic Gaussian process simulation method, we can model the uncertainty that stems from interpolating wind speed data to unseen locations. Leveraging techniques from physics-informed machine learning, e.g. conditioning on partial differential equations [Pförtner et al., 2022], allows for a more realistic model, consistent with the actual dynamics of the atmosphere.

The resulting, physics-informed Gaussian process models, provide uncertainty-aware, location-specific wind speed predictions on multi-decadal scales. When planning new turbine locations, these wind speed projections based on climate model data can serve as a proxy for expected future wind power generation.

References:

Effenberger, N., Ludwig, N., and White, R. H. (2024). Mind the (spectral) gap: how the temporal resolution of wind data affects multi-decadal wind power forecasts. Environmental Research Letters, 19.
Pförtner, M., Steinwart, I., Hennig, P., and Wenger, J. (2022). Physics-informed Gaussian process regression generalizes linear PDE solvers. arXiv preprint arXiv:2212.12474.
Pryor, S. C., Barthelmie, R. J., Bukovsky, M. S., Leung, L. R., and Sakaguchi, K. (2020). Climate change impacts on wind power generation. Nature Reviews Earth & Environment, 1(12):627–643.


How to cite: Effenberger, N., Pförtner, M., Hennig, P., and Ludwig, N.: Probabilistic Wind Speed Downscaling for Future Wind Power Assessment, EGU General Assembly 2024, Vienna, Austria, 14–19 Apr 2024, EGU24-2034, https://doi.org/10.5194/egusphere-egu24-2034, 2024.

EGU24-2693 | Orals | ITS1.12/AS5.15

HRGEN: A stochastic generator of hourly rainfall 

Wenting Wang, Shuiqing Yin, and Bofu Yu

Rainfall data are needed as input to drive hydrological and soil erosion models. Daily rainfall data are commonly used and widely accessible, whether sourced from meteorological observations or simulated by Global Climate Models (GCMs). However, daily data cannot capture intensity variations during a storm event, and may not be sufficient to capture the changes during extreme weather events under climate change scenarios. Weather generators (WGs) are statistical models that can generate random sequences of meteorological variables that exhibit statistical characteristics that are similar to observations. However, the low accuracy of generated sub-daily rainfall intensities motivated this study to stochastically disaggregate daily precipitation total at hourly intervals so that observed or GCM generated daily rainfall can be downscaled into hourly scale stochastically. To achieve this, we developed a model, HRGEN, based on long-term hourly precipitation data from 1971 to 2020 from 2405 meteorological stations across mainland China. The major improvement of this model over CLIGEN includes: (1) HRGEN significantly enhances the simulation accuracy of maximum peak intensities on an hourly basis (Hmax). The average Hmax over 2405 stations of hourly observations and HRGEN-generated are 4.0 mm h-1 and 4.2 mm h-1, respectively, while that generated by CLImate GENerator (CLIGEN) is 6.5 mm h-1. The mean absolute relative error (MARE) over 2405 stations is 8.2%. This improvement is critical for accurately estimating daily EI30 values, a key index in soil erosion models and soil loss prediction; (2) HRGEN preserves the relationship between total daily precipitation and storm duration and peak intensity; (3) The model has only six parameters, markedly simplifying the calibration and simulation processes. The HRGEN-simulated hourly rainfall data can be used to estimate rainfall erosivity for erosion prediction. The R-factor estimated using HRGEN-generated hourly data agrees well with the observed R-factor values, with a high Nash-Sutcliffe efficiency coefficient (NSE) of 0.92. The average R-factor estimated from hourly observations and HRGEN-generated hourly observations over 2405 stations are 3699.2 and 3720.7 MJ mm ha-1 h-1 a-1, respectively. In comparison, R-factor estimated by CLIGEN-generated rainfall is 9100.7 MJ mm ha-1 h-1 a-1. This study highlights HRGEN’s potential as a robust tool for stochastic generation of sub-daily rainfall as input to hydrologic and soil erosion models.

How to cite: Wang, W., Yin, S., and Yu, B.: HRGEN: A stochastic generator of hourly rainfall, EGU General Assembly 2024, Vienna, Austria, 14–19 Apr 2024, EGU24-2693, https://doi.org/10.5194/egusphere-egu24-2693, 2024.

EGU24-3205 | ECS | Posters on site | ITS1.12/AS5.15

A data fusion uncertainty-enabled method to map street-scale hourly NO2: a case study in Barcelona 

Alvaro Criado, Jan Mateu Armengol, Hervé Petetin, Daniel Rodríguez-Rey, Jaime Benavides, Cristina Carnerero, Marc Guevara, Carlos Pérez García-Pando, Albert Soret, and Oriol Jorba

Considering that air pollution is the leading global environmental risk factor according to the WHO,  characterizing NO2 levels holds crucial significance, particularly in heavily trafficked urban areas where NO2 legal limits and health guidelines are frequently exceeded. Obtaining accurate and comprehensive NO2 datasets on a city level is especially challenging due to the inherent uncertainties associated with urban air quality models, and the scarcity of air quality monitoring stations. An alternative method to describe NO2 levels involves developing short-term experimental campaigns using indicative measurements, although they report period-averaged results and do not have full spatial coverage. 

Taking advantage of the three mentioned approaches,  this work proposes a data-fusion method that combines i) near-real-time hourly observations obtained from the official air quality monitoring network, ii) the output of an urban air quality model (CALIOPE-Urban) that operates at high spatial (up to 20m x 20m) and temporal (hourly) resolutions, and iii) a microscale Land-Use-Regression (LUR) model based on machine learning. The microscale-LUR model includes different urban datasets such as traffic flow or average building density and two NO2 experimental campaigns. 

While the hourly observations enable the temporal variability adjustment in the dispersion model, the microscale-LUR model provides additional insights into the spatial characteristics of NO2 distribution. Our data-fusion approach was implemented on an hourly basis over the metropolitan area of Barcelona in 2019. Besides the bias-corrected NO2 hourly maps, this method also computes the uncertainty associated with the variance of the estimated error during the correction process. By integrating both corrected NO2 values and their associated uncertainty, it produces maps that show the probability of exceeding the hourly 200 µg/m3 and the annual 40 µg/m3 NO2 legal thresholds over Barcelona. 

Cross-validated results at the monitoring stations demonstrate that the spatial bias correction increases the correlation coefficient (r) by +46 % and decreases the root mean square error (RMSE) by −48 %, compared to the model output. This research emphasizes the importance of highly detailed spatial data within data-fusion techniques, enhancing the accuracy of predicting exceedances at the street level.

How to cite: Criado, A., Mateu Armengol, J., Petetin, H., Rodríguez-Rey, D., Benavides, J., Carnerero, C., Guevara, M., Pérez García-Pando, C., Soret, A., and Jorba, O.: A data fusion uncertainty-enabled method to map street-scale hourly NO2: a case study in Barcelona, EGU General Assembly 2024, Vienna, Austria, 14–19 Apr 2024, EGU24-3205, https://doi.org/10.5194/egusphere-egu24-3205, 2024.

EGU24-3540 | ECS | Posters virtual | ITS1.12/AS5.15

Testing the use of deep learning techniques for emulating regional reanalysis 

Antonio Pérez, Mario Santa Cruz, Javier Diez-Sierra, Matthew Chantry, András Horányi, Mariana Clare, and Cornel Soci

Reanalysis datasets serve as essential components for contemporary climate monitoring, integrating historical weather observations with predictive models to create extensive climate data records for the last decades. The fifth generation ECMWF atmospheric global climate reanalysis (ERA5) dataset from the European Centre for Medium-Range Weather Forecasts (ECMWF) represents the latest update, providing a broad temporal scope and improved spatial granularity. However, its resolution may fall short for detailed local-scale analysis required in critical sectors such as agriculture, energy, and disaster response, among others. Even though more detailed regional information for Europe like the Copernicus European Regional ReAnalysis (CERRA) do exist, its high computational costs and the lack of very near real-time data updates create limitations to conducting analyses close to real time.

To solve some of these limitations, a deep learning model has been developed to mirror CERRA's 2m temperature field utilising ERA5 as input. This approach aims to replicate the details of CERRA, ensuring rapid and efficient emulation without surpassing its original quality, i.e. treating CERRA as the ground truth. Central to this model is the Swin2SRModel component (Swin v2), which has effectively demonstrated the ability to downscale the resolution of inputs by a factor of 8. This capability aligns well with the intended task of downscaling the grid from 0.25º (ERA5) to 0.05º (CERRA). To achieve this, a Convolutional Neural Network (CNN) pre-processes the data, reshaping it to the necessary feature map size. The model training is focused on the specific region of interest of the Iberian Peninsula, instead of the entire European CERRA domain. The training, lasting 100 epochs, takes approximately 3.6 days using small batch processing. It employs the Adam optimizer, starting with a learning rate of 0.0001 that decreases following a cosine curve, integrating a warm-up phase to mitigate training instability. It utilises 32 years of data, spanning from 1985 to 2016, and its performance is validated against the independent dataset of 2017 to 2021.

A comprehensive post-training evaluation of the model shows a marked improvement – 35% reduction in Mean Absolute Error (MAE) and a nearly 30% enhancement in Root Mean Square Error (RMSE) – compared to the bicubic interpolation method. This leap in accuracy is especially notable in complex landscapes. Validation on specific locations, such as the Aneto mountain, have demonstrated a dramatic refinement in the mean error, dropping from -6.3°C to 0.06°C – 99% improvement. Similar improvements have been observed in Cantabrian Mountains such as Peña Vieja (94%) and Peña Labra (88%), illustrating the model's superior performance in areas where previous errors were substantial, highlighting its ability in areas that most require it.

In conclusion, the project shows promising results in enhancing reanalysis data with AI, demonstrating potential in both computational efficiency and near real-time application. While initial results are encouraging, indicating reduced errors compared to the bicubic interpolation, comprehensive validation against CERRA using independent observations and expansion to broader domains and variables remain crucial for confirming the method's effectiveness and reliability.

How to cite: Pérez, A., Santa Cruz, M., Diez-Sierra, J., Chantry, M., Horányi, A., Clare, M., and Soci, C.: Testing the use of deep learning techniques for emulating regional reanalysis, EGU General Assembly 2024, Vienna, Austria, 14–19 Apr 2024, EGU24-3540, https://doi.org/10.5194/egusphere-egu24-3540, 2024.

EGU24-4810 | Orals | ITS1.12/AS5.15

Dynamical Downscaling Simulation of Asian Climate with a Bias-Corrected CMIP6 Dataset: Evaluation  

Zhongfeng Xu, Ying Han, Meng-Zhuo Zhang, Chi-Yung Tam, Zong-Liang Yang, Ahmed EL Kenawy, and Congbin Fu

    In this study, we aim to assess the impacts of GCM bias correction on dynamical downscaling simulation over the Asia-western North Pacific region. Three simulations were conducted with a 25-km grid spacing for the period 1980–2014. The first simulation (WRF_ERA5) was driven by the European Centre for Medium-Range Weather Forecasts Reanalysis 5 (ERA5) dataset and served as the validation dataset. The original GCM dataset (MPI-ESM1-2-HR model) was used to drive the second simulation (WRF_GCM), while the third simulation (WRF_GCMbc) was driven by the bias-corrected GCM dataset. The bias-corrected GCM data has an ERA5-based mean and interannual variance but the long-term trends are derived from the ensemble mean of 18 CMIP6 models. Results demonstrate that the WRF_GCMbc significantly reduced the root-mean-square errors (RMSEs) of the climatological mean of downscaled variables, including temperature, precipitation, snow, wind, relative humidity, and planetary boundary layer height by 50%–90% compared to the WRF_GCM. Similarly, the RMSEs of interannual-to-interdecadal variances of downscaled variables were reduced by 30%–60%. Furthermore, the WRF_GCMbc better captured the annual cycle of the monsoon circulation and intraseasonal and day-to-day variabilities. The leading empirical orthogonal function (EOF) shows a monopole precipitation mode in the WRF_GCM. In contrast, the WRF_GCMbc successfully reproduced the observed tri-pole mode of summer precipitation over eastern China. This improvement could be attributed to a better-simulated location of the western North Pacific subtropical high in the WRF_GCMbc after GCM bias correction.

How to cite: Xu, Z., Han, Y., Zhang, M.-Z., Tam, C.-Y., Yang, Z.-L., EL Kenawy, A., and Fu, C.: Dynamical Downscaling Simulation of Asian Climate with a Bias-Corrected CMIP6 Dataset: Evaluation , EGU General Assembly 2024, Vienna, Austria, 14–19 Apr 2024, EGU24-4810, https://doi.org/10.5194/egusphere-egu24-4810, 2024.

EGU24-5980 | ECS | Posters on site | ITS1.12/AS5.15

Benchmarking Deep Learning based Downscaling of Wind Speed 

Luca Schmidt and Nicole Ludwig

The efficient placement of wind turbines relies on strategic assessment of local wind speed. Recent
studies highlight the crucial role of spatial resolution in accurately forecasting wind speed and
estimating the associated wind energy potential [1].

However, climate models typically fail to provide the spatial data resolution necessary for precise
energy resource assessment. To address this challenge, various downscaling methods have been
proposed to infer high-resolution data from coarser resolution data. Notably, image super-resolution
methods, a class of image processing techniques originally developed in computer vision to enhance
the resolution of natural images, have emerged as a promising approach for statistical downscaling.
By interpreting gridded data as images, these techniques are amenable to increasing the spatial resolution
of climate [3] and weather data [2].

We provide a comprehensive benchmark to compare the performance of various state-of-the-art image
superresolution models on weather data, such as ERA5 reanalysis data. The benchmark ranges from
interpolation baselines to all prominent deep learning based models, including a CNN-based model,
an attention-based model and a spatio-temporal model.


[1] Jung, C. and Schindler, D. [2022], ‘On the influence of wind speed model resolution on the global technical
wind energy potential’, Renewable and Sustainable Energy Reviews 156, 112001.
[2] Kurinchi-Vendhan, R., Lütjens, B., Gupta, R., Werner, L. and Newman, D. [2021], ‘Wisosuper: Bench-
marking super-resolution methods on wind and solar data’, arXiv preprint arXiv:2109.08770 .
[3] Stengel, K., Glaws, A., Hettinger, D. and King, R. N. [2020], ‘Adversarial super-resolution of climatological
wind and solar data’, Proceedings of the National Academy of Sciences 117(29), 16805–16815.


How to cite: Schmidt, L. and Ludwig, N.: Benchmarking Deep Learning based Downscaling of Wind Speed, EGU General Assembly 2024, Vienna, Austria, 14–19 Apr 2024, EGU24-5980, https://doi.org/10.5194/egusphere-egu24-5980, 2024.

Global climate models (GCMs) or Earth system models (ESMs) exhibit biases, with resolutions too coarse to capture local variability for fine-scale, reliable drought and climate impact assessment. However, conventional bias correction approaches may cause implausible climate change signals due to unrealistic representations of spatial and intervariable dependences. While purely data-driven deep learning has achieved significant progress in improving climate and earth system simulations and predictions, they cannot reliably learn the circumstances (e.g., extremes) that are largely unseen in historical climate but likely becoming more frequent in the future climate (i.e., climate non-stationarity).  This study shows an integrated trend-preserving deep learning approach can address the spatial and intervariable dependences and climate non-stationarity issues for downscaling and bias correcting GCMs/ESMs. Here we combine the super-resolution deep residual network (SRDRN) with the trend-preserving quantile delta mapping (QDM) to downscale and bias correct six primary climate variables at once (including daily precipitation, maximum temperature, minimum temperature, relative humidity, solar radiation, and wind speed) from five state-of-the-art GCMs/ESMs in the Coupled Model Intercomparison Project Phase 6 (CMIP6). We found that the SRDRN-QDM approach greatly reduced GCMs/ESMs biases in spatial and intervariable dependences while significantly better reducing biases in extremes compared to deep learning. The estimated drought based on the six bias-corrected and downscaled variables captured the observed drought intensity and frequency, which outperformed the state-of-the-art multivariate bias correction approach, demonstrating its capability for correcting GCMs/ESMs biases in spatial and multivariable dependences and extremes.

How to cite: Tian, D. and Wang, F.: Trend-Preserving Deep Learning for Multivariate Bias Correction and Downscaling of Climate Models, EGU General Assembly 2024, Vienna, Austria, 14–19 Apr 2024, EGU24-6408, https://doi.org/10.5194/egusphere-egu24-6408, 2024.

EGU24-7111 | ECS | Orals | ITS1.12/AS5.15

Revisiting Tabular Machine Learning and Sequential Models to Advance Climate Downscaling 

Sanaa Hobeichi, Yawen Shao, Neelesh Rampal, Matthias Bittner, and Gab Abramowitz

Recent advancements in the empirical downscaling of climate fields using Machine Learning have predominantly leveraged computer vision approaches. These methods treat a climate field as an image channel, applying image processing techniques to automatically extract features for the downscaling model from its latent space embeddings. In contrast, this work aims to revisit and validate the potential of tabular and sequential models in the context of grid-by-grid downscaling, where each grid cell in a map is individually downscaled and input features for the downscaling model are selected manually by a climate expert. We present downscaling results for precipitation and evapotranspiration using three distinct models: Long Short-Term Memory (LSTM), Multi-layer Perceptron (MLP), and a hybrid approach that combines Linear Regression with Random Forest. Our discussion includes the setup and optimization strategies for these models to enhance their ability to capture extremes. The merits of this grid-by-grid approach are highlighted, focusing not only on performance and effectiveness in preserving spatial features but also on its flexibility, spatial transferability, ease of model fine-tuning, and training efficiency.

How to cite: Hobeichi, S., Shao, Y., Rampal, N., Bittner, M., and Abramowitz, G.: Revisiting Tabular Machine Learning and Sequential Models to Advance Climate Downscaling, EGU General Assembly 2024, Vienna, Austria, 14–19 Apr 2024, EGU24-7111, https://doi.org/10.5194/egusphere-egu24-7111, 2024.

EGU24-8464 | ECS | Orals | ITS1.12/AS5.15

Machine Learning for Multivariate Downscaling: A Generative Model Inspired by Forecast Evaluation 

Maybritt Schillinger, Xinwei Shen, Maxim Samarin, and Nicolai Meinshausen

To complement computationally expensive regional climate model (RCM) simulations, machine learning methods can predict the high-resolution RCM data from low-resolution global climate model (GCM) input. Instead of merely targeting the conditional mean of the RCM field given the GCM data, more recent works are based on generative adversarial networks or diffusion models and aim to learn the full conditional distribution. In this spirit, we present a novel generative model that relies on statistical tools from forecast evaluation. The model can sample several plausible RCM realisations and enables assessing their variability. To achieve this goal, we use a simple neural network architecture that predicts Fourier coefficients of the high-resolution fields for multiple variables jointly (temperature, precipitation, solar radiation and wind). The loss function of our model is a proper scoring rule that measures the discrepancy between the model’s predictive distribution and the RCM’s true distribution. The score is minimised if both distributions agree. Our generative model is trained on multiple GCM-RCM combinations from the Euro-Cordex project. Furthermore, we show how the framework can be augmented to perform a bias-correction task: With a modified loss function, it is possible to generate data from the observational distribution, for example resembling gridded E-OBS data. To summarise, our work presents a machine learning method that allows us to generate multivariate high-resolution climate data, and can be extended flexibly to include further variables or downscale and bias-correct future projections.

How to cite: Schillinger, M., Shen, X., Samarin, M., and Meinshausen, N.: Machine Learning for Multivariate Downscaling: A Generative Model Inspired by Forecast Evaluation, EGU General Assembly 2024, Vienna, Austria, 14–19 Apr 2024, EGU24-8464, https://doi.org/10.5194/egusphere-egu24-8464, 2024.

EGU24-8821 | Orals | ITS1.12/AS5.15

Downscaling statistical information: a statistical approach 

Rasmus Benestad, Kajsa M. Parding, Abdelkader Mezghani, Andreas Dobler, Oskar A. Landgren, and Julia Lutz

If the shape of mathematical curves describing local weather statistics are systematically influenced by large-scale conditions and geographical factors, then it may be possible to downscale this kind of information directly. Such curves may include probability density functions (pdfs) for daily temperature/precipitation or intensity-duration-frequency (IDF) curves for estimating return values of intense sub-daily rainfall. Downscaling the shape of such curves may be referred to as ‘downscaling climate’ if we regard ‘local climate’ as the statistical description of various weather parameters. This approach is distinct from the more traditional approach ‘downscaling weather’, where one seeks to estimate particular local states for instance on a day-by-day basis. We present work on downscaling the shapes of pdfs and IDFs involving large multi-model ensembles for the application in climate change adaptation efforts. Our efforts also include an evaluation of both methodology and the global climate models' (GCMs) ability to reproduce observed large-scale climatic variability in terms of the salient spatio-temporal covariance structure. We emphasise that it’s important to combine different strategies for downscaling, e.g. regional climate models (RCMs) and empirical-statistical downscaling (ESD) that are based on different assumptions, for getting robust future regional climate projections.

How to cite: Benestad, R., Parding, K. M., Mezghani, A., Dobler, A., Landgren, O. A., and Lutz, J.: Downscaling statistical information: a statistical approach, EGU General Assembly 2024, Vienna, Austria, 14–19 Apr 2024, EGU24-8821, https://doi.org/10.5194/egusphere-egu24-8821, 2024.

EGU24-9083 | ECS | Orals | ITS1.12/AS5.15

A Novel Bias-Adjustment Methodology for Streaming Global Climate Models 

Ehsan Sharifi, Katherine Grayson, Sebastian Müller, and Stephan Thober

Projections generated by global climate models (GCMs) are increasingly utilized to inform climate adaptation policies. It is known that climate models simplify the real climate system, leading to biases between simulated and observed climates. The spatial and temporal resolution of GCMs is ever increasing to provide a better representation of the Earth system and in turn, also provide higher quality information for users. To effectively handle the substantial climate data produced by these models, which can reach Terabytes to Petabytes, the Destination Earth (DestinE) initiative is exploring data streaming—a new approach that enables user applications to run Earth system models in an end-to-end workflow directly downstream of the climate simulations, eliminating the need to store entire time-series of variables to disk.

Traditional methods for quantile or percentile calculation typically involve sorting the data and directly computing the specific value corresponding to the desired quantile. These methods can be computationally intensive, especially for large datasets, as it necessitates storing and processing the entire dataset. While traditional bias-adjustment (BA) algorithms rely on data being fully available, a further challenge lies in developing bias-adjustment procedures capable of accommodating streamed data on-the-fly. In the DestinE Climate Digital Twin (CDT), we extend the quantile-mapping technique used in the ISI-MIP project (isimip.org) because it is a well-established method and preserves the trend of the original data. The technique involves aligning the CDFs of the model data with those of the observed data by adjusting the model's cumulative distribution to match that of the observed data. The enhancements of the BA method in DestinE-CDT is making use of the T-Digest algorithm, a sophisticated strategy that dynamically clusters data points into small groups, which is used to generate a summarized representation of the data distribution from streamed data and accurately calculate percentiles. This clustering technique offers an accurate estimate of percentiles while efficiently managing large and unbounded data streams where new data points are continuously added.

We apply the developed quantile-mapping BA for different variables on a global scale and compare it with the parametric distribution functions used in quantile-mapping BA from the ISI-MIP project.

How to cite: Sharifi, E., Grayson, K., Müller, S., and Thober, S.: A Novel Bias-Adjustment Methodology for Streaming Global Climate Models, EGU General Assembly 2024, Vienna, Austria, 14–19 Apr 2024, EGU24-9083, https://doi.org/10.5194/egusphere-egu24-9083, 2024.

Downscaling techniques are one of the most prominent applications of Deep Learning (DL) in Earth System Modeling. A robust DL downscaling model can generate high-resolution fields from coarse-scale numerical model simulations, saving the timely and resourceful applications of regional/local models. Moreover, specific DL models can generate uncertainty information and provide ensemble-like pool scenarios, hardly achievable using traditional numerical simulations due to their high computational requirements. In this work, we present the application of deep generative models, namely a Generative Adversarial Network (GAN) and a Latent Diffusion model (LDCast, Leinonen et al., 2023), to perform the downscaling of ERA5 (Hersbach et al., 2018) data over Italy up to a resolution of 2km. The target high-resolution data used for training consists in the Italian high-resolution dynamical reanalyses obtained with COSMO-CLM (Raffa et al., 2021). The goal of the study is to show that recent advancements in generative modeling can learn to provide comparable results with numerical dynamical downscaling models, such as the COSMO-CLM model, given the same input data (i.e., ERA5 data), preserving the realism of fine-scale features and flow characteristics. The training and testing database is composed of hourly data from 2000 to 2020 (~184000 timestamps), and the target variables of the study are 2-m temperature and horizontal wind components. A selection of predictand variables from ERA5 is used as input to the DL models (e.g., 850hPa temperature, specific humidity, and wind). The generative models are compared with reference baselines, both DL-based (e.g., UNET) and statistical methods. Preliminary results are presented, highlighting the improvements introduced with this architecture with respect to the baselines. The results are evaluated by different quantitative verification scores: RMSE, predicted spectra, frequency distributions, and spatial distribution of errors. 

How to cite: Tomasi, E., Franch, G., and Cristoforetti, M.: Can AI be enabled to dynamical downscaling? Training Deep Generative Models to downscale ERA5 to high-resolution COSMO-CLM dynamical reanalyses over Italy , EGU General Assembly 2024, Vienna, Austria, 14–19 Apr 2024, EGU24-10091, https://doi.org/10.5194/egusphere-egu24-10091, 2024.

EGU24-10376 | ECS | Posters on site | ITS1.12/AS5.15

Spatial downscaling of climate projections of temperature and precipitation over complex mountain terrain: A case study in the north-eastern Italian Alps 

Michael Matiu, Anna Napoli, Dino Zardi, Alberto Bellin, and Bruno Majone

Mountain regions are particularly sensitive to climatic change. In these areas the complex topography modulates meteorological and climatic patterns with the elevation playing the strongest influence on temperature and precipitation. However, most regional climate models used in climate change assessments are too coarse to capture the relevant elevation gradients for impact studies, such as in hydrology, which require detailed spatial information on water availability, either in liquid or in solid state.

Focusing as a case study on Trentino-Alto Adige region in the north-eastern Italian Alps, we compare several statistical approaches for downscaling regional climate models to the spatial scale needed for impact studies in mountain areas. In particular, we propose a comparison between a novel method, based solely on climate model output using generalized additive models (GAM), and quantile mapping (QM) methods using an interpolated observational dataset as reference. We then evaluate and discuss the effectiveness of  downscaling approaches, relying on both spatial and temporal metrics and taking into account the possible elevation dependency.

Preliminary results show that the approach using GAMs offers spatial fields consistent with the large-scale climate model, while the QM methods have artificial breaks at grid cell boundaries. On the other hand, the GAM approach inherits the biases from the climate model, while QM also simultaneously performs bias adjustment using the observational dataset.

How to cite: Matiu, M., Napoli, A., Zardi, D., Bellin, A., and Majone, B.: Spatial downscaling of climate projections of temperature and precipitation over complex mountain terrain: A case study in the north-eastern Italian Alps, EGU General Assembly 2024, Vienna, Austria, 14–19 Apr 2024, EGU24-10376, https://doi.org/10.5194/egusphere-egu24-10376, 2024.

EGU24-11216 | ECS | Posters virtual | ITS1.12/AS5.15

Refining Regional Climate Projections for Louisiana and Mississippi: Dynamical Downscaling with WRF Model in the Face of Projected Sea Level Rise 

Zuhayr Shahid Ishmam, Paul Miller, Robert Rohli, and Rubayet Bin Mostafiz

Global climate models (GCMs) lack the necessary spatial resolution to accurately depict the atmospheric and land surface processes that define the regional climate of any particular location. In contrast, regional climate models (RCMs) explicitly capture the interactions between the broad-scale weather patterns simulated by global models and the specific characteristics of the local terrain. In this work, the Weather Research and Forecasting (WRF) model is used for dynamical downscaling simulations for a historical period (2001-2005) and the future (2095-2099) forced by the NCAR’s Community Earth System Model, version 1 (CESM1), for Louisiana and Mississippi, United States. The future RCM was run with both a present-day and future land-sea mask, considering model projections of sea level rise along the Gulf of Mexico coast. The convection-permitting, high-resolution (4 km) model performs more satisfactorily for temperature than rainfall when validated against observations from meteorological stations and gridded rainfall data. The future RCM runs demonstrate significant projected changes in average and extreme temperatures and rainfall from the current climate over the model domain. The probable retreat of the coastline shifts the sea breeze landward from its present-day area, which generates heavier rainfall and more moderate temperatures at places presently relatively distant from the Gulf of Mexico. This study enhances the existing dynamical downscaling methodology by incorporating the impacts of anticipated sea level rise on the regional climate.

How to cite: Ishmam, Z. S., Miller, P., Rohli, R., and Mostafiz, R. B.: Refining Regional Climate Projections for Louisiana and Mississippi: Dynamical Downscaling with WRF Model in the Face of Projected Sea Level Rise, EGU General Assembly 2024, Vienna, Austria, 14–19 Apr 2024, EGU24-11216, https://doi.org/10.5194/egusphere-egu24-11216, 2024.

EGU24-12144 | Posters on site | ITS1.12/AS5.15 | Highlight

Reconstruction of the atmosphere over the European Alps from 1850 to present using dynamical downscaling  

Madlene Pfeiffer, Ben Marzeion, and Inga Labuhn

The Alps are very sensitive to climate change and have experienced a strong increase in temperatures since the end of the Little Ice Age (1850 AD). This in turn influences the alpine glaciers, which are experiencing strong melting, further impacting geomorphological and hydrological processes in the high Alpine catchments. The combined change in climate and in prevalence of ice then has further impacts on erosional processes, biosphere, including local flora, and societies (e.g. by changes in the seasonal cycle of river runoff). In order to better understand small-scale processes, which are not well represented in climate observations and reanalysis products, as well as feedbacks and system interactions within the high Alpine Earth system, we have reconstructed atmospheric conditions over the European Alps from 1850 to present by dynamically downscaling global reanalysis data with the advanced research version of the Weather Research and Forecasting model (WRF-ARW) in a nested grid configuration with domains of 18-, 6-, and 2-km spatial resolution, respectively. To account for uncertainty introduced by the reanalysis, we have forced WRF with an ensemble of global reanalysis products. To quantify the errors, we compare our datasets to in-situ observations. In comparison to the reanalysis products that act as a forcing, we find an improvement in spatial correlation between the simulated and observed temperatures, as well as a better representation of precipitation patterns and amounts in the high-resolution domain. We present the first dynamically downscaled dataset over Europe (18 km), the entire Alps (6 km), and parts of central Alps (2 km), at high temporal resolution (3, 1, and 1 hour, respectively) that spans the entire period from 1850 to present.

How to cite: Pfeiffer, M., Marzeion, B., and Labuhn, I.: Reconstruction of the atmosphere over the European Alps from 1850 to present using dynamical downscaling , EGU General Assembly 2024, Vienna, Austria, 14–19 Apr 2024, EGU24-12144, https://doi.org/10.5194/egusphere-egu24-12144, 2024.

EGU24-12446 | Orals | ITS1.12/AS5.15

Evaluating CMIP6 models under different statistical downscaling methods for climate assessments in the north of Chile 

Catalina Jerez, Miguel Lagos-Zuñiga, and Santiago Montserrat

Statistical Downscaling Methods (SDMs) play a pivotal role in climate change assessments at local and regional scales, as they can efficiently reproduce historical climate observations, overcoming the limitation of Global Climate Models (GCMs) in capturing fine-scale climatic features. However, the evaluation of GCMs and SDMs often focuses on historical climatology, neglecting extreme events representation and climate change signal preservation. In response, this paper proposes a methodological guideline for GCMs and SDMs selection, incorporating three key criteria: representation of historical climatology (Past Performance Index - PPI), representation of extreme wet climate indices (Climate Integrated Impact Index - CI3), and preservation of climate signal change (Climate Signal Performance Criteria - SCPI). Satisfactory GCM and SDM performance during the historical period is defined by meeting conditions such as PPI ≥ 0.5 for each climatic variable (precipitation, minimum and maximum temperature) and CI3 ≥ 0.4. For future projections, SCPI guides the selection process, considering short (2015 – 2040), medium (2041 – 2070), and long-term (2071 – 2100) projections across different Shared Socioeconomic Pathways (SSPs) (see step d) in Figure 1).


The study evaluates 18 GCMs from Sixth Model Intercomparison Phase (CMIP6), interpolated to the gridded meteorological product CR2METv2.0 (0.05° x 0.05°) for the northern region of Chile (17ºS – 32º). Ten SDMs are applied to short, medium, and long-term periods under SSP2-4.5 and SSP5-8.5 scenarios. Results indicate that no single SDM corrects all criteria for all GCMs. Climate projection groups are established based on the number of criteria met, distinguishing models that satisfy two or three criteria. The historical evaluation shows that interannual variability is the most influential in the PPI results, both for precipitation and temperatures (min and max). Better historical performance is also observed for multivariate methods family over quantile mapping family or hybrid methods family (combination of analogs, resampling, climate fingerprinting and quantile mapping). In the case of CI3, all SDMs for all the GCMs show a similar bias for maximum precipitation magnitude and their mean temperature, meanwhile the consecutive wet days, days with precipitation over 50 mm and snow process indices present a bias of less than 10%. For this metric, no SDM family has a better performance over another SDM family. Finally, the preserving of climate signal change (for each SSP scenario and projection period) is not observed with the hybrid method. For quantile methods, we observed a tendency of modification of the signal climate change, and the multivariate methods has the best performance in these criteria. This proposed methodology facilitates the selection of GCM subsets based on study objectives (climatology, extreme events, or climate change signals). Future work should focus on advancing additional statistical downscaling methods capable of representing diverse criteria, including natural variability and climate change signals.

Figure 1. Methodological scheme for the selection of suitable GCMs and SDMs.

How to cite: Jerez, C., Lagos-Zuñiga, M., and Montserrat, S.: Evaluating CMIP6 models under different statistical downscaling methods for climate assessments in the north of Chile, EGU General Assembly 2024, Vienna, Austria, 14–19 Apr 2024, EGU24-12446, https://doi.org/10.5194/egusphere-egu24-12446, 2024.

EGU24-13235 | Orals | ITS1.12/AS5.15 | Highlight

A Process-Informed Determination of Credibility Across Different Downscaling Methods 

Melissa Bukovsky, Seth McGinnis, Rachel McCrary, and Linda Mearns

Despite the ongoing advancements in Earth system simulation, the results from Global Climate Models (GCMs) are still not refined enough to be directly applied to numerous climate impact issues. There are many techniques available to downscale GCM outputs to finer resolutions, from basic statistical adjustments to more complex methods like dynamical downscaling and machine learning. However, these methods often yield different results, making it difficult to assess their relative reliability, particularly when comparing statistical versus dynamical downscaling methods.

We consider downscaled results to be credible when the phenomena and processes producing it are consistent; for instance, if it’s raining, the necessary conditions for rain (such as lift and atmospheric moisture) should be present. To assess various downscaling techniques, and demonstrate this technique, we examine the occurrence of rainfall at a location the Southern Great Plains, specifically near the DOE ARRM site in Oklahoma during May, the rainiest month. In this scenario, we are looking for an atmospheric setup that produces uplift at this location and corresponds with the northward movement of moisture from the Gulf of Mexico.

By comparing the composite synoptic-scale meteorological conditions on days with and without rain from the GCM being downscaled or from the downscaling method, as appropriate, we can verify if the outcomes of downscaling GCM precipitation align with the processes that drive them. This method offers a process-based added-value analysis strategy for all kinds of downscaling techniques, which extends beyond basic measures of statistical resemblance.

We’ve used two regional climate models (RegCM4 & WRF), a machine learning technique (U-Net CNN), and four statistical methods of different complexities to downscale precipitation from three distinct GCMs. By using this method to compare them with each other and the raw GCM results, we’ve discovered that all downscaling methods can yield plausible outcomes when the GCM performs well, as they inherit its credibility. However, when the GCM’s performance is subpar, only dynamical methods can rectify regional circulation errors, unlike the other methods. Interestingly, we also found that simpler statistical methods outperform more complex non-dynamical methods when dealing with poor GCM inputs.

How to cite: Bukovsky, M., McGinnis, S., McCrary, R., and Mearns, L.: A Process-Informed Determination of Credibility Across Different Downscaling Methods, EGU General Assembly 2024, Vienna, Austria, 14–19 Apr 2024, EGU24-13235, https://doi.org/10.5194/egusphere-egu24-13235, 2024.

EGU24-14630 | ECS | Posters on site | ITS1.12/AS5.15

Machine learning-based downscaling of coarse resolution temperature and its application for potential frost identification over complex terrain. 

Sudheer Bhakare, Sara Dal Gesso, Marco Venturini, and Dino Zardi

The precise representation of spatial temperature is important for practical applications like agriculture where they require local information at very high resolution for managing agricultural activities. In recent times, statistical downscaling methods, specifically those utilizing machine learning methods are gaining importance due to their computational of time efficiency over dynamic downscaling.

This study focuses on enhancing the downscaling of spatial temperature over complex terrain using machine learning algorithms, particularly Random Forest (RF), Artificial Neural Networks (ANN), and Convolutional Neural Networks (CNN). The primary aim of this study is to identify the most promising machine learning model for downscaling gridded temperature at 2 meters from 9 km to 1 km over Non and Adige valleys. Additionally, we aim to apply these models for potential frost identification for the months of March, April, and May. We used static predictors such as Shutter Radar Topography Mission (SRTM) elevation which plays an important role in complex terrains to improve the performance of models. In addition to that, dynamic predictors such as zonal and meridional winds (U, V), windspeed, surface pressure (SP), etc. are used as auxiliary inputs. The study’s methodology includes training and evaluating the performance of three machine learning models using statistical metrics such as Root Mean Square Error (RMSE), Mean Absolute Error (MAE), R square (R2), and Mean Bias Error (MBE). Furthermore, we used other metrics such as recall, precision, and F1 score for assessing model performance for frost identification.

Our results show CNN models outperform other models across all the seasons with the best performance in summer (RMSE=1, MAE= 0.78, R2=0.94) and the least in winter (RMSE=1.3, MAE=1, R2=0.87).  All These models exhibit a consistent pattern of having good performance in summer and least in winter. The superiority of the CNN model can be attributed to its ability to capture spatial patterns in temperature data which makes it more reliable for complex terrains. Additionally, for frost identification, CNN models show better performance with the highest F1 score across March, April, and May.

How to cite: Bhakare, S., Dal Gesso, S., Venturini, M., and Zardi, D.: Machine learning-based downscaling of coarse resolution temperature and its application for potential frost identification over complex terrain., EGU General Assembly 2024, Vienna, Austria, 14–19 Apr 2024, EGU24-14630, https://doi.org/10.5194/egusphere-egu24-14630, 2024.

EGU24-15468 | ECS | Posters on site | ITS1.12/AS5.15

Spatio-temporal AI downscaling of ERA5-land precipitation estimates 

Luca Glawion, Julius Polz, Harald Kunstmann, Benjamin Fersch, and Christian Chwala

Generative deep learning models have been proven to have great potential for precipitation nowcasting and downscaling applications. spateGAN [1] is a conditional generative neural network that we initially developed for spatio-temporal superresolution of radar-rainfall in Germany. Here, we apply the model for downscaling of ERA5-land precipitation estimates and discuss the specific challenges that arise in such an application.


While ERA5 data are vital in climate science, their limited grid size and temporal resolution (1 hour and 0.1°, ERA5 global: 0.25°) hinder accurate representation of e.g. convective rainfall events. To address these limitations, we trained a physical constraint spateGAN to enhance the resolution of time sequences of ERA5 land precipitation patches towards the resolution of RADKLIM-YW, a high-resolution (5 minutes and 1 km) rain-gauge-adjusted radar product tailored for Germany which we used as a training target. Additionally, for comprehensive validation, we assessed the Multi-Radar/Multi-Sensor (MRMS) radar product for the United States. The downscaled rainfields produced by spateGAN exhibit coherent spatio-temporal patterns and an improved representation of extreme values. Employing an ensemble approach, by generating multiple high-resolution solutions by shifting model input patches both pixel- and timewise, further enhances the quality of the downscaling product, quantified by Continuous Ranked Probability Score (CRPS), ensemble Fractions Skill Score (FSS), and rank histograms. Furthermore, our analysis of downscaled MRMS data highlights spateGAN's applicability for global downscaling applications and beyond its original training region.


In summary, our findings show the feasibility of generating a global  high-resolution precipitation product based on ERA5. Such a product holds significant promise for various environmental applications, including in-depth analyses of rainfall variability on a fine-scaled global grid, impact assessments of extreme rainfall events, expanded possibilities for climate and hydrological model calibration and evaluation and as training data for AI weather forecasting models.


[1] Glawion, L., Polz, J., Kunstmann, H., Fersch, B., Chwala, C. (2023): spateGAN: Spatio-Temporal Downscaling of Rainfall Fields Using a cGAN Approach. Earth and Space Science. 10(10). e2023EA002906. https://doi.org/10.1029/2023EA002906.


How to cite: Glawion, L., Polz, J., Kunstmann, H., Fersch, B., and Chwala, C.: Spatio-temporal AI downscaling of ERA5-land precipitation estimates, EGU General Assembly 2024, Vienna, Austria, 14–19 Apr 2024, EGU24-15468, https://doi.org/10.5194/egusphere-egu24-15468, 2024.

Accurate downscaling of daily precipitation is crucial for hydrological and climate modeling, especially in regions with complex terrain and a lack of observational data. In such regions, climate reanalysis are not reliable and thus accurate downscaling is usually limited to those locations captured by a (discrete) network of in-situ measurements instead. For this reason, learning to downscale in ungauged locations, whilst maintaining the spatial structure of precipitation, is crucial to effectively downscale (gridded) climate simulations. 

This study introduces a Gaussian Process - Multi-Layer Perceptron (GP-MLP) latent variable model tailored for the probabilistic downscaling of daily precipitation in ungauged locations. By generating spatially coherent precipitation fields, this model addresses key challenges in regional climate impact assessments and water resource management.

The GP-MLP model consists of an MLP that performs non-linear regression, mapping a set of inputs to distributional parameters of a given probability distribution for each spatio-temporal locations, and we induce spatial correlation between locations with a latent variable modelled by a GP  We jointly learn the GP and MLP parameters using variational inference, which critically allows us to model non-Gaussian probability distributions. 

We test our approach in two geographically and climatologically diverse regions: the Swiss Alps and the Langtang Valley in Nepal. The Swiss Alps, with their complex terrain and relatively dense observational network, serve as an ideal region for the initial training of our model. In the Langtang Valley, a high-mountain region with limited ground-based observations, we employ a transfer learning strategy on the model pre-trained in the Swiss Alps. This process involves fine-tuning the model parameters to the unique climatic and topographical features of the Himalayas, thereby enhancing its performance in predicting daily precipitation in this data-sparse region.

Our preliminary findings demonstrate the model's strong capability in producing accurate and spatially coherent predictions of daily precipitation for ungauged locations. The probabilistic nature of the model's outputs is particularly valuable, providing not only predictions of daily precipitation but also quantifying the associated uncertainties - a crucial aspect for risk management in hydrology and agriculture in areas where the paucity of data has traditionally limited detailed climate impact analysis.

How to cite: Girona-Mata, M., Orr, A., and Turner, R. E.: Spatially-Coherent Probabilistic Downscaling of Daily Precipitation in Ungauged Mountain Locations: a Transfer Learning Study in the Swiss Alps and the Langtang Valley, Nepal., EGU General Assembly 2024, Vienna, Austria, 14–19 Apr 2024, EGU24-15911, https://doi.org/10.5194/egusphere-egu24-15911, 2024.

EGU24-16245 | ECS | Posters on site | ITS1.12/AS5.15

Stochastic simulation of high space-time resolution precipitation fields in Beijing 

Tinghui Li, Shuiqing Yin, Zeqi Li, Maoqing Wang, and Nadav Peleg

Precipitation is closely related to many earth surface processes, for some of them, such as urban flooding, high-resolution precipitation fields data are required. However, those high-resolution precipitation fields are often not available for a long enough period to be used for flood estimates. Stochastic models attempting to simulate precipitation at single or multiple sites face challenges in capturing the high spatial heterogeneity inherent in precipitation. We calibrated the Advanced WEather GENerator for a two-dimensional grid (AWE-GEN-2d) to simulate continuous 2-D precipitation fields and evaluated its performance based on CMA Multi-source merged Precipitation Analysis System Product (CMPAS) for the period from 2015 to 2020, with a spatial resolution of 0.01°×0.01° and a temporal resolution of hourly. Characteristics of spatiotemporal precipitation fields for 486 events were analyzed and monthly parameters in AWE-GEN-2d were obtained. AWE-GEN-2d was utilized to stochastically simulate hourly spatiotemporal precipitation fields at a resolution of 0.01°×0.01° for 30 years and its simulation accuracy was subsequently assessed by comparing with the observations. The results showed precipitation fields simulated by AWE-GEN-2d demonstrated consistency with the observed fields in terms of annual and monthly precipitation, the number and duration of precipitation events, and the average hourly precipitation intensity. For extreme hourly precipitation, the 95th and 99th percentiles of hourly precipitation were underestimated by 12.6% and 11.2%, respectively, compared to the observations. In terms of spatial pattern, we calculated the spatial autocorrelation function and spatial variation coefficient of the precipitation fields. The AWE-GEN-2d captured the general pattern but the spatial coefficient of variation was underestimated (spring to winter observations were 0.81, 1.16, 1.05, and 0.70; while the simulated were 0.57, 0.81, 0.74, and 0.49). The temporal autocorrelations were also underestimated, resulting in discontinuity jumps in rainfall centers. Future research work will focus on collecting sub-hourly observation interval data, such as 5 min or 10 min, and improve the simulation of the evolution of precipitation events, especially those with short durations and heavy intensities, which may bring high risks in urban flooding.

How to cite: Li, T., Yin, S., Li, Z., Wang, M., and Peleg, N.: Stochastic simulation of high space-time resolution precipitation fields in Beijing, EGU General Assembly 2024, Vienna, Austria, 14–19 Apr 2024, EGU24-16245, https://doi.org/10.5194/egusphere-egu24-16245, 2024.

EGU24-17936 | Orals | ITS1.12/AS5.15 | Highlight

An interactive climate atlas for northern Europe 

Kajsa Parding, Andreas Dobler, Rasmus Benestad, Julia Lutz, Abdelkader Mezghani, and Anita Verpe Dybdal

We present an interactive climate atlas providing visualisations of future regional climate projections of temperature and precipitation in northern Europe from multiple sources. It is based on results of both empirical-statistical and dynamical downscaling of multi-model ensembles from CMIP5 and CMIP6 including several emission scenarios. Displayed alongside each other, the projected climate change estimated from different model ensembles can be compared and contrasted. The comparison can be useful to evaluate the robustness of the climate change information and the influence of methodological choices such as the downscaling method and the selection of global climate models, and to explore how the level of greenhouse gas emissions may affect the future climate. The application is developed by researchers at the Norwegian Meteorological Institute and is freely available at the website futureclimate.met.no/dse4KSS.

How to cite: Parding, K., Dobler, A., Benestad, R., Lutz, J., Mezghani, A., and Dybdal, A. V.: An interactive climate atlas for northern Europe, EGU General Assembly 2024, Vienna, Austria, 14–19 Apr 2024, EGU24-17936, https://doi.org/10.5194/egusphere-egu24-17936, 2024.

Land Surface Temperature (LST) is crucial in many areas; but seamless LST data are difficult to obtain due to limitations in thermal infrared sensor technologies. Numerical modeling, which is based on physics-driven process, can simulate continuous spatial and temporal data. Simultaneously, machine learning, a typical data-driven approach, has been effective in remotely-sensed data reconstruction. In this study, we designed a fusion framework that combines the strengths of numerical modeling and machine learning. The framework includes the following steps: 1) Optimization of the numerical model: We use the urbanized High-Resolution Land Data Assimilation System (u-HRLDAS) model. Various spatio-temporal data sources are used to refine and optimize the model's simulations. 2) Database creation for LST reconstruction: This database incorporates forcing variables like 2-meter temperature, relative humidity, air pressure, wind speed, downward longwave and shortwave radiation for the u-HRLDAS model, along with the model's simulated LST outputs. Additional remotely-sensed data such as the Digital Elevation Model (DEM), Normalized Difference Vegetation Index (NDVI), latitude, longitude, land use and cover, and slope are also included. The datasets span the summer months (June to August) from 2011 to 2014. Daily LST data from MOD11A1 and MYD11A1 are used as label data. 3) Optimal model identification via automatic machine learning framework: The MODIS LST data in the database serves as training labels, with a 70/30 split for training and validation. Evaluation metrics like RMSE, MAE, and R² guide the selection. We chose the AutoGluon-Tabular framework, developed by Amazon, for its superior performance, which is achieved through bagging and stacking methods.  Finally, the 1-km seamless LST is reconstructed based on the model with the highest accuracy in validation.

Taking Xi’an city in China as the study region, nine models (Weightensemble_L2, LightGBMLarge, XGBoost, LightGBM, CatBoost, LightGBM, ExtraTree, NeuralNetTorch, and NeuralNetFastAI) were trained within the Autogluon-Tabular framework. These models displayed RMSE values ranging from 0.737 to 1.417 K, MAE spanning 0.522 to 1.031 K, and R² from 0.967 to 0.991. Notably, the Weightedensemble_L2 model excelled, with the lowest RMSE (0.737) and MAE (0.522), and the highest R² (0.991), closely followed by the LightBGMlarge model. with RMSE, MAE, and R² values of 0.739, 0.526, and 0.991, respectively. Furthermore, we conducted supplementary testing using four reserved MODIS LST images. Employing the previously trained WeightedEnsemble_L2 model, seamless predictions of MODIS LST were generated at four overpass timestamps: 02:30, 05:30, 14:30, and 17:30. The resulting spatial distributions is similar with the observed LST, validating our method's capability to capture LST's spatial characteristics and ensure spatial continuity compared to the original MODIS LST data.

In conclusion, the proposed fusion framework which integrates numerical modeling and automatic machine learning, successfully reconstructed LST with high accuracy and strong spatial similarities. There are still shortcomings of this method, such as the predicted images losing some spatial details compared to the observations, which need to be improved in the future.

How to cite: Yumin, L., Meiling, G., and Zhenhong, L.: Retrieving gapless 1-km land surface temperature based on numerical model and auto machine learning approach, EGU General Assembly 2024, Vienna, Austria, 14–19 Apr 2024, EGU24-18741, https://doi.org/10.5194/egusphere-egu24-18741, 2024.

EGU24-19266 | ECS | Posters on site | ITS1.12/AS5.15

Application of novel generative diffusion models to precipitation downscaling 

Alex Saoulis, Sebastian Moraga, Natalie Lord, Peter Uhe, and Nans Addor

Machine Learning (ML) is playing an increasingly valuable role in statistical downscaling. Capable of leveraging complex, non-linear relationships latent in the training data, the community has demonstrated significant potential for ML to learn a downscaling mapping. Following the perfect-prognosis (PP) approach, ML models can be trained on historical reanalysis data to learn a relationship between coarse predictors and higher resolution (i.e. downscaled) predictands. Once trained, the models can then be evaluated on general circulation model (GCM) outputs to generate regional downscaled results. Due to the relatively low computational cost of training and utilising these models, they can be used to efficiently downscale large ensembles of climate models over regional to global domains.

This work employs a novel diffusion algorithm to downscale climate data. Diffusion models have proven highly successful in applications such as natural image generation and super-resolution (the natural image analogue to climate downscaling). Diffusion models have been shown to significantly outperform earlier generative ML models such as Generative Adversarial Networks (GANs) and Variational Autoencoders (VAEs); they can produce highly diverse samples, emulate fine details with high fidelity, and exhibit much more stable training than alternative ML models. 

This work trains and evaluates diffusion models on the Multi-Source Weighted-Ensemble Precipitation (MSWEP) observational dataset over the Colorado River Basin (USA). High resolution (10km x 10km) MSWEP fields are artificially coarsened to generate training data. Once trained, the models are applied to bias-corrected climate model outputs to evaluate their ability to generate realistic downscaled precipitation fields. Performance is compared with several benchmarks, including classical regression techniques as well as alternative ML models.

How to cite: Saoulis, A., Moraga, S., Lord, N., Uhe, P., and Addor, N.: Application of novel generative diffusion models to precipitation downscaling, EGU General Assembly 2024, Vienna, Austria, 14–19 Apr 2024, EGU24-19266, https://doi.org/10.5194/egusphere-egu24-19266, 2024.

EGU24-19303 | Orals | ITS1.12/AS5.15 | Highlight

NASA Earth Exchange Global Daily Downscaled Projections (NEX-GDDP-CMIP6) 

Bridget Thrasher, Weile Wang, Andrew Michaelis, Ian Brosnan, and Sepideh Khajehei

The NASA Earth Exchange Global Daily Downscaled Projections CMIP6 archive (NEX-GDDP-CMIP6) contains daily climate projections of nine variables derived from thirty-five CMIP6 GCMs and four SSP scenarios (SSP2-4.5, SSP5-8.5, SSP1-2.6 and SSP3-7.0) for the period 2015-2100. Each of these climate projections was downscaled to a spatial resolution of 0.25 degrees x 0.25 degrees using the daily version of the BCSD statistical downscaling method. The purpose of this archive is to provide a set of global, high-resolution, bias-corrected climate change projections that can be used to evaluate climate change impacts on processes that are sensitive to finer-scale climate gradients and the effects of local topography on climate conditions. In this session, we will provide an overview of the methodology, as well as the details of its execution on the NASA Advanced Supercomputing (NAS) facility. In addition, we will discuss the various considerations, assumptions, and limitations of the downscaled data. Lastly, we will illustrate the various modes of accessing the archive, including examples using the NASA Regional Climate Model Evaluation System (RCMES) and cloud computing resources.

How to cite: Thrasher, B., Wang, W., Michaelis, A., Brosnan, I., and Khajehei, S.: NASA Earth Exchange Global Daily Downscaled Projections (NEX-GDDP-CMIP6), EGU General Assembly 2024, Vienna, Austria, 14–19 Apr 2024, EGU24-19303, https://doi.org/10.5194/egusphere-egu24-19303, 2024.

EGU24-19311 | ECS | Posters on site | ITS1.12/AS5.15

Statistical downscaling of seasonal forecast temperature using a climate-informed AI approach 

Yanet Díaz Esteban, Qing Lin, Arthur Hrast Essenfelder, Andrea Toreti, Fatemeh Heidari, Edgar Fabián Espitia Sarmiento, and Elena Xoplaki

Climate predictions on seasonal timescales are of major importance for the scientific, planning and policy communities to understand the impacts of climate variability and change and emergent risks, and thus develop appropriate adaptation and mitigation strategies. Nevertheless, the coarse spatial scale of that data limits its use in decision making. Downscaling is therefore emerging as a solution to transfer the climate information to a scale suitable for impact studies and climate-related risk assessments. In this study, a method for downscaling seasonal forecast temperature is presented, that integrates a Deep Residual Neural Network (DRNN) with an analog-based approach to increase the information from climate predictors. The advantage of the proposed approach is the incorporation of relevant large-scale variables, such as the geopotential height from different ensemble members, which supplies the model with varied information from the atmospheric circulation instead of using only a single input field as a predictor. This allows the model to capture the complex relationships between climate drivers and local scale variables such as temperature, that provides a great potential to reduce the large biases in climate model outputs. The DRNN based downscaling is applied to minimum and maximum temperature from ECMWF seasonal forecast at 1° resolution, downscaled to a resolution of 1 arcminute (~1.2 km), in a region that covers Germany and surrounding areas. The results are assessed against observations using both deterministic and probabilistic metrics and show an overall agreement between the downscaled product and the ground truth. This work demonstrates the added value of post-processing of seasonal forecasts, especially for applications of early warnings of extreme events and the associated hazards on a sub-seasonal to seasonal scale.  

How to cite: Díaz Esteban, Y., Lin, Q., Hrast Essenfelder, A., Toreti, A., Heidari, F., Espitia Sarmiento, E. F., and Xoplaki, E.: Statistical downscaling of seasonal forecast temperature using a climate-informed AI approach, EGU General Assembly 2024, Vienna, Austria, 14–19 Apr 2024, EGU24-19311, https://doi.org/10.5194/egusphere-egu24-19311, 2024.

EGU24-19420 | ECS | Orals | ITS1.12/AS5.15

Climate Services Downscale (CSDownscale): A statistical downscaling tool for (sub)seasonal to decadal climate predictions 

Eren Duzenli, Jaume Ramon Gamon, Alba Llabres, Verónica Torralba, Lluis Palma Garcia, Sara Moreno Montes, Carlos Delgado-Torres, Nuria Perez-Zanon, Javier Corvillo Guerra, and Raul Marcos

Statistical downscaling is a technique that allows to obtain high-resolution climate information from the coarse-resolution Global Climate Model (GCM) outputs through the long-term relationship between the GCM output and a reference dataset such as in-situ observations. The key benefit of employing statistical downscaling (SD) methods over the dynamical approaches is their significantly less computational costs. The cost-effectiveness of these methods enables the processing of large hindcasts, including multi-model systems with numerous ensemble members, which is highly relevant for the users. Thus, a comprehensive tool that allows users to apply state-of-the-art statistical downscaling methods on climate variables is crucial. CSDownscale is a new generation R package that has been  developed to statistically downscale subseasonal to seasonal to decadal climate predictions in the context of climate services, including its use in operational applications. The tool produces a downscaled field or time series using several bias correction, regression (i.e., linear and logistic) and analogs methods. Additionally, the package contains various interpolation methods such as nearest neighbor or bilinear approaches, which are used for regridding purposes. Users can easily combine these with bias correction and regression methods to perform downscaling. When applying these combined operations, the GCM data is initially interpolated to the resolution of the reference dataset, then the selected bias correction or regression method is implemented on the regridded data. However, the package also incorporates a method that infers the high-resolution values using a multi-linear regression with the four closest coarse-scale grid points, which skips the step of interpolation. Furthermore, the CSDownscale package includes an analogs based method, which looks for fields with similar conditions to the one being predicted and returns the high-resolution outcome of past conditions that are most similar, a certain number of similar fields or a combination of them. Finally, the CSDownscale package allows for the GCM data to be downscaled to either a reference grid space or a specific point location. All the methods are conceived to be done in cross-validation, that is, by excluding data from the specific time step being post-processed to avoid overfitting and, consequently, the overestimation of the actual prediction skill.

How to cite: Duzenli, E., Ramon Gamon, J., Llabres, A., Torralba, V., Palma Garcia, L., Moreno Montes, S., Delgado-Torres, C., Perez-Zanon, N., Corvillo Guerra, J., and Marcos, R.: Climate Services Downscale (CSDownscale): A statistical downscaling tool for (sub)seasonal to decadal climate predictions, EGU General Assembly 2024, Vienna, Austria, 14–19 Apr 2024, EGU24-19420, https://doi.org/10.5194/egusphere-egu24-19420, 2024.

EGU24-19461 | Orals | ITS1.12/AS5.15

Stochastic Spatial Weather Generator SPAGETTA: Development and Applications 

Martin Dubrovsky, Radan Huth, Petr Stepanek, Ondrej Lhotka, Jiri Miksovsky, Jan Meitner, Jan Balek, Adam Vizina, and Mirek Trnka

Stochastic weather generators are one of the most frequently used methodologies for producing input weather series for various process-based models (especially agricultural crop growth models and hydrological rainfall-runoff models) used e.g. in assessing impacts of climate change/variability on weather-dependent processes.

SPAGETTA (Dubrovsky et al., 2020, Theor. Appl. Climatol.) is a parametric multi-variable spatial weather generator run commonly (but not only) with daily time step. It is based on applying the spatialisation approach developed by Wilks (1998, J. Hydrol.) to our older single-site weather generator M&Rfi. Similarly to M&Rfi, SPAGETTA is designed for agricultural and hydrological modeling. Until recently, the stress was put on finetuning and validating the generator. Now, when the generator performs reasonably well, it is being used in various experiments.

In the first part of the presentation, the main results of the validation tests will be shown, focusing on the ability of the generator to reproduce spatial-temporal variability of multi-site temperature and precipitation series. Concerning the temporal variability, both high-frequency (interdiurnal) and low-frequency (intermonthly and interannual) variability was considered. The performance of the generator was compared with the performance of 19 RCMs taken from the CORDEX database.

In the second-part, to demonstrate different applications of the generators, we show results obtained in four experiments: (1) Assessment of separate effects of changes in the WG parameters, which represent the means, variability and lag-0 & lag-1 spatial correlations of temperature and precipitation, on a set of temperature and precipitation indices. The generator parameters were calibrated using the observational E-OBS data from 8 European regions and then modified with the changes (2070-99 vs. 1971-2000) derived from 19 RCM climate simulations (this experiment was already presented in EGU 2023). (2) To show the generator's performance in hydrological modeling, we applied the rainfall–runoff model to the watershed of Dyje river. The model outputs obtained using the synthetic weather series were compared with outputs obtained with the observed weather series (we call this type of experiment “indirect validation of WG”. (3) The generator was used to develop a new test for examining the collective significance of local trends at multiple sites (Huth and Dubrovsky, 2021, J. Clim.). This was made by applying large ensembles of realizations of synthetic multi-site weather series for user-defined lag-0 and lag-1 spatial correlation matrices, (4) The generator was used to assess the statistical significance of climate change scenarios produced by Regional Climate Models. The significance of the RCM-based changes (future vs. baseline) in individual WG parameters is based on comparing their values with the spread of the changes of these parameters based on ensembles of synthetic weather series, i.e. the pairs of synthetic series representing future and present climate; the generator was calibrated by RCM simulations for the corresponding time slices.

How to cite: Dubrovsky, M., Huth, R., Stepanek, P., Lhotka, O., Miksovsky, J., Meitner, J., Balek, J., Vizina, A., and Trnka, M.: Stochastic Spatial Weather Generator SPAGETTA: Development and Applications, EGU General Assembly 2024, Vienna, Austria, 14–19 Apr 2024, EGU24-19461, https://doi.org/10.5194/egusphere-egu24-19461, 2024.

EGU24-19640 | ECS | Orals | ITS1.12/AS5.15

Application of Machine Learning Statistical Downscaling to Seasonal Climate Forecasts for the Alpine Region 

Dhinakaran Suriyah, Crespi Alice, Jacob Alexander, and Pebesma Edzer

Climate change is a pressing global challenge, notably impacting sensitive regions like the Alpine area. Its diverse terrain and ecology make it vulnerable to heightened climate risks, including intensified weather extremes due to global warming. Precise local climate predictions are vital for managing risks in vulnerable areas like the Alpine region, necessitating reliable high-resolution climate data and forecasts. Global products often fall short in providing the fine-grained information needed for accurate localized assessments. This work aims to address the critical need for refined, high-resolution seasonal climate forecasts in the Alpine region as a tool to increase the ability to manage and anticipate climate variability and hazardous conditions. The study endeavors to utilize Perfect Prognosis (PP) within Statistical Downscaling (SD), leveraging regression-based Machine Learning (ML) algorithms to enhance the spatial resolution of daily temperature and total precipitation of ECMWF (European Centre for Medium Range Weather Forecasts) SEAS5 (Seasonal Forecast System 5) seasonal forecasts. Four ensemble learning methods — random forest, light gradient-boosting machine (LGBM), Adaptive Boosting (AdaBoost) and Extreme Gradient Boosting (XGBoost) are considered, while CERRA (Copernicus European Regional Reanalysis) reanalysis (5.5 km) is used as reference target. In order to define the optimal ML model and configuration, a preparatory phase is performed in which ML methods are implemented, optimized and inter-compared by considering ERA5 reanalysis predictor fields (~ 31 km) for the training period 1985-2015 and validation period 2016-2020. Initial findings show that LGBM reports better performance in training and validation, demonstrating superior computational speed and efficiency with respect to the others. LGBM reconstructs daily variability with R2 scores of 0.95 for mean temperature and 0.67 for precipitation. Remaining bias as yearly average is -0.05°C fo daily mean temperature and 5.34% for daily precipitation. Other error metrics, e.g., mean absolute error (MAE) and root mean squared error (RMSE) suggest room for improvements, especially in extreme value predictions and annual precipitation averages. LGBM is thus applied and further optimized on SEAS5. The contribution will further elaborate the inter-comparison of ML models and their downscaling skills for seasonal forecasts will be presented and discussed. The expected outcomes of this study in particular will serve as a crucial input of a drought prediction module in the framework of the EU-funded interTwin project. This research has been funded by the European Union through the interTwin project (101058386).

How to cite: Suriyah, D., Alice, C., Alexander, J., and Edzer, P.: Application of Machine Learning Statistical Downscaling to Seasonal Climate Forecasts for the Alpine Region, EGU General Assembly 2024, Vienna, Austria, 14–19 Apr 2024, EGU24-19640, https://doi.org/10.5194/egusphere-egu24-19640, 2024.

EGU24-1036 | ECS | Orals | NP1.5

Exploring Noise-induced and CO2-driven AMOC collapses in the PlaSIM-LSG climate model with a Rare Event Algorithm. 

Matteo Cini, Giuseppe Zappa, Francesco Ragone, and Susanna Corti

Earth-system Models of Intermediate Complexity (EMICs) are climate models featuring a simplified representation of climate processes and a much lower computation cost. This makes them particularly suitable for exploring phenomena with a large ensemble simulation approach. Here we use the coupled atmosphere-ocean PlaSIM-LSG EMIC to study the possibility of Atlantic Meridional Overturning Circulation (AMOC) spontaneous collapses and how this is altered in the presence of external anthropogenic forcing. Understanding the stability of the AMOC and its response to anthropogenic forcing is of key importance for advancing climate science. The idea of a “safe-operating space” has been proposed in order to define a threshold on anthropogenic forcing within which the AMOC does not lose stability. This requires understanding the combined action of CO2-driven and noise-induced processes in climate tipping events

 First, we address the occurrence of noise-induced AMOC collapses, i.e. spontaneous abrupt weakening  events induced by chaotic internal climate variability in absence of any external forcing. We address the problem of finding these extreme events via the application of a Rare Event Algorithm, which - via a selective cloning of the most interesting model trajectories -  allows a faster exploration of the model phase space in the direction of an AMOC decrease. The algorithm is applied to a PlaSIM-LSG ensemble simulation run at T21 spectral resolution in the atmosphere, and 3.5 degrees in the ocean, with fixed pre-industrial conditions. A number of collapse events, unseen in the pre-industrial control run, are sampled by the algorithm. Looking at the mechanisms causing the AMOC spontaneous collapse, we find that zonal wind stress over the North Atlantic is the main driver of the initial AMOC slowdown, while the suppression of surface convection in the Labrador sea is the likely cause of the subsequent AMOC collapse. Then, we investigate the influence of increasing CO2 levels on the frequency of these spontaneous AMOC collapses. We show that a higher CO2 not only leads to the well-known weakening of the AMOC mean state, but it also increases the possibility of incurring in abrupt noise-induced transitions. The employment of EMICs, combined with the proposed approach, samples a large number of rare phenomena. This procedure allows us to explore statistical properties that are not accessible with a deterministic approach in state-of-the-art high resolution models.

How to cite: Cini, M., Zappa, G., Ragone, F., and Corti, S.: Exploring Noise-induced and CO2-driven AMOC collapses in the PlaSIM-LSG climate model with a Rare Event Algorithm., EGU General Assembly 2024, Vienna, Austria, 14–19 Apr 2024, EGU24-1036, https://doi.org/10.5194/egusphere-egu24-1036, 2024.

EGU24-2167 | ECS | Posters on site | NP1.5

Early-Warning Signs for SPDEs under Boundary Noise 

Paolo Bernuzzi, Christian Kuehn, and Henk Dijkstra

The search of early-warning signs able to predict the approach of a parameter to a deterministic bifurcation threshold is relevant in climate as it aims to enable a proper prediction of qualitative changes in the studied models. The observation of such objects in SPDEs (stochastic partial differential equations) permits the consideration of space variables and the ensuing heterogeneity in the behaviour of their solutions.

The presence of Gaussian noise on the boundary of the studied space is used in order to build the signals, whose properties are discussed thoroughly. An example in the form of application of such tools on a climate model is presented and justified. The utility and appropriate use of the results on a more applied perspective are shown.

How to cite: Bernuzzi, P., Kuehn, C., and Dijkstra, H.: Early-Warning Signs for SPDEs under Boundary Noise, EGU General Assembly 2024, Vienna, Austria, 14–19 Apr 2024, EGU24-2167, https://doi.org/10.5194/egusphere-egu24-2167, 2024.

Aeolus 2.0 is an open-source numerical atmosphere model with intermediate complexity designed to capture the dynamics of the atmosphere, especially extreme weather and climate events. The model's dynamical core is built on a novel multi-layer pseudo-spectral moist-convective Thermal Rotating Shallow Water (mcTRSW) model, and it utilizes the Dedalus algorithm, renowned for its efficient handling of spin-weighted spherical harmonics in solving pseudo-spectral problems. Aeolus 2.0 comprehensively characterizes the temporal and spatial evolution of key atmospheric variables, including vertically integrated potential temperature, thickness, water vapor, precipitation, and the influence of bottom topography, radiative transfer, and insolation. It provides a versatile platform with resolutions ranging from smooth to coarse, enabling the exploration of a wide spectrum of dynamic phenomena with varying levels of detail and precision.

The model has been utilized to investigate the adjustment of large-scale localized buoyancy anomalies in mid-latitude and equatorial regions, along with the nonlinear evolution of key variables in both adiabatic and moist-convective environments. Our findings highlight the triggering mechanisms of phenomena such as the Madden-Julian Oscillation (MJO) and the circulation patterns induced by temperature anomalies and buoyancy fields. Furthermore, our simulations of large-scale localized temperature anomalies reveal insights into the impact of perturbation strength, size, and vertical structure on the evolution of eddy heat fluxes, including poleward heat flux, energy, and meridional elongation of the buoyancy field. We observe the initiation of atmospheric instability, leading to precipitation systems, such as rain bands, and asymmetric latent heat release due to moist convection in diabatic environments. This study identifies distinct patterns, including the formation of a comma cloud pattern in the upper troposphere and a comma-shaped buoyancy anomaly in the lower layer, accompanied by the emission of inertia gravity waves. Additionally, the role of buoyancy anomalies in generating heatwaves and precipitation patterns is emphasized, particularly in mid-latitude regions.

In summary, Aeolus 2.0, with its specific capabilities, contributes to our understanding of the complex interactions of moist convection, buoyancy anomalies, and atmospheric dynamics, shedding light on the dynamics of extreme weather events and their implications for climate studies.

References

1. Rostami, M., Zhao, B., & Petri, S. (2022). On the genesis and dynamics of MaddenJulian oscillation-like structure formed by equatorial adjustment of localized heating. Quarterly Journal of the Royal Meteorological Society, 148 (749), 3788-3813. Retrieved from https://rmets.onlinelibrary.wiley.com/doi/abs/10.1002/qj.4388 doi: https://doi.org/10.1002/qj.4388

2. Rostami, M., Severino, L., Petri, S., & Hariri, S. (2023). Dynamics of localized extreme heatwaves in the mid-latitude atmosphere: A conceptual examination. Atmospheric Science Letters, e1188. Retrieved from https://rmets.onlinelibrary.wiley.com/doi/abs/10.1002/asl.1188 doi: https://doi.org/10.1002/asl.1188

How to cite: Rostami, M. and Petri, S.: Exploring Extreme Weather and Climate Events with Aeolus 2.0: A Multi-layer moist-convective Thermal Rotating Shallow Water (mcTRSW) Dynamical Core, EGU General Assembly 2024, Vienna, Austria, 14–19 Apr 2024, EGU24-2867, https://doi.org/10.5194/egusphere-egu24-2867, 2024.

EGU24-4539 | ECS | Posters on site | NP1.5

Extreme value methods in dynamical systems of different complexity 

Ignacio del Amo, George Datseris, and Mark Holland

Extreme value theory provides a universal limit for the extremes of continuous independent and identically distributed random variables and has proven to be robust to generalisation to wider classes of random variables, including stationary processes, some nonstationary processes and even trajectories on deterministic chaotic systems. This universality, together with the fact that these methods require data from only one realization of the system, has been exploited in applications to study many series of climate data.

Fitting a probability distribution to the extreme events of a data series generated by a chaotic dynamical system gives us not only probabilistic predictions of the intensity and return time of the events themselves, but also geometrical information about the local structure of the attractor and the predictability and persistence of the extreme events.

However, these methods are sensitive to the mathematical properties of the dynamical system that generates the data, and are seldomly even mentioned when they are applied to real climate data. One further caveat of these methods is that they are hard to falsify, i.e. we cannot verify easily if an answer is wrong. For these reasons, we explore how these methods respond to different systems with different complexity and different mathematical properties, trying to understand which of the results on the literature could meaningful and which could be numerical artifacts.

How to cite: del Amo, I., Datseris, G., and Holland, M.: Extreme value methods in dynamical systems of different complexity, EGU General Assembly 2024, Vienna, Austria, 14–19 Apr 2024, EGU24-4539, https://doi.org/10.5194/egusphere-egu24-4539, 2024.

Within the climate model hierarchy, simple models usually play the important role of highlighting dynamical processes that can possibly govern climate phenomena. If, in addition, their results are in significant agreement with observations, the processes thus identified are even more likely to regulate the actual phenomena. In this context, the dynamical process of intrinsic variability paced by a deterministic forcing (also called deterministic excitation, DE [1]) is highlighted here by two simple models of different degrees of complexity and set in the different contexts of paleoclimate and physical oceanography. In both cases, despite the simplicity of the models, the results show significant agreement with observations.

The DE mechanism requires the system (i) to possess intrinsic nonlinear relaxation oscillations (ROs) and (ii) to be in the excitable state (i.e., ROs do not emerge spontaneously but can be excited, and therefore paced, by a suitable forcing); moreover, (iii) ROs are excited by a deterministic forcing if a given tipping point is passed.

In the first case [1], the abrupt late Pleistocene glacial terminations are shown by a conceptual model to correspond to the excitation, by the astronomical forcing, of ROs describing glacial-interglacial transitions (e.g., [2]). In the second case [3], ROs describing the Kuroshio Extension low-frequency variability [4] are shown, by a primitive equation ocean model, to be excited remotely by the North Pacific Oscillation. These results show how simple modeling approaches of different complexity advance process understanding and can, therefore, provide theoretical guidelines for interpreting state-of-the-art ESM results.

[1] Pierini S., 2023: The deterministic excitation paradigm and the late Pleistocene glacial terminations. Chaos, 33, 033108.

[2] Gildor H. and E. Tziperman, 2001: A sea ice climate switch mechanism for the 100-kyr glacial cycles. J. Geophys. Res., 106, 9117–9133.

[3] Pierini S., 2014: Kuroshio Extension bimodality and the North Pacific Oscillation: a case of intrinsic variability paced by external forcing. J. Climate, 27, 448-454.

[4] Pierini S., 2006: A Kuroshio Extension System model study: decadal chaotic self-sustained oscillations. J. Phys. Oceanogr., 36, 1605-1625.

How to cite: Pierini, S.: Simple oceanographic and paleoclimate modeling highlights the same dynamical process: intrinsic variability paced by a deterministic forcing, EGU General Assembly 2024, Vienna, Austria, 14–19 Apr 2024, EGU24-4679, https://doi.org/10.5194/egusphere-egu24-4679, 2024.

EGU24-5570 | ECS | Orals | NP1.5

The critical precipitation threshold for the Amazon forest biomass in the LPJmL vegetation model 

Da Nian, Sebastian Bathiany, Boris Sakschewski, Markus Drüke, Lana Blaschke, Maya Ben-Yami, Werner von Bloh, and Niklas Boers

The Amazon rainforest, one of the most important biomes in the world, and recognized as a potential tipping element in the Earth system, has received increasing attention in recent years. Theory and observations suggest that regional climate change from greenhouse gas emissions and deforestation may push the remaining forest toward a catastrophic tipping point.

Despite the urgency to assess the future fate of the Amazon, it remains unclear if state-of-the-art Dynamic Global Vegetation Models (DGVMs) can capture the highly nonlinear dynamics underlying such potentially abrupt dynamics and there is a noticeable scarcity of DGVM evaluations regarding their potential to predict forthcoming tipping points.

In our manuscript, we systematically investigate how the Amazon forest responds in idealized scenarios where precipitation is linearly decreased and subsequently increased between current levels and zero, using the state-of-the-art model LPJmL. We investigate whether large-scale abrupt changes and tipping points occur, and whether early warning signals as expected from theory can be detected. 

Our results indicate a pronounced nonlinearity but reversible behavior between vegetation aboveground biomass (AGB) and mean annual precipitation (MAP) in the LPJmL simulations. In particular, there exists a threshold at a critical rainfall level below which there is a rapid decrease in forest biomass. The value of the threshold is determined by seasonality, evapotranspiration and the adaptive capacity of roots. Significant "early warning signs" can be detected before the transition.

How to cite: Nian, D., Bathiany, S., Sakschewski, B., Drüke, M., Blaschke, L., Ben-Yami, M., von Bloh, W., and Boers, N.: The critical precipitation threshold for the Amazon forest biomass in the LPJmL vegetation model, EGU General Assembly 2024, Vienna, Austria, 14–19 Apr 2024, EGU24-5570, https://doi.org/10.5194/egusphere-egu24-5570, 2024.

EGU24-8104 | ECS | Posters on site | NP1.5

Disentangling the dynamics of the subpolar gyre and its interaction with the AMOC in the CMIP6 ensemble 

Swinda Falkena and Anna von der Heydt

The subpolar gyre (SPG) is one of the climate tipping elements which could have a large impact on the climate in the northern hemisphere. Improving our understanding of its dynamics is key to assessing the likelihood of it passing a tipping point. Some CMIP6 models exhibit abrupt transitions in the sea surface temperature in the SPG region, but the majority does not. The differences in the model response can be related to the stratification bias, with many models having a too strong stratification preventing them from exhibiting bistable gyre dynamics.

To better understand the SPG we study the (lagged) partial correlations between the relevant aspects of its dynamics in the CMIP6 ensemble. In contrast to standard correlations, partial correlations correct for the effect of autocorrelation and the effect of (the past of) other relevant variables. Therefore, it gives a better indication of there being a causal relation. Based on the partial correlation between the sea surface temperature and mixed layer depth we split the ensemble into two groups (strong or negligible relation) and for each select one model to study its dynamics in detail. In addition, we discuss the interaction of the SPG with the Atlantic Meridional Overturning Circulation (AMOC) using the same methods. These results can help in better informing more conceptual climate models of the SPG, AMOC and their interactions, which can be used to study potential tipping dynamics.

How to cite: Falkena, S. and von der Heydt, A.: Disentangling the dynamics of the subpolar gyre and its interaction with the AMOC in the CMIP6 ensemble, EGU General Assembly 2024, Vienna, Austria, 14–19 Apr 2024, EGU24-8104, https://doi.org/10.5194/egusphere-egu24-8104, 2024.

EGU24-8117 | Posters on site | NP1.5

Using a simple model to measure the differences between climate model land surface simulations and FLUXNET observations 

F. Hugo Lambert, Claire Zarakas, Monisha Natchiar S. R., Abigail L. S. Swann, and Charles D. Koven

Complex numerical models of climate consist of simulation of fluid dynamics and thermodynamics on a discrete grid, and parameterizations, which are algorithms that approximate processes smaller than gridscale. Because parameterizations of a given process may be written as different functions of different, potentially non-observable variables, it can be difficult to quantify the process differences between individual climate models and between climate models and the real world.

Here, we attempt to write down a simple linear model that represents the response of the Earth's tropical land surface to atmospheric forcing on monthly timescales in terms of the same observable variables using a technique called continuous structural parameterization. Simulated data are taken from complex General Circulation Models (GCMs) run under the AMIP protocol and a CESM2 perturbed physics ensemble (PPE) of our own devising;  observed measurements are taken from FLUXNET flux tower sites. We find that the simple model captures land surface behaviour well except in mountainous regions.

Establishing a generalised parameter space, we see that most GCMs are in reasonable agreement with FLUXNET at FLUXNET sites, although there is evidence that GCMs consistently slightly overestimate the response of surface turbulent fluxes to downward radiation. Further, it is found that the differences between structurally different AMIP models are considerably greater than the differences between CESM2 PPE members -- even though the PPE parameters are varied across their realistic domain. If the simple model is trained only at GCM spatial gridpoints that contain a FLUXNET site, there is little degradation in simple model performance compared with global training, suggesting that even the few available tropical FLUXNET sites are useful for constraining land surface model response throughout the tropics. This is of course contingent on whether or not point measurements taken by FLUXNET are representative of the wider area around FLUXNET sites.

How to cite: Lambert, F. H., Zarakas, C., Natchiar S. R., M., Swann, A. L. S., and Koven, C. D.: Using a simple model to measure the differences between climate model land surface simulations and FLUXNET observations, EGU General Assembly 2024, Vienna, Austria, 14–19 Apr 2024, EGU24-8117, https://doi.org/10.5194/egusphere-egu24-8117, 2024.

EGU24-8397 | ECS | Orals | NP1.5

AMOC Stability amid Tipping Ice Sheets from Conceptual to Intermediate Complexity Models 

Sacha Sinet, Anna S. von der Heydt, Peter Ashwin, and Henk A. Dijkstra

The Atlantic Meridional Overturning Circulation (AMOC) and polar ice sheets are considered susceptible to critical transitions under climate change. Identified as core tipping elements, their collapse would have global and drastic consequences. Furthermore, the AMOC and polar ice sheets form a complex interacting system, where the collapse of one component can heavily impact the stability of others. In the worst case, this could result in a large-scale domino effect, otherwise known as a cascading tipping event.

In this presentation, our focus is on assessing the stability of the AMOC in the presence of tipping Greenland ice sheet (GIS) and West Antarctica ice sheet (WAIS). While most existing studies agree on the destabilizing impact of a GIS collapse on the AMOC, the consequences of a WAIS collapse remain uncertain. A previous conceptual study suggested that a WAIS tipping event might actually prevent an AMOC collapse against both climate warming and increased GIS meltwater fluxes. Using a better conceptual model of the AMOC, we demonstrate that both the melting rate and natural variability associated with surface meltwater fluxes are decisive factors for this phenomenon to occur. Finally, we present preliminary findings in which the relevance of this stabilizing effect is investigated in the model of intermediate complexity CLIMBER-X.

How to cite: Sinet, S., von der Heydt, A. S., Ashwin, P., and Dijkstra, H. A.: AMOC Stability amid Tipping Ice Sheets from Conceptual to Intermediate Complexity Models, EGU General Assembly 2024, Vienna, Austria, 14–19 Apr 2024, EGU24-8397, https://doi.org/10.5194/egusphere-egu24-8397, 2024.

EGU24-8729 | ECS | Orals | NP1.5

Quantifying risk of a noise-induced AMOC collapse from northern and tropical Atlantic Ocean variability 

Ruth Chapman, Peter Ashwin, Richard Wood, and Jonathan Baker

The Atlantic Meridional Overturning Circulation (AMOC) exerts a major influence on global climate. There is much debate about whether the current strong AMOC may collapse as a result of anthropogenic forcing and/or natural variability. Here, we ask whether internal decadal variability could affect the likelihood of AMOC collapse. We examine natural variability of basin-scale salinities and temperatures in four CMIP6 pre-industrial runs. We fit the CMIP6 variability to several empirical, linear noise models, and to a nonlinear, process-based AMOC model. The variability is weak and its processes inconsistent among the CMIP6 models considered. Based on the CMIP6 variability levels we find that noise-induced AMOC collapse is unlikely in the pre-industrial climate, but plausible if external forcing has shifted the AMOC closer to a threshold, which can be identified for the non-linear model using bifurcation analysis. However the CMIP6 models may systematically underestimate current Atlantic Ocean variability, and we find that substantially stronger variability would increase the likelihood of noise-induced collapse.

How to cite: Chapman, R., Ashwin, P., Wood, R., and Baker, J.: Quantifying risk of a noise-induced AMOC collapse from northern and tropical Atlantic Ocean variability, EGU General Assembly 2024, Vienna, Austria, 14–19 Apr 2024, EGU24-8729, https://doi.org/10.5194/egusphere-egu24-8729, 2024.

EGU24-9253 | ECS | Posters on site | NP1.5

The impact of model resolution on variability in a coupled land atmosphere model 

Oisín Hamilton, Jonathan Demaeyer, Anupama Xavier, and Stéphane Vannitsem

Reduced order quasi-geostrophic land-atmosphere coupled models display qualitatively realistic mid-latitude atmosphere behaviour, meaning that such models can produce typical atmospheric dynamical features such as atmospheric blocking. At the same time, due to a low number of degrees of freedom, they are still simple enough to allow for analysis of the system dynamics. These features mean that these models are well suited to investigating bifurcations in atmospheric dynamics, and use a dynamical systems approach to better understand the corresponding atmospheric behaviour. 

This project introduces a symbolic python workflow for using the flexible  land-atmosphere (qgs, 2020) spectral model with the continuation software AUTO. This work builds on the results of Xavier et al. (2023) to understand how the model variability and predictability is impacted by the model resolution. We also use bifurcation diagrams to better understand how parameters such as atmosphere-land friction impact the atmospheric blocking, and in turn the model atmosphere predictability. This is done for a range of model resolutions to investigate how the number of degrees of freedom impacts both the realism of the model, but also the structures found in the dynamics.


Demaeyer, Jonathan & De Cruz, Lesley & Vannitsem, S.: qgs: A flexible Python framework of reduced-order multiscale climate models. Journal of Open Source Software. 5. 2597. 10.21105/joss.02597, 2020. 


Xavier, A. K., Demaeyer, J., and Vannitsem, S.: Variability and Predictability of a reduced-order land atmosphere coupled model, EGUsphere [preprint], https://doi.org/10.5194/egusphere-2023-2257, 2023.

How to cite: Hamilton, O., Demaeyer, J., Xavier, A., and Vannitsem, S.: The impact of model resolution on variability in a coupled land atmosphere model, EGU General Assembly 2024, Vienna, Austria, 14–19 Apr 2024, EGU24-9253, https://doi.org/10.5194/egusphere-egu24-9253, 2024.

EGU24-10070 | ECS | Posters on site | NP1.5

Spatial fluctuations of the Arctic sea ice border 

Clara Hummel

Every year, the area of the Arctic sea-ice decreases in the boreal spring and summer and reaches its yearly minimum in the early autumn. Due to global warming, Arctic summer sea ice will most probably disappear. As the sea ice cover decreases, its border is retreating northwards towards the central Arctic. This retreat is not uniform in space and the variability of the border’s movement further North could yield an early warning signal for summer sea ice loss. Here, we track the sea ice border from time series obtained from models of various complexity and observations to study the spatial variability of the border’s movement as Arctic summer sea ice approaches its disappearance.

How to cite: Hummel, C.: Spatial fluctuations of the Arctic sea ice border, EGU General Assembly 2024, Vienna, Austria, 14–19 Apr 2024, EGU24-10070, https://doi.org/10.5194/egusphere-egu24-10070, 2024.

EGU24-11984 | Posters on site | NP1.5

Dependence of simulated variability of surface climate on model complexity – insights from an ensemble of transient simulations of the Last Deglaciation 

Elisa Ziegler, Nils Weitzel, Jean-Philippe Baudouin, Marie-Luise Kapsch, Uwe Mikolajewicz, Lauren Gregoire, Ruza Ivanovic, Paul Valdes, Christian Wirths, and Kira Rehfeld

Climate variability is crucial to our understanding of future climate change and its impacts on societies and the natural world. However, the climate records of the observational era are too short to explore long-term variability. Conversely, an exploration of long transient simulations from state-of-the-art Earth System Models (ESMs) poses high computational demands. It is therefore pertinent to identify the level of complexity sufficient to simulate the variability of surface climate from annual to centennial and longer timescales.

To this end, we use an ensemble of transient simulations of the Last Deglaciation, the last period of significant global warming. The ensemble covers an energy balance model (EBM), models of intermediate complexity (EMICs), general circulation models (GCMs) and ESMs. This constitutes a hierarchy that we categorize based on employed atmosphere and ocean components and their resolution, as well as implemented radiation, land hydrology, vegetation and aerosol schemes.

To investigate the simulated variability of surface temperature and precipitation, we analyze changes in the shapes of their distributions as characterized by their higher order moments – variance, skewness, kurtosis – with warming. These higher order moments relate the tails to the extremes of the distributions. We identify spatial and temporal patterns and how they depend on model complexity. The EMICs can generally match the global and latitudinal changes in temperature variability found in more complex models. However, they lack in precipitation variability. We further find that the EMICs fail to simulate the tails of the precipitation distributions. We observe dependency of variability on the background state, generally increasing with model complexity. However, there is still a large spread between models of similar complexity, some of which can be related to differences in forcings. Furthermore, questions remain on the abilities of models of any complexity to simulate a magnitude of long-term variability similar to that found regionally in proxy reconstructions. Our analysis offers implications as to the complexity needed and sufficient for capturing the full picture of climate change and we offer some first insights into how the findings translate to future projections of climate change.

How to cite: Ziegler, E., Weitzel, N., Baudouin, J.-P., Kapsch, M.-L., Mikolajewicz, U., Gregoire, L., Ivanovic, R., Valdes, P., Wirths, C., and Rehfeld, K.: Dependence of simulated variability of surface climate on model complexity – insights from an ensemble of transient simulations of the Last Deglaciation, EGU General Assembly 2024, Vienna, Austria, 14–19 Apr 2024, EGU24-11984, https://doi.org/10.5194/egusphere-egu24-11984, 2024.

EGU24-12421 | Posters on site | NP1.5

A Novel Process Model of Ocean-Sea-Ice Interaction Using CESM 

Paul Hall, Christopher Horvat, Baylor Fox-Kemper, Samuel Brenner, and Alper Altuntas

We report on the development of a novel process model created to study ocean-sea ice interaction and the dynamics of the upper ocean in the marginal ice zone (MIZ), built using the Community Earth System Model (CESM). Our model uses the MOM6 ocean model and CICE6 sea-ice model as active components within CESM, on a custom ~50km x ~50km grid with a horizontal resolution of ~50m, extending to a depth of 75m (30 vertical layers). The model allows for either reflecting or zonally re-entrant boundary configurations. Atmospheric forcing is imposed through a simplified data atmosphere component that provides constant forcing over the model domain. Results from several simple scenarios are presented and compared to results obtained using the MITgcm.

By working within CESM, we are able to leverage CESM’s existing infrastructure and capabilities, including the use of the Community Mediator for Earth Prediction Systems (CMEPS) for coupling between active components. Furthermore, additional model components that are already available within CESM (e.g., waves, atmosphere) can be incorporated into the process model in a straightforward way. Future work will include incorporation of a modified sea-ice component that allows tracking of individual floes utilizing a discrete element method approach.

How to cite: Hall, P., Horvat, C., Fox-Kemper, B., Brenner, S., and Altuntas, A.: A Novel Process Model of Ocean-Sea-Ice Interaction Using CESM, EGU General Assembly 2024, Vienna, Austria, 14–19 Apr 2024, EGU24-12421, https://doi.org/10.5194/egusphere-egu24-12421, 2024.

EGU24-14067 | ECS | Orals | NP1.5

A Forecast Test for Reducing Dynamical Dimensionality of Model Emulators 

Tongtong Xu, Matthew Newman, Michael Alexander, and Antonietta Capotondi

The climate system can be numerically represented by a set of physically-based dynamical equations whose solution requires substantial computational resources. This makes computationally efficient, low dimensional emulators that simulate trajectories of the underlying dynamical system an attractive alternative for model evaluation and diagnosis. We suggest that since such an emulator must adequately capture anomaly evolution, its construction should employ a grid search technique where maximum forecast skill determines the best reference model. In this study, we demonstrate this approach by testing different bases used to construct a Linear Inverse Model (LIM), a stochastically-forced multivariate linear model that has often been used to represent the evolution of coarse-grained climate anomalies in both models and observations. LIM state vectors are typically represented in a basis of the leading Empirical Orthogonal Functions (EOFs), but while dominant large-scale climate variations often are captured by a subset of these statistical patterns, key precursor dynamics involving relatively small scales are not. An alternative approach is balanced truncation, where the dynamical system is transformed into its Hankel space, whose modes span both precursors and their subsequent responses. Constructing EOF- and Hankel-based LIMs from monthly observed anomalous Pacific sea surface temperatures, both for the 150-yr observational record and a perfect model study using 600 yrs of LIM output, we find that no balanced truncation model of any dimension can outperform an EOF-based LIM whose dimension is chosen to maximize independent skill. However, the dynamics of a high-dimensional EOF-based LIM can be efficiently reproduced by far fewer Hankel modes.

How to cite: Xu, T., Newman, M., Alexander, M., and Capotondi, A.: A Forecast Test for Reducing Dynamical Dimensionality of Model Emulators, EGU General Assembly 2024, Vienna, Austria, 14–19 Apr 2024, EGU24-14067, https://doi.org/10.5194/egusphere-egu24-14067, 2024.

EGU24-14439 | ECS | Posters on site | NP1.5

Nonlocal energy fluxes and fractional operators in updated, stochastic, Budyko-Sellers models 

dustin lebiadowski and shaun Lovejoy

We introduce a stochastic, energy-balance, climate model defined over the macroweather regime (approximately 15 days or longer). Together, the energy balance principle, combined with the model’s natural scaling, demonstrate quite promising results despite the relative simplicity. A special case of the model can also be derived from a very classical basis, and, because of some similarities, we propose this model as a development upon the work of Budyko and Sellers.

When the classical Budyko-Sellers energy balance model is updated by using the (correct) radiative-conductive surface boundary conditions, one obtains the Fractional Energy Balance Equation (FEBE). The FEBE involves fractional space-time operators and its generic solutions are scaling, in agreement with much atmospheric and oceanic data. In time, it implies long range memories that have been successfully used to make both multi-decadal climate projections as well as monthly and seasonal (long range) forecasts. In space, the FEBE is nonlocal so that energy flux imbalances at any location can affect the balance in locations far away. This is possible because the model operates over monthly and longer time scales; over these scales, energy can be both stored and transported in the atmosphere, ocean, and subsurface.

Until now, the FEBE’s full nonlocal space-time interaction operator has been only approximated. Here, by introducing a numerical model, the nonlocal dynamics of the FEBE and corresponding Earth-system FEBE energy flows over the 2D Earth surface are fully detailed.

We propose the FEBE as an alternative to more conventional, deterministic, weather-regime-based climate models. Given the generality of the ideas pursued here - the use of fractional operators; the use of stochasticity and the macroweather regime - there seems a great potential for these to be used much more widely. Hopefully this research, and possibly related works, will encourage a greater diversity of pursuits and be inspiring to others in their own work.

How to cite: lebiadowski, D. and Lovejoy, S.: Nonlocal energy fluxes and fractional operators in updated, stochastic, Budyko-Sellers models, EGU General Assembly 2024, Vienna, Austria, 14–19 Apr 2024, EGU24-14439, https://doi.org/10.5194/egusphere-egu24-14439, 2024.

EGU24-14831 | ECS | Orals | NP1.5

SPEEDY-NEMO: performance and applications of a fully-coupled intermediate-complexity climate model 

Paolo Ruggieri, Muhammad Adnan Abid, Javier Garcia-Serrano, Carlo Grancini, Fred Kucharski, Salvatore Pascale, and Danila Volpi

A fully-coupled general circulation model of intermediate complexity is documented. The study presents an overview of the model climatology and variability, with particular attention for the phenomenology of processes that are relevant for the predictability of the climate system on seasonal-to-decadal time-scales. It is shown that the model can realistically simulate the general circulation of the atmosphere and the ocean, as well as the major modes of climate variability on the examined time-scales: e.g. El Niño-Southern Oscillation, North Atlantic Oscillation, Tropical Atlantic Variability, Pacific Decadal Variability, Atlantic Multi-decadal Variability. We demonstrate the ability of the model in simulating non-stationarity of coupled ocean-atmosphere modes of variability. Potential applications of the model are discussed, with emphasis on the possibility to generate sets of low-cost large-ensemble retrospective forecasts. We argue that the presented model is suitable to be employed in traditional and innovative model experiments that can play a significant role in future developments of seasonal-to-decadal climate prediction.

How to cite: Ruggieri, P., Abid, M. A., Garcia-Serrano, J., Grancini, C., Kucharski, F., Pascale, S., and Volpi, D.: SPEEDY-NEMO: performance and applications of a fully-coupled intermediate-complexity climate model, EGU General Assembly 2024, Vienna, Austria, 14–19 Apr 2024, EGU24-14831, https://doi.org/10.5194/egusphere-egu24-14831, 2024.

EGU24-16958 | Orals | NP1.5

The Challenge of Non-Markovian Energy Balance Models in Climate 

Nicholas Wynn Watkins, Raphael Calel, Sandra Chapman, Aleksei Chechkin, Rainer Klages, and David Stainforth

Hasselmann’s paradigm, introduced in 1976 and recently honoured with the Nobel Prize, can, like many key innovations in the sciences of climate and complexity, be understood on several different levels, both technical and conceptual. It can be seen as a mathematical technique to add stochastic variability into pioneering energy balance models (EBMs) of Budyko and Sellers. On a more conceptual level, it used the mathematics  of Brownian motion to provide an  abstract superstructure linking slow climate variability to fast weather fluctuations, in a context broader than EBMs, leading Hasselmann to posit the need for negative feedback in climate modelling.

Hasselmann's paradigm itself has much still to offer us [e.g. Calel et al, Naure Communications, 2020], but naturally, since the 1970s a number of newer developments have built on his pioneering ideas. One important one has been the development of a rigorous mathematical hierarchy that embeds Hasselmann-type models in the more comprehensive Mori-Zwanzig (MZ) framework  (e.g.  Lucarini and Chekroun, Nature Reviews Physics, 2023). Another has been the interest in long range memory in stochastic EBMs, notably Lovejoy et al’s Fractional Energy Balance Equation [FEBE, discussed in this week’s Short Course SC5.15 ]. These have a memory with slower decay and thus longer range than the exponential form seen in Hasselmann’s EBM. My presentation [based on Watkins et al, in review at Chaos] attempts to build a bridge between MZ-based extensions of  Hasselmann, and the fractional derivative-based FEBE model.  I will argue that the Mori-Kubo overdamped Generalised Langevin Equation, as widely used in statistical mechanics, suggests the form of a relatively simple stochastic EBM with memory for the global temperature anomaly, and will discuss how this relates to FEBE.

How to cite: Watkins, N. W., Calel, R., Chapman, S., Chechkin, A., Klages, R., and Stainforth, D.: The Challenge of Non-Markovian Energy Balance Models in Climate, EGU General Assembly 2024, Vienna, Austria, 14–19 Apr 2024, EGU24-16958, https://doi.org/10.5194/egusphere-egu24-16958, 2024.

EGU24-18360 | Posters on site | NP1.5

Eddy Saturation and Latitudinal Storm Track Shift in a Reduced Two-level Model of the Atmosphere 

Valerio Lucarini, Melanie Kobras, and Maarten Ambaum

We introduce a minimal dynamical system derived from the classical Phillips two-level model with the goal of elucidating the essential mechanisms responsible for the interaction between eddies and mean flow. The choice of a two-level model as starting points allows for appreciating the relative role of barotropic and baroclinic processes. Specifically, we wish to explore the eddy saturation mechanism, whereby, when average conditions are considered, direct forcing of the zonal flow increases the eddy kinetic energy, while the energy associated with the zonal flow does not increase. The eddy-driven jet stream and storm tracks in the mid-latitude atmosphere are known to shift in latitude on various timescales, but the physical processes that cause these shifts are still unclear. Using our low-order model, we aim to understand the link between the structure of the eddies and the shift of the latitudinal maximum of the zonal flow in the mid-latitude atmosphere. Our findings elucidate the basic mechanisms behind baroclinic adjustment and provide insights into the properties of the storm track change between the jet entrance and jet exit regions of the North Atlantic.

How to cite: Lucarini, V., Kobras, M., and Ambaum, M.: Eddy Saturation and Latitudinal Storm Track Shift in a Reduced Two-level Model of the Atmosphere, EGU General Assembly 2024, Vienna, Austria, 14–19 Apr 2024, EGU24-18360, https://doi.org/10.5194/egusphere-egu24-18360, 2024.

EGU24-18412 | ECS | Orals | NP1.5

Rapid Emulation of Spatially Resolved Temperature Response Functions to Effective Radiative Forcing 

Christopher Womack, Noelle Eckley Selin, and Sebastian Eastham

We utilize ideas from signal processing to demonstrate a novel methodology for climate emulation based on the response of the climate system to effective radiative forcing (ERF). While previous work has demonstrated the efficacy of impulse response functions as a tool for climate emulation, these methods are largely non-generalizable to new scenarios and are inaccessible to more general audiences. To remedy this, we propose a generalizable framework for emulation of climate variables such as near-surface air temperature, representing the climate system through the surrogate of spatially resolved impulse response functions. These response functions are derived through the deconvolution of ERF and near-surface air temperature profiles, treating ERF and near-surface air temperature as input and output signals, respectively. Using this framework, new scenarios can be quickly and easily emulated through convolution and other sets of impulse response functions can be derived from any pair of climate variables. We present results from an application to near-surface air temperature based on ERF and temperature data taken from experiments in the sixth phase of the Coupled Model Intercomparison Project (CMIP6). We evaluate the emulator using additional experiments taken from the CMIP6 archive, including the Shared Socioeconomic Pathways (SSPs), demonstrating accurate emulation of global mean and spatially resolved temperature change with respect to the outputs of the CMIP6 ensemble. Global absolute error in emulated temperature averages 0.25 degrees Celsius with a bias ranging from -0.14 to -0.04 degrees Celsius. We additionally show how our emulator can be implemented as a tool for climate education through integration with the En-ROADS platform, providing fast visualizations of spatially resolved temperature change for a number of policy-relevant scenarios. While it is unable to capture state-dependent climate feedbacks, such as the non-linear effects of Arctic sea ice melt in high-warming scenarios, our results show that the emulator is generalizable to any scenario independent of the specific forcings present.

How to cite: Womack, C., Eckley Selin, N., and Eastham, S.: Rapid Emulation of Spatially Resolved Temperature Response Functions to Effective Radiative Forcing, EGU General Assembly 2024, Vienna, Austria, 14–19 Apr 2024, EGU24-18412, https://doi.org/10.5194/egusphere-egu24-18412, 2024.

EGU24-22102 | Orals | NP1.5 | Highlight

From conceptual to complex earth system models: why are models so linear? 

Victor Brovkin, Tobias Stacke, Philipp de Vrese, Thomas Kleinen, and Alexander Winkler

The evolution of the Earth’s climate from the past to the future is explored by a hierarchy of models ranging from conceptual models to full-complexity, high-resolution Earth System Models (ESMs) (Claussen et al., 2002). The strength of conceptual models lies in the clarity of representing the concept of interactions between different climate processes, while ESMs  offer greater realism when it comes to spatial or temporal detail. Intermediate complexity models are somewhere in between, they are able to provide a big picture for long timescales. A common pattern throughout the model hierarchy, except for conceptual models illustrating multiple steady states, is often linearity of model responses to external forcing. This linearity can be visible in transient experiments, but also in equilibrium simulations. The question arises: is this linearity an artefact of our models, or is it reflective of reality?


In most cases, the linear response is likely representative of reality. As an example, we will focus on the linearity of land-related processes, such as climate-carbon feedbacks and permafrost-hydrology interactions. Permafrost systems have thresholds at 0°C, leading to nonlinearities at the local scale, but the combined response at large spatial scales tends to be more linear. However, nonlinear and abrupt changes are evident in geological records. For instance, the abrupt onset of the Bölling/Alleröd warming about 14.8 thousand years ago indicates that nonlinear changes on large spatial scales are indeed a real, albeit very rare, phenomenon. We will discuss possible reasons for the predominant linearity of the models and explore whether high-resolution models might show more nonlinear responses than coarse-grid models.


Reference:

Claussen, M., Mysak, L., Weaver, A. et al. Earth system models of intermediate complexity: closing the gap in the spectrum of climate system models. Climate Dynamics 18, 579–586 (2002). https://doi.org/10.1007/s00382-001-0200-1

How to cite: Brovkin, V., Stacke, T., de Vrese, P., Kleinen, T., and Winkler, A.: From conceptual to complex earth system models: why are models so linear?, EGU General Assembly 2024, Vienna, Austria, 14–19 Apr 2024, EGU24-22102, https://doi.org/10.5194/egusphere-egu24-22102, 2024.

EGU24-35 | ECS | Orals | NP6.3

Lagrangian Coherence in Atmospheric Blocking 

Henry Schoeller, Robin Chemnitz, Stephan Pfahl, Péter Koltai, and Maximilian Engel

Atmospheric Blocking - also known as Quasi-Stationary Atmospheric States (QSAS) - exert a major influence on mid-latitude atmospheric circulation and are known to be associated with extreme weather events. Previous work has highlighted the importance of the origin of air parcels that define the blocking region, especially with respect to non-adiabatic processes such as moisture transport and latent heating. So far, an objective method for clustering the individual Lagrangian trajectories passing through the QSAS into larger and - more importantly - spatially coherent air streams has not been established, which is the focus of our current work.

    Coherent sets are regions in the phase space of dynamical systems that keep their geometric integrity to a large extent during temporal evolution. We extract a low-dimensional representation of the Lagrangian data via diffusion maps and cluster the trajectories in this representation to estimate coherent sets. Our implementation adapts the existing methodology to the non-Euclidean geometry of Earth's atmosphere and its challenging scaling properties. Several example cases are investigated. 

    The results confirm the existence of spatially coherent feeder airstreams differing with respect to their dynamical properties and, more specifically, their latent heating contribution. Air streams experiencing a considerable amount of latent heating occur mainly during the maturing and maintanence phases of the QSAS and contribute to its stability. In our example cases, trajectories also exhibit an increase in density when passing through the blocking region during its maintanence phase, which is in line with the common understanding of QSAS as regions of high stability. 

How to cite: Schoeller, H., Chemnitz, R., Pfahl, S., Koltai, P., and Engel, M.: Lagrangian Coherence in Atmospheric Blocking, EGU General Assembly 2024, Vienna, Austria, 14–19 Apr 2024, EGU24-35, https://doi.org/10.5194/egusphere-egu24-35, 2024.

EGU24-2652 | ECS | Posters on site | NP6.3

FLEXPART-11: Advancements in a Lagrangian Atmospheric Model for Enhanced Accuracy, Efficiency, and Flexibility 

Lucie Bakels, Daria Tatsii, Anne Tipka, Marina Dütsch, Michael Blaschek, Silvia Bucci, Andreas Plach, Martin Vojta, Petra Seibert, Ignacio Pisso, Sabine Eckhardt, Massimo Cassiani, Christine Groot Zwaaftink, Marie Mulder, and Andreas Stohl

Numerical methods and advanced simulation codes play a crucial role in helping us understand complex atmospheric processes. As technology progresses, it's important to develop sophisticated code for accurate and efficient simulations. In this update to FLEXPART, a Lagrangian model used in numerous studies for the past 30 years, we've made significant improvements. This version of FLEXPART shows improvements in accuracy and computational efficiency. By using native ECMWF coordinates, we reduced conservation errors by about 8-10% for semi-conserved quantities like potential vorticity. The shape of aerosol particles are now properly accounted for, greatly improving the accuracy of the deposition of non-spherical particles (e.g. microplastic fibers). Additionally, the incorporation of OpenMP parallelisation makes the model better suited for handling large input data and extended simulation periods. We've also introduced new methods for the input and output of particles in FLEXPART. Users can now run FLEXPART with their own particle input data, making it more adaptable for specific research scenarios.

How to cite: Bakels, L., Tatsii, D., Tipka, A., Dütsch, M., Blaschek, M., Bucci, S., Plach, A., Vojta, M., Seibert, P., Pisso, I., Eckhardt, S., Cassiani, M., Groot Zwaaftink, C., Mulder, M., and Stohl, A.: FLEXPART-11: Advancements in a Lagrangian Atmospheric Model for Enhanced Accuracy, Efficiency, and Flexibility, EGU General Assembly 2024, Vienna, Austria, 14–19 Apr 2024, EGU24-2652, https://doi.org/10.5194/egusphere-egu24-2652, 2024.

EGU24-3997 | ECS | Orals | NP6.3

A global Lagrangian eddy dataset based on satellite altimetry  

Tongya Liu and Ryan Abernathey

The methods used to identify coherent ocean eddies are either Eulerian or Lagrangian in nature, and nearly all existing eddy datasets are based on the Eulerian method. In this study, millions of Lagrangian particles are advected by satellite-derived surface geostrophic velocities over the period of 1993–2019. Using the method of Lagrangian-averaged vorticity deviation (LAVD), we present a global Lagrangian eddy dataset (GLED v1.0). This open-source dataset contains not only the general features (eddy center position, equivalent radius, rotation property, etc.) of eddies with lifetimes of 30, 90, and 180 days, but also the trajectories of particles trapped by coherent eddies over the lifetime. We present the statistical features of Lagrangian eddies and compare them with those of the most widely used sea surface height (SSH) eddies, focusing on generation sites, size, and propagation speed. A remarkable feature is that Lagrangian eddies are generally smaller than SSH eddies, with a radius ratio of about 0.5. Also, the validation using Argo floats indicates that coherent eddies from GLED v1.0 exist in the real ocean and have the ability to transport water parcels. Our eddy dataset provides an additional option for oceanographers to understand the interaction between coherent eddies and other physical or biochemical processes in the Earth system.

How to cite: Liu, T. and Abernathey, R.: A global Lagrangian eddy dataset based on satellite altimetry , EGU General Assembly 2024, Vienna, Austria, 14–19 Apr 2024, EGU24-3997, https://doi.org/10.5194/egusphere-egu24-3997, 2024.

EGU24-4656 | ECS | Orals | NP6.3

Three-dimensional influencers in the Western Baltic Sea: finite time coherent sets and their role for biological processes 

Rahel Vortmeyer-Kley, Bronwyn Cahill, Maximilian Berthold, and Ulrike Feudel

Describing and tracking three-dimensional flow structures in an ocean setting may explain elemental and biodiversity pattern. A possible tool can be finite time coherent sets. These sets are Lagrangian Coherent Structures characterized by minimal leakage and minimal exchange with their surrounding environment.

In oceanic settings, they can be understood as separated waterbodies or eddies playing an important role for transport and mixing processes.

Due to limited interaction with their surroundings, they even influence biological processes by providing competitive advantages for some species, for example, optimal temperature or nutrient conditions.

In a case study of three-dimensional finite time coherent sets in the Western Baltic Sea in May and July 2018, we show some different impacts on biological processes:

  • enhancement of phytoplankton growth in the set's surrounding,
  • transport of cold nutrient rich water from shallower to deeper regions, and
  • the formation of transient, moving dynamical niches with higher temperature inside the coherent set compared to its surrounding, prolonging the life of an existing phytoplankton bloom that is trapped during the formation of the coherent set.

Moreover, different dynamical patterns can be observed inside the finite time coherent sets during their travel and lifetime. Temporal stratification and mixing inside the coherent sets suppress or enhance growth temporally and locally.

In the coherent set’s surrounding, the formation of a “sticking” manifold supports the development of a local phytoplankton bloom in the upper water column.

Our case study in the Western Baltic Sea provides a first step towards understanding the impact of three-dimensional coherent sets on transport processes and phytoplankton growth in the Baltic Sea, as well as, the formation of dynamical pattern inside three-dimensional coherent sets.

How to cite: Vortmeyer-Kley, R., Cahill, B., Berthold, M., and Feudel, U.: Three-dimensional influencers in the Western Baltic Sea: finite time coherent sets and their role for biological processes, EGU General Assembly 2024, Vienna, Austria, 14–19 Apr 2024, EGU24-4656, https://doi.org/10.5194/egusphere-egu24-4656, 2024.

EGU24-6434 | Orals | NP6.3

A Maxey-Riley modeling framework for Sargassum raft drift 

M. Josefina Olascoaga

Sargassum has historically been found in the subtropical North Atlantic gyre where it provides important habitat for diverse marine species. However, since 2011 with the development of the Great Atlantic Sargassum Belt in the equatorial Atlantic, abundance has greatly increased, resulting in shorelines mass stranding. These coastal inundations of Sargassum have major impacts on the ecology, economies, and health of affected areas.
Understanding the Sargassum raft's motion is required to be able to predict the areas that could be affected by Sargassum. The motion of the rafts is fundamentally unlike Lagrangian (i.e., infinitesimally small, neutrally buoyant) particle motion since they represent finite-size, buoyant objects subjected to the action of ocean currents, wind, and waves. In this talk, we will present a Maxey-Riley model for the motion of Sargassum rafts that takes their inertial nature into account as well as the elastic interactions within a raft and physiological changes affecting the structure of the rafts.  This will be accompanied by a discussion of results from field and laboratory experiments used to validate the model. Joint work with F. J. Beron-Vera and G. Bonner.

How to cite: Olascoaga, M. J.: A Maxey-Riley modeling framework for Sargassum raft drift, EGU General Assembly 2024, Vienna, Austria, 14–19 Apr 2024, EGU24-6434, https://doi.org/10.5194/egusphere-egu24-6434, 2024.

EGU24-6839 | ECS | Posters on site | NP6.3

Impact of high-frequency motions on oceanic surface dispersion 

Laura Gomez-Navarro, Erik van Sebille, Clement Ubelmann, Veronica Morales-Marquez, Ismael Hernandez-Carrasco, Joey Richardson, Duarte Soares, Pierre Daniel, Aurelie Albert, Jean-Marc Molines, Julien Le Sommer, and Laurent Brodeau

Understanding the oceanic surface dispersion has important applications in ocean pollution scenarios. Of the different ocean pollution events, some of which have the most impact both on the marine environment and, on society and economy are: marine plastics, oil spills and Sargassum inundation events. Understanding the ocean dynamics that affect their trajectories is vital to simulate their pathways, and thus know their sources and sinks. This can then be used to implement clean-up strategies and to better manage MPAs. It can also help reduce the impact of ocean pollution on the marine environment and some major economic sectors like tourism. High frequency motions have an important impact on the surface dynamics, but high temporal resolution data is necessary to study their effects. New datasets and methodologies have allowed to obtain better representations of high frequency motions. Here, we specifically focus on the high frequency motions due to tides (like for example internal waves), as well as inertial oscillations. We simulate surface trajectories of plastic, oil and Sargassum using the OceanParcels Lagrangian simulator. We focus on three regions in the Atlantic Ocean: Açores Islands, North Atlantic and Tropical Atlantic, respectively. For the plastic simulations we look at the effect of tides by using velocity outputs from a high-resolution model which is a twin simulation without and with tidal forcing. For the oil spills and Sargassum outputs we use a new surface currents product generated by combining velocity data from drifters, high-frequency winds and altimetry to reconstruct high-frequency surface currents. We find that considering high-frequency motions is key to correctly simulate their surface trajectories, but that further work is necessary to understand the ocean dynamics at the fine-scales that can drive the variability in these Lagrangian trajectories.

How to cite: Gomez-Navarro, L., van Sebille, E., Ubelmann, C., Morales-Marquez, V., Hernandez-Carrasco, I., Richardson, J., Soares, D., Daniel, P., Albert, A., Molines, J.-M., Le Sommer, J., and Brodeau, L.: Impact of high-frequency motions on oceanic surface dispersion, EGU General Assembly 2024, Vienna, Austria, 14–19 Apr 2024, EGU24-6839, https://doi.org/10.5194/egusphere-egu24-6839, 2024.

EGU24-7549 | ECS | Orals | NP6.3

Impact of Swimmer Dynamics on Odor Transport by Mesoscale Swimmers in Turbulent Environments 

Martin James, Francesco Viola, and Agnese Seminara

Odor transport in fluidic environments is a subject of great importance, holding implications for numerous scientific disciplines, including fluid dynamics, biological studies, and engineering disciplines. Odor tracking serves as the foundation for various natural processes, such as the navigation of marine organisms and the foraging behavior of insects. Turbulent fluctuations add another level of complexity to the problem of odor transport in fluidic environments. 

The odor emitted by swimmers is not only influenced by the environment but also by hydrodynamic fluctuations caused by their dynamics. This effect is evident in large swimmers, where the wakes caused by their swimming dynamics could potentially alter odor distribution. However, it is much less clear whether and how hydrodynamic interactions affect the odor distribution of mesoscale swimmers. 

In this work, we explore the coupling of chemical and mechanical signals from mesoscale swimmers (Reynolds number <= 50), immersed in a turbulent open channel flow. We use a model system comprising a collection of swimmers in an open channel flow to explore the propagation and interaction of these signals. Furthermore, we vary their Reynolds numbers and evaluate the consequential changes in odor distribution. We show that the velocity fluctuations due to the swimmers play a significant role in changing the range and distribution of odor signals by screening the intensity and fluctuations of odor distribution downstream. We found substantial differences in odor screening depending on whether the swimmers are 'pushers' or 'pullers', the latter being more effective in screening their odor from predators. Our findings provide valuable insights into the coupling of mechanical and chemical signals of mesoscale swimmers in turbulence with novel considerations regarding the evolutionary preferences of specific swimming modes. 

How to cite: James, M., Viola, F., and Seminara, A.: Impact of Swimmer Dynamics on Odor Transport by Mesoscale Swimmers in Turbulent Environments, EGU General Assembly 2024, Vienna, Austria, 14–19 Apr 2024, EGU24-7549, https://doi.org/10.5194/egusphere-egu24-7549, 2024.

EGU24-8754 | Orals | NP6.3

Assessment of turbulent dispersion in the Red River plume region, northeast Vietnam, based on Lagrangian observations and modeling 

Alexei Sentchev, Duc Thinh Nguyen, Duy Vinh Vu, and Stefano Berti

The study aims to assess turbulent dispersion processes in the coastal regions of northeastern Vietnam, in order to meet the major challenge of monitoring the fate of particulate materials in this part of the East Vietnam Sea, home to the most famous tourist sites and economic sites. The study area is strongly influenced by the freshwater discharge of the Red River, which creates a large river plume, greatly affecting coastal circulation and turbulent dispersion. The monsoon wind profoundly alters the dynamics of the river plume, pushing light surface water seaward over long distances, in summer, and toward the coast, in winter. Sea surveys were organized for the first time in this region in 2022 and 2023 to better characterize the processes controlling coastal flow variability and turbulent dispersion in the plume region and surrounding waters. Surface drifters, released in the  plume region, were tracked during short periods of time, lfrom one to a few days. Current velocity profiling and CTD profiling have been also done. Estimates of the relative dispersion based on surface drifter measurements have revealed that the dispersion regime is local, mainly ballistic and Richardson, induced by turbulent eddies whose size does not exceed a few km. Local wind variability, combined with variations in bathymetry, considerably affects the transport pathways of real drifters and modifies the dispersion regime. A coastal circulation model was used to better assess dispersion processes over the entire study area and for a wide range of variability in the main forcing terms. Virtual surface drifters were tracked in the model velocity field during the surveying periods. The results revealed that, on scale of several days, the transport of passive tracers is considerably affected by irregularities in current velocity fields associated with zones of current convergence and divergence. The results also demonstrated that merging observations with model outputs significantly improves the representation of small scale features of current variability, turbulent mixing, and horizontal stirring of tracers in the plume region.

How to cite: Sentchev, A., Nguyen, D. T., Vu, D. V., and Berti, S.: Assessment of turbulent dispersion in the Red River plume region, northeast Vietnam, based on Lagrangian observations and modeling, EGU General Assembly 2024, Vienna, Austria, 14–19 Apr 2024, EGU24-8754, https://doi.org/10.5194/egusphere-egu24-8754, 2024.

In this presentation, I will describe a maritime oil spill case that affected the Eastern Mediterranean and several Middle Eastern countries' shorelines in early 2021 [1]. The sequence of events was successfully reconstructed, supported by remote sensing images and Lagrangian Coherent Structures. The comparison of the performance of various datasets found connections between Lagrangian Coherent Structures and Uncertainty Quantification [2].

Acknowledgments

Support from PIE project Ref. 202250E001 funded by CSIC, from grant PID2021-123348OB-I00 funded by MCIN/ AEI /10.13039/501100011033/ and by FEDER A way for making Europe.

References

[1] G. García-Sánchez, A. M. Mancho, A. G. Ramos, J. Coca, S. Wiggins. Structured pathways in the turbulence organizing recent oil spill events in the Eastern Mediterranean.   Scientific Reports 12, 3662 (2022).

[2] G. Garcia-Sanchez, A.M. Mancho, M. Agaoglou, S. Wiggins. New links between invariant dynamical structures and uncertainty quantification. Physica D 453, 133826 (2023).

How to cite: Mancho, A. M.: Quantifying Uncertainty in Lagrangian Transport for Assessing Environmental Problems, EGU General Assembly 2024, Vienna, Austria, 14–19 Apr 2024, EGU24-10330, https://doi.org/10.5194/egusphere-egu24-10330, 2024.

EGU24-10533 | Posters on site | NP6.3

Vertical distribution of net zooplankton biomass at the time of winter vertical mixing in the open southern Adriatic Sea (Mediterranean Sea) 

Mirna Batistić, Rade Garić, Marijana Hure, Nika Pasković, Laura Ursella, Vanessa Cardin, Giussepe Civitarese, Miroslav Gačić, and Stefano Miserocchi

The open southern Adriatic Sea with a maximum depth of 1242 m is one of the three sites of open deep-sea convection in the Mediterranean Sea. The effects of winter vertical mixing on zooplankton biomass were investigated in the open southern Adriatic Sea in February 2023. Samples were collected using Nansen nets (250 µm mesh size) in eight layers from 0 to 1200 m depth during day and night. The highest biomass values were sampled in the deeper layers below 300 m depth (twice as high as in the upper layers) both in the day and night samples. This could be related to vertical mixing in several pathways. This event was triggered by cold winter conditions and significant heat loss in the previous days, which together with the inflow of high salinity water from the eastern Mediterranean (38.96) caused strong vertical mixing down to 600 m depth. As a result of this event, relatively high chlorophyll-a concentrations (max. 0.33 mgm-3) were measured down to 600 m depth. Therefore, due to the vertical mixing, deeper layers received more food than usual from the surface, so that more food was available for deep-sea zooplankton organisms and they did not have to migrate upwards. The effect of vertical mixing in winter was also clearly visible in some zooplankton organisms that cannot effectively resist the vertical currents, so that they also contribute to the increase in biomass at depth. This is confirmed by the backscattering strength (Sv) data, which show that convective mixing resulted in a smeared Sv signal, indicating that the plankton was transported to deeper layers and no migration took place.

Future studies should consider the influence of open-sea convective events on vertical carbon export in the oligotrophic southern Adriatic.


How to cite: Batistić, M., Garić, R., Hure, M., Pasković, N., Ursella, L., Cardin, V., Civitarese, G., Gačić, M., and Miserocchi, S.: Vertical distribution of net zooplankton biomass at the time of winter vertical mixing in the open southern Adriatic Sea (Mediterranean Sea), EGU General Assembly 2024, Vienna, Austria, 14–19 Apr 2024, EGU24-10533, https://doi.org/10.5194/egusphere-egu24-10533, 2024.

EGU24-12049 | ECS | Posters on site | NP6.3

Lagrangian Coherent Structure regimes in the Baltic Sea and impact on algal blooms 

Dimitrios Antivachis, Kristofer Döös, Lars Axell, Lars Arneborg, and Inga Monika Koszalka

Algal blooms are common in the Baltic Sea during the summer, where they pose a significant threat to coastal services and industries. Lagrangian Coherent Structures (LCS) have been shown to play an important role in driving the mixing and transport of water masses and tracers in other ocean basins, such as the Mediterranean Sea (Antivachis et al. 2023), and are thus expected to have a strong effect on transport processes and the development and spread of algal blooms in the Baltic Sea.

In this work, we use trajectory-derived Largangian diagnostics to investigate the distribution and variability of LCS in the Baltic Sea, using a series of 10-day trajectory experiments during summer 2022. Finite Size Lyapunov Exponent (FSLE), Trajectory Rotation Angle (TRA) and related metrics are
used to assess the impact of LCS on horizontal mixing and dispersion processes in the basin. The potential influence of LCS on the spread and impact of algal blooms by opening/closing off transport pathways and exposing/shielding coastal regions is investigated by relating the spatiotemporal distribution of LCS to surface cyanobacteria concentrations obtained from satellite observations. The LCS regime in the Baltic Sea is compared to the ones observed in the Mediterranean in the author’s previous work (Antivachis et al. 2023). This is the first study to map the LCSs of the Baltic Sea and investigate their impact on algal blooms in that basin.

This work is part of the ongoing ALGOTL project, funded by the Swedish research council for sustainable development (FORMAS), aiming to develop a Lagrangian modelling and forecasting framework for algae growth and dispersion for assessing the risk posed by algal blooms. Particle advection is carried out using velocity fields from the Swedish Hydrological and Meteorological Institute (SMHI) NEMO-Nordic configuration (Hordoir et al. 2019) and the TRACMASS Lagrangian trajectory code (Aldama-Campino et al. 2020).

References

Dimitrios Antivachis, Vassilios Vervatis, and Sarantis Sofianos. Lagrangian coherent structures in the mediterranean sea: Seasonality and basin regimes. Progress in Oceanography, 215:103051, 2023. https://doi.org/10.1016/j.pocean.2023.103051

Hordoir, R., Axell, L., Höglund, A., Dieterich, C., Fransner, F., Gröger, M., Liu, Y., Pemberton, P., Schimanke, S., Andersson, H., Ljungemyr, P., Nygren, P., Falahat, S., Nord, A., Jönsson, A., Lake, I., Döös, K., Hieronymus, M., Dietze, H., Löptien, U., Kuznetsov, I., Westerlund, A., Tuomi, L., and Haapala, J.: Nemo-Nordic 1.0: a NEMO-based ocean model for the Baltic and North seas – research and operational applications, Geosci. Model Dev., 12, 363–386, https://doi.org/10.5194/gmd-12-363-2019, 2019. 

Aldama-Campino, Aitor, Döös, Kristofer, Kjellsson, Joakim, & Jönsson, Bror. (2020, December 17). TRACMASS: Formal release of version 7.0 (Version v7.0-beta). Zenodo. http://doi.org/10.5281/zenodo.4337926

How to cite: Antivachis, D., Döös, K., Axell, L., Arneborg, L., and Koszalka, I. M.: Lagrangian Coherent Structure regimes in the Baltic Sea and impact on algal blooms, EGU General Assembly 2024, Vienna, Austria, 14–19 Apr 2024, EGU24-12049, https://doi.org/10.5194/egusphere-egu24-12049, 2024.

EGU24-12353 | Posters on site | NP6.3

Lagrangian tracking of key demersal species in the western Mediterranean Sea: a high-resolution model approach 

Juan-Manuel Sayol, Isabel Vigo, David Garcia Garcia, and Cesar Bordehore

In this study we explore the most frequent trajectories of relevant demersal species in the western Mediterranean Sea. In particular, we focus on the Ibiza Channel, a region characterized by the interaction of water masses with distinct properties and by an intense fishing activity. Demersal species are suposed to be in planktonic stage, thus they behave, almost, as passive particles, being driven by the dominant ocean currents. The origin of selected demersal species, their preferred water mass properties, and their temporal variability are evaluated with a set of 2D and 3D backward Lagrangian simulations performed over a high-resolution ocean model. The model we use is the IBI-MFC, part of the Copernicus catalogue with a spatial resolution of 1/36º and 50 vertical layers. Moreover, the Lagrangian tracking is done with OceanParcels software.


With the above approach we get the most probable pathways, and associated water mass characteristics, of those demersal species of interest. Besides, a detailed evaluation of simulated trajectories provides interesting insights on the spatial and temporal changes in the origin of demersal species weeks before they reach the Ibiza Channel. These results are especially important to stablish new biodiversity hotspots that should be protected, e.g., as
eggs and larvae exportation areas.

How to cite: Sayol, J.-M., Vigo, I., Garcia Garcia, D., and Bordehore, C.: Lagrangian tracking of key demersal species in the western Mediterranean Sea: a high-resolution model approach, EGU General Assembly 2024, Vienna, Austria, 14–19 Apr 2024, EGU24-12353, https://doi.org/10.5194/egusphere-egu24-12353, 2024.

EGU24-13046 | ECS | Orals | NP6.3

Non-negligible impact of Stokes drift and wave-driven Eulerian currents on simulated surface particle dispersal in the Mediterranean Sea 

Siren Rühs, Erik van Sebille, Aimie Moulin, Emanuela Clementi, and Ton van den Bremer

Marine surface particle dispersal simulations are crucial for addressing societal issues such as plastic pollution, oil spills, biological connectivity, and recovery missions. However, the quality of these Lagrangian simulations depends on how well the underlying numerical model represents the prevalent ocean circulation features.

Here, we investigate how simulated surface particle dispersal changes, if the – often neglected or only approximated – impact of surface waves is included. Under the influence of surface waves, a particle not only moves with the Eulerian current velocity but also experiences a net drift in the direction of wave propagation, known as Stokes drift. Moreover, wave-current interactions result in wave-driven Eulerian currents. We use the output of a coupled ocean-wave model configuration for the Mediterranean Sea to answer the following questions: What is the relative impact of Stokes drift and wave-driven Eulerian currents? How well can the total wave impact be represented by the commonly used approximation consisting of the superposition of Eulerian currents and Stokes drift obtained from independenntly run ocean and wave models?

We find that Stokes drift as well as wave-driven Eulerian currents can have a non-negligible impact on surface particle dispersal. While both tend to act in opposing directions, they do not necessarily cancel each other out, due to different temporal and spatial variability. Our analyses suggest a seasonal dependency of the wave impact. For a major part of the Mediterranean Sea, ocean-wave coupling increases the simulated mean Lagrangian surface speed in winter through a dominant impact of Stokes drift and decreases it in summer through a dominant impact by wave-driven Eulerian currents. Yet, some regions also exhibit a dominance of either Stokes drift or wave-driven Eulerian current impact throughout the year. Consequently, applying the commonly used approximation is not always beneficial for surface particle simulations. The advantage or disadvantage of the approximation compared to neglecting any wave impact depends on the season, region, and Lagrangian measure of interest, and is difficult to estimate a priori. Hence, whenever possible, coupled ocean-wave models should be employed for surface particle dispersal simulations.


How to cite: Rühs, S., van Sebille, E., Moulin, A., Clementi, E., and van den Bremer, T.: Non-negligible impact of Stokes drift and wave-driven Eulerian currents on simulated surface particle dispersal in the Mediterranean Sea, EGU General Assembly 2024, Vienna, Austria, 14–19 Apr 2024, EGU24-13046, https://doi.org/10.5194/egusphere-egu24-13046, 2024.

EGU24-14799 | Posters on site | NP6.3

Offline-Coupling of the Lagrangian Particle Dispersion Model FLEXPART to ICON 

Stephan Henne, Pirmin Kaufmann, Lukas Emmenegger, and Dominik Brunner

Over the last years, the numerical weather prediction (NWP) and climate model ICON has become the operational forecasting tool for several national weather services and research groups. Operational analysis or re-analysis fields from NWP models are often used as input for offline-coupled atmospheric chemistry and transport models. Among the latter, Lagrangian Particle Dispersion Models (LPDMs) allow computationally efficient simulations, especially for point sources such as hazardous releases and for receptor-oriented studies such as determining the sensitivity of a concentration observation to upstream surface fluxes (i.e., estimating concentration footprints). One frequently used LPDM is the FLEXible PARTticle (FLEXPART) model, which is available for inputs from different global and regional NWPs (e.g., ECMWF-IFS, WRF, COSMO). Although these versions differ in the applied horizontal and vertical coordinate systems, they have in common that they interpolate gridded NWP output from a rectangular grid to particle positions. In contrast, ICON solves its state variables on a triangular grid. To make best use of ICON output, a direct interpolation from its native grid to particle positions is required. However, compared to a rectangular grid, where interpolation can be done in a straightforward fashion applying bi-linear or bi-cubic interpolation, interpolation from a triangular grid requires additional considerations concerning the choice of interpolation stencil and weight calculations.

Starting from FLEXPART for COSMO, which shares the same vertical grid system with ICON, we revised and generalized how FLEXPART interpolates from grid input to particle positions. Four different direct interpolation methods were implemented: next neighbor (containing triangle), inverse distance weight, barycentric interpolation, and radial basis function interpolation. The resulting FLEXPART version is runs efficiently with outputs from both COSMO and ICON. Next to the direct implementation, we also evaluated an indirect coupling in which ICON output is first interpolated onto a COSMO-like, staggered grid and then used as input for FLEXPART-COSMO.

Both direct and indirect FLEXPART-ICON approaches were thoroughly evaluated by comparison of individual plume simulations resulting from point sources. As a reference simulation, the same point sources were simulated with the Aerosols and Reactive Trace gases (ART) extension of the ICON model. We discuss differences in the performance between the direct and indirect approach and between the interpolation methods. Computational costs for the different approaches are evaluated and trade-offs between model performance and computational efficiency are discussed. 

How to cite: Henne, S., Kaufmann, P., Emmenegger, L., and Brunner, D.: Offline-Coupling of the Lagrangian Particle Dispersion Model FLEXPART to ICON, EGU General Assembly 2024, Vienna, Austria, 14–19 Apr 2024, EGU24-14799, https://doi.org/10.5194/egusphere-egu24-14799, 2024.

EGU24-15051 | Orals | NP6.3

FLEXWEB - A flexible particle dispersion model web interface 

Michael Blaschek, Lucie Bakels, Marina Dütsch, and Andreas Stohl

Flexpart (FLEXible PARTicle dispersion model) is a numerical model that simulates the dispersion of gases and aerosols in the atmosphere. In order for Flexpart to be used, it must be installed and run on a (super)computer. However, this is associated with obstacles, as not all scientists have access to a supercomputer and there are often technical problems during installation or execution. In this project, we therefore want to develop a Flexpart Web Service (FLEXWEB) in which Flexpart can be run via a website. We will show first results and details on the implementation of a test project for a potential operational service. Flexpart will be containerized and the service will be run in a Kubernetes cluster (in “the” cloud or on premises) to calculate trajectories and make these results easily accessible to users. As soon as the simulation is complete, the output files will be made available for download and displayed graphically. In this way, we hope to simplify access to Flexpart for scientists worldwide.

How to cite: Blaschek, M., Bakels, L., Dütsch, M., and Stohl, A.: FLEXWEB - A flexible particle dispersion model web interface, EGU General Assembly 2024, Vienna, Austria, 14–19 Apr 2024, EGU24-15051, https://doi.org/10.5194/egusphere-egu24-15051, 2024.

EGU24-15769 | Posters on site | NP6.3

Using Ensemble Ocean Currents for Drift Predictions 

Knut-Frode Dagestad, Johannes Rohrs, Martina Idzanovic, Edel Rikardsen, and Gaute Hope

Predicting the drift of objects and substances in the ocean is relevant for several important applications, such as assisting search and rescue and oil cleanup operations, and for understanding and analysing the drift and distribution of plastics or fish eggs and larvae in the ocean.

The largest uncertainty of such simulations is normally due to currents obtained from ocean models, in particular for the short-term applications such as oil spill accidents and search and rescue operations. Assimilation of observations help make the ocean models more precise, but unfortunately only a limited amount of observations with high spatial resolution are available.

Trajectory models compensate for the imprecise forcing data by adding horizontal diffusivity, providing a spatial spread to encompass the most likely drift. However, a more realistic spread can be obtained by running an ensemble ocean model, where current fields are perturbed in a more physically sound way.

In this study, we are analysing a set of ocean surface drifters released in the Fram Strait and Barents Sea, within the domain of an 24 member ensemble setup of ROMS with 2.5km pixel size, run operationally by MET Norway.

We explore and demonstrate methods to combine the ensemble current fields to improve the predictability of the drifter trajectories. Also, we demonstrate a method for further improvement of future predictability for situations where a recent part of the drift trajectory is known, e.g. for an object with GPS tracking that has lost connection.

How to cite: Dagestad, K.-F., Rohrs, J., Idzanovic, M., Rikardsen, E., and Hope, G.: Using Ensemble Ocean Currents for Drift Predictions, EGU General Assembly 2024, Vienna, Austria, 14–19 Apr 2024, EGU24-15769, https://doi.org/10.5194/egusphere-egu24-15769, 2024.

EGU24-15796 | ECS | Posters on site | NP6.3

Time-lagged Ensemble Model Verification for Short-term Prediction of Drifter Trajectories  

Victor de Aguiar, Martina Idžanović, Johannes Röhrs, Malin Johansson, and Torbjørn Eltoft

Predicting trajectories of objects at the ocean’s surface, such as oil slicks or their utilization in search-and-rescue operations, relies heavily on underlying geophysical models. Uncertainties are inevitably present in the modeled ocean and atmospheric fields, and are inherited by the Lagrangian models, thus limiting drift forecasts up to a few days. Estimating and subsequently addressing the uncertainty of the background hydrodynamic model is critical for short-window response and preparedness. Uncertainty estimation in drift modeling has traditionally been performed by varying the magnitude of the so-called wind drift factor. Such an approach results essentially in a greater diffusion of the cloud of virtual particles as the geophysical dynamic system is fundamentally the same. This can be overcome by perturbing by hydrodynamic ensemble generation through e.g. initial condition and surface forcing perturbations.

To derive estimates of the uncertainties, we evaluate short-term (1-5 days) trajectory forecasts forced by the Barents-2.5 km operational ensemble prediction system (EPS) against observed trajectories of undrogued drifters deployed in Fram Strait and Barents Sea. Seventeen low-cost devices (OpenMetBuoy) were deployed in sea ice free conditions during two field campaigns in April and August 2022, respectively, with life spans varying between 10 days and 10 months. Using 48 time-lagged ensemble members, the uncertainty in drift predictions is quantified via error/spread ratio, two-dimensional (2D) rank histograms and reliability diagrams. The ability of the EPS to capture physical processes is verified through rotary auto- and cross-spectral analysis on 5-day segments.

Our results show that the EPS manages to capture the main rotary spectral features well, but it underestimates with up to two orders of magnitude the spectral energy density towards the higher frequencies (> 0.08 cycles per hour) for both regions. High coherence (> 0.7) between observed and modeled drifter velocities, obtained through rotary cross-spectral, was found for the Barents Sea region, decreasing to less than 0.4 for the simulations performed in the Fram Strait. Additionally, we did not find indications that the observed and modeled drifter velocities are coherent to each other relative to the wind forcing in the latter area. 

The error/spread and 2D rank histograms revealed that Barents-2.5 is underdispersive, with the Fram Strait simulations presenting higher deviation from the ideal uniform distribution and higher error/spread (2.5-5) in comparison to the Barents Sea case (1-2). Despite its lack of dispersion, the EPS is nonetheless reliable in the Barents Sea for cumulative traveled distances up to approximately 1 inertial cycle. In Fram Strait, the model over- (under-) estimates trajectory displacements for super- (sub-) inertial frequencies.

Three key outcomes are highlighted in this work: (1) Forcing simulations with wind observations marginally improves the energy spectral density, indicating that modeling improvements should focus on the ocean model; (2) Adding further ensemble members through time-lagging does not necessarily improve ensemble dispersion; (3) Ensemble underdispersion does not imply lack of reliability if the main driving forces (e.g. wind and tides) are well resolved by the model.

How to cite: de Aguiar, V., Idžanović, M., Röhrs, J., Johansson, M., and Eltoft, T.: Time-lagged Ensemble Model Verification for Short-term Prediction of Drifter Trajectories , EGU General Assembly 2024, Vienna, Austria, 14–19 Apr 2024, EGU24-15796, https://doi.org/10.5194/egusphere-egu24-15796, 2024.

EGU24-17084 | ECS | Posters on site | NP6.3

Scaling and intermittent properties of atmospheric and oceanic turbulent pCO2 time series and their difference 

Kévin Robache, François G. Schmitt, and Yongxiang Huang

The oceans interact and exchange CO2 with the atmosphere through different processes that form the biological and physical pumps. The atmospheric and oceanic partial pressures of CO2 are therefore chemical tracers impacted by numerous forcing processes, including turbulence. Turbulence thus has an impact on the fluctuations of pCO2 and on their difference, the sign of which determines the direction of the air-sea flux of CO2.

Here, we used a published database (Sutton et al., 2019) to study the scaling properties of sea temperature, sea salinity, atmospheric and oceanic pCO2 and their difference ∆pCO2 time series recorded at 38 locations every 3 hours. Fourier spectral analysis revealed scaling for ranges between 3 days and 3 months approximately. The statistics of spectral slopes over this scaling range has been considered. Then, empirical mode decomposition and Hilbert spectral analysis were used to study the intermittency properties of the time series of 3 buoys having a large enough data points. For all three locations the intermittent multifractal properties of pCO2 were considered. Some main parameters were extracted assuming a lognormal multifractal model.

How to cite: Robache, K., Schmitt, F. G., and Huang, Y.: Scaling and intermittent properties of atmospheric and oceanic turbulent pCO2 time series and their difference, EGU General Assembly 2024, Vienna, Austria, 14–19 Apr 2024, EGU24-17084, https://doi.org/10.5194/egusphere-egu24-17084, 2024.

EGU24-19490 | ECS | Orals | NP6.3

What information can be gathered from patterns in turbulent free-surface flows? 

Omer Babiker, Jørgen Aanes, Anqing Xuan, Lian Shen, and Simen A Ellingsen

Gas transfer between ocean and atmosphere is largely governed by the turbulence in the topmost centimetres beneath the free surface. It has been frequently observed that areas of strong positive divergence of the surface-tangential velocity field correspond to efficient surface renewal and consequently increased transfer of gas across the interface. Patches of strong positive surface divergence occur through intermittent upwelling events visible as ``boils'' on the surface.

It has been qualitatively observed that surface-attached ``bathtub'' vortices tend to appear at the edges of upwelling boils, as well as sharp valleys, sometimes referred to as ``scars”. Surface-attached vortices and scars leave imprints on the surface which are particularly simple to detect: the vortices are circular and live for a long time, while scars are sharp and elongated structures.

From direct numerical simulations, we show that a very high correlation exists between the time-dependent number of surface-attached vortices and the mean square of the surface divergence. We use a newly developed method whereby the surface-attached vortices are identified with high precision and accuracy from their surface imprint only.

We also looked at the turbulent structures just beneath the surface-attached vortices and the scars, noting how far under the surface these structures propagate and, thus, how far into the flow subsurface features can be read from patterns on the surface only.

The main application is in remote sensing, as these patterns on the surface can be easily detected using camera footage, for example. These patterns would give estimates of the subsurface quantities without the need for expensive measurement.

How to cite: Babiker, O., Aanes, J., Xuan, A., Shen, L., and Ellingsen, S. A.: What information can be gathered from patterns in turbulent free-surface flows?, EGU General Assembly 2024, Vienna, Austria, 14–19 Apr 2024, EGU24-19490, https://doi.org/10.5194/egusphere-egu24-19490, 2024.

EGU24-20185 | Orals | NP6.3

Lagrangian modelling of plastic transport in marine waters.  

Guttorm Alendal, Prithvinath Madduri, Anna Oleynik, Helge Avlesen, and James R. Clark

We will report on two studies we have done related to Lagrangian transport of plastic particle in marine waters.

In the first study, we investigate the particle dynamics of tyre-wear microplastics that come from road traffic across two major bridges in Byfjorden, namely the Nordhordland Bridge and the Askøy Bridge. We employ a Lagrangian particle tracking framework, OpenDrift, with background horizontal velocities from Bergen Ocean Model (BOM), paired with a vertical sinking velocity obtained from Stokes law to track individual particle paths along the flow field until they reach the seafloor. The sinking velocity is picked from a distribution that is designed based on results from point source experiments, enabling us to cover the particle dynamics for a spectrum of sinking velocities. The basis of this study lies in using the variability in local currents, by conducting multiple experiments with distinct initial locations and release times to understand the similarities and differences in the footprint. In the particle simulation, the horizontal velocity experienced by individual particles depends on release time which is related to when in the tidal cycle the particle is released. We seek insights to discover potential aggregation zones and their corresponding gradients along the bottom of the fjord. We plan to shed light on ‘how particle dynamics change when we vary the sinking velocity’. These results could be applicable in identifying the mechanisms behind particle transport in fjords and can assist in designing sampling campaigns.

In the second, we assess the amount of transboundary plastic coming along the coast of western Norway, employing a nested modelling approach. We utilize emissions data of buoyant plastics from major European rivers (Meijer et al., 2021), as an input to our Lagrangian particle tracking model simulated using OpenDrift. The background currents are provided by the nested model which includes surface currents from three grids: A 4km model of the North Atlantic - Nordic4K (Lein et al., 2013), An 800m model covering Norway’s coastline - Norkyst800 (Albertsen et al., 2011), and 160m hydrodynamical model - NorFjords160 (Dalsøren et al., 2020). As particles transit through these nested grids, we precisely track the plastic pathways into the western Norwegian fjords around the city of Bergen. Employing this nested grid setup addresses problems with boundary conditions and mass balance. We present the estimates for the fraction of plastic moving into the fjord with focus on relative influence of wind and ocean currents on the transboundary movement of plastic. This study sheds light on processes responsible for near and far field transport, providing valuable insights for agencies working on trans-national pollution laws and implementing ocean clean-up strategies.

How to cite: Alendal, G., Madduri, P., Oleynik, A., Avlesen, H., and R. Clark, J.: Lagrangian modelling of plastic transport in marine waters. , EGU General Assembly 2024, Vienna, Austria, 14–19 Apr 2024, EGU24-20185, https://doi.org/10.5194/egusphere-egu24-20185, 2024.

EGU24-20942 | Posters on site | NP6.3

Nordstream pipelines CH4 leak estimates and transport uncertainty using ICOS data and the FLEXPART Lagrangian particle dispersion model 

Ignacio Pisso, Stephen Platt, Norbert Schmidbauer, Sabine Eckhardt, Nikolaos Evangeliou, Erik Marthinsen, Rona Thompson, and Massimo Cassiani

Following the sabotage of the Nord Stream 1 and 2 subsea pipelines on 26 September 2022, natural gas leaks resulted in unprecedented emissions of methane that were detected by several ICOS stations. As the plume traveled North, the detections occurred mainly in Scandinavia. NILU’s initial modeling activities provided a preliminary estimate of 155 KtonCH4 for the leaks that was made public as a press release. A recent collaborative effortorganized by the United Nations Environment Programme’s International Methane Emissions Observatory (UNEP’s IMEO) provided new model-based pipeline rupture outflow rates. In combination with updated ICOS CH4 time series we updated the estimated release values produced. We discuss the uncertainties associated with the atmospheric modelling for this updated analysis with emphasis on the Lagrangian transport aspects of the problem and the associated uncertainties.

How to cite: Pisso, I., Platt, S., Schmidbauer, N., Eckhardt, S., Evangeliou, N., Marthinsen, E., Thompson, R., and Cassiani, M.: Nordstream pipelines CH4 leak estimates and transport uncertainty using ICOS data and the FLEXPART Lagrangian particle dispersion model, EGU General Assembly 2024, Vienna, Austria, 14–19 Apr 2024, EGU24-20942, https://doi.org/10.5194/egusphere-egu24-20942, 2024.

AS6 – Short Courses & EDI

EGU24-410 | ECS | Orals | EOS3.1 | Highlight

Family-Friendly Conferences in the Geosciences 

Elena Päffgen, Leonie Esters, and Lisa Schielicke

Participation in (inter-) national conferences, seminars, and workshops such as the EGU General Assembly is important for professional exchange and personal networking, especially for early career scientists. Enabling scientists with family obligations to take part in conferences will increase gender equity and diversity, as women remain to be the main caregivers in most families.

The questions of family planning and kickstarting a professional career arise simultaneously in almost any field. What makes this particularly challenging for young families in academia is that this line of work frequently requires for parents to move, making traditional forms of supportive caregiving by extended family members often unavailable. The vital role conference attendance plays for an academic career only aggravates that challenge. Therefore, a lack of opportunities to attend conferences and workshops clearly puts young parents at a disadvantage, especially young women in academia.

The Project for Family-Friendly Conferences has been initiated by Leonie Esters and Lisa Schielicke from the Department of Geosciences at the University of Bonn in April 2023. Elena Päffgen joined as a research assistant (WHK) later the same year. With an initial duration of one and a half years the project is funded by the Gleichstellungsbüro (office for equal opportunities) of the university. Our principal goal is to find out, how conference and workshop participation can be made more family-friendly.

The present work analyses an online survey with 245 participants who were interviewed on the topic of family-friendly conferences. The survey was addressed to all scientists with a focus on geosciences, 58% of all participants claimed to have children, while 42% were childless. 61 comments expressing wishes and needs of parents and guardians we received from the participants underscore the urgency of the matter. Key concerns of the participants were clear communication (e.g., whether children could be brought along to the events in question), awareness among event-organizers, and easy access to financial assistance (e.g. for babysitting). For instance, more hybrid events, on-site childcare and designated family-friendly activities at conferences were named as possible improvements. However, considering that families and their challenges are diverse, a wide array of offers and flexibility are required to address their needs.

Our project aims to educate the wider academic community on family-specific challenges. Based on the results of this survey, we will provide conference organizers with guidelines to improve family-friendliness of conferences and facilitate their exchange among each other. Additionally, we want to keep parents informed about the offers for families that are already in place at conferences in our field of study. Overall, we are convinced that outcomes of our project will be beneficial for conference and workshop organizers likewise as for researchers who are parents and will contribute to gender equity and diversity in academia.

Children, parents and guardians are particularly welcome to the poster presentation and discussion.

If you would like to participate in our survey: https://www.empirio.de/s/VxLGGLxWv2


How to cite: Päffgen, E., Esters, L., and Schielicke, L.: Family-Friendly Conferences in the Geosciences, EGU General Assembly 2024, Vienna, Austria, 14–19 Apr 2024, EGU24-410, https://doi.org/10.5194/egusphere-egu24-410, 2024.

The European Geosciences Union (EGU) is the leading organisation supporting Earth, planetary and space science research in Europe, upholding and promoting the highest standards of scientific integrity, open science and open access research. EGU’s vision is to realise a sustainable and just future for humanity and the planet through advances in Earth, planetary and space sciences.

The EGU awards and medals programme acknowledges distinguished scientists every year for their exceptional research contribution to the Earth, planetary and space sciences. Furthermore, it recognises the awardees as role models for the following generation of early-career scientists, encouraging geoscience research. 

Except for EGU council and award committee members everyone (including non-EGU members) is eligible for receiving an EGU award. Nominations need to be submitted by EGU members online by 15 June every year. Each EGU medal or award is selected through a rigorous assessment of the candidates and their merits through the respective committee. The procedures for nomination, selection of candidates and the time schedule are described in detail on the EGU website. 

EGU is committed to recognizing scientific excellence providing equal opportunities. The processes and procedures that lead to the recognition of excellence must be transparent and free of biases. However, establishment of clear and transparent evaluation criteria and performance metrics to provide equal opportunities to researchers across gender, continents and ethnic groups can be challenging since the definition of scientific excellence is often elusive. 

The purpose of this presentation is to share the experiences and efforts of the European Geosciences Union to ensure equal opportunities. The presentation will showcase data and statistics to provide constructive directions towards the objective of offering equal opportunities to researchers from diverse demographic backgrounds.

How to cite: Blunier, T.: Equality of opportunities in EGU recognitions: The EGU Awards Committee experience, EGU General Assembly 2024, Vienna, Austria, 14–19 Apr 2024, EGU24-1620, https://doi.org/10.5194/egusphere-egu24-1620, 2024.

EGU24-9435 | ECS | Orals | EOS3.1 | Highlight

Navigating parenthood as an early career scientist: insights and challenges from hydrological sciences 

Diana Spieler, Lina Stein, and Rodolfo Nóbrega

Combining an academic career with caretaking responsibilities is an often-overlooked challenge. Juggling the workload, conference attendance, or the potential requirement to move to a new job all become more demanding when children or other caretaking responsibilities are a part of your life. We, members of the Young Hydrology Society (YHS), wanted to hear some views from academic parents in hydrology. What are the challenges they face, what is their advice to other parents and what systematic changes would they like to see? This non-scientific initiative gathered responses from academics within the hydrology community from different parts of the world at different career stages, including PhD candidates, postdoctoral researchers, assistant professors, and group leaders. The survey revealed diverse challenges and strategies employed by academic parents to balance their professional and personal lives. We identified a complex interplay of personal, institutional, and cultural factors that influence these experiences in academia. A common theme across responses was the strategic timing of parenthood, often aligned with phases of planning security, such as after having won a longer-term grant. Despite the varying international backgrounds, many responses highlighted the supportive role of national policies, particularly in countries like Sweden, which offer substantial parental support and flexible work arrangements. However, challenges such as reduced research productivity, lack of support to attend conferences, and the need to relocate were frequently mentioned as limiting factors for career development and progression. Among the strategies employed to minimise these challenges, we highlight adjusting work schedules, reducing workloads, and relying on support from partners and extended family. Childcare distribution varied, with many striving for an equitable split between partners, though this was often influenced by career demands and cultural standards or expectations. The responses also contained suggestions for systemic improvement, including extended childcare facilities at conferences, more flexible job contracts, and institutional support for parents, particularly during fieldwork and conferences. While there are notable advancements in some areas, there remains a significant need for systemic changes to better support academic parents and ensure a more inclusive and equitable academic environment. It is fundamental to highlight, however, that the results of this initiative do not capture the entire spectrum of experiences faced by those with caretaking responsibilities, and that our survey is likely to be biased towards ECS who still were engaged and successful in their work. We aim to release these results as a series of blog posts on the YHS webpage (https://younghs.com/blog/) to disseminate this topic with the main aim of offering valuable reassurance to current and future parents in academia facing similar challenges.

How to cite: Spieler, D., Stein, L., and Nóbrega, R.: Navigating parenthood as an early career scientist: insights and challenges from hydrological sciences, EGU General Assembly 2024, Vienna, Austria, 14–19 Apr 2024, EGU24-9435, https://doi.org/10.5194/egusphere-egu24-9435, 2024.

EGU24-9557 | Orals | EOS3.1

Diversity at a Small Geoscience Conference 

Alice Lefebvre and Renée Bernhard

Conferences are places where intellectual and communication standards are shown. Ultimately, they can contribute to create a sense of belonging or inadequateness. However, several analyses of specific diversity measures have demonstrated that large conferences often lack diversity in terms of gender, geographic location or race. The present contribution presents an analysis of the gender, country of affiliation and student status of the participants and presenters during four instances of a small European geoscience conference, as well as the length of presentation and number and tone of questions of the latest instance of this conference. We found that women make up about one-third of participants, session chairs, invited keynote speakers, and presenters (oral and poster) on average, but percentages vary greatly from one year to the next. Students represent around 30% of participants, but over 40% of poster presenters and 28% of long presentations. In total, only half of the participants asked a question, and most of the questions were asked by senior men. Around 25% of the questions were asked with a friendly tone; the remainder were neutrally asked. Friendly questions were asked more frequently after keynote lectures and long presentations than following short talks. We suggest concrete actions that can be taken to promote the development of an inclusive and supportive environment at small conferences.

How to cite: Lefebvre, A. and Bernhard, R.: Diversity at a Small Geoscience Conference, EGU General Assembly 2024, Vienna, Austria, 14–19 Apr 2024, EGU24-9557, https://doi.org/10.5194/egusphere-egu24-9557, 2024.

EGU24-10508 | ECS | Posters on site | EOS3.1 | Highlight

An Evaluation of the ADVANCEGeo Partnership Bystander Intervention Model 

Blair Schneider, Christine Bell, Stefanie Whitmire, Horinek Hannah, Meredith Hastings, Rebecca Barnes, Allison Mattheis, Billy Williams, and Erika Marin-Spiotta

The ADVANCEGeo Partnership program, funded by a National Science Foundation ADVANCE award in 2017, was designed to empower geoscientists to transform workplace climate, and has been recently adapted to other STEMM disciplines as well. To date, the ADVANCEGeo Partnership has led over 230 workshops to institutions across the USA and Europe, in both virtual and in-person formats. A main strategy of ADVANCEGeo for organizational climate change is to enact interventions at the individual and collective level through behavior change education informed by intersectionality and ethics of care frameworks. The program uses a community-based model for bystander intervention and workplace climate education designed to give members of the academic community the knowledge and tools to identify, prevent, and mitigate harm from exclusionary behaviors that directly affect the retention of historically excluded groups in STEMM. 

Evaluation data from 81 workshops held between 2018-2022 were analyzed using a transtheoretical framework of behavioral change. All of these workshops used a consistent structure and length of presentation (averaging 2.5 hours overall). Thirty six workshops were conducted in-person (44%) and forty five workshops were conducted virtually (56%) using the Zoom platform. The workshops were conducted for a variety of audiences, including institutional leadership, academic departments, professional societies, research groups, and student groups. Each workshop included the same core components, though some materials in the presentation portion were tailored to the needs of the audience as requested. Evaluation results show positive increases in participant knowledge, satisfaction, and intent to change behavior directly after the workshop. An additional follow up survey that was disseminated approximately 6 months after the workshop provides evidence of longitudinal behavior change. These results demonstrate that the ADVANCEGeo Bystander Intervention model design successfully shifts behaviors in workshop participants, with an aim to create more positive workplace climates for all seeking to be a part of STEMM.

How to cite: Schneider, B., Bell, C., Whitmire, S., Hannah, H., Hastings, M., Barnes, R., Mattheis, A., Williams, B., and Marin-Spiotta, E.: An Evaluation of the ADVANCEGeo Partnership Bystander Intervention Model, EGU General Assembly 2024, Vienna, Austria, 14–19 Apr 2024, EGU24-10508, https://doi.org/10.5194/egusphere-egu24-10508, 2024.

EGU24-11929 | ECS | Orals | EOS3.1 | Highlight

Promoting and Supporting Equity, Diversity, Inclusion, and Accessibility: A Collaborative Approach in the Hydrogeological Community and Beyond 

Luka Vucinic, Viviana Re, Barbara Zambelli, Theresa Frommen, Fatima Ajia, and Shrikant Limaye

The International Association of Hydrogeologists (IAH) is a scientific and educational charitable organisation for scientists, engineers, water managers and other professionals working in the fields of groundwater resources planning, management and protection. Comprising various commissions and networks, IAH engages in activities such as contributing to groundwater science, outreach, education, and training. While IAH takes meaningful steps towards equity, diversity, inclusion, and accessibility, recognising the importance of putting these principles into practice, it is essential to acknowledge that there are still numerous challenges and barriers that need to be addressed. It is worth noting that IAH shares similar challenges with many other organisations and associations in navigating the path towards greater equity, diversity, and inclusion. Therefore, the establishment of a dedicated working group became imperative to address and overcome these challenges effectively.

The Socio-Hydrogeology Network (IAH-SHG), an official IAH network, aims to integrate social sciences into hydrogeological research, and has two active working groups: the Working Group on Groundwater and Gender, and the newly established Equity, Diversity, Inclusion, and Accessibility (EDIA) Working Group. This group is designed to further enhance the EDIA landscape within the IAH and beyond. It is the result of collaborative endeavours, extensive discussions, and productive meetings within the IAH and IAH-SHG, and it builds on the work and experience of the Working Group on Groundwater and Gender and the IAH-SHG in general. We will showcase the key insights gained from our IAH-SHG experiences and demonstrate how we applied these lessons to facilitate the establishment of the EDIA Working Group.

By harnessing the power of collective effort, the EDIA Working Group aims to foster a positive impact that resonates throughout the IAH and wider hydrogeological community. We will present our experience regarding the pivotal role of networks, such as IAH-SHG, in advancing equity, diversity, inclusion, and addressing barriers within the geosciences. We will also share our plans for collaboration with other IAH commissions, networks, IAH members, and other individuals (i.e. membership in the IAH is not a prerequisite for individuals interested in joining the IAH-SHG or any of its working groups), as well as ideas and recommendations for new and innovative strategies to identify and overcome barriers. Furthermore, we will share the EDIA Working Group's experience so far, providing insights that may be valuable for other associations, organisations, and groups facing similar challenges.

How to cite: Vucinic, L., Re, V., Zambelli, B., Frommen, T., Ajia, F., and Limaye, S.: Promoting and Supporting Equity, Diversity, Inclusion, and Accessibility: A Collaborative Approach in the Hydrogeological Community and Beyond, EGU General Assembly 2024, Vienna, Austria, 14–19 Apr 2024, EGU24-11929, https://doi.org/10.5194/egusphere-egu24-11929, 2024.

EGU24-12182 | ECS | Orals | EOS3.1 | Highlight

Is my teaching gender-fair? A self-assessment questionnaire. 

Sílvia Poblador, Maria Anton-Pardo, Mireia Bartrons, Xavier Benito, Susana Bernal, Eliana Bohorquez Bedoya, Miguel Cañedo-Argüelles, Núria Catalán, Isabel Fernandes, Anna Freixa, Ana Genua-Olmedo, Elisabeth León-Palmero, Anna Lupon, Clara Mendoza-Lera, Ada Pastor, Pablo Rodríguez-Lozano, Aitziber Zufiaurre, and María del Mar Sánchez-Montoya

The study of inland waters - Limnology - is full of fascinating women who have vastly contributed to our understanding of these valuable ecosystems. Although women’s visibility was low during the early years of Limnology, it has increased over time. Nowadays, women represent half of the early-career limnologists in Europe. However, as in many other fields, their scientific contributions have been traditionally neglected from schools to universities (i.e., the Matilda effect). The project “Gender LimnoEdu”, developed by the Gender&Science AIL group and funded by EGU (2020), aims to increase the visibility of women in Limnology and related subjects - such as Ecology, Hydrology or other Geosciences - in academic courses and lectures. We have created a set of online ready-to-use resources: (1) a self-evaluation form to detect gender biases and raise self-awareness for teachers of Limnology and Geosciences courses (the form is applicable to a wide range of courses and disciplines), (2) teaching nutshells highlighting key female limnologists (and their history) to help lecturers to acknowledge the role of women in Limnology in their courses, and (3) a complete teaching unit about the past and present situation of women in the field of Limnology. All these resources are freely available (https://www.genderlimno.org). Here, we will present this toolbox of resources and guide you on how to use them for your teaching needs. Moreover, we will share the preliminary results of the self-evaluation form to showcase how gender-fair Limnology lessons in high-education courses are. We welcome everybody to take it! https://www.genderlimno.org/gender-fair-lessons.html

How to cite: Poblador, S., Anton-Pardo, M., Bartrons, M., Benito, X., Bernal, S., Bohorquez Bedoya, E., Cañedo-Argüelles, M., Catalán, N., Fernandes, I., Freixa, A., Genua-Olmedo, A., León-Palmero, E., Lupon, A., Mendoza-Lera, C., Pastor, A., Rodríguez-Lozano, P., Zufiaurre, A., and Sánchez-Montoya, M. M.: Is my teaching gender-fair? A self-assessment questionnaire., EGU General Assembly 2024, Vienna, Austria, 14–19 Apr 2024, EGU24-12182, https://doi.org/10.5194/egusphere-egu24-12182, 2024.

Many universities openly pledge commitments to improving diversity, with science, technology, engineering, and math (STEM) fields receiving significant attention. Despite these efforts, geoscience remains one of the least diverse fields in STEM. This recognition has prompted an increase in studies stressing the systemic lack of representation across the field and the barriers that exist for those within. However, much of this work has been limited by the use of demographic datasets that have been either passively collected or derived from government sources. Constraints include country-specific data collection policies, failures to collect field-specific data, and the absence of additional information necessary for intersectional analysis. Advancing diversity, equity, and inclusion (DEI) in our field requires meaningful datasets that clearly identify social inequalities. Limited, incomplete, or anecdotal data are too easily dismissed by those in power, stalling constructive efforts.

In Canada, demographic data is not regularly collected at academic institutions and is seldom field-specific. This absence of data undermines efforts to identify the current state of diversity in the field and prioritise initiatives for improvement. Collecting comprehensive demographic data is a crucial step in determining whether progress is evident. It can also help to highlight areas of concern, especially in fields lacking in diversity, such as geoscience. To address this absence of data, we disseminated a 22-question demographic survey to 35 academic geoscience departments across Canada in late 2022.

We received 482 eligible responses to the survey, accounting for approximately 20% of the research population. Overall, men make up a slight majority across all respondents (53%), and the percentage of individuals who identify as white (73%) is greater than the national average (67%). Additionally, results shows that research students (MSc and PhD) are a diverse group, while salaried positions (postdoc, research staff and faculty) lack diversity in a wide range of categories including, gender, race, LGBTQ+, Indigeneity, and disability. Moreover, tenured positions are overwhelmingly occupied by white men, with racial inequalities prominent in the data.

These data highlight several areas of concern in the academic career path. The transition from research student to salaried research remains a clear area of concern, while the tenure process appears to continually favour white able-bodied cisgender men. Moreover, the representation of Indigenous persons and those with self-identified disabilities remains very low. Solutions require institutional changes to recruitment, tenure applications, postdoctoral hiring, field work design, and mentoring practices. Importantly, they also require changes to how we collect and analyse demographic datasets in geoscience, as a continued reliance on data that is passively collected or obtained from government sources will continue to limit our abilities to identify areas of concern and create effective strategies.

How to cite: Jess, S., Heer, E., and Schoenbohm, L.: Active demographic data collection in geoscience: results, implications, and recommendations from a survey of Canadian academia  , EGU General Assembly 2024, Vienna, Austria, 14–19 Apr 2024, EGU24-12643, https://doi.org/10.5194/egusphere-egu24-12643, 2024.

EGU24-13028 | Orals | EOS3.1

Embedding EDI in Geoscience Publications – Examples from the AGU  

Matthew Giampoala, Mia Ricci, and Paige Wooden

The American Geophysical Union understands an expansive and inclusive geoscience community is key to furthering knowledge about the Earth and the universe and finding solutions to current societal challenges. Though the geosciences have historically been dominated by a few homogenous groups, the collaborative and global nature of our science impels us to change our systems to include historically marginalized voices. Supported by AGU’s 2018 Diversity and Inclusion Strategic Plan, in 2023, AGU Publications signed the Joint Commitment for Action on Inclusion and Diversity in PublishingSignatories agree to collect self-reported gender and race/ethnicity data, develop baselines, and set minimum standards for inclusion. We provide a demographic overview of our authors, reviewers, and editors over time, detail how we collect data while following privacy laws, and discuss how data informs our DEIA strategies. We provide reports to our journal editors who set baselines and develop journal goals. We launched various initiatives to increase diversity and equity and decrease bias in peer review processes, and used the data to assess outcomes of these initiatives. In addition, we present examples of policy and structural changes we have implemented to weave DEIA in the scientific publishing environment, including our equitable approach to Open Access, our Community Science Exchange, and the recently launched Inclusion in Global Research policy to improve equity and transparency in research collaborations.

How to cite: Giampoala, M., Ricci, M., and Wooden, P.: Embedding EDI in Geoscience Publications – Examples from the AGU , EGU General Assembly 2024, Vienna, Austria, 14–19 Apr 2024, EGU24-13028, https://doi.org/10.5194/egusphere-egu24-13028, 2024.

EGU24-14684 | Posters on site | EOS3.1

Nakkihomma: attitudes towards and distributions of academic household work 

Katja Anniina Lauri, Xuefei Li, Paulina Dukat, Nahid Atashi, Laura Karppinen, Katrianne Lehtipalo, Anna Lintunen, Dmitri Moisseev, Janne Mukkala, Tuomo Nieminen, Rosa Rantanen, Timo Vesala, Ilona Ylivinkka, and Hanna Vehkamäki

The equality and work well-being group at the Institute for Atmospheric and Earth System Research (INAR) at the University of Helsinki conducted a survey about academic household work (AHW) tasks among the institute’s staff in autumn 2023. The main aim of the survey was to find out how different AHW tasks are divided among the staff members and how the staff members consider these tasks.

Before the actual survey, we asked the staff to list tasks they consider AHW (nakkihomma in Finnish; direct translation: Frankfurter task). A few examples of AHW tasks we got: sending calendar invitations for meetings, making coffee for others, helping to organize social events at the institute, emotional service work (being involved in discussion with colleagues or students about their personal affairs or problems). For the survey, we grouped the proposed tasks in three categories (number of tasks in parentheses): research-related tasks (3), society-related tasks (4) and community-related tasks (29). The last category was further divided into four subcategories: tasks related to meetings (7), social events (6) and facilities (9), and miscellaneous (7). We asked which tasks the staff members consider as AHW, and how frequently they are committed to each task.

We received a total of 91 answers to the survey. This corresponds to 33% of our staff, but according to the background information we collected, the different groups in terms of gender, career stage, language status (Finnish/non-Finnish speaker) and staff group (research/technical/administrative) were represented well.

The general attitude towards AHW was surprisingly positive: 57% of respondents had a positive attitude while 35% had a neutral attitude. Senior research staff members use a considerable amount of time participating in different committee meetings while early-career researchers do not so much; however, they do a great deal of practical duties related to meetings. Furthermore, we found out that a lot of emotional service work is being done. Interestingly, early career researchers do not consider this generally as AHW while senior researchers do. Male staff members contribute more to technical writing and guiding tasks while female staff use more of their time in emotional service work and general collective AHW tasks. Finnish speakers contribute more to writing and guiding tasks while non-Finnish speakers are more frequently committed in “catering” AHW like making coffee. Technical and administrative personnel generally contribute more to AHW than research staff.

We hope that the results of this survey will help us developing a more equitable and inclusive atmosphere in our institute by enabling us to pay more attention in distributing AHW tasks in a more equal and just manner.

How to cite: Lauri, K. A., Li, X., Dukat, P., Atashi, N., Karppinen, L., Lehtipalo, K., Lintunen, A., Moisseev, D., Mukkala, J., Nieminen, T., Rantanen, R., Vesala, T., Ylivinkka, I., and Vehkamäki, H.: Nakkihomma: attitudes towards and distributions of academic household work, EGU General Assembly 2024, Vienna, Austria, 14–19 Apr 2024, EGU24-14684, https://doi.org/10.5194/egusphere-egu24-14684, 2024.

EGU24-16168 | Posters on site | EOS3.1

Inclusive excellence at the ERC: latest actions and results of sustained measures 

Claudia Jesus-Rydin, Luis Fariña-Busto, and Eystein Jansen

The European Research Council (ERC), Europe’s premiere funding agency for frontier research, views equality of opportunities as an essential priority and a vital mission to ensure fairness in the review process. The ERC monitors various demographic data yearly on every call and has taken actions to tackle imbalances and potential implicit and explicit biases.

The presentation focuses on ERC general historical data for the three individual funding schemes: Starting Grant, Consolidator Grant and Advanced Grant. Demographic geosciences data of proposals and grants, disaggregated by gender and country, is presented. After more than 14 years of existence and various specific actions to tackle societal imbalances, ERC data provides an insight of the impact of various actions.

In the first framework programme (FP7, 2007-2013), 25% of applicants were women. In the last years (Horizon 2020, 2014-2020), this percentage increased by 4%, with 29% of women applying for ERC grants. In the same periods of time, the share of women as grantees has also increased from 20% to 29%. In the last years, men and women enjoy equal success rates (data for non-binary applicants is also presented).

The most recent actions taken by the ERC to address gender and diversity (including disabilities and neo-colonialism) in its operations and processes are also presented.

The ERC knows that work to ensure inclusive excellence and equality of opportunities is never-ending. This presentation analyses the institutional efforts critically and discusses possible steps to consolidate the accomplished results.

How to cite: Jesus-Rydin, C., Fariña-Busto, L., and Jansen, E.: Inclusive excellence at the ERC: latest actions and results of sustained measures, EGU General Assembly 2024, Vienna, Austria, 14–19 Apr 2024, EGU24-16168, https://doi.org/10.5194/egusphere-egu24-16168, 2024.

EGU24-17197 | ECS | Orals | EOS3.1

Science Sisters: Interviews with diverse role models on career paths and academic life 

Marina Cano, Iris van Zelst, and Hinna Shivkumar

Science Sisters is a YouTube interview series and podcast hosted by Dr. Iris van Zelst. Lighthearted in tone, it explores different career paths, academic life, and science communication in the planetary and geosciences. The majority of the guests on the episodes are female and/or non-white to show a diverse range of role models in STEM and celebrate women in science. Together with the guest, Iris goes into the highs and lows of being a researcher and discusses issues in academia, such as the lack of permanent jobs in science and sexism. So far, two seasons of Science Sisters have been produced with topics including ethical fieldwork, switching careers, science communication, postdoc life, leadership, women in science, job applications, postdoc hopping, outreach, publishing, feeling incompetent, astronaut training, toxic academia, and how to build a research group.

Here, we present the project and some of the choicest nuggets of wisdom from the guests about academic life and careers. We also discuss the production phase of the series, highlighting for instance the considerations that go into selecting topics and guests, and the postproduction phase of editing and uploading the videos.

In addition, we present how we use Science Sisters as a way to start conversations in our own institutes. We organise a parallel seminar series where we watch the premieres of the episodes live on YouTube and afterwards have a discussion on the episode topic with the episode guest attending online. This has resulted in a greater understanding of each other and more cohesion within the institute. Early career scientists in particular say that Science Sisters is extremely useful to learn about life as a researcher and they enjoy the chatty, entertaining quality of the interviews.

How to cite: Cano, M., van Zelst, I., and Shivkumar, H.: Science Sisters: Interviews with diverse role models on career paths and academic life, EGU General Assembly 2024, Vienna, Austria, 14–19 Apr 2024, EGU24-17197, https://doi.org/10.5194/egusphere-egu24-17197, 2024.

EGU24-18544 | ECS | Orals | EOS3.1

Time’s up, bottom-up! A successful bottom-up approach for diversity and inclusions at Utrecht University 

Manon Verberne, Jana R. Cox, Frances E. Dunn, Merel Postma, and Tina Venema

Young Women of Geoscience (YWOG) is a group of young professionals (PhDs, postdocs, assistant professors and supporting staff) at Utrecht University with the aim to inspire, connect and support women and historically underrepresented groups in the field of geosciences, by creating an equal and inclusive working environment. We do this by opening up conversations and creating a safe and positive space for discussion. Now in our seventh year, the committee has established itself as a constant and stable presence within the faculty with regular events and initiatives that can easily be organized from our reputable base.

Our regular events consist of meet-and-greet sessions with senior staff members, that are well-attended by a variety of colleagues, which result in inspiring conversations. Additionally, book give-aways combined with book discussions are a recurring event, where books on diversity, inclusions and climate change are used to open conversations. These events often engage individuals who may not have initially identified with the committee's target audience, but afterwards their interest was sparked. In recent years we also organized successful events due to requests from staff members. Parenting during COVID was a successful online event with a panel discussion consisting of colleagues sharing tips and struggles. Additionally, this year we organized an event on pronouns, reaching a wide audience, from PhDs to supporting staff, professors and the faculty dean. It was also this session, with informative presentations and lively discussion, that led to immediate action from higher level staff on practical matters concerning pronouns in the workplace.

Our experience highlights the importance of a bottom-up approach in instigating meaningful change. The pronouns event is a prime example of this, opening the eyes of many attendees and making people feel the urgency for action. The event stemmed from a need within the faculty. However, to be able to organize such an event there must be a platform to do so. We have the opportunity to organize many events helped by funding through an Equality, Diversity and Inclusion (EDI) scheme and an internal award won by the committee. We aim to continue with the regular events like the meet-and-greets and book shares, and hope to organize more events that are based on the needs in the faculty to open conversations. YWOG's experience demonstrates the efficacy of a bottom-up approach, emphasizing the importance of diverse perspectives in fostering substantial changes toward a more inclusive working environment. The committee looks forward to sharing its experiences, connecting with other faculties and universities, and inspiring collective efforts to promote diversity and inclusion within geosciences.

How to cite: Verberne, M., Cox, J. R., Dunn, F. E., Postma, M., and Venema, T.: Time’s up, bottom-up! A successful bottom-up approach for diversity and inclusions at Utrecht University, EGU General Assembly 2024, Vienna, Austria, 14–19 Apr 2024, EGU24-18544, https://doi.org/10.5194/egusphere-egu24-18544, 2024.

EGU24-20027 | Orals | EOS3.1

Planning virtual and hybrid events: steps to improve inclusion and accessibility 

Aileen Doran, Victoria Dutch, Bridget Warren, Robert A. Watson, Kevin Murphy, Angus Aldis, Isabelle Cooper, Charlotte Cockram, Dyess Harp, Morgane Desmau, and Lydia Keppler

Over the last decade, the way we communicate and engage with one another has changed on a global scale. It is now easier than ever to network and collaborate with colleagues worldwide. But, the COVID-19 pandemic led to a rapid and unplanned move to virtual platforms, resulting in several accessibility challenges and the inadvertent exclusion of several people during online events. While virtual/hybrid events have strong potential to facilitate new opportunities and networks for everyone, they are also greatly positioned to increase the inclusion of groups traditionally excluded from purely in-person conferences. However, early and careful planning is needed to achieve this, with inclusion and accessibility considered from the start. Including a virtual element in a conference does not automatically equal inclusion or accessibility. Without effective planning, virtual and hybrid events will replicate many biases and exclusions inherent to in-person events.

This presentation will share lessons learned from previous events’ successes and failures, based on the combined experiences of several groups and individuals who have planned and run such events. This presentation is based on an EGU Sphere article, of the same title, that aims to provide guidance on planning online/hybrid events from an accessibility viewpoint based on the authors experiences. The goal of this presentation is to initiate discussion on event accessibility and inclusion and to help generate new ideas and knowledge from people outside of the authors network. Every event is unique and will require its own accessibility design, but early consideration is crucial to ensure everyone feels welcome and included. Our suggested accessibility considerations have been broken down into three stages of event planning: 1) Pre-event planning, 2) on the day/during the event, and 3) after the event.

Ensuring accessibility and inclusivity in designing and running virtual/hybrid events can help everyone engage more meaningfully, resulting in more impactful discussions including groups with limited access to in-person events. However, while this article is intended to act as a starting place for inclusion and accessibility in online and hybrid event planning, it is not a fully comprehensive guide. As more events are run, it is expected that new insights and experiences will be gained, helping to continually update standards.

How to cite: Doran, A., Dutch, V., Warren, B., Watson, R. A., Murphy, K., Aldis, A., Cooper, I., Cockram, C., Harp, D., Desmau, M., and Keppler, L.: Planning virtual and hybrid events: steps to improve inclusion and accessibility, EGU General Assembly 2024, Vienna, Austria, 14–19 Apr 2024, EGU24-20027, https://doi.org/10.5194/egusphere-egu24-20027, 2024.

EGU24-20337 | Posters on site | EOS3.1

The stagnation of low percentage of female scientists in Japan and JpGU's initiatives 

Rie Hori and Chiaki Oguchi

The percentage of female scientists in Japan is 17.5% in the 2021 survey. This percentage is the lowest among OECD countries. The percentages of female doctoral students in science and engineering graduate programs nationwide are 21.0% and 19.2%, indicating a gap between the percentage of female prospective researchers and the percentage of women actually employed. It is pointed out that this is due to gender bias at the time of recruitment. On the other hand, the percentage of female members of JpGU remains around 20%, which is higher than the average in Japan, but still low compared to the percentage of female geoscientists in EGU and AGU. One of the reasons for the low number of female scientists in Japan is the low percentage of female students entering science and engineering fields in Japan (27% in science and 16% in engineering). The Science Council of Japan's Subcommittee on Gender and Diversity in Science and Engineering analyzed this problem and pointed out that its cause lies in the environment of education system during elementary and junior high schools (Opinion of SCJ, 2023). In Japan, the following factors are considered to have contributed to the decline in the number of female students going on to study science and engineering, even though surveys such as PISA (2018) and TIMSS (2019) show that both male and female 15-year-olds have equal academic achievement and interested in science and mathematics in the early education stage. (1) The percentage of female science teachers in junior high school and above is significantly lower than in the OECD countries → Few role models. (2) Often exposed to obvious “implicit bias” that has no evidence to support it (for example, girls are not good at mathematics. Science and engineering professions are not suitable for girls).

JpGU and Japanese universities actively conduct outreach programs for female junior igh and high school students every year to foster future female scientists. However, only a small percentage of them in whole Japan participate in such events, and these initiatives does not give us a full solution.

How to cite: Hori, R. and Oguchi, C.: The stagnation of low percentage of female scientists in Japan and JpGU's initiatives, EGU General Assembly 2024, Vienna, Austria, 14–19 Apr 2024, EGU24-20337, https://doi.org/10.5194/egusphere-egu24-20337, 2024.

EGU24-22185 | Posters on site | EOS3.1

Signatures of Equality, Diversity and Inclusivity at EGU General Assemblies 

Johanna Stadmark, Alberto Montanari, and Caroline Slomp

The EGU recognises the importance of equality, diversity, and inclusion as a crucial foundation for scientific research to address fundamental scientific questions and societally relevant environmental challenges. The increasing diversity of our membership in all its facets fosters collaborative research and discovery that benefits humanity and our planet.

Since its founding, the EGU has worked to ensure equitable treatment for everyone in the community with the goal of increasing diversity. In autumn 2018, the EGU Council established a working group whose aim is to promote and support equality, diversity, and inclusion (EDI) in the Earth, planetary, and space sciences, with a focus on EGU activities. Less than three years later, the EDI group was upgraded into a committee and has delivered numerous actions.

The most recent achievements of EDI@EGU are the Champion(s) for Equality, Diversity and Inclusion Award that is bestowed to recognize excellent contributions to put into exemplary practice the principles of EDI. Furthermore, the EDI Committee is currently working on a new travel support scheme to promote diversity at the EGU General assemblies.

The above actions resulted in a more diverse attendance at EGU General Assemblies along the years. The total number of presenters has increased over the time period 2015-2023, and this increase was observed throughout all career stages. The proportion of women presenters has increased from 2015 to 2023. A similar trend was observed for the convenors, an increase in total numbers over the years and a higher proportion of women in 2023 than in 2015.

In the hybrid meeting in 2023 both early career scientists and more senior scientists to a higher extent participated physically in the meeting than online. While there were no differences in how women and men participated (online or physically), there are differences connected to the country affiliations. More than half of participants from countries in most of western Europe attended in Vienna, while participants from North America and Asia attended online.

Since EGU General Assembly is the largest geosciences conference in Europe understanding the demographic evolution and their participation to EGU activities, including the GA, of various groups is an important tool for EGU governing body to draw targeted actions to ensure that the current procedures are fair and that all in the community are being and feeling included. We therefore aim to analyse the changes in demographics with regards to gender, career stage as well as to geographical distribution of the presenters and convenors also in coming years to better understand the potential impacts of meetings organized online or physically, or as a combination of both these modes.

How to cite: Stadmark, J., Montanari, A., and Slomp, C.: Signatures of Equality, Diversity and Inclusivity at EGU General Assemblies, EGU General Assembly 2024, Vienna, Austria, 14–19 Apr 2024, EGU24-22185, https://doi.org/10.5194/egusphere-egu24-22185, 2024.

CC BY 4.0