EGU24-19206 | Orals | MAL21-GM | Ralph Alger Bagnold Medal Lecture
The Neogene record of Himalayan erosion in the Bengal FanEGU24-6103 | ECS | Orals | GM1.1 | Highlight | GM Division Outstanding ECS Award Lecture
Going beyond the river long profileGM1 – General Geomorphology
EGU24-6103 | ECS | Orals | GM1.1 | Highlight | GM Division Outstanding ECS Award Lecture
Going beyond the river long profileEGU24-6586 | ECS | Orals | GM1.1
Observations from a constantly changing nearshore zone in a mixed sediment bayEGU24-15955 | ECS | Orals | GM1.1
Identifying sediment-discharge event types with a data-based clustering approachEGU24-4165 | ECS | Posters on site | GM1.2
The highest gas hydrate volume estimate found in the sediments of the Chilean marginEGU24-4166 | Posters on site | GM1.2 | Highlight
Paleoenvironmental and geomorphological changes in an ancient baldcypress swamp preserved on the Northern continental shelf in the Gulf of MexicoEGU24-6076 | ECS | Posters on site | GM1.2
Ribbed Moraines and Generalised Linear Modelling: Can modelled ice conditions be used to predict the presence of specific landforms?EGU24-12134 | ECS | Posters on site | GM1.2
High-resolution fluvial geomorphology of dynamic volcanic environments of Costa Rica, Central AmericaEGU24-12871 | ECS | Posters on site | GM1.2
Global Distribution of Mountainous Headwater Catchments MorphologyEGU24-13101 | ECS | Posters on site | GM1.2
Quantifying the response of rivers to Holocene sea level rise in Southern EnglandEGU24-14468 | Posters on site | GM1.2
Extreme values of central Japan snowfall attributable to global climate change

EGU24-15831 | ECS | Posters on site | GM1.2
Right for the wrong reasons? On hillslope sediment and the streampower modelEGU24-16976 | ECS | Posters on site | GM1.2
Bedrock erosion by hyperconcentrated flows: A quantitative analysis and implications for effective gorge formationEGU24-2302 | ECS | Posters on site | ITS4.5/GM1.3
A holistic analysis of Chinese sponge city cases by region: Using PLS-SEM models to understand key factors impacting LID performanceEGU24-3300 | ECS | Posters virtual | ITS4.5/GM1.3
Integration of health indicators and quantification of benefits from BGS urban interventionsEGU24-3463 | ECS | Posters on site | ITS4.5/GM1.3
Beavers and flood alleviation: Human perspectives from downstream communities
EGU24-4650 | Orals | ITS4.5/GM1.3
Making Space for Water: Investing in Nature-based Solutions with BeaversEGU24-7812 | ECS | Orals | ITS4.5/GM1.3
Algal-bacteria raceway ponds for circular wastewater treatmentEGU24-11118 | ECS | Orals | ITS4.5/GM1.3 | Highlight
Enhancing Nitrogen Removal in European River Basins: The Crucial Role of Wetland Conservation and Restoration as Nature-Based SolutionsEGU24-13080 | ECS | Posters on site | ITS4.5/GM1.3
Long-term monitoring of eco-hydrological effects of Live Pole Drains in large open-air test facility at TUDelft campusEGU24-16355 | Posters on site | ITS4.5/GM1.3
The effectiveness of oyster reefs as a nature-based erosion control measure under storm eventsEGU24-17900 | ECS | Posters on site | ITS4.5/GM1.3
Exploratory analysis of the long(er) term dynamics of Nature-based Solutions: the case of agricultural soil propertiesEGU24-18207 | Posters virtual | ITS4.5/GM1.3
Freshwater mussels’ valve movement response as early-warning system of river’s ecosystem conditionsEGU24-19170 | Posters on site | ITS4.5/GM1.3
Influence of Island Morphology on Micro-Endemic Biodiversity DistributionEGU24-19856 | ECS | Posters on site | ITS4.5/GM1.3
Quantification of burrowing animals’ impact on landscapes: a review of numerical methods.EGU24-20606 | ECS | Orals | ITS4.5/GM1.3
Bioeconomy gaps and opportunities in restored Atlantic forestsGM2 – Geomorphologists' Tools and Methods
EGU24-480 | ECS | Posters on site | GM2.1
Probabilistic optimal transport-driven inversion of the 2012 Palisades rockfall seismic sourceEGU24-3399 | ECS | Orals | GM2.1
Enhancing debris flow warning through seismic feature selection and machine learning model comparisonEGU24-3861 | ECS | Posters on site | GM2.1
Capturing the short-term dynamics of outlet glaciers: insights from seismic monitoring on Sermeq Kujalleq in Kangia, GreenlandEGU24-5306 | ECS | Posters on site | GM2.1
Quantifying snout marginal bedload export from alpine glaciersEGU24-5947 | ECS | Posters on site | GM2.1
Low-cost raindrop sizing with piezoelectric sensor: A mechanical approachEGU24-6218 | ECS | Orals | GM2.1
High resolution observations of tide induced icequake activity at the Astrolabe glacier grounding zoneEGU24-7490 | Posters on site | GM2.1 | Highlight
August 2023 Slovenian flood anatomy from national seismometer network data analysisEGU24-8208 | ECS | Orals | GM2.1
Icequake source location using seismic data in Dålk Glacier, East AntarcticaEGU24-8304 | Posters on site | GM2.1
Water table height maps prediction from passive surface-wave dispersion using deep learningEGU24-9822 | ECS | Posters on site | GM2.1
Intermediate-depth icequakes at Greenland’s fastest outlet glacier: evidence for englacial thrust faulting?EGU24-10147 | ECS | Posters on site | GM2.1
Uncovering Stick-Slip Events: Denoising Cryoseismological Distributed Acoustic Sensing Data with an AutoencoderEGU24-11086 | ECS | Posters on site | GM2.1
Support vector regression-based model for the prediction of surface displacement and vibration using meteorological dataEGU24-11562 | ECS | Posters on site | GM2.1 | Highlight
How trees sway and what it tells us about their overall vitalityEGU24-13007 | Orals | GM2.1 | Highlight
Assessing the seismic signature of turbulent flow and intense bedload transport from designed laboratory experimentsEGU24-13208 | Posters on site | GM2.1 | Highlight
Analysis of Precursors and Collapse of June 15, 2023, Brienz/Brinzauls Rockslide in Switzerland: Integrating Seismic and Remote Sensing ObservationsEGU24-13722 | ECS | Posters on site | GM2.1
Investigating bedload transport in mountain rivers through seismic methods: the new monitoring station in the Solda River (South Tyrol, Italy)EGU24-13798 | Posters on site | GM2.1
Research on new methods and equipment for seismological monitoring of glaciers on the Qinghai-Tibet PlateauEGU24-13859 | ECS | Orals | GM2.1 | Highlight
An overview of environmental seismology used to study the internal structure of the North East Greenland Ice StreamEGU24-14117 | ECS | Posters on site | GM2.1
Probing relation between rainfall pattern and seismic detected water-and-sediment eventsEGU24-14125 | ECS | Posters on site | GM2.1
Studying field-scale dam breach due to overtopping by using seismic signalsEGU24-15165 | Orals | GM2.1
Investigating Rainfall-Driven Resonance Frequency Changes in a Natural Rock FormationEGU24-15794 | ECS | Orals | GM2.1 | Highlight
Monitoring subsurface changes in a quick clay area during extreme weatherEGU24-16742 | ECS | Posters on site | GM2.1
Detection and localisation of wadi flow events utilizing seismic sensorsEGU24-17219 | ECS | Posters on site | GM2.1
Towards seismic monitoring of terrestial ecosystems: an exploratory data analysis of the SeisSavanna datasetEGU24-17786 | Orals | GM2.1
Monitoring the mechanics of mountain permafrost using ambient noise seismologyEGU24-17787 | Posters on site | GM2.1
(Multi)annual variations in the microseism of the Northern AtlanticEGU24-18262 | ECS | Posters on site | GM2.1
Quantitative measurement of bedload transport variability with acoustic monitoring systems: Insight from controlled laboratory flume experimentsEGU24-18668 | Posters on site | GM2.1
Bedload sediment dynamics in two contrasting alpine glacier headwater catchmentsEGU24-394 | ECS | PICO | GM2.2 | Highlight
Smart boulders for real-time detection of hazardous movement on landslides
EGU24-558 | ECS | PICO | GM2.2
Estimating bed material transport in Himalayan streams using the virtual velocity approachEGU24-1825 | ECS | PICO | GM2.2
The Transition from Granular Debris Flow to Bedload: a force balance perspectiveEGU24-9717 | ECS | PICO | GM2.2 | Highlight
Vertical Mixing of Suspended Sediment in Big Rivers using ADCP data and Machine Learning
EGU24-11132 | PICO | GM2.2
Comparing methods to quantify grain-scale sediment structure in gravel-bed rivers
EGU24-11689 | PICO | GM2.2 | Highlight
Using seismic and timelapse camera observations to study flood-induced morphological changes on an alpine gravel-bed reachEGU24-13064 | ECS | PICO | GM2.2
A simplified Python-based kinematic model of particle transport in rivers
EGU24-18899 | ECS | PICO | GM2.2
Hydro-acoustic multi-frequency measurements of suspended sediment flux in riversEGU24-18979 | ECS | PICO | GM2.2
Exploring moisture-constrained aeolian sediment transport through a discrete particle modelling frameworkEGU24-20740 | ECS | PICO | GM2.2
Multi-Model Comparison of Suspended Sediment Flux in the Sagavanirktok River, Alaska.EGU24-1456 | ECS | Orals | GM2.3 | Highlight
Landscape response to tectonic deformation and cyclic climate change since ca. 800 ka in the southern Central AndesEGU24-1804 | Posters on site | GM2.3 | Highlight
Tracking dune blowouts to constrain prehistoric droughts in the Nebraska Sand Hills (Great Plains, USA)EGU24-1850 | Posters on site | GM2.3
Modelling detrital cosmogenic nuclide concentrations during landscape evolution in the LEM CIDREEGU24-4168 | Orals | GM2.3 | Highlight
Redrawing early human dispersal patterns with cosmogenic nuclidesEGU24-4994 | Posters on site | GM2.3
How deep is deep enough: disambiguating the acceptable depth for cosmogenic isochron burial datingEGU24-6385 | ECS | Posters on site | GM2.3 | Highlight
Relationships between temperature, elevation, and surface exposure age in the McMurdo Dry Valleys, AntarcticaEGU24-7506 | ECS | Posters on site | GM2.3
Combined application of single grain and cobble luminescence dating to Alpine glaciofluvial depositsEGU24-7571 | ECS | Posters on site | GM2.3
Controls on flank erosion rates during valley widening: an application of cosmogenic nuclides in Andean and French valleysEGU24-7686 | ECS | Posters on site | GM2.3
Combining meteoric and in situ 10Be for depositional flux estimations along a climate gradientEGU24-9605 | ECS | Orals | GM2.3
Early development of Argon-39 as a new geochronometer for geologic processes on short time scalesEGU24-10522 | ECS | Posters on site | GM2.3
Long-term denudation and topographic relief evolution of Central and Northern MadagascarEGU24-11574 | ECS | Orals | GM2.3
Unveiling the early Eurasian glaciations with new advances of 10Be-26Al burial datingEGU24-12081 | ECS | Posters on site | GM2.3
Constraining erosion rates and patterns for glaciated basins in the European Alps using thermoluminescence thermochronologyEGU24-14778 | Posters on site | GM2.3
Refining exposure-age estimates of 40- to 800-ka surfaces with 10Be, 21Ne, and additional geologic constraintsEGU24-17371 | ECS | Orals | GM2.3
ESR-thermochronometry in the western European Alps (Switzerland)EGU24-1085 | ECS | Posters on site | GM2.6
Quantifying the Importance of Wind Erosion of Bare Peat: Initial Insights from Field Measurements and Wind Tunnel ModellingEGU24-3160 | ECS | Orals | GM2.6
Instability of Antidune Incipience under Low Submergence ConditionsEGU24-6100 | Posters on site | GM2.6
Measured distributions of velocity and concentration for intense transport of bimodal lightweight sediment in tilting flumeEGU24-9106 | ECS | Orals | GM2.6
Formation and Kinematics of Basal Layer in Granular Flows Down Smooth and Rough InclinesEGU24-9390 | ECS | Orals | GM2.6
Assessment and evaluation of the utility of hydrokinetic technologies in low head streamsEGU24-9650 | ECS | Orals | GM2.6
Segregation of granular mixtures in an annular shear cell under shear, gravity, and convectionEGU24-9774 | ECS | Posters virtual | GM2.6
Subaqueous bedform morphology and migration in a mountainous macrotidal estuaryEGU24-9977 | ECS | Orals | GM2.6
Effects of particle elongation on dense granular flows down a rough inclined planeEGU24-10063 | ECS | Posters virtual | GM2.6
Incipient particle entraiment prediction with the use of machine learning methodsEGU24-10349 | ECS | Posters on site | GM2.6
Temporal development of the scour hole next to the riprap sloping structureEGU24-10417 | Posters on site | GM2.6
Change in flow field next to riprap sloping structure caused by variability of scoured bathymetryEGU24-11224 | ECS | Posters on site | GM2.6
Measuring flow resistance in rough-bed rivers using flume and CFD approachesEGU24-12742 | Orals | GM2.6
Background Topography Affects the Degree of Three-Dimensionality of Tidal Sand WavesEGU24-13532 | ECS | Posters virtual | GM2.6
Research on nearshore subaqueous geomorphology stability detection based on few-shot learningEGU24-15069 | Orals | GM2.6
Modeling particle impacts on granular media for the analysis of aeolian saltationEGU24-16292 | ECS | Orals | GM2.6
Flow rule for unsteady flows of spherical and non-spherical grains down rough inclined planesEGU24-17522 | ECS | Orals | GM2.6
Experimental modelling of local scour phenomenon at a series of repelling emergent spur dikesEGU24-18798 | ECS | Posters on site | GM2.6
Friction at the grain-scale: the role of inter-particle friction in granular media and its influence on grain-scale bed behaviourEGU24-19002 | ECS | Orals | GM2.6
A three-species model of aeolian saltation incorporating cooperative splashEGU24-22239 | ECS | Posters on site | GM2.6
Numerical simulation of dike breaching by overtopping. Influence of the bank erosion operator.EGU24-13250 | Posters on site | CL5.3
Assessing Gol-e-Zard Cave (GZS) and Bergen Speleothem Standards (BSS) for U/Th Geochronometry Using MC-ICP-MSEGU24-17301 | ECS | Posters on site | CL5.3
Refining the age-depth model of a marine sediment record in the Laptev Sea using Beryllium-10EGU24-18925 | Posters on site | CL5.3
μGraphiline: a high-throughput, low-maintenance, fully automated 14C graphitization systemEGU24-19089 | Posters on site | CL5.3
230Th/U and 234U/238U dating of cold-water corals: Approaching the disequilibrium theoryEGU24-21472 | ECS | Posters on site | CL5.3
Lyoluminescence: a potential tool for dating evaporites up to the Middle-Pleistocene?GM3 – Spatial Methods and Analysis in Geomorphology
EGU24-4399 | ECS | Posters on site | GM3.1
Evaluating the efficacy of multitemporal TLS and UAS surveys for quantifying wind erosion magnitudes of sand dune topographyEGU24-5142 | Posters on site | GM3.1 | Highlight
Four nationwide Digital Surface Models from airborne historical stereo-imagesEGU24-5670 | ECS | Posters on site | GM3.1
Enhancing 3D Feature-based Landslide Monitoring Efficiency by Integrating Contour Lines in Laser Scanner Point CloudsEGU24-5674 | ECS | Orals | GM3.1
Piecewise-ICP: Efficient Registration of 4D Point Clouds for Geodetic MonitoringEGU24-5757 | Posters on site | GM3.1
Arctic puzzle: pioneering a shrimp habitat model in topographically complex Disko Bay (West Greenland)EGU24-10361 | ECS | Orals | GM3.1
A Time-Series Analysis of Rockfall Evolution in a Coastal Region Using Remote Sensing DataEGU24-11949 | ECS | Posters on site | GM3.1
Employng satellite immagery interpretation tools to detect land-use land-change dynamics in Italian historical rural landscapesEGU24-12105 | ECS | Orals | GM3.1 | Highlight
Unleashing the archive of aerial photographs of Iceland, 1945-2000. Applications in geosciencesEGU24-14087 | ECS | Posters on site | GM3.1
A point-cloud deep learning model based on RGB-D images: Application of riverbed grain size surveyEGU24-14680 | Orals | GM3.1
Using current 3D point clouds as a tool to infer on past geomorphological processesEGU24-15439 | ECS | Orals | GM3.1 | Highlight
Utilizing historical aerial imagery for change detection in AntarcticaEGU24-16939 | ECS | Posters on site | GM3.1 | Highlight
Integrating structure-from-motion photogrammetry with 3D webGIS for risk assessment, mapping and monitoring of coastal area changes in the Maltese archipelagoEGU24-17822 | ECS | Posters on site | GM3.1
Evaluating Ordnance Survey sheets (1890s – 1957) for shoreline change analysis in the Maltese IslandsEGU24-21396 | ECS | Orals | GM3.1
Automatic detection of river bankfull parameters from high density lidar dataEGU24-196 | ECS | Posters on site | GM3.2
Remote sensing and geomorphometry application in riverscapes evolution in the south-eastern Arabian Peninsula (Sultanate of Oman)EGU24-1613 | ECS | Posters on site | GM3.2
Simulating 4D scenes of rockfall and landslide activity for improved 3D point cloud-based change detection using machine learningEGU24-5190 | ECS | Posters on site | GM3.2
Exploring Temperature-Shear Strength Dynamics: A Spatial Modelling Approach for Clay Landslide Susceptibility in ItalyEGU24-7114 | Posters on site | GM3.2
Bathymetry derivation and slope-assisted benthic mapping using optical satellite imagery in combination with ICESat-2EGU24-7859 | Posters on site | GM3.2
The Performance of the Man-Kendall Test in the Analysis of Coastal Changes along Cliff Sections on the Baltic SeaEGU24-8222 | ECS | Posters on site | GM3.2
Automated and flexible measuring of grain size and shape in images of sediment with deep learningEGU24-10314 | ECS | Posters on site | GM3.2
A deep learning-based super-resolution DEM model for pluvial flood simulationEGU24-12288 | Posters on site | GM3.2
TopoToolbox 3 – avenues for the future development of a software for terrain analysisEGU24-13135 | Posters on site | GM3.2
Spectral analysis as proxy for lineament spatial distribution: validation and case studyEGU24-13867 | ECS | Orals | GM3.2
The effect of correcting the projection error in Digital Terrain Models on Earth surface processesEGU24-14080 | Posters on site | GM3.2
Advancements in Point-Cloud Processing for Geo-Environmental Modeling: A Case Study of The Dalles Dam Digital Twin CreationEGU24-14955 | Posters on site | GM3.2
Multi-Technique Analysis and Landscape Evolution: Implications for Landslide-Fluvial Cascading Hazards AssessmentEGU24-15001 | Orals | GM3.2 | Highlight
Applying photogrammetry to time-lapse imagery for geomorphological change detectionEGU24-15418 | ECS | Posters on site | GM3.2 | Highlight
A definition of land surface geomorphodiversity across different scales
EGU24-16317 | Orals | GM3.2
Debris flow catchments and landscape evolution in the northern Colombian AndesEGU24-16412 | ECS | Orals | GM3.2
Deep-Image-Matching: an open-source toolbox for multi-view image matching of complex geomorphological scenarios
EGU24-18657 | ECS | Posters on site | GM3.2
Tailoring slope units delineation according to different natural phenomena for institutional land use planning at the regional scaleEGU24-18943 | ECS | Posters on site | GM3.2
Reconstructing ancient coastal landscapes and sea-level stands in Southern Italy (Cilento coast): a geostatistical approachEGU24-20335 | ECS | Posters on site | GM3.2
Bivariate mountain definition: a case study for the turkish mountain systemEGU24-720 | ECS | Posters on site | BG3.18
An adaptive mapping framework for the management of peat soils: a new Irish Peat Soils Map.EGU24-1164 | Posters on site | BG3.18 | Highlight
Long-term interventions by conservation and development projects support successful recovery of tropical peatlands in AmazoniaEGU24-3219 | ECS | Posters on site | BG3.18
Peat soil thickness and carbon storage in the Belgian High Fens: insights from multi-sensor UAV remote sensingEGU24-4700 | Posters on site | BG3.18
Large CO2 and CH4 emissions from drainage ditches in oil palm plantations on peat soilEGU24-7452 | Posters on site | BG3.18
How does land use change impact tropical peatland surface elevation changes?EGU24-9398 | Posters on site | BG3.18
Integrating UAS-based lidar data in eddy covariance flux footprint modellingEGU24-12027 | ECS | Posters on site | BG3.18
Resistant high tree cover mode with increasing fire in Indonesian natural peatland ecosystems
EGU24-13540 | ECS | Posters on site | BG3.18
Mapping Italian Alpine Peatlands Using Multisource Satellite Imagery and Machine Learning ApproachEGU24-14157 | Posters on site | BG3.18
Methane and Nitrous Oxide Fluxes in Soil and Stems of Malaysian Tropical Peat Swamp ForestEGU24-14254 | ECS | Posters virtual | BG3.18 | Highlight
Saltwater intrusion may aggravate carbon loss from tropical peatlandsEGU24-17791 | ECS | Posters on site | BG3.18
Identifying the Transition Zone between Peat and Mineral Soils Using Airborne Radiometric Data: a national scale case study from IrelandEGU24-18342 | Posters on site | BG3.18
A simple approach to upscale methane emissions from peatlands using Planetscope satellite data and machine learning algorithmEGU24-18587 | ECS | Posters on site | BG3.18
Deciphering Congo Peat Chemistry; Using Plants to Understand the Peat.EGU24-18973 | ECS | Posters on site | BG3.18
The Use of Ground-Penetrating Radar for Mapping Peatland Subsurface in Afforested Peatland RestorationEGU24-19643 | Posters on site | BG3.18
A Satellite-derived Peatland Ecotype Classification Method Using Artificial Neural Network Hierarchical EnsemblesEGU24-21619 | ECS | Posters on site | BG3.18
Automated Mapping of Artificial Drainage in Peatlands Using Deep Learning and Very High-Resolution Aerial ImageryEGU24-22001 | ECS | Posters virtual | BG3.18
Remote sensing of peatland degradation – a review on gaps and hotspots of research across the northern hemisphereEGU24-22008 | ECS | Orals | BG3.18 | Highlight
Carbon dynamics of high-elevation tropical cushion peatlands in the AndesGM4 – Geomorphology, Climate, and Hazards
EGU24-224 | Posters on site | GM4.2
Assessment of sediments dynamics through the identification of main deposition shapes in large reservoirsEGU24-4411 | ECS | Posters virtual | GM4.2
Reconstruction of spatial and temporal variability of debris flow in northern Apennines (Italy): Case study of the Alpe di Succiso areaEGU24-5581 | ECS | Orals | GM4.2
Quantifying the effects of rainfall temporal variability on landscape evolution processesEGU24-10204 | Orals | GM4.2
A stochastic landscape evolution model framework for debris flow and fluvial processesEGU24-10429 | ECS | Orals | GM4.2
Interaction Between Large Wood and Sediment Transport in an Alpine Torrent in the DolomitesEGU24-10776 | Orals | GM4.2
Amplified Risk: How Climate Change is Modifying the Risks from Geological HazardsEGU24-14250 | ECS | Orals | GM4.2 | Highlight
Widespread cascading torrential hazards in tropical regionsEGU24-14699 | ECS | Posters on site | GM4.2
How will bedload transport respond to climate change in Alpine regions? The "ALTROCLIMA" projectEGU24-16937 | Orals | GM4.2 | Highlight
Cascading Hazards – the challenges to understand interactionsEGU24-17658 | ECS | Posters on site | GM4.2
Addressing the 'Black Hole' amidst Sediment Connectivity and Multi-HazardsEGU24-18653 | ECS | Posters on site | GM4.2
Seven decades of debris flow activity. Spatio-temporal observations at connected and disconnected debris flow fans to the Lake Plansee (AT).EGU24-19175 | Orals | GM4.2
Non-uniqueness in sediment transport in river network hydrology-sediment modellingEGU24-19438 | ECS | Posters on site | GM4.2
Post-event forensic survey after a recent catastrophic flash flood in Central Spain: morphosedimentary and hydrodynamic reconstructionEGU24-20877 | ECS | Posters on site | GM4.2
Snow preparation in landslide scenarios under multi-hazard perspective: experiences from Lake Campotosto (Italy)EGU24-4885 | ECS | Posters on site | GM4.4
The Sea Level during MIS5a, MIS5c in the Southwestern Coast of South KoreaEGU24-5716 | Posters on site | GM4.4 | Highlight
TerraceM 3.0: Advancing marine terrace mapping through integrated machine learning methodsEGU24-8118 | ECS | Posters on site | GM4.4
Sea level oscillations within the Last Interglacial: insights from coral reef stratigraphic forward modellingEGU24-15894 | ECS | Posters on site | GM4.4
OSL Dated Sea-Level for MIS 5e Interglacial in South Carolina, United StatesEGU24-16272 | Posters on site | GM4.4 | Highlight
Geomorphological signatures of known climatic extreme events and validation of theoritical emplacement approach: Boulders on Cuban low-lying Marine TerracesEGU24-16538 | ECS | Posters on site | GM4.4
Last Interglacial sea-level proxies along the Brazilian western Atlantic coastsEGU24-17200 | Posters on site | GM4.4
Quaternary and Pliocene sea-level changes at Camarones, central Patagonia, ArgentinaEGU24-17311 | ECS | Posters on site | GM4.4
Early-to-Late Holocene Emerged Fossil Corals along the Negros Trench Forearc, PhilippinesEGU24-20690 | ECS | Posters on site | GM4.4
Interglacial beach ridge plains across the northern Gulf of MexicoEGU24-611 | ECS | Posters virtual | HS7.5
Hydrological Analysis of Monsoon Rain Spells in the Indian Ganga Basin over the Last CenturyEGU24-2163 | ECS | Posters on site | HS7.5
Climate risk-reduction potential of gridded precipitation data for agricultural index-based insurance developmentEGU24-3602 | ECS | Posters on site | HS7.5
FLOODGAMA: the new INUNGAMA. Beyond a flood events database for CataloniaEGU24-3951 | ECS | Orals | HS7.5
Multi-day precipitation extremes ranking and their association with atmospheric moisture fluxes over IndiaEGU24-5587 | ECS | Orals | HS7.5
Socio-Economic Vulnerability assessment and validation in Seoul, South KoreaEGU24-6088 | ECS | Posters on site | HS7.5
Modelling and Prediction of Unprecedented Heavy Rainfall Event Over North IndiaEGU24-6148 | ECS | Posters on site | HS7.5
Functionality assessment of road network combining flood roadworthiness and graph topologyEGU24-7026 | ECS | Orals | HS7.5
Characteristics of Disaster-causing Heavy Rainfall in Taipei City and Its ApplicationEGU24-7347 | Posters on site | HS7.5
Impacts comparison by using different hydraulic models on the 2011 flood in ThailandEGU24-7770 | Posters on site | HS7.5
Historical database for multi-hazard zonation and damage trend analysis in a Mediterranean study area (southern Italy)EGU24-8205 | ECS | Posters on site | HS7.5
A Multi-Criteria Analysis procedure for the evaluation and classification of flood risk mitigation strategiesEGU24-8531 | Orals | HS7.5
Appraising and reducing riverine flood risk: a case study from Central ItalyEGU24-9209 | ECS | Posters on site | HS7.5
Spatial analysis of catastrophic flooding in the metropolitan area of Murcia over the last 100 yearsEGU24-9313 | ECS | Orals | HS7.5
The Effects of Geographic Risk Complementarity on Reducing Flood Insurance CostsEGU24-10245 | ECS | Orals | HS7.5
A time-dependent non-asymptotic statistical analysis of extreme precipitation eventsEGU24-10877 | ECS | Posters on site | HS7.5
Exploring Diverse Perceptions of Multiple Risks among the Public in RomeEGU24-10950 | ECS | Posters on site | HS7.5
Temporal and spatial analysis of mortality associated with landslides on São Miguel Island (Portugal) from 1900 to 2020EGU24-11090 | ECS | Orals | HS7.5
From indices to impacts: Understanding the dynamics of drought impacts through socio-economic clusteringEGU24-11493 | ECS | Posters on site | HS7.5
Dry spell frequency and duration analysis using different spell definitionsEGU24-11733 | ECS | Orals | HS7.5
Exploring vulnerability to flash floods in a water-scarce MENA city: Challenges and possible solutionsEGU24-14198 | ECS | Orals | HS7.5
Assessing the Influenced Zone of Debris Flow Using Numerical SimulationEGU24-14698 | Posters on site | HS7.5
Monthly flood frequency regionalization for comprehensive flood damage assessment to cropsEGU24-14898 | Posters on site | HS7.5
The diverse impacts of extreme storms in the European South. The case of Storm Daniel (2023) in Greece.EGU24-15286 | ECS | Posters on site | HS7.5
A 10-Year climatology of hail in France: towards an estimate of the hail hazardEGU24-17412 | Orals | HS7.5 | Highlight
It could have come worse – an analysis of spatial counterfactual scenarios for the July 2021 flood in the Ahr Valley, GermanyEGU24-18244 | ECS | Orals | HS7.5
The effects of extreme rainfall trends on compound flood risk: A case study over Greater BostonEGU24-18357 | ECS | Posters on site | HS7.5
Unveiling the complexity of social vulnerability: An analysis of the Social Vulnerability Index in Sweden (SVIS)EGU24-19140 | ECS | Posters virtual | HS7.5
Sensitivity analysis of agricultural and hydrological droughts to rainfall deficits across IndiaEGU24-19552 | Posters on site | HS7.5 | Highlight
Unveiling global sub-daily precipitation extremes: Insights and development of the INTENSE ProjectEGU24-20944 | ECS | Posters on site | HS7.5
Towards optimizing the operation of controlled flood detention basinsEGU24-20988 | ECS | Posters on site | HS7.5
Assessment of future climate risk and vulnerability of local communities in High Mountain AsiaEGU24-21687 | Orals | HS7.5 | Highlight
Understanding the dynamics of multi-sector impacts of hydro-meteorological extremes: a methods overviewEGU24-1624 | ECS | Posters on site | NH3.2
Reconstructing the history of landslides in northern Japan through dendrogeomorphologyEGU24-2036 | ECS | Orals | NH3.2
Spatio-temporal distribution of extreme rock-ice avalanches in the Cordillera Blanca (Peru)EGU24-2547 | ECS | Posters on site | NH3.2
SAR Monitoring and Finite Element based Stability Modeling for the Zero Landslide in the Darjeeling Himalayas, IndiaEGU24-4336 | Posters on site | NH3.2
Study on energy and displacement evolution of rock slope during the development of landslide by multi-scale modelingEGU24-6304 | ECS | Posters on site | NH3.2
Physics-based uncertainty modeling of deep-seated landslides using InSAR: A case of El Forn (Andorra)
EGU24-8090 | ECS | Posters on site | NH3.2
The discovery of a large-scale gravitational collapse in the Gulf of Squillace, Calabria region (central Mediterranean)EGU24-11027 | ECS | Posters on site | NH3.2
Deep-seated gravitational slope deformations of Friuli Venezia Giulia Region (NE Italy)EGU24-11528 | Orals | NH3.2
Landslide mobility enhanced by dynamic basal liquefaction of underlying sedimentsEGU24-14609 | Posters on site | NH3.2
The Parraguirre ice-rock avalanche 1987, semi-arid Andes, Chile - A holistic revisionEGU24-15459 | ECS | Orals | NH3.2
Multiscale Numerical Modeling of Ultrasound-Induced Granular AvalanchesEGU24-16450 | ECS | Posters on site | NH3.2
Assessing river morphological changes induced by large ice-rock avalanches: The 2021 Chamoli disaster region using UAV-LIDAR data.EGU24-18109 | ECS | Posters on site | NH3.2
Paleo-landslides in the southern France (Larzac plateau)EGU24-18344 | ECS | Posters virtual | NH3.2
Locating Sediment Evacuation Zones – A Prefatory Action for Early Warning System Development in Mountainous landscapesEGU24-20856 | ECS | Posters virtual | NH3.2
“Identification and Characterization of Paleoalluvial Events in the Ranrahírca Hydrographic Unit, Cordillera Blanca, Perú”EGU24-703 | ECS | Orals | NH3.5 | Highlight
Integrated Monitoring and Multi-Hazard Early Warning System for Himalayan Region: Insights from the Chamoli Disaster of 2021EGU24-3817 | Posters on site | NH3.5
Failed Patagonian tableland: landslides distribution and controlsEGU24-5417 | ECS | Posters on site | NH3.5
Numerical modeling of collapsed deep-seated gravitational slope deformations: insights from Velka Fatra Mts., SlovakiaEGU24-6268 | Posters on site | NH3.5
Enhancing rockfall modelling through an integrated workflow, from source area definition to susceptibility zoningEGU24-6335 | Orals | NH3.5 | Highlight
Infrasound analysis of break-off events from Planpincieux glacier, Mount Blanc, ItalyEGU24-6627 | ECS | Posters on site | NH3.5
Landslides on the growing folds of the Kura fold-and-thrust belt (Azerbaijan, Georgia)EGU24-7631 | ECS | Posters on site | NH3.5 | Highlight
Causes, consequences and implications of the 2023 Lake Rasac GLOF, Cordillera Huayhuash, PeruEGU24-8202 | ECS | Posters on site | NH3.5
Mapping release and propagation areas of permafrost-related rock slope failures in the French Alps: A new methodological approach at regional scaleEGU24-8891 | ECS | Orals | NH3.5
Climate change impact on rock avalanches in metamorphic rock masses in Tyrol, AustriaEGU24-9085 | Orals | NH3.5 | Highlight
Probabilistic rockfall hazard and risk analysis along the El Portal Road in Yosemite National Park (California, USA)EGU24-10488 | Posters on site | NH3.5
Advanced Discontinuity Detection Algorithm for Geological Formations Using High-Density Point Cloud DataEGU24-14088 | ECS | Posters on site | NH3.5
A fast unsupervised deep learning algorithm using seismic records of a single station for roadside rockfall recognitionEGU24-15526 | ECS | Posters on site | NH3.5
Investigation into rockslides by the adaptive rock discrete fracture analysis (RDFA) methodEGU24-15711 | ECS | Orals | NH3.5
Rockfalls risk assessment along a E45 motorway section in South Tyrol (Italy)EGU24-16064 | ECS | Posters on site | NH3.5
Back analysis of the 2023 rockfall event of Martigny (Switzerland): trajectography prediction to future potential hazard along roadEGU24-16109 | Posters on site | NH3.5
Travel distance prediction for rock avalanche based on machine learningEGU24-16313 | ECS | Orals | NH3.5
Quantitative vulnerability assessment of buildings susceptible to slow-kinematic landslidesEGU24-17618 | ECS | Posters on site | NH3.5
Monitoring techniques for rockfall hazard across Malta, Mediterranean Sea.EGU24-18131 | Orals | NH3.5 | Highlight
Introducing uncertainty in hazard analysis in a simple way: example of rockfallsEGU24-20066 | ECS | Orals | NH3.5 | Highlight
Interdisciplinary insights into an exceptional giant tsunamigenic rockslide on September 16th 2023 in Northeast GreenlandEGU24-4772 | ECS | Orals | NH3.6
A Comparison of SimCLR and SwAV Contrastive Self-Supervised Learning Models For Landslide DetectionEGU24-5116 | ECS | Posters on site | NH3.6
Estimating near-surface reduction in shear-strength on hillslopes caused by strong ground shakingEGU24-5565 | ECS | Orals | NH3.6
A probabilistic model for slope stability analysis including the root reinforcement effectsEGU24-7357 | ECS | Orals | NH3.6
Machine learning-based landslide susceptibility mapping for short-term risk assessment in South KoreaEGU24-8845 | ECS | Posters on site | NH3.6
Combining meteorological and soil wetness information in machine learning modelling for landslide early warningEGU24-9311 | ECS | Posters on site | NH3.6
Temporal and spatial analysis of landslide-triggering rainfall conditions in Qinghai-Tibet Plateau, ChinaEGU24-10552 | Posters on site | NH3.6
Development of a data-driven space-time model to predict precipitation-induced geomorphic impact events at the Alpine ScaleEGU24-11180 | ECS | Posters on site | NH3.6
Identifying Heterogeneous Landslides using Multi-modal Deep LearningEGU24-12097 | Orals | NH3.6
A deep Learning-based approach for landslide dating from time-series of SAR dataEGU24-13892 | ECS | Posters on site | NH3.6
Forecasting of rainfall-induced landslides in pyroclastic soil deposits through hydrometeorological information.EGU24-14020 | ECS | Orals | NH3.6
Evaluating Landslide Susceptibility on the Big Sur Coast, California, USA using Complex Network TheoryEGU24-14188 | ECS | Posters virtual | NH3.6
A Non-Stationary Approach for Temporal Probability of Landslide using Hydrometeorological ThresholdsEGU24-14949 | Posters on site | NH3.6
Modeling the impact of Hurricane Maria on Puerto Rico with an eco-hydrological landslide modelEGU24-15351 | ECS | Posters on site | NH3.6
Mapping landslide susceptibility through physically-based modelingEGU24-15580 | ECS | Orals | NH3.6
Landsifier 2.0: Towards automating landslide trigger and failure movement identificationEGU24-17248 | ECS | Orals | NH3.6
Hybrid Physically Constrained Machine Learning Models of Landslide Susceptibility: a Case Study from SloveniaEGU24-17785 | ECS | Posters on site | NH3.6
Application of beta regression for the prediction of landslide areal density in South Tyrol, ItalyEGU24-18279 | ECS | Posters on site | NH3.6
Representative Profile Model (RPM): A new physically-based model for assessing the hazards of colluvial landslides at local scaleEGU24-18624 | Posters on site | NH3.6
Regional scale landslide susceptibility maps: strengths and weaknessesEGU24-18847 | ECS | Orals | NH3.6
A unified Bayesian model selection workflow for geophysical free-surface flowEGU24-20698 | Posters on site | NH3.6
Utilizing deep neural networks for landslide detection and segmentation in remote sensing imageryEGU24-22521 | ECS | Orals | NH3.6
A fast geo-hazard assessment for electro-energetic network systems using a simplified geo-hydrological modelEGU24-12 | ECS | Posters on site | NH9.1 | Highlight
Understanding fatal landslides on a global scale: insights from topographic, climatic, and anthropogenic perspectivesEGU24-1451 | ECS | Posters on site | NH9.1
A vulnerability framework for a global flood catastrophe modelEGU24-1669 | ECS | Posters on site | NH9.1
A Comprehensive Review of Coastal Compound Flooding LiteratureEGU24-2009 | ECS | Orals | NH9.1
Considering aftershock-induced damage accumulation in seismic loss assessmentsEGU24-5951 | ECS | Posters on site | NH9.1
Three-dimensional analysis of air temperature of the Hualien M6.9 earthquake based on the tidal forcesEGU24-7652 | ECS | Posters on site | NH9.1
A semi-automatic natural language tool to minimize systematic biases in geo-hydrological disaster datasets in tropical AfricaEGU24-7875 | ECS | Orals | NH9.1
Advancing drought detection and management using ML enhanced impact-based drought indexesEGU24-9197 | Orals | NH9.1 | Highlight
A global stochastic flood risk model for any climate scenarioEGU24-9533 | Posters on site | NH9.1
Modeling inland flooding caused by tropical cyclones in the US using AI-based synthetic eventsEGU24-9798 | ECS | Orals | NH9.1 | Highlight
Quantifying health-related climate metrics of extreme temperature disasters: An international analysis over five decadesEGU24-10060 | ECS | Posters on site | NH9.1
The Impact of El Niño-Southern Oscillation on Tropical Cyclone RisksEGU24-10905 | ECS | Posters on site | NH9.1
Flooding Under Climate Change in Small Island Developing StatesEGU24-13847 | Posters on site | NH9.1
Development of a Comprehensive Exposure-at-Risk Map for Europe: Integrating Coinciding Natural Hazards and Exposure MetricsEGU24-16095 | ECS | Posters on site | NH9.1
Do catchment characteristics drive extreme discharge tail behavior in the Meuse catchment? Insights from 1,040 years of synthetic discharge data.EGU24-16556 | ECS | Posters on site | NH9.1
Coastal flood risks in Europe in the context of sea-level rise: methods and preliminary results from the CoCliCo projectEGU24-17338 | ECS | Orals | NH9.1
Implications of the displacement of tropical cyclones for public policies in the North AtlanticEGU24-17738 | ECS | Orals | NH9.1
Complex emergencies: drivers of the humanitarian impacts of climate-related disastersEGU24-17751 | ECS | Orals | NH9.1 | Highlight
A New Method to Compile Global Multi-Hazard Event SetsEGU24-17874 | ECS | Orals | NH9.1
An evaluation of the use of regional climate model data applied to extreme precipitation in the Meuse basinEGU24-18718 | ECS | Orals | NH9.1
When one becomes many: Including complex channel systems in large scale flood models
GM5 – Humans, Life, and Landscapes
EGU24-1472 | Posters on site | GM5.2
Minimum duration of a Miocene lake phase in the hyperarid core of the Atacama Desert, ChileEGU24-2204 | Orals | GM5.2 | Highlight
On the tectonic and climatic controls to the evolutionary patterns of Andean plant groupsEGU24-3506 | Posters on site | GM5.2
Paleocene surface exposure ages imply an early development of hyperaridity in the Atacama DesertEGU24-6493 | ECS | Posters on site | GM5.2
Dating of upwelling archives in the eastern South Pacific: a multiproxy approach in the Late Neogene Bahía Inglesa Formation, North-Central ChileEGU24-6736 | Posters on site | GM5.2
Early Pliocene coastal upwelling off central Chile (Coquimbo Formation, Tongoy)EGU24-8271 | ECS | Posters on site | GM5.2
Quantifying processes in Earth’s Critical Zone in the Atacama Desert by combined luminescence and sedimentological approachesEGU24-8995 | ECS | Posters on site | GM5.2
Alluvial deposition at the Skeleton Coast, northern Namibia: chronology and spatial patternsEGU24-9360 | Posters on site | GM5.2
Studies of Nitrate Deposits in the Atacama Desert, Chile: Insights from Triple Oxygen Isotopes and Strontium IsotopesEGU24-9660 | Posters on site | GM5.2 | Highlight
Terracettes in the hyperarid Atacama Desert – fog-driven landforms of Holocene age?EGU24-10039 | ECS | Posters on site | GM5.2
Model Characterization of Hydrological and Fluvial Sediment Transport Processes in Present-day and Mid-Pliocene Climate ConditionsEGU24-10611 | ECS | Posters on site | GM5.2
Fog controls biological cycling of soil phosphorus in the Coastal Cordillera of the Atacama DesertEGU24-10679 | ECS | Posters on site | GM5.2
Mechanisms and timing of haloturbation in the northern Atacama Desert derived from a subsurface network of calcium sulphate wedgesEGU24-11939 | ECS | Posters on site | GM5.2
Assessing the last “large scale fluvial modification” across the hyperarid Atacama Desert, northern ChileEGU24-12220 | ECS | Posters on site | GM5.2
Significance of millennial-scale coastal upwelling and Rio Loa variability forAtacama paleoclimate during MIS 2EGU24-13141 | ECS | Posters on site | GM5.2
U-Pb LA-ICP-MS in situ dating of chrysocolla in copper deposits in Coastal Cordillera, northern ChileEGU24-18984 | Posters on site | GM5.2
Enhancing AMS measurement precision with the incorporation of 𝛿13C data measured with IRMSEGU24-1117 | Posters virtual | GM5.3
Application of Machine-Learning Based Models for Prediction of Suspended Sediment Load in the Indian Peninsular River BasinEGU24-1900 | Orals | GM5.3 | Highlight
Large Scale Modification of the Salton Sea Shoreline to Reduce the Potential for Dust EmissionsEGU24-4096 | ECS | Orals | GM5.3
Assessing river corridor changes after anthropogenic vegetation removal: an object-based mapping approachEGU24-4572 | ECS | Posters on site | GM5.3
Human impact on grain size variations of river gravel bars in the western Himalaya: Insights from a UAV surveyEGU24-9614 | ECS | Posters on site | GM5.3 | Highlight
The influence of anthropogenic topographic changes on geomorphological processes in the city of Rome (Italy)EGU24-11466 | Posters on site | GM5.3
The impact of anthropogenic activities on the geomorphological evolution of the Taro River over the last 70 yearsEGU24-12508 | ECS | Posters on site | GM5.3
A geophysical study of palaeochannels on the Somerset Levels coastal plain and wetland to explore river landscape evolution.EGU24-15250 | ECS | Posters on site | GM5.3
Legacy effects of post-storm silvicultural treatments on plot-scale soil erosion in a subalpine headwater catchment of the Italian AlpsEGU24-16648 | ECS | Posters on site | GM5.3
Shoreline Change Analysis After Construction of Coastal Structures in Wonpyeong-Chogok Beach by Satellite Image ProcessEGU24-19923 | Posters on site | GM5.3 | Highlight
Reading the sedimentary archives in the Danube floodplain downstream of Vienna (Austria)EGU24-472 | ECS | Posters on site | GM5.5
Comparative analysis of methods for assessing geoheritage degradation riskEGU24-909 | ECS | Orals | GM5.5
The influence of the spatial assessment unit on the final outcome of the geodiversity valueEGU24-4057 | Orals | GM5.5
Exploring the dynamics of geodiversity and land cover diversity in Northern AlbaniaEGU24-5421 | ECS | Posters on site | GM5.5 | Highlight
The Heritage of Frost Giants. From the Geomythologies to the Cultural Geomorphologyof Erratic Boulders in the Young Glacial Area of PolandEGU24-6207 | ECS | Orals | GM5.5
The spatial delineation of geosites: an approach for effective management and geoconservationEGU24-6702 | ECS | Orals | GM5.5
Cave Tourism in Switzerland: Implications for Preservation and Interpretation of Subterranean GeoheritageEGU24-8050 | ECS | Orals | GM5.5
Near-Surface Geophysical Investigation of Historic Mines in Ore Mountains, CzechiaEGU24-8148 | Posters on site | GM5.5
The Cimmerian Dobrogea Aspiring Geopark from Romania: raising awareness on the geological heritageEGU24-9525 | ECS | Orals | GM5.5
Bridging the gap between intangible science and society through geoheritageEGU24-15403 | ECS | Posters on site | GM5.5
Landform modifications within glaciotectonic landscape due to prolonged mining activity, Muskau Arch (W Poland)EGU24-15718 | ECS | Posters on site | GM5.5
Quantitative geodiversity inventory and evaluation on the example of SloveniaEGU24-16650 | ECS | Orals | GM5.5
Conservation of World Heritage glacial landscapes in a changing climate: The Swiss Alps Jungfrau-Aletsch caseEGU24-19805 | ECS | Posters on site | GM5.5
Citizen science in geoheritage: who participates in community geosite assessments?EGU24-21186 | Orals | GM5.5 | Highlight
Geosites that are out of this world: an example of planned development of Morasko (Poland) impact crater educational activitiesEGU24-1821 | ECS | Orals | HS9.3
Impact of soil erosion on chlordecone insecticide transfers in a tropical volcanic cultivated subcatchmentEGU24-6153 | ECS | Posters on site | HS9.3
Robust River load estimation of micropollutants: Method validation on an extended micropollutants datasetEGU24-6366 | ECS | Posters on site | HS9.3
Environmental and physical factors controlling the distribution of 137Cs in lake sediments in the Southern Hemisphere: a meta-analysis
EGU24-14030 | ECS | Posters virtual | HS9.3
Secondary Flow and Turbulent Kinetic Energy in a Dredged Channel with Riverbank
EGU24-15753 | Posters on site | HS9.3
Seasonal Retrieval of Suspended Sediment in the Pearl River Estuary Based on Measured DataEGU24-17267 | ECS | Orals | HS9.3
Tracing the eutrophication history of Lake Baldegg using diatom-bound nitrogen isotopesEGU24-17656 | ECS | Orals | HS9.3
Unravelling the mechanisms behind the spatial and temporal trends of suspended sediment in the Rhine basinEGU24-18246 | ECS | Posters on site | HS9.3
Suspended sediment and pollutant transport during heavy rain events: A case study of the Moselle riverEGU24-19408 | ECS | Posters on site | HS9.3
A Lagrangian Stochastic Approach with Embedded Ornstein-Uhlenbeck Processes for Suspended Sediment TransportEGU24-20737 | Posters on site | HS9.3
Lake organic and inorganic carbon cycle decoupling in response to historical watershed activities in Yunnan, ChinaEGU24-4999 | Posters on site | HS2.1.12 | Highlight
Lessons learned from 15 years of TERENO: the integrated TERrestrial ENvironmental Observatories in GermanyEGU24-7396 | Posters on site | HS2.1.12
Developing a coupled hydrological model for UK chalk catchmentsEGU24-9338 | ECS | Posters on site | HS2.1.12
The importance of in-situ soil moisture observations to evaluate the main drivers of event runoff characteristics in a small-scale catchmentEGU24-9375 | ECS | Posters on site | HS2.1.12
Link between groundwater storage and landscape changes in mountainous areas: the Kahule Khola watershed (Nepal)EGU24-13095 | Posters on site | HS2.1.12
Hydrological, biogeochemical, and ecological linkages at the land-sea margin: Insights from a coastal critical zone networkEGU24-13395 | Posters on site | HS2.1.12
Exploring Earth's Critical Zone Through the U.S. Critical Zone Collaborative NetworkEGU24-15453 | Posters on site | HS2.1.12
High Mountain Plateau Margin Critical Zone Observatory, Kaligandaki River NepalEGU24-17282 | ECS | Posters on site | HS2.1.12
Assessing the impact of stress–dependent hydraulic properties on hillslope-scale groundwater flow and transportEGU24-17490 | Posters on site | HS2.1.12 | Highlight
Hydroclimatic versus geochemical controls on silicate weathering ratesEGU24-20178 | Posters on site | HS2.1.12
Coevolution in the critical zone: the key role of fast hydrologic processesEGU24-219 | ECS | Posters on site | BG3.13
Rhizodeposition in the Plant Economic Space for 15 grassland species and its links to biogeochemical cycles (C,N)EGU24-743 | ECS | Posters on site | BG3.13
Assessing Fine Root Production in Terrestrial Forests: A Comparative Analysis of AI and Human Annotation Using Minirhizotron ImagesEGU24-3368 | ECS | Posters on site | BG3.13
Intra- and inter-specific changes in leaf and root defence traits along an experimental plant diversity gradient.EGU24-3412 | ECS | Posters on site | BG3.13
Unravelling the spatial structure of regular environmental spatial patternsEGU24-5143 | Posters on site | BG3.13
Quantification of rhizodeposition and priming effect of intermediate crops via 13CO2 labeling.EGU24-5403 | ECS | Posters on site | BG3.13
Effects of soil phosphorus on root exudates in central AmazoniaEGU24-7528 | ECS | Posters on site | BG3.13
Increasing root-derived soil carbon input to agricultural soils by variety selection of winter wheatEGU24-8136 | ECS | Posters on site | BG3.13
Model-based evaluation of the impact and longevity of a novel sustainable subsoil melioration method (Soil³ method) on root growthEGU24-8292 | ECS | Orals | BG3.13
Exploring the root economics space in shrub-encroached subalpine grasslandsEGU24-9347 | ECS | Posters on site | BG3.13
The impacts of several global change drivers on tropical root traits and dynamicsEGU24-9636 | ECS | Posters on site | BG3.13
Exudate dynamics and rhizosphere priming in wetland ecosystemsEGU24-9893 | ECS | Posters on site | BG3.13
Regional hotspots of Hengduan plant endemism inferring local speciation in response to connectivityEGU24-12367 | ECS | Posters on site | BG3.13
Increasing root trait complementarity in species mixtures may be detrimental for soil carbon storageEGU24-13758 | ECS | Posters on site | BG3.13
Assessing Sediment Delivery from Catchment Areas to Coastal Ecosystems in the Pacific Islands: A Study in an Urban ContextEGU24-14679 | ECS | Orals | BG3.13
Changes in soil organic carbon content affect plant available water more strongly in subsoil than in topsoilEGU24-14784 | ECS | Posters virtual | BG3.13
Vegetation Phenological Metrics and Accumulated Antecedent Precipitation (AAP) in dryland pastures.EGU24-17586 | ECS | Orals | BG3.13
Root functional strategies as drivers of the functional composition of soil fungal communitiesEGU24-18166 | Posters on site | BG3.13
Subsoil management as tool for climate-change adapted agricultureEGU24-19210 | Posters virtual | BG3.13
Management of belowground inputs is crucial to maintain soil carbon storage under climate changeEGU24-19602 | Posters on site | BG3.13
Influence of soil moisture content on water repellency after a forest burntEGU24-19872 | Posters on site | BG3.13
Subsoil amelioration in agriculture: Deep loosening and compost incorporation in a RetisolEGU24-20148 | Posters on site | BG3.13
Exploring Non-traditional Metal(loid) Stable Isotope Tools for Agricultural SystemsEGU24-22049 | Posters on site | BG3.13
Rapid alteration of organic matter cycling in a boreal peatland in response to rising temperaturesGM6 – Erosion, Sediments, Weathering, and Landscapes
EGU24-42 | Posters on site | GM6.1
Chemical composition and triple Sr isotopes of Gang-Kou River, Southern TaiwanEGU24-4124 | ECS | Posters on site | GM6.1
Beyond stream power: the dominance of landsliding on the active Taiwan orogenEGU24-7340 | Posters on site | GM6.1
Was the active Taiwan orogen one million years ago as high as today?EGU24-8368 | ECS | Posters on site | GM6.1
Chemical Weathering of Mafic Sources in Neogene New Guinea as a Control on Global ClimateEGU24-10899 | ECS | Posters on site | GM6.1
Source-to-Sink Sediment Tracing in the Glogn River CatchmentEGU24-11222 | Posters on site | GM6.1
Source-to-sink weathering response to the Paleocene-Eocene Thermal Maximum (PETM) in the Southern PyreneesEGU24-11667 | ECS | Orals | GM6.1
Debris flows and river dynamics – a case study of two Alpine catchments in western SwitzerlandEGU24-12576 | Posters on site | GM6.1
The Wimbach Observatory – Alpine sediment dynamics in transport-limited systems (Wimbach Valley, Berchtesgaden National Park)EGU24-13586 | ECS | Posters on site | GM6.1
In-situ Weathering of Alluvial Sediments in the Southern Central Andes Recorded by Ground- and Space-Based Hyperspectral ReflectanceEGU24-13843 | Posters on site | GM6.1
Using multispectral imagery to characterise weathering: A case study of moraines in the Central AndesEGU24-14355 | ECS | Posters on site | GM6.1
Modelling soil creep dynamics based on meteoric and terrestrial Be-10 coupling: validation on a hillslope profile in northern Abukuma Mountain, JapanEGU24-14856 | ECS | Orals | GM6.1
How debris flows shape mountain catchments? Insights from high-resolution topography.EGU24-16069 | ECS | Orals | GM6.1
Impact of Bedrock Fracturing on River Erosion: An Experimental ApproachEGU24-16621 | ECS | Posters on site | GM6.1
Quantifying the effect of freeze-thaw on daily sediment transport in an alpine catchmentEGU24-17114 | ECS | Orals | GM6.1
A multi-proxy approach to assess chemical weathering in the Southern French Alps since Marine Isotopic Stage 4EGU24-17766 | ECS | Posters on site | GM6.1
LiDAR assessment of sediment transport in a small, highly erosive alpine catchmentEGU24-18484 | ECS | Posters on site | GM6.1
A conceptual approach for deciphering mega-activity of debris flow fans and polygenetic fans for climate change anticipationEGU24-20646 | ECS | Orals | GM6.1
Enhanced CO2 consumption rate from silicate weathering by landslide erosion in the volcanic islandEGU24-140 | ECS | Orals | GM6.3
Controls on hydrological connectivity in the Lower Oder river and its floodplainEGU24-3050 | Posters on site | GM6.3
Alluvial fan river incision during climatic change: new clue from an experimental erosion deviceEGU24-4449 | Posters virtual | GM6.3
Fluvial fans as stratigraphic recorders of suborbital climate cyclicity: an example from the Lima fluvial fan in PeruEGU24-5232 | ECS | Posters on site | GM6.3
Source-to-Sink signal propagation in a coupled catchment-deep-sea fan system: the Sithas example from the Corinth Rift (Pleistocene, Greece)EGU24-7862 | ECS | Posters on site | GM6.3
Palaeohydrology and Fluvial Intermittency in the Eocene Hothouse: Castissent Formation, Southern PyreneesEGU24-8037 | ECS | Posters on site | GM6.3
Sedimentary systems archive the chronology of landscape evolution in the developing Okavango Rift Zone in southern AfricaEGU24-9145 | Posters on site | GM6.3 | Highlight
A systematic review of the hydrological and geomorphological impact of large dams in AfricaEGU24-10473 | ECS | Posters on site | GM6.3
Assessing the influence of large wood on sediment connectivity and river morphology in small streams in the Vienna Woods (Austria)EGU24-11891 | Orals | GM6.3 | Highlight
River responses to climate change – lessons from ancient river records, modern river discharge analyses and experimentsEGU24-12148 | ECS | Posters on site | GM6.3
Sea Level-Influenced Sedimentation in the Lower Brahmaputra Foreland Basin: Unraveling Dynamics and ProvenanceEGU24-17712 | ECS | Orals | GM6.3
Influence of network geometry on the sensitivity of alluvial rivers to environmental and tectonic changeEGU24-20022 | ECS | Posters on site | GM6.3
GIS-Based analysis of sediment connectivity in small mountain catchments of Metauro River (northern Apennines, Italy)EGU24-20212 | Posters on site | GM6.3
A Framework for Signal Shredding and Signal Detection Using a Physical Avalanching Rice PileEGU24-21535 | Posters on site | GM6.3
River capture frequency and magnitudes are regulated by rock erodibilityEGU24-617 | Posters virtual | GM6.4
Assessment of Suspended Sediment Dynamics in the Largest Peninsular Basin of IndiaEGU24-2975 | ECS | Posters on site | GM6.4
Initiation of the Central Tibet Watershed Mountains in Qiangtang: Insights from Provenance Mapping of Detrital Zircon Data SetEGU24-4832 | Posters on site | GM6.4
Dynamic drainage reorganization in the eastern Tibetan Plateau: A perspective from the First Bend of the Yangtze RiverEGU24-9769 | ECS | Orals | GM6.4 | Highlight
Understanding coastal response to sea level rise in Northern Italy: the Holocene history of the Tagliamento river deltaEGU24-11556 | ECS | Posters on site | GM6.4
Modelling Solutions for Ferricrete Formation and their Impacts on TopographyEGU24-11612 | Posters on site | GM6.4
Reconstructing Proterozoic Planforms and Channel Dynamics: New insights from the 1.2 Ga Stoer Group, NW ScotlandEGU24-11979 | Posters on site | GM6.4
Chemical analyses of surficial covers associated with alluvial fans in the western state of Bahia, BrazilEGU24-12448 | ECS | Posters on site | GM6.4
Anthropogenic stratigraphic signals downstream a metropolis:Extracting Vienna’s signature from Danube river plain archivesEGU24-17742 * | Orals | GM6.4 | Highlight
Landscape evolution on early Mars: a look inside a martian fan systemEGU24-14132 | ECS | PICO | GM6.5
'Witness mountains' on scarplands are expected outcomes of drainage capture dynamicsEGU24-19702 | PICO | GM6.5
Present-day denudation rates in postglacial landforms of the Polish LowlandsEGU24-20 | ECS | Orals | HS9.2
Effect of Sampling Design on Characterizing Surface Soil Fingerprinting Properties.EGU24-5507 | Posters on site | HS9.2
Impacts of rainfall variability on river discharges and suspended discharges : A Case Study in Chenyulan Watershed, TaiwanEGU24-5559 | ECS | Posters on site | HS9.2
Impact of dam construction on suspended sediment load alteration
EGU24-5752 | ECS | Posters on site | HS9.2
Exploring Remote Sensing Methodologies for River Bed Grain Size: Insights from a Mountainous Watershed Study in Val Camonica, ItalyEGU24-7560 | ECS | Posters on site | HS9.2
Impact Analysis of Series of Groundsills on the Fluvial Stability and GeomorphologEGU24-7827 | Orals | HS9.2
Impacts of check dams: a monitoring experience along a mountain watercourseEGU24-8068 | ECS | Posters on site | HS9.2
The new Austrian standard ÖNORM B4800 for torrent control workEGU24-8164 | ECS | Posters on site | HS9.2 | Highlight
Reconstructing the Flood History of Nan Ancient City: Insights from Sedimentary AnalysisEGU24-8675 | ECS | Posters on site | HS9.2
Assessment of flash flood impacts in a mountain basin: an integrated approach for the management of channel control worksEGU24-9807 | ECS | Posters on site | HS9.2
Quantifying Sediment Dynamics in an Alpine River Catchment using a 10Be Tracing MethodEGU24-16053 | ECS | Posters virtual | HS9.2
Hydrological and Sediment Transport Regime on Rivers in the Balkans: The Case of the Seman River in AlbaniaEGU24-16692 | Posters on site | HS9.2
Pre-event conditions and rainfall–runoff characteristics drive suspended sediment source variabilityEGU24-20102 | ECS | Posters on site | HS9.2
Deglaciation and debris flow dynamics: how does the glacier retreat affect debris flow activity in High Mountain Asia?EGU24-20482 | Posters on site | HS9.2
Advancing sediment fingerprinting techniques: The importance of considering sediment mixtures data in tracer selectionEGU24-21734 | Orals | HS9.2
Measures to mitigate torrential hazards in a typical alpine catchment area in SloveniaEGU24-1197 | ECS | Orals | EMRP1.3
A comparison of exfoliation joint formation mechanisms: what is the role of surface processes?EGU24-1670 | ECS | Posters on site | EMRP1.3
High-alpine rock slides controlled by pre-existing geological structures and brittle rock mass fracturingEGU24-3021 | ECS | Posters on site | EMRP1.3
Contribution of programming language to novel mine risk assessment projectEGU24-3893 | Posters on site | EMRP1.3
Increases in Poisson’s ratio due to cyclic deformation in cracked rockEGU24-5440 | Posters on site | EMRP1.3
Using AE based Machine Learning Approaches to Forecast Rupture during Rock Deformation Laboratory ExperimentsEGU24-5553 | Orals | EMRP1.3
Progressive rock failure under different loading conditions – sound and visionEGU24-9339 | ECS | Orals | EMRP1.3
The role of grain fragmentation in understanding shear localization via DEM simulationEGU24-10753 | ECS | Orals | EMRP1.3
Non-linear softening and relaxation in rocks and geomaterials: a laboratory perspectiveEGU24-13010 | ECS | Posters on site | EMRP1.3
The influence of fluid pressure on the phase transition of brittle faultingEGU24-14362 | Posters on site | EMRP1.3
Salt-driven Progressive Fracturing of Alluvial Boulders Along the Hyper-arid Shoreline of the Dead SeaEGU24-16652 | ECS | Posters on site | EMRP1.3
Time- and stress-dependent elastic properties in a concrete structure; spotting internal damage footprintsEGU24-10794 | ECS | PICO | SSS2.2
Correlating different evaluation methods for SWC as support for soil processes modellingEGU24-11138 | ECS | PICO | SSS2.2
Experimental simulation of soil erosion in the context of climate change in NW France.GM7 – Planetary, Aeolian and Dryland Geomorphology
EGU24-1889 | ECS | Posters on site | GM7.1
Deciphering the formation processes of linear dune gullies on MarsEGU24-5319 | ECS | Orals | GM7.1 | Highlight
The Upper Gediz Vallis Ridge at Gale Crater: Sedimentary Rock Clasts Transported by a Late-Stage Debris Flow on Mars?EGU24-8469 | ECS | Orals | GM7.1
Complex flow of mud over cold and frozen surfaces in low pressure: Insights from physical experimentsEGU24-8670 | ECS | Posters on site | GM7.1
Mapping the Tesserae Highlands of Venus – Insights into Tectonic Deformation and Plateau GenesisEGU24-8701 | ECS | Posters on site | GM7.1
Clusters of Late Noachian- Early Hesperian large volcanic constructs across Arabia Terra and Xanthe Terra on MarsEGU24-10798 | ECS | Posters on site | GM7.1
Hydro-Morphodynamic Delta Modelling for Future Exploration Insights at Oxia Planum, MarsEGU24-14037 | ECS | Orals | GM7.1
Putative Cold Seep Systems on Pluto: Analyzing Crater Morphology to Investigate Geological Sources of MethaneEGU24-15674 | ECS | Posters on site | GM7.1
A high-resolution hydrological model at planetary scale : conceptual study of the distribution and evolution of water reservoirs on early Mars.EGU24-15949 | ECS | Posters on site | GM7.1
Shock metamorphic features in minerals in crater fill from the Tvären impact structure, SwedenEGU24-18586 | ECS | Posters on site | GM7.1 | Highlight
Where Environments Collide: Aeolian-Fluvial Interactions on Ancient MarsEGU24-19885 | Posters on site | GM7.1
Understanding Martian megaflood-infiltration Landscapes at Hebrus Valles through Laboratory Experiments

EGU24-667 | ECS | Orals | GM7.2
Ripple patterns on Martian barchan dunes in the north: indicators of the flow regime.EGU24-4780 | Orals | GM7.2 | Highlight
The discovery of aerodynamic ripples in wind tunnel experiments
EGU24-6521 | Posters on site | GM7.2 | Highlight
Coevolving aerodynamic and impact ripples on Earth: unifying bedforms on water, Earth and MarsEGU24-7825 | ECS | Orals | GM7.2
Barchan swarm dynamics simulated with a Two-Flank Agent-Based ModelEGU24-11459 | ECS | Posters on site | GM7.2
Steady-state dune shapes through the barchan-parabolic transition.EGU24-13184 | ECS | Posters on site | GM7.2
Aeolian saltation: median height, mean grain size, and dimensionless shear velocityEGU24-16809 | ECS | Posters on site | GM7.2
Dynamic changes in the landscape of bare sand patches in sandy grasslandsEGU24-16955 | Posters on site | GM7.2
Photogrammetry as a tool to study the formation and evolution of aeolian ripples on a flat bed eroded by impactEGU24-18242 | ECS | Posters on site | GM7.2
Impact of grain size distribution and wind velocity on the armoring layer of aeolian megaripplesEGU24-18650 | Orals | GM7.2
Bright-toned aeolian bedforms in Oxia Planum (Mars), the ESA ExoMars landing siteEGU24-18903 | Posters on site | GM7.2
Effective shear stress threshold on Mars from a global dune flux surveyEGU24-19235 | ECS | Posters on site | GM7.2
Is impact ripple flattening caused by aeolian shear melting of the granular bed?
EGU24-2738 | ECS | PICO | GM7.3
Application of Sedimentary Forward Simulation in the Kezilesu Group of the Kedong Structural BeltEGU24-3400 | ECS | PICO | GM7.3
Small endorheic basin sediments along a climatic gradient as paleoenvironmental archivesEGU24-11443 | PICO | GM7.3 | Highlight
Mineral dust in the climate system: Dust source types and their response to environmental changes in a changing climateEGU24-1458 | Orals | PS2.5 | Highlight
Constraining the Thickness of the Conductive Portion Europa's Ice Shell using Sparse Radar EchoesEGU24-5965 | Posters on site | PS2.5
Ground-based monitoring of atmospheric species on Titan and a search for new nitriles with IRTF/TEXESEGU24-6159 | ECS | Posters on site | PS2.5
The effects of an icy porous layer on the two-way radar attenuation on EnceladusEGU24-7948 | ECS | Orals | PS2.5
The role of ammonia in the primordial distribution of volatiles in the hydrosphere of EuropaEGU24-9751 | ECS | Posters on site | PS2.5
Icy Moon Surfaces Microstructure through Multiphysics SimulationsEGU24-13407 | ECS | Posters on site | PS2.5
From Sea Ice to Icy Shells: Modeling the Dielectric Properties of Ice-Brine MixturesEGU24-13575 | ECS | Orals | PS2.5
Supercooling and Glass Formation upon Freezing of Enceladus-relevant Salt SolutionsEGU24-17359 | ECS | Orals | PS2.5
Microwave scattering in the Antarctic megadunes region: reconciling radar and radiometryEGU24-17668 | ECS | Posters on site | PS2.5
Numerical analysis of polar orbits for future Enceladus missionsEGU24-18532 | ECS | Posters on site | PS2.5
The thermal and dynamic state of Europa’s ice shell: Revealed by global-scale convection modelsEGU24-20219 | ECS | Posters on site | PS2.5
The Leaky Cauldron; an experimental study of the icy plumes of EnceladusEGU24-20872 | ECS | Orals | PS2.5
Optimising Thermal Mapping Instrument Filters to Unveil Enceladus' Subsurface Secrets
EGU24-21117 | Posters on site | PS2.5 | Highlight
Compiling analysis-ready ice data across cryosphere disciplinesEGU24-765 | ECS | Posters virtual | HS2.1.5
Origin, gradient, and recharge processes of perched aquifers of the Monahans and Kermit dune fields, northern Chihuahuan Desert, Texas, USAEGU24-2567 | ECS | Orals | HS2.1.5 | Highlight
GIRHAF (Gridded hIgh-resolution Rainfall for the Horn of AFrica): a new rainfall product for detailed applications in a region beset by climate hazardsEGU24-4462 | ECS | Posters on site | HS2.1.5
Modeling the impact of climate and land use changes on future water resources dynamics in central Sicily, ItalyEGU24-6984 | ECS | Posters on site | HS2.1.5
Westerly aridity in the western Tarim Basin driven by global cooling since the mid-Pleistocene transitionEGU24-7611 | ECS | Orals | HS2.1.5
Locating unsustainable water supplies for supporting ecological restoration in China's drylandsEGU24-10078 | ECS | Orals | HS2.1.5 | Highlight
Wheat irrigation in Marrakech conditions: A Simulation Study using SALTMEDEGU24-11799 | ECS | Orals | HS2.1.5 | Highlight
Exploring the mechanisms controlling dryland hydroclimate in past 'warmer worlds'EGU24-12194 | ECS | Orals | HS2.1.5
High resolution surface soil moisture microwave products: intercomparison and evaluation over SpainEGU24-13979 | Orals | HS2.1.5
Changes and attribution of natural runoff in the Yellow River over the past 500 yearsEGU24-14057 | ECS | Posters on site | HS2.1.5
Turbulent fluxes at kilometer scale determined by optical-microwave scintillometry in a heterogeneous oasis cropland of the Heihe River BasinEGU24-16291 | ECS | Orals | HS2.1.5
A New Perspective on Agricultural Drought Periods: A Mediterranean Semi-Arid ContextEGU24-17983 | ECS | Orals | HS2.1.5
Comparison of C-band radar and infrared thermal data for monitoring corn field in semi-arid area.EGU24-18295 | ECS | Posters on site | HS2.1.5
The relevance of Rossby wave breaking for precipitation in the world’s arid regionsEGU24-19511 | Posters on site | HS2.1.5
OurMED PRIMA-funded Project: Sustainable Water Storage and Distribution in the MediterraneanEGU24-20356 | ECS | Posters on site | HS2.1.5
Seasonal Water Turbidity Dynamics in Arid Central Asia: A Case Study of Lake Balkhash, Kazakhstan, Under Changing Environmental ConditionsEGU24-20999 | ECS | Orals | HS2.1.5
Soil and rock water dynamics in a semiarid karst savanna undergoing woody plant encroachmentEGU24-430 | ECS | PICO | AS3.9
West African dust load modeling and its impact on solar radiation forecast during the dry seasonEGU24-989 | ECS | PICO | AS3.9 | Highlight
Atmospheric radioisotopes in cryoconite from the Flade Isblink ice cap, NE GreenlandEGU24-1776 | PICO | AS3.9 | Highlight
Assessment of the Impact of Coarse and Fine Dust on Solar Devices in the Middle EastEGU24-2280 | ECS | PICO | AS3.9
Different orbital rhythms in loess grain-size records across the Chinese Loess PlateauEGU24-3106 | PICO | AS3.9 | Highlight
African dust transport and deposition modelling verified through a successful citizen science campaign in FinlandEGU24-3981 | ECS | PICO | AS3.9
How dust sources affect downstream regions in East Asia during a dust storm event
EGU24-4799 | ECS | PICO | AS3.9
Modeling the Mercury Cycle in the Sea Ice Environment: A Buffer between the Polar Atmosphere and OceanEGU24-5573 | ECS | PICO | AS3.9
Stronger early-spring dust outbreaks across the Northern Hemispheric mid-latitudes in a warmer climateEGU24-7871 | ECS | PICO | AS3.9
Wind erosion in Western Sahel : Quantifying the impact of land use and land managementEGU24-8628 | PICO | AS3.9 | Highlight
Impact of Saharan mineral dust layers on cloud formation and cloud propertiesEGU24-8796 | PICO | AS3.9 | Highlight
Potential environmental impacts of natural and mining related dust in Greenland and SvalbardEGU24-9570 | ECS | PICO | AS3.9
On the importance of Mongolian cyclones to East Asian dust storm activitiesEGU24-11462 | ECS | PICO | AS3.9
Seasonal effects of wind-blown dust emissions on size-resolved aerosol acidity over the U.SEGU24-12203 | ECS | PICO | AS3.9
Black Carbon and Dust in the snow of Chilean Central Andes: From albedo reductions to radiative forcingEGU24-12289 | ECS | PICO | AS3.9
Image-based nowcasting of dust storms by predicting SEVIRI desert dust RGB compositesEGU24-14539 | ECS | PICO | AS3.9
Exploring the effects of mineral dust acidification on oxidative potential and limiting nutrient solubilityEGU24-16299 | PICO | AS3.9 | Highlight
Diverse and high pollution of microplastics in seasonal snow across Northeastern ChinaEGU24-16833 | ECS | PICO | AS3.9
Cumulative and relative impact of aerosol species on snowmelt runoff from the Hindu Kush Himalayan glaciersEGU24-18339 | ECS | PICO | AS3.9
Fire-driven dust emissions – applying a newly developed parameterization scheme in a global aerosol-modelEGU24-18893 | ECS | PICO | AS3.9
Size segregation process along the soil-saltation-dust continuum: observations in southern TunisiaEGU24-20949 | PICO | AS3.9
Radiative Forcing Assessment of Black Carbon in Snow from the Antarctic PeninsulaGM8 – Tectonic, Volcanic, and Regional Geomorphology
EGU24-193 | ECS | Orals | GM8.1 | Highlight
Repeated failures of the giant Beshkiol landslide and its impact on the long-term Naryn Basin flooding, Kyrgyz Tien ShanEGU24-426 | ECS | Orals | GM8.1
Late oligocene elevation of the Himalaya recorded by O and H isotopes of fluid inclusionsEGU24-953 | ECS | Posters on site | GM8.1
Tectonic and climatic controls on terrace preservation in a large Himalayan river catchmentEGU24-2774 | ECS | Posters on site | GM8.1
Hillslope-controlled incision thresholds shape mountain range topography of the Northern AndesEGU24-4046 | ECS | Posters on site | GM8.1
The influence of sediment isostatic adjustment on sea-level change and its records along the coast of TaiwanEGU24-4055 | ECS | Posters on site | GM8.1
Formation of the Hukou waterfalls by entrenchment due to a downstream integration processEGU24-4481 | Posters on site | GM8.1
A Comparative Analysis of Fluvial Propagation and Divide Migration in the Liqiu River Basin, Eastern TibetEGU24-5153 | ECS | Orals | GM8.1
Monazite fission-track thermochronology as a possible proxy for low-magnitude erosionEGU24-5229 | Posters on site | GM8.1 | Highlight
Effects of glaciations on the tectonics of active continental margins: Insights from force-balance models and implications for the North Patagonian AndesEGU24-5304 | ECS | Posters on site | GM8.1
The validity of river steepness as a proxy for erosion ratesEGU24-6089 | Posters on site | GM8.1
The rapid surface uplift of the Eastern Alps. Evidence from cosmogenic nuclides and mapping of elevated low relief surfacesEGU24-6121 | Posters on site | GM8.1
Old orogen - young topography: erodibility contrast as superior control of relief rejuvenation in the Bohemian Massif?EGU24-6732 | Posters on site | GM8.1
Temporal deceleration of fluvial incision since the Middle Pleistocene along the Salween-Nu River in southeast TibetEGU24-7041 | ECS | Orals | GM8.1
Pleistocene drainage reorganization of the upper reaches of the Han River and its tectonic significanceEGU24-7438 | ECS | Orals | GM8.1 | Highlight
Climate-driven topographic asymmetry enhanced by glaciers: Implication for divide stability in glacial landscapesEGU24-7773 | ECS | Posters on site | GM8.1
Multi-stage Cenozoic exhumation history of southern Central Tian Shan: implications for geodynamic and sedimentary evolutionEGU24-8974 | ECS | Orals | GM8.1 | Highlight
The stratigraphic and orogenic response to the Middle Miocene Climatic Optimum in the southern Central AndesEGU24-9632 | Orals | GM8.1
Late Miocene evolution of Jordan Rift Valley recorded on its eastern flankEGU24-10973 | ECS | Orals | GM8.1
Tectonic advection controls drainage divide asymmetry patterns in the Longmenshan, SE Tibet, ChinaEGU24-11794 | Posters on site | GM8.1
Impact of glaciations on the exhumation history of the Kyrgyz Range – Western Tien Shan (Kyrgyzstan).EGU24-12433 | ECS | Posters on site | GM8.1
The Atacama Desert rock coast: an underrated witnesses of long-term wave erosionEGU24-14635 | Orals | GM8.1
Late Cenozoic deformation and glacial imprint on the Terskey Range, KyrgyzstanEGU24-15427 | ECS | Posters on site | GM8.1
River long profile modelling since the Mid-Pleistocene for the Río Santa Cruz, Southern Patagonia.EGU24-17993 | Posters on site | GM8.1
Recent denudation rates of southwestern Madagascar from a 10Be analysis of river sand samplesEGU24-18199 | ECS | Orals | GM8.1
Quaternary incision dynamics of the western to central Alpine valleys from cave systems investigationsEGU24-18699 | ECS | Orals | GM8.1
A landscape evolution model of how uplift has shaped drainage patterns in Central EuropeEGU24-447 | ECS | Orals | TS6.2
Tectonic and exhumation history of the Albanian Dinarides orogenic beltEGU24-991 | ECS | Posters on site | TS6.2
Quantifying crustal thickening and surface uplift in the northernmost Central AndesEGU24-3286 | ECS | Posters on site | TS6.2
The role of dip-slip components in creating and maintaining a strike-slip landscapeEGU24-3416 | ECS | Posters on site | TS6.2
Re-visiting the dip-slip rate of the North Tehran Fault at the northern megacity of Tehran (Iran) using luminescence datingEGU24-6226 | ECS | Posters on site | TS6.2
A 60.000-year tectonic record: speleoseismology insights from a fault zoneEGU24-6673 | ECS | Posters on site | TS6.2
Drainage base-level fall history in North-western Apennines and implications on the Alessandria Basin tectonic activityEGU24-7399 | ECS | Posters on site | TS6.2
Mechanical Models for East-West Extension within the Pamir Orogen: Insights from of the Holocene slip rate of the Kongur Normal FaultEGU24-9405 | ECS | Posters virtual | TS6.2
The thrust structure and slip partitioning of Haiyuan-Qilian systems at NE margin of Tibetan plateau, constrained from geomorphic evidenceEGU24-11036 | ECS | Orals | TS6.2
A reappraisal of the Carboneras Fault (SE Spain) from new structural, geochronological and thermal constraintsEGU24-12360 | ECS | Posters on site | TS6.2
Unraveling Flat Mountain Tops in the Coastal Cordillera of Central Chile: Based on Erosion Rates, Knickpoints, and Uplift MechanismsEGU24-14293 | ECS | Posters on site | TS6.2
Preliminary study on the characteristics and slip rate of the Quaternary fault in Mogod, MongoliaEGU24-14396 | Posters on site | TS6.2
Resetting of IRSL and IRPL signals by frictional heating in experimentally sheared Granite rock at seismic slip ratesEGU24-15246 | ECS | Posters on site | TS6.2
Sentinel-1 Insights into interseismic coupling along the plate boundary of the Western Makran Subduction ZoneEGU24-15504 | Posters on site | TS6.2
Cenozoic clockwise rotation of the northeastern Tibetan PlateauEGU24-15558 | ECS | Posters on site | TS6.2
Isolating tectonic signals from transient and lithologically heterogeneous landscapes in the Gulf of Corinth, GreeceEGU24-17056 | Posters on site | TS6.2
Deformation at Mefite d’Ansanto area (Italy) through an interdisciplinary approach: GNSS Network and Digital Elevation ModelEGU24-18030 | ECS | Posters on site | TS6.2
Timing of deformation in the Moravosilesian Foreland Basin – new insights from detrital zircon U-Pb datingEGU24-3024 | Posters on site | TS4.2
Instant weathering response to carbon-cycle perturbations during the end-Triassic extinctionEGU24-4635 | ECS | Orals | TS4.2
Starting of Qilianshan’s uplift since Cenozoic and its implications for Tibetan mantle dynamicsEGU24-4821 | ECS | Posters on site | TS4.2
The reservoir development model of different lithology basement rocks in Erlian Basin,Northeast China.EGU24-6716 | ECS | Orals | TS4.2
Helium diffusion systematics in apatites: lessons from Continuous Ramped Heating analysisEGU24-10890 | ECS | Posters on site | TS4.2
Evaluating the classic and distal Fish Canyon Tuff localities with apatite 4He/3He thermochronologyEGU24-11185 | ECS | Posters on site | TS4.2
New Constraints on Late Cenozoic Convergence between the Pamir and South Tianshan from Apatite (U-Th-Sm)/He ThermochronologyEGU24-12215 | ECS | Posters on site | TS4.2
Apatite U-Pb, fission-track, and trace element provenance constraints on Oligocene-Miocene northeastern Tibetan Plateau growth and dynamicsEGU24-13898 | Posters on site | TS4.2
Middle-late Mesozoic tectonic evolution of the NE China—corresponding to westward subduction of the paleo-Pacific plateEGU24-13936 | Posters on site | TS4.2
Overview of thermochronological studies in and around the Japan Arc; towards Thermo2025 Conference in Kanazawa, JapanEGU24-14975 | ECS | Posters on site | TS4.2
Impact of magmatic intrusions on metamict zircon annealing as constrained by Raman spectroscopy in the eastern Adamello batholith (Central Alps)EGU24-16090 | Posters on site | TS4.2
Lineament analysis for characterizing regional fracture system – A case study from the Oslo region, NorwayEGU24-16413 | Posters on site | TS4.2
From Margin to Menace: the role of structural inheritance in the geohazards distribution in NorwayEGU24-19032 | ECS | Posters on site | TS4.2
Effective Etch Times and compositional effects on the etching of Fossil Fission Tracks in Geological Apatite SamplesEGU24-20432 | Posters on site | TS4.2
Development and implications of a new open-source time-temperature inversion programEGU24-440 | ECS | Posters on site | GD1.1
Spatial and temporal variation in dynamic mantle support of the Antarctic plate: Implications for ice sheet evolutionEGU24-1686 | ECS | Posters on site | GD1.1
Detecting subduction-related metamorphic events during the early Brasiliano Orogeny in southern Borborema Province using detrital rutileEGU24-2321 | ECS | Orals | GD1.1
Cenozoic asthenospheric flow history in the Atlantic realm: Insights from Couette/Poiseuille flow modelsEGU24-2631 | Orals | GD1.1 | Highlight
River incision on hotspot volcanoes: insights from paleotopographic reconstructions and numerical modellingEGU24-3473 | Posters on site | GD1.1
The gully system on the NW sector of La Fossa cone (Vulcano Island): 2D evolution and hazard implicationEGU24-4552 | ECS | Orals | GD1.1 | Highlight
Synthetic Hiatus Maps as a Tool for Constraining Global Mantle Circulation ModelsEGU24-6721 | Orals | GD1.1 | Highlight
Sensitivity of Long-Wavelength Dynamic Topography and Free-Air Gravity to Lateral Variations in Lower Mantle ViscosityEGU24-7187 | ECS | Posters on site | GD1.1
Spontaneous Formation of Mantle Wind by Subduction and Its Impacts on Global Subduction AsymmetryEGU24-8475 | ECS | Posters virtual | GD1.1
Patterns of volcanic eruptions in connection to sea-level changeEGU24-8609 | ECS | Posters on site | GD1.1
Implications of dynamic topographic measurements along Africa’s passive marginsEGU24-9346 | Orals | GD1.1 | Highlight
Long-wavelength gravity and topography of the Pacific Ocean: Relative contribution of mantle dynamics and plate flexureEGU24-10128 | ECS | Orals | GD1.1
Exploring the potential of normal mode seismology for the assessment of geodynamic hypothesesEGU24-10566 | ECS | Orals | GD1.1
Global assessment of tomographic resolution and uncertainty with the SOLA methodEGU24-11744 | Orals | GD1.1 | Highlight
‘Volcano Geomorphology: landforms, processes and hazards’ ̶̶ A new book in ‘Advances in Volcanology’ Collection, Springer VerlagEGU24-11817 | ECS | Orals | GD1.1
River dynamics in an active volcano with tropical humid conditionsEGU24-12118 | ECS | Orals | GD1.1
Global continental hiatus surfaces as a proxy for tracking dynamic topography since the Upper JurassicEGU24-15103 | Posters on site | GD1.1
Understanding volcanic edifice erosion and morphologic evolution using numerical modelsEGU24-15687 | Posters on site | GD1.1
The EVoLvE toolkit: a set of methods for systematic quantification of volcano morphometry and their temporal evolutionEGU24-17475 | ECS | Posters on site | GD1.1
Surface regimes can provide an inherent perspective into interior dynamicsEGU24-18172 | Orals | GD1.1
On the different contributions to the peculiar topography of the Iberian PeninsulaEGU24-18291 | ECS | Posters on site | GD1.1
Lava tubes formation and extensive flow field development during the 1858 eruption of Mount Vesuvius.EGU24-21095 | Posters on site | GD1.1
Evolution and Growth of Lava Deltas: Insights from the 2021 La Palma Eruption (Canary Islands)EGU24-21597 | ECS | Orals | GD1.1 | Highlight
The Chon Aike magmatic province: an active margin origin?GM9 – Coastal and Submarine Geomorphology
EGU24-7489 | ECS | Orals | GM9.1 | Highlight
Spatial characteristics of washovers formed in the coastal zone of the semi-enclosed tideless sea basin, Gulf of Gdańsk, Baltic SeaEGU24-11826 | ECS | Orals | GM9.1 | Highlight
Computational Fluid Dynamics Model to Simulate Wind Flow Across a ForeduneEGU24-12232 | ECS | Orals | GM9.1
Performance of Satellite-Derived Shoreline algorithms on a beach with banquettes of Posidonia oceanica.EGU24-13439 | Posters on site | GM9.1
Morphodynamic classification of moraine cliffs of the Southern Baltic Sea coastEGU24-13785 | Orals | GM9.1 | Highlight
Ninety years of shoreline change at Narrabeen Beach (Australia) from sub-daily to decadal time scalesEGU24-14647 | ECS | Orals | GM9.1
Short-term coastal morphodynamics simulation using wave phase-resolving and phase-averaged models.EGU24-15730 | ECS | Orals | GM9.1
Effect of cohesive sediments on coastal bar morphology under waves and currentsEGU24-16635 | ECS | Orals | GM9.1
Erosional behaviour of a glacial till cliff coast in Stohl, Baltic Sea, GermanyEGU24-17322 | Orals | GM9.1 | Highlight
Assessing the dune system for coastal safety utilizing morphological modelsEGU24-17548 | Posters on site | GM9.1
Subpixel classification of high-resolution satellite images to identify dune plantsEGU24-18560 | ECS | Posters on site | GM9.1
Supervised segmentation algorithm for coastal dunes delimitation and classificationEGU24-19644 | ECS | Posters on site | GM9.1 | Highlight
Linking headland bypassing to the evolution of a spit and beach ridge system - Slocums River Embayment, Buzzards Bay, Massachusetts, USA
EGU24-19712 | Posters on site | GM9.1
Morphosedimentary evolution of a beach spit system (Punta Rasa, Argentina)EGU24-21383 | Posters on site | GM9.1
The role of a multiple intertidal barred (MITB) system in dissipating extreme storm wave energyEGU24-302 | ECS | Orals | GM9.2
New approach to the tendencies of coastal dynamics of the Curonian Spit based on wave reanalysis dataEGU24-2022 | ECS | Orals | GM9.2 | Highlight
Plant establishment and plant-sand feedbacks as fundaments for dune-for-dike nature-based solutionsEGU24-2083 | Posters on site | GM9.2
Multi-disciplinary monitoring system for resilient management of coastal areas: the REMACO projectEGU24-2843 | ECS | Posters on site | GM9.2
Recent changes in the morphodynamic of the Ebro river mouth (NW Mediterranean Sea)EGU24-6594 | ECS | Orals | GM9.2
Critical transition in barrier island’s state and the loss of barrier resiliencyEGU24-8052 | Orals | GM9.2
X-ray CT characterisation of dune sands to inform geomorphological modelsEGU24-9468 | ECS | Orals | GM9.2 | Highlight
Rates and Drivers of Coastal Cliff Erosion in England from 2 Decades of Lidar ObservationsEGU24-9730 | ECS | Posters on site | GM9.2 | Highlight
Enhancing coastal resilience with artificial dunes through bio-geomorphological processesEGU24-10562 | Posters virtual | GM9.2 | Highlight
Designing dunes in front of dikes: a hybrid blue-grey solutions for coastal safety under climate changeEGU24-14320 | ECS | Posters on site | GM9.2
Application of shore sediments accumulated in navigation channel for restoration of sandy beaches around Pärnu City, SW EstoniaEGU24-14736 | Posters on site | GM9.2
Simulating Long-Term Morphological Changes in the Nakdong River Estuary: Evaluating the Effects of Restoration InitiativesEGU24-15705 | ECS | Posters on site | GM9.2
Establishment of dune-building grasses in relation to beach moisture, burial and erosionEGU24-15906 | ECS | Posters on site | GM9.2
Monitoring beach erosion along the Italian coast: the case of Molise regional coast (Central Adriatic)EGU24-17855 | Posters on site | GM9.2
Storm-surge barriers induce loss of geomorphic diversity in shallow tidal embaymentsEGU24-17924 | Orals | GM9.2 | Highlight
Dune-based Nature-based Solutions in Ireland: unlocking their full potential to build coastal resilienceEGU24-18981 | ECS | Posters on site | GM9.2 | Highlight
Did the Vikings Trigger Dune Belt Formation in Saaremaa (Estonia)?EGU24-19690 | ECS | Orals | GM9.2
Multitechnical approach for the reconstruction of coastal changes: the case of Cala del Cefalo (southern Italy)EGU24-21172 | ECS | Posters on site | GM9.2 | Highlight
Unforeseen geomorphic consequences of modifying coastal river systemsEGU24-961 | ECS | Posters on site | GM9.4
Interplay between natural drivers and human activities in two Northern Adriatic lagoonsEGU24-5879 | ECS | Posters on site | GM9.4
Salt marsh organic matter quality and decomposition under sea-level rise scenarios: from leaves to fine absorptive rootsEGU24-6298 | ECS | Posters on site | GM9.4
Monitoring and Assessment of Salt Marsh Restoration Using Field and Remotely Sensed DataEGU24-7257 | ECS | Posters on site | GM9.4
Tidal influence on heat exchange and temperature dynamics in salt marshesEGU24-9168 | ECS | Orals | GM9.4 | Highlight
Land Reclamation Controls on Estuarine Morphological EvolutionEGU24-10523 | ECS | Posters on site | GM9.4
Using sediment texture and geochemistry as predictors to automatically classify sub-depositional environments in a modern estuaryEGU24-12648 | Posters on site | GM9.4
The accretionary balance of saltmarshes in Great Britain since 1900EGU24-15885 | Posters on site | GM9.4
Saltmarsh restoration through construction of sedimentation fields: controls on sediment delivery and hydrodynamicsEGU24-16273 | ECS | Orals | GM9.4 | Highlight
Identifying the drivers of sediment strength and erosion resistance in natural and restored tidal marshesEGU24-16633 | ECS | Posters on site | GM9.4
Stream Meandering in Coastal Wetlands: Patterns, Processes, and Ecomorphodynamics ImplicationsEGU24-17209 | ECS | Orals | GM9.4
Managing Marsh Nourishment Projects: An Integrated Measuring and Modeling ApproachEGU24-17274 | ECS | Posters on site | GM9.4
How does landscape vegetation configuration regulate local channel initiation in rapidly expanding marsh?EGU24-17347 | ECS | Orals | GM9.4
Fluid Mud Occurrence in the Hyper-Turbid Ems Estuary: Insights into Tidal Cycle InfluenceEGU24-17737 | ECS | Posters on site | GM9.4 | Highlight
Slowing down the tidal flood wave is the key to reducing tidal flood risk in estuaries worldwideEGU24-20007 | Orals | GM9.4 | Highlight
How much information do we need for a realistic representation of coastal wetland evolution?EGU24-21037 | ECS | Posters on site | GM9.4
Controls on the growth of wave-influenced river deltas: The roles of fluvial sediment composition and basin depthEGU24-7108 | Posters on site | GM9.5
One-dimensional land subsidence modelling constrained by electrical logging and its uncertainty analysisEGU24-8379 | ECS | Orals | GM9.5
The relationship between organic content and compressibility of peat and clay soilsEGU24-8808 | Posters on site | GM9.5
Land subsidence model inversion with the structural noise of tectonic motion and unknown groundwater abstractionEGU24-10558 | Posters on site | GM9.5 | Highlight
Assessing and mapping of land subsidence risk at different scales in major urban areas in ItalyEGU24-13137 | ECS | Posters on site | GM9.5 | Highlight
Land subsidence induced by urbanization: towards building damage predictionsEGU24-15465 | Posters on site | GM9.5
InSAR illuminates Pohnpei island's subsidence, validating GNSS and late Holocene seal-level dataEGU24-15985 | Posters on site | GM9.5
Rethinking the resilience of salt marshes to land subsidence and sea-level rise: The RESTORE project approachEGU24-17366 | ECS | Posters on site | GM9.5
Managing Land Subsidence in the Netherlands: A Process-Based Modelling Approach to Evaluate Alternative Sustainable PathwaysEGU24-18690 | ECS | Posters on site | GM9.5
Peridynamics modelling of earth fissures associated to aquifer exploitation and pre-existing normal faults with applications to Beijing, ChinaEGU24-20524 | ECS | Posters on site | GM9.5
An analysis of remote sensing land subsidence data in the NetherlandsEGU24-21064 | ECS | Orals | GM9.5
A Model for Fast Estimation of Seawater Intrusion in Coastal Aquifers: Simulating Flow and Land SubsidenceEGU24-648 | ECS | Orals | GM9.6 | Highlight
Unveiling the Multifaceted Hazard Risks of Volcanic Eruptions: The case of Kolumbo submarine volcanoEGU24-2937 | ECS | Posters on site | GM9.6
Fine-scale seafloor bedform morphology along a slope-confined submarine canyon in the Northern South China SeaEGU24-5688 | ECS | Orals | GM9.6
Turbulence intermittency effects on initiation threshold of sediment motion in natural watersEGU24-5882 | ECS | Posters on site | GM9.6
Submarine geomorphology of the Diamantina Trench (SE Indian Ocean) based on high-resolution multibeam sonar bathymetry and push core sedimentsEGU24-6154 | ECS | Posters on site | GM9.6
Submarine braided channels in response to channel confinement shapes and inflow-to-sediment discharge ratios: Insights from physical experimentsEGU24-7144 | Posters on site | GM9.6
Submerged aeolian dunes on the flat-topped Dokdo seamount in the East (Japan) Sea, KoreaEGU24-8455 | ECS | Orals | GM9.6
Seismic and core-based glacial sequence stratigraphy of an overdeepened valley fill in northern SwitzerlandEGU24-8780 | Posters on site | GM9.6
Assessing the influence of climate on Antarctic submarine gully evolutionEGU24-9993 | ECS | Posters on site | GM9.6
Understanding the paleogeographic evolution of the North Axial Channel, Southern North SeaEGU24-10335 | ECS | Posters on site | GM9.6
Exploring the Outline of the Pre-Odra River System Through Seismic Reflection Imaging Offshore Rügen IslandEGU24-10619 | ECS | Posters on site | GM9.6
Josephine Submarine Seamount: New Insights from multibeam data and seabed sampling for environmental conditions in the Early QuaternaryEGU24-10732 | ECS | Posters on site | GM9.6
Imaging the Plio-Quaternary submarine geomorphological evolution of the Gulf of CagliariEGU24-10857 | Posters on site | GM9.6
Assessing the dynamics of turbiditic terminal lobes: a geometrical approachEGU24-11305 | ECS | Posters on site | GM9.6
Plio-Quaternary geological events in the Western Mediterranean Sea: focus on the West Sardinian margin and adjacent oceanic basinEGU24-12684 | ECS | Posters on site | GM9.6
Deciphering the origin of sediment waves along the Northwest African margin through multidisciplinary analysisEGU24-16357 | ECS | Posters on site | GM9.6
Present-day current activity in an inactive canyon-channel system: the Gollum Channel System offshore southwest Ireland.
EGU24-16490 | Orals | GM9.6 | Highlight
A decade of multibeam bathymetric mapping: Implications and lessons learned from (peri-)Alpine lakes in SwitzerlandEGU24-17529 | Posters on site | GM9.6
A glimpse below the wine-dark sea: Multi-beam bathymetric survey around Despotiko and Strongylo islands (Cyclades, Greece)EGU24-22150 | ECS | Posters on site | GM9.6
Feather-like submarine channels: a unique imprint of overbank flows imaged by 3D seismic dataEGU24-22420 | Posters on site | GM9.6
Quantitative analysis of Antarctic channel distribution and the role played by continental geomorphology in channel evolutionEGU24-1975 | ECS | Posters on site | GM9.7
Comprehensive review of pockmarks and first "Susceptibility Map" of the Italian Continental MarginsEGU24-2587 | Posters on site | GM9.7
Geochemical, geophysical and biological features of Black Point shallow hydrothermal vent at Panarea island (Italy)EGU24-5051 | ECS | Orals | GM9.7 | Highlight
Systemic comparisons of the adaptations in symbiotic bathymodiolin mussels from diverse stages of hydrothermal vents and cold seepsEGU24-5523 | Orals | GM9.7 | Highlight
The unique geomorphology of submarine venting features as revealed by dropping lake levels in the Dead SeaEGU24-8298 | Orals | GM9.7 | Highlight
Fluid escape submarine geomorphological features in the NW Black SeaEGU24-8501 | Posters on site | GM9.7
EMAN7: understanding methane seepage dynamics in the Hola TroughEGU24-14435 | ECS | Posters on site | GM9.7
Investigating seabed fluid activities using historical single-beam echo sounder data in the offshore southwestern TaiwanEGU24-14838 | Posters on site | GM9.7
Geomorphology of the Montenegro slope (eastern Adriatic Sea): A tale of slump scars, corals and a chimney forestGM10 – Glacial, Periglacial, and Cold Regions Geomorphology
EGU24-5293 | Posters on site | GM10.2
Thermal characteristics of springs fed by mountain permafrost in Val di Sole (Eastern Italian Alps)EGU24-7901 | ECS | Orals | GM10.2
Quantifying thaw subsidence in a permafrost landscape (Bayelva basin, Svalbard)EGU24-8710 | ECS | Posters on site | GM10.2
Exploring the modern-day sedimentary record of glacial margins in central Chilean PatagoniaEGU24-9425 | ECS | Posters on site | GM10.2
Feasible task? The application of the Schmidt-hammer method for dating rock glaciers made of conglomerate rockEGU24-11592 | ECS | Orals | GM10.2
InSAR monitoring of solifluction and permafrost evolution in the Northeastern Tibetan PlateauEGU24-11992 | Posters on site | GM10.2 | Highlight
Geomorphological record of a former ice stream to ice shelf lateral transition zone in Northeast GreenlandEGU24-12056 | ECS | Orals | GM10.2
The lifecycle of a relict periglacial boulder landscape, southern Appalachians, USAEGU24-12138 | ECS | Posters on site | GM10.2 | Highlight
Morphological comparison of polygonal patterned ground across the Arctic and Antarctic: Implications for polygon formation on Earth and MarsEGU24-12797 | ECS | Orals | GM10.2
Future proglacial lake evolution and outburst flood hazards in south IcelandEGU24-14909 | ECS | Posters on site | GM10.2
Identifying Moraine-Dammed Glacial Lakes Using Moraine Accumulation Characteristics and Vision TransformerEGU24-16439 | ECS | Orals | GM10.2
Contrasting regional ice margin dynamics of the Scandinavian Ice Sheet revealed by the landform recordEGU24-20546 | Posters on site | GM10.2
Is the asymmetry of dolines in the Central Styrian Karst determined by periglacial processes?EGU24-1010 | ECS | Orals | GM10.4 | Highlight
A glacier-based reconstruction of the Last Glacial Maximum climate in the southern European AlpsEGU24-3491 | ECS | Posters on site | GM10.4
Quantification of landslide-induced changes in glacier dynamics – project outlineEGU24-3632 | ECS | Posters on site | GM10.4
Insights from Cirque Floor Altitudes in the Western Putorana Nature Reserve, Russian FederationEGU24-7690 | ECS | Orals | GM10.4
Glacial history of the King Haakon Trough System, sub-Antarctic South GeorgiaEGU24-10169 | ECS | Posters on site | GM10.4
Field observations of interlinked subglacial cavities in Kangerlussuaq - Greenland ice sheet western margin.EGU24-11008 | ECS | Posters on site | GM10.4
Application of a new statistically rigorous comparison tool of observed and modelled flow directions of the last British-Irish ice sheet over timeEGU24-11858 | ECS | Posters on site | GM10.4
Geomorphological Analysis of Cirques in the Western Islands of GreenlandEGU24-11985 | ECS | Posters on site | GM10.4 | Highlight
Luminescence rock surface dating of englacial transported debris from Mer de Glace glacier, French AlpsEGU24-12152 | ECS | Orals | GM10.4
Geomorphic evidence for along-margin ice flow from Melville Bugt slope, west GreenlandEGU24-13494 | ECS | Orals | GM10.4
First evidence and dating of Glacial Lake Yukon using paleomagnetic dating and cosmogenic nuclidesEGU24-13860 | Posters on site | GM10.4
Late Quaternary glacier-climate reconstruction in the Ahuriri River valley, Southern Alps of New ZealandEGU24-14426 | Orals | GM10.4 | Highlight
Reconstructing the deglacial dynamics of the northwestern Laurentide Ice SheetEGU24-15483 | Posters on site | GM10.4
The valley glacier network of the Valsugana (south-eastern Alps) during the LGM: Chronology and Equilibrium Line AltitudesEGU24-16440 | ECS | Posters on site | GM10.4 | Highlight
Deglaciation pattern of the last Scandinavian Ice Sheet across FennoscandiaEGU24-16566 | ECS | Posters on site | GM10.4
Early stage Quaternary overdeepening in Upper Swabia - GermanyEGU24-17599 | ECS | Posters on site | GM10.4
Unravelling the Patagonian Local Last Glacial Maximum and its Deglaciation History from a Modelling PerspectiveEGU24-20311 | Posters on site | GM10.4
Glacial cirque morphometry of Rila and Pirin Mountains (Bulgaria)EGU24-21174 | ECS | Posters on site | GM10.4
Reconstruction of palaeoglaciers and palaeoclimate in Zheduo Shan, Eastern Tibetan Plateau, during the Last Glacial MaximumEGU24-367 | ECS | Posters on site | GM10.5
Controls on glacial divide migration in Southern Canadian Rocky Mountain fold and thrust beltEGU24-3349 | ECS | Orals | GM10.5
Assessing rock glacier velocities on the Tibetan Plateau using satellite SAR interferometryEGU24-4107 | ECS | Posters virtual | GM10.5
Assessing the Role of Outburst Floods in the Formation of the Lower St. Croix River Valley, MN/WI, USAEGU24-5833 | ECS | Posters on site | GM10.5
Advancing understanding of Holocene rock glacier dynamicsEGU24-6056 | ECS | Posters on site | GM10.5
Morphodynamics of three active rock glaciers and its influence on spring hydrochemistry in the Swiss AlpsEGU24-7422 | ECS | Orals | GM10.5
Formation and preservation of low-relief surfaces by Pliocene-Quaternary glaciationsEGU24-7434 | ECS | Posters on site | GM10.5
Investigating post-glacial transient phases as hot-moments of landscape dynamics - combining numerical modelling and topographic analysisEGU24-7461 | ECS | Posters on site | GM10.5
How glacial landscape evolution has impacted Scandinavian Ice Sheet dynamics and dimensionsEGU24-7706 | ECS | Posters on site | GM10.5
The current and future state of mountain permafrost in the Eastern Italian Alps: the RETURN projectEGU24-9551 | ECS | Orals | GM10.5
Quantifying water and ice content variability in ice-rich permafrost using piezometer measurementsEGU24-13150 | Posters on site | GM10.5
Assessing rock glacier activity in the Austrian Alps using radar interferometry and image correlation techniquesEGU24-15821 | ECS | Posters on site | GM10.5
Towards a comprehensive rock glacier inventory in the Swiss AlpsEGU24-16141 | Posters on site | GM10.5
Rock glacier inventorying and validation across the Hindu Kush Himalaya from deep learning and high-resolution imagesEGU24-17330 | ECS | Posters on site | GM10.5
Inventory and kinematics of rock glaciers in Goikarla Rigyu, Tibetan PlateauEGU24-18492 | ECS | Orals | GM10.5
How does rock glaciers deactivate? Geomorphic and activity states of French Alpine rock glaciers in transitionEGU24-19785 | ECS | Posters on site | GM10.5
Characterizing ground ice content and origin to better understand the seasonal surface dynamics of the Gruben rock glacier (western Swiss Alps)EGU24-9989 | ECS | PICO | CR4.3
Strong regulation of permafrost coverage on runoff recession in the high-altitude permafrost basinEGU24-15002 | ECS | PICO | CR4.3
The influence of sub-seasonal to seasonal atmospheric temperature variability on alpine permafrostEGU24-15928 | ECS | PICO | CR4.3
Field study of permafrost molards from diverse origins of landslides in Matanuska Valley, AlaskaEGU24-17962 | ECS | PICO | CR4.3
The impact of thermokarst development on flow and transport processes in alpine rock glaciersEGU24-2778 | ECS | Posters on site | CR5.2
Quantifying the surging process of the Kyagar Glacier in the Karakoram using successive digital elevation models and optical satellite imagesEGU24-3498 | ECS | Orals | CR5.2 | Highlight
Reconstructed global glacier mass change since LIA strongly influenced by the sample of observed glaciersEGU24-4111 | ECS | Orals | CR5.2
Alpine-wide LIA glacier reconstruction and ELA patterns using glacier modellingEGU24-5311 | Posters on site | CR5.2
The glacier views of Jean-Antoine Linck - a milestone for the Mont Blanc glacier history from the 18th to the 19th centuryEGU24-6015 | Posters virtual | CR5.2 | Highlight
Patterns and influencing factors of glacier changes in High Mountain Asia since the Little Ice AgeEGU24-6439 | ECS | Posters on site | CR5.2
Testing the veracity of satellite-derived end-of-season snowline altitudes as a proxy for the glacier ELA.EGU24-9700 | ECS | Posters on site | CR5.2
Tapping the potential of multi-temporal thermal infrared UAV over a debris-covered glacierEGU24-9745 | Posters on site | CR5.2
Annual glacier mass balance estimation through ASTER DTMs and snowlines extracted from Landsat and Sentinel-2 imagesEGU24-10176 | ECS | Orals | CR5.2
Glacier Monitoring Using GEDI Data in Google Earth Engine: Outlier Removal and Accuracy AssessmentEGU24-10439 | Posters on site | CR5.2
The Laki Eruption – studying Weather and Climate during the Little Ice Age with Paleo-ReanalysisEGU24-11248 | ECS | Orals | CR5.2
A new inventory of High Mountain Asia surging glaciers derived from multiple elevation datasets since the 1970sEGU24-12440 | Posters on site | CR5.2
Integration of historical glacier images into the Euro-Climhist databaseEGU24-14469 | ECS | Posters virtual | CR5.2
Evolution of the covered glaciers in the Cordillera Blanca during the period 1962 - 2020EGU24-15934 | Orals | CR5.2 | Highlight
The pulse of the Pamirs: using remote sensing and in situ data to investigate accelerating glacier mass loss in the PamirsEGU24-19324 | ECS | Posters on site | CR5.2
An improved dataset of ASTER elevation time series in High Mountain Asia to study surge dynamicsGM11 – Riverine Geomorphology
EGU24-422 | Orals | GM11.1 | Highlight
Process-landform relationships at variable spatio-temporal scales in the Southern Chaco fluvial megafans (Argentina)EGU24-1364 | ECS | Orals | GM11.1
Towards a Global Assessment of Bar Push Versus Bank Pull using Remote Sensing and Cloud Computing.EGU24-2094 | ECS | Orals | GM11.1
Near-bed flow directions under varying ice cover of a meander bend in 2016–2024EGU24-2103 | ECS | Orals | GM11.1
Bimodality in river bed state suggests critical transitions at high flowEGU24-2690 | ECS | Orals | GM11.1
Mechanisms controlling storage capacity dynamics in China’s largest freshwater lakeEGU24-3955 | ECS | Posters on site | GM11.1
Spatial Variability in Meander Characteristics Within Modern Distributive Fluvial Systems (DFS)EGU24-4459 | ECS | Orals | GM11.1
Climate change and anthropogenic stresses on the sediment load variation in the Western Ghat RiversEGU24-7038 | ECS | Posters on site | GM11.1
Effect of bedload sheets beyond hydrograph boundary layer on alternate bar morphologyEGU24-7517 | ECS | Orals | GM11.1
Distributions of river bank erosion in cold-climate regions identified using novel real-time sensorsEGU24-8192 | ECS | Posters on site | GM11.1
Probabilistic Modeling of Sediment Dynamics in Braided River SystemsEGU24-11871 | Posters on site | GM11.1
Channel mobility-driven hydrological connectivity controls water surface area variations in oxbow lakesEGU24-12442 | ECS | Orals | GM11.1
Numerical Exploration of the Morphodynamic Regime Diagram for Straight Channel River FlowsEGU24-15667 | ECS | Posters on site | GM11.1
Modeling spatio-temporal variation of longitudinal connectivity and its relation to meander evolutionEGU24-16227 | Posters on site | GM11.1
Utilization of high-resolution data in hydrological modelling for future studies of Tana RiverEGU24-18107 | Orals | GM11.1
Linking energy efficiency of surface runoff, logistic growth and landform changesEGU24-18108 | Orals | GM11.1
A physically-based estimation of the length parameter in river bifurcation modelsEGU24-19752 | ECS | Orals | GM11.1
Velocity field in a groin field: implications for sediment and nutrients transportEGU24-19826 | Orals | GM11.1
Investigating Hydrological Connectivity inthe Yamuna River System, IndiaEGU24-20340 | ECS | Posters on site | GM11.1
Riverbed morphology and flow resistance: integrating UAV-based 3D mapping and flow modelingEGU24-21442 | ECS | Orals | GM11.1
Rock type as a driver of drainage network reorganizations in the Amazon regionEGU24-37 | ECS | Posters virtual | GM11.2
Using a scaled model to assess the performance of different sediment augmentation strategies in a restored channelEGU24-1296 | ECS | Posters on site | GM11.2
Water Level Lowering and Increased Tidal Influence in the Mekong Delta driven by Human-Induced Riverbed IncisionEGU24-4413 | ECS | Posters on site | GM11.2
Calibration of a diffusion model for aggrading channel after sediment overloading experiments with near-critical flowEGU24-6363 | ECS | Posters on site | GM11.2
Geomorphological analysis of the Serio River aimed at its sustainable managementEGU24-9362 | ECS | Posters on site | GM11.2
The trend of gravel bars' degradation in the last two decades is perceived positively by societyEGU24-9610 | ECS | Posters on site | GM11.2
Analyzing anthropogenic impact on river morphodynamics in the Upper Orcia Valley (central italy) through multitemporal NDVI assessmentEGU24-10238 | Posters on site | GM11.2
Assessing the relative importance of hydrological and geomorphological controls on river flood conveyance at a global scaleEGU24-10726 | ECS | Orals | GM11.2
Coarse deposits on river terraces: Evidence of suspended transport of gravels during high-magnitude floodsEGU24-10883 | ECS | Posters on site | GM11.2
Investigating river-restoration-effects on riverbed-stability by physical modellingEGU24-17425 | ECS | Posters on site | GM11.2
Propagation of hydro-geomorphic disturbances through continental-scale river basinsEGU24-17477 | ECS | Posters on site | GM11.2
Lagrangian description for the drift of large floating debris in rivers during floodsEGU24-19149 | ECS | Posters virtual | GM11.2
Assessment and Prediction of River Bank Shifting Using Automated GIS and Remote Sensing Approaches: A Case Study of the Jamuna River in Bangladesh.EGU24-19762 | Posters on site | GM11.2
How does bed load transport influence the longitudinal profile of reservoir sedimentation?EGU24-20827 | Posters on site | GM11.2
Modelling channel geomorphic change from landslide sediment delivery during Typhoon Mangkhut in the PhilippinesEGU24-1225 | ECS | Posters on site | HS2.2.9
A Long-term Spatial Runoff and Flood Prediction Method in Higher AccuracyEGU24-1606 | ECS | Posters on site | HS2.2.9
Integrated Approach to Mekong River Flow Modeling: Data Gaps and Climate TrendsEGU24-4402 | ECS | Posters on site | HS2.2.9
A comprehensive method based on machine learning schemes in predicting river flow, case study: Po RiverEGU24-4407 | ECS | Posters on site | HS2.2.9
Daily Streamflow Simulations Improvement in Data Scarce Watersheds using different Optimization Techniques and Calibration MethodsEGU24-5805 | ECS | Posters on site | HS2.2.9
IRIS: Global Reach-Scale River Surface Slopes from the ICESat-2 SatelliteEGU24-6865 | ECS | Orals | HS2.2.9
Monitoring river morphology with Sentinel 2 data: limitations and opportunities across scalesEGU24-9754 | Posters on site | HS2.2.9
An ADCP large-scale international intercomparaison: Sault-Brénaz 2023EGU24-11189 | ECS | Posters on site | HS2.2.9
A Contactless Rapid Rating Curve Assessment Based On Drone-borne MeasurementEGU24-12507 | Posters on site | HS2.2.9
Towards a comprehensive optical workflow for monitoring and estimation of water levels and discharge in watercoursesEGU24-15519 | ECS | Posters on site | HS2.2.9
Exploring the relative scale of uncertainty in high-resolution soil moisture remote sensing products towards model integrationEGU24-16356 | Posters on site | HS2.2.9
Sharing perceptual models of uncertainty – on the use of soft information about discharge data uncertaintyEGU24-16913 | ECS | Posters on site | HS2.2.9
Characterizing the space-time evolution of wet channels in a non-perennial Mediterranean catchment exploiting a network of camera trapsEGU24-16956 | ECS | Orals | HS2.2.9 | Highlight
Improving the resolution of satellite precipitation products in EuropeEGU24-17533 | Posters on site | HS2.2.9
A Round Robin Exercise for an intercomparison of Snow Cover Area maps retrieved from Earth ObservationEGU24-19308 | Posters on site | HS2.2.9
Evaluation of remote sensing actual evapotranspiration products for hydrological modeling applicationsEGU24-19935 | Orals | HS2.2.9
An evaluation of low-cost terrestrial LiDAR sensors for assessing geomorphic changeEGU24-22332 | Orals | HS2.2.9
Monitoring of infrastructure at risk of scour and other hydraulic actionsEGU24-824 | ECS | Posters on site | HS9.6
Critical Submergence for Lateral Rectangular Intakes: A CFD StudyEGU24-840 | ECS | Orals | HS9.6
Effect of bedload shape on the signal characteristics of a hybrid impact plateEGU24-986 | ECS | Posters on site | HS9.6
Analyzing Grain Size Distribution and Depositional Traits at the Ganga River Bend near Varanasi, IndiaEGU24-1066 | ECS | Orals | HS9.6
Seepage Induced Morphodynamics of Alluvial Channels: Unraveling Dune Dynamics and Flow CharacteristicsEGU24-2084 | ECS | Orals | HS9.6
Determination of spatial-temporal distribution of bedload transport areas in physical modelEGU24-2123 | ECS | Posters virtual | HS9.6
A novel modeling approaches to understand the fate and transport of microplastics in aquatic environment
EGU24-2704 | Posters virtual | HS9.6
Optimizing Spur Dike Orientation for Scour Control in Downward Seepage ScenariosEGU24-2769 | ECS | Posters virtual | HS9.6
Exploring the Mechanisms and Vegetative Influence on River Bank Migration in Sinuous ChannelsEGU24-4253 | ECS | Orals | HS9.6 | Highlight
Navigating reservoir sedimentation through hydro-suctionEGU24-4601 | Posters on site | HS9.6 | Highlight
Integration of Automated River Fow Discharge and Sediment Observation Systems and ApplicationsEGU24-5276 | ECS | Posters on site | HS9.6
Numerical simulations of sediment yield and terrain changes by water erosion using a processed-based modelEGU24-9321 | ECS | Orals | HS9.6
Quantifying seasonal bedload transport rates in a sub-arctic river using image velocimetry methodsEGU24-9542 | ECS | Posters on site | HS9.6
Slender Wood Jamming at bridge piers: Finite-infinite retention time regimesEGU24-9582 | Posters on site | HS9.6
Monitoring of selected hydro-morphological elements on natural rivers in Slovakia depending on river scaleEGU24-10368 | ECS | Orals | HS9.6
Evaluating Vegetation-Influenced Roughness Estimation Methods to Improve Hydrological ModellingEGU24-10441 | ECS | Orals | HS9.6
Impact of Halting Dam Operations on Downstream Flow: A Modern Modelling ApproachEGU24-10751 | ECS | Posters on site | HS9.6
Assessment of different vegetation friction approaches in numerical hydrodynamic modelingEGU24-13827 | ECS | Posters on site | HS9.6
From River to Reservoir: Exploring Phytoplankton Dynamics and Its Environmental Correlates in the Xiangjiaba Channel-Type ReservoirEGU24-14936 | Posters on site | HS9.6
LSPIV analysis of large wood effect on the direction and velocity of surface flow in meandering river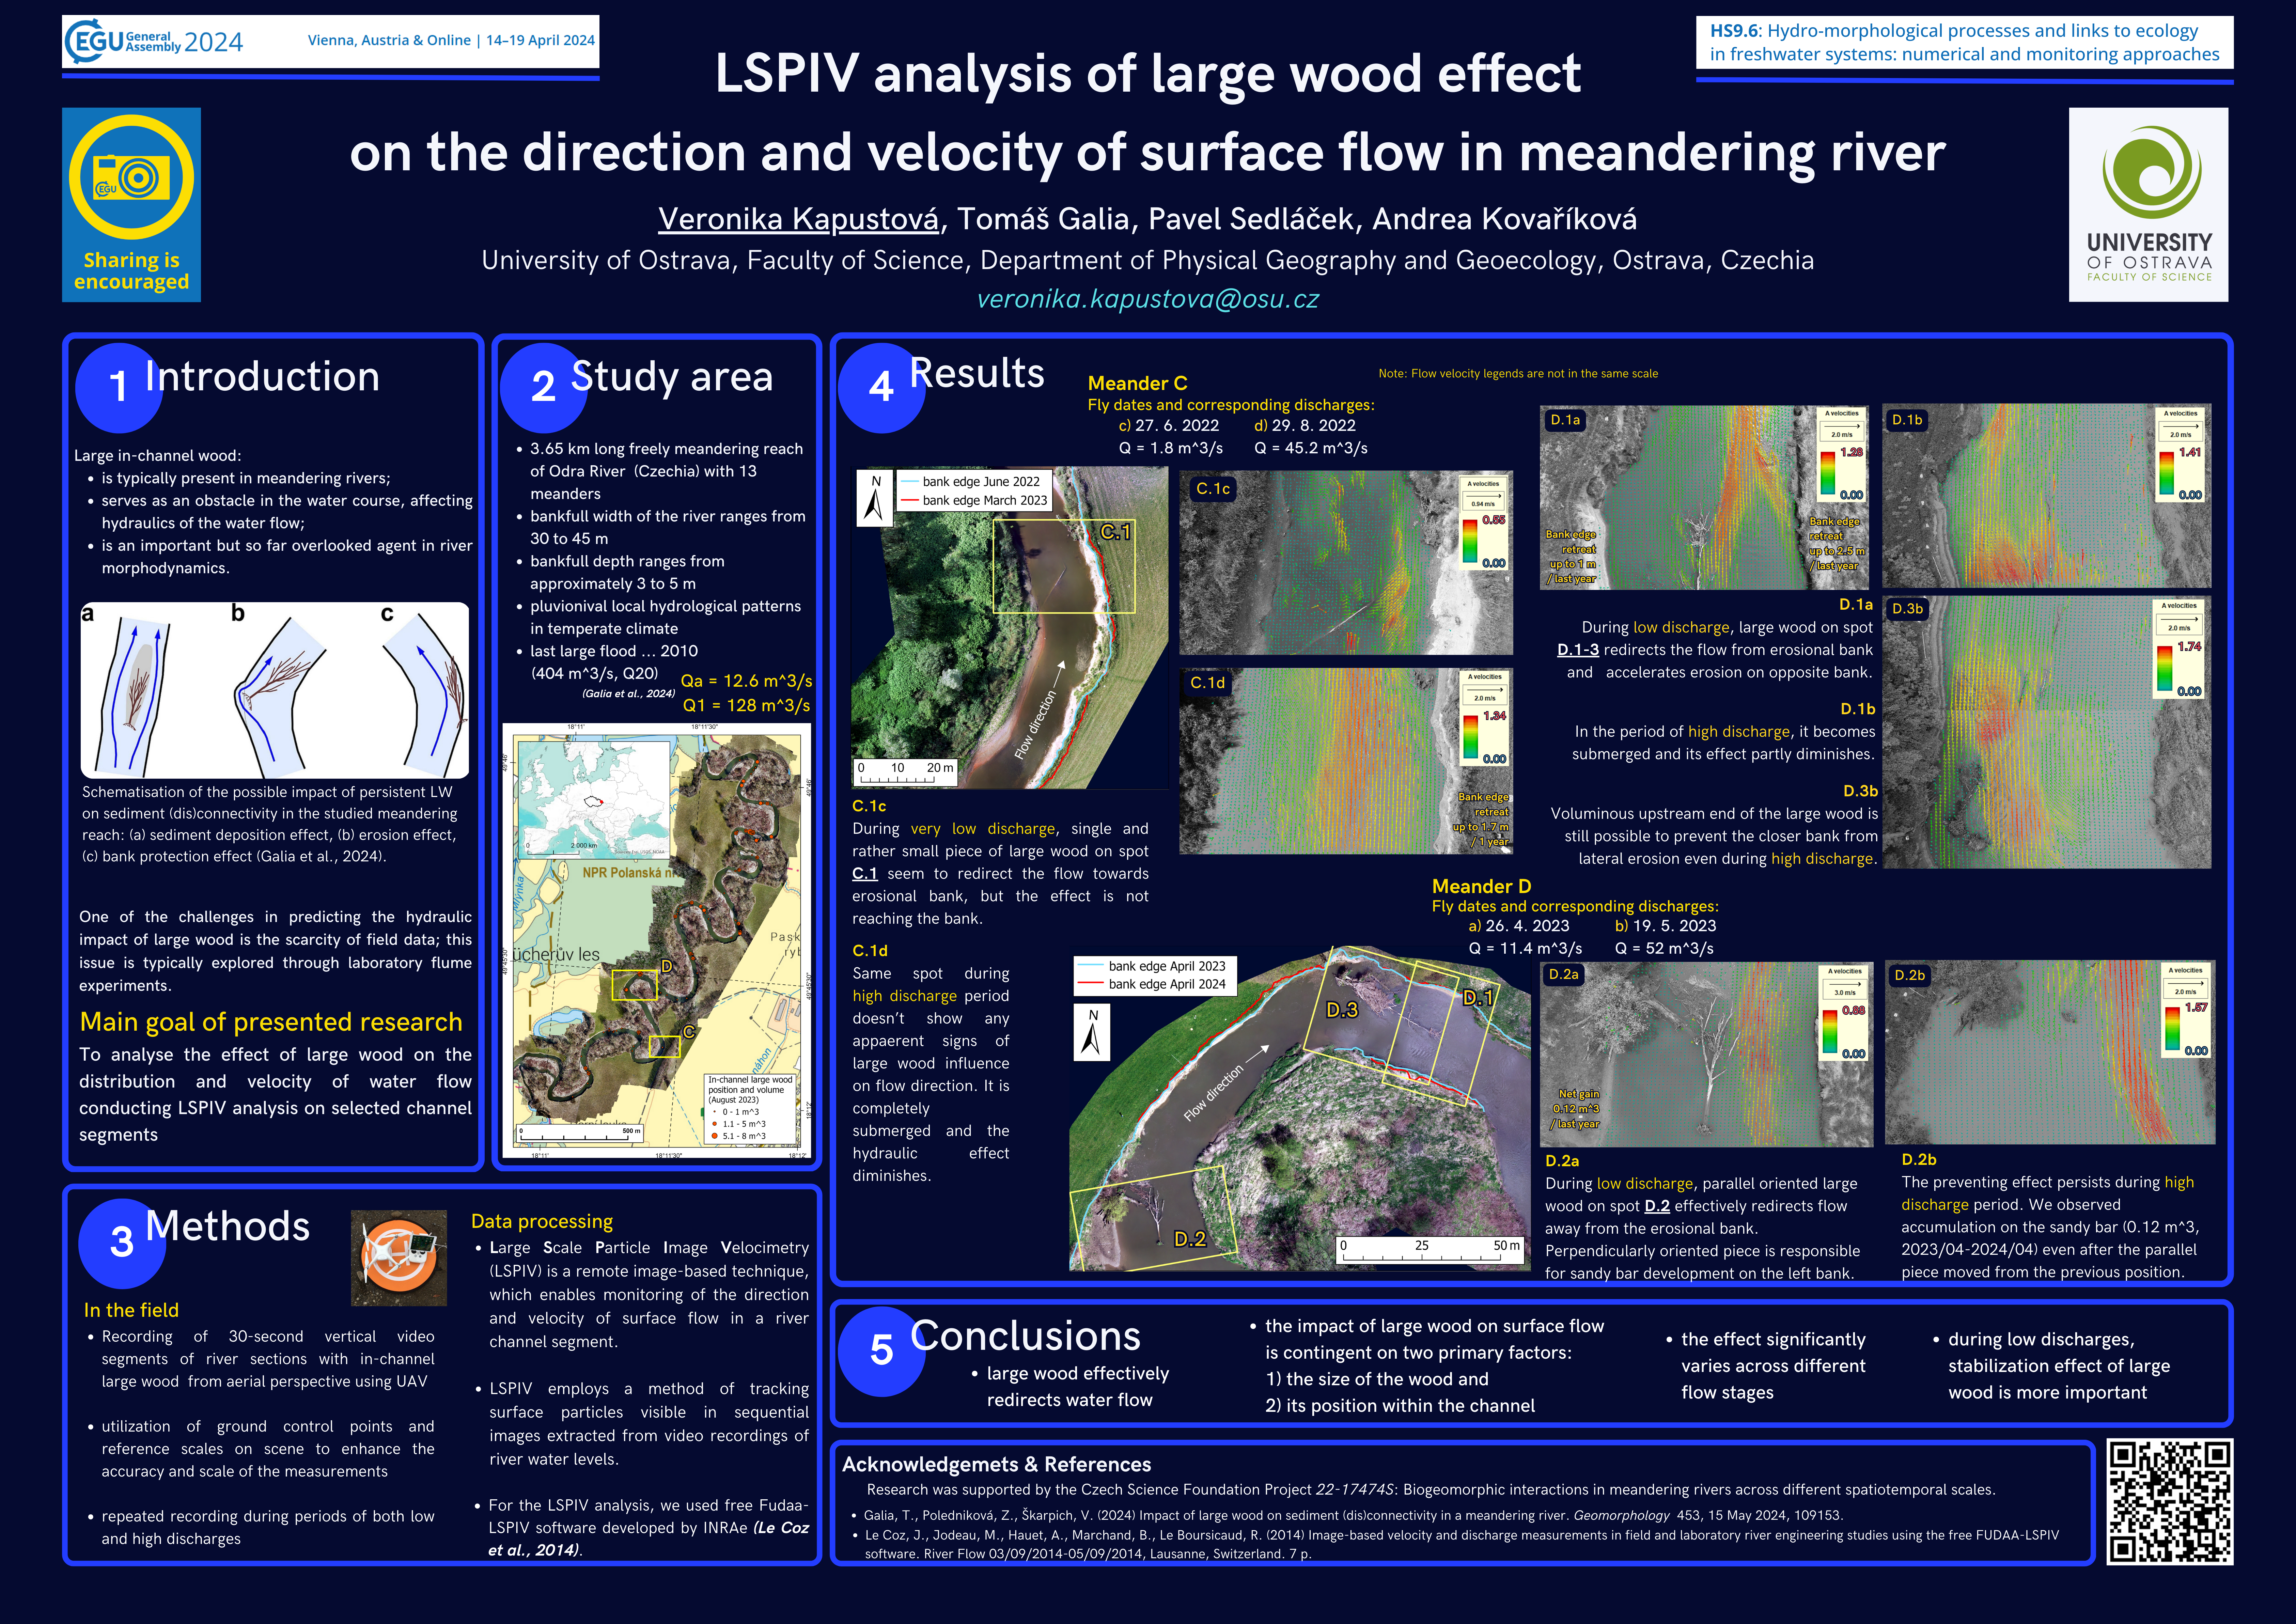
EGU24-15025 | ECS | Posters on site | HS9.6
Comparative analysis of effectiveness of I Head, L Head and T Head GroyneEGU24-16337 | ECS | Posters on site | HS9.6
An experimental set-up for the spatio-temporal quantification of fine particle infiltration in porous beds
EGU24-16582 | ECS | Posters on site | HS9.6
Suspended sediment transport in a river network: testing signal propagation and modelling approachesEGU24-17002 | ECS | Orals | HS9.6
Analyzing Large-Scale Sediment Connectivity in a Central Asian Catchment Using Geospatial DatasetsEGU24-17212 | ECS | Orals | HS9.6
Assessment of the Accuracy of Numerical Morphological Models based on Reduced Saint-Venant EquationsEGU24-17368 | ECS | Posters on site | HS9.6
Developing an Impulse-Based Intermittent Particle Entrainment Mechanism in Turbulent Flows Using a Multivariate Random ProcessEGU24-18138 | ECS | Posters virtual | HS9.6
Effects of Width Ratio and Offtake Angle on the Morphological Characteristics of an Offtake ChannelEGU24-18252 | ECS | Orals | HS9.6 | Highlight
A robust, user-friendly tool for accurate fluvial grain-size/substrate class estimationEGU24-19028 | ECS | Posters on site | HS9.6 | Highlight
Hydro-ecologically based operation of run-of-river reservoirs for effective sediment management and energy productionEGU24-19462 | ECS | Orals | HS9.6 | Highlight
Optimization of direct bedload measurements using ADCP Bottom TrackingGM12 – Education and Outreach in Geomorphology
EGU24-2760 | ECS | Orals | EOS1.1 | Katia and Maurice Krafft Award Lecture
Reclaiming the rocks: ukuthetha ngezifundo zomhlaba ngesiXhosaEGU24-3201 | Posters on site | EOS1.1
Sharing outreach and educational materials through YouTube: a case study from the Shear Zone ChannelEGU24-3519 | ECS | Orals | EOS1.1 | Highlight
Filipino youth-led place-based geoducation through knowledge sharing between young professionals and residents : the Nomad Projects OpenEdu workshopsEGU24-6322 | Orals | EOS1.1 | Highlight
Science communication and the law: Lessons learned from being an expert witnessEGU24-6332 | Posters on site | EOS1.1
#ClimateResearchNet - a collaboration of climate communicatorsEGU24-7951 | ECS | Posters on site | EOS1.1
"Quake Shake" - A New Citizen Earthquake Outreach Programme In Ireland.EGU24-9830 | Posters on site | EOS1.1
Engaging with Local Spaces: Student-created digital field tours to facilitate community learningEGU24-11941 | ECS | Orals | EOS1.1
Communicating the KNMI’23 Climate Scenarios for the Dutch CaribbeanEGU24-11952 | ECS | Orals | EOS1.1
Connecting worlds: Mutual benefits of teacher–researcher interaction.EGU24-12836 | Posters on site | EOS1.1
Enriching the inclusivity of geophysical data communication using tactile resourcesEGU24-13276 | Posters on site | EOS1.1
Raising Sand's Value Awareness: Science and Communication Initiatives.EGU24-14964 | ECS | Posters virtual | EOS1.1
Strengthening the Bridge between Singapore and Norway: How Education Exchanges and Public Outreach are Applied in Climate ScienceEGU24-15324 | ECS | Orals | EOS1.1
Youth education and empowerment through outdoor experiential learning and peer-to-peer communicationEGU24-17240 | Posters on site | EOS1.1
From research to outreach – an example from the Smøla island, Mid-NorwayEGU24-19052 | ECS | Orals | EOS1.1
uniWeather™: Advancing real-time outreach in urban environmental sciences through app and platformEGU24-19582 | Posters on site | EOS1.1
Interactive visualisation system for compound weather and climate extremes in Hungary based on station data seriesEGU24-20046 | Posters on site | EOS1.1
An exercise in the Civil Protection Operations Room to explain to high school students how an earthquake emergency is handledEGU24-21986 | Orals | EOS1.1 | Angela Croome Award Lecture
Existential Threat: How Scientists Can Work With The Media To Communicate Complex Systemic CrisesEGU24-1344 | Orals | EOS4.4
Freedom and Responsibility: the Ethics of Academic Researchers’ Public Advocacy
EGU24-2607 | Posters on site | EOS4.4
Geoethics literacy: Clarifying values, principles and behaviourEGU24-3568 | Posters on site | EOS4.4
Exploring the horizon of geosciences through the lens of geoethicsEGU24-3586 | Posters on site | EOS4.4
An infrastructure for researching on geoethics and facilitating its international promotionEGU24-6573 | ECS | Orals | EOS4.4
Proposal for a Geoethics Code for the Geoscientist Community of Chile
EGU24-6593 | ECS | Posters on site | EOS4.4
Invitation to a research project on geography and climate educationEGU24-6662 | ECS | Posters on site | EOS4.4
Examining Race and Class Disparities in Urban Heat in Australia and New Zealand: Towards Environmental Justice in Urban PlanningEGU24-7655 | Orals | EOS4.4
Delivering Critical Raw Materials: Ecological, Ethical and Societal IssuesEGU24-14027 | ECS | Orals | EOS4.4
Do religions matter? The empirical study of the religion-climate relation in TaiwanEGU24-16730 | ECS | Orals | EOS4.4
Climate Change, Ocean Health and Quality of Life - An Inextricable Connection in Large Ocean Island StatesEGU24-17346 | Posters on site | EOS4.4
The importance of making geoethics a central concern of Sri Lankan education strategyEGU24-20953 | Posters on site | EOS4.4
Shaping Thriving Ocean Futures – Education to advance healthy coastal communities and marine systemsEGU24-21221 | Orals | EOS4.4
Mapping water from our tap to the watershed: A first step toward ecological limitsEGU24-5473 | Posters on site | EOS1.3
Memory of the Sea: an art-science collaboration across generations in two Arab villages in IsraelEGU24-7920 | ECS | Posters on site | EOS1.3
Noise Variations: A Journey in Search of the Whispers of GlaciersEGU24-8045 | Orals | EOS1.3
Wildfires, floods, droughts, and the climate crisis: can art narrate the risk?EGU24-8550 | Posters on site | EOS1.3
Musical messages – Creating a Bespoke Climate Story for the Outer HebridesEGU24-10516 | ECS | Orals | EOS1.3
‘Almost Surely’ – Exploring the potential of (video) art to communicate probabilities and climate riskEGU24-11416 | ECS | Orals | EOS1.3
Linking geology and art: observations to interpretations of the Sanetsch Fold, Helvetic AlpsEGU24-13963 | ECS | Orals | EOS1.3
The Virtual Water Gallery: Measuring attitude changes towards climate and water through artEGU24-16510 | ECS | Posters on site | EOS1.3
Promoting science through art via cartoons and fiber artEGU24-17685 | Posters on site | EOS1.3
A tale of a meteorite who was too magnetic - using comics to simplify complex ideasEGU24-19426 | ECS | Orals | EOS1.3 | Highlight
Exploring the capacity of climate art to communicate climate change from a cultural perspectiveEGU24-20608 | Posters on site | EOS1.3 | Highlight
Perspectives Through the Eyes of Primary School Students: A Visual JourneyEGU24-20694 | Orals | EOS1.3
The role of the arts in a community-based participatory research projectEGU24-534 | ECS | Orals | EOS1.5 | Highlight
Unreal field trips? Gamification as key for unlocking the potential of virtual geological fields trips.EGU24-1593 | ECS | Posters on site | EOS1.5 | Highlight
Game-based learning: addressing curriculum gaps in water management education in Ugandan schools

EGU24-1742 | ECS | Posters on site | EOS1.5
The science literacy board game: a new tool for improving science literacy with informal youth education (SCIBORG)EGU24-1785 | ECS | Posters on site | EOS1.5
Level Up Learning: A User-Friendly Game Engine Template for Virtual Reality Landslide ExperiencesEGU24-2087 | Orals | EOS1.5
"Submersion": A board game for coastal risk exploration and adaptation planningEGU24-2605 | Posters on site | EOS1.5
How to debrief geo-simulation/games: Some ideas and actions to make your debriefing more effectiveEGU24-4047 | ECS | Posters on site | EOS1.5
Exploring Risk Perception through a game of Downward CounterfactualsEGU24-5877 | Orals | EOS1.5 | Highlight
From a white paper to an adventure gamebook: engaging practitioners in climate change impact studies on hydrologyEGU24-6418 | ECS | Posters virtual | EOS1.5
Serious Games for Climate Action: Designing Analog Engagement Tools for Citizen ParticipationEGU24-8162 | Orals | EOS1.5 | Highlight
Daybreak: Communicating the climate crisis with a board gameEGU24-9597 | Orals | EOS1.5 | Highlight
Interactive instant urban climate modelling with AI and LEGO-citiesEGU24-11214 | Posters on site | EOS1.5
Remote Sensing: a stellar occultation video game based on ALTIUSEGU24-12424 | Posters on site | EOS1.5
Climate Tick-Tock: sparking climate action through a cooperative and educational game on climate change in the 21st centuryEGU24-14061 | Posters on site | EOS1.5 | Highlight
Hydro-E-scape: A digital adventure in Hydrology for learning and assessmentEGU24-16700 | ECS | Orals | EOS1.5
Stygos - A Board Game Depicting the Challenging Life of Underground OrganismsEGU24-17108 | Posters on site | EOS1.5
WellPlaced: Cooperatively navigating challenges to land and water management to reach SDG6EGU24-21654 | Posters on site | EOS1.5
THE WORK OF LANDSCAPE URBANISM: Using digitally enriched board games to engage communities in UK planningEGU24-1854 | ECS | Posters on site | EOS1.7
Communicating seismic risk: experiences from launching the Swiss and the European seismic risk modelsEGU24-1894 | ECS | Posters on site | EOS1.7
From model development to co-designing user-centered earthquake forecastsEGU24-8051 | ECS | Orals | EOS1.7
Improving flood risk evaluation and communication by mapping the loss probability of pedestriansEGU24-12557 | Posters on site | EOS1.7
Collaboration at the science-policy interface for effective earthquake risk communication in New ZealandEGU24-17037 | Orals | EOS1.7
How do coastal experts communicate science? Insights from an international surveyEGU24-17942 | Posters on site | EOS1.7
A contribution towards the understanding of the “bradyseism” phenomenon at the Campi Flegrei volcanic area (Southern Italy)EGU24-18191 | Posters virtual | EOS1.7 | Highlight
Technological and conceptual tools for risk communication during the different phases of disaster risk management of natural and human-made hazardsEGU24-19048 | Orals | EOS1.7 | Highlight
Exploring creative play to enhance multi-stakeholder climate and disaster risk communication and knowledge co-productionEGU24-19082 | ECS | Orals | EOS1.7 | Highlight
Informing adaptation: how do UK organisations view and use climate information?EGU24-20521 | ECS | Orals | EOS1.7
Cascade effects of Greece using historical data of natural hazards: An operational tool in educationEGU24-21551 | Orals | EOS1.7
Two decades of seismic risk communication in Europe: where did we head to?EGU24-1575 | Orals | EOS1.8 | Highlight
Resources to give facts a fighting chance against misinformation
EGU24-2157 | Orals | EOS1.8
Unseen heat, a story about the potential heat extremes in the NetherlandsEGU24-3116 | Orals | EOS1.8 | Highlight
Design as a participatory foundation for impactful climate communicationsEGU24-3182 | ECS | Orals | EOS1.8
AI-Enhanced Academic Entrepreneurship in K-12 Climate Education in ChinaEGU24-3634 | ECS | Posters on site | EOS1.8
Homeopathy in Greece: A critical evaluation of institutional support versus scientific evidenceEGU24-8129 | Orals | EOS1.8 | Highlight
Bridging disciplines, shaping futures: the power of networking for climate change communicationEGU24-8799 | ECS | Orals | EOS1.8
Surfing the Climate Wave: Laura and Joan's Expedition in the DeltaEGU24-12511 | Orals | EOS1.8
Justice and urban transformation in light of accelerating climate changeEGU24-15618 | ECS | Orals | EOS1.8
Misinformation in scientific news in Bulgarian for future inoculationEGU24-17203 | ECS | Orals | EOS1.8 | Highlight
A Digital Academy against Climate Change Disinformation featuring trustworthy and fact-checked information and resources on climate change and media literacy.EGU24-17910 | Orals | EOS1.8 | Highlight
We Are the Possible: New Narratives Connecting Science, Health, Education and the ArtsEGU24-18318 | Posters on site | EOS1.8
A co-production methodology for high-quality climate services: An example from the health sector.EGU24-20900 | Orals | EOS1.8 | Highlight
Climate Narratives: Empowering Voices for a Sustainable Future.EGU24-3761 | ECS | Posters on site | EOS2.1
Organising an international summer school from scratch, towards establishing the traditionally held one – HydRoData Summer SchoolEGU24-3835 | Orals | EOS2.1
Master your master thesis – overcome writer’s block and handle feedback like a proEGU24-4738 | ECS | Orals | EOS2.1
The development and impact of VR fieldtrips on Geoscience CurriculaEGU24-8230 | Orals | EOS2.1
Visible Geology: a revolutionary shift in earth-related science education is here.EGU24-8346 | Posters on site | EOS2.1
Geological activities at Galilei Science Department (Liceo Scientifico Statale "Galileo Galilei" - Potenza, Italy)EGU24-10192 | Posters on site | EOS2.1
International summer school in Azerbaijan: advanced field studies on mud volcanism and fluid migration systemsEGU24-11410 | ECS | Posters on site | EOS2.1
Case Study How to Teach Elements of Meteorology from Kindergarten to School-Living Examination via Harmonised CurriculumEGU24-11429 | ECS | Orals | EOS2.1 | Highlight
How to deal with water conflicts? The use of role play at engineering schools for fronting real situationsEGU24-12930 | Orals | EOS2.1 | Highlight
Interactive Wellbeing Maps: Experiences from a compulsory undergraduate GIS assessmentEGU24-13146 | Posters on site | EOS2.1
EDUCOAST Summer Course: a Real-World Immersive Educational Experience.EGU24-13622 | Orals | EOS2.1
Heliophysics Applications on Education and Research using Cloud ComputingEGU24-16464 | Posters on site | EOS2.1
CloudEARTHi Initiative – Reshaping Education for a Resilient Future Amidst Societal ChallengesEGU24-16918 | ECS | Orals | EOS2.1
ChatGPT in Geoscience Education: Revolutionizing Learning or Ethical Minefield?EGU24-18160 | Posters virtual | EOS2.1
Reflecting on the use of Generative AI in Higher Education Teaching & LearningEGU24-19409 | Orals | EOS2.1
Multidisciplinary laboratories to enhance engineering teaching in higher educationEGU24-19920 | Posters on site | EOS2.1
Going back to the Roots: The Challenge of Teaching Mathematics in Atmospheric SciencesEGU24-20024 | ECS | Orals | EOS2.1
Developing and teaching a postgraduate module to research students: lessons from the COVID-19 pandemicEGU24-20099 | ECS | Posters on site | EOS2.1
Skills gap analysis in the space sector: Bridging the gap between curricula and job requirements for the future space workforce.EGU24-20452 | Orals | EOS2.1
Actions to address the recruitment crisis into Geoscience related degrees in the UK
EGU24-337 | ECS | Posters on site | EOS2.4
Exploring the Depths: 3D Modeling of Ukraine's Caves through Terrestrial Laser Scanning and Digital PhotogrammetryEGU24-1090 | ECS | Posters on site | EOS2.4
Coming in from the cold: addressing the challenges experienced by women conducting remote polar fieldwork
EGU24-4152 | Posters on site | EOS2.4
Learning from the past to shape the future: Environmental change, health and ecosystem services of Lake MalawiEGU24-4239 | ECS | Posters on site | EOS2.4
Visualization of DDE-Outcrop 3D to Promote Public Education in Natural History MuseumsEGU24-5166 | Posters on site | EOS2.4 | Highlight
Advancing Chinese Landscape Painting Research with DDE-Outcrop 3D TechnologyEGU24-5636 | ECS | Posters on site | EOS2.4
Exploration and Application of High-Precision Inclined Photography Technology in Digital Collection of Geological OutcropsEGU24-13374 | Posters virtual | EOS2.4
Live From the Metaverse! An Introduction to Geological Mapping in Immersive Virtual RealityEGU24-15319 | ECS | Posters on site | EOS2.4 | Highlight
Swiss Alps 3D: building a large-scale 3D underground model of the Central European AlpsEGU24-16189 | ECS | Posters on site | EOS2.4
From theory to real-world geomatics applications: glacier monitoring fieldworks through an innovative teaching programEGU24-16411 | Posters virtual | EOS2.4
Svalbard Integrated Arctic Earth Observing System: Tools to help you do fieldwork in SvalbardEGU24-17802 | ECS | Orals | EOS2.4
ADVANCEing FieldSafety: A new course and toolkit for diverse and inclusive geoscience teamsEGU24-18133 | Posters virtual | EOS2.4
Can Virtual Field Trips be used to prepare students for real fieldwork?EGU24-22115 | Orals | EOS2.4 | Highlight
Gear Hack for women: Polar Gear Revisited for Female FriendlyField OperationsEGU24-3636 | Posters virtual | EOS2.7
Sensors and citizen sciences : What contributions for environmental sciences? The OZCAR Community's case
EGU24-6147 | ECS | Posters on site | EOS2.7
Engaging a highly-qualified crowd in an information system for natural hazards in mountain areasEGU24-7613 | ECS | Posters on site | EOS2.7
Into the Deep - Marine Image Analysis Hub for Citizen ScientistsEGU24-11489 | Posters on site | EOS2.7
Develop A Citizen Science Toolbox for Change in the Danube Basin EcosystemEGU24-15061 | ECS | Posters on site | EOS2.7
Participatory science at school: The Black Carbon educational experimentEGU24-16755 | ECS | Posters on site | EOS2.7
Citizen Science Programs as Scientific Data Collection Approach of Soil MediumEGU24-20692 | ECS | Posters on site | EOS2.7
CS4Rivers: a transdisciplinary approach for monitoring freshwater habitats and their biodiversity.
EGU24-1620 | Posters on site | EOS3.1
Equality of opportunities in EGU recognitions: The EGU Awards Committee experienceEGU24-9435 | ECS | Orals | EOS3.1 | Highlight
Navigating parenthood as an early career scientist: insights and challenges from hydrological sciencesEGU24-10508 | ECS | Posters on site | EOS3.1 | Highlight
An Evaluation of the ADVANCEGeo Partnership Bystander Intervention ModelEGU24-11929 | ECS | Orals | EOS3.1 | Highlight
Promoting and Supporting Equity, Diversity, Inclusion, and Accessibility: A Collaborative Approach in the Hydrogeological Community and BeyondEGU24-12182 | ECS | Orals | EOS3.1 | Highlight
Is my teaching gender-fair? A self-assessment questionnaire.EGU24-14684 | Posters on site | EOS3.1
Nakkihomma: attitudes towards and distributions of academic household workEGU24-16168 | Posters on site | EOS3.1
Inclusive excellence at the ERC: latest actions and results of sustained measuresEGU24-17197 | ECS | Orals | EOS3.1
Science Sisters: Interviews with diverse role models on career paths and academic lifeEGU24-18544 | ECS | Orals | EOS3.1
Time’s up, bottom-up! A successful bottom-up approach for diversity and inclusions at Utrecht UniversityEGU24-20027 | Orals | EOS3.1
Planning virtual and hybrid events: steps to improve inclusion and accessibilityEGU24-20337 | Posters on site | EOS3.1
The stagnation of low percentage of female scientists in Japan and JpGU's initiativesEGU24-22185 | Posters on site | EOS3.1
Signatures of Equality, Diversity and Inclusivity at EGU General AssembliesEGU24-36 | ECS | PICO | EOS4.1
Embedded research into collaborative multi-scale water resources planning in England and WalesEGU24-6524 | PICO | EOS4.1
Connecting geothermal energy research and policy – an example from IrelandEGU24-10786 | PICO | EOS4.1 | Highlight
Bridging the gap between scientists and policymakers: the experience of the H2020 CORE projectEGU24-11604 | PICO | EOS4.1 | Highlight
From frontier research to biodiversity conservation and restoration policiesEGU24-14177 | ECS | PICO | EOS4.1
How can bureaucrats help change light bulbs? Evaluation of pro-poor energy initiatives in TaiwanEGU24-19035 | ECS | PICO | EOS4.1 | Highlight
Reflecting on the role of science advice in theclimate crisis: The importance ofscience-society-policy interfaces
EGU24-20315 | PICO | EOS4.1
The Parliamentary Evening – a successful instrument of the Science-Policy DialogueEGU24-8098 | Posters on site | EOS4.5
From carbon footprint to transition plan in a French geosciences laboratoryEGU24-9536 | ECS | Orals | EOS4.5 | Highlight
Going Beyond Research: A Large-scale Investigation of Climate Change Engagement by ScientistsEGU24-9910 | Posters on site | EOS4.5
An example of reflexive and ethical work on a geoscientific speculation bubble: the case of natural hydrogenEGU24-11035 | Orals | EOS4.5
ClimarisQ: A game on the complexity of the climate systems and the extreme events
EGU24-11091 | Posters on site | EOS4.5 | Highlight
Climate Horizons: a graphic novel of key IPCC findings to reach a wider audienceEGU24-11767 | Posters on site | EOS4.5
“Slow science” concept: first insights of perceptions and suggestions in an oceanography laboratoryEGU24-15634 | Orals | EOS4.5 | Highlight
Conference of the Parties or Conference of the People? Introducing a series of alternative grassroots COPsEGU24-16862 | Orals | EOS4.5 | Highlight
Exploring key issues in public engagement and activism. Findings of a working group at the University of Lausanne.EGU24-18757 | ECS | Posters on site | EOS4.5
Building transdisciplinary solutions at the first ever Climate Security FestivalEGU24-19128 | Posters on site | EOS4.5
IPSL climactions and the bottom-up ecological transformation of a climate research institute (2016-2024)EGU24-19470 | Posters on site | EOS4.5 | Highlight
Scientific debunking of institutional and corporate communicationEGU24-19960 | ECS | Orals | EOS4.5
Climate activism as a form of science communication and public engagementEGU24-20093 | Posters on site | EOS4.5
Beyond Traditional Science Advocacy: Should Scientists engage in Climate Action?EGU24-20180 | ECS | Orals | EOS4.5 | Highlight
Mapping Fossil Ties: Decentralised research into ties between universities and the fossil fuel industryEGU24-6386 | Orals | EOS4.7
Challenges to implement an open, free, participative gravity-modelling initiativeEGU24-7637 | Orals | EOS4.7
Svalbox – from an educational tool to systematic digitization of SvalbardEGU24-7704 | ECS | Orals | EOS4.7 | Highlight
The Deep Network - Curating and co-producing quality ocean-education information for adultsEGU24-7937 | Posters on site | EOS4.7 | Highlight
Geodynamica: Earth & Planets slinging Earth and (exo)planets’ structure and dynamics into Diamond Open AccessEGU24-13283 | ECS | Posters on site | EOS4.7
Automated Python workflow for generating Sentinel-1 PSI and SBAS interferometric stacks using SNAP on the Geospatial Computing PlatformEGU24-13649 | Posters on site | EOS4.7
Introducing the World Climate Research Program (WCRP) AcademyEGU24-14670 | Orals | EOS4.7 | Highlight
Exchanging knowledge in community online seminars: lessons learned from the Rifts and Rifted Margins Seminar seriesEGU24-16433 | Orals | EOS4.7
Improving access to climate information: The Met Office Climate Data PortalEGU24-16864 | Orals | EOS4.7 | Highlight
Building and establishing the open collection of geoscience graphicsEGU24-16894 | Posters on site | EOS4.7
Geomorphica: The Diamond Open-Access Journal for GeomorphologyEGU24-17098 | Posters on site | EOS4.7 | Highlight
Did This Really Happen?!: Creating Comics as a Resource for a More Inclusive Scientific CommunityEGU24-17536 | ECS | Orals | EOS4.7
FID GEO – a hub for the publication and the connection of diverse research results and groups in GermanyEGU24-17597 | Posters on site | EOS4.7
Towards a fair and inclusive next-generation of academic evaluationEGU24-18520 | ECS | Posters on site | EOS4.7
A global dataset for lake physical variables from satellite measurementsEGU24-18547 | ECS | Orals | EOS4.7
Advancing Open Science in Oceanography: A Global Assessment of Data Availability and Sharing PracticesEGU24-18775 | ECS | Posters on site | EOS4.7
SoilPulse – A software package for semi-automated metadata management and publicationEGU24-20245 | ECS | Orals | EOS4.7
Applications of Atmospheric Composition Data: Open Source Training Materials by EUMETSAT